Financial Markets 11-1
|
|
|
- Cornelius Powell
- 6 years ago
- Views:
Transcription
1 Financial Markets Laurent Calvet John Lewis Topic 11: Measuring Financial Risk HEC MBA Financial Markets 11-1
2 Risk There are many types of risk in financial transactions Liquidity Currency Political Inflation Natural Disaster Solvency/Counterparty Interest rate Regulatory Fraud Market Investors seek to reduce uncertainty of cash flows HEC MBA Financial Markets 11-2
3 $100 Invested at the End of
4 A First Look at Risk and Return Small stocks had the highest long-term return while T-Bills had the lowest. Small stocks had the largest price fluctuations while T-Bills had the lowest. Higher risk requires a higher return 11-4
5 Expected Return Weighted average of all possible returns, where the weights are the probabilities. Expected Return [ ] = = R R E R P R Example: [ ] 25%( 0.20) 50%(0.10) 25%(0.40) ER = + + = 10% 11-5
6 Variance and Standard Deviation Variance The expected squared deviation from the mean [ ] ( ) 2 Var( R) = PR R E R R Standard Deviation SD( R) = Var( R) Both are measures of risk In finance, the standard deviation of a return is also called its volatility 11-6
7 Example 1 TXU stock has the following probability distribution: Probability Return.25 8%.55 10%.20 12% Compute TXU s expected return and standard deviation. 11-7
8 Solution TXU E[R] and Std Dev Expected Return E[R] = (.25)(.08) + (.55)(.10) + (.20)(.12) E[R] = = = 9.9% Standard Deviation SD(R) = [(.25)( ) 2 + (.55)( ) 2 + (.20)( ) 2 ] 1/2 SD(R) = [ ] 1/2 SD(R) = /2 = = 1.338% HEC MBA Financial Markets 11-8
9 Historical Returns Realized Return The return that actually occurs over a particular time period. R t + 1 ( P + Div ) P Div P P = = + P P P t+ 1 t+ 1 t t+ 1 t+ 1 t t t t R Div + P t+ 1 t+ 1 t + 1 = 1 Pt Dividend yield Capital gain 11-9
10 Numerical Example: Ford Motor Company Date End-of-month Prices Dividend Montly Return (%) Jun ,24 Jul ,74 0,1 5,86% Aug ,97-7,17% Sep ,86-1,10% Oct ,32 0,1-14,60% Nov ,13-2,28% Dec ,72-5,04% Jan ,58 0,1 12,44% Feb ,97-7,11% Mar ,96-0,13% Apr ,95 0,1-11,43% May ,16 3,02% Jun ,93-3,21% ( )/
11 Historical Average and Variance Average Return: 1 1 T R R R R R ( ) = T = T T t = 1 where R t is the realized return of a security in year t. Show that average monthly return is -2.56% for Ford Variance: T 1 Var( R) = R R 1 T t = 1 ( ) 2 t The square root of the variance is an estimate of volatility Show that monthly variance is 0.55% for Ford t 11-11
12 Tradeoff Between Risk and Return There is a positive relationship between the volatility and average return of large portfolios
13 Individual Stocks Is there a positive relationship between volatility and average returns for individual stocks? NO, as is apparent in the next slide. Larger stocks tend to have lower volatility than smaller stocks. All individual stocks tend to have higher risk and lower returns than large portfolios 11-13
14 500 Individual Stocks by Size
15 Common Versus Independent Risk Common Risk Risk that is perfectly correlated Affects all securities Independent Risk Risk that is uncorrelated Affects only a particular security Diversification The averaging out of independent risks in a large portfolio 11-15
16 Diversification in Stock Portfolios Firm-Specific Risk Good or bad news about an individual company Example: CEO died in a plane accident Systematic Risk due to Market-Wide News News that affects all stocks Examples: Economic downturn that adversely affects the demand for the products of all firms, sovereign default
17 Large Portfolio When many stocks are combined in a large portfolio, the firm-specific risks for each stock will average out and be diversified The systematic risk, however, will affect all firms and will not be diversified 11-17
18 No Arbitrage and Risk Premium Investors are not compensated for firm-specific risk Otherwise, investors could buy the stocks, earn the additional premium, and simultaneously sell the portfolio. The risk premium of a security is determined only by its systematic risk This implies that a stock s volatility, which is a measure of total risk (that is, systematic risk plus diversifiable risk), is not especially useful in determining the risk premium that investors will earn
19 Estimating the Expected Return Estimating the expected return of a security will require two steps: 1. Measure the investment s systematic risk 2. Determine the risk premium required to compensate for that amount of systematic risk. Systematic risk is measured relative to an efficient benchmark
20 Efficient Benchmark Efficient Portfolio A portfolio that contains only systematic risk. There is no way to reduce the volatility of the portfolio without lowering its expected return. Market Portfolio An efficient portfolio that contains all shares and securities in the market. The S&P 500 is often used as a proxy for the market portfolio. Market Risk Premium = E RMkt r f 11-20
21 Measuring Systematic Risk To determine how sensitive a stock is to systematic risk, look at the average change in the return for each 1% change in the return of the efficient portfolio. Beta (β): The expected percent change in the excess return of a security for a 1% change in the excess return of the market portfolio Beta differs from volatility. Volatility measures total risk (systematic plus unsystematic risk), while beta is a measure of systematic risk
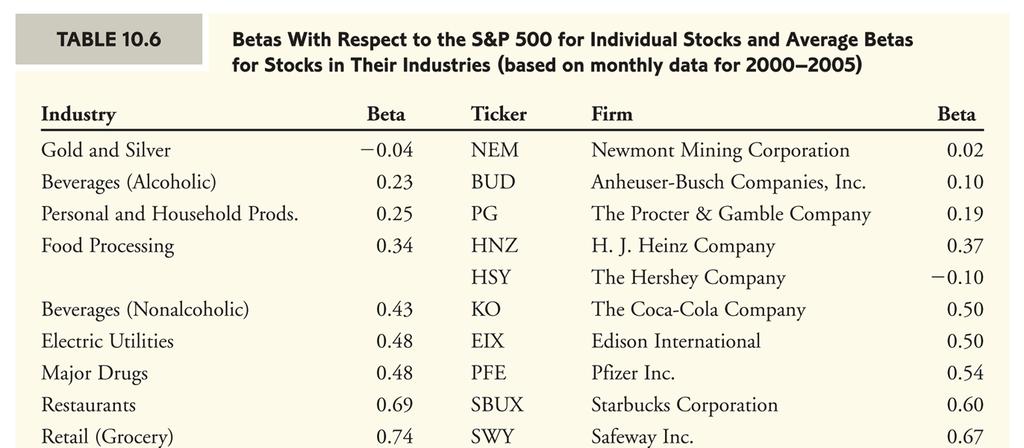
22 What drives β? A security s beta is related to how sensitive its underlying revenues and cash flows are to general economic conditions. Stocks in cyclical industries, are likely to be more sensitive to systematic risk and have higher betas than stocks in less sensitive industries

23 10-23

24 A Low β Stock: AIR LIQUIDE 11-24
25 A High β Stock: INTEL CORP 11-25
26 Estimating a Security s Risk Premium We estimate a traded security s expected return from its beta. [ ] = Risk-Free Interest Rate + Risk Premium E R = rf + β ( E RMkt rf) 11-26
27 Problem There is a 60% chance that the market return will be 15% next year and a 40% chance that the market return will be 5% next year. Assume the risk-free rate is 6%. If Microsoft s beta is 1.18, what is its expected return next year? 11-27
28 Solution MSFT E[R] E[R Mkt ] = (60% 15%) + (40% 5%) = 11% E[R] = r f + β (E[R Mkt ] r f ) E[R] = 6% (11% 6%) E[R] = 6% + 5.9% = 11.9% HEC MBA Financial Markets 11-28
Financial Markets. Laurent Calvet. John Lewis Topic 13: Capital Asset Pricing Model (CAPM)
") Financial Markets Laurent Calvet calvet@hec.fr John Lewis john.lewis04@imperial.ac.uk Topic 13: Capital Asset Pricing Model (CAPM) HEC MBA Financial Markets Risk-Adjusted Discount Rate Method We need a
Financial Markets Laurent Calvet calvet@hec.fr John Lewis john.lewis04@imperial.ac.uk Topic 13: Capital Asset Pricing Model (CAPM) HEC MBA Financial Markets Risk-Adjusted Discount Rate Method We need a
Manager Comparison Report June 28, Report Created on: July 25, 2013
 Manager Comparison Report June 28, 213 Report Created on: July 25, 213 Page 1 of 14 Performance Evaluation Manager Performance Growth of $1 Cumulative Performance & Monthly s 3748 3578 348 3238 368 2898
Security Analysis: Performance
 Security Analysis: Performance Independent Variable: 1 Yr. Mean ROR: 8.72% STD: 16.76% Time Horizon: 2/1993-6/2003 Holding Period: 12 months Risk-free ROR: 1.53% Ticker Name Beta Alpha Correlation Sharpe
Understanding the Principles of Investment Planning Stochastic Modelling/Tactical & Strategic Asset Allocation
 Understanding the Principles of Investment Planning Stochastic Modelling/Tactical & Strategic Asset Allocation John Thompson, Vice President & Portfolio Manager London, 11 May 2011 What is Diversification
Beginning Date: January 2016 End Date: June Managers in Zephyr: Benchmark: Morningstar Short-Term Bond
 Beginning Date: January 2016 End Date: June 2018 Managers in Zephyr: Benchmark: Manager Performance January 2016 - June 2018 (Single Computation) 11200 11000 10800 10600 10400 10200 10000 9800 Dec 2015
Beginning Date: January 2016 End Date: September Managers in Zephyr: Benchmark: Morningstar Short-Term Bond
 Beginning Date: January 2016 End Date: September 2018 Managers in Zephyr: Benchmark: Manager Performance January 2016 - September 2018 (Single Computation) 11400 - Yorktown Funds 11200 11000 10800 10600
Define risk, risk aversion, and riskreturn
 Risk and 1 Learning Objectives Define risk, risk aversion, and riskreturn tradeoff. Measure risk. Identify different types of risk. Explain methods of risk reduction. Describe how firms compensate for
Beginning Date: January 2016 End Date: February Managers in Zephyr: Benchmark: Morningstar Short-Term Bond
 Beginning Date: January 2016 End Date: February 2018 Managers in Zephyr: Benchmark: Manager Performance January 2016 - February 2018 (Single Computation) 11200 11000 10800 10600 10400 10200 10000 9800
Principles of Finance Risk and Return. Instructor: Xiaomeng Lu
 Principles of Finance Risk and Return Instructor: Xiaomeng Lu 1 Course Outline Course Introduction Time Value of Money DCF Valuation Security Analysis: Bond, Stock Capital Budgeting (Fundamentals) Portfolio
Dividend Growth as a Defensive Equity Strategy August 24, 2012
 Dividend Growth as a Defensive Equity Strategy August 24, 2012 Introduction: The Case for Defensive Equity Strategies Most institutional investment committees meet three to four times per year to review
QCU and Exercise for Part 3 : 30 QCU (only one answer is right) and 1 Exercise
 and 1 Exercise") QCU and Exercise for Part 3 : 30 QCU (only one answer is right) and 1 Exercise Risk and return Cost of equity From the cost of equity to the cost of capital Corporate Finance Master 1 2012-2013 All campuses
QCU and Exercise for Part 3 : 30 QCU (only one answer is right) and 1 Exercise Risk and return Cost of equity From the cost of equity to the cost of capital Corporate Finance Master 1 2012-2013 All campuses
Risk and Risk Aversion
 Risk and Risk Aversion Do markets price in new information? Refer to spreadsheet Risk.xls ci Price of a financial asset will be the present value of future cash flows. PV i 1 (1 Rs ) (where c i = are the
INDEX PERFORMANCE HISTORY MARKET CYCLE ANALYSIS*
 OVERVIEW Index Name: Helios Diversified Index Ticker: Inception Date: September 30, 2003 S&P Launch Date: March 3, 2017 : 45% MSCI ACWI / 25% BBgBarc Agg Bond / 30% Morningstar Div Alts Morningstar SecID:
Hedging Potential for MGEX Soft Red Winter Wheat Index (SRWI) Futures
 Futures") Hedging Potential for MGEX Soft Red Winter Wheat Index (SRWI) Futures Introduction In December 2003, MGEX launched futures and options that will settle financially to the Soft Red Winter Wheat Index (SRWI),
Hedging Potential for MGEX Soft Red Winter Wheat Index (SRWI) Futures Introduction In December 2003, MGEX launched futures and options that will settle financially to the Soft Red Winter Wheat Index (SRWI),
XML Publisher Balance Sheet Vision Operations (USA) Feb-02
 Feb-02") Page:1 Apr-01 May-01 Jun-01 Jul-01 ASSETS Current Assets Cash and Short Term Investments 15,862,304 51,998,607 9,198,226 Accounts Receivable - Net of Allowance 2,560,786
Page:1 Apr-01 May-01 Jun-01 Jul-01 ASSETS Current Assets Cash and Short Term Investments 15,862,304 51,998,607 9,198,226 Accounts Receivable - Net of Allowance 2,560,786
JUPITER POLICE OFFICER'S RETIREMENT FUND INVESTMENT PERFORMANCE PERIOD ENDING SEPTEMBER 30, 2008
 JUPITER POLICE OFFICER'S RETIREMENT FUND INVESTMENT PERFORMANCE PERIOD ENDING SEPTEMBER 30, 2008 NOTE: For a free copy of Part II (mailed w/i 5 bus. days from request receipt) of Burgess Chambers and Associates,
Chapter 13 Return, Risk, and Security Market Line
 1 Chapter 13 Return, Risk, and Security Market Line Konan Chan Financial Management, Spring 2018 Topics Covered Expected Return and Variance Portfolio Risk and Return Risk & Diversification Systematic
Index Models and APT
 Index Models and APT (Text reference: Chapter 8) Index models Parameter estimation Multifactor models Arbitrage Single factor APT Multifactor APT Index models predate CAPM, originally proposed as a simplification
Foundations of Investing
 www.edwardjones.com Member SIPC Foundations of Investing 1 5 HOW CAN I STAY ON TRACK? 4 HOW DO I GET THERE? 1 WHERE AM I TODAY? MY FINANCIAL NEEDS 3 CAN I GET THERE? 2 WHERE WOULD I LIKE TO BE? 2 Develop
CS/Tremont Hedge Fund Index Performance Review
 In fact, the S&P500 volatility 1 on average was 2.58x that of the HFI s. Using over fifteen years of data, we found that S&P500 s volatility to be on average 2.5x that of the HFI s. II. ANALYSIS The Beryl
INDEX PERFORMANCE HISTORY MARKET CYCLE ANALYSIS*
 OVERVIEW Index Name: Helios Alpha Index Ticker: Inception Date: September 30, 2003 S&P Launch Date: March 3, 2017 Benchmark: MSCI ACWI Index INDEX PERFORMANCE HISTORY As of: October 31, 2018 DESCRIPTION
INDEX PERFORMANCE HISTORY MARKET CYCLE ANALYSIS*
 Jun 09 Dec 09 Jun 10 Dec 10 Jun 11 Dec 11 Jun 12 Dec 12 Jun 13 Dec 13 Jun 14 Dec 14 Jun 15 Dec 15 Jun 16 Dec 16 Jun 17 Dec 17 Jun 18 Dec 18 Dec 07 Jan 08 Feb 08 Mar 08 Apr 08 May 08 Jun 08 Jul 08 Aug 08
Chapter 10. Chapter 10 Topics. What is Risk? The big picture. Introduction to Risk, Return, and the Opportunity Cost of Capital
 1 Chapter 10 Introduction to Risk, Return, and the Opportunity Cost of Capital Chapter 10 Topics Risk: The Big Picture Rates of Return Risk Premiums Expected Return Stand Alone Risk Portfolio Return and
Risk and Return (Introduction) Professor: Burcu Esmer
 Professor: Burcu Esmer") Risk and Return (Introduction) Professor: Burcu Esmer 1 Overview Rates of Return: A Review A Century of Capital Market History Measuring Risk Risk & Diversification Thinking About Risk Measuring Market
Risk and Return (Introduction) Professor: Burcu Esmer 1 Overview Rates of Return: A Review A Century of Capital Market History Measuring Risk Risk & Diversification Thinking About Risk Measuring Market
Spheria Australian Smaller Companies Fund
 29-Jun-18 $ 2.7686 $ 2.7603 $ 2.7520 28-Jun-18 $ 2.7764 $ 2.7681 $ 2.7598 27-Jun-18 $ 2.7804 $ 2.7721 $ 2.7638 26-Jun-18 $ 2.7857 $ 2.7774 $ 2.7690 25-Jun-18 $ 2.7931 $ 2.7848 $ 2.7764 22-Jun-18 $ 2.7771
INDEX PERFORMANCE HISTORY MARKET CYCLE ANALYSIS*
 OVERVIEW Index Name: Helios Dynamic Risk 13% Index Ticker: Inception Date: February 28, 2005 S&P Launch Date: March 3, 2017 Benchmark: 65% MSCI ACWI / 35% BBgBarc Agg Bond Morningstar SecID: F00000YYHJ
Diversification. Finance 100
 Diversification Finance 100 Prof. Michael R. Roberts 1 Topic Overview How to measure risk and return» Sample risk measures for some classes of securities Brief Statistics Review» Realized and Expected
UCRP and GEP Quarterly Investment Risk Report
 UCRP and GEP Quarterly Investment Risk Report Quarter ending June 2011 Committee on Investments/ Investment Advisory Group September 14, 2011 Contents UCRP Asset allocation history 5 17 What are the fund
Financial & Business Highlights For the Year Ended June 30, 2017
 Financial & Business Highlights For the Year Ended June, 17 17 16 15 14 13 12 Profit and Loss Account Operating Revenue 858 590 648 415 172 174 Investment gains net 5 162 909 825 322 516 Other 262 146
WESTWOOD LUTHERAN CHURCH Summary Financial Statement YEAR TO DATE - February 28, Over(Under) Budget WECC Fund Actual Budget
 Budget WECC Fund Actual Budget") WESTWOOD LUTHERAN CHURCH Summary Financial Statement YEAR TO DATE - February 28, 2018 General Fund Actual A B C D E F WECC Fund Actual Revenue Revenue - Faith Giving 1 $ 213 $ 234 $ (22) - Tuition $ 226
WESTWOOD LUTHERAN CHURCH Summary Financial Statement YEAR TO DATE - February 28, 2018 General Fund Actual A B C D E F WECC Fund Actual Revenue Revenue - Faith Giving 1 $ 213 $ 234 $ (22) - Tuition $ 226
THE B E A CH TO WN S O F P ALM B EA CH
 THE B E A CH TO WN S O F P ALM B EA CH C OU N T Y F LO R I D A August www.luxuryhomemarketing.com PALM BEACH TOWNS SINGLE-FAMILY HOMES LUXURY INVENTORY VS. SALES JULY Sales Luxury Benchmark Price : 7,
TERMS OF REFERENCE FOR THE INVESTMENT COMMITTEE
 I. PURPOSE The purpose of the Investment Committee (the Committee ) is to recommend to the Board the investment policy, including the asset mix policy and the appropriate benchmark for both ICBC and any
Common stock prices 1. New York Stock Exchange indexes (Dec. 31,1965=50)2. Transportation. Utility 3. Finance
2. Transportation. Utility 3. Finance") Digitized for FRASER http://fraser.stlouisfed.org/ Federal Reserve Bank of St. Louis 000 97 98 99 I90 9 9 9 9 9 9 97 98 99 970 97 97 ""..".'..'.."... 97 97 97 97 977 978 979 980 98 98 98 98 98 98 987 988
Digitized for FRASER http://fraser.stlouisfed.org/ Federal Reserve Bank of St. Louis 000 97 98 99 I90 9 9 9 9 9 9 97 98 99 970 97 97 ""..".'..'.."... 97 97 97 97 977 978 979 980 98 98 98 98 98 98 987 988
Ch. 8 Risk and Rates of Return. Return, Risk and Capital Market. Investment returns
 Ch. 8 Risk and Rates of Return Topics Measuring Return Measuring Risk Risk & Diversification CAPM Return, Risk and Capital Market Managers must estimate current and future opportunity rates of return for
Using projections to manage your programs
 Using projections to manage your programs To project total provider reimbursements To do what ifs based on caseloads or other metrics To project amounts of admin & support available for spending Based
Review of Registered Charites Compliance Rates with Annual Reporting Requirements 2016
 Review of Registered Charites Compliance Rates with Annual Reporting Requirements 2016 October 2017 The Charities Regulator, in accordance with the provisions of section 14 of the Charities Act 2009, carried
Return, Risk, and the Security Market Line
 Chapter 13 Key Concepts and Skills Return, Risk, and the Security Market Line Know how to calculate expected returns Understand the impact of diversification Understand the systematic risk principle Understand
Understanding Investment Risk
 Understanding Investment Risk Investments and services offered through Morgan Stanley Smith Barney LLC, and accounts carried by Morgan Stanley & Co. Incorporated; members SIPC. 2009 Morgan Stanley Smith
Chapter 10: Capital Markets and the Pricing of Risk
 Chapter 0: Capital Markets and the Pricing of Risk- Chapter 0: Capital Markets and the Pricing of Risk Big Picture: ) To value a project, we need an interest rate to calculate present values ) The interest
Executive Summary. July 17, 2015
 Executive Summary July 17, 2015 The Revenue Estimating Conference adopted interest rates for use in the state budgeting process. The adopted interest rates take into consideration current benchmark rates
Chapter 10: Capital Markets and the Pricing of Risk
 Chapter 10: Capital Markets and the Pricing of Risk -1 Chapter 10: Capital Markets and the Pricing of Risk Fundamental question: What is the relationship between risk and return in a more complex world
TD Securities 2011 Calgary Unconventional Energy Conference July 7, Dawn Farrell Chief Operating Officer
 TD Securities 2011 Calgary Unconventional Energy Conference July 7, 2011 Dawn Farrell Chief Operating Officer 1 Forward looking statements This presentation may contain forward looking statements, including
Portfolio Management
 Portfolio Management Risk & Return Return Income received on an investment (Dividend) plus any change in market price( Capital gain), usually expressed as a percent of the beginning market price of the
Monetary Economics Portfolios Risk and Returns Diversification and Risk Factors Gerald P. Dwyer Fall 2015
 Monetary Economics Portfolios Risk and Returns Diversification and Risk Factors Gerald P. Dwyer Fall 2015 Reading Chapters 11 13, not Appendices Chapter 11 Skip 11.2 Mean variance optimization in practice
HUD NSP-1 Reporting Apr 2010 Grantee Report - New Mexico State Program
 HUD NSP-1 Reporting Apr 2010 Grantee Report - State Program State Program NSP-1 Grant Amount is $19,600,000 $9,355,381 (47.7%) has been committed $4,010,874 (20.5%) has been expended Grant Number HUD Region
A Note on the Steepening Curve and Mortgage Durations
 Robert Young (212) 816-8332 robert.a.young@ssmb.com The current-coupon effective duration has reached a multi-year high of 4.6. A Note on the Steepening Curve and Mortgage Durations While effective durations
QUESTION 2. QUESTION 3 Which one of the following is most indicative of a flexible short-term financial policy?
 QUESTION 1 Compute the cash cycle based on the following information: Average Collection Period = 47 Accounts Payable Period = 40 Average Age of Inventory = 55 QUESTION 2 Jan 41,700 July 39,182 Feb 18,921
Sustainable Investment Solutions Personalized Investment Plan
 Sustainable Investment Solutions Personalized Investment Plan Portfolio Recommendation and Investment Policy Statement Prepared for John Q. Sample and Mary R. Sample February 11, 2014 By First Affirmative
Discussion: Bank Risk Dynamics and Distance to Default
 Discussion: Bank Risk Dynamics and Distance to Default Andrea L. Eisfeldt UCLA Anderson BFI Conference on Financial Regulation October 3, 2015 Main Idea: Bank Assets 1 1 0.9 0.9 0.8 Bank assets 0.8 0.7
Aspiriant Risk-Managed Equity Allocation Fund RMEAX Q4 2018
 Aspiriant Risk-Managed Equity Allocation Fund Q4 2018 Investment Objective Description The Aspiriant Risk-Managed Equity Allocation Fund ( or the Fund ) seeks to achieve long-term capital appreciation
An introduction to Invesco s Equity Long/Short Strategies
 An introduction to Invesco s Equity Long/Short Strategies This marketing document is exclusively for use by Professional Clients and Financial Advisers in Germany. This document is not for consumer use,
Leading Economic Indicator Nebraska
 Nebraska Monthly Economic Indicators: December 20, 2017 Prepared by the UNL College of Business Administration, Bureau of Business Research Author: Dr. Eric Thompson Leading Economic Indicator...1 Coincident
Risk and Return Analysis of Selected Stock Listed on Nifty Financial Services Index
 Risk and Return Analysis of Selected Stock Listed on Nifty Financial Services Index Raghav Kumar Jha UGC-NET (Management), Uttarakhand S.E.T (Management), M.B.A (Finance And Marketing), Vatika Kunj, V+Po-
MBF2263 Portfolio Management. Lecture 8: Risk and Return in Capital Markets
 MBF2263 Portfolio Management Lecture 8: Risk and Return in Capital Markets 1. A First Look at Risk and Return We begin our look at risk and return by illustrating how the risk premium affects investor
Figure 1: Change in LEI-N August 2018
 Nebraska Monthly Economic Indicators: September 26, 2018 Prepared by the UNL College of Business, Bureau of Business Research Author: Dr. Eric Thompson Leading Economic Indicator...1 Coincident Economic
Big Walnut Local School District
 Big Walnut Local School District Monthly Financial Report for the month ended September 30, 2013 Prepared By: Felicia Drummey Treasurer BIG WALNUT LOCAL SCHOOL DISTRICT SUMMARY OF YEAR TO DATE FINANCIAL
Office of the Treasurer of The Regents
 UCRP and GEP Quarterly Investment Risk Report Committee on Investments/ Investment t Advisory Group Quarter ending March 200 May 7, 200 Contents UCRP Asset allocation history 5 7 What are the fund s asset
Stock Performance of Socially Responsible Companies
 10.1515/nybj-2017-0001 Stock Performance of Socially Responsible Companies Tzu-Man Huang 1 California State University, Stanislaus, U.S.A. Sijing Zong 2 California State University, Stanislaus, U.S.A.
CITI Bank Bangkok branch. Set B Capital Item1 Capital Structure Table 2 Capital of Foreign Banks Branchs Unit : THB. Item June 30, 2009
 CITI Bank Bangkok branch Set B Capital Item1 Capital Structure Table 2 Capital of Foreign Banks Branchs Unit : THB Item June 30, 20 1 Assets required to be maintained under Section 32 17,753,449,882.45
SYSTEMATIC GLOBAL MACRO ( CTAs ):
:") G R A H M C A P I T A L M A N G E M N T G R A H A M C A P I T A L M A N A G E M E N T GC SYSTEMATIC GLOBAL MACRO ( CTAs ): PERFORMANCE, RISK, AND CORRELATION CHARACTERISTICS ROBERT E. MURRAY, CHIEF OPERATING
G R A H M C A P I T A L M A N G E M N T G R A H A M C A P I T A L M A N A G E M E N T GC SYSTEMATIC GLOBAL MACRO ( CTAs ): PERFORMANCE, RISK, AND CORRELATION CHARACTERISTICS ROBERT E. MURRAY, CHIEF OPERATING
AK Advisory Partners LLC: Educational Module Series. Client Servicing & Client Retention. (Updated January 2009)
") : Educational Module Series Client Servicing & Client Retention (Updated January 2009) 1 CLIENT SERVICING AND CLIENT RETENTION Managing the relationship Setting-up a servicing plan Preparing for the quarterly
: Educational Module Series Client Servicing & Client Retention (Updated January 2009) 1 CLIENT SERVICING AND CLIENT RETENTION Managing the relationship Setting-up a servicing plan Preparing for the quarterly
April 2018 Data Release
 April 2018 Data Release The Home Purchase Sentiment Index (HPSI) is a composite index designed to track consumers housing-related attitudes, intentions, and perceptions, using six questions from the National
Isle Of Wight half year business confidence report
 half year business confidence report half year report contents new company registrations closed companies (dissolved) net company growth uk company share director age director gender naming trends sic
Chapter 7. Introduction to Risk, Return, and the Opportunity Cost of Capital. Principles of Corporate Finance. Slides by Matthew Will
 Principles of Corporate Finance Seventh Edition Richard A. Brealey Stewart C. Myers Chapter 7 Introduction to Risk, Return, and the Opportunity Cost of Capital Slides by Matthew Will - Topics Covered 75
Archana Khetan 05/09/ MAFA (CA Final) - Portfolio Management
 - Portfolio Management") Archana Khetan 05/09/2010 +91-9930812722 Archana090@hotmail.com MAFA (CA Final) - Portfolio Management 1 Portfolio Management Portfolio is a collection of assets. By investing in a portfolio or combination
Archana Khetan 05/09/2010 +91-9930812722 Archana090@hotmail.com MAFA (CA Final) - Portfolio Management 1 Portfolio Management Portfolio is a collection of assets. By investing in a portfolio or combination
Absolute Return Fixed Income: Taking A Different Approach
 August 2015 Absolute Return Fixed Income: Taking A Different Approach Executive Summary Historically low global fixed income yield levels present a conundrum for today s fixed income investors. Increasing
Cost Estimation of a Manufacturing Company
 Cost Estimation of a Manufacturing Company Name: Business: Date: Economics of One Unit: Manufacturing Company (Only complete if you are making a product, such as a bracelet or beauty product) Economics
Grant Park Multi Alternative Strategies Fund. Why Invest? Profile Since Inception. Consider your alternatives. Invest smarter.
 Consider your alternatives. Invest smarter. Grant Park Multi Alternative Strategies Fund GPAIX Executive Summary November 206 Why Invest? 30 years of applied experience managing funds during multiple market
Emil van Essen, LLC. Spread Trading program. Monthly performance. Performance statistics Dec 2006 to Mar 2015
 Commodity Trading Advisors (CTAs) provide advice and services related to trading and investment strategies utilizing futures contracts and options on futures contracts on a wide variety of physical goods
January 2018 Data Release
 January 2018 Data Release The Home Purchase Sentiment Index (HPSI) is a composite index designed to track consumers housing-related attitudes, intentions, and perceptions, using six questions from the
RETURN AND RISK: The Capital Asset Pricing Model
 RETURN AND RISK: The Capital Asset Pricing Model (BASED ON RWJJ CHAPTER 11) Return and Risk: The Capital Asset Pricing Model (CAPM) Know how to calculate expected returns Understand covariance, correlation,
Mechanics of Cash Flow Forecasting
 Texas Association Of State Senior College & University Business Officers July 13, 2015 Mechanics of Cash Flow Forecasting Susan K. Anderson, CEO Anderson Financial Management, L.L.C. 130 Pecan Creek Drive
W.E. Donoghue Power Dividend Total Return Index TM (PWRDXTR)
") W.E. Donoghue Power Dividend Total Return Index TM (PWRDXTR) A Tactical Dividend Strategy for Today s Low Yield World For more information call: 800 642-4276 S&P 500 Index Since the Turn of the Millennium
W.E. Donoghue Power Dividend Total Return Index TM (PWRDXTR) A Tactical Dividend Strategy for Today s Low Yield World For more information call: 800 642-4276 S&P 500 Index Since the Turn of the Millennium
October 2016 Data Release
 Mar-11 Apr-11 May-11 Jun-11 Jul-11 Aug-11 Sep-11 Oct-11 Nov-11 Dec-11 Jan-12 Feb-12 Mar-12 Apr-12 May-12 Jun-12 Jul-12 Aug-12 Sep-12 Oct-12 Nov-12 Dec-12 Jan-13 Feb-13 Mar-13 Apr-13 May-13 Jun-13 Jul-13
1.2 The purpose of the Finance Committee is to assist the Board in fulfilling its oversight responsibilities related to:
 Category: BOARD PROCESS Title: Terms of Reference for the Finance Committee Reference Number: AB-331 Last Approved: February 22, 2018 Last Reviewed: February 22, 2018 1. PURPOSE 1.1 Primary responsibility
October 2018 Data Release
 Mar-11 Apr-11 May-11 Jun-11 Jul-11 Aug-11 Sep-11 Oct-11 Nov-11 Dec-11 Jan-12 Feb-12 Mar-12 Apr-12 May-12 Jun-12 Jul-12 Aug-12 Sep-12 Oct-12 Nov-12 Dec-12 Jan-13 Feb-13 Mar-13 Apr-13 May-13 Jun-13 Jul-13
January 2019 Data Release
 Mar-11 Apr-11 May-11 Jun-11 Jul-11 Aug-11 Sep-11 Oct-11 Nov-11 Dec-11 Jan-12 Feb-12 Mar-12 Apr-12 May-12 Jun-12 Jul-12 Aug-12 Sep-12 Oct-12 Nov-12 Dec-12 Jan-13 Feb-13 Mar-13 Apr-13 May-13 Jun-13 Jul-13
Eastern Point Trust Company Basic Plan Portfolio
 Eastern Point Trust Company Basic Plan Portfolio January 2001 - August 2018 (Single Computation) 400 350 300 250 200 150 100 50 Dec 2000 Dec 2003 Dec 2005 Dec 2007 Dec 2009 Dec 2011 Dec 2013 Dec 2015 Aug
June 2018 Data Release
 Mar-11 Apr-11 May-11 Jun-11 Jul-11 Aug-11 Sep-11 Oct-11 Nov-11 Dec-11 Jan-12 Feb-12 Mar-12 Apr-12 May-12 Jun-12 Jul-12 Aug-12 Sep-12 Oct-12 Nov-12 Dec-12 Jan-13 Feb-13 Mar-13 Apr-13 May-13 Jun-13 Jul-13
Financial'Market'Analysis'(FMAx) Module'5
 Module'5") Financial'Market'Analysis'(FMAx) Module'5 Equity Pricing This training material is the property of the International Monetary Fund (IMF) and is intended for use in IMF Institute for Capacity Development
Financial'Market'Analysis'(FMAx) Module'5 Equity Pricing This training material is the property of the International Monetary Fund (IMF) and is intended for use in IMF Institute for Capacity Development
PHOENIX ENERGY MARKETING CONSULTANTS INC. HISTORICAL NATURAL GAS & CRUDE OIL PRICES UPDATED TO July, 2018
 Jan-01 $12.9112 $10.4754 $9.7870 $1.5032 $29.2595 $275.39 $43.78 $159.32 $25.33 Feb-01 $10.4670 $7.8378 $6.9397 $1.5218 $29.6447 $279.78 $44.48 $165.68 $26.34 Mar-01 $7.6303 $7.3271 $5.0903 $1.5585 $27.2714
THE CHINESE UNIVERSITY OF HONG KONG Department of Mathematics MMAT5250 Financial Mathematics Homework 2 Due Date: March 24, 2018
 THE CHINESE UNIVERSITY OF HONG KONG Department of Mathematics MMAT5250 Financial Mathematics Homework 2 Due Date: March 24, 2018 Name: Student ID.: I declare that the assignment here submitted is original
Key IRS Interest Rates After PPA
 Key IRS Rates - After PPA - thru 2011 Page 1 of 10 Key IRS Interest Rates After PPA (updated upon release of figures in IRS Notice usually by the end of the first full business week of the month) Below
OPTIMAL RISKY PORTFOLIOS- ASSET ALLOCATIONS. BKM Ch 7
 OPTIMAL RISKY PORTFOLIOS- ASSET ALLOCATIONS BKM Ch 7 ASSET ALLOCATION Idea from bank account to diversified portfolio Discussion principles are the same for any number of stocks A. bonds and stocks B.
March 07, Dear Friends and Investors,
 March 07, 2018 Dear Friends and Investors, The following market overview for the month of February, 2018 has been produced by the Fund s Senior Portfolio Manager, Steven Goldman. We trust that you ll find
Factor Leave Accruals. Accruing Vacation and Sick Leave
 Factor Leave Accruals Accruing Vacation and Sick Leave Factor Leave Accruals As part of the transition of non-exempt employees to biweekly pay, the UC Office of the President also requires standardization
Fiscal Year 2018 Project 1 Annual Budget
 Fiscal Year 2018 Project 1 Annual Budget Table of Contents Table Page Summary 3 Summary of Costs Table 1 4 Treasury Related Expenses Table 2 5 Summary of Full Time Equivalent Table 3 6 Positions Cost-to-Cash
Systinvest. Track Record. ploutos. wikifolios
 Systinvest Track Record ploutos wikifolios Content wikifolio Trader ploutos page 2 General information on wikifolio and the trader ploutos Marketcycles page 3 Category 1, Crash Risk Control-strategy applied
Ho Ho Quantitative Portfolio Manager, CalPERS
 Portfolio Construction and Risk Management under Non-Normality Fiduciary Investors Symposium, Beijing - China October 23 rd 26 th, 2011 Ho Ho Quantitative Portfolio Manager, CalPERS The views expressed
BANK OF GUYANA. BANKING SYSTEM STATISTICAL ABSTRACT Website:
 BANK OF GUYANA BANKING SYSTEM STATISTICAL ABSTRACT Website: www.bankofguyana.org.gy RESEARCH DEPARTMENT November 2010 STATISTICAL ABSTRACT TABLES CONTENTS 1. MONETARY AUTHORITY 1.1 Bank of Guyana: Assets
When we model expected returns, we implicitly model expected prices
 Week 1: Risk and Return Securities: why do we buy them? To take advantage of future cash flows (in the form of dividends or selling a security for a higher price). How much should we pay for this, considering
Order Making Fiscal Year 2018 Annual Adjustments to Transaction Fee Rates
 This document is scheduled to be published in the Federal Register on 04/20/2018 and available online at https://federalregister.gov/d/2018-08339, and on FDsys.gov 8011-01p SECURITIES AND EXCHANGE COMMISSION
INTRODUCTION TO RISK AND RETURN IN CAPITAL BUDGETING Chapters 7-9
 INTRODUCTION TO RISK AND RETURN IN CAPITAL BUDGETING Chapters 7-9 WE ALL KNOW: THE GREATER THE RISK THE GREATER THE REQUIRED (OR EXPECTED) RETURN... Expected Return Risk-free rate Risk... BUT HOW DO WE
General Fund Revenue
 Millions Percent of Kathy Steinert, Director of Fiscal Services Phone: 541.923.8927 145 SE Salmon Ave Redmond, OR 97756 kathy.steinert@redmond.k12.or.us Date: May 23, 2014 To: Redmond School District Board
Large Cap Low Volatility Strategy. 12/31/ Vanderbilt Beach Road, Suite 102 Naples, Florida V:
 Large Cap Low Volatility Strategy 12/31/2018 999 Vanderbilt Beach Road, Suite 102 Naples, Florida 34108 V: 866-459-9998 10 Executive Summary Reduced Equity Market Risk The 50%+ downturn in the broad U.S.
What makes US government bonds safe assets?
 What makes US government bonds safe assets? Zhiguo He (Chicago Booth and NBER) Arvind Krishnamurthy (Stanford GSB and NBER) Konstantin Milbradt (Northwestern Kellogg and NBER) ASSA 2016 1 / 11 Motivation
OTHER DEPOSITS FINANCIAL INSTITUTIONS DEPOSIT BARKAT SAVING ACCOUNT
 WEIGHTAGES JAN FEB MAR APR MAY JUN JUL AUG SEPT OCT NOV DEC ANNOUNCEMENT DATE 19.Dez.14 27.Jän.15 24.Feb.15 26.Mär.15 27.Apr.15 26.Mai.15 25.Jun.15 28.Jul.15 26.Aug.15 23.Sep.15 27.Okt.15 25.Nov.15 MUDARIB
CHAPTER 8 Risk and Rates of Return
 CHAPTER 8 Risk and Rates of Return Stand-alone risk Portfolio risk Risk & return: CAPM The basic goal of the firm is to: maximize shareholder wealth! 1 Investment returns The rate of return on an investment
Risk and Return. Return. Risk. M. En C. Eduardo Bustos Farías
 Risk and Return Return M. En C. Eduardo Bustos Farías Risk 1 Inflation, Rates of Return, and the Fisher Effect Interest Rates Conceptually: Interest Rates Nominal risk-free Interest Rate krf = Real risk-free
Maximizing Returns, Minimizing Max Draw Down
 RISK MANAGEMENT CREATES VALUE Maximizing Returns, Minimizing Max Draw Down For EDHEC Hedge Funds Days 10-Dec.-08 Agenda > Does managing Extreme Risks in Alternative Investment make sense? Will Hedge Funds