For personal use only Y E A R R E S U L T S FY17
|
|
|
- Jeremy Shepherd
- 5 years ago
- Views:
Transcription


1 H A L F Y E A R R E S U L T S FY17
2 I M P O R T A N T N O T I C E & D I S C L A I M E R This presentation has been prepared by Specialty Fashion Group Limited (the Company ). It contains general background information about the Company s activities current as at the date of the presentation. It is information given in summary form and does not purport to be complete. The distribution of this presentation in jurisdictions outside Australia may be restricted by law and you should observe any such restrictions. The Company has prepared this presentation based on information available to it, including information derived from publicly available sources that have not been independently verified. No representation or warranty, express or implied, is made as to the fairness, accuracy, completeness, correctness or reliability of the information, opinions and conclusions expressed. Any statements or assumptions in this presentation as to future matters may prove to be incorrect and differences may be material. This presentation should not be relied upon as a recommendation or forecast by the Company. To the maximum extent permitted by law, none of the Company, its directors, employees or agents, nor any other person accepts any liability, including, without limitation, any liability arising from fault or negligence on the part of any of them or any other person, for any loss arising from the use of this presentation or its contents or otherwise arising in connection with it. 2

3 AGENDA 1. Business Overview 2. Key Growth Priorities 3. Financial Analysis 4. Outlook 5. Appendices 3

4 1 BUSINESS OVERVIEW 4
5 BUSINESS OVERVIEW HIGHLIGHTS Continuous business improvement focus delivers profit growth across most key metrics, compared against the previous corresponding period ( PCP ): NPAT improved by 36.8%. EPS increased by 37.0%. Underlying EBITDA increased by 12.7%. Achieved despite comparative sales growth for the period of - 2.0%. Revenue decline of -1.0% in challenging trading period. Gross margin increased, due to: o o o Better negotiated product cost prices; Higher average selling prices; Reducing duty charge; Offset by o strengthening USD on cost of purchases (7 cents/9%). Adjusted costs of doing business ( CODB ) increased by $0.9m. Rivers achieved an EBITDA profit for the half. City Chic s continued growth domestically and internationally. Online sales up 28% to $45.6m, which represents 10.6% of total revenues. Store portfolio: 1,066 stores plus 29 concession locations in Myer (a further 15 Myer concession locations opened in H1 FY17). H1FY17 H1FY16 FY16 Revenue (A$m) Revenue growth (1.0%) 5.2% 4.4% *Gross profit (A$m) Gross margin % 58.0% 56.1% 55.0% **EBIT DA (A$m) EBIT DA margin % 7.1% 6.2% 3.0% NPAT (A$m) (2.2) NPAT margin % 2.8% 2.0% (0.3%) Basic EPS (cents/share) (1.1) Costs of Doing Business Income statement *CODB CODB % 51.0% 50.2% 52.2% * Reclassification of $4.7m warehousing costs from CODB to Gross Margin in H1 FY16 for comparability. ** EBITDA for H1FY16 is on an underlying basis, See Appendix for full reconciliations. 5
 driven by investment in stores and e-commerce platform. Net cash position of $12.3m: cash of $18.6m less borrowings of $6.3m. (Net cash position PCP $1.4m).")
6 BUSINESS OVERVIEW HIGHLIGHTS Inventories higher than LY mainly due to increased holdings in City Chic USA and increased stock in transit due to earlier Chinese New Year in CAPEX (PP&E and intangibles) driven by investment in stores and e-commerce platform. Net cash position of $12.3m: cash of $18.6m less borrowings of $6.3m. (Net cash position PCP $1.4m). Foreign currency: Average FX rate for the half of US$0.73 achieved versus US$0.80 in H1FY16. Average cover at US$0.73 until 30 June Net movement in working capital reflects net impact of: o higher inventories offset by o increased trade and other payables. Extended trading terms renegotiated with direct suppliers. * * Includes 29 concession sites in Myer (30 June 2016: 14). 6
7 BUSINESS OVERVIEW OMNI-CHANNEL STRATEGY Omni-channel strategy is delivering growth. Leveraging customer database to give seamless shopping experience in stores and online. Click and collect' entrenched in our brands. Opened 28 new stores; closed 25 stores. Total of 1,066 stores and 29 concession sites at period end: o Opened 15 concession sites in Myer; o 14 existing stores refurbished. 28% growth in online sales to $45.6m (PCP $35.7m), representing 10.6% of total revenues (PCP 8.2%). Database membership growth and continued success of insightsdriven digital strategy. In-house customer insights team and CRM platform drive positive results; customer membership database: over 8.5m members. Brands Online sales % of Total Millers 4.4% Katies 6.9% Crossroads 7.3% Autograph 14.1% City Chic 28.7% Rivers 5.8% Group 10.6% City Chic online includes dropship trading on Nordstrom and Macy s websites. H1FY17 H1FY16 Growth Total Revenue (A$m) (1.0%) Online Sales (A$m) % Online Sales % of total revenue 10.6% 9.0% 17.8% Excluding wholesale revenue (A$m) - (3.5) Comparable Online Sales (A$m) % Comparable Online Sales % of total revenue 10.6% 8.2% 29.2% * Wholesale included in Online % for H1 FY16, excluded for H2 FY16 and H1 FY17. 7
8 BUSINESS OVERVIEW KEY BRANDS AND OPERATIONS Target Market Affordable, thoughtful fashion that suits her lifestyle and make her look and feel amazing. Value based fashion for the ageless and feminine woman. Modern, relaxed and accentuating fashion for plus-size women in sizes 14 to 26. Affordable fashion in sizes 8 to 22, for the fashion-conscious woman. Bold, sexy and glam fashion for the younger plus-size woman. Quality and comfort clothing and footwear for mature Australian men and women. Indicative Price Point $12-$70 $20-$120 $20-$100 $15-$65 $59-$250 $15-$120 Product Range Female Apparel (Plus Size and Mature) Adult Apparel & Footwear # of Stores * 153 Loyalty Program Marketing Highlight Launched Millers Everything life is campaign across multiple channels. Rebranding and launch of Studio East by Katies (sizes 14-26). Redefined and launched our Product and Brand DNA bringing our product to life with a cheeky sense of optimism. Successfully launched website onto new platform and implemented creative brand refresh. International partnership growth including ASOS and opening of Macy s Dream Doors. Achieved sign-ups to our loyalty programme via SMS doubled following launch of retention drive. H1 FY17 Net Sales: Online as % of Total 4% 7% 14% 7% 29% 6% *Includes 29 concession locations in Myer at 31 December 2016 (30 June 2016: 14). 8

9 2 KEY GROWTH PRIORITIES 9


10 KEY GROWTH PRIORITIES Key growth priorities are: Rejuvenation of existing brands across the Group continues; Completing Rivers' transformation and building sustainable profitability; and City Chic offshore expansion including building multi-channel platform in USA. 10


11 KEY GROWTH PRIORITIES BRAND REJUVENATION The brand continues to rejuvenate its offer. Strong 19.3% online sales growth, representing 4.4% of sales and continues to grow. New in-store and online branding initiatives well received. 11 existing sites rebranded using new Millers' design concept. 53 stores have been rebranded to date, and are performing above the brand s average. Growth expected to continue in H2 FY17, supported by: o further roll out of new Millers store design concept; o opening of new stores; and o increased online sales. 11


12 KEY GROWTH PRIORITIES RIVERS TRANSFORMATION Transformation well on-track. Underlying EBITDA profit made in H1 FY17. Experienced management team executing turnaround strategy. Positive customer response to product offer across all categories. Significant headway achieved in reducing Rivers CODB. Customer membership database continues to grow. 23.6% uplift in online sales compared to PCP. Strong trend of repeat purchases by registered rewards customers continues. Inventories clean with omni-channel strategy and increased refinement in merchandise planning. No complacency, though remain confident Rivers will maintain its growth momentum and achieve a much improved result this year over PCP. 12

 in UK,")


13 KEY GROWTH PRIORITIES OFFSHORE EXPANSION Continue to build multi-channel platform in USA. Wholesale distribution into 140 Macy s stores. Successful product trials in Evans (The Arcadia Group) in UK, supported by ongoing repeat orders. Significant uplift in Nordstrom sales through wholesale and online, exceeding expectations. Locally, City Chic rolled out a further 15 new concession sites into Myer during H1 FY17, bringing the total concession sites to 29. UK UAE USA AU NZ RSA City Chic International Representation 13
14 SOCIAL RESPONSIBILITY & COMPLIANCE Ethical Trade Focus on developing Ethical Sourcing policies to ensure we build a fully transparent supply chain. Key Updates Relaunched Code of Conduct and Ethical sourcing policies to entire vendor base. All human rights policies defined to International Labour Organisation ( ILO ) standards. Redefined ethical sourcing policies: more emphasis on workers human rights, participation in worker health and safety committees and social accountability. Implemented animal welfare policy. Key Milestones Introduced Vendor MAKE YOUR MARK program. Rolled out/trained vendors on 10 Rules of Engagement. Traced/implemented Farm to Factory audits on key cotton programs. On-going focus Launch worker grievance hotline/anonymous to create mechanism for all factory workers to voice concerns around safety or working conditions. April 2017 Implement training program for worker participation and safety committees. Occupational Health & Safety (OH&S) OHS/ WHS and Health Management Strategies ensure SFG safe and healthy environment for customers and employees. Key Milestones Concluded second Health & Wellbeing initiative: OneEighty. Full implementation of health-outcome focused workers compensation initiative: Recover@Work. Key results to date: 44% reduction in Lost Time Injuries (LTI s), ending calendar year (since projects launched) with total reduction of 54%. 10% decrease in incidents, furthering on last year s 10% group reduction. Results achieved through continued high engagement rates across network. On-going focus Expanding on the OneEighty and Recover@Work programs; including full implementation at Support Office. 14

15 3 FINANCIAL ANALYSIS 15
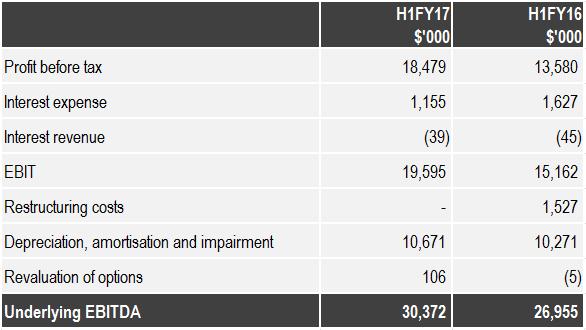
16 GROUP TRADING HALF-YEAR ENDED 31 DECEMBER 2016 Revenue decline driven by fewer units sold albeit at a higher average selling price ( ASP ) as the Group drives a First Price, Right Price strategy. Benefits derived at gross profit level from on-going shift to directly sourced product. Gross margin increase mainly due to: o Increased ASP (up 3.6% on PCP); and o Improved underlying cost price stronger USD fully offset by better price negotiation and duty reductions. Costs of doing business increased by $0.9m/0.4% as inflation was partly offset by tight cost control. Underlying EBITDA of $30.4m up on PCP by $3.4m/12.7%. H1FY17 $'000 H1FY16 $'000 Change % Revenue 430, ,303 (1.0%) Gross Profit 249, , % 58.0% 56.1% Underlying EBIT DA 30,372 26, % EBIT 19,595 15, % Profit before tax 18,479 13, % Net profit after tax 12,059 8, % Basic earnings per share (cents) % CODB 219, , % 51.0% 50.2% Reclassification of $4.7m warehousing costs from CODB to Gross Margin in H1 FY16 for comparability. See Appendix for full reconciliation. 16
17 GROUP CASHFLOW HALF-YEAR ENDED 31 DECEMBER 2016 WORKING CAPITAL Net movement reflects impact of o higher inventories as a result of increased holdings to support wholesale growth in the USA; and o increased trade and other payables. Use of trade finance facility and proactive negotiations extended trading terms with direct suppliers with on-going repeat orders. CAPEX (PP&E and intangible assets) Total net capex including intangibles additions of $8.2m (PCP $7.4m) primarily for stores and investment in IT infrastructure. NET CASH/DEBT Net cash position of $12.3m comprising cash of $18.6m less borrowings of $6.3m (Net cash position PCP $1.4m). $61.0m bank loan facilities with $50.4m unused at 31 December Total available facilities will be $52.0m at 30 June 2017, in line with FY16 reduction, reflecting the lower borrowing requirements of the Group. Bank loan facilities in compliance with bank covenants. Reducing bank facility to $42.0m by February H1FY17 $'000 H1FY16 $'000 Underlying EBITDA 30,372 26,955 Restructuring costs - (1,527) Net working capital 4,610 14,419 Net interest (1,116) (1,582) Net taxes - (1,458) Operating cash flow 33,866 36,807 Net capex including intangibles (8,224) (7,430) Free cash flow 25,642 29,377 Borrowings (25,927) (23,216) Dividends - - Net cash flow (285) 6,161 DIVIDENDS Board resolved not to declare an interim dividend. 17

18 4 OUTLOOK 18


19 OUTLOOK A VIEW OF THE FUTURE The uncertainty of the trading outlook is heightened by new normal market volatility. SFG has proven agility to navigate turbulent trading conditions. The focus is to remain vigilant in delivering earnings growth. The Group is confident in the strategy: to be a leading Omni-channel retailer in a specialised category where we have a proven track record, scale, insight, and momentum. 19

20 5 APPENDICES
21 EBITDA RECONCILIATION 21
22 H1 FY16 RECLASSIFICATION RECONCILIATION HALF-YEAR ENDED 31 DECEMBER 2016 Income statement H1FY17 H1FY16 FY16 Revenue (A$m) Revenue growth (1.0%) 5.2% 4.4% Gross profit (A$m) Gross margin % 58.0% 57.2% 55.6% Reclassifcation adjustment (A$m)* 0.0 (4.7) (4.8) Adjusted gross profit (A$m) Adjusted gross margin % 58.0% 56.1% 55.0% Underlying EBIT DA (A$m) Underlying EBIT DA margin % 7.1% 6.2% 3.0% NPAT (A$m) (2.2) NPAT margin % 2.8% 2.0% (0.3%) Basic EPS (cents/share) (1.1) Costs of Doing Business CODB CODB % 51.0% 51.3% 52.8% Reclassifcation adjustment (A$m)* 0.0 (4.7) (4.8) Adjusted CODB(A$m) Adjusted CODB % 51.0% 50.2% 52.2% *As referenced on slide 5 and
 173 166 7 - - 138 1 (8) 131 124 7 - - * 118 15-133 113 12 6 2 151 5 (3) 153 153 - - - - 4-4 3 1 Total 1,092 28 (25) 1,095 1,033 54 6 2 * Includes 29 concession sites in")
23 STORE MOVEMENTS HALF-YEAR ENDED 31 DECEMBER 2016 Store movements Stores 1 Jul 16 New Closed Stores 31 Dec 16 Stores AU Store Location Stores NZ Stores USA Stores RSA (4) (10) (8) * (3) Total 1, (25) 1,095 1, * Includes 29 concession sites in Myer at 31 December 2016 (30 June 2016: 14). 23
24 STORE & OTHER CAPEX HALF-YEAR ENDED 31 DECEMBER 2016 H1FY17 $'000 H1FY16 $'000 New stores 2,434 1,732 Refurbishments & relocations 3,774 3,199 IT capex 1,761 1,791 Head office capex Other capex Proceeds from disposals (360) (168) Total net capex 8,224 7,430 New stores $'000 Refurbs & relocations $'000 Total H1FY17 $' , ,502 1, ,281 1,024 2, ,434 3,774 6,504 24
25 E N D WE WILL BE A GLOBAL MARKET LEADER AS OUR BRANDS CHANGE THE PERCEPTION OF FASHION
YEAR END REPORT 30 JUNE
 YEAR END REPORT 30 JUNE 13 IMPORTANT NOTICE AND DISCLAIMER This presentation has been prepared by Specialty Fashion Group Limited (the Company ). It contains general background information about the Company
25 February 2019 The PAS Group Limited H1 FY2019 Results Briefing
 25 February 2019 The PAS Group Limited H1 FY2019 Results Briefing ABN 25 169 477 463 H1 FY2019 Results Summary Sales up 9.9% to $143.0 million Online sales up 11.0% Wholesale sales up 32.1% Retail sales
1H FY16 RESULTS PRESENTATION
 FY16 RESULTS PRESENTATION March 2016 Contents 1 Results Overview 2 Key Line Items 3 Country Results 4 Cash Flow, Balance Sheet, Dividend 5 Growth Strategy Update 6 FY16 Outlook 7 Questions A Appendices
Shaver Shop Group Limited 1H FY18 RESULTS INVESTOR PRESENTATION. 23 February 2018
 Shaver Shop Group Limited 1H FY18 RESULTS INVESTOR PRESENTATION 23 February 2018 1 TABLE OF CONTENTS 01 Key business highlights 02 Financial results 03 Key growth drivers 04 Trading update& outlook 05
Cautionary Statement Regarding Forward-Looking Statements
 January 2018 Cautionary Statement Regarding Forward-Looking Statements Forward Looking Statements: Certain statements are forward-looking statements made pursuant to the safe harbor provisions of the Private
Myer First Half 2018 Results. Continued strong growth in the online business Renewed focus on product, price and customer service
 21 March 2018 Myer First Half 2018 Results Continued strong growth in the online business Renewed focus on product, price and customer service Myer Holdings Limited (MYR) today announced its financial
For personal use only. Lovisa Holdings Limited 2019 HALF YEAR
 Lovisa Holdings Limited 2019 HALF YEAR SHANE FALLSCHEER CHRIS LAUDER MANAGING DIRECTOR CHIEF FINANCIAL OFFICER Some of the information contained in this presentation contains forward - looking statements
Sigma Pharmaceuticals Limited
 Sigma Pharmaceuticals Limited Results Presentation for the Full Year ended 31 January 2013 Mark Hooper CEO& Managing Director Jeff Sells Chief Financial Officer 14 March 2013 Important notice The material
Financial Year highlights 4. Accent Group business model 5. H1 FY19 summary of financial performance 6. Retail performance 8
 1 2 Table of contents Item Page Financial Year highlights 4 Accent Group business model 5 H1 FY19 summary of financial performance 6 Retail performance 8 Omnichannel performance 10 Wholesale & Vertical
Investor Presentation
 Investor Presentation Cautionary Note Regarding Forward-Looking Statements This presentation contains forward-looking information, including the Company s statements regarding its future outlook. In addition,
2017 Half-Year Results
 2017 Half-Year Results Martin Earp, CEO Josée Lemoine, CFO 16 August 2017 Financials Pillars of Growth Summary of Performance H1 2017 Sales Revenue $218.2m 1.7% Demographics Deaths 1 2.8% Australia $44.1m
For personal use only
 FY16 FULL YEAR RESULTS REVIEW Agenda GROUP RESULTS OVERVIEW BUSINESS UNIT REVIEW OUTLOOK Eastlands Shopping Centre BSA completed the mechanical services upgrade and extension to one 29/08/2016 BSA Limited
Third Quarter 2017 Business Update. October 26, 2017
 Third Quarter 2017 Business Update October 26, 2017 Third Quarter 2017 Results (GAAP Basis) $ in millions, except EPS Q3 % of Q3 % of Increase/ 2017 Sales 2016 Sales (Decrease) Net sales $948.2 $901.4
Interim Results Presentation. For the six months ended 31 December 2018
 Interim Results Presentation For the six months ended 31 December 2018 1 STEEL & TUBE IS One of New Zealand s leading providers of steel solutions, and a proud New Zealand company, with over 65 years of
Investor Presentation
 Investor Presentation Cautionary Note Regarding Forward-Looking Statements This presentation contains forward-looking information, including the Company s statements regarding its future outlook. In addition,
AUSTRALIAN PHARMACEUTICAL INDUSTRIES LIMITED HALF YEAR FY14 RESULTS PRESENTATION WEDNESDAY 30 APRIL 2014
 AUSTRALIAN PHARMACEUTICAL INDUSTRIES LIMITED HALF YEAR FY14 RESULTS PRESENTATION WEDNESDAY 30 APRIL 2014 Important Notice The material in this presentation is of general information about API s activities
For personal use only. JB Hi-Fi Limited. HY18 Results Presentation
 JB Hi-Fi Limited HY8 Results Presentation 5 FEBRUARY AUGUST 06 08 PAGE Agenda. Group Performance Overview. JB HI-FI 3. The Good Guys 4. Group Balance Sheet and Cash Flow 5. Outlook Richard Murray Group
FY17 RESULTS. Tuesday 20 February 2018
 FY17 RESULTS Tuesday 20 February 2018 Agenda 2017 Highlights Results 2018 Observations Out-of-Home industry APN Outdoor Contract renewals Focus and objectives Trading update 2 2017 Highlights 3 2017 highlights
THINKSMART 2009 Half Year Results Presentation: 21 st August 2009
 THINKSMART 2009 Half Year Results Presentation: 21 st August 2009 Ned Montarello Executive Chairman & CEO Neil Barker Group COO Agenda 1. The ThinkSmart Business 2. Half Year Scorecard 3. Key Financial
For personal use only
 FY15 FULL YEAR RESULTS REVIEW Progressing to plan Agenda GROUP RESULTS OVERVIEW BUSINESS UNIT REVIEW OUTLOOK 150 Collins Street, Westpac Building. Mechanical work was completed by Allstaff Airconditioning
Tabcorp Holdings Limited. 2014/15 Full Year Results Presentation 13 August 2015
 Tabcorp Holdings Limited ABN 66 063 780 709 2014/15 Full Year Results Presentation 13 August 2015 Draft version 15 (01-08-13) FY15 overview Statutory NPAT $334.5m, up 157.5%, comprising of: NPAT from continuing
For personal use only
 Appendix 4D Name of entity (SFH) Appendix 4D Half year report ABN Half yearly (tick) 43 057 569 169 Preliminary final (tick) 1. Details of the reporting period Current reporting period Previous corresponding
Photo by James Ball - Coffey International Limited FY2013 Half Year Results Presentation. 11 February 2013
 Photo by James Ball - www.dlscape.com Coffey International Limited FY2013 Half Year Results Presentation 11 February 2013 Agenda Financial Performance Business Performance Outlook Presenters John Douglas
For personal use only. FY16 Results Presentation
 FY16 Results Presentation PAGE 1 Agenda 1. Highlights 2. FY16 Results Trading performance Balance sheet and cash flow Capital management 3. Business Update Our objectives The JB HI-FI model Store portfolio
Kathmandu FY12 Results Presentation
 Kathmandu FY12 Results Presentation Contents Results Overview Key Line Items Country Results Cash Flow, Balance Sheet, Dividend Growth Strategy Update FY13 Outlook Questions 2 Results Overview Results
Investor & Analyst Presentation Ful YearResults 30 June2016 For personal use only 25th August 2016 Rebekah O Flaherty - CEO I Jonathan Kenny - CFO
 Investor & Analyst Presentation Full YearResults 30 June2016 25th August 2016 Rebekah O Flaherty - CEO I Jonathan Kenny - CFO Agenda 1 Overview 2 Strategic Priorities 3 FY16 Financial Results 4 FY17 Outlook
FY2018 Results Presentation
 FY2018 Results Presentation Disclaimer The material in this presentation has been prepared by Bapcor Limited ( Bapcor ) ABN 80 153 199 912 and is general background information about Bapcor s activities
For personal use only. FY2017 Results Presentation
 FY2017 Results Presentation Disclaimer The material in this presentation has been prepared by Bapcor Limited ( Bapcor ) ABN 80 153 199 912 and is general background information about Bapcor s activities
For personal use only. Beacon Lighting Group Limited RESULTS PRESENTATION F Y 20 14
 For personal use only Beacon Lighting Group Limited RESULTS PRESENTATION F Y 20 14 AGENDA 1. BACKGROUND 2. RESULTS OVERVIEW 3. TRADING PERFORMANCE 4. CASH FLOW, BALANCE SHEET, DIVIDEND 5. GROWTH STRATEGY
Business Update. USPP Conference Miami. Luis Damasceno Group CFO Michael Williams Group Finance Director & Treasurer January 2019
 Business Update USPP Conference Miami Luis Damasceno Group CFO Michael Williams Group Finance Director & Treasurer 23-25 January 2019 www.alsglobal.com IMPORTANT NOTICE AND DISCLAIMER This presentation
SAFE HARBOR STATEMENT
 1 SAFE HARBOR STATEMENT Forward Looking Statements This press release, and the above referenced conference call, contains or may contain forward-looking statements made pursuant to the safe harbor provisions
Sigma Pharmaceuticals Limited
 Investor Relations Contact: Gary Woodford Corporate Affairs Manager Gary.Woodford@signet.com.au Phone: 03 9215 9632 Mobile: 0417 399 204 Mark Hooper CEO and Managing Director Gary Woodford Corporate Affairs
MEDIA RELEASE JUST GROUP S FIRST HALF NET PROFIT UP 9.0% ANNOUNCES SOUTH AFRICAN JOINT VENTURE AND OFF-MARKET SHARE BUY-BACK
 7 March 2007 MEDIA RELEASE JUST GROUP S FIRST HALF NET PROFIT UP 9.0% ANNOUNCES SOUTH AFRICAN JOINT VENTURE AND OFF-MARKET SHARE BUY-BACK Just Group today announced a net profit of $39.7 million for the
1H 19 Investor Presentation February 2019
 1H 19 Investor Presentation February 2019 1 About Raiz Raiz (formerly Acorns) is a mobile first micro-investing platform via mobile phone or web app, which allows customers to invest in a portfolio of
1H18 RESULTS 6 MONTHS ENDED 31 DECEMBER 2017
 1H18 RESULTS 6 MONTHS ENDED 31 DECEMBER 2017 GROUP RESULTS 2 GROWTH IN PROFIT AND FCF Group Underlying 1 Reported 2 1H 2018 1H 2017 1H 2018 1H 2017 Revenue 856.5 808.7 856.5 808.7 EBIT 81.3 81.9 61.6 61.1
Noni B Limited ABN Appendix 4D Results for announcement to the market and Interim Financial Report Half-year ended 30 December 2018
 Noni B Limited ABN 96 003 321 579 Appendix 4D Results for announcement to the market and Interim Financial Report Half-year ended 30 December 2018 Lodged with the ASX under Listing Rule 4.2A 1 Appendix
Q Earnings Presentation
 Q1 2018 Earnings Presentation May 24, 2018 1 Cautionary Statement Regarding Forward Looking Statements This presentation contains forward-looking statements, including statements made within the meaning
1H18 Results Presentation Sid Takla Interim Chief Executive Officer Lyndal York Chief Financial Officer
 1H18 Results Presentation Sid Takla Interim Chief Executive Officer Lyndal York Chief Financial Officer 21 August 2018 Important Notice and Disclaimer This presentation has been prepared by Asaleo Care
FY18 Results Presentation Bravura Solutions Limited. 28 August 2018
 FY18 Results Presentation Bravura Solutions Limited 28 August 2018 Important notice and disclaimer The information contained in this document (including this notice) and discussed at this presentation
Pacific Brands Half Year Results 2015
 Pacific Brands Half Year Results 2015 17 February 2015 David Bortolussi, Chief Executive Officer David Muscat, Chief Financial Officer 0 Half year results summary Strategic review objectives achieved ahead
Nordstrom Second Quarter 2017 Earnings Achieved Expectations Results Reflected Positive Anniversary Sale, Inventory and Expense Execution
 EX-99.1 2 jwnq22017ex991.htm EX-99.1 Exhibit 99.1 FOR RELEASE: August 10, 2017 at 1:05 PM PDT INVESTOR CONTACT: MEDIA CONTACT: Trina Schurman Nordstrom, Inc. (206) 303-6503 Gigi Ganatra Duff Nordstrom,
For personal use only. F Y R e s u l t s P r e s e n t a t i o n
 F Y 2 0 1 6 R e s u l t s P r e s e n t a t i o n Our Brands 2 Disclaimer The material in this presentation has been prepared by Bapcor Limited ( Bapcor ) ABN 80 153 199 912 and is general background information
Half Year results and outlook
 PRESENTATION TO INVESTORS & ANALYSTS Half Year results and outlook David Banfield - Group CEO Jannine Mountford - Group CFO 1 March 2018 For 6 months 1 July 31 December 2017 New Zealand tapware underperforms,
ROADSHOW Hong Kong // Credit Suisse
 ROADSHOW Hong Kong // Credit Suisse HUGO BOSS Company Handout Hong Kong, July 3, 2015 HUGO BOSS July 3, 2015 2 Agenda Financial Review First Quarter 2015 Strategic Outlook 2015 and beyond Financial Outlook
Full year results presentation to 30 June 2016
 Full year results presentation to 30 June 2016 1 Disclaimer and Non-IFRS Information 2 Disclaimer The material in this presentation has been prepared by carsales.com Limited (ASX: CAR) ABN 91 074 444 018
Inghams Group Limited. FY2018 Results Presentation
 Inghams Group Limited FY2018 Results Presentation 22 AUGUST 2018 Important notice and disclaimer Disclaimer The material in this presentation is general background information about the activities of Inghams
FIRST-HALF 2017 RESULTS. 27 July 2017
 FIRST-HALF 2017 RESULTS 27 July 2017 Disclaimer FORWARD LOOKING STATEMENTS This presentation contains certain statements that constitute "forward-looking statements", including but not limited to statements
For personal use only
 Nick Scali Limited NCK.ASX FY18 Results Presentation 16 th August 2018 Key Highlights Sales Sales increased 7.7% to $250.8m (FY17: $232.9m) Increase assisted by full year of sales from 4 stores opened
Investor Presentation
 NZX Code: ATM ASX Code: A2M 3 May 2017 NZX/ASX Market Release Investor Presentation Please find attached a presentation to be given today by The a2 Milk Company Limited at Macquarie s annual Australia
1H FY19 RESULTS PRESENTATION 25 February 2019
 RELIANCE WORLDWIDE CORPORATION LIMITED ACN 610855877 1H FY19 RESULTS PRESENTATION 25 February 2019 INVESTOR PRESENTATION 1H FY19 RESULTS PAGE 0 Important Notice This presentation contains general information
Investor & Analyst Presentation
 Investor & Analyst Presentation FY18 H1 Results For the six monthsended 31 December 2017 15 th February 2018 Rebekah O Flaherty-CEO I Jonathan Kenny-CFO Agenda 1 2 3 4 5 6 Overview Strategic Priorities
Group Strategy. Claus-Dietrich Lahrs, Chief Executive Officer. November 8, 2011
 Group Strategy Claus-Dietrich Lahrs, Chief Executive Officer November 8, 2011 HUGO BOSS Investor Day 2011 // Group Strategy HUGO BOSS November 8, 2011 2 / 37 AGENDA INTRODUCTION HUGO BOSS A PREMIUM BUSINESS
FINANCIAL RESULTS PRESENTATION H1FY18
 Virtus Health (ASX:VRT) FINANCIAL RESULTS PRESENTATION H1FY18 Tuesday 20 th February, 2018 9.15am AEDT DISCLAIMER The material in this presentation has been prepared by Virtus Health Limited ABN 80 129
AUSTRALIAN PHARMACEUTICAL INDUSTRIES LIMITED FULL YEAR FY12 RESULTS PRESENTATION THURSDAY 25 OCTOBER 2012
 AUSTRALIAN PHARMACEUTICAL INDUSTRIES LIMITED FULL YEAR FY12 RESULTS PRESENTATION THURSDAY 25 OCTOBER 2012 1 Important notice The material in this presentation is of general information about API s activities
H1 16 interim results. 22 September 2015
 H1 16 interim results 22 September 2015 Important notice 2 This presentation may include certain forward-looking statements, beliefs or opinions, including statements with respect to the Company s business,
24 th Annual General Meeting
 24 th Annual General Meeting 28 October 2016 gwagroup.com.au Agenda Chairman s Address Managing Director s Address Formal Business Darryl McDonough Chairman Tim Salt Managing Director Darryl McDonough
INVESTOR PRESENTATION
 INVESTOR PRESENTATION Results for the 6 months ended 31 December 2017 Kevin Slaven CEO Geoff Stephenson CFO www.pmplimited.com.au ABN 39 050 148 644 27 February 2018 TABLE OF CONTENTS Financial Highlights
BILLABONG INTERNATIONAL LIMITED
 BILLABONG INTERNATIONAL LIMITED 2017 FULL YEAR RESULTS 30 August 2017 Courtney Conlogue Billabong 2017 FULL YEAR RESULTS 1 2017 FULL YEAR RESULTS 2 TODAY SUMMARY OF RESULTS PROGRESS ON OUR STRATEGY FINANCIAL
For personal use only
 ACN 072 507 147 ASX & MEDIA RELEASE 25 May 2017 THORN FY17 KEY NUMBERS UP, ISSUES BEING ADDRESSED Consumer leasing and business finance company, Thorn Group Limited (ASX: TGA), has lifted revenue, EBIT
Interim Results Presentation
 Interim Results Presentation Half Year 31 December 2015 Released 15 February 2016 Scott McMillan, Managing Director Lee Schofield, Chief Executive Officer Matt Dyer, Chief Financial Officer Key Messages
Company Results Half Year ended 4 January 2009
 Michael Luscombe Chief Executive Officer Tom Pockett Finance Director Company Results Half Year ended 4 January 2009 Highlights Financial Half Year 09 This is a strong result reflecting increasing customer
2017 half year results investor presentation
 2017 half year results investor presentation 27 February 2017 contents section presenting slide CEO presentation Julian Ogrin 3 broadband 10 CFO presentation Leanne Wolski 14 summary Julian Ogrin 21 appendix
FY17 Annual Results Announcement
 FY17 Annual Results Announcement Ainsworth Game Technology Limited www.agtslots.com.au Disclaimer IMPORTANT NOTICE This presentation has been prepared by Ainsworth Game Technology Limited ACN 068 516 665
For personal use only
 RELIANCE WORLDWIDE CORPORATION LIMITED ACN 610855877 www.rwc.com FY2016 RESULTS PRESENTATION 29 August 2016 Important notice This presentation contains general information about s activities at the date
2011 Interim Results. Keith Gordon, Managing Director & Chief Executive Officer Stephen Gobby, Chief Financial Officer
 2011 Interim Results Keith Gordon, Managing Director & Chief Executive Officer Stephen Gobby, Chief Financial Officer Emeco 2011 Interim Results Overview Financials Strategy & Outlook Questions Appendices
sur 11 16/08/ :58 Nordstrom Reports Second Quarter 2013 Earnings Print Page Close Window
 Print Page Close Window Nordstrom Reports Second Quarter 2013 Earnings SEATTLE--(BUSINESS WIRE)--Aug. 15, 2013-- Nordstrom, Inc. (NYSE:JWN) today reported earnings per diluted share of $0.93 for the second
ASX Media Release WORLEYPARSONS LIMITED (ASX: WOR) FULL YEAR 2017 RESULT
 FULL YEAR 2017 RESULT") 23 August 2017 ASX Media Release WORLEYPARSONS LIMITED (ASX: WOR) FULL YEAR 2017 RESULT Professional services company WorleyParsons Limited today announced a statutory net profit after tax (NPAT) of $33.5
23 August 2017 ASX Media Release WORLEYPARSONS LIMITED (ASX: WOR) FULL YEAR 2017 RESULT Professional services company WorleyParsons Limited today announced a statutory net profit after tax (NPAT) of $33.5
First Quarter 2017 Business Update APRIL 27, 2017
 First Quarter 2017 Business Update APRIL 27, 2017 First Quarter 2017 Highlights Net Sales $ in millions, except EPS Adjusted Operating Income* (Adjusted Operating Margin) Adjusted EPS* +1% (15%) (8%) $724.1
INTERIM RESULTS PRESENTATION SIX MONTHS TO 30 JUNE 2018
 INTERIM RESULTS PRESENTATION SIX MONTHS TO 30 JUNE 2018 DISCLAIMER The information contained in this presentation has not been independently verified and this presentation contains various forward-looking
A S X A N N O U N C E M E N T
 A S X A N N O U N C E M E N T DATE: 24 February 2016 Attached is the Presentation regarding Pact s Half year Financial Results for the half year ended 31 December 2015. The Presentation will occur at 10am
For personal use only
 Investor Presentation Half Year Results to 31 December 2016 24 February 2017 PETER CAUGHEY, CEO & MANAGING DIRECTOR 1 Agenda Overview Financials Business conditions, strategy and outlook 2 Overview 1H17
Total Transaction Value (TTV) (unaudited) $1,870m Up 9% Revenue and other income $150.5m Up 26% Statutory NPAT $22.1m Up 28%
 (unaudited) $1,870m Up 9% Revenue and other income $150.5m Up 26% Statutory NPAT $22.1m Up 28%") 24 February, 2017 ASX RELEASE Corporate Travel Management reports record 1HFY17 profit, Trading at top end of FY2017 profit guidance, or $97m 1HFY17 Results Highlights: Total Transaction Value (TTV) (unaudited)
24 February, 2017 ASX RELEASE Corporate Travel Management reports record 1HFY17 profit, Trading at top end of FY2017 profit guidance, or $97m 1HFY17 Results Highlights: Total Transaction Value (TTV) (unaudited)
For personal use only
 FY2017 Annual results Another record-breaking year 14 August 2017 Praemium Limited ACN: 098 405 826 Disclaimer The material contained in this document is a presentation of general information about the
FULL YEAR RESULTS 26 TH APRIL 2018
 1 FULL YEAR RESULTS 26 TH APRIL 2018 2 Overview Profit growth in a challenging market Simply Be standout performance Strategic momentum: UK market share gains USA +21% in H2 New partnerships announced
FY Alliance Aviation Services Limited Results Presentation. August 2018
 FY 2018 Alliance Aviation Services Limited Results Presentation August 2018 Key Messages Alliance Aviation Services Limited announces a full year result which includes: $ 26.1m A strong financial performance
We prioritize sustainable, profitable growth
 We prioritize sustainable, profitable growth Updated growth target reflects prioritization of profitability over overly expensive growth Previous financial targets for 2020 Updated targets Net sales At
Fourth Quarter & Fiscal 2015 Business Update. February 25, 2016
 Fourth Quarter & Fiscal 2015 Business Update February 25, 2016 Fourth Quarter 2015 Highlights Net Sales Comparable to LY $ in millions, except EPS Adjusted Operating Income* (Adjusted Operating Margin)
Vita Group (VTG)! Results Presentation!
! Results Presentation!") Vita Group (VTG) Results Presentation First half FY14 Group highlights Sustained trend of strong profit, dividend growth Underlying EBITDA 1 +18%, underlying NPAT 2 +56%, dividend +66% Areas of strategic
Vita Group (VTG) Results Presentation First half FY14 Group highlights Sustained trend of strong profit, dividend growth Underlying EBITDA 1 +18%, underlying NPAT 2 +56%, dividend +66% Areas of strategic
Investor Meeting Presentation
 September 2015 HUGO BOSS September 2015 2 Agenda Financial Review First Half Year 2015 Strategic Outlook 2015 and beyond Financial Outlook 2015 HUGO BOSS September 2015 3 Agenda Financial Review First
For personal use only
 ASX Code: A2M NZX Code: ATM 17 February 2016 NZX/ASX Market Release Outstanding growth in infant formula drives record results for The a2 Milk Company Full year forecast revised upward Overview - financial
LANDS' END ANNOUNCES FIRST QUARTER FISCAL 2017 RESULTS
 LANDS' END ANNOUNCES FIRST QUARTER FISCAL 2017 RESULTS DODGEVILLE, Wis., June 6, 2017 (GLOBE NEWSWIRE) - Lands' End, Inc. (NASDAQ:LE) today announced financial results for the first quarter ended April
TOURISM HOLDINGS LTD FY16 INTERIM RESULTS PRESENTATION. 23 February 2016
 TOURISM HOLDINGS LTD FY16 INTERIM RESULTS PRESENTATION 23 February 2016 $M H1 FY16 Highlights Revenue $134M up 20% Earnings before interest and tax* $15.0M up 42% Net profit after tax $8.2M up 45% H1 EBIT
For personal use only. JB Hi-Fi Limited. HY17 Results Presentation
 JB Hi-Fi Limited HY7 Results Presentation 3 5 FEBRUARY AUGUST 06 07 PAGE Agenda. Group Performance Overview. JB HI-FI 3. The Good Guys 4. Stores 5. Group Balance Sheet and Cash Flow 6. Outlook Richard
GrandVision Full Year 2016 Results. 20 February 2017
 GrandVision Full Year 2016 Results 20 February 2017 Forward looking statements This presentation contains forward-looking statements that reflect GrandVision s current views with respect to future events
ASCENA RETAIL GROUP, INC.
 ASCENA RETAIL GROUP, INC. FORM 8-K (Current report filing) Filed 12/13/12 for the Period Ending 12/11/12 Address 933 MACARTHUR BOULEVARD MAHWAH, NJ, 07430 Telephone 551.777.6700 CIK 0001498301 Symbol ASNA
STEEL & TUBE HOLDINGS LIMITED. HY18 Interim Results Presentation. For the Six Months to 31 December February 2018
 STEEL & TUBE HOLDINGS LIMITED HY18 Interim Results Presentation For the Six Months to 31 December 2017 23 February 2018 BECOMING A MODERN AND INNOVATIVE COMPANY Providing Strength to New Zealand Steel
Financial Year 1H19 Results
 Financial Year 1H19 Results Investor presentation 20 November 2018 1 Agenda 1. 1H19 Summary 2. 1H19 Financial results 3. FY19 Outlook 4. Q&A 5. Appendix 2 1H19 Summary Skander Malcolm Chief Executive Officer
German Investment Seminar 2011 Commerzbank AG New York January 10-11, 2011
 German Investment Seminar 2011 Commerzbank AG Mark Langer Chief Financial Officer Dennis Weber Head of Investor Relations New York January 10-11, 2011 German Investment Seminar, Commerzbank HUGO BOSS January
For personal use only
 FY14 RESULTS John Croll Chief Executive Officer Nimesh Shah Chief Financial Officer AGENDA OVERVIEW OF FY14 RESULT FINANCIAL PERFORMANCE FY15 OUTLOOK GROWTH STRATEGY Q&A JOHN CROLL NIMESH SHAH JOHN CROLL
Villa World Limited FY14 Results Presentation COVER. ASX Investor Series. 26 August villaworld.com.au. [] August villaworldgroup.com.
![Villa World Limited FY14 Results Presentation COVER. ASX Investor Series. 26 August villaworld.com.au. [] August villaworldgroup.com.](/thumbs/80/80864998.jpg "Villa World Limited FY14 Results Presentation COVER. ASX Investor Series. 26 August villaworld.com.au. [] August villaworldgroup.com.") Villa World Limited FY14 Results Presentation Villa World Limited ASX Investor Series 26 August 2014 villaworld.com.au 16 October 2014 villaworld.com.au Since 1986 COVER [] August 2013 villaworldgroup.com.au
Villa World Limited FY14 Results Presentation Villa World Limited ASX Investor Series 26 August 2014 villaworld.com.au 16 October 2014 villaworld.com.au Since 1986 COVER [] August 2013 villaworldgroup.com.au
2017 Annual General Meeting 2 May 2017
 2017 Annual General Meeting 2 May 2017 Forward Looking Statements This presentation contains forward-looking statements that reflect GrandVision s current views with respect to future events and financial
Fourth Quarter 2017 Earnings Presentation
 Fourth Quarter 2017 Earnings Presentation Safe Harbor Statement This document may contain certain forward-looking statements within the meaning of the Private Securities Litigation Reform Act of 1995.
METCASH. FY16 Half Year Results - 30 November 2015
 METCASH FY16 Half Year Results - 30 November 2015 GROUP UPDATE IAN MORRICE GROUP CHIEF EXECUTIVE OFFICER Group update positive momentum continues Group revenue up 1.4% to $6.6b MF&G revenue up 0.7%, continued
Sales increased 8.1% to $128.0m (HY17: $118.4m)
") Nick Scali Limited NCK.ASX HY18 Results Presentation 7th February 2018 Key Highlights Sales increased 8.1% to $128.0m (HY17: $118.4m) Sales Like for like sales growth of +2.6% for Nick Scali Furniture
Nick Scali Limited NCK.ASX HY18 Results Presentation 7th February 2018 Key Highlights Sales increased 8.1% to $128.0m (HY17: $118.4m) Sales Like for like sales growth of +2.6% for Nick Scali Furniture
MAISONS DU MONDE: FULL-YEAR 2017 RESULTS
 PRESS RELEASE MAISONS DU MONDE: FULL-YEAR 2017 RESULTS Very good performance across the board, in line with targets Solid sales growth and profitability Excellent free cash flow generation and strong deleveraging
PMP LIMITED. For personal use only INVESTOR PRESENTATION. Results for the 6 months ended 31 December February 2016
 PMP LIMITED ABN 39 050 148 644 Results for the 6 months ended 31 December 2015 22 February 2016 Peter George, CEO Geoff Stephenson, CFO INVESTOR PRESENTATION 2016 HALF YEAR RESULTS Contents Pages H1 FY16
American Eagle Outfitters Report Second Quarter Results, Comp Sales Increased 2%, Sales and EPS Above Expectations
 NEWS RELEASE American Eagle Outfitters Report Second Quarter Results, Comp Sales Increased 2%, Sales and EPS Above Expectations 8/23/2017 PITTSBURGH--(BUSINESS WIRE)-- American Eagle Outfitters, Inc. (NYSE:AEO)
For personal use only
 Click to edit Master text styles IDP Education FY16 Results Presentation Twelve months to 30 June 2016 11 February 2016 Important notice and disclaimer Click Disclaimer to edit Master text styles The material
FY 2018 Full Year Results Investor Presentation. 27 th August 2018
 FY 2018 Full Year Results Investor Presentation 27 th August 2018 Corporate Overview Cash Converters is a leading international operator and franchisor in personal financial services and second hand goods
For personal use only
 16 March 2017 Myer records first half NPAT growth of 5.3% to $62.8 million Myer Holdings Limited (MYR) today announced its financial results for the 26 weeks to 28 January 2017. Myer Chief Executive Officer