Full year results presentation to 30 June 2016
|
|
|
- Ronald Collins
- 6 years ago
- Views:
Transcription
1 Full year results presentation to 30 June
2 Disclaimer and Non-IFRS Information 2 Disclaimer The material in this presentation has been prepared by carsales.com Limited (ASX: CAR) ABN ( carsales") and is general background information about carsales activities current as at the date of this presentation. The information is given in summary form and does not purport to be complete. In particular you are cautioned not to place undue reliance on any forward looking statements regarding our belief, intent or expectations with respect to carsales businesses, market conditions and/or results of operations, as although due care has been used in the preparation of such statements, actual results may vary in a material manner. Information in this presentation, including forecast financial information, should not be considered as advice or a recommendation to investors or potential investors in relation to holding, purchasing or selling securities. Before acting on any information you should consider the appropriateness of the information having regard to these matters, any relevant offer document and in particular, you should seek independent financial advice. Non-IFRS Financial Information carsales' results are reported under International Financial Reporting Standards (IFRS). This presentation also includes certain non-ifrs measures including, proforma, underlying and look through. These measures are used internally by management to assess the performance of our business and our associates, make decisions on the allocation of resources and assess operational management. Non-IFRS measures have not been subject to audit or review. All numbers listed as reported comply with IFRS.
3 Table of Contents 3 Key Messages 4 7 Reported Group Financial Performance 8 11 carsales Domestic carsales International Outlook New Product Releases Appendix 29 34
4 4 Key Messages to 30 June 2016
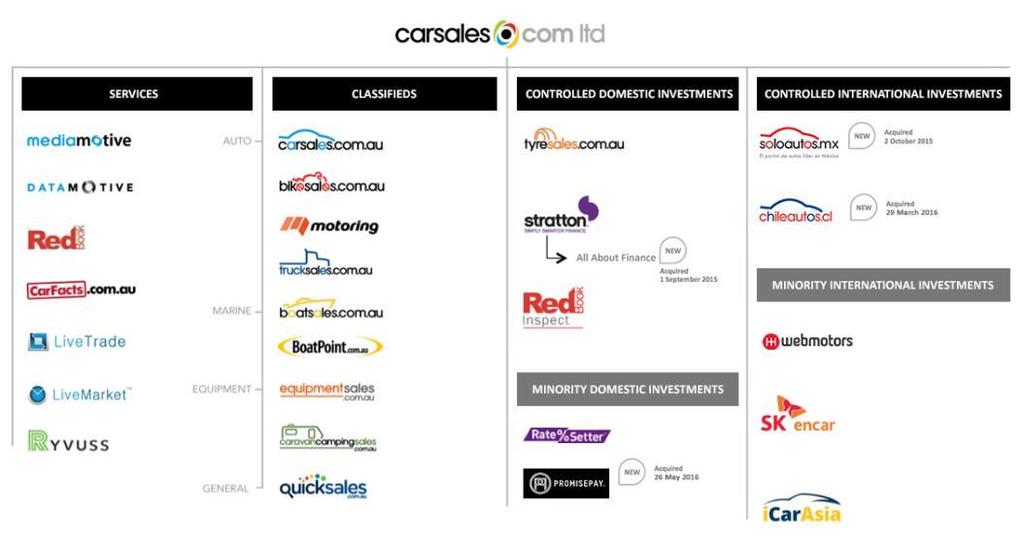
5 Organisational Structure 5

6 Overview of FY16 6 FINANCIAL OVERVIEW Pleasing full year results. REPORTED REVENUE up 10% to $344m FY16 pcp growth in revenue of 10%, EBITDA of 10% and adjusted NPAT* of 9%. Reported NPAT** up 6% to $109m. DOMESTIC OVERVIEW Strong H2 revenue growth across all online advertising and data research and services. REPORTED EBITDA up 10% to $170m Strong gross profit contribution from Stratton reflecting ongoing growth in core finance products. Overall Group EBITDA margins maintained at 50%. Continued strong revenue performance by Redbook Inspect and Tyresales. INTERNATIONAL OVERVIEW Adjusted NPAT* up 9% to $111m Completed the acquisition of 83% of Chileautos, the No. 1 auto classifieds business in Chile, during the second half continuing our Latin American expansion strategy. 65% of SoloAutos in Mexico also acquired during the year. Strong local currency growth for SKENCARSALES with revenue up 21% on pcp. Webmotors delivered solid local currency revenue growth of 13% on pcp with lead model being trialled from 1 July * Adjusted NPAT stated above is post non-controlling interests and excludes one-off gains on business disposal, gains on associate dilution and acquired intangible amortisation. See slide 30 regarding the disclosure of non-ifrs Information and slide 31 for a reconciliation of adjusted NPAT to Reported NPAT. ** Reported NPAT stated above is post non-controlling interests.

7 FY16 Operational Highlights 7 * Figures stated are for all websites in the carsales Network globally
8 8 Reported Group Financial Performance to 30 June 2016
9 Financial Overview Solid growth in revenue rising to $344.0m, up by 10% on pcp. Operating expenses (before Interest and D&A) up 10% on pcp. EBITDA up 10% on pcp to $170.3m. Stratton gross profit up 29% reflecting strong core finance revenue growth, offset by reduction in low margin products. Adjusted NPAT up 9% on pcp to $110.5m. D&A increased by $2.8m reflecting acquisition intangible asset amortisation and depreciation of capitalised labour supporting group wide integration and globalisation projects. Underlying solid growth in profits from associates (up 34% on pcp), offset by acquisition intangible asset amortisation, adverse FX in Brazil and inclusion of Ratesetter for the first time. Divestment of homesales business resulted in a gain of $0.9m. Adjusted EPS up 3.3 cents per share to 45.9, up 8% on pcp. Reported EPS up 2.2 cents per share to 45.4, up 5% on the prior year. Final FY16 dividend of 19.5 cents per share declared up 10% on pcp (FY15 final dividend of 17.7 cents per share). $A Millions Growth Year Ending 30 June 2016 FY15 FY16 $'s % Revenue Online Advertising % Data & Research % Finance and Related Services % International % Total Revenue % Operating Expenses (Before Interest and D&A) % EBITDA % EBITDA Margin 50% 50% D&A % EBIT % Net Interest Expense % Profit Before Tax % Income Tax Expense % Profits from Associates % Gain on business disposal N/A Gain on associate dilution (2.6) (74%) Outside Equity Interests (4.0) (4.8) (0.8) (21%) Reported Net Profit After Tax % Reported Earnings Per Share (cents) % Adjusted Net profit After Tax* % Adjusted Earnings Per Share (cents)* % 9 * Adjusted NPAT and earnings per share stated above is post non-controlling interests and excludes one-off gains on subsidiary disposal, gains on associate dilution and acquired intangible amortisation. See slide 30 regarding the disclosure of non-ifrs Information and slide 31 for a reconciliation of adjusted NPAT to Reported NPAT.


10 Strong track record of financial performance 10 REPORTED REVENUE REPORTED EBITDA ADJUSTED NPAT Millions Millions Millions CAGR 16.9% CAGR 13.9% CAGR 11.5% Once again carsales continues to demonstrate consistent high returns to its shareholders.
 FY16 Reported Leverage Ratio (Net debt / Annualised EBITDA) FY15 Reported Net Interest Cover (Annualised EBITDA / Annualised Net Interest Expense) FY16")


11 Reported Debt and Cash flow 11 Continued strong operating cash flows Improved credit metrics Millions Reported Operating Cash flow (column) and conversion from EBITDA to cash (line) FY16 Reported Leverage Ratio (Net debt / Annualised EBITDA) FY15 Reported Net Interest Cover (Annualised EBITDA / Annualised Net Interest Expense) FY16 FY15 See slide 30 regarding the disclosure of non-ifrs Information $A Millions Growth Year Ending 30 June 2016 FY15 FY16 $'s % Cash Capital expenditure % Capitalised labour costs % Total capital expenditure % * Net debt includes total borrowings less total cash as at 30 June 2016 per published balance sheet. Ratios above are based on reported financial outcomes and may vary with bank covenant definitions. Solid cash conversion of earnings with Operating cash flow / EBITDA at 72% up on pcp, with FY15 being lower due to timing of tax payments. Reported Net Debt* of ~$198m as at 30 June ~$10m increase on 30 June 2015 due to investments in Chile, Mexico and Promisepay, offset by operating cashflow. Cash capex up 153% on pcp to $4.3m principally reflecting office fit-out costs at Stratton due to ongoing business growth. Capitalised labour costs up 66% on pcp due to investment in technology platforms supporting international and adjacent market expansion.
12 12 carsales Domestic to 30 June 2016


13 Domestic Revenue Performance - Summary 13 $A Millions Growth Year Ending 30 June 2016 FY15 FY16 $'s % Domestic Revenue Dealer % Private % Display % Total Online Advertising % Data, Research and Services % Finance and Related Services % Total Domestic Revenue % Automotive Inventory at 30 June FY16 Category Revenue

14 Domestic Revenue Performance by Category 14 Millions Millions Dealer Dealer revenue up 10% on pcp to $123.8m Solid new and used car dealer enquiry volumes. Full year used enquiry volumes up 3% and in H2 new car enquiry volumes saw pcp growth. Pleasing used and new inventory growth of 8% and 15% respectively on pcp. Strong growth in depth products and pricing improvements continue to expand yields. CAGR 10.4% Millions Millions Private Private revenue up 19% on pcp to $51.1m Continued strong revenue growth from Tyresales B2C and Redbook Inspect. Private automotive ad volumes up double digit percentage in H2 and more pleasingly accompanied by lower time to sell which is a great message for consumers. Strong growth in lower priced inventory which has been well supported by free under $3k campaign. Total private inventory up 12% on pcp to around 86,000 cars as at 30 June Good growth in instant offer product which achieves an outcome for the consumer without being reflected in inventory count. CAGR 11.3% Good opportunities to come from investment in Promisepay along with other product development in Q4.
15 Domestic Revenue Performance by Category 15 Millions Display CAGR 10.8% Display revenue up 9% to $65.8m Continued improvement in revenue trend growth to 9% on pcp (FY15 3% on pcp). Refreshed new car showroom launched to provide new opportunities for display. Despite ongoing changes in OEM advertising policies we have continued to develop stronger relationships with OEMs across the board. Invested in analytics and insights to complement the evolution of the display product set. Millions Millions Data, Research & Services Data, Research and Services revenue up 9% to $35.8m Continued solid pcp revenue growth from Livemarket, driven by volume growth. Redbook business continues to expand reflecting increasing demand from OEM s for data services. CAGR 13.1%
16 Domestic Revenue Performance by Category 16 Finance and Related Services Revenue up 6% to $63.0m $A Millions Growth Year Ending 30 June 2016 FY15 FY16 $'s % Core Finance % Other products (6.6) (25%) Total Revenue % Cost of sales (6.9) (30%) Gross Profit % Operating Expenses (Before Interest and D&A) % EBITDA % Strong growth in core finance broking revenue up 31% on pcp. All About Finance acquisition integrated into core Stratton operations and performing well. Q4 soft as a result of a temporary volume capacity reduction at a major lender. Gross profit up 29% on pcp to $47.2m reflecting growth in core finance broking and reduction in volume of low margin other products. Core finance EBITDA margins continue to expand reflecting ongoing operational leverage. Ratesetter integration continues and showing encouraging signs for the future. Equity accounted losses of $1m reflecting early stage of the business. 10% stake in Promisepay acquired during the year with significant potential to provide complementary transaction settlement services to core customer base.
17 17 carsales International to 30 June 2016
 and SoloAutos (Mexico) acquisitions completed in the year.")
18 International Portfolio 18 International Key Highlights Strong double digit revenue growth rates across International. Business model progression continues in all of our businesses to support future growth. Chileautos (Chile) and SoloAutos (Mexico) acquisitions completed in the year. $A Millions Growth Year Ending 30 June 2016 FY15 FY16 $'s % Revenue % EBITDA (0.2) (13%) Adjusted NPAT (including associates) after NCI* % * Adjusted NPAT and earnings per share stated above is post non-controlling interests and excludes one-off gains on subsidiary disposal, gains on associate dilution and acquired intangible amortisation. See slide 30 regarding the disclosure of non-ifrs Information and slide 31 for a reconciliation of adjusted NPAT to Reported NPAT.
19 Asia Underlying Results 19 SKENCARSALES Financials (49.9% Owned - Equity Accounted by CAR) Pro-Forma (100%) 12 months to months to 30 June 2015 June 2016 PCP KRWb KRWb % Underlying Revenue* % Underlying EBITDA* 14.5** % Underlying EBITDA(%)* 58.2% 51.9% N/A Underlying Adjusted NPAT* % Underlying Cash Balance % carsales Share of Earnings Adjusted NPAT (Share of Associate Earnings)* Key Drivers AUDm AUDm % % 30 June June s 000 s % Inventory % Unique Visitors 3,568 5, % Strong Financial Results. Strong continued revenue growth across dealer, private and display advertising channels. Dealer growth a standout reflecting growth in premium listing products. Private growth reflects introduction of paid listings in April Underlying EBITDA margin performed consistently with H1 as the business continued to invest in personnel and technology in preparation for the introduction of a lead model. Continued investment in marketing in H2. RedBook Asia and New Zealand (100% owned / Consolidated by CAR) 12 months to 30 June months to 30 June 2016 AUDm AUDm % Reported Revenue % Reported EBITDA % PCP Solid performances across Asian countries, reflecting continued demand for data services, particularly in China. icar Asia Financials (20.2% Owned - Equity Accounted by CAR) Estimated Adjusted NPAT (Share of Associate Earnings excl. one-off acctg gains) 12 Months to Months to 30 June 2015 June 2016 PCP AUDm AUDm % (3.3) (2.4) 27% Retained 20.2% equity position *Revenue and EBITDA stated is 100% of the revenue and EBITDA for the business. The carsales share of earnings is based on owning the percentage set out above. Adjusted NPAT stated above excludes intangible amortisation. See slide 30 regarding the disclosure of non-ifrs Information and slide 31 for a reconciliation of adjusted NPAT to Reported NPAT. ** FY15 EBITDA represented to reclassify KRWb1.4 of non-operating income below EBITDA consistent with FY16 presentation. No net impact on Underlying or Reported NPAT.
20 Latin America Underlying Results 20 WebMotors Financials (30% owned - Equity Accounted by CAR) Pro-Forma (100%) 12 Months to 30 June Months to 30 June 2016 PCP BRLm BRLm % Underlying Revenue* % Underlying EBITDA* % Underlying EBITDA* (%) 27% 27% N/A Underlying NPAT* 29.5** % Underlying Cash Balance % WebMotors continuing solid growth Pleasing double digit growth in both dealer and private revenue segments across the year. Display remains challenging reflecting the subdued economic conditions and impacts on the new car market as a result a 25% reduction in new car market size in H2 on pcp. carsales Share of Earnings Adjusted NPAT* (Share of Associate Earnings) AUDm AUDm % (1.4%) Decline in desktop visitors on pcp reflects shift to mobile and more targeted marketing activities which resulted in significant reduction in low quality traffic. This, along with other operational improvements, has achieved 50%+ growth in dealer lead volumes on pcp. Key Drivers 30 June s 30 June s Inventory % Unique Visitors 9,811 8,396 (14.4%) % Trial of a leads based model for dealer from July 2016 has potential to be a good growth contributor over the coming year. Anticipate a good level of acceptance from dealers over transition to lead model. Margins remain steady, reflecting underlying leverage offset by investments to implement lead model. carsales adjusted NPAT impacted by adverse FX rates during the year otherwise share of earnings growth would be similar of WebMotors underlying earnings growth. *Revenue and EBITDA stated is 100% of the revenue and EBITDA for the business. The carsales share of earnings is based on owning the percentage set out above. Adjusted NPAT stated above excludes intangible amortisation. See slide 30 regarding the disclosure of non-ifrs Information and slide 31 for a reconciliation of adjusted NPAT to Reported NPAT. ** FY15 underlying NPAT has been represented to exclude acquired intangible amortisation consistent with the FY16 presentation.
 N/A Reported EBITDA (%) N/A N/A N/A Adjusted NPAT* N/A (6.5) N/A Reported Cash Balance N/A 43.3 N/A Key Drivers 30 June 2015 000 s 30 June 2016 000 s Inventory N/A 37.")
21 Latin America Underlying Results 21 SoloAutos Financials (65% owned Consolidated by CAR) Pro-Forma (100%) 2 Oct 2014 to 30 June Oct 2015 to 30 June 2016 PCP MXPm MXPm % Reported Revenue N/A 5.9 N/A Reported EBITDA N/A (7.5) N/A Reported EBITDA (%) N/A N/A N/A Adjusted NPAT* N/A (6.5) N/A Reported Cash Balance N/A 43.3 N/A Key Drivers 30 June s 30 June s Inventory N/A 37.4 N/A Unique Visitors % % SoloAutos Solid revenue performance since acquisition of Soloautos. Earnings impacted by one-time post acquisition costs to change the trading model and prepare for future growth. Pleasing growth in unique visitors and dealer numbers on pcp. Spanish language editorial site Autologica acquired in the period to support the development of the business. Integration of carsales IP and technology set to continue into FY17. Chileautos Financials (83% owned Consolidated by CAR) Pro-Forma (100%) 24 March to 30 June March to 30 June 2016 PCP CLPm CLPm % Reported Revenue N/A 358 N/A Reported EBITDA N/A 175 N/A Reported EBITDA (%) N/A 49% N/A Adjusted NPAT* N/A 165 N/A Reported Cash Balance N/A 281 N/A Key Drivers ChileAutos Pleasing performance since acquisition of Chileautos. Significant opportunity to grow revenue and earnings from implementation of carsales technology platform. 30 June s 30 June s Inventory N/A 63 N/A Unique Visitors 1,850 1,830 (1%) % Revenue and EBITDA stated is 100% of the revenue, EBITDA and NPAT for the business over the carsales ownership period. Soloautos acquired on 2 October 2015 and Chileautos acquired on 29 March * Adjusted NPAT stated above excludes intangible amortisation. See slide 30 regarding the disclosure of non-ifrs Information and slide 31 for a reconciliation of adjusted NPAT to Reported NPAT.
22 Outlook to 30 June
23 Performance Outlook 23 carsales Domestic Outlook Domestic core business performance in the first month of FY17 has remained solid. Domestic adjacencies continue to build scale and breadth with a number of promising opportunities. We continue to monitor our performance and market conditions. Assuming these are stable we anticipate FY17 revenue and EBITDA growth will remain solid. carsales International Outlook Assuming no further deterioration in market conditions we anticipate the trialling of the lead model into Brazil to be a good growth contributor to local currency revenue and earnings over the full year. Korea expected to see continued solid local currency revenue and earnings growth. Expect ongoing integration of core carsales IP and technology into Chilean and Mexican businesses to provide solid uplift in revenue and earnings in the coming year.
24 24 New Product Releases to 30 June 2016

25 Redbook Inspections 25


26 Motoring.com.au Refresh 26

27 New Car Showroom 27
28 Native Advertising 28
29 29 Appendix to 30 June 2016
30 Overview of carsales Non-IFRS Financial Information 30 What is IFRS and non-ifrs financial information? IFRS financial information is financial information that is presented in accordance with all relevant accounting standards. Non-IFRS financial information is financial information that is presented other than in accordance with all relevant accounting standards. For example: Revenue or Profit information calculated on a basis other than under accounting standard definitions or calculated with accounting standards and then adjusted eg; proforma, underlying or look through ; What non-ifrs financial information does carsales disclose in its half year and year end results presentations? carsales presents reported financial information for its business segments, associates and investments where applicable IFRS financial information exists. The financial information presented is sourced directly from financial information prepared in accordance with all relevant accounting standards and has been subject to either review or audit by carsales external auditors (PwC). In carsales investor presentations the company aims to provide equal or greater prominence to IFRS financial information. However, we also present or refer to non-ifrs financial information. Please note, all information labelled Reported in this presentation complies with IFRS. Non-IFRS financial information is calculated based on statutory IFRS financial information and adjusted to show either a position excluding significant items which have been removed OR presented based on carsales effective equity ownership interest of an entity s underlying revenue, EBITDA or NPAT. Any non-ifrs financial information is clearly labelled as underlying or look-through to differentiate it from reported/ifrs financial information. carsales provides reconciliations on the face of slides, appendices and in footnotes of presentations in order to allow the reader to clearly reconcile between the IFRS and non-ifrs financial information. Why does carsales disclose non-ifrs financial information in its half year and full year results presentations? Since March 2013 carsales has invested in businesses in Malaysia, Thailand, Indonesia, South Korea, Mexico and Brazil and has become a global portfolio of online automotive assets as such carsales management believes that the presentation of additional non-ifrs information in its half year and full year results presentations provides readers of these documents with a greater understanding into the way in which management analyses the business as well as meaningful insights into the financial conditions of carsales overall performance. The Australian Securities and Investment Commission ( ASIC ) acknowledges the relevance of non-ifrs financial information in providing meaningful insight as long as it does not mislead the reader.
31 Reconciliation of Reported to Adjusted NPAT 31 $A Millions Growth Year Ending 30 June 2016 FY15 FY16 $'s % Reported NPAT % Gain on disposal of business - (1.0) Gain on associate dilution (3.5) (1.0) NPAT before one-off gains % Acquired intangible amortisation Stratton Webmotors SK Encar Soloautos Total acquired intangible amortisation Adjusted NPAT before one-off gains and acquired intangible amortisation % Weighted Average Number of Shares 238,911, ,645,736 Adjusted Earnings per Share (cents) %
 multiplied by the % ownership (30% for WebMotors, 49.")

32 Look Through Revenue and EBITDA Performance 32 Look Through Revenue ($m) Look Through EBITDA ($m) Millions Millions CAGR 15.7% CAGR 14.1% NOTE: carsales Look Through methodology is: For equity accounted associates: Add the total revenue or EBITDA for the period of ownership within the reporting period (e.g. carsales investments in icar Asia, WebMotors and SK ENCARSALES were owned for the entire reporting period) multiplied by the % ownership (30% for WebMotors, 49.9% for SKENCARSALES and 20.2% for icar Asia over the period). For consolidated associates/subsidiaries, revenue and EBITDA attributable to associates has been eliminated (i.e. total revenue and EBITDA multiplied by carsales percentage ownership remains as the look through revenue and EBITDA). All numbers for icar Asia are carsales management estimates. Some Look Through numbers involve the disclosure of non IFRS information - Refer to carsales Look Through P&L Analysis slide and Disclosure of Non IFRS slide 30 for further details.
, Auto Inspect (owned 50.1% from 26 June 2015), Ratesetter (owned 15% from 12 March 2015) and Promisepay (owned 10.1% from 26 May 2016) are presented with Domestic Investments.")
33 carsales Look Through P&L Analysis 33 * Investments in Tyresales (owned 50% from 1 July 2013), Auto Exchange (owned 50% from 1 July 2013), Stratton Finance (owned 50.1% from 15th July 2014), Auto Inspect (owned 50.1% from 26 June 2015), Ratesetter (owned 15% from 12 March 2015) and Promisepay (owned 10.1% from 26 May 2016) are presented with Domestic Investments. NOTE: carsales Look Through methodology is: For equity accounted associates: Add the total revenue or EBITDA for the period of ownership within the reporting period (e.g. carsales investments in icar Asia, WebMotors and SK ENCARSALES were owned for the entire reporting period) multiplied by the % ownership (30% for WebMotors, 49.9% for SKENCARSALES and 20.2% for icar Asia over the period). For consolidated associates/subsidiaries, revenue and EBITDA attributable to associates has been eliminated (i.e. total revenue and EBITDA multiplied by carsales percentage ownership remains as the look through revenue and EBITDA). All numbers for icar Asia are carsales management estimates. Some Look Through numbers involve the disclosure of non IFRS information - Refer to carsales Look Through P&L Analysis slide and Disclosure of Non IFRS slide 30 for further details.


34
Organisational Structure
 Organisational Structure Performance Update Operational Overview Operational Performance Automotive dealer enquiry growth steady throughout the half, while overall automotive inventory was similar to the
For personal use only ANNUAL REPORT 2016
 ANNUAL REPORT CONTENTS VISION 01 What we do 02 History 04 FY16 Highlights 06 The carsales world 07 Our brands 08 FY16 Financial performance 10 Chair s report 12 Managing Director s update 14 Directors
For personal use only
 For personal use only Appendix 4E carsales.com Ltd ABN 91 074 444 018 Results for Announcement to the Market Full-year ended 30 June (Previous corresponding period: Full-year ended 30 June 2016) A Revenue
CARS.COM. Third Quarter 2017 Earnings November 8, 2017
 CARS.COM Third Quarter 2017 Earnings November 8, 2017 Forward Looking Statements This presentation contains forward looking statements within the meaning of the federal securities laws, including those
For personal use only
 Click to edit Master text styles IDP Education FY16 Results Presentation Twelve months to 30 June 2016 11 February 2016 Important notice and disclaimer Click Disclaimer to edit Master text styles The material
Financial results & business update. Quarter ended 30 September October 2016
 Financial results & business update Quarter ended 30 September 2016 19 October 2016 Disclaimer 3 Any remarks that we may make about future expectations, plans and prospects for the company constitute forward-looking
Investor & Analyst Presentation
 Investor & Analyst Presentation FY18 H1 Results For the six monthsended 31 December 2017 15 th February 2018 Rebekah O Flaherty-CEO I Jonathan Kenny-CFO Agenda 1 2 3 4 5 6 Overview Strategic Priorities
H1 16 interim results. 22 September 2015
 H1 16 interim results 22 September 2015 Important notice 2 This presentation may include certain forward-looking statements, beliefs or opinions, including statements with respect to the Company s business,
Shaver Shop Group Limited 1H FY18 RESULTS INVESTOR PRESENTATION. 23 February 2018
 Shaver Shop Group Limited 1H FY18 RESULTS INVESTOR PRESENTATION 23 February 2018 1 TABLE OF CONTENTS 01 Key business highlights 02 Financial results 03 Key growth drivers 04 Trading update& outlook 05
AUB GROUP LTD FULL YEAR RESULTS
 AUB GROUP LTD FULL YEAR RESULTS FOR THE PERIOD ENDED 30 JUNE 207 (FY7) 28 TH AUGUST 207 Page - AUB Group Ltd FY7 Results NOTICE SUMMARY INFORMATION This document has been prepared by AUB Group Limited
FY18 Results Presentation Bravura Solutions Limited. 28 August 2018
 FY18 Results Presentation Bravura Solutions Limited 28 August 2018 Important notice and disclaimer The information contained in this document (including this notice) and discussed at this presentation
AUB GROUP LTD HALF YEAR RESULTS
 AUB GROUP LTD HALF YEAR RESULTS FOR THE PERIOD ENDED 31 DECEMBER 2017 (1H18) 26 FEBRUARY 2018 Page 1 - AUB Group Ltd 1H18 Results NOTICE SUMMARY INFORMATION This document has been prepared by AUB Group
For personal use only. FY17 H1 Results. John Croll - Chief Executive Officer Nimesh Shah - Chief Financial Officer 22 February 2017
 FY17 H1 Results John Croll - Chief Executive Officer Nimesh Shah - Chief Financial Officer 22 February 2017 Agenda Overview of FY17 H1 Results and Business Performance Strategy Update FY17 H1 Financial
For personal use only. FY2017 Results Presentation
 FY2017 Results Presentation Disclaimer The material in this presentation has been prepared by Bapcor Limited ( Bapcor ) ABN 80 153 199 912 and is general background information about Bapcor s activities
Sigma Pharmaceuticals Limited
 Investor Relations Contact: Gary Woodford Corporate Affairs Manager Gary.Woodford@signet.com.au Phone: 03 9215 9632 Mobile: 0417 399 204 Mark Hooper CEO and Managing Director Gary Woodford Corporate Affairs
2017 FULL YEAR RESULTS
 2017 FULL YEAR RESULTS ESTABLISHING LEADING POSITIONS IN NEW GROWTH SECTORS Malcolm Bundey Managing Director and CEO Richard Betts Chief Financial Officer 16 August 2017 Pact Group Holdings Ltd ABN: 55
FY2018 Results Presentation
 FY2018 Results Presentation Disclaimer The material in this presentation has been prepared by Bapcor Limited ( Bapcor ) ABN 80 153 199 912 and is general background information about Bapcor s activities
FY17 Results. IDP Education FY17 Results Presentation
 FY17 Results IDP Education FY17 Results Presentation 22 August 2017 Important Notice and Disclaimer Disclaimer Non-IFRS Financial Information The material in this presentation has been prepared by IDP
Carsales.com. Motoring along nicely A$10.23 AUSTRALIA. Event. Impact. Earnings and target price revision. Price catalyst. Action and recommendation
 AUSTRALIA CRZ AU Price (at 9:48, 18 Feb 15 GMT) Outperform A$1.23 Valuation A$ 12.59 - DCF (WACC 8.1%, beta 1.2, ERP 5., RFR 3.8%, TGR 3.) 12-month target A$ 12.3 12-month TSR % +24.1 Volatility Index
Glanbia plc 2017 Half Year Results Presentation
 Glanbia plc 2017 Half Year Results Presentation 10 August 2017 Siobhan Talbot Group Managing Director Mark Garvey Group Finance Director Cautionary Statement Half Year 2017 Performance Summary Adjusted
Full Year 2017 Results Presentation Bravura Solutions Limited
 Full Year 2017 Results Presentation Bravura Solutions Limited 23 rd August 2017 Important notice and disclaimer The information contained in this document (including this notice) or discussed at this presentation
For personal use only
 MMS Group 18 October 2016 Presenters Mike Salisbury, CEO Mark Blackburn, CFO McMillanShakespeareGroup Overview Record FY16 profit result with strong free cash flow Segment revenue of $503.2m, +29.9% EBITDA
For personal use only. F Y R e s u l t s P r e s e n t a t i o n
 F Y 2 0 1 6 R e s u l t s P r e s e n t a t i o n Our Brands 2 Disclaimer The material in this presentation has been prepared by Bapcor Limited ( Bapcor ) ABN 80 153 199 912 and is general background information
INDEPTH RESEARCH NOTE REA Group Ltd Neutral
 1 INDEPTH RESEARCH NOTE REA Group Ltd Neutral Price: A$72.97 Price Target: A$74.80 ASX: REA 12 February 2018 REA s first half FY18 (1H18) result was underpinned by strong growth in the Australian business
ABN Half Year Report - 31 December 2011
 ABN 91-074-444-018 Half Year Report - 31 December 2011 ABN 91 074 444 018 ASX Half-year information - 31 December 2011 Lodged with the ASX under Listing Rule 4.2A. This information should be read in conjunction
OneVue Holdings Limited (OVH)
") OneVue Holdings Limited (OVH) H1 FY 2018 results presentation 26 February 2018 1 HIGHLIGHTS 2 FINANCIALS 3 OUTLOOK 4 APPENDICES Page 2 1 HIGHLIGHTS . BENEFITTING FROM SECTORAL GROWTH AND STRUCTURAL DISRUPTION
OneVue Holdings Limited (OVH) H1 FY 2018 results presentation 26 February 2018 1 HIGHLIGHTS 2 FINANCIALS 3 OUTLOOK 4 APPENDICES Page 2 1 HIGHLIGHTS . BENEFITTING FROM SECTORAL GROWTH AND STRUCTURAL DISRUPTION
For personal use only
 Full Year 2017 Results Presentation February 2018 A leading player in the global online classifieds industry FY2017 was another year of strong profitable growth for Mitula Revenue +20% A$33.6m Visits 807m
QANTM. Full Year Results Presentation. Leon Allen, Managing Director and CEO Martin Cleaver, Chief Financial Officer. 12 months to 30 June 2018
 Full Year Results Presentation 12 months to 30 June 2018 QANTM 29 AUGUST 2018 Leon Allen, Managing Director and CEO Martin Cleaver, Chief Financial Officer Structure 1. 2018 Summary Features 2. Market
TI Fluid Systems plc Results Presentation for TI Fluid Systems plc 20 March 2018
 2017 Results Presentation for 20 March 2018 Disclaimer This presentation contains certain forward-looking statements with respect to the financial condition, results of operations and business of (the
Half year results 31 December Jon Macdonald Caroline Rawlinson
 Half year results 31 December 2016 Jon Macdonald Caroline Rawlinson CEO CFO Overview H1 YoY Revenue $115m +9% Expenses $40m +5% EBITDA 1 $74m +12% EBIT 1 $64m +12% Operating NPAT 1 $45m +16% Dividend 8.5cps
1H 19 Investor Presentation February 2019
 1H 19 Investor Presentation February 2019 1 About Raiz Raiz (formerly Acorns) is a mobile first micro-investing platform via mobile phone or web app, which allows customers to invest in a portfolio of
Siemens Gamesa Renewable Energy Q Results
 Siemens Gamesa Renewable Energy Q2 208 Results 04 May 208 Disclaimer This material has been prepared by Siemens Gamesa Renewable Energy, and is disclosed solely for information purposes. This document
FY2017 Full Year Results August 2017
 FY2017 Full Year Results August 2017 Repositioning Automotive in a challenging market Market conditions in FY2017 Lower margins in finance Weak WA market conditions but growth in market share Tighter consumer
AUSTRALIAN PHARMACEUTICAL INDUSTRIES LIMITED HALF YEAR FY14 RESULTS PRESENTATION WEDNESDAY 30 APRIL 2014
 AUSTRALIAN PHARMACEUTICAL INDUSTRIES LIMITED HALF YEAR FY14 RESULTS PRESENTATION WEDNESDAY 30 APRIL 2014 Important Notice The material in this presentation is of general information about API s activities
Australia and New Zealand Banking Group Limited
 Australia and New Zealand Banking Group Limited ABN 11 005 357 522 31 March 2017 Consolidated Financial Report Dividend Announcement and Appendix 4D The Consolidated Financial Report and Dividend Announcement
SOUTHERN CROSS AUSTEREO FY17 INVESTOR PRESENTATION. 24 August 2017
 SOUTHERN CROSS AUSTEREO FY17 INVESTOR PRESENTATION 24 August 2017 1 Disclaimer Summary information The material in this presentation has been prepared by Southern Cross Media Group Limited ABN 91 116 024
For personal use only
 FY16 RESULTS BRIEFING H U G H M A R K S C H I E F E X E C U T I V E O F F I C E R G R E G B A R N E S C H I E F F I N A N C I A L O F F I C E R M I C H A E L S T E P H E N S O N C H I E F S A L E S O F
FY 2018 Full Year Results Investor Presentation. 27 th August 2018
 FY 2018 Full Year Results Investor Presentation 27 th August 2018 Corporate Overview Cash Converters is a leading international operator and franchisor in personal financial services and second hand goods
CY2017 RESULTS PRESENTATION 19 FEBRUARY 2018
 CY2017 RESULTS PRESENTATION 19 FEBRUARY 2018 HIGHLIGHTS REVENUE GROWING FASTER THAN MARKET WITH MARGIN EXPANSION REVENUE UNDERLYING 1 NPATA 2 13.1% 13.1% 22.5% 22.5% Revenue $380.3m 13.1% NPAT 2 $33.1m
Xenith IP Group Limited
 Xenith IP Group Limited Results Financial Year to 30 June 2017 29 August 2017 Craig Dower Stuart Smith Lesley Kennedy CEO and Managing Director Executive Director and Head of Corporate Development CFO
Cover-More Group. UBS Australasia Conference. November 2015
 Cover-More Group UBS Australasia Conference November 2015 Executive summary: FY15 overview Cover-More delivered another year of double digit earnings growth, with offshore business growing substantially.
Financial results & business update. Quarter and year ended 31 December February 2017
 Financial results & business update Quarter and year ended 31 December 2016 14 February 2017 Disclaimer 3 Any remarks that we may make about future expectations, plans and prospects for the company constitute
Amadeus FY 2014 Results
 Amadeus FY 2014 Results February 27, 2015 Disclaimer This presentation may contain certain statements which are not purely historical facts, including statements about anticipated or expected future revenue
Investor & Analyst Presentation Ful YearResults 30 June2016 For personal use only 25th August 2016 Rebekah O Flaherty - CEO I Jonathan Kenny - CFO
 Investor & Analyst Presentation Full YearResults 30 June2016 25th August 2016 Rebekah O Flaherty - CEO I Jonathan Kenny - CFO Agenda 1 Overview 2 Strategic Priorities 3 FY16 Financial Results 4 FY17 Outlook
Cars.com. Second Quarter 2018 Earnings. August 8, 2018
 Cars.com Second Quarter 2018 Earnings August 8, 2018 Forward-Looking Statements This presentation contains forward-looking statements within the meaning of the federal securities laws. All statements other
Amadeus H Results
 Amadeus H1 2014 Results August 1, 2014 Disclaimer This presentation may contain certain statements which are not purely historical facts, including statements about anticipated or expected future revenue
2018 FOURTH QUARTER EARNINGS CALL
 NORTH AMERICA S LEADING BUILDING MATERIALS DISTRIBUTOR RESIDENTIAL COMMERCIAL INTERIOR SOLAR 2018 FOURTH QUARTER EARNINGS CALL Forward Looking Statements / Non-GAAP Measures This presentation contains
FY18 - Half Year Investor Presentation 22 February 2018
 Who are we? FY18 - Half Year Investor Presentation 22 February 2018 Jonathan Rubinsztein CEO Richard Leon CFO Disclaimer Forward looking statements: All statements other than statements of historical fact
ASG GROUP DELIVERS SOLID GROWTH ACROSS ALL KEY FINANCIAL INDICATORS
 ASG GROUP LIMITED ASX ANNOUNCEMENT: H1 RESULTS RELEASE DATE: 28 TH FEBRUARY 2012 ASG GROUP DELIVERS SOLID GROWTH ACROSS ALL KEY FINANCIAL INDICATORS Financial Highlights: Revenue of $76.04 million, an
Myer First Half 2018 Results. Continued strong growth in the online business Renewed focus on product, price and customer service
 21 March 2018 Myer First Half 2018 Results Continued strong growth in the online business Renewed focus on product, price and customer service Myer Holdings Limited (MYR) today announced its financial
For personal use only
 FY14 RESULTS John Croll Chief Executive Officer Nimesh Shah Chief Financial Officer AGENDA OVERVIEW OF FY14 RESULT FINANCIAL PERFORMANCE FY15 OUTLOOK GROWTH STRATEGY Q&A JOHN CROLL NIMESH SHAH JOHN CROLL
OneVue Holdings Limited (OVH)
") OneVue Holdings Limited (OVH) Morgan Stanley Emerging Companies Conference Thursday 7 June 2018 A FINTECH COMPANY THAT PARTNERS TO DISRUPT ALONG THE SUPERANNUATION VALUE CHAIN Market leading businesses,
OneVue Holdings Limited (OVH) Morgan Stanley Emerging Companies Conference Thursday 7 June 2018 A FINTECH COMPANY THAT PARTNERS TO DISRUPT ALONG THE SUPERANNUATION VALUE CHAIN Market leading businesses,
For personal use only
 Mantra Group H1FY2015 Results Presentation 26 February 2015 Important notice and disclaimer Important notice and disclaimer This document is a presentation of general background information about the activities
FY16 YEAR END RESULTS 5 APRIL 2016
 FY16 YEAR END RESULTS 5 APRIL 2016 DEFINITIONS AND IMPORTANT NOTICE The following definitions apply throughout Trading EBITDA (earnings before interest, tax, depreciation and amortisation): excludes exceptional
FY 2018 results presentation
 FY 2018 results presentation EMERGING FINANCIAL SERVICES COMPANY STRONGLY LEVERAGED TO SUPERANNUATION SECTOR, DELIVERS RECORD GROWTH OneVue Holdings Limited (OVH) 27 August 2018 1 HIGHLIGHTS Market leading
For personal use only
 FY16 Full Year Results 23 August 2016 Matt Muscio Chief Executive Officer Dean Taylor Chief Financial Officer Kristine James General Manager Corporate Development Agenda 1. Highlights 2. Financial Performance
Vita Group (VTG)! Results Presentation!
! Results Presentation!") Vita Group (VTG) Results Presentation First half FY14 Group highlights Sustained trend of strong profit, dividend growth Underlying EBITDA 1 +18%, underlying NPAT 2 +56%, dividend +66% Areas of strategic
Vita Group (VTG) Results Presentation First half FY14 Group highlights Sustained trend of strong profit, dividend growth Underlying EBITDA 1 +18%, underlying NPAT 2 +56%, dividend +66% Areas of strategic
Dreamscape Networks Limited (ASX: DN8) Maiden Full Year Results Presentation Year Ended 30 June 2017
 Maiden Full Year Results Presentation Year Ended 30 June 2017") Dreamscape Networks Limited (ASX: DN8) Maiden Full Year Results Presentation Year Ended 30 June 2017 1 Our Vision Providing simple, innovative and affordable Online Solutions that change lives 2 A Year
Dreamscape Networks Limited (ASX: DN8) Maiden Full Year Results Presentation Year Ended 30 June 2017 1 Our Vision Providing simple, innovative and affordable Online Solutions that change lives 2 A Year
Investor Presentation
 NZX Code: ATM ASX Code: A2M 3 May 2017 NZX/ASX Market Release Investor Presentation Please find attached a presentation to be given today by The a2 Milk Company Limited at Macquarie s annual Australia
Updates to External Reporting. Investor and Analyst Briefing: December 2018
 Updates to External Reporting Investor and Analyst Briefing: December 2018 Summary As outlined at Spark s results announcement the presentation of Spark s financial results will change from FY19 onwards
1H18 Results Presentation Sid Takla Interim Chief Executive Officer Lyndal York Chief Financial Officer
 1H18 Results Presentation Sid Takla Interim Chief Executive Officer Lyndal York Chief Financial Officer 21 August 2018 Important Notice and Disclaimer This presentation has been prepared by Asaleo Care
FY2017 Result Presentation. 21 August 2017
 FY2017 Result Presentation 21 August 2017 The Hansen journey growing and diversifying by geography, industry, propriety products and customer Early 1990 s Today Revenue by geography Industry verticals
A S X A N N O U N C E M E N T
 A S X A N N O U N C E M E N T DATE: 24 February 2016 Attached is the Presentation regarding Pact s Half year Financial Results for the half year ended 31 December 2015. The Presentation will occur at 10am
FY 2017 Third Quarter Earnings Call
 FY 2017 Third Quarter Earnings Call July 27, 2017 Improving the experience of a world in motion Forward Looking Statement Adient has made statements in this document that are forward-looking and, therefore,
2Q 2017 Highlights and Operating Results
 2Q 2017 Highlights and Operating Results July 25, 2017 1 2Q 2017 Highlights and Operating Results Table of Contents Page(s) 1 Sales Overview and Highlights 4-5 2 NSS Overview 6-7 3 EES Overview 8-9 4 UPS
Hill-Rom Fourth Quarter 2016 Financial Results. November 3, 2016
 Hill-Rom Fourth Quarter 2016 Financial Results November 3, 2016 Forward Looking Statements Certain statements in this presentation contain forward-looking statements, within the meaning of the Private
ITW Conference Call Fourth Quarter 2012
 ITW Conference Call Fourth Quarter 2012 January 29, 2013 SOLID GROWTH. STRONG RETURNS. BEST-IN-CLASS OPERATOR. 100 YEARS STRONG Safe Harbor Statement Forward-Looking Statements This conference call contains
Tabcorp Holdings Limited. 2014/15 Full Year Results Presentation 13 August 2015
 Tabcorp Holdings Limited ABN 66 063 780 709 2014/15 Full Year Results Presentation 13 August 2015 Draft version 15 (01-08-13) FY15 overview Statutory NPAT $334.5m, up 157.5%, comprising of: NPAT from continuing
FY 2018 FIRST QUARTER EARNINGS. Adient s Q1 results impacted by headwinds in Seat Structures & Mechanisms (SS&M) business $4,204M $102M
 business $4,204M $102M") FY 2018 FIRST QUARTER EARNINGS Adient s Q1 results impacted by headwinds in Seat Structures & Mechanisms (SS&M) business > > Q1 GAAP net income and EPS diluted of $(216)M and $(2.32), respectively; Q1
FY 2018 FIRST QUARTER EARNINGS Adient s Q1 results impacted by headwinds in Seat Structures & Mechanisms (SS&M) business > > Q1 GAAP net income and EPS diluted of $(216)M and $(2.32), respectively; Q1
Class Limited. FY17 Results Presentation. Kevin Bungard, CEO 15 August 2017
 Class Limited FY17 Results Presentation Kevin Bungard, CEO 15 August 2017 Important information This presentation is provided for information purposes only. The information in this presentation is in a
SAMSONITE INTERNATIONAL S.A.
 Hong Kong Exchanges and Clearing Limited and The Stock Exchange of Hong Kong Limited take no responsibility for the contents of this announcement, make no representation as to its accuracy or completeness
PRESENTATION. FY14 Half Year Results. Donald McGurk Managing Director and CEO. Michael Barton Chief Financial Officer
 INVESTOR PRESENTATION FY14 Half Year Results Donald McGurk Managing Director and CEO Michael Barton Chief Financial Officer 3 March 2014 Important Notice and Disclaimer Disclaimer This presentation has
For personal use only. Appen Limited. Global Leader in Language Technology Solutions. FY2014 Results Presentation
 Appen Limited Global Leader in Language Technology Solutions FY2014 Results Presentation Agenda Topic: Introduction to Appen Financial Performance Growth and Outlook People and Leadership Speaker: Chris
Financial results & business update. Quarter and year ended 31 December February 2016
 Financial results & business update Quarter and year ended 31 December 2015 11 February 2016 Disclaimer 3 Any remarks that we may make about future expectations, plans and prospects for the company constitute
Business Update. USPP Conference Miami. Luis Damasceno Group CFO Michael Williams Group Finance Director & Treasurer January 2019
 Business Update USPP Conference Miami Luis Damasceno Group CFO Michael Williams Group Finance Director & Treasurer 23-25 January 2019 www.alsglobal.com IMPORTANT NOTICE AND DISCLAIMER This presentation
 ASX ANNOUNCEMENT DATE: 22 February 2017 Attached is the Presentation regarding Pact s Half year Financial Results for the half year ended 31 December 2016. The Presentation will occur at 10am (Melbourne
Tabcorp Holdings Limited 2015/16
 Tabcorp Holdings Limited ABN 66 063 780 709 2015/16 Full Year Results Presentation 4 August 2016 Draft version 15 (01-08-13) FY16 overview Statutory results NPAT $169.7m, down 49.3% EPS 20.4 cents per
For personal use only
 Half Year Investor Presentation 29 August 2016 COMPANY OVERVIEW Who are we? icar Asia Limited (ASX:ICQ) owns and operates ASEAN s No. 1 network of automotive portals with clear leadership positions established
DATATEC GROUP AUDITED PROVISIONAL RESULTS FOR THE YEAR ENDED 28 FEBRUARY 2018
 Technology Distribution Integration & Managed Services Consulting & Research AUDITED PROVISIONAL RESULTS FOR THE YEAR ENDED 28 FEBRUARY 2018 AGENDA Results summary, overview & strategic update Jens Montanana,
NOT FINANCIAL PRODUCT ADVICE
 1 SUMMARY INFORMATION This presentation contains summary information about Fairfax Media Limited and its activities current as at 21 February 2018. The information in this presentation is of a general
FY18 Results Presentation. August 2018
 FY18 Results Presentation August 2018 1 Disclaimer 2 Summary information This presentation contains summary information about Managed Accounts Holdings Limited (Company) (ASX: MGP) and its activities as
Investor Presentation
 Investor Presentation (NASDAQ: TRIP) Q2 2013 Safe Harbor Statement Forward-Looking Statements. Our presentation today, including the slides contained herein, contains "forward-looking statements" within
Investor Presentation
 Investor Presentation (NASDAQ: TRIP) Q4 2012 Safe Harbor Statement Forward-Looking Statements. Our presentation today, including the slides contained herein, contains "forward-looking statements" within
Acquisition of Dealer Inspire and Launch Digital Marketing
 Acquisition of Dealer Inspire and Launch Digital Marketing Investor Presentation February 14, 2018 Forward Looking Statements This presentation contains forward looking statements within the meaning of
ANNUAL GENERAL MEETING
 ANNUAL GENERAL MEETING CEO Presentation 29 TH October 2018 Disclaimer The material in this presentation has been prepared by Bapcor Limited ( Bapcor ) ABN 80 153 199 912 and is general background information
For personal use only
 FULL YEAR INVESTOR PRESENTATION March 2017 EXECUTIVE SUMMARY New Car Advertising Spend A$2.3B Non-Digital icar Asia s markets offer a huge opportunity for growth New Car Digital Spend A$350m Used Car Dealer
Assurant and The Warranty Group: Creating a Leading Global Lifestyle Provider
 Assurant and The Warranty Group: Creating a Leading Global Lifestyle Provider 1 Safe Harbor Statement Some of the statements included in this presentation, particularly those with respect to the proposed
Q Earnings Presentation August 2, 2018
 Q2 2018 Earnings Presentation August 2, 2018 Safe Harbor Statement Safe Harbor Statement under the Private Securities Act of 1995: Statements in this news release that are forward-looking statements are
Autohome Inc. Announces Unaudited Second Quarter Ended June 30, 2017 Financial Results
 Autohome Inc. Announces Unaudited Second Quarter Ended June 30, 2017 Financial Results August 9, 2017 5:33 AM ET Net Revenues Increased 13.3% Year-over-Year to RMB1.6 Billion Net Income Attributable to
For personal use only Y E A R R E S U L T S FY17
 H A L F Y E A R R E S U L T S FY17 I M P O R T A N T N O T I C E & D I S C L A I M E R This presentation has been prepared by Specialty Fashion Group Limited (the Company ). It contains general background
Amadeus Jan - June 2015 Results
 Amadeus Jan - June 2015 Results July 31, 2015 Disclaimer This presentation may contain certain statements which are not purely historical facts, including statements about anticipated or expected future
1Q 2018 Highlights and Operating Results
 1Q 2018 Highlights and Operating Results April 26, 2018 1 Table of Contents Page(s) 4 Announced Agreements to Acquire Australia and New Zealand Security Businesses 5-9 Sales Overview 10-17 Financial Performance
For personal use only
 Quarterly Business Review Q2 FY19 Strong December Quarter revenue growth. Jayride has now achieved 22 consecutive quarters of revenue growth. Quarter Highlights Over 20 new countries launched, Over 170
Beginning to realize improvement in freight and warehouse costs
 This presentation contains certain forward-looking statements within the meaning of the Private Securities Litigation Reform Act of 1995, such as statements regarding the Company s expected financial performance,
Half-Year 2017 Results. 20 February 2017
 Half-Year 2017 Results 20 February 2017 Overview & Results Highlights Tom Gorman Key messages Sales revenue growth of 5% at constant currency, reflecting growth in every operating segment despite some
QANTM. Full Year Results Presentation. Leon Allen, Managing Director and CEO Martin Cleaver, Chief Financial Officer. 12 months to 30 June 2017
 Full Year Results Presentation 12 months to 30 June 2017 QANTM 30 AUGUST 2017 Leon Allen, Managing Director and CEO Martin Cleaver, Chief Financial Officer Disclaimer This presentation has been prepared
2017 AGM Presentation Amendment
 ASX Announcement 2017 AGM Presentation Amendment MELBOURNE, Australia, 8 November 2017 Aconex Limited (ASX: ACX), provider of the #1 global platform connecting teams on construction and engineering projects,
For personal use only
 23 August 2013 Full Year Results June 2013 We attach an Investor Presentation for the FY13 Full Year Results. As previously announced, a results briefing for analysts will be held at 10:30am Sydney time
FY 2019 FIRST QUARTER EARNINGS. Adient reports first quarter 2019 financial results
 FY 2019 FIRST QUARTER EARNINGS Adient reports first quarter 2019 financial results > > Q1 GAAP net loss and EPS diluted of $(17)M and $(0.18) respectively; Q1 Adjusted-EPS diluted of $0.31 > > Adjusted-EBIT
For personal use only GTN Limited Results for the 12 months ending 30 June 2016
 GTN Limited Results for the 12 months ending 30 June 2016 Highlights: Revenue $166.1 million, +8% on FY 2015 (+1% on Prospectus Forecast of $164.1 million) Statutory NPAT ($17.2) million (exceeds FY 2015