EBRO PULEVA. 9M06 & Outlook Approaching 3Bn
|
|
|
- Leona Mason
- 5 years ago
- Views:
Transcription
1 EBRO PULEVA 9M06 & Outlook 2006 Approaching 3Bn


2 I Introduction CONTENTS II Business Units: 9M06 results and year-end outlook 01 Sugar 02 Rice 03 Dairy 04 Pasta III Ebro Puleva 9M06 consolidated results and year-end outlook 01 Profit and Loss Account 02 Evolution of Debt IV Conclusion V Annex I Highlights in IAS format VI Annex II Sales by Regions VII Corporate Calendar 2006 VIII Disclaimer

3 Introduction


4 INTRODUCTION Ebro Puleva: Approaching 3Bn! Our Market Cap and Turnover are Fast Approaching EUR 3Bn. The most significanteventssince our last presentation of resultsare: - - Conclusion of the sale of our businesses in Central America. The announcement and confirmation of the acquisition of Minute Rice, which has now been paid. It will be consolidated as from 1 November. And the most important business highlights in the period were: Outstanding performance of our brands, strengthening our positions in the markets on which we are already established. The good start made on new markets, in both rice and pasta (Poland, Libya, Hungary, Czech Republic, etc.). Excellent cash generation, which has enabled us to buy NWP (USD 363m) and still reduce our debt. We are, however, somewhat hampered by the strong inflation of our raw materials (energy, rice, wheat and, more recently, milk). INTRODUCTION 9M06


5 Business Units: 9M06 Results and Year-End Outlook 01 Sugar 02 Rice 03 Dairy 04 Pasta

6 01 SUGAR


7 01 SUGAR 9M06 Intervention Quotas The new CMO Sugar came into force on July 1st. The European Commission had already reduced the quota by 2.5 million tonnes before the campaign got underway. As a result of this measure and the heavy declassification made in the 05/06 campaign, there is a smaller quantity of sugar in circulation this year, which has in turn, after many months, restored the balance on the sugar market, enabling prices to recover. It has also been possible during 2006 to sell sugar to intervention and C sugar at higher prices than those estimated in February. SALES EBITDA 553, , ,777 84,078 70, ,851 9M2004 9M2005 9M2006 9M2004 9M2005 9M2006 BUSINESS AREAS SUGAR 9M06

8 01 SUGAR 9M06 The dawn of the Reform In these circumstances, turnover grew by 10.3%. The division Ebitda, at EUR 71Mio., has achieved in just 9 months the estimate for the full year made in our presentation First Reading of the CMO Sugar Reform in February. It is, nevertheless, down 15.6% year on year. Among other aspects, Royal Decree 890/2006, published in July, set a 15% ceiling on restructuring aid for the agricultural sugar sector. The compensation awarded to us for giving up the quota of the Ciudad Real factory is 86% (86% x 730EUR x 22000tn=EUR 13.8m.) The 9M06 results include EUR 25Mio. restructuring expenses deriving from the new CMO. Thous EUR 9M2004 9M2005 9M /05 CAG 06/04 Sales 553, , , % -1.8% Ebitda 105,777 84,078 70, % -18.1% Ebitda Margin 19.1% 17.4% 13.3% -23.5% -16.6% Ebit 88,603 67,053 50, % -24.3% Operating Profit 80,170 67,900 25, % -43.2% ROCE BUSINESS AREAS SUGAR 9M06


9 01 SUGAR Outlook More Balanced European Sugar Market The WTO negotiations were interrupted in July this year and are not likely to be resumed for some time. Meanwhile, current EU import tariffs and export refunds will be maintained. A further 1.5 million tonnes of quota have been assigned to the restructuring fund for the 06/07 sugar campaign. With a view to securing greater balance on the European sugar market, this situation is expected to be maintained for the remaining 3 months of the year. SALES EBITDA 734, , , , ,505 99, E E2006 BUSINESS AREAS SUGAR Out look

10 01 SUGAR Outlook A Better Price and a More Adjusted Market We met last February 24th to inform on the measures approved by the European Commission in the CMO Sugar Reform. In the model we used, we established a conservative selling price for sugar. During 2006 the production cutbacks imposed by the European authorities have clearly worked and we have been able to sell sugar at a better price than we had expected. In this context, we expect the division to end the year with sales up 7.7% to approx. EUR 703Mio. and an Ebitda of around EUR 100Mio. The estimated year-end Profit and Loss Account includes the appropriate amounts for disposal of assets, compensations and other expenses and provisions corresponding to the restructuring we are currently immersed in, which will this year tot up to around EUR 30Mio. Thous EUR E2006 E06/05 CAG E06/04 Sales 734, , , % -2.2% Ebitda 152, ,505 99, % -19.1% Ebitda Margin 20.7% 18.3% 14.2% -22.5% -17.3% Ebit 118,205 86,273 66, % -24.7% Operating Profit 72,126 83,733 36, % -29.2% ROCE BUSINESS AREAS SUGAR Out look

11 02 RICE


12 02 RICE 9M06 Volatile Raw Material Price These results do not yet include the contribution of Minute Rice, which will be consolidated from November on. The division results reflect the squeeze on industrial margins suffered in the rice market during the 05/06 campaign, due largely to the continuous price rises in the raw material and the soaring energy costs. We met recently to weigh up the strategic measures. We are now beginning a new phase, the most visible aspect of which will be the extensive industrial restructuring, although the most important aspect will be the implementation of a new development model. SALES EBITDA 394, , ,324 38,673 53,544 45,584 9M2004 9M2005 9M2006 9M2004 9M2005 9M2006 BUSINESS AREAS RICE 9M06

13 02 RICE 9M06 New Products and Increased Advertising In this context, division sales slipped by 1% to EUR 506Mio. Ebitda fell 15%, mainly due to the squeeze on industrial margins. It is important here to stress the increased expenditure on advertising, amounting to EUR 17Mio. in the first nine months of the year, and the extraordinary cost of launching the microwave products on the US market, some EUR 3.6Mio. The cost of restructuring and closing factories in the USA, totaling EUR 4Mio., has also affected other margins Thous EUR 9M2004 9M2005 9M /05 CAG 06/04 Sales 394, , , % 13.2% Ebitda 38,673 53,544 45, % 8.6% Ebitda Margin 9.8% 10.5% 9.0% -14.0% -4.1% Ebit 30,559 39,536 30, % 0.3% Operating Profit 30,618 37,724 24, % -10.7% ROCE n.a. 1 In pursuance of the IAS, these figures do not include the contribution of Central American businesses in 2006 or in the other years. BUSINESS AREAS RICE 9M06

14 02 RICE Outlook Inflationist Rice Since the closing of prices for the 05/06 harvest, rice prices have continued to rise throughout 2006, putting a squeeze on the industrial margin. The brand business has achieved strong growth as the increased investment in advertising throughout the year has borne fruit. This evolution is consistent with our strategy of tilting the scales in favour of the brand market. The provisional year-end estimate includes a 2-month contribution from Minute Rice. We include our best estimate to date because it has not yet been incorporated within the group. 574,856 SALES 688, ,962 61,291 EBITDA 68,820 70, E E2006 BUSINESS AREAS RICE Out look

15 02 RICE Outlook Bolstering Brands with Advertising and Innovation With the new harvest (Oct 2006) and the new measures introduced as part of the new development model, the margins recorded in the past two years should be changed. Strong growth is expected in Europe in the fourth quarter. The sales estimates for the full year will include two months of Minute Rice, which we expect to contribute some EUR 12Mio., bringing the division s sales to EUR 709Mio.. An Ebitda of EUR 3.7Mio. is estimated for Minute, taking the division Ebitda to EUR 70.5Mio Thous EUR E2006 E06/05 CAG E06/04 Sales 574, , , % 11.1% Ebitda 61,291 68,820 70, % 7.4% Ebitda Margin 10.7% 10.0% 10.0% -0.3% -3.3% Ebit 47,624 49,147 50, % 2.9% Operating Profit 47,086 46,932 40, % -6.8% ROCE n.a. 1 In pursuance of the IAS, these figures do not include the contribution of Central American businesses in 2006 or in the other years. BUSINESS AREAS RICE Out look
16 03 DAIRY
, which achieved a cumulative growth over the first 9 months of 57%,")


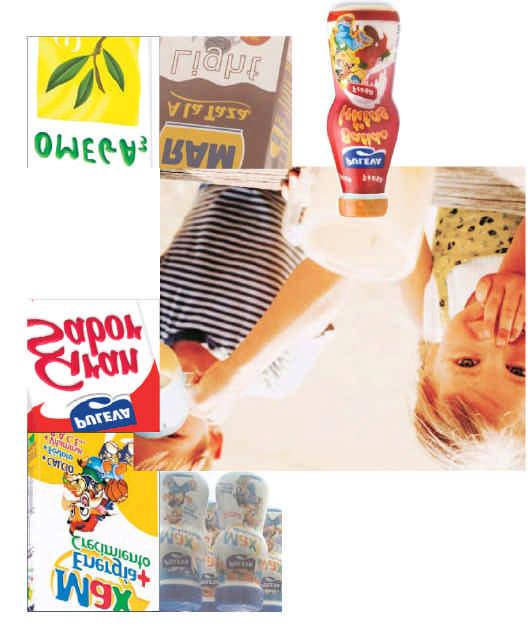
17 03 DAIRY 9M06 New sprinter: Puleva Max The premium brand Puleva is not affected and has turned a profit on its latest launchings (Puleva Max), which achieved a cumulative growth over the first 9 months of 57%, following on from the high-cal (Calcio) and Omega3 lines. Children s nutrition productshave been very successfully launched. The rises in energy costs first and raw materials more recently have somewhat dampened the excellent progress of the new launchings and the restructurings made in the division. SALES EBITDA 389, ,411 34,747 40,881 41, ,702 9M2004 9M2005 9M2006 9M2004 9M2005 9M2006 BUSINESS AREAS DAIRY 9M06

18 03 DAIRY 9M06 One Less Brand. Smaller but More Profitable Sales The 3% drop in sales can essentially be put down to the sale of Leyma brand in August The division has achieved an Ebitda of EUR 42m, boosted by the excellent performance of new products for young people and follow-on milks, but checked by the hike in energy costs and, more recently, by the increased cost of the raw material, heightened this summer by the severe drought in Spain. The division has achieved an Ebitda to Sales ratio of 11%, while raising its ROCE to 17.5%. Thous EUR 9M2004 9M2005 9M /05 CAG 06/04 Sales 368, , , % 1.3% Ebitda 34,747 40,881 41, % 9.7% Ebitda Margin 9.4% 10.5% 11.0% 5.4% 8.3% Ebit 23,255 28,141 29, % 12.6% Operating Profit 22,473 23,916 28, % 12.8% ROCE BUSINESS AREAS DAIRY 9M06
 with a 93.")

19 03 DAIRY Outlook Investing Savings in Future Yield The results achieved by the new products launched in 2006, such as Max, with a year-on-year cumulative growth of 57.1% up to September, or our Peques products, which boosted our Children s Nutrition division with an 86.2% growth, or Calcio Soja (calcium-soya enriched milk) with a 93.1% growth, suggest new business opportunities for forthcoming years. We have incurred in hefty advertising investments and associated commercial costs to launch these new ranges of products, which are expected to be a strong source of income in the future. SALES EBITDA 518, ,412 46,620 54,121 56, , E E2006 BUSINESS AREAS DAIRY Out look

20 03 DAIRY Outlook Good ROCE Division sales will foreseeably drop by 2.5% to EUR 505Mio., mainly due to the sale of the Leyma brand last year. Despite this, the enhanced sales mix and the savings achieved through restructuring will raise the Ebitda margin by almost one percentage point to 11.2%, giving an estimated year-end Ebitda of around EUR 56.7Mio. The division ROCE is expected to reach 18%. Thous EUR E2006 E06/05 CAG E06/04 Sales 497, , , % 0.8% Ebitda 46,620 54,121 56, % 10.3% Ebitda Margin 9.4% 10.4% 11.2% 7.4% 9.3% Ebit 31,078 37,507 40, % 13.8% Operating Profit 31,111 31,473 39, % 12.4% ROCE BUSINESS AREAS DAIRY Out look


21 04 PASTA
 has an optimum financial position, although there is still room for improvement in certain organisational and strategic aspects, which we are working on in close")

22 04 PASTA 9M06 What Pasta! The Pasta Division, until very recently consisting exclusively of Panzani, now has a prominent size in the Group, since the incorporation of New World Pasta in June. New World Pasta (hereinafter NWP ) has an optimum financial position, although there is still room for improvement in certain organisational and strategic aspects, which we are working on in close collaboration with Riviana and Panzani. We are in the process of defining a Marketing Plan giving each of its brands a specific future and personality and stimulating innovation. We are bolstering the basic aspects of production: raw material procurement control, quality control, cost control, etc. Between Panzani and NWP we are creating a solid, united group, expert in the peculiarities of the pasta world, which will strengthen our position as leaders on the American market. BUSINESS AREAS PASTA 9M06

23 04 PASTA 9M06 Sculpting the New Division The 9M05 consolidated results included only a 5-month contribution by Panzani. The 9M06 results include a full contribution by Panzani but only 4 months of NWP. NWP contributes EUR 80Mio. to the pasta division turnover, bringing it to EUR 405Mio. NWP adds EUR 14Mio. to the Ebitda, pushing the division figure up to EUR 60.3Mio. Thous EUR 9M M /05 Sales 183, , % Ebitda 23,765 60, % Ebitda Margin 12.9% 14.9% 14.9% Ebit 15,766 41, % Operating Profit 17,796 44, % ROCE Panzani has been consolidated since May 2005 NWP is consolidated as from June 2006 BUSINESS AREAS PASTA 9M06


24 04 PASTA Outlook In a proforma year it would contribute more to consolidated results than sugar The 2005 division results included a contribution of only 8 months by Panzani. In the 2006 full-year results, Panzani will be consolidated for 12 months, although NWP for only 7 months. NWP will contribute EUR 145m to the division turnover, which will total approx. EUR 584.5m. The division EBITDA es estimated at EUR 88.7m, of which EUR 27m will correspond to the US subsidiary. 1 2 Thous EUR 2005 E2006 E06/05 Sales 289, , % Ebitda 44,416 88, % Ebitda Margin 15.3% 15.2% -1.1% Ebit 31,492 62, % Operating Profit 33,957 60, % ROCE Panzani has been consolidated since May 2005 NWP is consolidated as from June 2006 BUSINESS AREAS PASTA Out look


25 Ebro Puleva consolidated 9M06 results and year-end outlook 01 Consolidated Profit and Loss Account 02 Debt Evolution

26 CONSOLIDATED 9M06 & Outlook Changes in Consolidated Group Our businesses in Central America were sold last August. According to the IFRS, the proceeds generated on the sale of these businesses, the tax effects of that sale and the income generated by their operations up to the date of their sale are presented in a single net sum in the item "Discontinued Activities" on both the 9-month and the estimated full-year Profit and Loss Accounts. The income and expenses corresponding to these businesses in previous years have also been reclassified at Discontinued Activities". To enable homogenous comparison with previous years, we have considered it more representative to include the income generated on the sale of these businesses in 2006 as non-recurring operating income, leaving the income from ordinary activities during 8 months of 2006 in the businesses that have been sold as Discontinued Activities". The 9M and estimated year-end profit and loss accounts drawn up strictly in accordance with the IAS are set out in Annex I. The 9M06 results do not include the contribution of Minute Rice, which will be consolidated as from November. CONSOLIDATED RESULTS PROFIT AND LOSS ACCOUNT 9M06
. The consolidated Ebitda is up 7% to EUR 208.4Mio.")
27 CONSOLIDATED 9M06 Consolidated Management The consolidated turnover is 20.3% up on the same period of 2005 and 21.8% (CAGR) on In an effort to boost our brand positions, we have stepped up our investments in advertising by 75% to EUR 54.5Mio. (2.8% of sales). The consolidated Ebitda is up 7% to EUR 208.4Mio., bolstered by the incorporation of new businesses that make up for the reduced yield of the sugar business and the complicated situation on the raw materials market. During the first 9 months of the year we have ploughed the proceeds from divestments back into restructuring different businesses, especially those affected by the Reform of the Sugar Sector. Thous EUR 9M2004 9M2005 9M /05 CAG 06/04 Sales 1,322,532 1,642,276 1,975, % 22.2% Ebitda 169, , , % 10.7% Ebitda Margin 12.9% 11.9% 10.6% -11.1% -9.4% Ebit 131, , , % 3.8% Operating Profit 163, , , % 15.7% Earnings before Tax 135, , , % 16.0% Attributed earnings 94, , , % 17.7% ROCE Out CONSOLIDATED RESULTS EVOLUTION OF DEBT look

28 DEBT EVOLUTION 9M06 A Streamlined Balance Sheet We have made huge efforts over the past twelve months to reduce our debt. To facilitate analysis, we include a table showing a simplified source and application of funds statement. Even when including the acquisition of New World Pasta, our Net Debt is reduced by EUR 15.5m year on year. 12 Months Dept 30 Sept EBITDA CA Divestment (net) Real Estate Divestments Biotech Shares Sale NWP Acquisition CAPEX Taxes Dividends WC, Interest, etc Debt 30 Sept CONSOLIDATED RESULTS DEBT 9M06
29 CONSOLIDATED Outlook We are approaching the EUR 3bn sales threshold! The estimated turnover of the consolidated group in 2006 is 19.3% up on 2005 and 21.1% (CAGR) on This strong growth has been achieved as a result of the diversification strategy, comprising the incorporation of Riviana and Panzani, plus 7 months of NWP and 2 of Minute Rice. Our brand commitment has led us to increase our investment in advertising by 42% to EUR 73.1m (2.7% of sales). Ebitda is expected to grow by 8.8%, breaking through the EUR 300m threshold, based on the incorporation of new businesses to offset the smaller returns on the sugar business and the difficult situation on the raw materials market. We continue with the sugar provisions in the fourth quarter. Our net profit is now over EUR 185m, giving an EPS of 1.2 EUR (+19%). Thous EUR E2006 E06/05 CAG E06/04 Sales 1,814,359 2,266,992 2,703, % 22.1% Ebitda 248, , , % 11.1% Ebitda Margin 13.7% 12.4% 11.3% -8.7% -9.0% Ebit 182, , , % 6.9% Operating Profit 194, , , % 23.3% Earnings before Tax 171, , , % 19.8% Attributed earnings 126, , , % 20.9% EPS (EUR) ROCE CONSOLIDATED RESULTS CONSOLIDATED Out look
 below 4 times, bearing in mind that the contribution by the new businesses is limited to 7 months for NWP and just 2 for Minute")
30 DEBT EVOLUTION Outlook Flat Rate but with More Minutes We achieve an optimum financial structure for a food manufacturing enterprise: Net Debt/Shareholders Equity = 1. As promised, we are keeping our debt coverage ratio (Net Debt/Ebitda) below 4 times, bearing in mind that the contribution by the new businesses is limited to 7 months for NWP and just 2 for Minute Rice. We are endeavouring to reduce our debt still further, since cash generation is one of the prime objectives set by our management team. We will digest the latest acquisitions before making any further purchases. Thous EUR 31 Dec Sep Dec Sep Dec 06E Sep06/Sep05Dec06E/Dec05 Net Debt 472, , , ,442 1,195, % 28.4% Average Debt 352, , ,427 1,014,818 1,056, % 25.6% Shareholders' Equity 961,160 1,044,026 1,076,582 1,152,331 1,197, % Leverage ND 49.1% 95.1% 86.5% 84.8% 99.9% Leverage AD 36.6% 77.1% 78.2% 88.1% 88.3% x Ebitda (ND) x Ebitda (AD) CONSOLIDATED RESULTS DEBT Out look


31 Conclusions


32 Conclusions Proud to Face the Challenge As indicated throughout this presentation, we are expecting good year-end results, based on the evolution of the sugar division, which has been better than expected, and the new acquisitions, which more than make up for the loss of yield caused by the strong inflation of raw materials (energy, rice, wheat and, more recently, milk). The level of synergies and convergence among the recent acquisitions in North America is going to be very high. We are now embarking on a phase of major industrial restructurings in our businesses, which will entail an increase in restructuring costs but will lay the foundations for a new development model that will, in turn, secure significant returns once implemented. We are fulfilling our objective of focusing on activities with a greater brand weight, on developed markets and with an enhanced balance among economic regions (Annex II). CONCLUSIONS 9M06


33 Annexes I & II


34 ANNEX I IFRS-compliant 9M interim profit and loss account IFRS-compliant estimated full-year profit and loss account ANNEX I 9M06


35 ANNEX II Sales by Regions Sales 9M04 Sales 9M06 Spain 74% Spain 46% Europe 36% Others 6% North America 2% Europe 18% Others 6% North America 12% Sales Outlook 2004 Sales Outlook 2006 Spain 73% Spain 43% Europe 36% Others 3% North America 5% Europe 19% Others 6% North America 15% ANNEX II 9M06


36 Corporate Calendar
 24 April Presentation 1st quarter results 3 July Dividend payment 20 July Presentation 1st half results 2 October Dividend payment 30 October 22")
37 CORPORATE CALENDAR Adequate communication Ebro Puleva will continue to pursue its commitment to transparency and reporting in 2006: 24 February Presentation year-end 2005 results 3 April Dividend payment 5 April Annual General Meeting (2nd Call) 24 April Presentation 1st quarter results 3 July Dividend payment 20 July Presentation 1st half results 2 October Dividend payment 30 October 22 December Presentation 3rd quarter results and outlook for 2006 Announcement 2007 dividend against 2006 accounts 27 December Dividend payment CORPORATE CALENDAR M06


38 DISCLAIMER Disclaimer To the best of our knowledge, the estimates contained in this presentation on the future growth of the different businesses and the overall business, market share, financial results and other aspects of the operations and position of the company are accurate as at the date hereof. All the figures set out in this report are calculated according to the International Accounting Standards (IAS). The contents of this presentation are no guarantee of future actions and entail certain risks and uncertainties. Business results may be affected by numerous factors and, consequently, they may differ considerably from those estimated herein. Analysts and investors should not rely exclusively on these estimates, which are valid only at the date of this presentation. Ebro Puleva is not bound to publish the results of any updates of these estimates made to reflect events and circumstances occurring after the date of this presentation, including, though by no means limited to, changes in the Ebro Puleva businesses or in its acquisitions strategy, or to reflect unforeseen events. Analysts and investors are advised to consult the company s Annual Report and the documents filed with the Authorities, especially the National Securities Market Commission (CNMV). DISCLAIMER 9M06
RESULTS 9M18 and Outlook
 RESULTS 9M18 and Outlook 1 Contents BUSINESS UNIT RESULTS 9M18 AND 2018 OUTLOOK 1.1 Rice 1.2 Pasta CONSOLIDATED GROUP RESULTS 9M18 AND 2018 OUTLOOK 2.1 P&L 2.2 Debt Performance CONCLUSION CORPORATE CALENDAR
TO THE NATIONAL SECURITIES EXCHANGE COMISION OF SPAIN
 TO THE NATIONAL SECURITIES EXCHANGE COMISION OF SPAIN Madrid, 24 October, 2018 Ref: presentation to analysts announced this morning, regarding the Group Ebro Foods results for the third quarter and forecast
FIVE YEARS OF IMPROVEMENTS YEAR-END
 The challenge of FIVE YEARS OF IMPROVEMENTS YEAR-END 2004 Five years of improvements Contents 1. Five years of Management 2. After five years of Management 3. Creating Value 4. Results at year-end 2004
Index. BUSINESS UNITS RESULTS 1H Rice 1.2 Pasta EBRO FOODS GROUP CONSOLIDATED RESULTS 1H Income Statement 2.2 Debt Evolution CONCLUSION
 RESULTS 1H16 1 Index BUSINESS UNITS RESULTS 1H16 1.1 Rice 1.2 Pasta EBRO FOODS GROUP CONSOLIDATED RESULTS 1H16 2.1 Income Statement 2.2 Debt Evolution CONCLUSION CORPORTE CALENDAR 2016 DISCLAIMER 2 1.BUSINESS
CONSOLIDATED GROUP RICE PASTA
 CONSOLIDATED GROUP RICE PASTA ANNUAL REPORT Business areas 59 Pasta, sauces and others This division is represented by the companies new world pasta (leader in the United States and Canada), Panzani (no.
L 346/12 Official Journal of the European Union
 L 346/12 Official Journal of the European Union 20.12.2013 COUNCIL REGULATION (EU) No 1370/2013 of 16 December 2013 determining measures on fixing certain aids and refunds related to the common organisation
Contents. 1 H2 Highlights. 2 Outcome summary. 3 Raw materials and evolution of consumption. 4 Profit and loss statement. 5 Results per business units
 Contents 1 H2 Highlights 2 Outcome summary 3 Raw materials and evolution of consumption 4 Profit and loss statement 5 per business units 6 Balance sheet 7 Cash generation 8 Conclusions 9 Annexes 2 H2 Highlights
Interim report. Financial year 2005/06 1st Quarter 1 March to 31 May 2005
 Interim report Financial year 2005/06 1st Quarter 1 March to 31 May 2005 Dear Shareholders, This interim report informs you about the development of business in the first three months of the current 2005/06
AUDIT REPORT ON THE CONSOLIDATED FINANCIAL STATEMENTS
 Audit Report EBRO PULEVA, S.A. AND SUBSIDIARIES Consolidated Financial Statements and Consolidated Management Report for the year ended December 31, 2008 AUDIT REPORT ON THE CONSOLIDATED FINANCIAL STATEMENTS
Analyst Conference May 18, Dr. Wolfgang Heer (CEO), Thomas Kölbl (CFO)
, Thomas Kölbl (CFO)") Analyst Conference May 18, 2011 Dr. Wolfgang Heer (CEO), Thomas Kölbl (CFO) Analyst Conference May 18, 2011 Dr. Wolfgang Heer (CEO) Agenda 1. Overview and strategic objectives page 4 2. Financial Highlights
Analyst Conference May 18, 2011 Dr. Wolfgang Heer (CEO), Thomas Kölbl (CFO) Analyst Conference May 18, 2011 Dr. Wolfgang Heer (CEO) Agenda 1. Overview and strategic objectives page 4 2. Financial Highlights
Early warning system. No 4-6/2010
 EUROPEAN COMMISSION Brussels, 17.8.2010 COM(2010) 438 final REPORT FROM THE COMMISSION TO THE EUROPEAN PARLIAMENT AND THE COUNCIL on EAGF expenditure. Early warning system No 4-6/2010 EN EN TABLE OF CONTENTS
Presentation to Investors. December 2013
 Presentation to Investors December 2013 Who we are Engineering contractor and greenfield developer Revenues 2012 > 38 bn Current Backlog 67 bn Civil Engineering Industrial Engineering Construction Environment
Fortuna Entertainment Group NV
 Fortuna Entertainment Group NV Analyst Presentation Q1 2011 May 5, 2011 Disclaimer. This document has been prepared by Fortuna Entertainment Group N.V. (the Company ) solely for use at the Presentation.
Press Release. Outlook
 Press Release October 26, 2018 Signify reports third quarter sales of EUR 1.6 billion, improvement in operational profitability by 150 bps to 12.0% and free cash flow to EUR 64 million 2018 1 Sales of
STATEMENT 3RD QUARTER ST NINE MONTHS 2018
 QUARTERLY STATEMENT 3RD QUARTER 2018 1ST NINE MONTHS 2018 A very good third quarter 2018 3rd quarter Sales grew 7 percent to 3.8 billion Considerable increase in earnings in the growth segments Adjusted
FULL YEAR 2011 RESULTS
 FULL YEAR 2011 RESULTS February 28 th 2012 1 28 February 2011 This document does not constitute a purchase, sales or exchange offer, nor is it an invitation to draw up a purchase, sales or exchange offer,
ANNEX CAP evolution and introduction of direct payments
 ANNEX 2 REPORT ON THE DISTRIBUTION OF DIRECT AIDS TO THE PRODUCERS (FINANCIAL YEAR 2005) 1. FOREWORD The Commission regularly publishes the breakdown of direct payments by Member State and size of payment.
Almarai Company Announces Its Annual Consolidated Financial Results for The Year Ended in 31 st December 2018 (12 Months)
") 20 th January 2019 Almarai Company Announces Its Annual Consolidated Financial Results for The Year Ended in 31 st December 2018 (12 Months) Almarai Company ( the Company ) is pleased to announce its annual
20 th January 2019 Almarai Company Announces Its Annual Consolidated Financial Results for The Year Ended in 31 st December 2018 (12 Months) Almarai Company ( the Company ) is pleased to announce its annual
JANUARY-SEPTEMBER 2012 RESULTS
 Press Release JANUARY-SEPTEMBER 2012 RESULTS Santander registered attributable net profit of EUR 1.804 billion (-66%), after covering 90% of real estate provisions required by the latest Spanish regulations
Powering Up : From Consolidation to Delivery
 Powering Up : From Consolidation to Delivery Dresdner Kleinwort Wasserstein New York, January 10, 2005 Ingo Alphéus Vice President Investor Relations of RWE AG Forward looking statement This presentation
Roadshow presentation 3-Month Key Sales Figures 2016/17. January 2017
 Roadshow presentation 3-Month Key Sales Figures 2016/17 Agenda BC at a glance Highlights 3 months 2016/17 Strategy & Outlook Page 2 BC at a glance Who we are? The heart and engine of the chocolate industry
Financial Overview. Olivier Dubois President and CFO. Investor Presentation Paris, October 17, New York, October 19, 2007
 Financial Overview Olivier Dubois President and CFO Investor Presentation Paris, October 17, 2007 - New York, October 19, 2007 Good morning ladies and gentlemen, I am Olivier Dubois, Technip President
SEMPERIT GROUP Q / Q INVESTOR PRESENTATION. Dr Martin Füllenbach, CEO Frank Gumbinger, CFO 21 November 2018
 SEMPERIT GROUP Q1-3 / Q3 INVESTOR PRESENTATION Dr Martin Füllenbach, CEO Frank Gumbinger, CFO 21 November 1 Agenda Restructuring and Transformation update (p.3) Operational Highlights (p.9) Financial performance
MORGAN STANLEY GLOBAL CONSUMER & RETAIL CONFERENCE. Cécile Cabanis, CFO. November 14, 2017 I 1 I
 MORGAN STANLEY GLOBAL CONSUMER & RETAIL CONFERENCE November 14, 2017 Cécile Cabanis, CFO I 1 I This document contains certain forward-looking statements concerning Danone. In some cases, you can identify
Delivering Superior Sustainable Profitable Growth
 Investor Seminar October 22, 2018 Delivering Superior Sustainable Profitable Growth Cécile CABANIS CFO Our journey towards long-term sustainable value creation Accelerated transformation since last three
Nestlé Investor Seminar 2008
 Nestlé Investor Seminar 2008 Procurement of Raw Materials at Nestlé Malcolm Harrison Head of Procurement 1 Nestlé Investor Seminar Vevey 16-17 June 2008 Disclaimer This presentation contains forward looking
INTERIM REPORT. 1st. 3rd. quarter 2001/02
 INTERIM REPORT 1st. 3rd. quarter 2001/02 March 1 through November 30, 2001 2 Dear shareholders, A major step was taken in Südzucker Group s refocus on its core competencies with the approval in December
METRO QUARTERLY STATEMENT 9M/Q3 2017/18
 CONTENT 2 Overview 4 Sales, earnings and financial position 5 Earnings position of the sales lines 5 8 Real 9 Others 10 Outlook 11 Store network 12 Income statement 13 Balance sheet 15 Cash flow statement
Net interest-bearing debt at 30 September 2016 was DKK million (30 September 2015: DKK 476 million).
.") H+H International A/S Interim financial report Company Announcement No. 343, 2016 H+H International A/S Dampfærgevej 3, 3rd Floor 2100 Copenhagen Ø Denmark Tel. +45 35 27 02 00 info@hplush.com www.hplush.com
H+H International A/S Interim financial report Company Announcement No. 343, 2016 H+H International A/S Dampfærgevej 3, 3rd Floor 2100 Copenhagen Ø Denmark Tel. +45 35 27 02 00 info@hplush.com www.hplush.com
Central and Eastern Europe: Overview of EU Enlargement and Its Impact on Primary Commodity Markets
 Central and Eastern Europe: Overview of EU Enlargement and Its Impact on Primary Commodity Markets USDA Agricultural Outlook Forum February 20 2003 Chris Horseman Agra Europe (London) Ltd. AGRA Agra Group
Henrik Lange Executive Vice President and CFO
 Henrik Lange Executive Vice President and CFO SKF Capital Markets Day 10 September 2014 Agenda Financial development Cash flow, working capital Financial position Acquisitions Second brand Key business
SUGAR. STARCH. FRUIT.
 REPORT ON THE FIRST THREE QUARTERS Q3 2004 05 AGRANA BETEILIGUNGS- AG SUGAR. STARCH. FRUIT. DEAR SHAREHOLDER, DEAR SIR OR MADAM, The Extraordinary General Meeting of Shareholders held on 5 November 2004
Self Storage Group ASA Third quarter November 2017
 Self Storage Group ASA Third quarter 2017 16 November 2017 1 GROUP HIGHLIGHTS THIRD QUARTER 2017 Revenues in Q3 2017 NOK 55.6 million, up from NOK 51.4 million in Q2 2017 Adjusted EBITDA in Q3 2017 of
Philips Lighting reports first quarter sales of EUR 1.5bn and operational profitability of 7%
 Philips Lighting reports first quarter sales of EUR 1.5bn and operational profitability of 7% First quarter 2018 results Analyst & Investor presentation April 26, 2018 Important information Forward-Looking
EBRO PULEVA GROUP DIRECTOR S REPORT FOR THE YEAR ENDED 31 DECEMBER 2009 (THOUSAND OF EUROS) 1. ANALYSIS OF THE YEAR. SOLID BALANCED GROWTH.
 1. ANALYSIS OF THE YEAR. SOLID BALANCED GROWTH.") 1. ANALYSIS OF THE YEAR. SOLID BALANCED GROWTH Backdrop 2009 was characterised by the economic crisis. In general the developed economies -in which Ebro Puleva carries on the most significant portion of
1. ANALYSIS OF THE YEAR. SOLID BALANCED GROWTH Backdrop 2009 was characterised by the economic crisis. In general the developed economies -in which Ebro Puleva carries on the most significant portion of
Philips Lighting reports 0.5% full year comparable sales growth, 10% operational profitability and EUR 403 million free cash flow
 Philips Lighting reports 0.5% full year comparable sales growth, 10% operational profitability and EUR 403 million free cash flow Q4 & Full Year 2017 presentation February 2, 2018 Important information
KEY ELEMENTS OF THE AGREEMENT ON CAP REFORM nd July 2013
 KEY ELEMENTS OF THE AGREEMENT ON CAP REFORM 2014-2020 2 nd July 2013 INTRODUCTION Following a series of meetings of the EU Council of Agriculture Ministers, the EU Commission and European Parliament between
FINANCIAL MANAGEMENT OF THE EUROPEAN AGRICULTURAL FUNDS
 FINANCIAL MANAGEMENT OF THE EUROPEAN AGRICULTURAL FUNDS Agenda Introduction (slides 3-7) Principles of shared financial management (slides 8-17) Financial management of EAGF (slides 18-22) Financial management
Deutsche Bank Conference
 Deutsche Bank Conference 11 JUNE 2007 CASINO IN A SNAP SHOT A 100-year old banner 2006 consolidated sales: EUR22.5 Bio A leading multiformat French food retailer A rapid internationalisation since 1996:
Vitasoy Announces 15% Growth in Net Sales Revenue to HK$2,783 million for FY2008/09
 For Immediate Release Vitasoy Announces 15% Growth in Net Sales Revenue to HK$2,783 million for FY2008/09 Positive Sales Growth Recorded in All Major Markets Financial Highlights For the year ended 31st
CTT Correios de Portugal. Company Presentation
 CTT Correios de Portugal Company Presentation Disclaimer DISCLAIMER This document has been prepared by CTT Correios de Portugal, S.A. (the Company or CTT ) exclusively for use during roadshows and conferences
2017 Annual Results. Philippe Capron
 2017 Annual Results Philippe Capron Overall 2017 performance better than expected, marked by strong revenue growth Strong revenue growth: +4.9% at constant FX (+3.5% like-for-like): improvement in France
The Reform of the Common Agricultural Policy Implementation. Catherine Combette DG Agriculture and Rural Development European Commission
 The Reform of the Common Agricultural Policy 2014-2020 Implementation Catherine Combette DG Agriculture and Rural Development European Commission catherine.combette@ec.europa.eu Agriculture and Rural Development
Bekaert delivers vigorous growth, record results and continuing strong dividend
 Press release regulated information 13 March, 2009 Press Katelijn Bohez T +32 56 23 05 71 Investor Relations Jacques Anckaert T +32 56 23 05 72 Annual results 2008 Bekaert delivers Highlights 1 Bekaert
1st Quarter Results Zumtobel Group 2007/08. September 18, 2007
 1st Quarter Results Zumtobel Group 2007/08 September 18, 2007 Presentation Dr. A. Ludwig / T. Spitzenpfeil Q1 2007/08 key facts and figures On track for double digit margin Zumtobel Group Continuing growth
Ezentis increases its EBITDA by 142,3% in the first nine months of the year up to 16,4 million Euros
 Results Presentation Ezentis increases its EBITDA by 142,3% in the first nine months of the year up to 16,4 million Euros The revenue of the Company increased by 30% up to 228,5 million Euros thanks to
Interim Report January June 2011
 Interim Report January June Lars Nyberg President and CEO 1 A united TeliaSonera shows strong profitability Net sales SEK 25,894 million (27,065) Increased 3.0 percent in local currencies EBITDA* SEK 9,9
This report constitutes regulated information as defined in the Royal Decree of 14 November 2007.
 This report constitutes regulated information as defined in the Royal Decree of 14 November 2007. 1 Table of Content 1 Overview of Key Figures 4 2 Highlights 6 3 Key events for the third quarter 2013 7
STRONG UPSWING IN FIRST-HALF 2006 RESULTS
 July 27, 2006. Press rele ase STRONG UPSWING IN FIRST-HALF 2006 RESULTS SALES: up 21.8% to 20,551 million; up 19.7% at constant exchange rates*. OPERATING INCOME: up 32.3% to 1,815 million; up 29.8% at
Analyst Conference May 15, Dr. Wolfgang Heer (CEO), Thomas Kölbl (CFO)
, Thomas Kölbl (CFO)") Analyst Conference May 15, 2012 Dr. Wolfgang Heer (CEO), Thomas Kölbl (CFO) Analyst Conference May 15, 2012 Dr. Wolfgang Heer (CEO) Agenda 1. Overview and strategic objectives page 4 2. Financial Highlights
Analyst Conference May 15, 2012 Dr. Wolfgang Heer (CEO), Thomas Kölbl (CFO) Analyst Conference May 15, 2012 Dr. Wolfgang Heer (CEO) Agenda 1. Overview and strategic objectives page 4 2. Financial Highlights
PRESS RELEASE. De'Longhi S.p.A. The Shareholders Annual General Meeting, held today in ordinary session:
 PRESS RELEASE De'Longhi S.p.A. The Shareholders Annual General Meeting, held today in ordinary session: (i) approved the consolidated 2017 results, confirming the data approved by the Board of Directors
HelloFresh SE QUARTERLY STATEMENT Q QUARTERLY STATEMENT Q HelloFresh SE
 QUARTERLY STATEMENT Q3 2018 HelloFresh SE 1 HELLOFRESH AT A GLANCE Key Figures Key Performance Indicators Group 30- Sept 17 YoY growth 30- Sept 17 YoY growth Active customers (in millions) 1.84 1.28 43.7%
Financial results & business update. Quarter ended 30 September October 2016
 Financial results & business update Quarter ended 30 September 2016 19 October 2016 Disclaimer 3 Any remarks that we may make about future expectations, plans and prospects for the company constitute forward-looking
HUHTAMÄKI OYJ INTERIM REPORT. January 1 September 30, 2012
 HUHTAMÄKI OYJ INTERIM REPORT January 1 September 30, 2012 Q1- Huhtamäki Oyj, Interim Report January 1 September 30, 2012 Strong earnings growth Profitability improvement continued The North America segment
Investor presentation
 Investor presentation Important information Forward-Looking Statements and Risks & Uncertainties This document and the related oral presentation contain, and responses to questions following the presentation
Release no Report on the first 9 months of 2014 To NASDAQ Copenhagen A/S
 Page 1/11 20 November 2014 for Today the Board of has discussed and approved the following report on the first 9 months of 2014. Highlights Sales in the first 9 months of 2014 at actual exchange rates
Fredrik Nilsson Chief Financial Officer and acting Chief Executive Officer. CFO update. The Co-Development Company
 Fredrik Nilsson Chief Financial Officer and acting Chief Executive Officer CFO update How we measure success Important financial KPIs Organic volume growth Higher than market growth Operating profit Double-digit
Q Interim Report. October 25, 2018 Panu Routila, President & CEO Teo Ottola, CFO
 Q3 2018 Interim Report October 25, 2018 Panu Routila, President & CEO Teo Ottola, CFO 2 Agenda 1. Group highlights 2. Business Area Service 3. Business Area Industrial Equipment 4. Business Area Port Solutions
BUSINESS REVIEW Q3/2018 / CRAMO PLC Q3
 BUSINESS REVIEW /2018 / CRAMO PLC 1 PROFITABLE GROWTH CONTINUED BUSINESS REVIEW /2018 / CRAMO PLC JULY SEPTEMBER 2018 Sales EUR 197.9 (191.9) million, up by 3.1%. In local currencies, sales grew by 7.5%.
Results Presentation 1Q May 12 th 2017
 Results Presentation 1Q 2017 May 12 th 2017 Executive Summary OPERATING OUTPERFORMANCE 11% Sales & EBIT recovery in CIMIC & margins stability NET PROFIT GROWTH in the HIGH END TARGET 12.6% like-for-like*
Strengthening the economic model
 Strengthening the economic model Cécile CABANIS Executive Vice President, Chief Financial Officer Strategy and Information Systems DISCLAIMER This document is presented by Danone. It contains certain forward-looking
ANNEX CAP evolution and introduction of direct payments
 ANNEX 2 REPORT ON THE DISTRIBUTION OF DIRECT AIDS TO THE PRODUCERS (FINANCIAL YEAR 2004) 1. FOREWORD The Commission regularly publishes the breakdown of direct payments by Member State and size of payment.
1Q18 Key figures SALES 8,671 +3,7% +14,7% EBIT % +16.9% NET PROFIT % +13.4% NET DEBT % BACKLOG 66,677-2,1% +10.
 Key figures Figures in million YoY Var. Like for Like Var. 1 SALES 8,671 +3,7% +14,7% EBIT 473 +7.9% +16.9% NET PROFIT 250 +7.4% +13.4% NET OPERATING CASH FLOW (2) LTM 1,603 +40.9% NET DEBT 359-78.8% BACKLOG
BANK PEKAO S.A. GROUP
 BANK PEKAO S.A. GROUP Financial results after 4Q 2005 Strong results, positive outlook Warsaw, 21 February, 2006 DISCLAIMER Forward looking statements This presentation contains certain forward-looking
Interim report Q3, July September 2017 Stockholm, 25 October 2017
 Interim report Q3, July September Stockholm, 25 October As of the second quarter of, Cloetta Italia S.r.l. is accounted for as discontinued operation. The comparative figures in the consolidated profit
Analyst & Investor Fact Sheet Q3 2018
 Evonik Group in million Q3 2017 yoy Δ% Q2 2018 qoq Δ% External sales 3,556 3,794 7% 3,870 3,794-2% 3,756 Volume (%) -1% 3% Price (%) 9% 4% Exchange Rates (%) -1% -2% Other effects (%) 0% 1% Adjusted EBITDA
Third Quarter Ended September 30, 2016
 Third Quarter Ended September 30, 2016 1 Forward-Looking Statements In the interest of providing shareholders and potential investors with information regarding TransForce, including management s assessment
Industriestraße D Stuttgart Phone: Fax: Internet:
 9-Months Report 2003 CENIT AG Systemhaus Industriestraße 52-54 D-70565 Stuttgart Phone: +49 711 7825-30 Fax: +49 711 7825-4000 Internet: http://www.cenit.de Investor Relations: Fabian Rau Phone: +49 711
Organic growth in all divisions for ASSA ABLOY
 Interim Report Q3 2017 20 October 2017 The global leader in door opening solutions Organic growth in all divisions for ASSA ABLOY Third quarter Net sales increased by 3% to SEK 18,499 M (18,025), with
FY 2011 Results. February 28th, 2012
 FY 2011 Results February 28th, 2012 Disclaimer In addition to figures prepared in accordance with IFRS, PRISA presents non-gaap financial performance measures, e.g., EBITDA, EBITDA margin, adjusted EBITDA,
Quarter ended 30 September Financial results & business update
 Quarter ended 30 September 2014 Financial results & business update 21 October 2014 Disclaimer Any remarks that we may make about future expectations, plans and prospects for the company constitute forward-looking
Strong first quarter performance supports positive outlook for the year
 First quarter report of 2018 for ROCKWOOL International A/S Release no. 8 2018 to Nasdaq Copenhagen 18 May 2018 Strong first quarter performance supports positive outlook for the year The strong first
QUARTERLY REPORT 2Q10
 QUARTERLY REPORT 2Q10 www.ence.es Growing the forest and growing with it 1 BUSINESS GROWTH AND MARKET OUTLOOK The growth for the quarter can be summarised with the following main figures: Strong operating
EMPOWERING INNOVATION
 EMPOWERING INNOVATION INTERIM REPORT THIRD QUARTER 2017 This English translation is for information purposes only. In case of any discrepancies between this version and the Swedish, the Swedish version
1H18 Key figures SALES 17,777 +2,2% +10,1% EBITDA 1, % +8.7% EBIT % +11.9% NET PROFIT % +13.3%
 Key figures Figures in million YoY Var. Like for Like Var. 1 SALES 17,777 +2,2% +10,1% EBITDA 1,248 +2.0% +8.7% EBIT 946 +5.1% +11.9% NET PROFIT 447 +7.4% +13.3% LTM Net Operating Cash Flow 1,605 +24.1%
October December Peter Nilsson, President & CEO Ulf Berghult, Chief Financial Officer
 October December 206 Peter Nilsson, President & CEO Ulf Berghult, Chief Financial Officer Highlights Business areas Financials Summary & Q 207 outlook Q&A 2 207-02-0 New platform - focus on profitable
AGRANA Beteiligungs-AG Annual Results for
 AGRANA Beteiligungs-AG Annual Results for 2013 14 1 March 2013 28 February 2014 Presentation for investors and analysts Vienna, 9 May 2014 Annual Results for 2013 14, 9 May 2014 In our Hands At AGRANA,
Q1 Q Q3 Q EUR million Jan-Mar 2018 Jan-Mar 2017 Change, % EUR million Jan-Dec 2017
 Stockholm, Sweden, 4 May Eltel Group Interim report January March January March Group net sales decreased 10.5% to EUR 266.6 million (297.8), mainly as a result of divestments and on-going discontinuation
Grupo Logista H Results. May 6, 2015
 Grupo Logista H1 2015 Results May 6, 2015 Grupo Logista reports First Half 2015 Results Grupo Logista announces today its first half results for 2015. Main highlights: Net Income up by 16.2% to 47.1 million
Thomas Cook. Delivering the transformation. Q3 Interim Management Statement Thomas Cook Group plc
 Thomas Cook Delivering the transformation Q3 Interim Management Statement 2013 1 Key messages and agenda 1 2 3 Delivering the transformation Delivering improved financial and business performance Current
CHR. HANSEN HOLDING A/S DANSK FINANSANALYTIKERFORENING COPENHAGEN 12 JUNE 2013
 CHR. HANSEN HOLDING A/S DANSK FINANSANALYTIKERFORENING COPENHAGEN 12 JUNE 213 Chr. Hansen A bioscience based company Founded in 1874 Dairy Enzymes (12% of revenue*) CED Cheese Cultures (37% of revenue*)
9-Month Report of FJA AG
 www.fja.com 9-Month Report of FJA AG 01.01.2008-30.09.2008 Contact FJA AG Elsenheimerstrasse 65 80687 Munich GERMANY Investor Relations Phone: + 49 89 76901-274 or -7002 Fax: + 49 89 7698813 Email: investor.relations@fja.com
Almarai Company. Fiscal Year 2018 and Fourth Quarter 2018
 Fiscal Year 2018 and Fourth Quarter 2018 Disclaimer Information contained in this presentation is subject to change without further notice, its accuracy is not guaranteed and it may not contain all material
RECTICEL FULL YEAR 2012 RESULTS
 RECTICEL FULL YEAR 2012 RESULTS Financial Analysts Meeting Brussels, 01 March 2013 Olivier Chapelle CEO Recticel Jean-Pierre Mellen CFO Recticel Michel De Smedt IRO Recticel 1 Highlights 2 FY2012 Consolidated
Full year and Q results March 15, 2017
 Full year and Q4 2016 results March 15, 2017 Disclaimer This document and its related communication ( Presentation ) have been issued by windeln.de SE and its subsidiaries ( Company ) and do not constitute
Interim Report. January September 2013
 Interim Report January September 2013 Disclaimer Albain Bidco Norway AS is providing the following financial results for the third quarter of 2013 to holders of its EUR225,000,000 6.750% Senior Secured
2017 HALF-YEAR RESULTS
 I 1 I 2017 HALF-YEAR RESULTS July 27, 2017 Emmanuel Faber, CEO Cécile Cabanis, CFO I 2 I This document is presented by Danone. It contains certain forward-looking statements concerning Danone. In some
The Board of Directors met on March 6, 2018 and approved the audited 2017 financial statements.
 Mersen 2017 results: on-going positive momentum LIKE-FOR-LIKE INCREASE IN SALES OF 8% FOR THE YEAR OPERATING MARGIN BEFORE NON-RECURRING ITEMS OF 9.2% FOR THE YEAR, UP 170 BASIS POINTS ON 2016 VERY STRONG
The CAP after Round tables on the green architecture of the CAP. #FutureofCAP. Brussels, 12 November 2018
 The CAP after 2020 Round tables on the green architecture of the CAP Brussels, 12 November 2018 Gregorio DÁVILA DÍAZ DG Agriculture and Rural Development European Commission #FutureofCAP THE NEW DELIVERY
Grupo Santander carried out its business in 2017 in a more favourable environment, one of the most positive in recent years.
 Message from José Antonio Álvarez Grupo Santander carried out its business in 2017 in a more favourable environment, one of the most positive in recent years. The global economy and, in particular, the
PRESS RELEASE REGULATED INFORMATION
 31/08/2009 PRESS RELEASE REGULATED INFORMATION CONSOLIDATED RESULTS OVER FIRST HALFYEAR 2009 Net sales decrease with 14% over first half year EBITDA margins under pressure strong focus on costs reductions
Charts on the 1st Quarter , February 13, ThyssenKrupp
 Charts on the 1st Quarter 2006-2007, February 13, 2007 0 Charts on the 1st Quarter 2006-2007, February 13, 2007 1 Q1 2006/2007 Overview Excellent start to fiscal year 2006/2007 Order intake: 13.3 billion,
Third-quarter earnings burdened by raw material-related losses. Group adjusted EBITDA at EUR 56 million
 1 (23) Contents Highlights in the third quarter of 2017... 2 Highlights during the first nine months of 2017... 2 Business and financial outlook for the fourth quarter of 2017... 3 CEO Roeland Baan...
Nestlé India Limited 20th Financial Analysts Meet - Gurgaon 30th November 2011
 Nestlé India Limited 20 th Financial Analysts Meet - Gurgaon 30 th November 2011 Disclaimer This presentation may contain statements which reflect Management s current views and estimates and could be
Tobacco Growing in the European Union
 Tobacco Growing in the European Union Mr Johan van Gruijthuijsen 1, European Commission Study conducted as a technical document for The first meeting of the Ad Hoc Study Group on Alternative Crops established
PRESS RELEASE. The Board of Directors Approves the Third Interim Report on Operations at September 30, 2012
 PRESS RELEASE The Board of Directors Approves the Third Interim Report on Operations at September 30, 2012 Net revenues increase (+13.2%) EBITDA highly improves (+14.6%) Solid operating results in Australia
Nordzucker AG Interim Report Financial Year 2009/2010
 Nordzucker AG Interim Report Financial Year 2009/2010 1st Half-year March 1 August 31, 2009 Group figures and ratios Operating business H1 2009/2010 H1 2008/2009 Change absolute Revenues EUR m 904 561
First Quarter 2015 Earnings. May 11, 2015
 First Quarter 2015 Earnings May 11, 2015 1 Forward-Looking Statements Some of the statements made in this presentation are forward-looking and are made pursuant to the safe harbor provision of the Private
Interim Results 9-month figures FY 11
 Interim Results 9-month figures FY 11 Bernhard Schreier, CEO Dirk Kaliebe, CFO Robin Karpp, Head of Investor Relations Heidelberger Druckmaschinen AG February 09, 2011 Highlights FY 11 Order intake increased