Roadshow presentation 3-Month Key Sales Figures 2016/17. January 2017
|
|
|
- Jade Shelton
- 6 years ago
- Views:
Transcription

1 Roadshow presentation 3-Month Key Sales Figures 2016/17
2 Agenda BC at a glance Highlights 3 months 2016/17 Strategy & Outlook Page 2


3 BC at a glance


4 Who we are? The heart and engine of the chocolate industry A merger between Cacao Barry, the very first chocolate connoisseur since 1842 and Callebaut a chocolate couverture manufacturer expert since 1911 Listed on the SIX Swiss Exchange since 1998 Today, the world's leading manufacturer of high-quality chocolate and cocoa products Barry Callebaut is inside 25% of all consumer products containing cocoa or chocolate Page 4

5 Barry Callebaut at a glance We add value in every step of the cocoa and chocolate value chain Page 5


6 FY 2015/16 Page 6


7 What do we offer? A broad range from standard to the most premium products Cocoa Products Food Manufacturers Gourmet & Specialties Page 7


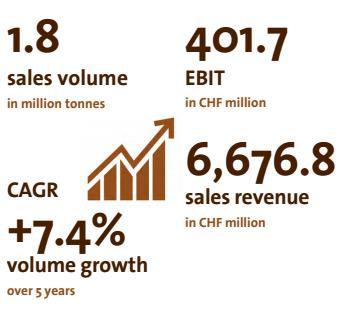
8 How are we organized? Our Regional and Product split FY 2015/16 Sales Volume: 1.8 mio tonnes Sales Volume per Region Asia Pacific 4% Sales Volume per Product Group Gourmet & Specialities 11% Global Cocoa 24% EMEA 44% Cocoa Products 24% Food Manufacturers 65% Americas 28% Sales Revenue: CHF6,676.8m EBITDA: CHF539.4m EBIT: CHF401.7m Page 8
9 Our business model We apply a cost plus approach to the majority of the business Customers Pricing model Profit levers Food Manufacturers Small, medium and Global Food Manufacturers Cost Plus Customer mix Product mix Economies of scale 65% Cocoa Products Small, medium and Global Food Manufacturers Market prices Cost Plus (partly) Global set-up Combined ratio Customer/product mix 24% Gourmet & Specialties 11% Professional users, Food Price list Expansion of global brands Chains, Distributors Adjacent products Innovation/Sustainability Note: Percentage of FY2015/16 Group sales volume Passing on the cost of raw materials to customers underpins profit stability by mitigating volatility impact of main raw materials Page 9


10 A global footprint and a local service Cocoa factories in origin countries and chocolate factories close to our customers Cocoa processing factory Chocolate factory Integrated factory Page 10

11 Highlights - 3 months 2016/17


12 3-Month Key Sales Figures Steady start, consistent above market growth Sales volume growth flat Above-market growth in chocolate +2.3% 1 Gourmet & Specialties continues to perform strongly, up +14.3% Nearly completed phase-out of less profitable contracts in cocoa -8.6% Sales revenue up +3.2% in local currencies (+4.2% in CHF) Mid-term guidance confirmed 1 Nielsen chocolate confectionery in volume 26 countries - Aug 2016 Oct 2016 Page 12
13 3 months 2016/17 Above-market growth in Chocolate, and nearly completed phase-out of less profitable contracts in Global Cocoa Sales Volume (in tonnes) +2.2% +1.4% 1' % +8.8% 1'828 4' % Group 3 months 2015/16 EMEA Americas Asia Global Cocoa Group 3 months 2016/17 Market Volume growth 2-3.1% -2.0% +3.7% -2.3% 1 Due to the intentional phasing out of low-profit contracts, including long-term ingredients agreements 2 Source: Nielsen chocolate confectionery in volume 26 countries - Aug 2016 Oct 2016 Page 13


14 3 months 2016/17 All key growth drivers contributed to steady volume growth Emerging Markets Long-term outsourcing & Strategic Partnerships +2.5% vs prior year +1.0% vs prior year +17.7% +26.5% Gourmet & Specialties +14.3% vs prior year +6.5 % Volume growth 3 months 2016/17 CAGR 5 year Volume 35.0% 32.5% 11.2% % of total Annual Group Sales Volume Page 14


15 Focus on execution - Cocoa Leadership Project Commercial leadership Operations leadership Global leverage SKU reduction ongoing Customer segmentation Manufacturing footprint reduced in Asia Centralized combined cocoa ratio management in place Stronger focus on added-value products Working Capital optimized through better product flows Setting up Global market intelligence Harmonized sales tools Page 15
16 Cocoa processing profitability Temporary improvement; at higher levels compared to prior year European combined ratio - 6 months forward ratio Combined ratio 3.32 Butter ratio Powder ratio 0.00 Dec-07 Dec-08 Dec-09 Dec-10 Dec-11 Dec-12 Dec-13 Dec-14 Dec-15 Dec-16 For cocoa processors, profitability depends on the ratio between input costs (price of cocoa beans) and combined output prices (price of cocoa butter and powder). Page 16
17 Raw materials evolution Cocoa bean prices lower than prior year, world sugar prices increased strongly, milk powder prices remain firm 300% Average 3 months vs. prior year 250% 200% Sugar world +51.4% Cocoa beans -1.6% 150% 100% 50% Sugar EU +4.7% Milk powder +15.4% 0% Sep.2007 Sep.2008 Sep.2009 Sep.2010 Sep.2011 Sep.2012 Sep.2013 Sep.2014 Sep.2015 Sep.2016 Note: All figures are indexed to Sep 2007 Source: Cocoa beans London (2 nd position), Sugar world London n 5 (2nd position), Sugar EU Kingsman estimates W-Europe DDP, skimmed milk powder average price Germany, Netherlands, France. Page 17


18 Strategy & Outlook
19 Consistent long-term strategy, focus on execution Vision Heart and engine of the chocolate and cocoa industry Expansion Sustainable growth Margin accretive growth 4 strategic pillars Innovation SMART growth Accelerated growth in Gourmet, Specialties and emerging markets Cost Leadership Return on Capital and greater focus on Free cash flow Sustainability Talent & Team Page 19

20 Leveraging global scale and expertise Execution translated into our Product groups Gourmet & Specialties Accelerated growth Expand reach Expand scope Growth & profit accretion Food Manufacturers Global Cocoa Sustained growth Strengthen existing partnerships Foster new partnerships Innovation & cocreation Profitable growth Reinvent and refocus our model Restore profitability Page 20

21 Page 21


22 Strategic priorities 2016/17 Grow Competitively Further leverage our innovation capabilities Inspire and co-create Nourish & expand partnerships Grow Sustainably Cocoa Beyond cocoa Talents & teams Grow Profitably Cocoa Leadership deployment Increase leverage Footprint & Capabilities Disciplined execution Quality & service Profitability & cash Page 22

 Average volume growth 4-6% EBIT growth on average above volume growth 1 1 In")
23 Outlook Continue to strive for a smart balance between consistent, above-market volume growth and enhanced profitability Outlook Continue to implement smart growth, we have good visibility on volume growth and expect positive contribution to profitability from our Cocoa Leadership project. Mid-term guidance (2015/ /18) Average volume growth 4-6% EBIT growth on average above volume growth 1 1 In local currencies and barring any major unforeseen events Page 23

24 Appendix


25 What makes Barry Callebaut unique? Global number one player in chocolate and cocoa Deep chocolate and cocoa expertise Global leader in Gourmet & Specialties Proven and long-term oriented strategy Unparalled global footprint, present in all key markets Preferred outsourcing and strategic partner Leader in Innovation Cost leadership along the value chain Pioneer in sustainability Entrepreneurial spirit Balancing short and long-term Page 25
26 Capital Expenditures in CHF mio. +4.5% +4.6% +4.2% +4.0% +3.0% CAPEX as % of sales revenue Additional growth IT Upgrade / efficiency gains existing sites Maintenance 2011/ / / / / /17 E Page 26
27 7-year EBIT per tonne development EBIT per tonne temporarily affected by a challenging cocoa products market and a strong Swiss franc EBIT per tonne in constant currencies EBIT per tonne in CHF (as reported) +7.2% Volume in kmt 2009/ / / / / / /16 Page 27
28 Chocolate and Cocoa markets Barry Callebaut uniquely positioned in industrial chocolate and cocoa markets Cocoa grinding capacity Industrial chocolate open market BC Cargill Olam Blommer Mondelez Guan Chong Ecom Cocoa BT Cocoa Nestlé Transmar Group Others BC Cargill Blommer Fuji Oil Puratos Cémoi Irca Clasen Kerry Group Guittard Others Notes: Olam incl. ADM; Cargill incl. ADM chocolate business; Fuji Oil incl. Harald Sources: Proprietary estimates Page 28
29 West Africa is the world s largest cocoa producer Total world harvest (15/16): 4,031 TMT Brazil* 3% Cameroon* 6% Ecuador 6% Nigeria 5% others 13% Ivory Coast* 39% About 70% of total cocoa beans come from West Africa BC processed ~900,000 tonnes or 22% of the world crop Barry Callebaut has various cocoa processing facilities in origin countries*, in Europe and in the USA Indonesia* 9% Ghana* 19% Source: ICCO estimates Page 29
30 FY results 2015/16 Solid volume growth, profitability as anticipated and flat in local currencies (In CHF mio.) Sales Volume Total (in tonnes) Group performance FY 2015/16 (in CHF) % vs prior year (in CHF) % vs prior year in local currencies 1,834, % Sales Revenue 6, % +8.8% Gross Profit % +4.4% EBIT Total EBIT per tonne % -5.2% +0.1% -2.0% Net profit for the year % -5.1% Free cash flow Page 30
31 EBIT FY 2015/16 Operating profit flat in local currencies, supported by good product and customer mix, while setting up the path for continued smart growth in CHF mio % One-off related to the settlement agreement with Petra Foods EBIT FY 2014/15 Additional Gross Profit Additional SG&A Restructuring & other one-off EBIT FY 2015/16 before FX FX Impact EBIT FY 2015/16 Page 31
32 Free Cash Flow Strong cash flow generation as a result of efforts to reduce working capital and strict discipline on CAPEX in CHF mio % (py -101) -201 (py-249) -141 (py-145) -17 (py +44) 404 Operating Cash Flow FY 2014/15 Operating Cash Flow FY 2015/16 Change in Working capital Capital Expenditures Interest paid and income taxes M&A and other Free Cash Flow FY 2015/16 Page 32
33 Balance Sheet & key ratios Improvement of our some financial ratios, based on our smart growth strategy and some positive one-off effects Aug 16 Aug 15 Total Assets [CHF m] 5, ,429.4 Net Working Capital [CHF m] 1, ,529.7 Non-Current Assets [CHF m] 2, ,185.5 Net Debt [CHF m] 1, ,728.0 Shareholders' Equity [CHF m] 1, ,772.8 Debt/Equity ratio 74.3% 97.5% Solvency ratio 34.7% 32.7% Net debt / EBITDA 2.7x 3.2x Interest cover ratio 4.0x 4.1x ROIC 9.5% 9.8% ROE 11.2% 13.5% Page 33
34 Available Financing Enough headroom for further growth and raw material price fluctuations As of 31 August 2016 CHF 4,407 mio ABS CHF 948 mio Various uncommitted facilities -58.9% 3-5 years Related Party loan 2017 Maturity 2019 EUR 600 mio. Domestic Commercial Paper Programme Various bilateral LT loans CHF 150 mio. EUR 600 mio Syndicated Bank Loan (11 banks) CHF 1,811 mio ABS Short-term Maturity 2017 EUR 350 mio 6.0% Senior Notes Maturity 2021 Maturity 2023 EUR 250 mio % Senior Notes USD 400 mio 5.5% Senior Notes Committed lines Long-term Maturity 2024 EUR 450 mio 2.375% Senior Notes Cash and cash equivalents Page 34 Available Funding Sources Outstanding amounts
35 Liquidity Debt maturity profile As of 31 August 2016 In CHF mio Uncommitted lines Committed lines Cash and revolving credit facility (undrawn) Short-term facilities Term loans Bonds 134 Cash Page 35
Roadshow presentation 9 months Key Sales Figures 2016/17. July 2017
 Roadshow presentation 9 months Key Sales Figures 2016/17 Agenda BC at a glance Highlights Q3 2016/17 Strategy & Outlook Page 2 BC at a glance Who are we? The heart and engine of the chocolate industry
Roadshow presentation 9-Month Key Sales Figures July 2016
 Roadshow presentation 9-Month Key Sales Figures 2015-16 Agenda BC at a glance Highlights 9 months 2015/16 Strategy & Outlook Page 2 BC at a glance Who we are? The heart and engine of the chocolate industry
Roadshow presentation - Half-Year Results 2015/16. April 2016
 Roadshow presentation - Half-Year Results 2015/16 April 2016 Agenda BC at a glance Highlights HY 2015/16 Financial Review Strategy & Outlook Page 2 BC at a glance We are present in the key parts of the
Roadshow presentation Half Year Results 2017/18. April 2018
 Roadshow presentation Half Year Results 2017/18 April 2018 Agenda BC at a glance Highlights HY 2017/18 Financial Review HY 2017/18 Strategy & Outlook Page 2 April 2018 HY 2017/18 Roadshow Presentation
Roadshow presentation - Full-Year Results 2016/17. November 2017
 Roadshow presentation - Full-Year Results 2016/17 Agenda BC at a glance Highlights FY 2016/17 Financial Review Strategy & Outlook Page 2 BC at a glance Who are we? The heart and engine of the chocolate
Full Year Results 2012/13
 Full Year Results 2012/13 Analysts Conference Nov 7, 2013 Because we love chocolate Cautionary note Certain statements in this presentation regarding the business of Barry Callebaut are of a forward-looking
Full Year Results 2016/17. Analysts Conference November 8, 2017
 Full Year Results 2016/17 Analysts Conference Cautionary note Certain statements in this presentation regarding the business of Barry Callebaut are of a forwardlooking nature and are therefore based on
Full Year Results 2014/15. Analysts Conference November 4, 2015
 Full Year Results 2014/15 Cautionary note Certain statements in this presentation regarding the business of Barry Callebaut are of a forwardlooking nature and are therefore based on management s current
April 1, 2011 Barry Callebaut H1 2010/11 results presentation
 Half-Year Results 2010/11 Media presentation April 1, 2011 April 1, 2011 Barry Callebaut H1 2010/11 results presentation Cautionary note Certain statements in this presentation regarding the business of
Half-year Results 2013/14
 Half-year Results 2013/14 Media Conference April 3, 2014 Cautionary note Certain statements in this presentation regarding the business of Barry Callebaut are of a forward-looking nature and are therefore
Half-year Results 2013/14
 Half-year Results 2013/14 Analysts Conference April 3, 2014 Cautionary note Certain statements in this presentation regarding the business of Barry Callebaut are of a forward-looking nature and are therefore
Barry Callebaut Roadshow presentation - Q1 2010/11. January 2011
 Barry Callebaut Roadshow presentation - Q1 2010/11 Agenda BC at a glance Q1 Key Sales Figures Strategy & Outlook Q & A 2 Barry Callebaut as the heart and engine of the chocolate industry Cocoa Plantations
INVESTOR PRESENTATION
 INVESTOR PRESENTATION HALF YEAR 2010 CONTENTS 1 PERFORMANCE HIGHLIGHTS HY 2010 2 ENVIRONMENT HY 2010 3 P&L & B/S DETAILS HY 2010 4 MATERIAL COST DEVELOPMENT 5 OUTLOOK 2010 6 QUESTIONS & ANSWERS 1 PERFORMANCE
Barry Callebaut AG. Update to credit strengths and challenges. CREDIT OPINION 19 December Update
 CREDIT OPINION rry Callebaut AG Update to credit strengths and challenges Update Summary rating rationale rry Callebaut AG's (rry Callebaut) 1 rating reflects (1) the company's leading market position
MONTHLY COCOA MARKET REPORT. August 2014
 MONTHLY COCOA MARKET REPORT August 2014 Important Notification The information provided is not intended for distribution to, or use by, any person or entity in any jurisdiction or country where such distribution
Half-Year Results 2016/17
 Half-Year Results 2016/17 We are the heart and engine of the chocolate and cocoa industry Half-Year Results 2016/17 in brief Volume growth picking up in Q2 +3.5%, fueled by key growth drivers, resulting
Full Year Results Roadshow Presentation NOVEMBER, 2012
 Full Year Results 2011-12 Roadshow Presentation NOVEMBER, 2012 Agenda BC at a glance Highlights FY11/12 Financials Strategy and outlook 2 Barry Callebaut is present in all stages of the industrial chocolate
Credit Opinion: Barry Callebaut AG
 Credit Opinion: Barry Callebaut AG Global Credit Research - 08 Jan 2016 Switzerland Ratings Category Outlook Corporate Family Rating Barry Callebaut Services N.V. Outlook Senior Unsecured -Dom Curr Moody's
Wrap up by CFO October 21, Victor Balli Chief Financial Officer
 Investor Day Paris Wrap up by CFO October 21, 2011 Victor Balli Chief Financial Officer BC volume development (in 000 MT, incl consumer WE) Volume in 000 metric tons (MT) +8.9% per year +6 8 % per year
Corporate Presentation
 Corporate Presentation 1Q14 Financial Results & Corporate Updates 28 May 214 Presented by: Mr. Brandon Tay, Managing Director IR Adviser AQUILAS CORPORATE UPDATE Industry Overview Cocoa ingredients prices
Annual Results 2008/09 Analyst and Investor presentation
 Annual Results 2008/09 Analyst and Investor presentation November 12, 2009 Impressions after 10 weeks Strengths Entrepreneurship Leading-edge manufacturing technology Customer centric Global footprint
Roadshow presentation - Q1 2011/12. January 2012
 Barry Callebaut Roadshow presentation - Q1 2011/12 January 2012 Agenda BC at a glance Q1 Key Sales Figures Strategy & Outlook Q & A January 2012 Barry Callebaut Roadshow Q1 2011/12 2 Barry Callebaut is
Annual Results 2008/09 Media presentation
 Annual Results 2008/09 Media presentation November 12, 2009 Impressions after 10 weeks Strengths Entrepreneurship Leading-edge manufacturing technology Customer centric Global footprint Chocolate is an
Petra Foods posts US$26.3 million net profit in FY2007 net profit on 60% rise in sales to US$836.6m
 FOR IMMEDIATE RELEASE Petra Foods posts US$26.3 million net profit in FY2007 net profit on 60% rise in sales to US$836.6m EBITDA growth of 9.1% reinforces the strong fundamentals of both Divisions Financial
Financial Analysts Presentation March 17th, 2009
 ANNUAL RESULTS 2008 Financial Analysts Presentation March 17th, 2009 1 Annual Media Conference FULL YEAR 2008 GROUP MANAGEMENT Group Management Ernst Tanner Duty Free & Country Responsibility Hansjürg
Full-Year 2016/17 Results Stäfa, May 16, 2017 Lukas Braunschweiler CEO, Hartwig Grevener CFO, Thomas Bernhardsgrütter IR
 Full-Year 2016/17 Results Stäfa, Lukas Braunschweiler CEO, Hartwig Grevener CFO, Thomas Bernhardsgrütter IR Disclaimer This presentation contains forward-looking statements, which offer no guarantee with
Nilfisk Financial Results 2017 Webcast presentation - February 28
 Webcast presentation - February 28 Today s presenters Nilfisk CEO Hans Henrik Lund Nilfisk CFO Karina Deacon Page 2 Agenda 1 2 3 4 5 6 Highlights Business unit update Financials Nilfisk Next Outlook 2018
Financial Results (unaudited)
") 4 th Quarter and Full Year 2011 Financial Results (unaudited) 24 February 2012 1 1 Important note on forward looking statements The presentation herein may contain forward looking statements by the management
4 th Quarter and Full Year 2011 Financial Results (unaudited) 24 February 2012 1 1 Important note on forward looking statements The presentation herein may contain forward looking statements by the management
(Registration no C)
") 3 rd rd Quarter & 9-Month 2014 Financial Results (unaudited) 11 November 2014 1 1 Important Note on Forward Looking Statements The presentation herein may contain forward looking statements by the management
3 rd rd Quarter & 9-Month 2014 Financial Results (unaudited) 11 November 2014 1 1 Important Note on Forward Looking Statements The presentation herein may contain forward looking statements by the management
HALF-YEAR 2016 INVESTOR PRESENTATION
 HALF-YEAR 2016 INVESTOR PRESENTATION AGENDA 1. Performance Highlights HY2016 2. P&L and B/S Details HY2016 3. Outlook Environment 2016 Investor Presentation HY2016 July 22, 2016 2 PERFORMANCE HIGHLIGHTS
July 26, 2017 LafargeHolcim Ltd 2015
 Second Quarter 2017 Results Beat Hess, Chairman and Interim CEO Roland Köhler, Interim COO and Regional Head of Europe, Australia/NZ & Trading Ron Wirahadiraksa, CFO July 26, 2017 LafargeHolcim Ltd 2015
Lindt & Sprüngli LINDT & SPRÜNGLI. Half-Year Results 2009
 Lindt & Sprüngli Half-Year Results 2009 1 HALF YEAR RESULTS 2009 Half-Year Results 2009 Introduction 2 HALF YEAR RESULTS 2009 HY Results 2009 Introduction ENVIRONMENT HY 2009: General factors Consumers:
(Registration no C) (Registration no C) Financial Results. (unaudited) 11 November 2009
 (Registration no C) Financial Results. (unaudited) 11 November 2009") 3 rd Quarter and 9-Month 9 2009 Financial Results (unaudited) 11 November 2009 1 Important note on forward looking statements The presentation herein may contain forward looking statements by the management
3 rd Quarter and 9-Month 9 2009 Financial Results (unaudited) 11 November 2009 1 Important note on forward looking statements The presentation herein may contain forward looking statements by the management
26 oktober Sustainable Banking. Richard Kooloos BBK
 Sustainable Banking BBK 26 oktober 2015 Richard Kooloos ABN AMRO strategy and sustainability strategy Improve profitability Pursue selective international growth Enhance client centricity Strategic priorities
DSM Capital Markets Day 2018
 DSM Capital Markets Day 2018 Targets 2021 focused on growth, cash and value Geraldine Matchett CFO ROYAL DSM CAPITAL MARKETS DAY LONDON (UK) - 20 JUNE 2018 Safe harbor statement This presentation may contain
Full-year results 2018
 Full-year results 2018 Investor Call 1 Disclaimer This presentation contains forward looking statements which reflect Management s current views and estimates. The forward looking statements involve certain
Half-Year Results 2011/12
 Half-Year Results 2011/12 With annual sales of about CHF 4.6 billion (EUR 3.6 billion/usd 5.0 billion) for fiscal year 2010/11, Zurich-based is the world s leading manufacturer of high-quality cocoa and
Nilfisk Q3 Interim Report 2018 Webcast presentation November 14, 2018
 Nilfisk Q3 Interim Report 2018 Webcast presentation November 14, 2018 Agenda 1 2 3 4 5 Highlights Business unit update Simplifications initiatives Financials Outlook 2018 6 Q&A 2 Q3 2018 results Financial
Half-Year Results 2017/18
 Half-Year Results 2017/18 We are the heart and engine of the chocolate and cocoa industry Half-Year Results 2017/18 in brief Sales volume growth +8.0% Sales revenue of CHF 3.5 billion, 1.8% in local currencies
Nestlé Investor Seminar 2008
 Nestlé Investor Seminar 2008 Procurement of Raw Materials at Nestlé Malcolm Harrison Head of Procurement 1 Nestlé Investor Seminar Vevey 16-17 June 2008 Disclaimer This presentation contains forward looking
Investor Presentation HY2018. Maître Chocolatier Suisse Depuis 1845
 Investor Presentation HY2018 Agenda 1. Performance Highlights HY2018 2. P&L and B/S Details HY2018 3. Outlook 2018 July 24, 2018 HY 2018 Investor Presentation 2 Performance Highlights HY2018 P&L Statement
Zumtobel Group AG FY 2014/15 results
 Zumtobel Group AG FY 2014/15 results June 24, 2015 1 24 June 2015 Annual Results 2014/15 Improvement in revenues and earnings, restructuring measures on track Financials FY 2014/15 at a glance Group revenues
Full-year results 2017 Conference. February 15, 2018 Nestlé full-year results 2017
 Full-year results 2017 Conference 1 Disclaimer This presentation contains forward looking statements which reflect Management s current views and estimates. The forward looking statements involve certain
Full-Year 2017/18 Results Stäfa, May 22, 2018 Arnd Kaldowski, CEO Hartwig Grevener, CFO Thomas Bernhardsgrütter, IR
 Full-Year 2017/18 Results Stäfa, Arnd Kaldowski, CEO Hartwig Grevener, CFO Thomas Bernhardsgrütter, IR Disclaimer This presentation contains forward-looking statements, which offer no guarantee with regard
Henkel AG & Co. KGaA. Klaus Keutmann Frankfurt,
 Henkel AG & Co. KGaA Klaus Keutmann Frankfurt, 21.01.2015 Disclaimer This information contains forward-looking statements which are based on current estimates and assumptions made by the corporate management
Zumtobel Group AG Q1 2015/16 results
 Zumtobel Group AG Q1 2015/16 results September 8, 2015 1 8 September 2015 Q1 2015/16 results An expected slow start to the FY but on track to meet full year guidance Financials Q1 2015/16 at a glance Group
Board of Directors Zurich, 24 March, 2009 Dufry Presentation - Full Year 2009 Results
 Dufry Presentation - Full Year 2009 Results March 2010 1 Legal Disclaimer Information in this presentation may involve guidance, expectations, beliefs, plans, intentions or strategies regarding the future.
Third Quarter 2017 Results Jan Jenisch, CEO Ron Wirahadiraksa, CFO. October 27, 2017 LafargeHolcim Ltd 2015
 Third Quarter 2017 Results Jan Jenisch, CEO Ron Wirahadiraksa, CFO October 27, 2017 LafargeHolcim Ltd 2015 01 Initial views Q3 2017 and Outlook Jan Jenisch, Chief Executive Officer 2017 LafargeHolcim 2
(Registration no C) (Registration no C) Financial Results
 (Registration no C) Financial Results") 3 rd Quarter & 9-Month 2011 Financial Results (unaudited) 10 November 2011 1 1 Important note on forward looking statements The presentation herein may contain forward looking statements by the management
3 rd Quarter & 9-Month 2011 Financial Results (unaudited) 10 November 2011 1 1 Important note on forward looking statements The presentation herein may contain forward looking statements by the management
(Registration no C) (Registration no C)
 (Registration no C)") 3 rd Quarter & 9-Month 2012 Financial Results (unaudited) 8 November 2012 1 1 Important note on forward-looking statements The presentation herein may contain forward looking statements by the management
3 rd Quarter & 9-Month 2012 Financial Results (unaudited) 8 November 2012 1 1 Important note on forward-looking statements The presentation herein may contain forward looking statements by the management
ZEBRA TECHNOLOGIES SECOND-QUARTER 2016 RESULTS. August 9, 2016
 ZEBRA TECHNOLOGIES SECOND-QUARTER 2016 RESULTS August 9, 2016 Anders Gustafsson Chief Executive Officer Mike Smiley Chief Financial Officer 2 Safe Harbor Statement Statements made in this presentation
STRONG GROWTH MOMENTUM: ALL REGIONS WITH DOUBLE-DIGIT GROWTH IN Q3 PRESENTATION NINE MONTHS 2014, OCTOBER 2014
 STRONG GROWTH MOMENTUM: ALL REGIONS WITH DOUBLE-DIGIT GROWTH IN Q3 PRESENTATION NINE MONTHS 2014, OCTOBER 2014 1. HIGHLIGHTS AND RESULTS NINE MONTHS 2014 HIGHLIGHTS NINE MONTHS 2014 Q3 with continued growth
Preliminary Results 2013 Imperial Tobacco Group PLC
 Preliminary Results 2013 Imperial Tobacco Group PLC 5 November 2013 1 Disclaimer Certain statements in this document constitute or may constitute forward-looking statements. Any statement in this document
technicolor.com 7 JUNE 2018
 technicolor.com 7 JUNE 2018 COUNTRIES SITES REVENUES Connected Home 57% 57% 2017 2016 16% 1% 26% Production Services 18% DVD Services 24% North America 53% 2017 2016 25% 16% 52% 7% Europe, Middle-East
Zumtobel Group AG H1 2015/16 results. December 9, 2015
 Zumtobel Group AG H1 2015/16 results December 9, 2015 1 9 December 2015 H1 2015/16 results Solid Q2 after a weak start into the financial year Financials H1 2015/16 at a glance Group revenues increase
WESCO International John Engel Chairman, President and CEO. William Blair & Company 36 th Annual Growth Stock Conference June 14, 2016
 WESCO International John Engel Chairman, President and CEO William Blair & Company 36 th Annual Growth Stock Conference June 14, 2016 Safe Harbor Statement Note: All statements made herein that are not
Continuous Improvement of Operating Performance Half Year Results 2014
 Continuous Improvement of Operating Performance Half Year Results 2014 Vernier, 17 July 2014 Gilles Andrier CEO Half Year Results 2014 Highlights Sales CHF 2.2 billion, up 4.5% on a like-for-like* basis
2008 Half Year Results. 30 July 2008
 1 2008 Half Year Results 30 July 2008 2 This material may be deemed to include forward-looking statements within the meaning of Section 27A of the US Securities Act of 1933 and Section 21E of the US Securities
FY2017 Earnings presentation. Landis+Gyr June 5, 2018
 FY2017 Earnings presentation Important notices This presentation includes forward-looking information and statements including statements concerning the outlook for our businesses. These statements are
Driving shareholder value
 KONE CMD 2017 Driving shareholder value ILKKA HARA, CFO SEPTEMBER 29, 2017 AGENDA FINANCIAL OVERVIEW BUILDING ON THE STRONG BUSINESS MODEL INVESTING FOR THE FUTURE LOOKING AHEAD Financial overview 3 Sales
Trelleborg Financials
 Trelleborg Financials Capital Markets Day Ulf Berghult, Chief Financial Officer Berns, December 6 Agenda Financial targets Group structure Continuing operations Trelleborg Group Updated financial targets
31 March 2018 Audited Preliminary Results. 6 June 2018
 31 March 2018 Audited Preliminary Results 6 June 2018 1 Presentation Team Euan Fraser Chief Executive Officer Stuart McNulty UK Chief Executive Officer John Paton Chief Financial Officer Has led Alpha
IMCD reports 25% EBITA growth in 2018
 Press release IMCD reports 25% EBITA growth in 2018 Rotterdam, The Netherlands (1 March 2019) - IMCD N.V. ( IMCD or Company ), a leading distributor of speciality chemicals and food ingredients, today
2007 Revenue and Results. 2007: strong increase in results Strengthened growth momentum. February 15 th, 2008
 2007 Revenue and Results 2007: strong increase in results Strengthened growth momentum February 15 th, 2008 2007 revenue and results Agenda A successful 2007 Be the recognized industry leader John Glen
Strong performance, delivering a record free cash flow Full Year Results 2012
 Strong performance, delivering a record free cash flow Full Year Results 2012 Vernier, 5 th February 2013 Gilles Andrier CEO Full Year Results 2012 Financial Highlights Sales CHF 4.3 billion, up 6.6% in
HALF-YEAR Investor Presentation
 HALF-YEAR 2015 Investor Presentation AGENDA 1. Performance Highlights HY2015 2. P&L and B/S Details HY2015 3. Outlook 2015 4. Questions & Answers Investors Presentation - HY2015 August 18, 2015 3 PERFORMANCE
INEOS STYROLUTION. Q1/ 2018 Investor Earnings Call
 INEOS STYROLUTION Q1/ 2018 Investor Earnings Call Disclaimer The following presentation includes forward-looking statements, within the meaning of the US securities laws, based on our current expectations
FULL YEAR REPORT, 2017 TELEPHONE/AUDIO CONFERENCE 8 FEBRUARY 2018, AT CET TOMMY ANDERSSON, PRESIDENT AND CEO HELENA WENNERSTRÖM, EVP AND CFO
 TELEPHONE/AUDIO CONFERENCE 8 FEBRUARY 2018, AT 15.30 CET TOMMY ANDERSSON, PRESIDENT AND CEO HELENA WENNERSTRÖM, EVP AND CFO DIRECT LINK AUDIOCAST: HTTPS://TV.STREAMFABRIKEN.COM/BULTEN Q4 2017 TELECONFERENCE:
Full-Year / Fourth Quarter 2010 Results
 Full-Year / Fourth Quarter 2010 Results 16 February 2011 Disclaimer This presentation contains certain statements that are neither reported financial results nor other historical information. This presentation
Agenda. 1. Highlights FY 2012 Results. 2. Operational Performance Priorities for Financials. 5. Conclusion
 1MARCH 2013 Legal Disclaimer Information in this presentation may involve guidance, expectations, beliefs, plans, intentions or strategies regarding the future. These forward-looking statements involve
WESCO International John Engel Chairman, President and CEO. EPG Conference May 16, 2016
 WESCO International John Engel Chairman, President and CEO Safe Harbor Statement Note: All statements made herein that are not historical facts should be considered as forwardlooking statements within
Part 1 Executing our strategy
 Entwurf 19.09.018 15h00 Part 1 Executing our strategy Klaus Rosenfeld Chief Executive Officer Capital Markets Day 018 Berlin Disclaimer This presentation contains forward-looking statements. The words
Full Year Results 2003
 Full Year Results 2003 Industry Leadership Achieved Dr Jürg Witmer Chief Executive Officer Achievements 2003 Actual sales growth of 9% in local currencies Operating cash-flow increased by 17% Industry
2009 Half Year Results. 29 July 2009
 1 2009 Half Year Results 29 July 2009 2 Roger Carr Chairman 3 Agenda Chairman s comments Roger Carr First Half Highlights Todd Stitzer Operational and Financial Review Andrew Bonfield Strategic Update
ANSELL LIMITED Half Year Results to December Magnus Nicolin Chief Executive Officer Neil Salmon Chief Financial Officer
 ANSELL LIMITED Half Year Results to December 2014 Magnus Nicolin Chief Executive Officer Neil Salmon Chief Financial Officer Disclaimer The following presentation has been prepared by Ansell Limited for
SABMiller plc. Full year results Twelve months ended 31 March Graham Mackay, Chief Executive Jamie Wilson, Chief Financial Officer.
 SABMiller plc Full year results Twelve months ended 31 March 2012 Graham Mackay, Chief Executive Jamie Wilson, Chief Financial Officer 24 May 2012 Forward looking statements This presentation includes
September 11, Corporate Update. Rich Tobin, President & Chief Executive Officer
 September 11, 2018 Corporate Update Rich Tobin, President & Chief Executive Officer Forward-Looking Statements and Non-GAAP Measures Our comments may contain forward-looking statements that are inherently
Investor Presentation
 Investor Presentation May 2013 48,000 employees 200 offices 70 countries 1 global platform Table of Contents I. Company Description II. Global Growth Strategy III. Financial Overview IV. Appendix 2 Company
Third quarter Vestas Wind Systems A/S. Copenhagen, 9 November Classification: Public
 Third quarter Vestas Wind Systems A/S Copenhagen, 9 November Classification: Public Disclaimer and cautionary statement This document contains forward-looking statements concerning Vestas financial condition,
Zumtobel Group AG Q1 2018/19 & Strategic Outlook. September 2018
 Zumtobel Group AG Q1 2018/19 & Strategic Outlook September 2018 AGENDA Q1 2018/19 financial results Corporate Strategy Outlook ) Q1 2018/19 results & strategic outlook 04.09.2018 2 Stabilisation measures
B. Riley Investor Conference. May 23, 2018
 B. Riley Investor Conference May 23, 2018 About This Presentation Safe Harbor Statement This presentation includes forward-looking statements (statements which are not historical facts) within the meaning
Nemetschek Group. Company Presentation September Constractor: MT Højgaard, Søborg, Denmark Image: Tom Roe Realized with SOLIBRI
 The Blue Planet, Copenhagen, Denmark Constractor: MT Højgaard, Søborg, Denmark Image: Tom Roe Realized with SOLIBRI Nemetschek Group September 2018 Nemetschek s key achievements: #2 biggest listed software
Consolidated Financial Statements
 Consolidated Income Statement for the fiscal year 2017/18 2016/17 restated 1 in thousands of CHF Notes Revenue from sales and services 6,948,411 6,805,156 Cost of goods sold (5,791,331) (5,846,346) Gross
Strengthening the economic model
 Strengthening the economic model Cécile CABANIS Executive Vice President, Chief Financial Officer Strategy and Information Systems DISCLAIMER This document is presented by Danone. It contains certain forward-looking
Ageas Strategy in Portugal
 Ageas Strategy in Portugal A G E A S I N V E S T O R D AY 6 TH O F J U N E 2 0 17 I LISBON PORTUGAL Evolution of Ageas presence in Portugal Ocidental : A success story since 2005 Agenda Ageas Seguros :
Henkel Roadshow Q November, 2014
 Henkel Roadshow Q3 2014 November, 2014 Disclaimer This information contains forward-looking statements which are based on current estimates and assumptions made by the corporate management of Henkel AG
Third quarter Vestas Wind Systems A/S. Copenhagen, 7 November 2018
 Third quarter Vestas Wind Systems A/S Copenhagen, 7 November Disclaimer and cautionary statement This document contains forward-looking statements concerning Vestas financial condition, results of operations
KONE Result presentation 2018 JANUARY 24, 2019 HENRIK EHRNROOTH, PRESIDENT & CEO ILKKA HARA, CFO
 KONE Result presentation 2018 JANUARY 24, 2019 HENRIK EHRNROOTH, PRESIDENT & CEO ILKKA HARA, CFO Q4 2018 Highlights Orders received and sales grew in all regions and all businesses Adjusted EBIT returned
2018 Half Year Results
 A GLOBAL LEADER IN METAL FLOW ENGINEERING 2018 Half Year Results 26 July 2018 Patrick André Chief Executive 1 Disclaimer This presentation, which has been prepared by Vesuvius plc (the Company ), includes
HALF-YEAR RESULTS 2014 AND STRATEGY 2018 SIKA PRESENTATION JULY 2014
 HALF-YEAR RESULTS 2014 AND STRATEGY 2018 SIKA PRESENTATION JULY 2014 1. HIGHLIGHTS AND RESULTS HALF-YEAR 2014 HIGHLIGHTS HALF-YEAR 2014 Strategy 2018 well on track 18.1% sales growth (10.6% in CHF) to
2007 half year results roadshow
 2007 half year results roadshow 2007 half year results roadshow - August 2007 Disclaimer This presentation contains forward looking statements which reflect Management s current views and estimates. The
t e c h n i c o l o r. c o m
 2017 t e c h n i c o l o r. c o m Forward looking statements THIS PRESENTATION contains certain statements that constitute "forward-looking statements", including but not limited to statements that are
Interim Report Third Quarter 2018
 Johan Westman, CEO Fredrik Nilsson, CFO Interim Report Third Quarter 2018 Agenda 1 Third quarter 2018 2 Business area information 3 The AAK Way 4 Q&A 2 Highlights Q3 2018 HIGHLIGHTS GROWTH & RETURNS 2018
Fredrik Nilsson CFO and acting CEO Anne Mette Olesen Chief Marketing Officer. Interim report Fourth quarter and Year-end 2017
 Fredrik Nilsson CFO and acting CEO Anne Mette Olesen Chief Marketing Officer Interim report Fourth quarter and Year-end 20 Agenda Fourth quarter and full year 20 Business area information The AAK Way Q
GENERAL MEETING 3 MAY Arnaud Lagardère General and Managing Partner
 GENERAL MEETING 3 MAY 2018 Arnaud Lagardère General and Managing Partner CONTENTS 1 OUR MARKETS AND THEIR TRENDS 2 OUR GROUP TODAY 3 OUR STRATEGIC VISION AND AMBITION 2 OUR MARKETS AND OUR GROUP TODAY
HUGO BOSS First Nine Months Results 2011
 HUGO BOSS First Nine Months Results 2011 Mark Langer (CFO) November 2, 2011 Conference Call, First Nine Months Results 2011 HUGO BOSS November 2, 2011 2 / 30 AGENDA OPERATIONAL HIGHLIGHTS FIRST NINE MONTHS
We prioritize sustainable, profitable growth
 We prioritize sustainable, profitable growth Updated growth target reflects prioritization of profitability over overly expensive growth Previous financial targets for 2020 Updated targets Net sales At
KONE Q OCTOBER 26, 2017 HENRIK EHRNROOTH, PRESIDENT & CEO ILKKA HARA, CFO
 KONE Q3 2017 OCTOBER 26, 2017 HENRIK EHRNROOTH, PRESIDENT & CEO ILKKA HARA, CFO Q3 2017 highlights Orders received returned to growth in China with positive contribution from focused pricing actions Roll-out
Talanx Strategy Frankfurt, 23 October Torsten Leue, CEO
 Talanx Strategy Frankfurt, 23 October 2018 Torsten Leue, CEO Key messages We commit to an increased RoE of 800 bps above risk-free an annual EPS-growth 5% on average 35% to 45 % payout of IFRS earnings
Q in brief. Strong organic sales development. Electromechanical products up 30% Strong EBIT growth of 12%
 Q4 Report 20 Q4 20 in brief Strong organic sales development Very strong growth in Americas and APAC Strong growth in Global Technologies Good growth in EMEA Growth in Entrance Systems Electromechanical