Ferrotec Corporation Results for the fiscal year ended March 31, 2013
|
|
|
- Arlene Day
- 5 years ago
- Views:
Transcription

1 Ferrotec Corporation Results for the fiscal year ended March 31, 2013 May 28, 2013 (JASDAQ 6890) / 1.This fiscal year results cover twelve months period from April to March of Ferrotec, and twelve months period from Jan. to Dec. of consolidated subsidiaries and affiliated companies included in investment profit loss in equity method. 2.This presentation was prepared for the purpose of providing information regarding the company s results of operations for the fiscal year ended March 31, 2013 and is not a solicitation to purchase securities issued by the Company. Please ensure that the decision on whether to make an investment in our Company is made at your own risk. 3.These materials were prepared based on information available as of May 28, All opinions, forecasts and other forward-looking statements are based on management s judgments in accordance with materials available at that time and may be changed without prior notice.
2 FY March 2013 Financial Results
3 Financial Highlights in millions Amount FY3/12 Pct. of sales(%) Amount FY3/13 Pct. of sales(%) Amount YoY Pct. of sales(%) Net sales 60, , , Cost of sales 43, , , Gross income 16, , , SG&A expenses 12, , , Operating income 4, ,608-7,732 - Non-operating income , Non-operating expense 1, , Ordinary income 3, ,465-6,752 - Extraordinary income , , Extraordinary expense , , Net income 1, ,532-8,247 - Capital Investment 7,877-3,706-4, Depreciation 2,825-3, Note: exchange rate FY3/12 FY3/13 : US$ RMB

4 Financial Highlights 4 FY3/13 in millions Amount Pct. of sales(%) Net sales 38, Cost of sales 31, Gross income 6, SG&A expenses 10, Operating income 3,608 - Non-operating income 1, Non-operating expense 1, Ordinary income 3,465 - Extraordinary income 1, Extraordinary expense 4, Income before income tax 6,158 - Corporate tax, etc Net income 6,532 - Cost rate declined mainly because of posting valuation loss of 1,884 million due to lowerof-cost-or-market method Include 853 million in provision of allowance for doubtful accounts Include 871 million in exchange gain 1,548 million in gain on sale of land is included in extraordinary profit 3,657 million in business restructuring expenses is included in extraordinary loss Include 561 million in reversal of deferred tax assets, etc.
5 Segment Sales and Operating Income Net sales FY3/12 FY3/13 YoY ( in millions) Amount Pct. Of Sales(%) Amount Pct. Of Sales(%) Amount Pct. Of Sales(%) Equipment-related 24, , , Electronic device 5, , Photovoltaic-related 27, , , Others 2, , T o t a l 60, , , Operating income FY3/12 FY3/13 YoY ( in millions) Amount Pct. Of Sales(%) Amount Pct. Of Sales(%) Amount Pct. Of Sales(%) Equipment-related 2, , Electronic device Photovoltaic-related ,934-4,709 - Others Corporate & elimination T o t a l 4, , ,732 -


6 Consolidated Balance Sheet ~Assets~ ( in millions) FY3/12 FY3/13 Difference Current assets 41,330 34,271 7,059 Cash & deposits 9,560 7,373 2,187 Note & accounts receivable 13,921 15,235 1,314 Inventory 11,987 9,536 2,451 Current assets:main factor of increase 2,187 million decrease in cash and deposits, 2,451 million decrease in inventories and 2,703 million in others of current assets (mainly due to decrease in advance payments related to long-term purchase agreement) Fixed assets 31,241 32, Tangible fixed assets 25,397 24, Building 5,279 5, Equipment & machinery 7,205 10,165 2,960 Tools, furniture, and fixture 4,813 5,980 1,167 Major factor for decrease in tangible fixed assets Decrease due to sale of land of the previous head office 6 Land 2, ,014 Intangible fixed assets 2,368 1, Goodwill 1, Investments & other assets 3,475 5,473 1,998 T o t a l a s s e t s 72,571 66,343 6,228 Intangible fixed assets Amortization of goodwill: Actual: 456 million (Expected to be 162 million in the 34th period because one company will amortize goodwill in 1H)

 5,836 million ( 6,056 million) 18,370 million ( 21,068 million) Long-term debt 5,856 5,836 20 Total liabilities 38,384 35,904 2,480 Net Assets 34,186 30,439 3,747")
7 Consolidated Balance Sheet ~Liabilities and net worth~ ( in millions) FY3/12 FY3/13 Difference Current liabilities 29,592 27,243 2,349 Notes and accounts payable 8,610 8, Major factors for decrease in current liabilities Decreases in short-term debt and accounts payable facilities Shot-term debt 11,834 9,667 2,167 Current portion of longterm borrowings. 3,177 2, Fixed liabilities 8,792 8, CB Interest-being debt Short-term debt +Current portion of long-term borrowings Long-term debt + bond etc. Total 12,534 million (15,011million) 5,836 million ( 6,056 million) 18,370 million ( 21,068 million) Long-term debt 5,856 5, Total liabilities 38,384 35,904 2,480 Net Assets 34,186 30,439 3,747 Shareholder s equity 36,311 29,366 6,945 Total adjustment 2, ,322 Minority interests Net interest-being debt 10,997 million ( 11,508 million) Parenthesis represent the figures at the end of Mar Net assets Shareholders equity: Net income: - 6,532 million Dividends: 612 million Foreign currency translation adjustments: 3,211 million 7 Total liabilities & shareholder s equity 72,571 66,343 6,228 Note: exchange rates for end FY3/13 : / US dollar / RMB ( year-end exchange rate )
8 Consolidated Cash Flow ( in millions) FY3/12 FY3/13 8 Cash flow from operating activities 642 1,584 Income before income taxes 2,814 6,158 Depreciation 2,825 3,321 Exchange gain & loss( :gain) Changes in cost of structural reform ( :decrease) 0 1,579 Changes in notes & accounts receivable ( :increase) Changes in inventories( :increase) 2,960 3,377 Changes in accounts payable( :decrease) 1 1,385 Others 2, Cash flow from investing activities 8, Payments for purchase of tangible fixed assets 7,877 3,706 Proceeds from sales of tangible fixed assets 186 3,480 Payments for purchase of marketable securities 1 1 Proceeds from sales of marketable securities 29 6 Others Cash flow from financing activities 10,098 3,991 Changes in short-term borrowing 4,845 2,848 Proceeds from long-term debt 3,435 3,500 Payments of long-term debt 3,679 3,926 Proceeds from issuance of common stock 6,091 - Payments for dividend Others Changes in cash & cash equivalents 2,249 2,187 Cash and cash equivalents, beginning of year 7,310 9,560 Cash and cash equivalents, end of year 9,560 7,373 Operating cash flow Net income before income taxes + Depreciation - 2,837 million Increase in operating cash flow due to increased allowance for business structural reform: 1,579 million Increase in operating cash flow due to decreased trade receivables: 393 million Increase in operating cash flow due to decreased inventories: 3,377 million Decrease in operating cash flow due to decreased trade payables: - 1,385 million Investing cash flow Payment for acquisition of tangible fixed assets is mainly to invest in upgrading facilities Proceeds from sale of tangible fixed assets is mainly for selling previous head office
9 Business Forecast ( in millions) FY3/13 FY3/14(E) YoY (%) Net sales 38,424 42, Operating income 3,608 1,000 - Ordinary income 3, Net income 6, Capital investment 3,706 1, Depreciation 3,321 3, Note: Exchange rate FY3/13 FY3/14(assumed rate) : / US dollar / RMB Capital investment is based on cash flow considering unprojected large-scale capital investment and accounts payable facilities at the end of previous year.
10 Business Forecast ( in millions) FY3/14 (E) Net sales 42,000 Make investments in miniaturization in the semiconductor market and in panels for mobile phones in the FPD market as well. Material products which are consumables recover. Thermo-module for consumer use expands. Operating income 1,000 Complete the disposal of underperforming business and succeed in reducing costs and cutting selling, general and administrative expenses which will result in turning profitable. Ordinary income 700 Expect reduced interest burden associated with decrease in debt and weak yen. Net income 450 End of posting extraordinary loss and expect to turn profitable. 10
11 Business Forecast (sales by segment) YoY ( in millions) FY3/13 FY3/14(E) (%) Equipment-related 18,867 22, Vacuum Feedthroughs 4,686 5, Quartz 3,420 4, Ceramics 4,108 4, EB-Gun, LED 2,724 3, semiconductor wafer 3,930 4, Electronic device 4,563 5, Thermo-electric module 4,126 4, Ferrofluid, others Photovoltaic-related 12,345 11, Quartz crucibles 2,709 3, Solar silicon 5,509 6, PV manufacturing Epuip. 2, Solar cell, Others 1, Others 2,648 3, total 38,424 42,
12 Status by Segment and Outlook


13 Segment 49% 32% 12% Equipment-related Electronic device Photovoltaic-related Vacuum feedthroughs Quartz Ferrofluid PV manufacturing equip. Single crystal silicon growing furnaces Multi crystal silicon casting furnaces Ceramics Deposition equipment Quartz crucible Consumable Hot zone Thermo-electric module Single crystal ingot PV silicon(ingot) Multi- crystal ingot PV wafer And wafer processing 13 The bar chart represents the pct. of each segment in FY3/13 sales
14 Equipment-related Segment Sales ( in million) 30,000 25,000 20,000 15,000 10,000 5, ,694 24,883 4,641 22,305 4,027 18,867 3, ,507 4,999 4,122 3,930 4,078 4,350 4,108 6,501 3,529 5,509 2,724 3,420 4,087 7,764 6,763 4,686 5,340 FY3/11 FY3/12 FY3/13 FY3/14(e) Semiconductor wafer Ceramics EB-gun, LED,others Quartz Product Vacuum Feedthrough 14 =Semiconductor silicon products have been shifted to semiconductor wafer from FY3/12.

 Others 36% Sales by category PV 8% FPD 12% Semi-conductor 35% LED 9% In the FPD market, investments in large LCD for TV, small-and-midsized")
15 Status and Outlook for Vacuum Feedthroughs (m ) 12,000 9,000 6,000 7,764 Transition of sales 6,763 4,686 5, Status of FY3/13 Low motivation to make capital investments in the semiconductor market throughout the year In the LED market, motivation to invest remained low along with drop in prices In the FPD market, almost no investments for mobile phones and TVs Demand for optical equipment in Europe slightly recovered Demand for robot manufacturers slightly decreased 3, Outlook for FY3/14 0 FY3/11 FY3/12 FY3/13 FY3/14(e) Others 36% Sales by category PV 8% FPD 12% Semi-conductor 35% LED 9% In the FPD market, investments in large LCD for TV, small-and-midsized high-definition LCD for mobile phone and organic EL manufacturing equipment in China are expected In the semiconductor market, major companies start making investments again Gradual recovery is expected from the middle of the 1st half to the 2nd half European market remains flat Show signs of gradual recovery in demand for robot manufacturers Measures Start receiving orders for chambers for general industry Boost demand for contracted equipment sub-assembly products Provision of engineering after-sales services 15 Others: Aero, Medical, Science etc


16 Status and Outlook for Quartz Products (m ) 10,000 8,000 6,000 4,000 2, ,501 LED 8% Transition of sales FY3/11 FY3/12 FY3/13 FY3/14(e) PV 5% LCD 0% End user 26% 5,509 Others 5% 3,420 Sales by category OEM 56% 4, Status of FY3/13 End to decreased orders due to customers operating rates (slow moving inventory due to sluggish DRAM) throughout the year Decrease in domestic and major US OEM customers orders led to contraction of production For the LED market, pressure on request for price reduction due to intensifying price competition Orders decreased because Asian companies postponed their reinvestments 2. Outlook for FY3/14 Low until earlier in the first half of the year but then recovers Orders from major OEM customers in the US recover Expect increase in orders due to reinvestments by domestic and Asian companies Expect to remain flat in the LED market Measures Increase production in China to reduce costs Chinese factories of the US and Taiwanese companies are probable customers; aim for increase in sales in collaboration with Ferrotec Cleaning business Speeding up of obtaining approvals for high-purity products Strengthening of marketing in the Taiwanese market, quick delivery, stable product quality, customize 16
 MC(Machinable Ceramics) 1.")
17 Status and Outlook for Ceramics Products 17 (m ) 6,000 5,000 4,000 3,000 2,000 1,000 0 FC Export 11% FC Semiconduct or Equipment 28% 3,819 FY3/11 FY3/12 FY3/13 FY3/14(e) FC Others 12% Transition of sales 4,507 Sales by category 4,108 4,350 MC Semiconduct or testing 29% MC Japan MC Export 12% 8% FC(Fine Ceramics) MC(Machinable Ceramics) 1. Status of FY 3/13 Machinable Ceramics (Photoveel) Memory (N/Flash) and non-memory (Logic) were both driven by booming demand for mobile device resulting in substantial increase in the 1st half due mainly to the contributions from Japanese, Korean and Taiwanese manufacturers. Entered into an inventory adjustment phase in the 2nd half. Expanded the new use of general MC for organic EL panel (OELD) manufacturing equipment Fine Ceramics Has been moving toward moderate recovery since the end of 2011 due to investments in miniaturization by major semiconductor manufacturers in the world. However, deep cuts in mobile device production led to slowdown in companies investments. As a result, order situation since summer remained severe. Achieved sales increase as a result of big increase in export share mainly for the US 2.Outlook for FY 3/14 Machinable Ceramics (Photoveel) Although inventory adjustments of mobile devices since last year has been completed, actual demand remains sluggish. Increase in demand for the new mobile hand set model from the 1st half is expected. It is the dawn of the battle among mobile devices and request for price reduction will be even more severe General MC is actively expanding medical equipment-related sales in Japan, the US and Europe. Now working toward the realization of adopting newly developed products in Japan Fine Ceramics Investments in miniaturization mainly in Taiwan started again as well in some factories in Japan this spring. Orders are on a recovery trend since the beginning of the year and further investments in miniaturization are expected. For exports, achieved significant results in expanding sales mainly for the US and now developing European market 3.Continued sales policy Cultivate new customers of wafer circuit inspection tools and expand use Continue with marketing activities to develop new customers and new use in the European market in addition to the US and Asian markets For both the FC and MC, expand sales by developing new materials and strengthen competitiveness of sales
 EB Deposition Equipment Semiconductor Wafer : 1. Status of FY 3/13 Semiconductor market worsened rapidly from the 2nd half.")
18 Status and Outlook for Semiconductor Wafer and Deposition Equipment (m ) 8,000 6,000 4,000 2,000 0 (m ) 8,000 Transition of sales Semiconductor wafer 4,999 4,641 4,027 3,930 FY3/11 FY3/12 FY3/13 FY3/14(e) EB Deposition Equipment Semiconductor Wafer : 1. Status of FY 3/13 Semiconductor market worsened rapidly from the 2nd half. Struggled in the sluggish market and inventory adjustments but sales remained flat. Own brand: Newly obtained approval in Korea Boosted crystal and CVD to expand own brand 2. Outlook for FY3/14 The market condition recovers in general and own brand in particular is expected to expand The Japanese market is expected to remain sluggish Increase the variety of wafers and expect to increase sales to meet customer needs Measures Establish a system corresponding to the expansion of mass production Upgrade facilities and establish a system for services including technology and quality 6,000 EB Deposition Equipment: 4,000 4,122 4,078 2,724 3, Status of FY 3/13 Remained flat due to the completion of LED investment; there was a demand for transmitter chip for mobile phones 2, Outlook for FY 3/14 Remain flat and demand is expected to recover from the 2nd half 18 0 FY3/11 FY3/12 FY3/13 FY3/14(e) Measures Focus on optical market and start taking orders Announce new models which improved the yield greatly
19 Electronic Device Segment Sales ( in million) 8,000 6,917 others 6, , ,563 5, Ferrofluid,SMT, others 4, ,442 2,000 4,933 4,126 4,764 Thermo-electric module 0 FY3/11 FY3/12 FY3/13 FY3/14(e) 19

 Sales by category Power device substrates 0% Others 2% Automobile 67% 2.")
20 Status and Outlook for Thermo-electric Module Products (m ) 8,000 6,000 4,000 6,442 Transition of sales 4,933 4,126 4, Status of FY 3/13 Automobile Seat Application Almost as planned Other Application Medical, biotech equipment, semiconductor and optics applications were strong Sales fell short due to the effect of sluggish demand for consumer use Struggled with semiconductor use due to sluggish demand in the 2nd half 20 2,000 0 Science 3% Optical commubicat ion 5% Biochemical 7% Consumer 7% Photology 4% Semiconduc tor 5% FY3/11 FY3/12 FY3/13 FY3/14(e) Sales by category Power device substrates 0% Others 2% Automobile 67% 2. Outlook for FY 3/14 Automobile Seat Application New models will be launched and expect to increase Other Application Consumer equipment, biotech equipment, semiconductor and optics applications are strong Newly adopt electric shaver, water purifier, etc. and expect increase Release power device substrates and quickly obtain approval Measures Focus on expanding share of the US and Chinese optical communications markets Strengthen marketing targeting the US and expand highly functional market Promote automation of production line aiming to cut fixed cost

 Quartz crucibles PV manufacturing")
21 Photovoltaic-related Segment Sales ( in million) 35,000 30,000 27,357 Solar cell & Others 25,000 21,150 2,091 Solar silicon 20,000 15,000 10,000 5, ,510 6,185 7,420 12,345 4,887 11,173 3,654 1, ,509 12,959 6,268 9,801 2,709 3,952 2, FY3/11 FY3/12 FY3/13 FY3/14(e) Quartz crucibles PV manufacturing Equip. 21

 2.")

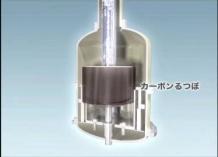
22 Status and Outlook for PV Manufacturing Equip. (m ) Transition of sales 1. Status of FY3/13 15,000 12,000 9,801 12,959 The market remained sluggish resulting in sharp decrease in orders for equipment Number of inquiries also decreased except for R&D use 9,000 Excessive production capacity drove the price down and the entire industry suffered damage 6,000 3, , FY3/11 FY3/12 FY3/13 FY3/14(e) 2. Outlook for FY3/14 Orders for PV equipment not expected Shift to equipment for general industry and maintain production facilities Measures Multi crystal silicon casting furnaces Pct. Of sales In the PV segment FY3/13 PV manufacturi ng equip. 18% Horizontal development using core technologies including glass processing machine, general-purpose polishing machine and core drill Order activities eying the relaunch of the original CMS business Further streamline management Single crystal silicon growing furnaces 22 Block Cutting

 Pct.")
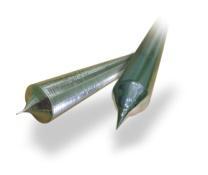
23 Status and Outlook for Quartz Crucibles (m ) Transition of sales 1. Status of FY3/13 8,000 6,000 4,000 3,654 4,887 2,709 3,952 Crucibles and vessels were weak throughout the year Shifted PV application to Yinchuan factory and secured price competitiveness Customers operating rates decreased by more than half and production adjustment continues Started handling semiconductor use and started obtaining customers approvals 2, Outlook for FY3/14 0 FY3/11 FY3/12 FY3/13 FY3/14(e) Pct. Of sales In the PV segment Pressure on price reduction continues although demand for PV application hits bottom Prices will drop but quantity is expected to increase Expected to gradually raise the ratio of semiconductor use Vessels for multi-crystal are expected to expand due to the withdrawal of competitors Single-crystal quartz crucible FY3/13 Quartz crucibles 22% Measures Differentiate from competitors through the approval of prolonged heat resistant products Reduce costs by recycling raw materials at the Yinchuan factory and through scouring process Quickly receive approval of 8-inch for semiconductor to increase market share 23 Multi-crystal vessel
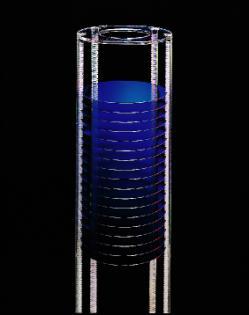
24 Status and Outlook for Solar Silicon (m ) Transition of sales 1. Status of FY3/13 10,000 7,500 6,185 7,420 5,509 6,268 Further deterioration in market condition resulted in withdrawal from own products Almost completed posting valuation loss due to a drop in raw material poly-silicon price Booming demand in China, US and Japan. Declined in Europe 5, Outlook for FY3/14 2,500 0 FY3/11 FY3/12 FY3/13 FY3/14(e) Pct. Of sales In the PV segment Shift to OEM, demand is expected to be relatively strong. Consumers demand high conversion efficiency and low-cost products Demand stagnated in Europe but demand in emerging countries including India, Eastern Europe, the Middle East and South America emerge; Booming demand in Japan, China and the US. Price is expected to be at the current level FY3/13 Measures Single crystal ingot Multi- crystal ingot Manufacture crystals at the Yinchuan factory and reduce costs Expansion of OEM customers Differentiate through fixed abrasive cutting wafer Secure OEM orders for N-type products 24 PV wafer Solar silicon 45%
25 Reference Materials
26 Corporate Data Corporate Name Ferrotec Corporation Date of Foundation September 27, 1980 A d d r e s s Nihonbashi Plaza Building, 2-3-4, Nihonbashi, Chuo-ku, Tokyo Japan L i s t e d JASDAQ (Listed Code:6890) P r e s i d e n t Akira Yamamura Business Segment Equipment-related business : Vacuum Feedthrough, Quartz, Ceramics, silicon, wafer processing PV-related business : PV manufacturing equip, Quartz crucibles, solar silicon Electronic device business : thermo-electric module, Ferrofluid C a p i t a l 13,101,346 thousand JPY I s s u e d S t o c k 30,903,702 Related Company 24 Consolidated Subsidiary 5 Companies Accounted for by the Equity Method 26 E m p l o y e e s Consolidated 4,920 Non-consolidated 184


27 History 1980~ Started manufacturing and selling products using ferrofluids (computer seals, vacuum feedthroughs) Vacuum Feedthroughs 1990~ 92 Started manufacturing and selling thermomodules and modules in China 98 Started manufacturing and selling quartz products for the semiconductor industry Thermo-electric module Quartz 2000~ 02 Started contract manufacturing service business for silicon wafer processing, machine tool production and other activities (Shanghai factory) 05 Started photovoltaic products business; started manufacturing and selling machinery and crucibles for manufacturing silicon ingots and crystals 08 Started manufacturing and selling ceramic products Ingot Single crystal silicon growing furnaces Machinable Ceramics With a core of ferrofluid expertise ~ Ferrotec s core Technology ~ Establishing operations in other countries 91: Established subsidiary in Massachusetts, USA 92: Established subsidiary in Hangzhou, China 95: Established subsidiary in Shanghai, China 97: Established subsidiary in Singapore 99: Started operations in North America and Europe by acquiring Ferrofluidics Building a new profit structure 02: Started contract manufacturing service (CMS) business at the Shanghai factory, including silicon wafer processing, machine tool production and other activities Expertise in production technologies extending from component processing to final assembly allowed Ferrotec to start the CMS business 05 : Increased manufacturing and sales activities for photovoltaic products in Hangzhou, China 27
28 Sales and Operating Income Trend Sales Trend Operating income Trend ( in millions) ( in millions) Equipment related Electronic device PV Others Equipment related Electronic device PV Others 57,880 2,117 60,088 2,509 6, ,475 4,124 31,541 5,389 10,579 21,151 6,917 27,357 5,337 38,424 2,648 12,345 4, , ,165 3, ,499 3, ,750 11,822 27,693 24,883 18,867 3,934 8 FY3/10 FY3/11 FY3/12 FY3/13 FY3/10 FY3/11 FY3/12 FY3/13 31
Ferrotec Corporation Results for the 1 st half of the fiscal year ended March 31, 2014
 Ferrotec Corporation Results for the 1 st half of the fiscal year ended March 31, 2014 November 27, 2013 (JASDAQ 6890) http://www. ferrotec. co. jp/ 1. This 1st half results cover six months period from
Ferrotec Corporation Results for the 1 st half of the fiscal year ending March 31, 2016
 Ferrotec Corporation Results for the 1 st half of the fiscal year ending March 31, 2016 November 26, 2015 (JASDAQ 6890) http://www. ferrotec. co. jp/ 1. This 1st half results cover six months period from
Ferrotec Corporation Results for the 1 st half of the fiscal year ended March 31, 2012
 Ferrotec Corporation Results for the 1 st half of the fiscal year ended March 31, 2012 November 24, (JASDAQ 6890) http://www. ferrotec. co. jp/ 1. This 1st half results cover six months period from April
Ferrotec Holdings Corporation Results for the fiscal year ended March 31, 2018
 Ferrotec Holdings Corporation Results for the fiscal year ended March 31, 2018 May 28, 2018 ( JASDAQ 6890 ) http://www.ferrotec.co.jp/ 1.This fiscal year results cover twelve months period from April to
Ferrotec Holdings Corporation
 6890 TSE JASDAQ Analyst Noboru Terashima Index Summary----------------------------------------------------------------------------------------------------------------------------------------------------------------------------
Consolidated financial results for the first quarter of Fiscal 2009
 MARUWA CO., LTD. 3-83, Minamihonjigahara-cho, Owariasahi-city, Aichi-pref., 488-0044 JAPAN 7 August Consolidated financial results for the first quarter of Fiscal 2009 MARUWA CO., LTD. today announced
Financial Report for the 9-month Period Ended September 30, 2011 (Consolidated - Japanese Standards)
") November 4, 2011 Financial Report for the 9-month Period Ended September 30, 2011 (Consolidated - Japanese Standards) Company name: DAITO ELECTRON CO., LTD. Stock exchange listing: 1st Sections of the
November 4, 2011 Financial Report for the 9-month Period Ended September 30, 2011 (Consolidated - Japanese Standards) Company name: DAITO ELECTRON CO., LTD. Stock exchange listing: 1st Sections of the
Business Results: Review of Operations for Fiscal 2016
 Financial Data/Corporate Information Business Results: Review of Operations for Fiscal 216 Business results for Fiscal 216 In the electronics market in which the ULVAC Group operates, trends toward more
Consolidated Financial Review for the Third Quarter Ended December 31, 2015
 Jan 29, 2016 Consolidated Financial Review for the Third Quarter Ended December 31, 2015 Company name: Tokyo Electron Limited URL: http://www.tel.com Telephone number: (03) 5561-7000 Stock exchange listing:
Consolidated Financial Review for the Second Quarter Ended September 30, 2015
 Oct 27, 2015 Consolidated Financial Review for the Second Quarter Ended September 30, 2015 Company name: Tokyo Electron Limited URL: http://www.tel.com Telephone number: (03) 5561-7000 Stock exchange listing:
CONSOLIDATED FINANCIAL RESULTS for the Second Quarter of the Year Ending December 31, 2018 (Unaudited) <under Japanese GAAP>
 <under Japanese GAAP>") Translation Notice: This English version is a translation of the original disclosure in Japanese released on July 30, 2018 at 15:00 (GMT+9) and is only for reference purposes. In the case where any differences
Translation Notice: This English version is a translation of the original disclosure in Japanese released on July 30, 2018 at 15:00 (GMT+9) and is only for reference purposes. In the case where any differences
CONSOLIDATED FINANCIAL REPORT FOR THE SECOND QUARTER ENDED SEPTEMBER 30, 2012 [Japanese GAAP]
![CONSOLIDATED FINANCIAL REPORT FOR THE SECOND QUARTER ENDED SEPTEMBER 30, 2012 [Japanese GAAP]](/thumbs/85/92763399.jpg "CONSOLIDATED FINANCIAL REPORT FOR THE SECOND QUARTER ENDED SEPTEMBER 30, 2012 [Japanese GAAP]") November 5, 2012 Dainippon Screen Mfg. Co., Ltd. Tenjinkita-machi 1-1, Teranouchi-agaru 4-chome, Horikawa-dori, Kamigyo-ku, Kyoto 602-8585, Japan CONSOLIDATED FINANCIAL REPORT FOR THE SECOND QUARTER ENDED
November 5, 2012 Dainippon Screen Mfg. Co., Ltd. Tenjinkita-machi 1-1, Teranouchi-agaru 4-chome, Horikawa-dori, Kamigyo-ku, Kyoto 602-8585, Japan CONSOLIDATED FINANCIAL REPORT FOR THE SECOND QUARTER ENDED
Consolidated Financial Results for the Six Months Ended November 30, 2012 [Japanese GAAP]
![Consolidated Financial Results for the Six Months Ended November 30, 2012 [Japanese GAAP]](/thumbs/92/110389493.jpg "Consolidated Financial Results for the Six Months Ended November 30, 2012 [Japanese GAAP]") Translation Member of the Financial Accounting Standards Foundation January 11, 2013 Consolidated Financial Results for the Six Months Ended November 30, 2012 [Japanese GAAP] Listed company name: Toyo
Translation Member of the Financial Accounting Standards Foundation January 11, 2013 Consolidated Financial Results for the Six Months Ended November 30, 2012 [Japanese GAAP] Listed company name: Toyo
Consolidated Financial Results for the Six Months ended November 30, 2009
 Translation Member of the Financial Accounting Standards Foundation Consolidated Financial Results for the Six Months ended January 13, 2010 Listed company name: Toyo Tanso Co., Ltd. Stock exchange listing:
Consolidated Financial Results for 3Q FY2018
 Consolidated Financial Results for 3Q FY2018 February 1, 2019 Fuji Electric Co., Ltd. 2019 Fuji Electric Co., Ltd. All rights reserved. 1 Summary of Consolidated Financial Results for (Apr. - Dec.) FY2018
Operating Results and Financial Position (for the fiscal year ended March 31, 2011)
") SHIMADZU CORPORATION IR Group Corporate Strategy Planning Department 1 Nishinokyo-Kuwabaracho, Nakagyo-ku Kyoto 604-8511 Japan http://www.shimadzu.com/ Tel: +81 75-823-1128 May 10, 2011 Operating Results
SHIMADZU CORPORATION IR Group Corporate Strategy Planning Department 1 Nishinokyo-Kuwabaracho, Nakagyo-ku Kyoto 604-8511 Japan http://www.shimadzu.com/ Tel: +81 75-823-1128 May 10, 2011 Operating Results
Consolidated Financial Review for the First Quarter Ended June 30, 2008
 Consolidated Financial Review for the First Quarter Ended June 30, 2008 Company name: URL: http://www.tel.com Telephone number: (03) 5561-7000 Stock exchange listing: Tokyo Stock Exchange 1st Section Code
Report of Consolidated Financial Results For the Six Months Ended September 30, 2004
 October 22, 2004 Report of Consolidated Financial Results For the Six Months Ended September 30, 2004 Registered Stock Listings: Tokyo, Osaka Company Name: Hitachi High-Technologies Corporation Code No:
Results of Operations Half Year Ended September 30, 2009 KITO CORPORATION. TSE 1 st Section
 Results of Operations Half Year Ended September 30, 2009 KITO CORPORATION TSE 1 st Section November 19, 2009 Content 1. First Half of FY 2010 Financial Results 2. Second Half of FY 2010 Financial Outlook
Final Results for Fiscal 2009
 MARUWA CO., LTD. 3-83, Minamihonjigahara-cho, Owariasahi-city, Aichi-pref., 488-0044 JAPAN 8 May 2009 Final Results for Fiscal 2009 MARUWA CO., LTD. today announced its consolidated business results for
Summary of Kobe Steel's Consolidated Financial Results for Fiscal 2007 (April 1, 2007 March 31, 2008)
") Kobe Steel, Ltd. Tokyo, Japan Tokyo Stock Exchange No. 5406 April 25, 2008 Summary of Kobe Steel's Consolidated Financial Results for Fiscal 2007 (April 1, 2007 March 31, 2008) TOKYO, April 25, 2008 Kobe
Kobe Steel, Ltd. Tokyo, Japan Tokyo Stock Exchange No. 5406 April 25, 2008 Summary of Kobe Steel's Consolidated Financial Results for Fiscal 2007 (April 1, 2007 March 31, 2008) TOKYO, April 25, 2008 Kobe
Performance Summary. Copyright 2018 Harmonic Drive Systems Inc.
 Performance Summary 2 1st-half consolidated results (versus original forecasts for the period) Original forecasts (announced May 11) 1st-half FY ending Mar.31,2019 Vs. original forecasts for the period
FY09 Summary of Financial Results (Consolidated) April 30, 2010
 April 30, 2010") FY09 Summary of Financial Results (Consolidated) April 30, 2010 Company Name Wacom Co., Ltd. (Code Number: 6727 TSE1) (URL http://www.wacom.co.jp) Representative: Masahiko Yamada, CEO TEL: 03-5309-1500
FY09 Summary of Financial Results (Consolidated) April 30, 2010 Company Name Wacom Co., Ltd. (Code Number: 6727 TSE1) (URL http://www.wacom.co.jp) Representative: Masahiko Yamada, CEO TEL: 03-5309-1500
CONSOLIDATED FINANCIAL REPORT FOR THE FISCAL YEAR ENDED MARCH 31, 2018 [Japanese GAAP]
![CONSOLIDATED FINANCIAL REPORT FOR THE FISCAL YEAR ENDED MARCH 31, 2018 [Japanese GAAP]](/thumbs/90/103479331.jpg "CONSOLIDATED FINANCIAL REPORT FOR THE FISCAL YEAR ENDED MARCH 31, 2018 [Japanese GAAP]") May8,2018 SCREEN Holdings Co., Ltd. Tenjinkita-machi 1-1, Teranouchi-agaru 4-chome, Horikawa-dori, Kamigyo-ku, Kyoto 602-8585, Japan CONSOLIDATED FINANCIAL REPORT FOR THE FISCAL YEAR ENDED MARCH 31, 2018
May8,2018 SCREEN Holdings Co., Ltd. Tenjinkita-machi 1-1, Teranouchi-agaru 4-chome, Horikawa-dori, Kamigyo-ku, Kyoto 602-8585, Japan CONSOLIDATED FINANCIAL REPORT FOR THE FISCAL YEAR ENDED MARCH 31, 2018
Consolidated Financial Review for the Year Ended March 31, 2013
 Consolidated Financial Review for the Year Ended April 30, 2013 Company name: Tokyo Electron Limited URL: http://www.tel.com Telephone number: (03) 5561-7000 Stock exchange listing: Tokyo Stock Exchange
17,456 28,730 (39.2) Net income (million yen) 10,175 14,691 (30.7) Net income per share (yen) Diluted net income per share (yen)
 Net income (million yen) 10,175 14,691 (30.7) Net income per share (yen) Diluted net income per share (yen)") Hitachi Metals, Ltd. (Jan. 30, 2013) http://www.hitachi-metals.co.jp 1-2-1 Shibaura, Minato-ku, Tokyo Consolidated Financial Report for the 9-month period ended December 31, 2012 Contact: Kazutsugu Kamatani,
Hitachi Metals, Ltd. (Jan. 30, 2013) http://www.hitachi-metals.co.jp 1-2-1 Shibaura, Minato-ku, Tokyo Consolidated Financial Report for the 9-month period ended December 31, 2012 Contact: Kazutsugu Kamatani,
Consolidated Financial Review for the First Quarter Ended June 30, 2016
 Consolidated Financial Review for the First Quarter Ended June 30, 2016 Company name: Tokyo Electron Limited URL: http://www.tel.com Telephone number: (03) 5561-7000 Stock exchange listing: Tokyo Stock
CONSOLIDATED FINANCIAL STATEMENTS FOR THE FISCAL YEAR ENDED 31 MARCH 2013
 Page 1/17 CONSOLIDATED FINANCIAL STATEMENTS FOR THE FISCAL YEAR ENDED 31 MARCH 2013 10 May 2013 Financial Highlights For the fiscal year ended 31 March 2013 (FY2012) FY2012 FY2011 Thousands of US dollars
TOKYO ELECTRON Summary of Consolidated Financial Results for the Second Quarter Ended September 30, 2018 (Japanese GAAP) October 31, 2018 Name of List
 October 31, 2018 Name of List") Summary of Consolidated Financial Results for the Second Quarter Ended September 30, 2018 (Japanese GAAP) October 31, 2018 Name of Listed Company: Tokyo Electron Limited Stock Exchange Listing: Tokyo Security
Summary of Consolidated Financial Results for the Second Quarter Ended September 30, 2018 (Japanese GAAP) October 31, 2018 Name of Listed Company: Tokyo Electron Limited Stock Exchange Listing: Tokyo Security
CITIZEN HOLDINGS CO., LTD.
 Consolidated Financial Statements for the Six Months Ended September 30, 2015 These financial statements have been prepared for reference only in accordance with accounting principles and practices generally
CONSOLIDATED FINANCIAL REPORT FOR THE THIRD QUARTER ENDED DECEMBER 31, 2012 [Japanese GAAP]
![CONSOLIDATED FINANCIAL REPORT FOR THE THIRD QUARTER ENDED DECEMBER 31, 2012 [Japanese GAAP]](/thumbs/82/85693640.jpg "CONSOLIDATED FINANCIAL REPORT FOR THE THIRD QUARTER ENDED DECEMBER 31, 2012 [Japanese GAAP]") February 8, 2013 Dainippon Screen Mfg. Co., Ltd. Tenjinkita-machi 1-1, Teranouchi-agaru 4-chome, Horikawa-dori, Kamigyo-ku, Kyoto 602-8585, Japan CONSOLIDATED FINANCIAL REPORT FOR THE THIRD QUARTER ENDED
February 8, 2013 Dainippon Screen Mfg. Co., Ltd. Tenjinkita-machi 1-1, Teranouchi-agaru 4-chome, Horikawa-dori, Kamigyo-ku, Kyoto 602-8585, Japan CONSOLIDATED FINANCIAL REPORT FOR THE THIRD QUARTER ENDED
Final Results for Fiscal 2010
 MARUWA CO., LTD. 3-83, Minamihonjigahara-cho, Owariasahi-city, Aichi-pref., 488-0044 JAPAN 27 Apr. 2010 Final Results for Fiscal 2010 MARUWA CO., LTD. today announced its consolidated business results
Operating Results and Financial Position For the Six Months ended September 30, 2012
 SHIMADZU CORPORATION IR Group, Corporate Strategy Planning Department 1 Nishinokyo-Kuwabaracho, Nakagyo-ku, Kyoto 604-8511, Japan http://www.shimadzu.com/ Tel: +81 75-823-1128 November 8, 2012 Operating
NAGASE & CO., LTD. Contents. 1. FYE March 2015 Results P FYE March 2016 Earnings Projections P. 13. Management Plan P. 19
 NAGASE & CO., LTD. Contents 1. FYE March 2015 Results P. 3 2. FYE March 2016 Earnings Projections P. 13 3. Mid-Term Management Plan Overview/Long-Term Management Plan P. 19 4. (Reference) Information by
Summary of Consolidated Financial Results for the First Half Ended September 30, 2008
 Head Office : 8-1 Nihonbashi Odenmacho, Chuo-ku, Tokyo, Japan Code No. : 7537 (URL http://www.marubun.co.jp) Contact : Corporate Planning Dept., Phone +81-3-3639-3010, Fax +81-3-5644-7693 November 7, 2008
Consolidated Financial Results of Kyocera Corporation and its Subsidiaries for the Nine Months Ended December 31, 2016
 Consolidated Financial Results of Kyocera Corporation and its Subsidiaries for the Nine Months Ended December 31, 2016 The consolidated financial information is prepared in accordance with accounting principles
Final Results for Fiscal Year
 MARUWA CO., LTD. 3-83, Minamihonjigahara-cho, Owariasahi-city, Aichi-pref., 488-0044 JAPAN 15 May 2013 Final Results for Fiscal Year 2012-2013 MARUWA CO., LTD. has announced its consolidated business results
Operating Results. Financial Review. Business Overview. Net Sales
 Financial Review Panasonic has begun applying International Financial Reporting Standards (IFRS) on a voluntary basis as of the fiscal year ended March 217. Financial figures for previous consolidated
Q2 FY2018 (July - September 2017) Financial Announcement
 Financial Announcement") FY218 (July - September 217) Financial Announcement October 31, 217 Agenda: FY218 Consolidated Financial Summary Tetsuro Hori, Representative Director, CFO, Executive Vice President Business Environment
FY218 (July - September 217) Financial Announcement October 31, 217 Agenda: FY218 Consolidated Financial Summary Tetsuro Hori, Representative Director, CFO, Executive Vice President Business Environment
CONSOLIDATED FINANCIAL REPORT FOR THE SECOND QUARTER ENDED SEPTEMBER 30, 2017 [Japanese GAAP]
![CONSOLIDATED FINANCIAL REPORT FOR THE SECOND QUARTER ENDED SEPTEMBER 30, 2017 [Japanese GAAP]](/thumbs/77/74666358.jpg "CONSOLIDATED FINANCIAL REPORT FOR THE SECOND QUARTER ENDED SEPTEMBER 30, 2017 [Japanese GAAP]") October 31, 2017 SCREEN Holdings Co., Ltd. Tenjinkita-machi 1-1, Teranouchi-agaru 4-chome, Horikawa-dori, Kamigyo-ku, Kyoto 602-8585, Japan CONSOLIDATED FINANCIAL REPORT FOR THE SECOND QUARTER ENDED SEPTEMBER
October 31, 2017 SCREEN Holdings Co., Ltd. Tenjinkita-machi 1-1, Teranouchi-agaru 4-chome, Horikawa-dori, Kamigyo-ku, Kyoto 602-8585, Japan CONSOLIDATED FINANCIAL REPORT FOR THE SECOND QUARTER ENDED SEPTEMBER
Consolidated Financial Results for the Fiscal Year Ended December 31, 2015 (January 1, 2015 to December 31, 2015)
") Consolidated Financial Results for the Fiscal Year Ended December 31, 2015 (January 1, 2015 to December 31, 2015) February 12, 2016 Company name: SIIX Corporation Stock code: 7613 Stock exchange listing
Consolidated Financial Results for the Fiscal Year Ended December 31, 2015 (January 1, 2015 to December 31, 2015) February 12, 2016 Company name: SIIX Corporation Stock code: 7613 Stock exchange listing
Consolidated Financial Results for the First Quarter Ended June 30, 2015
 Consolidated Financial Results for the First Quarter Ended June 30, 2015 July 31, 2015 SHARP CORPORATION Stock exchange listings: Tokyo Code number: 6753 URL: http://www.sharp.co.jp/ Representative: Kozo
FY2016 Consolidated Financial and Operating Results<JGAAP> (Overview English translation of the Japanese original) April 27, 2016
 April 27, 2016") FY2016 Consolidated Financial and Operating Results (Overview English translation of the Japanese original) April 27, 2016 Company Name: SANYO DENKI CO., LTD. Code Number: 6516 (Listed on the First
FY2016 Consolidated Financial and Operating Results (Overview English translation of the Japanese original) April 27, 2016 Company Name: SANYO DENKI CO., LTD. Code Number: 6516 (Listed on the First
Q1 FY2019 (April 1, 2018 June 30, 2018) Financial Announcement
 Financial Announcement") Q1 FY219 (April 1, 218 June 3, 218) Financial Announcement July 26, 218 Agenda: Q1 FY219 Consolidated Financial Summary Ken Sasagawa, Vice President, Accounting Dept. Business Environment and Financial
Q1 FY219 (April 1, 218 June 3, 218) Financial Announcement July 26, 218 Agenda: Q1 FY219 Consolidated Financial Summary Ken Sasagawa, Vice President, Accounting Dept. Business Environment and Financial
Consolidated Financial Results of Kyocera Corporation and its Subsidiaries for the Year Ended March 31, 2017
 Consolidated Financial Results of and its Subsidiaries for the Year Ended March 31, 2017 The consolidated financial information is prepared in accordance with generally accepted accounting principles in
Consolidated Financial Results for 1Q FY2018
 Consolidated Financial for FY2018 July 27, 2018 Fuji Electric Co., Ltd. 2018 Fuji Electric Co., Ltd. All rights reserved. 1 Summary of Consolidated Financial for FY2018 (YoY Comparison) Continuation of
FINANCIAL SUMMARY FOR THE FIRST QUARTER ENDED JUNE 30, 2009
 Company Name: ANRITSU CORPORATION (Code Number:6754) Listed at : Tokyo Stock Exchange URL http://www.anritsu.co.jp/ Representative: Hiromichi Toda ; President and Director Contact Person: Tetsuo Kawabe
Fiscal 2015 Supplementary Information May 10, 2016
 Fiscal 2015 Supplementary Information May 10, 2016 * Forward-looking statements made in this document, such as business forecasts, are based on the information available at this time and on certain premises
Interim period. 13,200 (31.3%) 37,000 (1.6%) Net income (million yen ) 7,200 (29.8%) 20,900 (5.9%) Net income per share (yen)
 37,000 (1.6%) Net income (million yen ) 7,200 (29.8%) 20,900 (5.9%) Net income per share (yen)") Hitachi Metals, Ltd. (July 28, 2011) http://www.hitachi-metals.co.jp 1-2-1 Shibaura, Minato-ku, Tokyo, Japan Consolidated Financial Report for the first quarter ended June 30, 2011 Contact: Kenichi Nishiie,
Hitachi Metals, Ltd. (July 28, 2011) http://www.hitachi-metals.co.jp 1-2-1 Shibaura, Minato-ku, Tokyo, Japan Consolidated Financial Report for the first quarter ended June 30, 2011 Contact: Kenichi Nishiie,
Note: Shareholders equity (million yen) 12/2010:198,756 3/2009: 193,423
 12/2010:198,756 3/2009: 193,423") Hitachi Metals, Ltd. (Feb. 2, 2011) http://www.hitachi-metals.co.jp 2-1 Shibaura 1-chome, Minato-ku, Tokyo Consolidated Financial Report for the 9-month period ended December 31, 2010 Contact: Kenichi
Hitachi Metals, Ltd. (Feb. 2, 2011) http://www.hitachi-metals.co.jp 2-1 Shibaura 1-chome, Minato-ku, Tokyo Consolidated Financial Report for the 9-month period ended December 31, 2010 Contact: Kenichi
MITSUBISHI GAS CHEMICAL COMPANY, INC.
 MITSUBISHI GAS CHEMICAL COMPANY, INC. Consolidated Financial Results For the Third Quarter of the Fiscal Year Ending March 31, 2010 This document has been translated from the original Japanese as a guide
February 6, Business Results Announcement for the Nine Months ended December 31, Toray Industries, Inc.
 February 6, 2009 Business Results Announcement for the Nine Months ended December 31, 2008 Toray Industries, Inc. 1 Contents I. Business Results for the Nine Months ended December 31, 2008 (Consolidated
Consolidated Financial Results for 3Q FY2017
 Consolidated Financial Results for 3Q FY2017 January 30, 2018 Fuji Electric Co., Ltd. 2018 Fuji Electric Co., Ltd. All rights reserved. 1 Summary of Consolidated Financial Results for (Apr.- Dec.) FY2017
SHINKAWA LTD. (URL
 Consolidated Financial Results for the Six Months of the Fiscal Year Ending March 31, 2019 SHINKAWA LTD. (URL https://www.shinkawa.com/) November 9, 2018 Listing First Section of Tokyo Stock Exchange Security
CITIZEN HOLDINGS CO., LTD.
 Consolidated Financial Statements for the Three Months Ended June 30, 2015 These financial statements have been prepared for reference only in accordance with accounting principles and practices generally
Other Notes Numbers of shares issued (Common stock) (i) Number of shares outstanding at end of period (Including treasury stock) Dec., ,904,35
 (i) Number of shares outstanding at end of period (Including treasury stock) Dec., ,904,35") Consolidated Financial Report [IFRS] For the 9-month period ended December 31, 2017 Listed Company: Hitachi Metals, Ltd. (URL http://www.hitachi-metals.co.jp/e/index.html) Listed Stock Exchanges: Tokyo
Consolidated Financial Report [IFRS] For the 9-month period ended December 31, 2017 Listed Company: Hitachi Metals, Ltd. (URL http://www.hitachi-metals.co.jp/e/index.html) Listed Stock Exchanges: Tokyo
Kurita Water Industries Reports Earnings for the Fiscal Year Ended March 2008
 FOR IMMEDIATE RELEASE Kurita Water Industries Reports Earnings for the Fiscal Year Ended March 2008 Tokyo, Japan, April 30, 2008 Kurita Water Industries Ltd. (TSE Security Code 6370) announced net sales
Kobe Steel's Consolidated Financial Results for First Quarter Fiscal 2012 (April 1 June 30, 2012)
") Kobe Steel's Consolidated Financial Results for First Quarter Fiscal 2012 (April 1 June 30, 2012) July 30, 2012 Company name: Kobe Steel, Ltd. Code number: 5406 Stock exchanges where shares are listed:
Kobe Steel's Consolidated Financial Results for First Quarter Fiscal 2012 (April 1 June 30, 2012) July 30, 2012 Company name: Kobe Steel, Ltd. Code number: 5406 Stock exchanges where shares are listed:
Consolidated Summary Report for the First Quarter of Fiscal Year Ending March 2009 Jul 29, 2008
 Member of the Financial Accounting Standards Foundation Consolidated Summary Report for the First Quarter of Fiscal Year Ending March 2009 Jul 29, 2008 Company Name: Kenwood Corporation (Code Number: 6765,
Consolidated Financial Results for the First Three Quarters of the Fiscal Year Ending March 31, 2018 [Japan GAAP]
![Consolidated Financial Results for the First Three Quarters of the Fiscal Year Ending March 31, 2018 [Japan GAAP]](/thumbs/84/89184755.jpg "Consolidated Financial Results for the First Three Quarters of the Fiscal Year Ending March 31, 2018 [Japan GAAP]") Consolidated Financial Results for the First Three Quarters of the Fiscal Year Ending March 31, 2018 [Japan GAAP] Prepared in accordance with accounting principles generally accepted in Japan Translated
Consolidated Financial Results for the First Three Quarters of the Fiscal Year Ending March 31, 2018 [Japan GAAP] Prepared in accordance with accounting principles generally accepted in Japan Translated
Note: Shareholders equity (9/2012 : 224,563 million yen 3/2012 : 220,282 million yen )
") Hitachi Metals, Ltd. (Oct. 25, 2012) http://www.hitachi-metals.co.jp 1-2-1 Shibaura, Minato-ku, Tokyo Consolidated Financial Report for the 6-month period ended September 30, 2012 Contact: Kazutsugu Kamatani,
Hitachi Metals, Ltd. (Oct. 25, 2012) http://www.hitachi-metals.co.jp 1-2-1 Shibaura, Minato-ku, Tokyo Consolidated Financial Report for the 6-month period ended September 30, 2012 Contact: Kazutsugu Kamatani,
Financial Results of the First Half ended September 30, 2009
 Financial Results of the First Half ended September 30, 2009 November 5, 2009 Company name: NIKON CORPORATION Code number: 7731; Stock listing: Tokyo Stock Exchange URL http://www.nikon.co.jp/ Representative:
Consolidated Business Results and Forecast. May 15, 2009 NSK Ltd.
 FINANCIAL IAL CONFERENCE Consolidated Business Results and Forecast May 15, 29 NSK Ltd. Cautionary Statements with Respect to Forward-Looking Statements Statements made in this report with respect to plans,
No change. Million yen
 November 9, 2012 Consolidated Cumulative 3rd quarter Financial Results for the Fiscal Year Ended December 31, 2012 (January 1, 2012 to September 30, 2012) Company name: SIIX Corporation Stock code: 7613
Kobe Steel's Consolidated Financial Results through the Third Quarter of Fiscal 2012 (April 1 December 31, 2012)
") Kobe Steel's Consolidated Financial Results through the Third Quarter of Fiscal 2012 (April 1 December 31, 2012) February 1, 2013 Company name: Kobe Steel, Ltd. Code number: 5406 Stock exchanges where
Kobe Steel's Consolidated Financial Results through the Third Quarter of Fiscal 2012 (April 1 December 31, 2012) February 1, 2013 Company name: Kobe Steel, Ltd. Code number: 5406 Stock exchanges where
CONSOLIDATED RESULTS FOR THE FIRST QUARTER ENDED MARCH 31, 2008
 CONSOLIDATED RESULTS FOR THE FIRST QUARTER ENDED MARCH 31, April 24, CONSOLIDATED RESULTS (Millions of yen, thousands of U.S. dollars, except per share amounts) Actual Change(%) March 31, 2007 (Unaudited)
Financial Results For the Fiscal Year 2016 ending January 31, 2016
 Financial Results For the Fiscal Year 2016 ending January 31, 2016 March 16, 2016 Balance Sheets (Consolidated) Thousands of Yen 31 Jan., 2016 Assets Current assets: Cash & Cash equivalents 1,984,469 Accounts
Analyst and Investor Briefing on the First Quarter of the Fiscal Year Ending March 31, 2010 (FY2010.3) July 31, 2009 YAMAHA CORPORATION
 July 31, 2009 YAMAHA CORPORATION") Analyst and Investor Briefing on the First Quarter of the Fiscal Year Ending March 31, 2010 () July 31, 2009 YAMAHA CORPORATION Overview of Performance in the First Quarter First quarter sales and operating
Analyst and Investor Briefing on the First Quarter of the Fiscal Year Ending March 31, 2010 () July 31, 2009 YAMAHA CORPORATION Overview of Performance in the First Quarter First quarter sales and operating
Operating income ( million) (%)
 (%)") Summary Consolidated Financial Statements for the First Quarter of the Fiscal Year Ending March 31, 2005 July 29, 2004 These financial statements have been prepared for reference only in accordance with
Summary Consolidated Financial Statements for the First Quarter of the Fiscal Year Ending March 31, 2005 July 29, 2004 These financial statements have been prepared for reference only in accordance with
3. Forecasts for Year ending March 31, 2017 (From April 1, 2016 to March 31, 2017) (Percentage represents comparison to previous fiscal year) 4. Other
 (Percentage represents comparison to previous fiscal year) 4. Other") November 8, 2016 Consolidated Financial Results of the First Half ended September 30, 2016 (Japanese Standards) Company name: NIKON CORPORATION Code number: 7731; Stock listings: Tokyo Stock Exchange URL
November 8, 2016 Consolidated Financial Results of the First Half ended September 30, 2016 (Japanese Standards) Company name: NIKON CORPORATION Code number: 7731; Stock listings: Tokyo Stock Exchange URL
Operating and Financial Review
 Operating and Financial Review Scope of Consolidation and Number of Employees In fiscal 216, the year ended March 31, 217, the total number of consolidated subsidiaries and affiliates decreased by 3 to
1Q FY2016 (April 1, 2015 June 30, 2015) Financial Announcement
 Financial Announcement") FY216 (April 1, 215 June 3, 215) Financial Announcement Agenda: Introduction Tetsuro Higashi, Representative Director, President & CEO FY216 Consolidated Financial Summary Tetsuro Hori, Corporate Director,
FY216 (April 1, 215 June 3, 215) Financial Announcement Agenda: Introduction Tetsuro Higashi, Representative Director, President & CEO FY216 Consolidated Financial Summary Tetsuro Hori, Corporate Director,
FY2018 Consolidated Financial and Operating Results <IFRS> (Overview English translation of the Japanese original) April 26, 2018
 April 26, 2018") FY2018 Consolidated Financial and Operating Results (Overview English translation of the Japanese original) April 26, 2018 Company Name: SANYO DENKI CO., LTD. Code Number: 6516 (Listed on the First
FY2018 Consolidated Financial and Operating Results (Overview English translation of the Japanese original) April 26, 2018 Company Name: SANYO DENKI CO., LTD. Code Number: 6516 (Listed on the First
Operating Results and Financial Position (for the Nine Months ended December 31, 2011)
") SHIMADZU CORPORATION IR Group Corporate Strategy Planning Department 1 Nishinokyo-Kuwabaracho, Nakagyo-ku Kyoto 604-8511 Japan http://www.shimadzu.com/ Tel: +81 75-823-1128 February 10, 2012 Operating
SHIMADZU CORPORATION IR Group Corporate Strategy Planning Department 1 Nishinokyo-Kuwabaracho, Nakagyo-ku Kyoto 604-8511 Japan http://www.shimadzu.com/ Tel: +81 75-823-1128 February 10, 2012 Operating
YASKAWA Electric Corporation (TSE 6506)
") YASKAWA Electric Corporation (TSE 6506) FY2007 Financial Results (Summary) (Ended March 20, 2008) FY2008 Forecast and Measures (Summary) (Ending March 20, 2009) Presented by Koji Toshima, President April
YASKAWA Electric Corporation (TSE 6506) FY2007 Financial Results (Summary) (Ended March 20, 2008) FY2008 Forecast and Measures (Summary) (Ending March 20, 2009) Presented by Koji Toshima, President April
FOR IMMEDIATE RELEASE Kurita Water Announces Earnings for the Six-Month Period to September 30, 2003.
 FOR IMMEDIATE RELEASE Kurita Water Announces Earnings for the Six-Month Period to September 30, 2003. Orders rose 15% over the previous year to 78.2 billion on a consolidated basis due to brisk orders
Yes (for analysts and institutional investors) Note: The original disclosure in Japanese was released on November 7, 2014 at 15:00 (GMT +9).
 Note: The original disclosure in Japanese was released on November 7, 2014 at 15:00 (GMT +9).") November 7, 2014 Summary of Consolidated Financial Results for the Second Quarter of the Fiscal Year Ending March 31, 2015 (Six Months Ended September 30, 2014) [Japanese GAAP] Company name: NITTOKU ENGINEERING
November 7, 2014 Summary of Consolidated Financial Results for the Second Quarter of the Fiscal Year Ending March 31, 2015 (Six Months Ended September 30, 2014) [Japanese GAAP] Company name: NITTOKU ENGINEERING
CONSOLIDATED FINANCIAL STATEMENTS FOR THE FISCAL YEAR ENDED MARCH 31, 2016
 Page 1/21 May 10, 2016 CONSOLIDATED FINANCIAL STATEMENTS FOR THE FISCAL YEAR ENDED MARCH 31, 2016 Financial Highlights For the fiscal year ended March 31, 2016 (FY2015) FY2015 FY2014 Millions of US dollars
FY2017 Consolidated Financial and Operating Results<JGAAP> (Overview English translation of the Japanese original) April 27, 2017
 April 27, 2017") FY2017 Consolidated Financial and Operating Results (Overview English translation of the Japanese original) April 27, 2017 Company Name: SANYO DENKI CO., LTD. Code Number: 6516 (Listed on the First
FY2017 Consolidated Financial and Operating Results (Overview English translation of the Japanese original) April 27, 2017 Company Name: SANYO DENKI CO., LTD. Code Number: 6516 (Listed on the First
3. Financial Forecasts for the Year Ending March 31, 2019 (April 1, 2018 to March 31, 2019) Note: Percentages for year ending March 31, 2019 indicate
 Note: Percentages for year ending March 31, 2019 indicate") Summary of Consolidated Financial Results for the First Quarter Ended June 30, 2018 (Japanese GAAP) July 26, 2018 Name of Listed Company: Tokyo Electron Limited Stock Exchange Listing: Tokyo Security Code:
Summary of Consolidated Financial Results for the First Quarter Ended June 30, 2018 (Japanese GAAP) July 26, 2018 Name of Listed Company: Tokyo Electron Limited Stock Exchange Listing: Tokyo Security Code:
NOK CORPORATION and Consolidated Subsidiaries Consolidated Financial Results for Fiscal Year Ended March 31, 2018 (Japanese GAAP)
") Member of Financial Accounting Standards Foundation NOK CORPORATION and Consolidated Subsidiaries Consolidated Financial Results for Fiscal Year Ended March 31, 2018 (Japanese GAAP) Date: May 10, 2018
Member of Financial Accounting Standards Foundation NOK CORPORATION and Consolidated Subsidiaries Consolidated Financial Results for Fiscal Year Ended March 31, 2018 (Japanese GAAP) Date: May 10, 2018
Consolidated Financial Results for the First Quarter of Fiscal Year ending September 30, 2019 (Japanese GAAP)
") Consolidated Financial Results for the First Quarter of Fiscal Year ending September 30, 2019 (Japanese GAAP) February 4, 2019 Company name: Hamamatsu Photonics K.K. Stock listing: Tokyo Stock Exchange
Consolidated Financial Results for the First Quarter of Fiscal Year ending September 30, 2019 (Japanese GAAP) February 4, 2019 Company name: Hamamatsu Photonics K.K. Stock listing: Tokyo Stock Exchange
3Q FY2012 (April 1, 2011 December 31, 2011) Financial Announcement
 Financial Announcement") FY212 (April 1, 211 December 31, 211) Financial Announcement TOKYO ELECTRON February 3, 212 FY212 (April 1, 211 December 31, 211) Consolidated Financial Summary FY212: October 1, 211 - December 31, 211
FY212 (April 1, 211 December 31, 211) Financial Announcement TOKYO ELECTRON February 3, 212 FY212 (April 1, 211 December 31, 211) Consolidated Financial Summary FY212: October 1, 211 - December 31, 211
Taiyo Holdings / 4626
 COVERAGE INITIATED ON: 2017.12.08 Shared Research Inc. has produced this report by request from the company discussed in the report. The aim is to provide an owner s manual to investors. We at Shared Research
Fiscal 2014 Supplementary Information May 11, 2015
 Fiscal 2014 Supplementary Information May 11, 2015 * Forward-looking statements made in this document, such as business forecasts, are based on the information available at this time and on certain premises
Consolidated Results for the First Three Quarters of the Fiscal Year Ending February 28, 2019
 Consolidated Results for the First Three Quarters of the Fiscal Year Ending February 28, 2019 [Japan GAAP] January 10, 2019 Listed company name: YASKAWA Electric Corporation Stock ticker number: 6506 https://www.yaskawa.co.jp/en/
FY2009 Financial Results
 FY29 Financial Results I. FY29 ended March 21 Financial Results II. FY21 Full Year Plan April 28, 21 TOPCON CORPORATION CFO Takayuki Ogawa Topcon Investor Relations 21 FY29 ended March 21 Financial Results
3. Business results forecast for the year ending March 31, 2019 (Apr.1, Mar.31, 2019) Revenues Adjusted Operating Income (% indicates the rate
 Revenues Adjusted Operating Income (% indicates the rate") Consolidated Financial Report [IFRS] For the Year Ended March 31, 2018 Listed Company: Hitachi Metals, Ltd. (URL http://www.hitachi-metals.co.jp/e/index.html) Listed Stock Exchanges: Tokyo Stock Exchange,
Consolidated Financial Report [IFRS] For the Year Ended March 31, 2018 Listed Company: Hitachi Metals, Ltd. (URL http://www.hitachi-metals.co.jp/e/index.html) Listed Stock Exchanges: Tokyo Stock Exchange,
Consolidated Financial Results for the Fiscal Year Ended March 31, 2013 (Japanese Accounting Standards)
") Consolidated Financial Results for the Fiscal Year Ended March 31, 2013 (Japanese Accounting Standards) May 13, 2013 Company name: SHOFU INC. Listing: Tokyo Stock Exchange (First section) Code number:
Consolidated Financial Results for the Fiscal Year Ended March 31, 2013 (Japanese Accounting Standards) May 13, 2013 Company name: SHOFU INC. Listing: Tokyo Stock Exchange (First section) Code number:
Accounting Report for the First Half of Fiscal Year Ending March 2018 (April 1, 2017 September 30, 2017)
") October 31, 2017 Company: Representative: Contact: JVCKENWOOD Corporation Takao Tsuji, Representative Director of the Board, President and CEO (Code: 6632; First Section of the Tokyo Stock Exchange) Masatoshi
October 31, 2017 Company: Representative: Contact: JVCKENWOOD Corporation Takao Tsuji, Representative Director of the Board, President and CEO (Code: 6632; First Section of the Tokyo Stock Exchange) Masatoshi
Earnings Release 4Q January 23, 2007
 Earnings Release 4Q 2006 January 23, 2007 1 This presentation has been prepared based on internally audited figures and final figures may change due to the results of independent auditors audit. All information
Consolidated Financial Report [IFRS] For the 9-month period ended December 31, 2018 Listed Company: Hitachi Metals, Ltd. (URL
![Consolidated Financial Report [IFRS] For the 9-month period ended December 31, 2018 Listed Company: Hitachi Metals, Ltd. (URL](/thumbs/94/119904380.jpg "Consolidated Financial Report [IFRS] For the 9-month period ended December 31, 2018 Listed Company: Hitachi Metals, Ltd. (URL") Consolidated Financial Report [IFRS] For the 9-month period ended December 31, 2018 Listed Company: Hitachi Metals, Ltd. (URL https://www.hitachi-metals.co.jp/e/index.html) Listed Stock Exchanges: Tokyo
Consolidated Financial Report [IFRS] For the 9-month period ended December 31, 2018 Listed Company: Hitachi Metals, Ltd. (URL https://www.hitachi-metals.co.jp/e/index.html) Listed Stock Exchanges: Tokyo
Consolidated Results of Kyocera Corporation and its Subsidiaries for the Nine Months Ended December 31, 2007
 Consolidated Results of Kyocera Corporation and its Subsidiaries for the Nine Months Ended December 31, 2007 The consolidated financial statements are prepared in conformity with accounting principles
YASKAWA Electric Corporation (TSE 6506)
") YASKAWA Electric Corporation (TSE 6506) First Half of FY2008 Financial Results Summary (Ended September 20, 2008) FY2008 Financial Forecasts Summary (Ending March 20, 2009) Presented by Koji Toshima, President
YASKAWA Electric Corporation (TSE 6506) First Half of FY2008 Financial Results Summary (Ended September 20, 2008) FY2008 Financial Forecasts Summary (Ending March 20, 2009) Presented by Koji Toshima, President
CONSOLIDATED RESULTS FOR THE THIRD QUARTER AND THE NINE MONTHS ENDED SEPTEMBER 30, 2009
 CONSOLIDATED RESULTS FOR THE THIRD QUARTER AND THE NINE MONTHS ENDED SEPTEMBER 30, 2009 October 27, 2009 CONSOLIDATED RESULTS FOR THE THIRD QUARTER Net sales 774,324 Actual (Millions of yen, thousands
1. Analysis of Business Results (1) Financial Performance for Fiscal 2008 (April 1, 2008 March 31, 2009)
 Financial Performance for Fiscal 2008 (April 1, 2008 March 31, 2009)") - 15 - Financial Performance 1. Analysis of Business Results (1) Financial Performance for Fiscal 2008 (April 1, 2008 March 31, 2009) The Fuji Electric Group s operating environment during fiscal 2008
- 15 - Financial Performance 1. Analysis of Business Results (1) Financial Performance for Fiscal 2008 (April 1, 2008 March 31, 2009) The Fuji Electric Group s operating environment during fiscal 2008
Operating Results and Financial Position
 SHIMADZU CORPORATION IR Group Corporate Strategy Planning Department 1 Nishinokyo-Kuwabaracho, Nakagyo-ku Kyoto 604-8511 Japan http://www.shimadzu.com/ Tel: +81 75-823-1128 August 5, 2009 Operating Results
Consolidated Financial Results of Fiscal Year 2017
 Consolidated Financial Results of Fiscal Year 2017 Company name: DISCO Corporation Stock code number: 6146 (Tokyo Stock Exchange 1st Section) URL: http://www.disco.co.jp Telephone number: 81-3-4590-1099
Analyst and Investor Briefing on the Second Quarter of the Fiscal Year Ending March 31, 2009 (FY2009.3) November 4, 2008 YAMAHA CORPORATION
 November 4, 2008 YAMAHA CORPORATION") Analyst and Investor Briefing on the Second Quarter of the Fiscal Year Ending March 31, 2009 () November 4, 2008 YAMAHA CORPORATION Overview of Performance in the Second Quarter of 2Q External Environment
Analyst and Investor Briefing on the Second Quarter of the Fiscal Year Ending March 31, 2009 () November 4, 2008 YAMAHA CORPORATION Overview of Performance in the Second Quarter of 2Q External Environment
FY nd Quarter Consolidated Financial and Operating Results <IFRS> (Overview English translation of the Japanese original) October 31, 2018
 October 31, 2018") FY2019 2 nd Quarter Consolidated Financial and Operating Results (Overview English translation of the Japanese original) October 31, 2018 Company Name: SANYO DENKI CO., LTD. Code Number: 6516 (Listed
FY2019 2 nd Quarter Consolidated Financial and Operating Results (Overview English translation of the Japanese original) October 31, 2018 Company Name: SANYO DENKI CO., LTD. Code Number: 6516 (Listed