Facts & Figures January June 2010
|
|
|
- Britney Lyons
- 5 years ago
- Views:
Transcription

1 Facts & Figures January June
2 Contents Page SEB Group 3 23 Asset quality Bond portfolios Divisional level Merchant Banking Retail Banking Wealth Management Life Baltic Macro update
 Excluding Retail Germany 2) Aggregated income distribution of Swedbank, SHB, Nordea, Danske Bank and DnB NOR.")
3 To be the leading Nordic corporate Bank Share of total income 20 (%) SEB 1) Nordic peers 2) 0% 20% 40% 60% 80% 100% Large Corporates & Institutions Life Asset management Retail 1) Excluding Retail Germany 2) Aggregated income distribution of Swedbank, SHB, Nordea, Danske Bank and DnB NOR. Business units only (indicative) 3


4 We have the credentials! Strong customer base Large companies 1,800 Financial institutions 700 SMEs Product excellence Cash management globally Scandinavian currencies globally Nordic stock broker Nordic and Baltic investment bank Custody Nordics and Baltics Nordic asset management SMEs Sweden Passionate people 400,000 Private individuals 4 million 1) 1) Excluding Retail Germany 4
5 Organisation Chairman of the Board Marcus Wallenberg Internal Audit Agneta Brevenhag * President & CEO Annika Falkengren Group IT Ulf Thorstensson Business Support & Group Staff CFO Jan Erik Back Group Operations Pia Warnerman Bo Magnusson, Deputy CEO Group Credits & Group Risk Control Johan Andersson Merchant Banking Retail Banking Wealth Management Life Baltic Magnus Carlsson Mats Torstendahl Fredrik Boheman Anders Mossberg Martin Johansson * Reports directly to the Board 5

6 Share of profit before credit losses Jan Jun 2010 Germany Lithuania Estonia 1% Latvia 5% 4% Finland Denmark 5% 6% 14% 15% 50% Sweden Wealth Management Life 9% 13% 15% Baltic 6% Merchant Banking 57% Norway Retail Banking Geography Adjusted for Other Divisions Adjusted for Other 6
7 SEB Group Income, Expenses and Operating profit, SEK m 14,000 12,000 10,000 8,000 6,000 4,000 2, ,000 5,000 4,000 3,000 2,000 1,000 0 Q1-05 Q1-05 Q2-05 Q2-05 Q3-05 Q3-05 Q4-05 Q4-05 Q1-06 Q1-06 Excluding portfolios Income Expenses Q2-06 Q2-06 Q3-06 Q4-06 Operating profit Including: One-off charges of SEK 890m in Q Sales of Baltic properties in Q4 20 of SEK 785m SEK 600m redundancies and SEK 780m VPC divest in Q4- SEK 594m goodwill write-down in Q1 SEK 2,394m goodwill write-down in Q2 and SEK 1,3bn capital gain on repurchased bond Q3-06 Q4-06 Q1- Q2- Q3- Q4- Q1- Q1- Q2- Q3- Q4- Q1- Q2- Q2- Q3- Q3- Q4- Q4- Q1- Q1- Q2- Q2- Q3- Q3- Q4- Q1-10 Q4- Q2-10 Q1-10 Q2-10 7
8 Net interest and Net fee and commission income SEB Group, SEK m 7,000 6,000 5,000 4,000 3,000 2,000 1,000 0 Q1-06 Q2-06 Q3-06 Q4-06 Q1- Q2- Q3- Q4- Q1- Q2- Q3- Q4- Q1- Q2- Q3- Q4- Q1-10 Q2-10 Net interest income Net fee and commissions 8
9 Key figures SEB Group Change Q2 Jan-Jun Q1 Q2 Jan-Jun SEK m Operating income 9,821 19,193 5% -25% -22% Operating expenses 6,619 12,986 4% -27% -20% Profit before credit losses etc 3,202 6,2 7% -23% -26% Operating profit 2,580 3, % 51% Net profit 2,004 2, % Return on Equity, % Cost / income ratio Credit loss level, % Basel II (without transitional floors) Core Tier I capital ratio, % 12, 12, 11,71 11,31 11,31 Tier I capital ratio, % 14,31 14,31 13,88 13, 13, Risk-weighted assets, SEKbn
10 Net interest income analysis SEB Group, SEK m H vs. H1 20 Q vs. Q Q vs. Q2 20 H ,274 Q ,875 Q2 20 5,370 Lending margin 3 Lending margin 9 Lending margin 100 Lending volume -491 Lending volume 1 Lending volume -244 Deposit margin -1,050 Deposit margin -35 Deposit margin -478 Deposit volume -174 Deposit volume 9 Deposit volume -71 Funding & other -1,896 Funding & other 236 Funding & other -582 H ,970 Q ,5 Q ,5 10
11 Fee and commission income Gross quarterly development Q Q SEB Group, SEK m Capital market driven Non-capital market driven 2,500 2,000 1,500 Securities transaction driven Value driven performance driven 1,000 Deal driven * New issues & advisory * Q adjusted for gross commission on security lending, SEK 200m Secondary market & derivatives Custody & mutual funds Payments, cards, structured lending, deposits, guarantees Other 11
12 Impact from exchange rate fluctuations SEB Group Feb 20 Apr 20 SEK/EUR Period-End Jun 20 Aug 20 Oct 20 Dec 20 Feb 2010 Apr 2010 Jun Feb 20 Apr 20 SEK/USD Period-End Jun 20 Aug 20 Oct 20 Dec 20 Feb 2010 Apr 2010 Jun 2010 SEK m Q2-10/Q2- Q2-10/Q1-10 YTD-10/YTD- Total income Total expenses Net credit losses Operating profit SEK bn Jun-10/Dec- Loans to the public -32 Deposits from the public -18 RWA - Basel II -16 Total assets
13 Assets under management SEB Group, SEK bn Assets under management year-end 20 1,356 Inflow (11%) Outflow (-9%) Net inflow of which: 28.8 Sweden 8.7 Other Nordic 10.0 Germany 6.1 Baltic countries and Poland 2.4 Other and Eliminations 1.6 Acquisition/disposal net Change in value -57 Assets under management June ,328* * Of which, not eliminated: Retail Banking 86 Wealth Management 1,258 Life
14 A strong balance sheet structure June 2010 Balance sheet structure Liquid assets Cash & Lending Financial Institutions Net Bond portfolio Net Other trading Household Lending Deposits Financial Institutions Funding <1 year Funding, remaining maturity >1 year Short-term funding Banking book Other Lending Deposits from the public Stable funding Equity Assets Equity & Liabilities 14
15 Net liquidity position SEB s matched funding horizon Months Loans to deposits ratio; %* 200% 180% 160% 140% 120% 100% 155% Q NB: Increased due to volatile repo volumes 10 Loans to deposit ratio excl repos, %* 5 0 Q4- Q2- Q4- Q2- Q4- Q % 180% 160% 140% 120% 100% 142% Q *excl re-classified bonds 15
16 Deposits, excl repos, from the public Corporate deposits +100% in 5 years SEK m 900, , , , , , ,000 Public sector Private sector Corporate sector Total deposits 200, ,000 0 Q Q Q Q Q1 20 Q3 20 Q1 20 Q3 20 Q1 20 Q3 20 Q
17 Funding structure SEB Group, SEK 1,580bn, June 2010 Deposits - Financial Institutions 13.0% Mortgage Covered Bonds Sweden 10.1% Deposits - General Public 42.2% Deposits - Central Banks 7.6% CPs/CDs 10.8% Subordinated debt 2.0% Mortgage Covered Bonds Germany 2.5% Schuldscheins and Reg Bonds 1.3% Public Covered Bonds Germany 4.4% Senior debt 6.3% 17
18 Long-term funding Maturity profile SEK bn 0 <1Y 1-2Y 2-3Y 3-4Y 4-5Y 5-7Y 7-10Y >10Y Subordinated Debt Covered Bonds non SEK, Swe Covered Bonds SEK, Swe Senior Unsecured Mortgage Pfandbriefe, Ger Public Pfandbriefe, Ger
19 Funding raised with original maturity > 1 year SEK bn Instrument Q Q Q3 2010* Yankee CD Senior unsecured SEB AG Senior unsecured SEB AB Structured bonds Covered bonds SEB AG Covered bonds SEB AB Hybrid tier Total *Until August 27 19
20 European 5Y SEN CDS (bp) 20 SHB DnB NOR Nordea Danske HSBC SEB StanChart Swedbank BNP Credit suisse Commerz INTNED Deutsche Bank Intesa DPostbank Barclays SOCGEN KBC CASA UniCredit BPM Santander Popolare Lloyds RBS BBVA Mpaschi Dexia Bankinter Popular BoI BCP BPI BES Pastor AIB Alpha NBG Eurobank Piraeus "The Nordics CDS spreads continue to tighten at a more rapid pace than European peers" Source: UBS Sept 2, 2010


21 CEBS and SEB "As expected, the Nordic banks screened strongly in the much-anticipated C-EBS stress-test, with an average Tier 1 of 9.8% in 2011E relative to a European average 8.6% under the most stressed scenario. Further, given that risk-weighted assets are calculated under transitional rules in each of the adverse scenarios, we view the headline Tier 1 ratios as understating Nordic capital strength on a Europeanrelative basis." Source: UBS 21
22 Dividend development SEK m 16,000 14,000 12,000 10,000 8,000 6,000 4,000 2,000 Total dividend Net profit DPS*, SEK Pay-out ratio 40% 38% 32% 33% 0% 172% 30% Dividend policy: 40% of net profit (Earnings per share) over the business cycle *No. shares adjusted for rights issue 22
23 Capital adequacy SEB Group Total capital ratio, % Tier 1 capital ratio, % Core Tier 1 (from 20) Basel II (without transition rules) SEK bn Dec Dec Dec Dec Dec Mar Jun Capital base Risk-w. Assets Target: A Tier 1 capital ratio of 10% over the business cycle 23
24 Capital adequacy and RWA SEB Group - Basel II without transitional rules SEB risk class migration, by quarter Corporate and inter-bank portfolios SEK bn Risk class migration, excl. default To/from default Total Risk-weighted assets SEK bn Dec Market and Operational Risk 15 Migration FX effects Other Q1 20 Q2 20 Q3 20 Q4 20 Q1 20 Q2 20 Q3 20 Q4 20 Q Q Jun


25 Asset quality 25
26 Credit portfolio* On & off balance, SEK bn Jun '10 (Mar '10) Swedish Nordic** German Baltic Total Corporates 325 (319) 164 (159) 110 (1) 56 (59) 655 (646) Property Management 126 (117) 18 (21) 78 (79) 25 (26) 248 (244) Households 324 (314) 46 (46) 90 (92) 54 (56) 514 (5) Public Administration 16 (20) 2 (1) 64 (64) 4 (5) 86 (90) Total non-banks 791 (770) 229 (227) 343 (344) 140 (146) (1 487) 1% Banks 104 (144) 42 (46) 64 (62) 1 (2) 212 (254) Total 896 (914) 271 (273) 4 (406) 141 (148) (1 741) -2% -1% 0% -5% -2% * Based on SEB's operations ** Including other 26
27 Credit portfolio* On & off balance, SEK bn SEB Group Dec '06 Dec ' Dec ' Dec ' Mar '10 Jun '10 % Corporates % Property Management % Households % Public Administration % Total non-banks % Banks % Total % SEB Group Dec '06 Dec ' Dec ' Dec ' Mar '10 Jun '10 Δ Q2 Lending * 937 1,112 1,362 1,3 1,235 1, Contingent Liabilities Derivative Instruments Credit Portfolio 1,316 1,552 1,934 1,816 1,741 1, * Before loan loss reserves, excluding repos & debt instruments 27
28 Rating of credit portfolio June 2010 Total credit portfolio excl. Households* (%) Of which, Corporates* (%) 38% 20% 33% 23% 26% 39% 5% 4% 8% 4% Risk Class '1-4 '5-7 '8-10 '11-12 '13-16 S&P AAA/A- BBB BB B+/B B-/D Risk Class '1-4 '5-7 '8-10 '11-12 '13-16 S&P AAA/A- BBB BB B+/B B-/D Household (EAD, IRB reported) 30% 44% PD (%) 16% 7% 3% 1% 0< < < 1 1< 5 5< 50 50< 100 * Including repos 28
29 Credit portfolio - households SEK bn Mortgage Other Dec ' Mar' Jun' Sep' Dec ' Mar '10 Jun '10 Mortgage Other Dec ' Dec ' Mar '10 Jun '10 Dec ' Dec ' Mar '10 Jun '10 Dec ' Dec ' Mar '10 Jun '10 Nordic* German Baltics * Incl. other 29
30 Credit portfolio corporates SEK bn SEB Group Other "Nordic" - Retail Baltic Germany - Larger "Nordic" - Larger Q4 '06 Q4 ' Q4 ' Q4 ' Q1 '10 Q2 '10 Geography based on SEB's operations 30
31 Development of NPLs SEK bn Non-performing loans 13.8% of lending Individually assessed Portfolio assessed % of lending 1.0% of lending 30.6% of lending 0 Q1 ' Q2 Q3 Q4 Q1 '10 Q2 Q1 ' Q2 Q3 Q4 Q1 '10 Q2 Q1 ' Q2 Q3 Q4 Q1 '10 Q2 Q1 ' Q2 Q3 Q4 Q1 '10 Q2 Nordic Germany Baltics Ukraine & Russia 31
32 Level of net credit losses, % Nordics Baltics Jan-Jun '10 Germany Jan-Jun '10 SEB Group Jan-Jun ' Jan-Jun '10 32
33 NPLs & reserves SEB Group, SEK bn Dec ' Mar ' Individually assessed loans Impaired loans, gross Specific reserves Collective reserves Off Balance sheet reserves Specific reserve ratio 44% 43% 42% 45% 49% 52% 54% Total reserve ratio 69% 72% 72% 72% 70% 77% 77% Portfolio assessed loans Loans past due > 60 days Restructured loans Collective reserves Reserve ratio 44% 41% 37% 40% 45% 46% 48% Non-performing loans Total reserves NPL coverage ratio 65% 66% 63% 65% 65% 70% 71% Non-performing loans / Lending 0.9% 1.1% 1.5% 1.7% 1.9% 1.8% 1.8% Jun ' Sep ' Dec ' Mar '10 Jun '10 33
34 SEB Group net credit losses SEK m Net credit losses, quarterly Q2 20 Q3 20 Q4 20 Net write-offs Net specific provisions Net collective provisions of which: Individually assessed loans Portfolio assessed loans Net credit losses Net credit loss level Q1 20 Q2 20 Q3 20 Q4 20 Q Q
35 Credit portfolio Total exposure: EUR 14.8 bn (SEK 141 bn) Baltic countries, EUR bn Banks Public Admin Households Property Mgmt Corporates Dec ' Dec ' Dec ' Mar '10 Jun '10 Dec ' Dec ' Dec ' Mar '10 Jun '10 Dec ' Dec ' Dec ' Mar '10 Jun '10 Estonia Lativa Lithuania 19% -4% -9% -3% -3% 12% 4% -15% -6% -3% 29% 8% -17% -3% -2% Growth rates in local currency 35
36 Baltic lending to the public* EUR bn Lending to the public Credit loss reserves Q1 20 Q2 Q3 Q4 Q1 20 Q2 Q3 Q4 Q1 20 Q2 Q3 Q4 Q Lending to the public, SEK bn Q2 * Excluding reclassified bonds 36
37 SEB Baltic asset quality Net credit losses Q1 20 Q2 2010, SEK m 2,000 1,500 1, Estonia Latvia Lithuania SEB Baltic Net Credit Losses SEK m % of Estonia Latvia Lithuania Total Q2 Total Net Write-offs % Net Specific Provisions % Net Collective Provisions % of which: Individually assessed loans % Portfolio assessed loans % Net Credit Losses % 37
38 NPLs & reserves SEB Baltic, June 2010, SEK m Estonia Latvia Lithuania SEB Baltic Dec 20 Individually assessed loans Impaired loans, gross 1,773 3,4 7,561 12,743 13,932 Specific reserves 1,126 1,720 3,912 6,759 6,632 Collective reserves 398 1,119 1,225 2,741 2,467 Off balance sheet reserves Specific reserve ratio 64% 50% 52% 53% 48% Total reserve ratio 86% 83% 68% 75% 65% Portfolio assessed loans Loans past due > 60 days, gross 1,043 2,182 1,480 4,705 4,440 Restructured loans Collective reserves 581 1, ,640 2,267 Reserve ratio 53% 54% 43% 50% 48% Non-performing loans 2,865 5,786 9,353 18,003 18,684 Total reserves 2,1 4,143 5,977 12,227 11,416 NPL coverage ratio 74% 72% 64% 68% 61% 38
39 Bond portfolios 39
40 Bond Investment Portfolio* Portfolio breakdown, 30 June, 2010 Structured Credits 544 positions, well diversified across products, asset classes and geographical areas 48% of the portfolio volume is rated Aaa/AAA, 12% below investment grade During 2010, 77 positions have been downgraded whereof 32 positions from AAA During 2010, 3 positions have been upgraded Mark-to-Market prices are applied to almost all positions very small amount of holdings classified as level 3 Average maturity ~3 years Annual amortisation ~SEK 8bn Financials Senior FRNs Maturity is 6M - 5Y, weighted average life is 1.7Y Bond investment portfolio SEK 75bn Volume in SEK bn (% of portfolio) 14% 3% 83% Loans & Receivables (MTM not recorded) Held for Trading (MTM over income) Available for Sale (MTM over equity) * Net of short and fully matched positions; excluding holdings in the insurance business 40
41 Bond Investment Portfolio Portfolio breakdown by geography, 30 June, 2010 and financial effects Product UK Spain Europe Other US Australia/ NZ Total Volume Financials 11.3% 9.0% 33.1% 41.2% 5.4% 27.0 Covered Bonds Structured Credits 0% 96% 4% 0% 0% % 6.5% 40.0% 35.3% 0.8% 39.0 ABS 1.0% 2.1% 3.5% 1.4% 0.0% 3.1 CDO 0.4% 0.0% 3.3% 4.0% 0.0% 3.0 CLO 1.4% 0.0% 12.8% 13.0% 0.0% 10.6 CMBS 1.6% 0.0% 6.6% 0.6% 0.0% 3.5 CMO 0.0% 0.0% 0.0% 7.4% 0.0% 2.9 RMBS prime RMBS non-prime 12.8% 4.4% 13.8% 3.1% 0.8% % 0.0% 0.0% 5.9% 0.0% 2.3 Bond investment Q2 Q1 Q2 Jan - Dec portfolio, SEK m Structured credits Financial institutions Covered bonds etc Income effect Structured credits Financial institutions Covered bonds etc Equity effect Total recognized Structured credits Financial institutions Covered bonds etc Fair value of reclassified securities Total fair value
42 Divisional level 42
43 Operating profit before credit loss provisions per division Jan Jun 2010 vs. Jan Jun 20 SEK m 8,000 7,000 6,000 5,000 4,000 3,000 2,000 1, ,000-2,000 Merchant Banking Retail Banking Jan-Jun 20 Jan-Jun 2010 Income Op.profit RoE before credit losses Sweden: -13% -30% 14% Card: 0% -3% 25% Wealth Management RoE Jan - Jun % 17.1% 21.5% 32.8% Neg * Retail ex. Germany * Life Baltic 43
44 Summary per division Jan Jun 2010 Merchant Banking Retail Banking Wealth Management Life Baltic Other Group Operating profit, SEK m 4, ,117-1,402-2,249 3,655 Business equity, SEK bn ** *** 99.1 * Return on equity, % Neg 5.37 Cost / income ratio RWA, SEK bn, Basel II**** RWA, SEK bn, Basel I ,0 Tax Rate 28.0% 23.4% 28.0% 12.0% 13.8% * Average shareholders' equity ** Where of Sweden 7.0bn, Germany 4.3bn and Cards 2.7bn *** Where of Estonia 3.5bn, Latvia 4.3bn and Lithuania 4.0bn **** Basel II without transitional floors 44
45 Lending to the public* SEK bn Q1 Q2 Q3** Q4** Q1** Q2** Q3** Q4** Q1** Q2** MB Retail Banking RB Sweden RB Germany RB Cards Wealth Management Life Baltic Baltic Estonia Baltic Latvia Baltic Lithuania Other/Elim SEB Group 1,9 1,132 1,226 1,297 1,317 1,305 1,2 1,188 1,204 1,226 * After credit loss reserves ** Including re-classified bonds 45
46 Deposits from the public SEK bn Q1 Q2 Q3 Q4 Q1 Q2 Q3 Q4 Q1 Q MB Retail Banking RB Sweden RB Germany RB Cards Wealth Management Life Baltic Baltic Estonia Baltic Latvia Baltic Lithuania Other/Elim SEB Group
47 Full-time equivalents, end of quarter Q1 Q2 Q3 Q4 Q1 Q2 Q3 Q4 Q1 Q MB 2,742 2,760 2,719 2,698 2,697 2,650 2,582 2,539 2,529 2,530 Retail Banking 5,3 5,530 5,338 5,275 5,127 5,171 5,0 4,974 4,792 4,932 RB Sweden 2,723 2,865 2,728 2,710 2,621 2,642 2,515 2,512 2,531 2,674 RB Germany 1,802 1,830 1,794 1,746 1,702 1,716 1,687 1,661 1,476 1,462 RB Cards Wealth Management 1,160 1,143 1,123 1,8 1,064 1, , Life 1,222 1,235 1,250 1,226 1,206 1,196 1,184 1,173 1,175 1,173 Baltic 3,366 3,469 3,420 3,353 3,353 3,285 3,252 3,3 2,957 2,937 Baltic Estonia 986 1, Baltic Latvia , Baltic Lithuania 1,368 1,423 1,439 1,464 1,492 1,432 1,400 1,306 1,239 1,226 Other 7,412 7,5 7,578 7,493 7,210 7,115 6,906 6,783 6,6 6,550 SEB Group 21,210* 21,64521,42821,131 20,656 20,43019,912 19,562 19,032 19,1 * Whereof 1,039 encompasses the consolidated acquisitions of Factorial bank in Ukraine and Key Asset Management. 47

48 Merchant Banking Magnus Carlsson Head of Merchant Banking SEK m Jan Jun Total income 8,865-21% Interest, net 3,978-29% Commission, net 2,503-10% Financial, net 2,337-13% Total expenses -4,173-1% Profit bef. credit losses 4,692-33% Credit losses, net % Operating profit 4,619-27% RoE, % C/I Highlights Strong market position with further enhanced client relations in a market with higher volatility Strategic initiatives in Nordics and Germany gaining momentum with recruitments and increased client activity Solid asset quality reflected in the low lending loss provisions All business areas show increased customer activities 48
49 Merchant Banking SEK m Excl. MTM in investment portfolio Income Expenses 7,000 6,000 5,000 4,000 3,000 2,000 1,000 0 Q2- Q3- Q4- Q1- Q2- Q3- Q4- Q1- Q2- Q3- Q4- Q1-10 Q2-10 4,000 3,500 3,000 2,500 2,000 1,500 1, Operating profit Excl. MTM in investment portfolio Q2- Q3- Q4- Q1- Q2- Q3- Q4- Q1- Q2- Q3- Q4- Q1-10 Q
50 Share of income and result by area Jan Jun 2010, per cent of total Income Operating profit Total = SEK 8,865m Total = SEK 4,619m Global Transaction Services Global Transaction Services 18% 48% Corporate Banking 12% 53% 34% 35% Corporate Banking Trading and Capital Markets Trading and Capital Markets 50
51 Trading & Capital Markets Diversified earnings, client driven activities Trading and Capital Markets income by main product cluster, excl. investment portfolios 8% 11% 7% 5% 6% 22% 15% 11% 8% 8% -2% 3% 6% 12% 44% 46% 59% 50% 44% 45% 46% 26% 28% 33% 38% 41% 36% 44% Q1 - Q2 Q3 Q4 Q1 - -3% 21% 19% 63% 21% 46% Q2 Q3 Q4 Q1-3% 8% 30% 34% 24% 6% 7% 6% 34% 22% 28% 22% 30% 30% 34% 38% 41% 36% Q2 Q3 Q4 Q1-10 4% 29% 29% 38% Q2 Strong client driven performance across all product areas on back of higher market activity and volatility Equities confirmed the clear number one position on the Nordic and Baltic stock exchanges and was awarded the best Equity Research house in Sweden by Financial Hearings Equities Capital Markets FX Structured Derivatives and other TCM 51
52 Merchant Banking Market shares Nordic and Baltic stock exchanges Jan Jun 2010 Nordic ECM transactions, by Bookrunner* Jan Jun 2010 (EUR m) SEB 9.1% SEB 2,378 SHB 6.6% DnB NOR 1,495 Credit Suisse 6.4% Nordea 1,266 Nordnet 4.8% JP Morgan 1,257 Deutsche Bank 3.9% Carnegie 1,048 Source: The Nordic Stock exchanges * Rank based on IPOs or follow-ons, Nordic stock exchanges Source: Dealogic 52
53 Merchant Banking Syndicated loans Swedish Mandated Lead Arranger Jan 2010 Jun 2010 Nordic Mandated Lead Arranger Jan 2010 Jun 2010 Nordea 29,0% Nordea 21,3% SEB 13,9% SEB 9,9% Swedbank 9,8% Danske Bank 9,6% Danske Bank 8,7% DnB NOR 9,2% DnB NOR 8,1% Swedbank 6,0% Source: Dealogic Analytics 53
54 Custody volume development 7,000 6,000 5,000 4,000 3,000 2,000 1,000 Assets under custody, SEK bn No of transactions/day 210, , , ,000 90,000 60,000 30, NB: CCP (Central Counterparty Clearing House) introduced in autumn of 20, affecting number of transactions going forward 54


55 Merchant Banking rankings July 2010 June 2010 June 2010 Best Investment Bank in Finland Best Brokerage Firm Nordic Countries by Extel Surveys Best Research House in Sweden June 2010 Best Trade Bank in Western Europe 2010 May 2010 March 2010 January 2010 January 2010 January 2010 November 20 October 20 October 20 September 20 European Property Investment Award No. 1 FX House in the Nordic region No. 1 Equity House in the Nordic region Best Overall Bank for Cash Management, Nordic Region Best Bank for Liquidity Management, Nordic Region Best Bank for Risk Management, Nordic Region Best Sub Custodian in all Nordic & Baltic countries Best bank in the Nordic region for Cash Management, Financial Supply Chain and Risk Management Most valuable real estate brand Germany No. 1 Corporate Finance House in the Nordics (Top ranked in all 4 countries) Best Real Estate Bank in the Nordic & Baltic Region Second Best Real Estate Bank in Germany Third Best Real Estate Bank Globally 55

56 Retail Banking Mats Torstendahl Head of Retail Banking SEK m Jan Jun Total income 5,421-9% Interest, net 3,6-14% Commission, net 2,159-1% Expenses -4,197-5% Profit bef. credit losses 1,224-20% Credit losses, net % Operating profit % RoE, % C/I Highlights Focus on enhancing the customer experience yielding results, applicable to all channels where we meet customers Accessibility has improved sharply Growth among customers on track - 3,000 new SME clients YTD In particular Retail Sweden growing in lending and deposits, increases in the 12 months to June of 12% and 4% respectively Gradually declining credit losses contributed to operating profit of SEK 786m 56
57 57 Retail Banking SEK m Operating profit ,000 1,500 2,000 Q1- Q2- Q3- Q4- Q1- Q2- Q3- Q4- Q1- Q2- Q3- Q4- Q1-10 Q ,000 1,500 2,000 2,500 3,000 3,500 Q1- Q2- Q3- Q4- Q1- Q2- Q3- Q4- Q1- Q2- Q3- Q4- Q1-10 Q2-10 Income Expenses
58 Share of income and result by area Jan Jun 2010, per cent of total Income Profit before credit losses Total = SEK 5,421m Total = SEK 1,224m SEK m Cards Sweden Sweden % 52% Germany % Germany Cards
59 Business volume development by area SEK bn Q change vs. Q2 20 (local currency) Mortgages Other lending Deposits Sweden % 68 1% % Germany 59-3% 21-4% 44-8% Deposit breakdown, Percent of total deposits, Jun 2010 Transaction account private Savings account private Retail Total Sweden Germany 46 % 7% 27 % 20 % 49 % 8% Transaction account corporate & public Savings account corporate & public 19 % % % 4% 1% 59 % 59
60 Retail Sweden SEK m Jan Jun Total income 2,823-13% Interest, net 1,911-18% Commission, net 763 5% Total expenses -1,982-3% Profit bef. credit losses % Credit losses, net % Operating profit % RoE, % C/I Total lending 360,500 12% Total deposits 160,700 4% Highlights Several investments for growth in the Swedish SME-segment were made, e.g. skill building and recruitment of corporate advisors Corporate and real estate lending in general, and real estate related lending in particular, increases Availability improved as the telephone bank added staff and improved processes Growth in Private mortgage lending slowed down in relation the full year of 20 The highly competitive "Placeringskonto" (fixed term account) continued to attract deposits, SEK 14bn since launch 60
61 Net interest income and volumes Retail Sweden SEK m Net Interest Income distribution SEK bn Mortgages % Q1 20 Q Private Corporate Margins Mortgages Other lending Deposits Q2 Q4 Q2 Q4 Q2 Q4 Q2 10 SEK bn Other lending* % SEK bn Deposits Private Corporate Margins Private Corporate Margins Q2 Q4 Q2 Q4 Q2 Q4 Q2 10 Q2 Q4 Q2 Q4 Q2 Q4 Q2 10 * Excluding leasing %
62 Swedish mortgages private market Fixed / floating interest rates, market share, per cent 100% Fixed Floating Volume Sales 25% 80% 20% 60% 15% 40% 10% 20% 5% 0% Q1 Q2 Q3 Q4 Q1 Q2 Q3 Q4 Q1 Q2 Q3 Q4 Q1 Q % Note: Fixed as presented here include mortgages with interest rate fixed for 1 year or more Floating as presented here include mortgages with interest rate fixed for 3 months or less 62
63 Market share development Sweden, per cent Corporate Private 20 Mortgages* 20 Other lending 30 Deposits Q2 06 Q4 Q2 Q4 Q2 Q4 Q2 Q4 Q Q2 06 Q4 Q2 Q4 Q2 Q4 Q2 Q4 Q Q2 06 Q4 Q2 Q4 Q2 Q4 Q2 Q4 Q2 10 Note: Other lending and deposits=seb Parent Bank Sweden, i.e. not only Retail Sweden * New measurement method from Q4 20. Lowers the volume market share with approximately 0.2 percentage points 63
64 Retail Germany SEK m Jan Jun Total income 1,228-10% Interest, net % Commission, net 541-7% Total expenses -1,473-12% Profit bef. credit losses -245 Credit losses, net -95 Operating profit -340 RoE, % C/I Total lending 80,600-13% Total deposits 44,100-19% Highlights Agreement reached to divest Retail Germany to Banco Santander The new advisory model SEB FinanzKonzept received positive feedback both from customers and independent rating agencies Net interest income development was weak as lending and deposit volumes did not grow Commission income, which in FX-adjusted terms actually increased by 3% vs. previous year, did still reflect modest levels of activity and risk appetite in the savings and insurance area Operating loss was contained by cost control measures and decreasing credit losses 64
65 Net interest income and volumes Retail Germany EUR m EUR bn Other lending Outstanding volume Net Interest Income distribution Q1 20 Q Mortgages Other lending Deposits % Margins Q2 Q4 Q2 Q4 Q2 Q4 Q2 10 EUR bn Mortgages* % Outstanding volume Margins Q2 Q4 Q2 Q4 Q2 Q4 Q2 10 EUR bn Deposits Outstanding volume Margins Q2 Q4 Q2 Q4 Q2 Q4 Q2 10 Figures above present Mortgage, lending and deposits from private individuals and SME * Effected by amortizations on large historical sales volumes, partly sold through external sales organizations % 65
66 Sales development Retail Germany EUR m 450 New mortgage* 55,000 Customer appointments* EUR m 140 Insurance ,000 45,000 40,000 35,000 30, Q2 06 Q4 Q2 Q4 Q2 Q4 Q2 Q4 Q ,000 20,000 15,000 10,000 5,000 0 Q2 06 Q4 Q2 Q4 Q2 Q4 Q2 Q4 Q Q2 06 Q4 Q2 Q4 Q2 Q4 Q2 Q4 Q2 10 * incl. prolongation * by Call centre 66
67 Cards SEK m Jan Jun Total income 1,368 0% Interest, net 502 7% Commission, net 835-4% Total expenses % Profit bef. credit losses 627-3% Credit losses, net % Operating profit % RoE, % C/I Total lending 16,700-4% Highlights Several investments for future growth were made, not least in the Nordic co-brand business A multicurrency travel account service was launched, allowing customers to reduced their FXrelated risks Underlying income growth of 2% were offset by exchange rate changes Credit losses, including fraud, continued to decline and reached the lowest level in more than two years 67
68 Cards SEK bn Turnover cards Q1 Q2 Q3 Q4 Q1 Q2 Q3 Q4 Q1 Q2 Q3 Q4 Q1 Q2 Q3 Q4 Q1 Q2 Q3 Q4 Q1 Q Millions Number of cards Q1 Q2 Q3 Q4 Q1 Q2 Q3 Q4 Q1 Q2 Q3 Q4 Q1 Q2 Q3 Q4 Q1 Q2 Q3 Q4 Q1 Q1 Q
69 Wealth Management Fredrik Boheman Head of Wealth Management SEK m Jan Jun Total income 2,127 20% Interest, net % Commission, net 1,8 32% Total expenses - 1,340 2% Operating profit % Highlights Revenues above last year mainly due to: Increased base commission, mainly due to higher market values Stronger performance and transaction fee income Good brokerage income Net interest and FX adversely affect income Net sales SEK 28bn YTD, 35% above YTD 20 (21bn) Total AuM SEK 1,258bn. Down 1,3% from year-end (1,275bn). Average AuM up 11% compared to last year RoE, % C/I
70 Share of income and result by area January June 2010; percent of total Income Total = SEK 2,127m Operating result Total = SEK 784m Institutional Clients Private Banking Institutional Clients Private Banking 65% 35% 58% 42% 20: 61% vs 39% 20: 56% vs 44% 70
71 AuM per product type Wealth Management, SEK bn Mutual Funds Institutional Clients ex MF Private Clients ex MF 1,1 1,9 1,147 1,192 13% 14% 15% 15% 1,266 1,320 1,300 1,285 1,256 1,217 1,181 15% 15% 1,201 1,220 1,275 1,300 1,258 15% 15% 1,142 1,128 15% 15% 14% 13% 13% 15% 15% 15% 16% 16% 48% 48% 47% 47% 46% 46% 45% 45% 45% 44% 46% 48% 48% 46% 45% 44% 43% 43% 39% 38% 38% 39% 39% 40% 40% 40% 40% 41% 40% 39% 39% 39% 41% 41% 41% 42% Q1-06 Q2-06 Q3-06 Q4-06 Q1- Q2- Q3- Q4- Q1- Q2- Q3- Q4- Q1- Q2- Q3- Q4- Q1-10 Q
72 Total Net Sales per quarter Wealth Management, SEK bn IC PB Q1- Q2- Q3- Q4- Q1- Q2- Q3- Q4- Q1- Q2- Q3- Q4- Q1-10 Q2-10 The figures are not eliminated. Restated for transfer of Foundations & Companies from PB to IC. 72
73 Mutual funds per product type Wealth Management, June 2010 (June 20) Total amount SEK 522 bn (SEK 471 bn) 27% 36% Equity funds 36% (32%) Fixed income funds 27% (27%) Balanced funds 15% (14%) 15% Alternative funds 22% (27%) 22% 73
74 Activity level Wealth Mutual Funds Net Sales Sweden Cumulative Jan 2005 Jun 2010, including PPM SEK m 80,000 60,000 40,000 20,000-20,000 SEB SHB Robur Nordea 0 Jan 05 Jan 06 Jan Jan Jan Jan 10 Distribution per type of fund Jan Jun % 80% 60% 40% 20% 0% -20% -40% SEB Equity funds Short bond funds Alternative funds Total Mixed funds Long bond funds -40,000 Source: Svensk Fondstatistik 74

75 Life Anders Mossberg Head of Life SEK m Jan Jun Total income 2,297 6% Total expenses -1,180-1% Operating profit 1,117 13% Change in surplus values, net % Highlights Strong result operating profit increased by 13 per cent High premium inflow a confirmation of customer confidence Well diversified offering in unit-linked supports customers risk management in volatile markets High RoE and low C/I ratio Business result 1,537 3% RoE, % C/I ratio
76 76 Life SEK m Operating profit Q1- Q2- Q3- Q4- Q1- Q2- Q3- Q4- Q1- Q2- Q3- Q4- Q1-10 Q ,000 1,200 Q1- Q2- Q3- Q4- Q1- Q2- Q3- Q4- Q1- Q2- Q3- Q4- Q1-10 Q2-10 Income Expenses
77 Share of income and profit by area Life, Jan Jun 2010, per cent of total Income Operating profit Total = SEK 2,297m Total = SEK 1,117m International 9% Denmark 27% International 8% Denmark 28% 64% 64% Sweden Sweden Sweden including central functions etc 77
78 Market position by profit area Market shares, gross premium income, Unit-linked insurance (%, Q1 2010) Sweden* SEB Market share 25 Competitors SEB Rank 1 Main competitor Folksam (20) Denmark** 9 2 Danica (30) Estonia 12 3 Sampo (42) Latvia 15 3 Sampo (47) Lithuania 23 2 Sampo (27) 0% 20% 40% 60% 80% 100% * Sweden based on new sales 12 months to June 2010 ** Denmark full year 20 78
79 Market shares Sweden, per cent Unit-linked old and new insurances, 12 months to June 2010 (June 20) Nordea 9.5% (7.0) Moderna 3.8% (4.5) SPP 5.5% (5.5) Other 0.7% (0.2) SEB Trygg Liv 24.8% (27.3) AMF 3.6% (4.0) Folksam 9.8% (8.6) Danica 2.5% (2.4) SHB 6.0% (4.6) Skandia 11.9% (13.9) LF 8.3% (8.6) Swedbank 13.7% (13.4) Source: Swedish insurance federation 79
80 Sales volume weighted SEK m Life Division total sales Jan Jun 2010 Jan Jun 20 Change Unit linked 21,849 20,746 5% Traditional and Sickness/health 3,625 5,434-33% Total 25,474 26,180-3% Unit-linked sales, Sweden* 34,900 31,600 27,9 26,682 30,436 33,467 17, Jan-Jun Market share Sweden % ** *Including Swedish customers of the Irish subsidiary ** June 2010 figures (latest) 80
81 Sales SPE Life including the Baltics from 2006 Traditional vs. unit-linked Individual vs. corporate 100% Traditional and sickness/health Unit-linked 100% Individual Corporate 80% 80% 60% 60% 40% 40% 20% 20% 0% 0% Jan Jan- Jun Jun Note: SPE = Single premiums plus regular premiums times ten 81
82 New business profit Life (2006 only Swedish market), SEK m Jul 20 Full yearfull yearfull year Full year - Jun New sales (single/10+regular) 4,037 4,026 3,858 3,689 3,345 Net present value 1,512 1,492 1,598 1,775 1,788 Acquisition cost New business profit Margin, % Swedish market
83 Life, AuM and Premium income SEK bn Assets under management, (net assets) Traditional and Risk Unit-linked Premium income gross Traditional and Risk Unit-linked Jan- Jun Jan- Jun
84 Operating profit development Life, SEK m Business result split in Operating profit and Change in surplus values SEK m 1, ,376 1, Operating profit 1, Total incl. Change in surplus values 3,130 3,5 2, ,470 1,802 2,052 1,063 3,015 2,115 1,537 1, Jan - Jun 2010 Life Holding group, SEK m Dec Dec Dec Dec Jun Equity * 8,450 8,836 8,827 8,594 8,024 Surplus value ** 12,872 14,496 11,549 13,656 14,006 * Dividend paid; 2006: : -1,150 20: -1,275 20: -1, : -1,000. ** Value of in-force business; Net of DAC 84

85 Baltic Martin Johansson Head of Baltic Highlights Improved macro economic situation during the second quarter with some gradual growth evident SEK m Jan Jun Total income 1,449-30% Interest, net % Commission, net % Expenses %* Profit bef. credit losses 481 Neg. Credit losses, net -1,882-57% Operating profit -1,402 59%* Non-performing loans have stabilised in all 3 countries Net credit provisions 57% lower than in 20. Second quarter net credit provisions one third of level in 1Q 2010 Green light for Estonia to adopt the Euro in January 2011 RoE, % Neg. Neg. C/I * * Adjusted for goodwill write-down in Q
86 Baltic SEK m 1,600 1,400 1,200 1, Q1- Q2- Q3- Q4- Q1- Income Q2- Q3- Expenses Q4- Q1- Q2- * Q3- Q4- Q1-10 Q2-10 1,500 Operating profit ,500-2,500 Q1- Q2- Q3- Q4- Q1- Q2- Q3- Q4- Q1- Q2-* Q3- Q4- Q1-10 Q2-10 * Adjusted for goodwill write-down in Q

87 Share of income and result by area Jan Jun 2010, per cent of total Income Total = SEK 1,449m SEK m Profit before credit losses Total = SEK 481m Lithuania 40% 32% Estonia % 186 Latvia 87
88 Business volume development by area SEK bn Q change vs. Q2 20 (local currency) Mortgages Other lending Deposits Estonia 14-3% 21-14% 20-6% Latvia 8-17% 19-18% 14-3% Lithuania 20-3% 30-22% 26 0% Deposit breakdown, Percent of total deposits, Jun 2010 Transaction account private Savings account private Transaction account corporate & public Savings account corporate & public Estonia Latvia Lithuania 20 % 17 % 23 % 40 % 20 % 22 % 6% 24 % 36 % 34 % 32 % 26 % 88
89 SEB Baltic Lending market shares Per cent, Q Q % Estonia 50% Latvia 50% SEBEstonia Swedbank DnB Nord Nordea Sampo/Danske Bank Lithuania 40% 40% 40% 30% 30% 30% 20% 20% 20% 10% 10% 10% 0% Q2 Q4 Q2 Q4 Q2 Q4 Q2 Q4 Q % Q2 Q4 Q2 Q4 Q2 Q4 Q2 Q4 Q % Q2 Q4 Q2 Q4 Q2 Q4 Q2 Q4 Q Source: Bank of Estonia, Association of Latvian Banks, Association of Lithuanian Banks, SEB (Estonian figures are extrapolated from April) 89
90 Baltic Estonia SEK m Jan Jun Total income % Interest, net % Commission, net % Expenses %* Profit bef. credit losses 146 Neg. Credit losses, net % Operating profit -113 RoE, % Neg. Neg. C/I * Total lending 35,500-21% Total deposits 19,700-17% Highlights Net interest income 40% lower than in 20 due to lower volumes and margins but stabilising Net credit provisions 62% lower than in 20. Second quarter 28% lower than in Q Increase seen in level of banking transactions and credit card usage during 2010 Green light for Estonia to adopt the Euro in January 2011 * Adjusted for goodwill write-down in Q
91 Net interest income and volumes Baltic Estonia, EEK EEK m Net Interest Income distribution Q1 20 Q Mortgages Other lending Deposits EEK bn Mortgages Outstanding volume* Q1 Q2 Q3 Q4 Q1 Q2 Q3 Q4 Q1 Q2 Q3 Q4 % Margin 2.0 Q1 Q EEK bn Other lending Outstanding volume* Q1 Q2 Q3 Q4 Q1 Q2 Q3 Q4 Q1 Q2 * Adjusted to Group common definition Q3 Q4 % Margin 2.0 Q1 Q EEK bn Deposits Outstanding volume Q1 Q2 Q3 Q4 Q1 Q2 Q3 Q4 Q1 Q2 Q3 Margin Q4 Q1 Q %
92 Baltic Latvia SEK m Jan Jun Total income 4-35% Interest, net % Commission, net 93-14% Expenses %* Profit bef. credit losses 149 Neg. Credit losses, net % Operating profit -596 RoE, % Neg. Neg. C/I * Total lending 26,800-28% Total deposits 13,700-15% Highlights Net interest income 40% lower than in 20 but stabilising Net credit provisions 54% lower than in 20. Second quarter 70% lower than in 1Q 2010 Costs down 26% compared to 20* Deposit volumes have started to increase during 2010 SEB named Best Bank in Latvia in annual banking awards** * Adjusted for goodwill write-down in Q2 20 ** Emeafinance CEE and CIS banking awards
93 Net interest income and volumes Baltic Latvia, LVL LVL m Net Interest Income distribution Q1 20 Q Mortgages Other lending Deposits LVL bn Mortgages Outstanding volume* Q1 Q2 Q3 Q4 Q1 Q2 Q3 Q4 Q1 Q2 Q3 Q4 % Margin 2.0 Q1 Q LVL bn Other lending Outstanding volume* Q1 Q2 Q3 Q4 Q1 Q2 Q3 Q4 Q1 Q2 * Adjusted to Group common definition Q3 Q4 % Margin 2.5 Q1 Q LVL bn Deposits Outstanding volume Q1 Q2 Q3 Q4 Q1 Q2 Q3 Q4 Q1 Q2 Q3 Q4 Margin Q1 Q %
94 Baltic Lithuania SEK m Jan Jun Total income % Interest, net % Commission, net 196-9% Expenses %* Profit bef. credit losses 186 Neg. Credit losses, net % Operating profit -693 RoE, % Neg. Neg. C/I * Total lending 50,300-27% Total deposits 25,500-12% Highlights Net interest income 35% lower than in 20 but stabilising Net credit provisions 57% lower than in 20. Second quarter 75% lower than in 1Q 2010 Costs down 19% compared to 20* Increase seen in level of banking transactions and credit card usage during 2010 SEB named most attractive employer in Lithuania** * Adjusted for goodwill write-down in Q2 20 ** CV Online and business newspaper Verslo Žinios 94
95 Net interest income and volumes Baltic Lithuania, LTL LTL m Net Interest Income distribution Q1 20 Q Mortgages Other lending Deposits LTL bn Mortgages Outstanding volume* Q1 Q2 Q3 Q4 Q1 Q2 Q3 Q4 Q1 Q2 Q3 Q4 % Margin 2.5 Q1 Q LTL bn Other lending Outstanding volume* Q1 Q2 Q3 Q4 Q1 Q2 Q3 Q4 Q1 Q2 * Adjusted to Group common definition Q3 Q4 % Margin 2.5 Q1 Q LTL bn Deposits Outstanding volume Q1 Q2 Q3 Q4 Q1 Q2 Q3 Q4 Q1 Q2 Q3 Margin Q4 Q1 Q %
96 Macro Update 96
97 Strong fundamentals in the Nordics Public sector/current account balances. Percent of GDP 10 Norway Public sector deficit, Greece Australia France Spain USA Canada Italy Euro-zone Ireland UK Denmark Finland Japan Sweden Germany Netherlands Current account balance, 2010 Source: OECD, SEB X-asset 97
98 Strong Nordic situation Nordic Corporate Debt/Asset ratio, % Dec-03 Dec-04 Dec-05 Dec-06 Source: Deutsche Bank, Norges Bank, Sveriges Riksbank, Dec- Debt/Asset ratios are back to levels seen prior to crisis Dec- Dec- Debt/Asset ratio Nordic Interest coverage ratio (x) Dec-03 Dec-04 Dec-05 Dec-06 Interest cov. ratio rising to 4x, but still below the 5x level seen prior crisis Interest coverage ratio Source: Deutsche Bank, Norges Bank, Sveriges Riksbank Dec- Dec- Dec- 10% Budget deficit (-) / surplus (+), (2010E, EU Commission forecast) 5% 0% -5% -10% Maastricht criterion -15% Ireland U.K. Spain Greece Portugal France Euro Area Netherlands Italy Denmark Belgium Germany Austria Finland Luxemb. Sweden Norway Source: Deutsche Bank, EU Commission, Eurostat 98
99 Sweden: Highest growth in the West GDP growth: 4.7% in 2010, 2.9% in 2011 and 2.7% in 2012 Bright picture supported by fiscal policy and low interest rates/yields, good balance Export sector and home price correction the main risks Labour market is strengthening unemployment about 7% by 2012 Low inflation: International situation, productivity, wages and salaries, stronger SEK Strong public finances: room for 2011 reforms is SEK 25 bn Central government debt will fall to about 27% of GDP Change in the Riksbank s game plan Front-loaded key rate hikes for interest rate-sensitive economy and krona Stronger krona against the euro (9.00 per EUR at year-end, 8.75 at close of 2011) 99
100 Sweden: Exports have taken off 20 Strongest merchandise exports since Year-on-year percentage change (LHS) Level (RHS) Source: Statistics Sweden, SEB 100
101 Sweden: Rapidly falling government debt Forecast assumes privatisations and currency loan repayment Privatisation: SEK 50 bn Currency loan: SEK 50 bn
102 Low residential investments and number of housing starts International comparison Marked recovery in Residential investment, % of GDP Number of housing starts in relation to population (%) Sweden Denmark UK Norway Spain USA Sweden US Denmark UK Norway Spain France 0.0 Jul-92 Apr-95 Jan-98 Oct-00 Jun-03 Mar-06 Dec- Source: Riksbank Stability Report 20:2 102
103 Sweden: Households interest rate burden still low Per cent of disposable income Sweden: Interest rate burden after taxes (LHS) Sweden: Debts (RHS) US: Debts (RHS) Source: Riksbank, Federal Reserve, SEB 103
104 Home prices: No adjustment in Sweden and Norway 250 Home prices Index 2000 = United Kingdom Norway US Denmark Spain Germany Sweden Source: Reuters EcoWin 104
105 Sweden - Total household savings 100% 90% 80% 70% 60% 50% 40% 30% 20% 10% 0% 04-IV 05-IV 06-IV -IV -IV -IV Housing Shareholdings Premium Pensions Bonds Mutual funds U-L insurance Trad insurance Bank deposits Source: SEB Savings Barometer Q
106 Balance sheet of Swedish households SEK m Assets Liabilities 12,000,000 10,000,000 8,000,000 6,000,000 4,000,000 2,000, IV 00-IV 01-IV 02-IV 03-IV 04-IV 05-IV 06-IV -IV -IV -IV 106
107 Sweden: Core inflation below 2 per cent 5 Low inflation Year-on-year percentage change 5 4 SEB forecast jan apr jul okt jan apr jul okt jan apr jul okt jan apr jul okt jan apr jul okt CPIF CPIF excl energy and food CPI Source: Statistics Sweden, SEB 1
108 Nordic central banks will have to go it alone for some time Key rates Per cent Forecast SEB Euro zone Norway Sweden Source: ECB, Norges Bank, Sveriges Riksbank, SEB 1
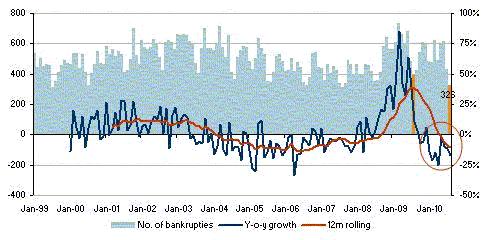
109 Swedish bankruptcies 1
110 Turnaround of Baltic macro situation GDP development back on positive growth* Estonia Latvia Lithuania a 2010f 2011f 2012f Exports have rebounded Index EU Sentiment indicator Estonia Latvia Lithuania Source: Reuters EcoWin Comments on recent macro events Estonia back on growth track, flash Q2 GDP signals first year-on-year increase since Q4 20 Latvia is bottoming out, strong industrial production in Q2 Lithuania back to growth, Q2 GDP grow with ~7% Estonia's adoption of the euro in 2011 will add further stability in the region overall *Nordic Outlook, Aug 31,
111 Internal adjustments have improved competitiveness Real effective exchange rates Index 100 = Estonia Lithuania Latvia Source: BIS 111
112 Less depressed internal demand will normalise CA Current account Per cent of GDP Estonia Latvia Lithuania Source: Reuters EcoWin 112
Facts & Figures January September 2009
 www.sebgroup.com Facts & Figures January September 2009 1 Contents Page SEB Group 3 15 Asset quality 16 29 Bond portfolios 30 36 Divisional level 37 42 Merchant Banking 43 53 Retail Banking 54 64 Wealth
Investor presentation. Result presentation
 Investor presentation Result presentation 21 Highlights Income Solid results given present macroeconomic climate Lower provisioning for credit losses and no new NPL formation Provisions for credit losses
Investor presentation. Result
 Investor presentation Result 2010 Highlights Income Stable earnings from a diversified platform Provisions for credit losses Net credit losses back to pre-crisis levels Strategic alignment Strategic alignment
Investor Presentation. Annual Accounts
 Investor Presentation Annual Accounts SEB a unique Nordic Bank Relationships Corporates Stability 2 Unique corporate franchise Truly embedded corporate bank Mergers & Acquisitions Foreign Exchange Trade
Investor Presentation. Result presentation. January September 2010
 Investor Presentation Result presentation January September 2010 Highlights Income Seasonally slow quarter supported by diversified earnings Further improved asset quality Baltics back in black Profit
Fact Book January September 2010
 Fact Book January September STOCKHOLM 28 OCTOBER SEB Fact book January September N Table of contents Table of contents...2 About SEB...3 SEB History...3 Financial targets...3 Organisation...4 Corporate
Fact Book January June 2011
 Fact Book January June STOCKHOLM 14 JULY SEB Fact Book January June N Table of contents Table of contents...2 About SEB...3 SEB history...3 Financial targets...3 Organisation...4 Corporate Governance...5
Fact Book January September 2010
 Fact Book January September STOCKHOLM 28 OCTOBER SEB Fact book January September N Table of contents Table of contents...2 About SEB...3 SEB History...3 Financial targets...3 Organisation...4 Corporate
Fact Book Annual Accounts 2010
 Fact Book Annual Accounts STOCKHOLM 4 FEBRUARY 211 SEB Fact Book Annual Accounts N Table of contents Table of contents...2 About SEB...3 SEB history...3 Financial targets...3 Organisation...4 Corporate
Annika Falkengren. President and CEO. Result presentation. January September 2010
 Annika Falkengren President and CEO Result presentation January September 2010 Highlights Income Seasonally slow quarter supported by diversified earnings Further improved asset quality Baltics back in
Annika Falkengren. Merrill Lynch Banking & Insurance CEO Conference. London. 30 September President and CEO
 Annika Falkengren President and CEO Merrill Lynch Banking & Insurance CEO Conference London 3 September 29 1 The starting point: SEB has a strong competitive position A long-term relationship bank Strong
Danske Nordic Bank Seminar
 Jan Erik Back CFO Danske Nordic Bank Seminar Copenhagen 2 September 2009 1 SEB s competitive position A long-term relationship bank Strong income and balance sheet Q2-recap, liquidity and capital Asset
Investor presentation. January September
 Investor presentation January September 2007 1 Outline Business activity and financial performance Comments on The current market situation and fixed income securities portfolios The Baltic countries The
Annika Falkengren. President and CEO. Result presentation
 Annika Falkengren President and CEO Result presentation 2010 Highlights Income Solid results given present macroeconomic climate Lower provisioning for credit losses and no new NPL formation Provisions
Fact Book January June 2013
 Fact Book January June STOCKHOLM 15 JULY SEB Fact Book January June 1 Table of contents About SEB... 4 Financial targets... 4 Rating... 4 Organisation...5 Full-time equivalents, end of quarter... 5 Corporate
Annika Falkengren. The relationship bank of the Nordics. CEO & President. Copenhagen January 11, 2011
 Annika Falkengren CEO & President The relationship bank of the Nordics Copenhagen January 11, 2011 SEB s anatomy 2010 in summary Outlook Conclusions 2 SEB a unique Nordic Bank Relationships Corporates
Annika Falkengren CEO
 Annika Falkengren CEO 2007 Highlights Q1 2007 Operating profit SEK 4.2bn Revenues exceeded SEK 10bn Continued high customer activity but more volatile capital markets Organic growth RWA: + 7% Stable costs
Fact Book January September 2013
 Fact Book January September STOCKHOLM 24 OCTOBER SEB Fact Book January-September 1 Table of contents About SEB... 4 Financial targets... 4 Rating... 4 Organisation...5 Full-time equivalents, end of quarter...
Annika Falkengren. President & CEO. Results 2009
 Annika Falkengren President & CEO Results 29 1 Highlights Q1 29 Strong underlying business SEK 4.8bn before provisions for credit losses and impairment charges Stable cost development Doubled collective
UBS Nordic Financial Services Conference Stockholm
 Annika Falkengren President and CEO UBS Nordic Financial Services Conference Stockholm 10 September 2009 1 The starting point: SEB has a strong competitive position A long-term relationship bank How we
Annika Falkengren CEO. UBS conference. May 14, 2007
 Annika Falkengren CEO UBS conference May 14, 2007 What we are How we differ Growth opportunities 2 SEB history Longstanding customer relationships Entrepreneurship International outlook Same major owners
Investor breakfast meeting
 Annika Falkengren President & CEO Jan Erik Back CFO Investor breakfast meeting 17 August 20 1 Priorities for 20 Maintain flexibility & resilience Exploit core strengths Corporates in Nordics & Germany
Fact Book January March 2014
 Fact Book January March 214 STOCKHOLM 25 APRIL 214 SEB Fact Book January March 214 1 Table of contents About SEB... 4 Financial targets... 4 Rating... 4 Organisation...5 Full-time equivalents, end of quarter...
Fact Book January June 2014
 Fact Book January June STOCKHOLM 14 JULY SEB Fact Book January June 1 Table of contents About SEB... 4 Financial targets... 4 Rating... 4 Organisation...5 Full-time equivalents, end of quarter... 5 Corporate
ABGSC Swedish Banks Treasury lunches
 ABGSC Swedish Banks Treasury lunches Nov 11, 211 Anders Kvist Head of Group Treasury Balance Sheet, Liquidity & Funding A strong balance sheet structure Sep 21 Balance sheet structure Liquid assets Cash
Morgan Stanley European Financials Conference, London 27 March Jan Erik Back CFO SEB
 Morgan Stanley European Financials Conference, London 27 March 212 Jan Erik Back CFO SEB In the new world, what are SEB s priorities? Relationship banking as the key franchise driver Response to the new
Annual Accounts Annika Falkengren President & CEO
 Annual Accounts 2014 Annika Falkengren President & CEO Unique economic environment Key Interest rates % 2.00 1.80 1.60 1.40 1.20 1.00 0.80 0.60 0.40 0.20 0.00 Jan-14 Sweden Norway Eurozone Feb-14 Mar-14
Investor presentation. Results 2009
 Investor presentation Results 2009 1 Highlights 2009 Strong underlying business SEK 4.8bn before provisions for credit losses and impairment charges Stable cost development Doubled collective provisions
Carnegie Nordic Large Cap Seminar Stockholm 4 March 2008 Mikael Inglander, CFO
 Carnegie Nordic Large Cap Seminar Stockholm 4 March 28 Mikael Inglander, CFO The leading bank in four small countries Sweden Total population: 9.2m Employees: 8,75 Private customers: 4.1m Corp. customers:
Fact book Q April 2007
 Fact book Q1 27 25 April 27 Contents page General information 2 Mission, vision, values and markets 2 Financial objectives 3 Geographic reach and market shares 4 Macro economic indicators 5-6 Business
Chart pack to council for cooperation on macroprudential policy
 Chart pack to council for cooperation on macroprudential policy Contents List of charts... 3 Macro and macro-financial setting... 5 Swedish macroeconomic setting... 5 Foreign macroeconomic setting... Macro-financial
Financial Results 2018 Johan Torgeby, President & CEO. Telephone conference 30 January 2019
 Financial Results 2018 Johan Torgeby, President & CEO Telephone conference 30 January 2019 jan-17 apr-17 jul-17 okt-17 jan-18 apr-18 jul-18 okt-18 jan-17 apr-17 jul-17 okt-17 jan-18 apr-18 jul-18 okt-18
Interim report Q October 2008 Jan Lidén President and CEO
 Interim report Q3 2008 23 October 2008 Jan Lidén President and CEO Content Highlights in Q3 results The macro-economic environment Comments on issues in focus Funding and liquidity Credit quality Business
Facts. Q3, 2007 October 24, 2007
 Facts October 24, 27 24 October, 27 Contents page General information 2 Mission, vision, values and markets 2 Financial objectives 3 Geographic reach and market shares 4 Macro economic indicators 5-6 Business
Fact Book. January September 2018 STOCKHOLM 25 OCTOBER 2018
 Fact Book January September STOCKHOLM 25 OCTOBER SEB Fact Book January September Table of contents Table of contents... 2 About SEB... 4 SEB history... 4 Organisation... 5 Share of operating profit...
Swedbank New York and Boston roadshow, September 24 26, Mikael Inglander, Chief Financial Officer
 Swedbank New York and Boston roadshow, September 24 26, 27 Mikael Inglander, Chief Financial Officer The leading bank in four small countries Sweden Total population: 9.m Private customers: 4.1m Corp.
Debt Investor Presentation FY 2013 and Q Financials. Thomas Bengtson Arne Boberg
 Debt Investor Presentation FY 2013 and Q1 2014 Financials Thomas Bengtson Arne Boberg More information Available on www.sebgroup.com You will find it under Investor Relations Disclaimer IMPORTANT NOTICE
Fact Book. Annual Accounts 2017 STOCKHOLM 31 JANUARY 2018
 Fact Book Annual Accounts STOCKHOLM 31 JANUARY 218 SEB Fact Book Annual Accounts Table of contents Table of contents... 2 About SEB... 4 SEB history... 4 Financial targets... 4 Rating... 4 Organisation...
Interim report, Q October, 2007 Jan Lidén CEO and President
 Interim report, Q3 2 24 October, 2 Jan Lidén CEO and President Summary January September 2 Shareholders net profit increased 12 percent to SEK 8,888m compared with previous year Net interest income was
Nomura Financial Services Conference London, 29 August Jan Erik Back, CFO
 Nomura Financial Services Conference London, 29 August 2012 Jan Erik Back, CFO SEB s strategy remains firm Universal bank in Sweden and the Baltics Corporate bank in the Nordics, Germany and internationally
Interim report Q April 25, 2007 Jan Lidén President and CEO
 Interim report Q1 2007 April 25, 2007 Jan Lidén President and CEO Highlights Q1 2007 Strong and stable results intact SEK 2,910m (2,270 Q1, 2006) Strong and stable results from all major business areas;
Investor Presentation
 Thomas Bengtson Johan Wallenborg Investor Presentation Paris Feb 2010 1 Contents SEB 2009 Results p.3 Swedish Housing Market p.29 Swedish Covered Bonds p.39 Swedish liquid Covered Bond market p.43 SEB
Debt Investor Presentation Financials Q Thomas Bengtson John Arne Wang
 Debt Investor Presentation Financials Q1 2015 Thomas Bengtson John Arne Wang More information Available on www.sebgroup.com You will find it under Investor Relations Disclaimer IMPORTANT NOTICE THIS PRESENTATION
Thomas Bengtson John Arne Wang. Debt Investor Presentation Q and FY 2015
 Debt Investor Presentation Q1 2016 and FY 2015 Thomas Bengtson John Arne Wang More information Available on www.sebgroup.com You will find it under Investor Relations Disclaimer IMPORTANT NOTICE THIS PRESENTATION
Fact Book January June 2017 STOCKHOLM 14 JULY 2017
 Fact Book January June 217 STOCKHOLM 14 JULY 217 SEB Fact Book January June 217 Table of contents Table of contents... 2 About SEB... 4 SEB history... 4 Financial targets... 4 Rating... 4 Organisation...
Swedbank s third quarter 2018 results
 Swedbank s third quarter 2018 results Birgitte Bonnesen (CEO), Anders Karlsson (CFO), Helo Meigas (CRO) Swedbank in the Baltics Swedbank s customers in the Baltics Market leader with a strong focus on
Anders Ek Executive Vice President, Head of Strategic and International Banking. Tokyo March 14, 2007
 Anders Ek Executive Vice President, Head of Strategic and International Banking Tokyo March 14, 2007 Swedbank - an introduction (2) A leading Nordic-Baltic bank Other markets, niche banking Denmark - Swedbank
UBS Global Financial Services conference New York, May 16, Jan Lidén CEO
 UBS Global Financial Services conference New York, May 16, 27 Jan Lidén CEO The leading bank in four small countries Sweden Total population: 9.m Private customers: 4.1m Corp. customers: 262, Organisations:
Nomura Annual Financials Conference 31 August Fredrik Rystedt. Group CFO / EVP
 Nomura Annual Financials Conference 31 August 2011 Fredrik Rystedt Group CFO / EVP Disclaimer This presentation contains forward-looking statements that reflect management s current views with respect
Baltics going forward
 Jan Erik Back CFO Baltics going forward November 25 20 SEB Baltic division background SEB Baltic division overview Universal banking services in all three countries Ranked No 1 by customers in Estonia
Annual Report 2007: Resilient results in turbulent times. 31 January 2008
 Annual Report 2007: Resilient results in turbulent times 31 January 2008 AGENDA Agenda Slide Key messages 3 Highlights 4 Business area highlights 18 Business trends 20 Outlook 27 Q&A session 28 Appendix
BoA Merrill Lynch Banking & Insurance CEO Conference London, 25 September 2012
 BoA Merrill Lynch Banking & Insurance CEO Conference London, 25 September 2012 Annika Falkengren President & CEO The message from last year s conference Stability Sustainable growth Continuous improvement
Press Conference Q2-17. Johan Torgeby President & CEO 14 July, 2017
 Press Conference Q2-17 Johan Torgeby President & CEO 14 July, 2017 Strong equity markets and improved market sentiment combined with low volatility and tightening of credit spreads CDS Spreads Swedish
Q4, February 2007
 16 February 27 Contents page Mission, vision, values and markets 2 Financial objectives 3 Geographic reach and market shares 4 Macro economic indicators 5 Cross selling, Internet bank and cards 6 Lending
Swedbank s year-end 2011 results. Michael Wolf, CEO Göran Bronner, CFO Håkan Berg, CRO
 Swedbank s year-end 2011 results Michael Wolf, CEO Göran Bronner, CFO Håkan Berg, CRO Delivered according to last years prospects Net profit of SEK 11.7bn for 2011 Core Tier 1 capital ratio of 15.7 per
Banking in a tough environment
 Banking in a tough environment Carnegie Nordic Large Cap Seminar Stockholm Tonny Thierry Andersen CFO & Member of the Executive Board March 3, 2009 The real economy is now severely affected Index Industrial
Keefe, Bruyette & Woods 2012 European Financials Conference 19 September Niklas Ekvall Head of Group Treasury
 Keefe, Bruyette & Woods 2012 European Financials Conference 19 September 2012 Niklas Ekvall Head of Group Treasury Disclaimer This presentation contains forward-looking statements that reflect management
Swedbank investor presentation. February 2014
 Swedbank investor presentation February 2014 Executive summary Market position Swedbank (A+/A1/A+) is the largest retail bank in Sweden and the market leader in private mortgages and deposits in all of
= = = = Annual Accounts 2010
 Annual Accounts 2010 STOCKHOLM 4 FEBRUARY 2011 For comparative purposes, the Group s income statement has been restated as continuing and discontinued operations, reflecting the divestment of SEB s German
Debt Investor Presentation Jan- Sep 2014 Financials Thomas Bengtson
 Debt Investor Presentation Jan- Sep 2014 Financials Thomas Bengtson More information Available on www.sebgroup.com You will find it under Investor Relations Disclaimer IMPORTANT NOTICE THIS PRESENTATION
Executive Board meeting. 14 December 2011
 Executive Board meeting December EU measures ECB Key policy rate has been reduced to. percent Measures: Liquidity operation with a maturity of months Reserve requirements reduced from to per cent Reduced
Facts. Q1, April 2010
 Facts 27 April 21 27 April 21 Contents page General information 2 Geographic reach 2 Macro economic indicators 3-4 Business volumes 5 Business volumes 5 Lending 6-7 Savings and investments 8 Other products
Swedbank year-end results 2018
 Swedbank year-end results 218 Birgitte Bonnesen (CEO), Anders Karlsson (CFO), Helo Meigas (CRO) Strong financial result in 218 delivered on strategic priorities SELECTED 218 DELIVERIES Continued digitisation
Facts. Q2, 2010 July 22, 2010
 Facts Q2, 21 July 22, 21 Q2, 21 22 July 21 Contents page General information 2 Geographic reach 2 Macro economic indicators 3-4 Business volumes 5 Business volumes 5 Lending 6-7 Savings and investments
RESULTS DNB GROUP FOURTH QUARTER
 RESULTS DNB GROUP FOURTH QUARTER 03.02.2017 Major achievements in 2016 CET1 ratio requirement reached one year ahead of plan. CET1 ratio 16.0 per cent. Leverage ratio 7.3 per cent, well above the upcoming
Swedbank s second quarter 2013 results. Michael Wolf, CEO Göran Bronner, CFO Håkan Berg, CRO
 Swedbank s second quarter 213 results Michael Wolf, CEO Göran Bronner, CFO Håkan Berg, CRO Retail Stable results continue SEKm Q2 12 Q1 13 Q2 13 Q/Q Y/Y Net interest income 3 362 3 332 3 367 35 5 Net commissions
Can performance continue?
 Can performance continue? UBS 13 th Annual Nordic Financial Services Conference 2 September 21 CEO Rune Bjerke Strong pre-crisis position 35 3 25 2 15 1 5 3 25 2 15 1 5 2 4 Pre-crisis market capitalisation
Handelsbanken January June July 2013
 Handelsbanken January June 2013 17 July 2013 Q307 Q407 Q108 Q208 Q308 Q408 Q109 Q209 Q309 Q409 Q110 Q210 Q310 Q410 Q111 Q211 Q311 Q411 Q112 Q212 Q312 Q412 Q113 Q213 Handelsbanken Group Average annual growth
Capital efficiency and cost control. Bjørn Erik Næss, CFO
 Capital efficiency and cost control Bjørn Erik Næss, CFO 4 Capital efficiency and cost control Adequately capitalised Strict cost control Strong funding position 2 Macro parameters Norway - key assumptions
First quarter results April Michael Wolf, CEO and Erkki Raasuke, CFO
 First quarter results 2009 23 April 2009 Michael Wolf, CEO and Erkki Raasuke, CFO Reduce current risk levels 1. Secure asset quality by pro-active measures 2. Protect earnings capacity throughout the downturn
Telephone Conference Q Johan Torgeby, President & CEO
 Telephone Conference Q3 2018 Johan Torgeby, President & CEO Highlights YTD 2018 Solid result despite seasonal slowdown Healthy corporate activity continued in Q3 Strong capital position, robust asset quality
Pohjola Group. Interim Report for 1 January 30 September Pohjola/IR
 Pohjola Group Interim Report for 1 January 3 September 29 2 Contents Pohjola in Brief 3 Strategy and Financial targets 7 Interim Report for Q1 3/9 14 Review by Business Segment Banking 26 Asset Management
Second Quarter Report 2010
 Copenhagen, Helsinki, Oslo, Stockholm, 21 July 2010 Second Quarter Report 2010 CEO Christian Clausen s comment to the report: We have seen a positive development in our customer business with a record
Telephone Conference Q2-18 Johan Torgeby President & CEO 17 July, 2018
 Telephone Conference Q2-18 Johan Torgeby President & CEO 17 July, 2018 Highlights Jan-Jun 2018 Pick-up in customer activity following a muted start of the year Broad based demand for SEB s services Strong
Goldman Sachs Roadshow 6-7 December Gunn Wærsted Executive Vice President, Head of Wealth Management
 Goldman Sachs Roadshow 6-7 December 2012 Gunn Wærsted Executive Vice President, Head of Wealth Management Disclaimer This presentation contains forward-looking statements that reflect management s current
Contents Nordea overview Group Corporate Centre Group Functions Key financial figures Risk, liquidity and capital management Business areas
 Contents Nordea overview Group Corporate Centre - Nordea in brief 3 - Group Corporate Centre Financial highlights 34 - Board of Directors & GEM 4 - Rating 6 Group Functions - Nordea s largest shareholders
Swedbank s second quarter 2018 results
 Swedbank s second quarter 218 results Anders Karlsson (CFO), Helo Meigas (CRO) Group financial highlights TOTAL INCOME SEK 11.8bn 12 8 4 Total income, SEKbn Strong loan volume growth Higher commission
SEB Enskilda Nordic Banks Seminar. Stockholm, 26 May Carl-Johan Granvik Group CRO
 SEB Enskilda Nordic Banks Seminar Stockholm, 26 May 2010 Carl-Johan Granvik Group CRO Disclaimer This presentation contains forward-looking statements that reflect management s current views with respect
Highlights of Handelsbanken s annual report
 Highlights of Handelsbanken s annual report January - December 2008 * Summary of Q4 2008, compared with Q3 2008 Operating profits rose by 39% to SEK 5,216m (3,758). Excluding capital gains, operating profits
Swedbank s third quarter 2012 results London
 Swedbank s third quarter 212 results London Reduced tail risk but weaker economic outlook Low growth/low interest rate environment will remain Sweden benefits from strong financials Regulation drives:
Contents Nordea overview Group Corporate Centre Group Functions Key financial figures Risk, liquidity and capital management Business areas
 Contents Nordea overview Group Corporate Centre - Nordea in brief 3 - Group Corporate Centre Financial highlights 34 - Board of Directors & GEM 4 - Rating 6 Group Functions - Nordea s largest shareholders
Swedbank Interim report, Q April 25, 2007
 Swedbank Interim report, Q1 2007 April 25, 2007 CONTINUED STRONG MOMENTUM ON ALL MARKETS Stable net profit for first quarter 2007 compared with fourth quarter 2006 Net profit for the period amounted to
Third Quarter Results 2008 BBVA
 Third Quarter Results 2008 BBVA Madrid, October 29 th 2008 Contents Group results for 9M08 Results by business area Spain & Portugal Wholesale Banking & Asset Management Mexico USA South America Conclusions
Supplementary Financial Information JANUARY DECEMBER 2017
 Supplementary Financial Information JANUARY DECEMBER 2017 1 Disclaimer This presentation may contain forward-looking statements that reflect management s current views with respect to certain future events
Swedbank year-end report 2017
 Swedbank year-end report 217 Birgitte Bonnesen (CEO), Anders Karlsson (CFO), Helo Meigas (CRO) Swedish Banking Solid mortgage volume growth SEKm Q4 17 Q3 17 QoQ Net interest income 3 861 3 812 49 Net commission
SEE macroeconomic outlook Recovery gains traction, fiscal discipline improving. Alen Kovac, Chief Economist EBC May 2016 Ljubljana
 SEE macroeconomic outlook Recovery gains traction, fiscal discipline improving Alen Kovac, Chief Economist EBC May 216 Ljubljana Real economy highlights Recent GDP track record reveals more favorable footprint
6 th Capital Markets Day 12 December 2008, Vienna
 , Vienna An in-depth look at assets and asset quality Bernhard Spalt, Chief Risk Officer Presentation topics Analysing customer loans Overview CEE loan book in detail Real estate loans in detail Non-performing
Investor Presentation January December 2017
 Investor Presentation January December 2017 Disclaimer IMPORTANT NOTICE THIS PRESENTATION IS NOT AN OFFER OR SOLICITATION OF AN OFFER TO BUY OR SELL SECURITIES. IT IS SOLELY FOR USE AT AN INVESTOR PRESENTATION
January March Investor presentation
 January March 2014 Investor presentation Disclaimer IMPORTANT NOTICE THIS PRESENTATION IS NOT AN OFFER OR SOLICITATION OF AN OFFER TO BUY OR SELL SECURITIES. IT IS SOLELY FOR USE AT AN INVESTOR PRESENTATION
Highlights of Handelsbanken s Annual Report
 Highlights of Handelsbanken s Annual Report HIGHLIGHTS OF ANNUAL REPORT JANUARY DECEMBER Highlights of Handelsbanken s Annual Report January - December Summary January December, compared with January December
Swedbank s third quarter 2013 results
 Swedbank s third quarter 213 results Michael Wolf, CEO Göran Bronner, CFO Anders Karlsson, CRO Swedbank Retail Stable results SEKm Q3 12 Q2 13 Q3 13 Q/Q Y/Y Net interest income 3 45 3 367 3 473 16 68 Net
Interim report Q August, 2007 Jan Lidén CEO and President
 Interim report Q2 27 7 August, 27 Jan Lidén CEO and President Summary Q2 27 (Q1 27) Continued improved results: SEK 3,112m (2,91 in Q1 27) Earnings per share increased 7% compared with Q1 27 Net interest
Swedbank s third quarter 2017 results
 Swedbank s third quarter 217 results Birgitte Bonnesen (CEO), Anders Karlsson (CFO), Helo Meigas (CRO) Swedish Banking Good loan volume growth SEKm Q3 17 Q2 17 QoQ Net interest income 3 811 3 792 19 Net
Danske Bank. Conservatism or weak asset quality? Henrik Hoffmann Executive Vice President, Group Credits March 27, 2009
 Danske Bank Conservatism or weak asset quality? Henrik Hoffmann Executive Vice President, Group Credits March 27, 2009 Agenda 1. Market situation: Very pessimistic outlook 2. The credit organization in
Supplementary Financial Information Sampo Group. January-December 2010
 Supplementary Financial Information Sampo Group January-December 2010 Disclaimer This presentation may contain forward-looking statements that reflect management s current views with respect to certain
Danske Bank Fact Book Q Fact Book Q Supplementary Information for Investors and Analysts. Unaudited. Updated: January 31, 2008
 Fact Book Q4 2007 Supplementary Information for Investors and Analysts Unaudited Updated: January 31, 2008 1 Table of contents 1.1. Financial goals 4 1.2. Share Data 4 1.3. Ratings 5 1.4. Changes in accounting
OUTLOOK FOR THE NEW ZEALAND GOVERNMENT DEBT MARKET. 1 The Treasury
 OUTLOOK FOR THE NEW ZEALAND GOVERNMENT DEBT MARKET 1 The Treasury TODAY Economic outlook New Zealand Government: risk/reward Fiscal priorities NZDMO s strategy What to watch for 2 1. ECONOMIC OUTLOOK 3
Goldman Sachs Financials Conference. Sustaining profitability despite challenging funding conditions. Frans Lindelöw
 Goldman Sachs Financials Conference Sustaining profitability despite challenging funding conditions Frans Lindelöw Group Executive Management Berlin, 13 June 2008 Disclaimer This presentation contains
Financial Results 2013
 Financial Results 2013 Creating a New Base for the Future 13 February 2014 Gerard van Olphen (Chairman of the Board) Maurice Oostendorp (CFRO) I. Highlights 2013, Strategy Update SNS REAAL FINANCIAL RESULTS
Europe Outlook. Third Quarter 2015
 Europe Outlook Third Quarter 2015 Main messages 1 2 3 4 5 Moderation of global growth and slowdown in emerging economies, with downside risks The recovery continues in the eurozone, but still marked by