Intelligent Statistical Methods for Safer and More Robust Qualifications
|
|
|
- Kathlyn Tyler
- 6 years ago
- Views:
Transcription
1 equivalence Intelligent Statistical Methods for Safer and More Robust Qualifications Wayne J. Levin M.A.Sc. P.Eng President: Predictum Inc. Disclaimer: Predictum Inc. will not be liable for any loss or damage which you may suffer as a result of or connected with the download, viewing or application of methods and advice contained in this file. PREDICTUM INC
2 items Why Qualifications Fail: Engineers Top 10 List How many do I really need to measure? How do I know they are the same? Statistical Methods Assuring Equivalence thoughts and recommendations
3 Deming s production viewed as a system Suppliers of materials & equipment Design & Redesign Consumer Research A B Production & test of materials Production, assembly, inspection Distribution Consumers C D Tests of processes, machines, methods, costs W. Edwards Deming, Out of the Crisis, p.2
4 top 10 risks in qualification Disclaimer: Predictum Inc. will not be liable for any loss or damage which you may suffer as a result of or connected with the download, viewing or application of methods and advice contained in this file. PREDICTUM INC
5 Full Risk is not analyzed A full risk analysis is not done beforehand; purpose(s) of the process, inputs, outputs, measures. The qualification plan is not based on this full risk analysis. A Secondary purpose or effect is not accounted for While the primary purpose of the process is accounted for, possible secondary purposes are not discussed or known and thus potentially not examined and checked. Insufficient Sample Size The sample size used cannot detect shifts with reasonable probability. The probability of missing a shift is not examined up front and thus relative risk is not known.
6 Unexamined Sources of Variation The potential sources of variation were not examined beforehand. Sample and run design does not take into account relevant potential sources of variation. Interactions not tested; Unwanted bias not controlled Interactions between possible factors are not known and not tested. The factor being changed and qualified may interact with other factors that are not being tested.
7 Unwanted bias not controlled or Covariates unaccounted Runs are not randomized but made with intended or unintended patterns; shift to shift, tool to tool, Device to Device, etc.. These patterns are not accounted for in the analysis. Variables that cannot be controlled but may be significant are not measured and included in the analysis. Qualification testing fails to include variation Testing for equivalence is done only on the process average but fails to include potential changes in process variation. This is especially dangerous for low Cpk processes.
8 Testing Equivalence using the wrong control The control sample includes sources of variation that are special cause related or not included in the qualification sample. This inflates the variation used in testing and can hide potentially significant shifts. Shift within Specification Wide specification limits allow for a shift. This shift may bring the process into an area never run in before, but still within specification.
9 Future results are not simulated Given the shift due to the change, the expectation of future performance and Cpk is not simulated up front. No follow-up checks and/or no monitors to catch drift Critical parameters are not checked post change. No follow-up is done to check for stability of the change.
10 ACT PLAN STUDY DO
11 ACT PLAN STUDY DO ACT PLAN STUDY DO
12 Decide whether to put the tool/material into production PLAN Full Risk Analysis Variance Analysis Power Analysis Equivalence Value ACT ACT PLAN STUDY DO STUDY DO Oneway ANOVA Equivalence Unequal Variance Test Normal Quantile Plot QQ-Plot Simulation / Cpk Analysis Collect Data
13 plan:sampling HOW MANY? FROM WHAT LOCATION? Disclaimer: Predictum Inc. will not be liable for any loss or damage which you may suffer as a result of or connected with the download, viewing or application of methods and advice contained in this file. PREDICTUM INC
14 PLAN Full Risk Analysis Variance Analysis Power Analysis Equivalence Value ACT ACT PLAN STUDY DO STUDY DO
15 plan:sampling representative: capture the dominant sources of process variation look for patterns in your variation sufficient: sample enough data to be sure to see a difference if it is there

16 edge effect Though these wafers went through one step, there are, apparently, two process conditions in effect: outer dies versus inner dies

17 edge effect A 3D view of the same wafers
18 Deming s production viewed as a system Suppliers of materials & equipment Design & Redesign Consumer Research A B C Production & test of materials Production, assembly, inspection Distribution Consumers OUTER INNER D Tests of processes, machines, methods, costs W. Edwards Deming, Out of the Crisis, p.2
19 variance components within wafer wafer-to-wafer lot-to-lot

")
20 variance components Lot-to-lot variation is the highest component: 2/3 wafer-to-wafer, within lot is 28% Residual = within wafer (site-to-site) variation


21 Moose Jaw 2708 KM Toronto
22 power Power is the ability to detect a difference if it is there. Usually want power to be above 0.80.

23 microscope: the more powerful, the more insights that can be seen

24 power Power is affected by: sample size: the more data, the higher power alpha: the higher alpha risk, the higher power standard deviation: the more variability, the less power delta: bigger differences are easier to see (higher power)
25 power:sample size
26 power:alpha
27 power:variability
28 power:delta
29 plan:equivalence How much of a difference is considered equivalent?
30 PLAN ACT ACT PLAN STUDY DO STUDY DO
31 study Disclaimer: Predictum Inc. will not be liable for any loss or damage which you may suffer as a result of or connected with the download, viewing or application of methods and advice contained in this file. PREDICTUM INC
32 PLAN ACT ACT PLAN STUDY DO STUDY DO Oneway ANOVA Equivalence Unequal Variance Test Normal Quantile Plot QQ-Plot Simulation / Cpk Analysis
33 hypothesis testing Disclaimer: Predictum Inc. will not be liable for any loss or damage which you may suffer as a result of or connected with the download, viewing or application of methods and advice contained in this file. PREDICTUM INC
34 Concerning Hypothesis Testing: Small wonder that students have trouble. They may be trying to think. W. Edwards Deming On Probability as a Basis for Action The American Statistician, Vol.29, No. 4, 1975, pp
 p < alpha: reject H 0 Reject H0 Fail")
35 plan:sampling Step 1: Know your Null Hypothesis H 0 for equivalence: the pre & post processes average and variances are the same Step 2: Determine alpha alpha is inversely proportional to risk Step 3: Collect your data and conduct analysis Step 4: Compare p-value to alpha p > alpha: Fail to reject H 0 (accept H 0 ) p < alpha: reject H 0 Reject H0 Fail to Reject H0
36 errors Type I False Signal make a change that does not result in improvement controlled by alpha: occurs alpha% of the time Type II Missed opportunity fail to make a change that would result in improvement controlled by beta (determined by alpha, sample size, variability and the difference you wish to detect)

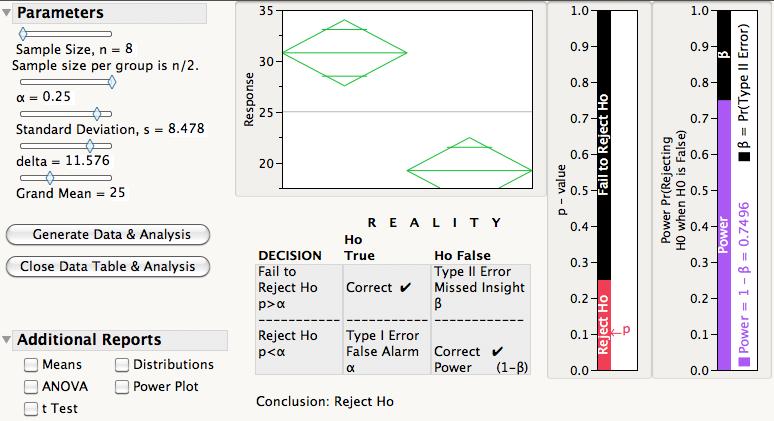
37 example 1 Step 1: H 0 for equivalence: the pre & post processes averages are the same Step 2: alpha = 0.05 Step 3: Data complete - analysis at right Step 4: p > alpha: Fail to reject H 0 (accept H 0 )
38 example 2 Step 1: H 0 for equivalence: the pre & post processes averages are the same Step 2: alpha = 0.05 Step 3: Data complete - analysis at right Step 4: p < alpha: reject H 0 (accept H 0 )
39 equivalence testing Disclaimer: Predictum Inc. will not be liable for any loss or damage which you may suffer as a result of or connected with the download, viewing or application of methods and advice contained in this file. PREDICTUM INC

40 equivalence testing Same difference for both 26 observations p-value > 0.2 Fail to reject H0 100 observations p-value < 0.05 Reject H0 Any difference, no matter how small, can be found to be significantly different, if the sample size is big enough
41 equivalence establish a minimum difference is to be considered practically zero if the actual difference is = to a this difference, then declare PRE POST if the actual difference is closer to zero, then declare PRE= POST
 is not significantly different than the difference considered to be")
42 different the actual difference (1.8) is not significantly different than the difference considered to be practically zero (2) a high p-value means different
43 equivalent the actual difference (0.22) is significantly different than the difference considered practically zero (2) Note the low p- values indicated that actual difference is significantly different than the practical difference
44 evaluating equivalence location, variance & shape Disclaimer: Predictum Inc. will not be liable for any loss or damage which you may suffer as a result of or connected with the download, viewing or application of methods and advice contained in this file. PREDICTUM INC

45 all equivalent normal quantile plot points on top of each other
46 H0: the variances are equal alpha = 0.05 p > alpha fail to reject H0
47
48 different distributions Variances are different Normal quantile plot slopes are different
49 H0: the variances are equal alpha = 0.05 p > alpha reject H0

50 the shape of a distribution is not easily determined with a control chart
51 location & variation are different Normal quantile plot has different slopes points follow their respective lines indicating that they are normally distributed
52 H0: the variances are equal alpha = 0.05 p > alpha reject H0
53

54 same location different variation normal quantile plots have different slopes

55 Note that the normal quantile plot intersect each other at the center p-values are low, reject H0 that the variances are the same
56 note the average is the same across both PRE and POST Control Limits show change in variation

57 location different, variance the same Normal quantile plot slopes are the same Normal quantile plot slopes are separated
58
59 Control limits are the same width processes are centered differently

60 study:q-q Plot Quantile- Quantile plot shows equivalence among location variation shape
61 equivalent The points follow the diagonal line Equivalent average variability
62 Different distributions off-diagonal curvature
63 same distribution, variance different location points parallel to the diagonal
64 different variability & location no curvature - same distribution different slope - different variability points intersect red line offcenter - different location

65 different variability & location no curvature - same distribution different slope - different variability points intersect red line at center - same location
66 Decide whether to put the tool/material into production PLAN ACT ACT STUDY PLAN DO STUDY DO
67 thoughts and recommendations THE NEW NORMAL Disclaimer: Predictum Inc. will not be liable for any loss or damage which you may suffer as a result of or connected with the download, viewing or application of methods and advice contained in this file. PREDICTUM INC


68 sample size:a big challenge more data is required to determine the shape of a distribution

69 reduce variation! High variability, low power. Each additional sample provides very little power Low variability, high power. Each additional sample provides a lot more power
70 cooperate with your suppliers! Suppliers of materials & equipment Design & Redesign Consumer Research A B Production & test of materials Production, assembly, inspection Distribution Consumers C D Tests of processes, machines, methods, costs W. Edwards Deming, Out of the Crisis, p.2
71 3. Cease dependence on inspection to achieve quality. The 14 points W. Edwards Deming Out of the Crisis, MIT 1982 Quals are inspections. Innovate to reduce the need to perform quals Build systems that facilitate diligence and maintain stability (not easy to do - but imagine the benefits to yield, quality & productivity)

72 smed single minute exchange of die changed the system

73 1. Create constancy of purpose for improvement of product and service. The 14 points W. Edwards Deming Out of the Crisis, MIT 1982
74 Control In control process maximum productivity given the current system change the system to achieve higher levels of productivity
75 items Why Qualifications Fail: Engineers Top 10 List How many do I really need to measure? How do I know they are the same? Statistical Methods Assuring Equivalence thoughts and recommendations
76 Questions?
77 how can we help? Wayne J. Levin M.A.Sc. P.Eng (416)
Tests for Two Variances
 Chapter 655 Tests for Two Variances Introduction Occasionally, researchers are interested in comparing the variances (or standard deviations) of two groups rather than their means. This module calculates
Tests for One Variance
 Chapter 65 Introduction Occasionally, researchers are interested in the estimation of the variance (or standard deviation) rather than the mean. This module calculates the sample size and performs power
Tests for Two Means in a Multicenter Randomized Design
 Chapter 481 Tests for Two Means in a Multicenter Randomized Design Introduction In a multicenter design with a continuous outcome, a number of centers (e.g. hospitals or clinics) are selected at random
Copyright 2011 Pearson Education, Inc. Publishing as Addison-Wesley.
 Appendix: Statistics in Action Part I Financial Time Series 1. These data show the effects of stock splits. If you investigate further, you ll find that most of these splits (such as in May 1970) are 3-for-1
Two-Sample T-Tests using Effect Size
 Chapter 419 Two-Sample T-Tests using Effect Size Introduction This procedure provides sample size and power calculations for one- or two-sided two-sample t-tests when the effect size is specified rather
Tests for Intraclass Correlation
 Chapter 810 Tests for Intraclass Correlation Introduction The intraclass correlation coefficient is often used as an index of reliability in a measurement study. In these studies, there are K observations
Mean GMM. Standard error
 Table 1 Simple Wavelet Analysis for stocks in the S&P 500 Index as of December 31 st 1998 ^ Shapiro- GMM Normality 6 0.9664 0.00281 11.36 4.14 55 7 0.9790 0.00300 56.58 31.69 45 8 0.9689 0.00319 403.49
Tests for the Difference Between Two Linear Regression Intercepts
 Chapter 853 Tests for the Difference Between Two Linear Regression Intercepts Introduction Linear regression is a commonly used procedure in statistical analysis. One of the main objectives in linear regression
PASS Sample Size Software
 Chapter 850 Introduction Cox proportional hazards regression models the relationship between the hazard function λ( t X ) time and k covariates using the following formula λ log λ ( t X ) ( t) 0 = β1 X1
ENGM 720 Statistical Process Control 4/27/2016. REVIEW SHEET FOR FINAL Topics
 REVIEW SHEET FOR FINAL Topics Introduction to Statistical Quality Control 1. Definition of Quality (p. 6) 2. Cost of Quality 3. Review of Elementary Statistics** a. Stem & Leaf Plot b. Histograms c. Box
Superiority by a Margin Tests for the Ratio of Two Proportions
 Chapter 06 Superiority by a Margin Tests for the Ratio of Two Proportions Introduction This module computes power and sample size for hypothesis tests for superiority of the ratio of two independent proportions.
Washington University Fall Economics 487. Project Proposal due Monday 10/22 Final Project due Monday 12/3
 Washington University Fall 2001 Department of Economics James Morley Economics 487 Project Proposal due Monday 10/22 Final Project due Monday 12/3 For this project, you will analyze the behaviour of 10
The Assumption(s) of Normality
 of Normality") The Assumption(s) of Normality Copyright 2000, 2011, 2016, J. Toby Mordkoff This is very complicated, so I ll provide two versions. At a minimum, you should know the short one. It would be great if you
The Assumption(s) of Normality Copyright 2000, 2011, 2016, J. Toby Mordkoff This is very complicated, so I ll provide two versions. At a minimum, you should know the short one. It would be great if you
WHS FutureStation - Guide LiveStatistics
 WHS FutureStation - Guide LiveStatistics LiveStatistics is a paying module for the WHS FutureStation trading platform. This guide is intended to give the reader a flavour of the phenomenal possibilities
Estimating Beta. The standard procedure for estimating betas is to regress stock returns (R j ) against market returns (R m ): R j = a + b R m
 against market returns (R m ): R j = a + b R m") Estimating Beta 122 The standard procedure for estimating betas is to regress stock returns (R j ) against market returns (R m ): R j = a + b R m where a is the intercept and b is the slope of the regression.
Estimating Beta 122 The standard procedure for estimating betas is to regress stock returns (R j ) against market returns (R m ): R j = a + b R m where a is the intercept and b is the slope of the regression.
Rand Final Pop 2. Name: Class: Date: Multiple Choice Identify the choice that best completes the statement or answers the question.
 Name: Class: Date: Rand Final Pop 2 Multiple Choice Identify the choice that best completes the statement or answers the question. Scenario 12-1 A high school guidance counselor wonders if it is possible
Planning Sample Size for Randomized Evaluations Esther Duflo J-PAL
 Planning Sample Size for Randomized Evaluations Esther Duflo J-PAL povertyactionlab.org Planning Sample Size for Randomized Evaluations General question: How large does the sample need to be to credibly
Is a Binomial Process Bayesian?
 Is a Binomial Process Bayesian? Robert L. Andrews, Virginia Commonwealth University Department of Management, Richmond, VA. 23284-4000 804-828-7101, rlandrew@vcu.edu Jonathan A. Andrews, United States
Subject CS1 Actuarial Statistics 1 Core Principles. Syllabus. for the 2019 exams. 1 June 2018
 ` Subject CS1 Actuarial Statistics 1 Core Principles Syllabus for the 2019 exams 1 June 2018 Copyright in this Core Reading is the property of the Institute and Faculty of Actuaries who are the sole distributors.
Non-Inferiority Tests for the Odds Ratio of Two Proportions
 Chapter Non-Inferiority Tests for the Odds Ratio of Two Proportions Introduction This module provides power analysis and sample size calculation for non-inferiority tests of the odds ratio in twosample
Washington University Fall Economics 487
 Washington University Fall 2009 Department of Economics James Morley Economics 487 Project Proposal due Tuesday 11/10 Final Project due Wednesday 12/9 (by 5:00pm) (20% penalty per day if the project is
Non-Inferiority Tests for the Ratio of Two Means in a 2x2 Cross-Over Design
 Chapter 515 Non-Inferiority Tests for the Ratio of Two Means in a x Cross-Over Design Introduction This procedure calculates power and sample size of statistical tests for non-inferiority tests from a
Tests for Two Independent Sensitivities
 Chapter 75 Tests for Two Independent Sensitivities Introduction This procedure gives power or required sample size for comparing two diagnostic tests when the outcome is sensitivity (or specificity). In
Tests for Two Means in a Cluster-Randomized Design
 Chapter 482 Tests for Two Means in a Cluster-Randomized Design Introduction Cluster-randomized designs are those in which whole clusters of subjects (classes, hospitals, communities, etc.) are put into
Data Analysis and Statistical Methods Statistics 651
 Data Analysis and Statistical Methods Statistics 651 http://www.stat.tamu.edu/~suhasini/teaching.html Lecture 14 (MWF) The t-distribution Suhasini Subba Rao Review of previous lecture Often the precision
Planning Sample Size for Randomized Evaluations
 Planning Sample Size for Randomized Evaluations Jed Friedman, World Bank SIEF Regional Impact Evaluation Workshop Beijing, China July 2009 Adapted from slides by Esther Duflo, J-PAL Planning Sample Size
Non-Inferiority Tests for the Ratio of Two Proportions
 Chapter Non-Inferiority Tests for the Ratio of Two Proportions Introduction This module provides power analysis and sample size calculation for non-inferiority tests of the ratio in twosample designs in
Mixed Models Tests for the Slope Difference in a 3-Level Hierarchical Design with Random Slopes (Level-3 Randomization)
") Chapter 375 Mixed Models Tests for the Slope Difference in a 3-Level Hierarchical Design with Random Slopes (Level-3 Randomization) Introduction This procedure calculates power and sample size for a three-level
Chapter 375 Mixed Models Tests for the Slope Difference in a 3-Level Hierarchical Design with Random Slopes (Level-3 Randomization) Introduction This procedure calculates power and sample size for a three-level
Key Objectives. Module 2: The Logic of Statistical Inference. Z-scores. SGSB Workshop: Using Statistical Data to Make Decisions
 SGSB Workshop: Using Statistical Data to Make Decisions Module 2: The Logic of Statistical Inference Dr. Tom Ilvento January 2006 Dr. Mugdim Pašić Key Objectives Understand the logic of statistical inference
CAES Workshop: Risk Management and Commodity Market Analysis
 CAES Workshop: Risk Management and Commodity Market Analysis ARE THE EUROPEAN CARBON MARKETS EFFICIENT? -- UPDATED Speaker: Peter Bell April 12, 2010 UBC Robson Square 1 Brief Thanks, Personal Promotion
Master s in Financial Engineering Foundations of Buy-Side Finance: Quantitative Risk and Portfolio Management. > Teaching > Courses
 Master s in Financial Engineering Foundations of Buy-Side Finance: Quantitative Risk and Portfolio Management www.symmys.com > Teaching > Courses Spring 2008, Monday 7:10 pm 9:30 pm, Room 303 Attilio Meucci
IEOR 130 Fall, 2017, Prof. Leachman Solutions to Homework #2
 IEOR 130 Fall, 017, Prof. Leachman Solutions to Homework # 1. Speedy Micro Devices Co. (SMD) fabricates microprocessor chips. SMD sells the microprocessor in three speeds: 300 megahertz ("Bin 1"), 33 megahertz
Properties of Probability Models: Part Two. What they forgot to tell you about the Gammas
 Quality Digest Daily, September 1, 2015 Manuscript 285 What they forgot to tell you about the Gammas Donald J. Wheeler Clear thinking and simplicity of analysis require concise, clear, and correct notions
KARACHI UNIVERSITY BUSINESS SCHOOL UNIVERSITY OF KARACHI BS (BBA) VI
 VI") 88 P a g e B S ( B B A ) S y l l a b u s KARACHI UNIVERSITY BUSINESS SCHOOL UNIVERSITY OF KARACHI BS (BBA) VI Course Title : STATISTICS Course Number : BA(BS) 532 Credit Hours : 03 Course 1. Statistical
88 P a g e B S ( B B A ) S y l l a b u s KARACHI UNIVERSITY BUSINESS SCHOOL UNIVERSITY OF KARACHI BS (BBA) VI Course Title : STATISTICS Course Number : BA(BS) 532 Credit Hours : 03 Course 1. Statistical
Equivalence Tests for the Odds Ratio of Two Proportions
 Chapter 5 Equivalence Tests for the Odds Ratio of Two Proportions Introduction This module provides power analysis and sample size calculation for equivalence tests of the odds ratio in twosample designs
Group-Sequential Tests for Two Proportions
 Chapter 220 Group-Sequential Tests for Two Proportions Introduction Clinical trials are longitudinal. They accumulate data sequentially through time. The participants cannot be enrolled and randomized
A New Methodology for Measuring Actual to Expected Performance
 A New Methodology for Measuring Actual to Expected Performance Jochen Ruß, Institut für Finanz- und Aktuarwissenschaften Daniel Bauer, Georgia State University This talk is based on joint work with Nan
Web Science & Technologies University of Koblenz Landau, Germany. Lecture Data Science. Statistics and Probabilities JProf. Dr.
 Web Science & Technologies University of Koblenz Landau, Germany Lecture Data Science Statistics and Probabilities JProf. Dr. Claudia Wagner Data Science Open Position @GESIS Student Assistant Job in Data
Exam 2 Spring 2015 Statistics for Applications 4/9/2015
 18.443 Exam 2 Spring 2015 Statistics for Applications 4/9/2015 1. True or False (and state why). (a). The significance level of a statistical test is not equal to the probability that the null hypothesis
Evidence from Large Workers
 Workers Compensation Loss Development Tail Evidence from Large Workers Compensation Triangles CAS Spring Meeting May 23-26, 26, 2010 San Diego, CA Schmid, Frank A. (2009) The Workers Compensation Tail
FE670 Algorithmic Trading Strategies. Stevens Institute of Technology
 FE670 Algorithmic Trading Strategies Lecture 4. Cross-Sectional Models and Trading Strategies Steve Yang Stevens Institute of Technology 09/26/2013 Outline 1 Cross-Sectional Methods for Evaluation of Factor
Non-Inferiority Tests for the Ratio of Two Means
 Chapter 455 Non-Inferiority Tests for the Ratio of Two Means Introduction This procedure calculates power and sample size for non-inferiority t-tests from a parallel-groups design in which the logarithm
Tests for Two Exponential Means
 Chapter 435 Tests for Two Exponential Means Introduction This program module designs studies for testing hypotheses about the means of two exponential distributions. Such a test is used when you want to
Non-Inferiority Tests for Two Means in a 2x2 Cross-Over Design using Differences
 Chapter 510 Non-Inferiority Tests for Two Means in a 2x2 Cross-Over Design using Differences Introduction This procedure computes power and sample size for non-inferiority tests in 2x2 cross-over designs
starting on 5/1/1953 up until 2/1/2017.
 An Actuary s Guide to Financial Applications: Examples with EViews By William Bourgeois An actuary is a business professional who uses statistics to determine and analyze risks for companies. In this guide,
7. For the table that follows, answer the following questions: x y 1-1/4 2-1/2 3-3/4 4
 7. For the table that follows, answer the following questions: x y 1-1/4 2-1/2 3-3/4 4 - Would the correlation between x and y in the table above be positive or negative? The correlation is negative. -
Impact of Unemployment and GDP on Inflation: Imperial study of Pakistan s Economy
 International Journal of Current Research in Multidisciplinary (IJCRM) ISSN: 2456-0979 Vol. 2, No. 6, (July 17), pp. 01-10 Impact of Unemployment and GDP on Inflation: Imperial study of Pakistan s Economy
PAIRS TRADING (just an introduction)
") PAIRS TRADING (just an introduction) By Rob Booker Trading involves substantial risk of loss. Past performance is not necessarily indicative of future results. You can share this ebook with anyone you
PAIRS TRADING (just an introduction) By Rob Booker Trading involves substantial risk of loss. Past performance is not necessarily indicative of future results. You can share this ebook with anyone you
Chapter 11: Inference for Distributions Inference for Means of a Population 11.2 Comparing Two Means
 Chapter 11: Inference for Distributions 11.1 Inference for Means of a Population 11.2 Comparing Two Means 1 Population Standard Deviation In the previous chapter, we computed confidence intervals and performed
Evidence from Large Indemnity and Medical Triangles
 2009 Casualty Loss Reserve Seminar Session: Workers Compensation - How Long is the Tail? Evidence from Large Indemnity and Medical Triangles Casualty Loss Reserve Seminar September 14-15, 15, 2009 Chicago,
Tests for the Difference Between Two Poisson Rates in a Cluster-Randomized Design
 Chapter 439 Tests for the Difference Between Two Poisson Rates in a Cluster-Randomized Design Introduction Cluster-randomized designs are those in which whole clusters of subjects (classes, hospitals,
Two-Sample Z-Tests Assuming Equal Variance
 Chapter 426 Two-Sample Z-Tests Assuming Equal Variance Introduction This procedure provides sample size and power calculations for one- or two-sided two-sample z-tests when the variances of the two groups
1/2 2. Mean & variance. Mean & standard deviation
 Question # 1 of 10 ( Start time: 09:46:03 PM ) Total Marks: 1 The probability distribution of X is given below. x: 0 1 2 3 4 p(x): 0.73? 0.06 0.04 0.01 What is the value of missing probability? 0.54 0.16
Alternative VaR Models
 Alternative VaR Models Neil Roeth, Senior Risk Developer, TFG Financial Systems. 15 th July 2015 Abstract We describe a variety of VaR models in terms of their key attributes and differences, e.g., parametric
The Two-Sample Independent Sample t Test
 Department of Psychology and Human Development Vanderbilt University 1 Introduction 2 3 The General Formula The Equal-n Formula 4 5 6 Independence Normality Homogeneity of Variances 7 Non-Normality Unequal
Quality Digest Daily, March 2, 2015 Manuscript 279. Probability Limits. A long standing controversy. Donald J. Wheeler
 Quality Digest Daily, March 2, 2015 Manuscript 279 A long standing controversy Donald J. Wheeler Shewhart explored many ways of detecting process changes. Along the way he considered the analysis of variance,
Economics 345 Applied Econometrics
 Economics 345 Applied Econometrics Problem Set 4--Solutions Prof: Martin Farnham Problem sets in this course are ungraded. An answer key will be posted on the course website within a few days of the release
Introduction to Algorithmic Trading Strategies Lecture 8
 Introduction to Algorithmic Trading Strategies Lecture 8 Risk Management Haksun Li haksun.li@numericalmethod.com www.numericalmethod.com Outline Value at Risk (VaR) Extreme Value Theory (EVT) References
Stat 328, Summer 2005
 Stat 328, Summer 2005 Exam #2, 6/18/05 Name (print) UnivID I have neither given nor received any unauthorized aid in completing this exam. Signed Answer each question completely showing your work where
Hierarchical Models of Mnemonic Processes.
 July, 2008 Collaborators Mike Pratte (Hire Him) Richard Morey (Too Late) We have seen a plethora of signal detection and multinomial processing tree models We have seen a plethora of signal detection and
Analysis of 2x2 Cross-Over Designs using T-Tests for Non-Inferiority
 Chapter 235 Analysis of 2x2 Cross-Over Designs using -ests for Non-Inferiority Introduction his procedure analyzes data from a two-treatment, two-period (2x2) cross-over design where the goal is to demonstrate
The Binomial Distribution
 The Binomial Distribution January 31, 2019 Contents The Binomial Distribution The Normal Approximation to the Binomial The Binomial Hypothesis Test Computing Binomial Probabilities in R 30 Problems The
Models of Patterns. Lecture 3, SMMD 2005 Bob Stine
 Models of Patterns Lecture 3, SMMD 2005 Bob Stine Review Speculative investing and portfolios Risk and variance Volatility adjusted return Volatility drag Dependence Covariance Review Example Stock and
TraderEx Self-Paced Tutorial and Case
 Background to: TraderEx Self-Paced Tutorial and Case Securities Trading TraderEx LLC, July 2011 Trading in financial markets involves the conversion of an investment decision into a desired portfolio position.
charts to also be in the overbought area before taking the trade. If I took the trade right away, you can see on the M1 chart stochastics that the
 When you get the signal, you first want to pull up the chart for that pair and time frame of the signal in the Web Analyzer. First, I check to see if the candles are near the outer edge of the Bollinger
Forex Ultimate Trend Signals Indicator - MT4
 Forex Ultimate Trend Signals Indicator - MT4 Enjoy Forex Trading with this awesome Trend Signals Indicator (Ultimate Trend Signals Indicator with BUY/SELL Alerts) (Upgraded for new MT4-Build 600 Platform)
Time series analysis on return of spot gold price
 Time series analysis on return of spot gold price Team member: Tian Xie (#1371992) Zizhen Li(#1368493) Contents Exploratory Analysis... 2 Data description... 2 Data preparation... 2 Basics Stats... 2 Unit
Mixed models in R using the lme4 package Part 3: Inference based on profiled deviance
 Mixed models in R using the lme4 package Part 3: Inference based on profiled deviance Douglas Bates Department of Statistics University of Wisconsin - Madison Madison January 11, 2011
MULTIPLE CHOICE. Choose the one alternative that best completes the statement or answers the question. Solve the problem.
 MULTIPLE CHOICE. Choose the one alternative that best completes the statement or Solve the problem. 1. Find forα=0.01. A. 1.96 B. 2.575 C. 1.645 D. 2.33 2.Whatistheconfidencelevelofthefolowingconfidenceintervalforμ?
Valuing Investments A Statistical Perspective. Bob Stine Department of Statistics Wharton, University of Pennsylvania
 Valuing Investments A Statistical Perspective Bob Stine, University of Pennsylvania Overview Principles Focus on returns, not cumulative value Remove market performance (CAPM) Watch for unseen volatility
Equivalence Tests for the Difference of Two Proportions in a Cluster- Randomized Design
 Chapter 240 Equivalence Tests for the Difference of Two Proportions in a Cluster- Randomized Design Introduction This module provides power analysis and sample size calculation for equivalence tests of
Tests for Paired Means using Effect Size
 Chapter 417 Tests for Paired Means using Effect Size Introduction This procedure provides sample size and power calculations for a one- or two-sided paired t-test when the effect size is specified rather
THE IMPORTANCE OF ASSET ALLOCATION vs. SECURITY SELECTION: A PRIMER. Highlights:
 THE IMPORTANCE OF ASSET ALLOCATION vs. SECURITY SELECTION: A PRIMER Highlights: Investment results depend mostly on the market you choose, not the selection of securities within that market. For mutual
Linear regression model
 Regression Model Assumptions (Solutions) STAT-UB.0003: Regression and Forecasting Models Linear regression model 1. Here is the least squares regression fit to the Zagat restaurant data: 10 15 20 25 10
Lecture 6: Non Normal Distributions
 Lecture 6: Non Normal Distributions and their Uses in GARCH Modelling Prof. Massimo Guidolin 20192 Financial Econometrics Spring 2015 Overview Non-normalities in (standardized) residuals from asset return
Lecture 16: Estimating Parameters (Confidence Interval Estimates of the Mean)
") Statistics 16_est_parameters.pdf Michael Hallstone, Ph.D. hallston@hawaii.edu Lecture 16: Estimating Parameters (Confidence Interval Estimates of the Mean) Some Common Sense Assumptions for Interval Estimates
Statistics 16_est_parameters.pdf Michael Hallstone, Ph.D. hallston@hawaii.edu Lecture 16: Estimating Parameters (Confidence Interval Estimates of the Mean) Some Common Sense Assumptions for Interval Estimates
Chapter 18: The Correlational Procedures
 Introduction: In this chapter we are going to tackle about two kinds of relationship, positive relationship and negative relationship. Positive Relationship Let's say we have two values, votes and campaign
Beating the market, using linear regression to outperform the market average
 Radboud University Bachelor Thesis Artificial Intelligence department Beating the market, using linear regression to outperform the market average Author: Jelle Verstegen Supervisors: Marcel van Gerven
Algorithmic Trading Session 4 Trade Signal Generation II Backtesting. Oliver Steinki, CFA, FRM
 Algorithmic Trading Session 4 Trade Signal Generation II Backtesting Oliver Steinki, CFA, FRM Outline Introduction Backtesting Common Pitfalls of Backtesting Statistical Signficance of Backtesting Summary
Chapter 7. Inferences about Population Variances
 Chapter 7. Inferences about Population Variances Introduction () The variability of a population s values is as important as the population mean. Hypothetical distribution of E. coli concentrations from
Research at Intersection of Trade and IO. Interest in heterogeneous impact of trade policy (some firms win, others lose, perhaps in same industry)
") Research at Intersection of Trade and IO Countries don t export, plant s export Interest in heterogeneous impact of trade policy (some firms win, others lose, perhaps in same industry) (Whatcountriesa
Research at Intersection of Trade and IO Countries don t export, plant s export Interest in heterogeneous impact of trade policy (some firms win, others lose, perhaps in same industry) (Whatcountriesa
Jacob: The illustrative worksheet shows the values of the simulation parameters in the upper left section (Cells D5:F10). Is this for documentation?
. Is this for documentation?") PROJECT TEMPLATE: DISCRETE CHANGE IN THE INFLATION RATE (The attached PDF file has better formatting.) {This posting explains how to simulate a discrete change in a parameter and how to use dummy variables
PROJECT TEMPLATE: DISCRETE CHANGE IN THE INFLATION RATE (The attached PDF file has better formatting.) {This posting explains how to simulate a discrete change in a parameter and how to use dummy variables
Effective Corporate Budgeting
 Effective Corporate Budgeting in 8 Easy Steps This ebook will offer 8 easy and easy and proven steps for improving your corporate budgeting and planning process. You will see that by making a few small
Excess Returns Methodology (the basics)
") Excess Returns Methodology (the basics) We often ask whether some event, like a merger announcement, dividend omission, or stock split, has an impact on stock prices. Since we have CRSP data available,
Excess Returns Methodology (the basics) We often ask whether some event, like a merger announcement, dividend omission, or stock split, has an impact on stock prices. Since we have CRSP data available,
Maximum Likelihood Estimation Richard Williams, University of Notre Dame, https://www3.nd.edu/~rwilliam/ Last revised January 13, 2018
 Maximum Likelihood Estimation Richard Williams, University of otre Dame, https://www3.nd.edu/~rwilliam/ Last revised January 3, 208 [This handout draws very heavily from Regression Models for Categorical
Statistical Methodology. A note on a two-sample T test with one variance unknown
 Statistical Methodology 8 (0) 58 534 Contents lists available at SciVerse ScienceDirect Statistical Methodology journal homepage: www.elsevier.com/locate/stamet A note on a two-sample T test with one variance
Let us assume that we are measuring the yield of a crop plant on 5 different plots at 4 different observation times.
 Mixed-effects models An introduction by Christoph Scherber Up to now, we have been dealing with linear models of the form where ß0 and ß1 are parameters of fixed value. Example: Let us assume that we are
Non-Inferiority Tests for the Difference Between Two Proportions
 Chapter 0 Non-Inferiority Tests for the Difference Between Two Proportions Introduction This module provides power analysis and sample size calculation for non-inferiority tests of the difference in twosample
Stochastic Modelling: The power behind effective financial planning. Better Outcomes For All. Good for the consumer. Good for the Industry.
 Stochastic Modelling: The power behind effective financial planning Better Outcomes For All Good for the consumer. Good for the Industry. Introduction This document aims to explain what stochastic modelling
The Binomial Distribution
 The Binomial Distribution January 31, 2018 Contents The Binomial Distribution The Normal Approximation to the Binomial The Binomial Hypothesis Test Computing Binomial Probabilities in R 30 Problems The
Sample Statistics Pro ciency Exam #1
 Sample Statistics Pro ciency Exam #1 Name: 1 An appliance store recorded its monthly sales M of microwave ovens for 20 months and ordered them as follows: 123, 126, 140, 141, 149 152, 152, 160, 164, 165
2018 AAPM: Normal and non normal distributions: Why understanding distributions are important when designing experiments and analyzing data
 Statistical Failings that Keep Us All in the Dark Normal and non normal distributions: Why understanding distributions are important when designing experiments and Conflict of Interest Disclosure I have
Vol. 2, Issue 5, May 2016, ISSN:
 INCOME CONSUMPTION RELATIONSHIP AMONG PUBLIC SECTOR BANK EMPLOYEES : A STUDY BASED ON LIFE CYCLE HYPOTHESIS Veena Jayan Research Scholar, M.A Economics, Maharajas College, Ernakulam, Kerala ABSTRACT :
Better decision making under uncertain conditions using Monte Carlo Simulation
 IBM Software Business Analytics IBM SPSS Statistics Better decision making under uncertain conditions using Monte Carlo Simulation Monte Carlo simulation and risk analysis techniques in IBM SPSS Statistics
How Risky is the Stock Market
 How Risky is the Stock Market An Analysis of Short-term versus Long-term investing Elena Agachi and Lammertjan Dam CIBIF-001 18 januari 2018 1871 1877 1883 1889 1895 1901 1907 1913 1919 1925 1937 1943
Quantitative Measure. February Axioma Research Team
 February 2018 How When It Comes to Momentum, Evaluate Don t Cramp My Style a Risk Model Quantitative Measure Risk model providers often commonly report the average value of the asset returns model. Some
Discussion of The initial impact of the crisis on emerging market countries Linda L. Tesar University of Michigan
 Discussion of The initial impact of the crisis on emerging market countries Linda L. Tesar University of Michigan The US recession that began in late 2007 had significant spillover effects to the rest
Sampling Distributions Chapter 18
 Sampling Distributions Chapter 18 Parameter vs Statistic Example: Identify the population, the parameter, the sample, and the statistic in the given settings. a) The Gallup Poll asked a random sample of
Financial Econometrics (FinMetrics04) Time-series Statistics Concepts Exploratory Data Analysis Testing for Normality Empirical VaR
 Time-series Statistics Concepts Exploratory Data Analysis Testing for Normality Empirical VaR") Financial Econometrics (FinMetrics04) Time-series Statistics Concepts Exploratory Data Analysis Testing for Normality Empirical VaR Nelson Mark University of Notre Dame Fall 2017 September 11, 2017 Introduction
Financial Econometrics (FinMetrics04) Time-series Statistics Concepts Exploratory Data Analysis Testing for Normality Empirical VaR Nelson Mark University of Notre Dame Fall 2017 September 11, 2017 Introduction
High Frequency Autocorrelation in the Returns of the SPY and the QQQ. Scott Davis* January 21, Abstract
 High Frequency Autocorrelation in the Returns of the SPY and the QQQ Scott Davis* January 21, 2004 Abstract In this paper I test the random walk hypothesis for high frequency stock market returns of two