RANCHO CALIFORNIA WATER DISTRICT
|
|
|
- Sophia Reeves
- 5 years ago
- Views:
Transcription


1 RANCHO CALIFORNIA WATER DISTRICT Two-Year Rate Study Final Report / June 4, 2018
2
 is pleased to provide the Rancho California Water District (District) with this report on the Two-Year Rate Study (Study).")

3 June 4, 2018 Mr. Richard Aragon Assistant General Manager CFO/Treasurer Rancho California Water District Winchester Rd. Temecula, CA Subject: Two-Year Rate Study Report Dear Mr. Aragon, Raftelis Financial Consultants, Inc. (Raftelis) is pleased to provide the Rancho California Water District (District) with this report on the Two-Year Rate Study (Study). The major objectives of the Study include the following:» Develop updated water, recycled water, and wastewater rates for Fiscal Year (FY) 2019 and FY 2020 that are fair and equitable and ensure adequate revenue recovery for the District.» Ensure that the updated water, recycled water, and wastewater rates are consistent with current California standards and legislative requirements, including Proposition 218. The Report summarizes the key findings and recommendations related to the development of the two-year water, recycled water, and wastewater rates. It has been a pleasure working with you, and we thank you and District staff for the support provided during the course of the Study. Sincerely, RAFTELIS FINANCIAL CONSULTANTS, INC. Sanjay Gaur Khanh Phan Charles Diamond Vice President Senior Consultant Associate Consultant 445 S. Figueroa Street, Suite 2270 Los Angeles, CA
4 TABLE OF CONTENTS INTRODUCTION District Overview... 1 Study Background... 1 Study Objectives... 2 LEGAL FRAMEWORK AND RATE-SETTING METHODOLOGY... 3 Legal Framework... 3 Rate-Setting Methodology... 6 WATER BUDGET AND TIER DEFINITIONS... 7 Water Budget Definitions... 7 Water Budget Factors Tier Definitions Water Usage Analysis Current Water & RW Rates WATER SUPPLY ALLOCATION DEVELOPMENT OF FY 2019 WATER RATES Water Revenue Requirements Cost Of Service Analysis Definition of Cost Components Allocation of Revenue Requirements to Cost Components Monthly Service Charge Rate Development Energy Charge Rates Water Commodity Charge Rates Water Supply Cost Component Delivery Cost Component Supplemental Supply Program Cost Component Capital Surcharge Cost Component Santa Rosa Proposed FY 2019 Water Commodity Charge Rates Water Customer Impacts DEVELOPMENT OF FY 2020 WATER RATES Revenue Requirement Increases Proposed FY 2020 Water Rates RECYCLED WATER (RW) RATES Rancho California Water District Two-Year Rate Study Report
5 RW Revenue Requirements Development Of RW Rates RW Monthly Service Charges RW Commodity Charge Rates WASTEWATER (WW) RATES Revenue Requirements Development Of WW Rates Rancho California Water District Two-Year Rate Study Report
6 LIST OF TABLES Table 3-1: CII Accounts Allocation by Meter Size Table 3-2: CII Accounts Large Lot Variance Table 3-3: Crop Coefficients for Major Crops Table 3-4: Water Budget Factors Table 3-5: BBTR Tier Definitions by Customer Type Table 3-6: CII and Ag Tier Definitions Table 3-7: Current Monthly Service Charge Rates ($/Meter) Table 3-8: Current Energy Charge Rates ($/CCF) Rancho Table 3-9: Current Energy Charge Rates ($/CCF) Santa Rosa Table 3-10: Current Commodity Charge Rates ($/CCF) Table 4-1: Projected Water Sales by Customer Class Table 4-2: Projected Water Sales by Tier for BBTR Customers Rancho Table 4-3: Projected Water Sales by Tier for BBTR Customers Santa Rosa Table 4-4: Projected Water Sales by Tier for CII and Ag Customers Table 4-5: Projected Inefficient Water Usage in FY Table 5-1: Total Revenue Requirements in FY Table 5-2: Other Revenues in FY Table 5-3: Conservation Program Revenue Requirement in FY Table 5-4: Special Conservation Program Revenue Requirement in FY Table 5-5: Revenue Requirement from Water Rates in FY Table 5-6: Allocation of Revenue Requirements to Cost Components Rancho Table 5-7: Allocation of Revenue Requirements to Cost Components Santa Rosa Table 5-8: Meter Ratios by Meter Size Table 5-9: Unit Charges for Monthly Service Charge Cost Components Table 5-10: Proposed FY 2019 Monthly Service Charge Rates ($/Meter Size) Rancho Table 5-11: Proposed FY 2019 Monthly Service Charge Rates ($/Meter Size) Santa Rosa Table 5-12: Equivalent Lift Units - Rancho Table 5-13: Equivalent Lift Units Santa Rosa Table 5-14: FY 2019 Energy Unit Rate Calculation Table 5-15: Proposed FY 2019 Energy Charge Rates ($/CCF) by Power Zone - Rancho Table 5-16: Proposed FY 2019 Energy Charge Rates ($/CCF) by Power Zone Santa Rosa Table 5-17: Water Commodity Cost Components Table 5-18: Percent of Water Usage by Tier Accountable for Cost Components Table 5-19: Units of Service by Tier Rancho Table 5-20: Units of Service by Tier Santa Rosa Table 5-21: Units of Service for Cost Components Table 5-22: FY 2019 Water Supply Cost Component Allocation by Source Rancho Table 5-23: FY 2019 BBTR Supply Cost Component Rates ($/CCF) by Tier Rancho Table 5-24: FY 2019 CII/Ag Budget Supply Cost Component Rates ($/CCF) by Tier Rancho Table 5-25: FY 2019 Water Supply Cost Component Allocation by Source Santa Rosa Table 5-26: FY 2019 BBTR Supply Cost Component Rates ($/CCF) by Tier Santa Rosa Rancho California Water District Two-Year Rate Study Report
7 Table 5-27: FY 2019 CII/Ag Supply Cost Component Rates ($/CCF) by Tier Santa Rosa Table 5-28: FY 2019 Unit Delivery Rates ($/CCF) Rancho Table 5-29: FY 2019 Unit Delivery Rates Santa Rosa Table 5-30: FY 2019 Unit Rates for Supplemental Supply Cost Component Rancho Table 5-31: FY 2019 Supplemental Supply Cost Component Rates ($/CCF) by Tier Rancho Table 5-32: FY 2019 Unit Rates ($/CCF) for Supplemental Supply Cost Component Santa Rosa Table 5-33: FY 2019 Supplemental Supply Cost Component Rates ($/CCF) by Tier Santa Rosa Table 5-34: FY 2019 Capital Surcharge Table 5-35: FY 2019 Water Commodity Charge Rates ($/CCF) by Cost Component Rancho Table 5-36: FY 2019 Water Commodity Charge Rates ($/CCF) Rancho Table 5-37: FY 2019 Water Commodity Charge Rates ($/CCF) by Cost Component Santa Rosa Table 5-38: FY 2019 Water Commodity Charge Rates ($/CCF) Santa Rosa Table 6-1: FY 2020 Water Revenue Requirement Rancho Table 6-2: FY 2020 Water Revenue Requirement Santa Rosa Table 6-3: FY 2020 Monthly Service Charge Rates ($/Meter Size) Rancho Table 6-4: FY 2020 Energy Charge Rates ($/CCF) by Power Zone Rancho Table 6-5: FY 2020 Water Commodity Charge Rates ($/CCF) Rancho Table 6-6: FY 2020 Monthly Service Charge Rates ($/Meter Size) Santa Rosa Table 6-7: FY 2020 Energy Charge Rates ($/CCF) by Power Zone Santa Rosa Table 6-8: FY 2020 Water Commodity Charge Rates ($/CCF) Santa Rosa Table 7-1: RW Revenue Requirements Table 7-2: RW Monthly Service Charges ($/Meter Size) Rancho Table 7-3: RW Monthly Service Charge Rates Santa Rosa Table 7-4: RW Unit Commodity Charge Rates ($/AF) Table 8-1: WW Revenue Requirements Table 8-2: Total District WW EDUs Table 8-3: FY 2019 WW Monthly Service Charge Rates ($/EDU) Table 8-4: FY 2020 WW Monthly Service Charge Rates ($/EDU) Table 8-5: Effective WW Monthly Service Charge Rates ($/EDU) for FY 2019 and FY Rancho California Water District Two-Year Rate Study Report
8 LIST OF FIGURES Figure 3-1: Water Budget Tiers... 7 Figure 3-2: Customized Water Budget Tiers (Illustrative Purposes Only)... 8 Figure 3-3: BBTR Water Sales Distribution by Tier Figure 3-4: CII and AG Water Sales Distribution by Tier Figure 4-1: Projected Water Demand AF Figure 4-2: Source of Supply Cost Per AF in FY Figure 5-1: FY 2019 Average Residential Customer Monthly Bill Impacts - Rancho Figure 5-2: FY 2019 Average Residential Customer Monthly Bill Impacts Santa Rosa LIST OF APPENDICES Appendix A: FY 2019 & FY 2020 Operating Budgets Rancho California Water District Two-Year Rate Study Report
9 GLOSSARY Term Definition AF Ag AWB AWWA BBTR CCF CII CIP COS D DF indoor DF outdoor District EMU ET ET 0 Acre Feet Agricultural Customers Agricultural Water Budget American Water Works Association Budget Based Tiered Rates Centum Cubic Feet = 100 cubic feet = 748 gallons Commercial/Industrial/Institutional Customers Capital Improvement Plan Cost of Service Single Family Customers Indoor Drought Factor Outdoor Drought Factor Rancho California Water District Equivalent Meter Unit Evapotranspiration Evapotranspiration Reference Index ETAF Evapotranspiration Adjustment Factor FY Fiscal Year (July 1 June 30) GIS Geographical Information Systems GPCD Gallons per capita per day IA Irrigated Acres IWB Indoor Water Budget K c L LWSR M M1 Manual MWD O&M OWB R R&R RW T&D TWB UE V indoor V outdoor Crop Coefficient Landscape Customers Local Water Sustainability Rate Multi Family Customers Principles of Water Rates, Fees, and Charges: Manual of Water Supply Practices M1", 6 th edition published by AWWA Metropolitan Water District of Southern California Operations and Maintenance Outdoor Water Budget Residential Customers Capital replacement and refurbishment Recycled Water Transmission and Distribution Total Water Budget Ultra-Efficient Indoor Variance Outdoor Variance Rancho California Water District Two-Year Rate Study Report
10 This page intentionally left blank to facilitate two-sided printing. Rancho California Water District Two-Year Rate Study Report
11 INTRODUCTION 1.1 DISTRICT OVERVIEW The Rancho California Water District (District) maintains over 44,000 water service connections as well as more than 9,000 acres of irrigated agricultural properties across a 156-square mile service area. The District is divided into two separate Water Divisions, with the Rancho Division generally encompassing the Eastern area of the District and the Santa Rosa Division generally encompassing the Western area (collectively the Divisions). The District also maintains over 230 recycled water (RW) connections and provides wastewater (WW) service to approximately 8,300 equivalent dwelling units (EDUs) within the District s service area. The District maintains separate accounting records, and sets rates and charges separately for each Water Division as well as for RW and WW. Sources of water supply consist of local groundwater, treated and untreated imported water from the Metropolitan Water District of Southern California (MWD), and recycled water. STUDY BACKGROUND In 2009, Raftelis Financial Consultants, Inc. (Raftelis) assisted the District in conducting a Water Budget Rate Study (see Section 3 for more detail on water budgets). The results of the study were presented to the District Board and adopted in the summer of In 2015, due to the ongoing drought in California the District: (1) revised current water budgets to ensure that there were adequate and equitable water supply allocations for essential and efficient use; and (2) amended the rates to further improve equity, promote efficiency and conservation, and ensure compliance with Proposition 218 requirements. In 2017, the District conducted a Water, RW, and WW Rate Study. The 2017 study incorporated two additional changes to the District s water rate structure: (1) it added a third tier for Agricultural (Ag) and Commercial, Industrial, and Institutional (CII) customers; and (2) it added a Local Water Sustainability Rate (LWSR) surcharge to all customer classes for the Santa Rosa Division. In January 2018, the District engaged Raftelis to conduct a Two-Year Rate Study (Study) to develop updated water, RW, and WW rates for both Divisions for Fiscal Year (FY) and FY This report documents the resultant findings, analyses, and recommendations of the Study. The water rates in this Study were developed using rate-making principles set forth by the American Water Works Association s Principles of Water Rates, Fees and Charges (M1 Manual). This M1 Manual s cost-ofservice principles endeavor to distribute costs to customer categories (also referred to as classes) and to individual customers in proportion to the way customers use the water system. Pursuant to the M1 Manual, rate studies generally contain three elements: (1) a revenue requirements analysis, which determines how much revenue is needed from rates to recover a utility s projected costs; (2) a cost of service analysis, which allocates the revenue requirements to the rate components; and (3) a rate design analysis, which determines any modifications that are required to align the rate structure with the cost of service. 1 Each fiscal year spans from July 1 of the preceding calendar year to June 30 of the corresponding calendar year. For example, FY 2019 begins on July 1, 2018 and ends on June 30, Two-Year Rate Study Report 1
12 STUDY OBJECTIVES The major objectives of the Study include the following: 1. Develop updated water, RW, and WW rates for FY 2019 and FY 2020 that are fair and equitable and ensure adequate revenue recovery for the District 2. Ensure updated water, RW, and WW rates are consistent with current California legal standards and legislative requirements, including Proposition 218. For WW rates, an updated cost of service analysis was not conducted at this time as customer flows have stayed relatively constant when compared to previous years, which are captured by the existing Equivalent Dwelling Unit (EDU) assignments, equal to a total of 8,300 EDUs for FY Rancho California Water District
13 LEGAL FRAMEWORK AND RATE-SETTING METHODOLOGY This section of the report describes the legal framework that was considered in the development of the rates to ensure that the calculated COS rates provide a fair and equitable allocation of costs to the different customer classes. LEGAL FRAMEWORK CONSTITUTIONAL MANDATES AND STATUTORY AUTHORITY Article XIII D, Section 6 (Proposition 218) and Article X, section 2 of the California Constitution govern the legal framework and principles applicable to the Study. 2 With regards to water rates, this Study equitably implements and harmonizes these constitutional mandates in concert with the authority and principles set forth in Water Code Section 370 et seq. which governs Allocation-Based Conservation Water Pricing (commonly referred to as a Water Budget Rate Structure ). This Study utilizes the existing inclining four tier rate structure (for water-budget customers), which was designed to implement, in a reasonable manner, the constitutional mandates and statutory authority and principles referenced above. CALIFORNIA CONSTITUTION ARTICLE X, SECTION 2 Article X, section 2 of the California Constitution provides as follows: It is hereby declared that because of the conditions prevailing in this State the general welfare requires that the water resources of the State be put to beneficial use to the fullest extent of which they are capable, and that the waste or unreasonable use or unreasonable method of use of water be prevented, and that the conservation of such waters is to be exercised with a view to the reasonable and beneficial use thereof in the interest of the people and for the public welfare. As such, public agencies are constitutionally mandated to maximize the beneficial use of water, prevent waste, and encourage conservation. CALIFORNIA CONSTITUTION ARTICLE XIII D, SECTION 6 (PROPOSITION 218) Proposition 218, reflected in the California Constitution as Article XIII D, was enacted in 1996 to ensure that rates and fees were reasonable and proportional to the cost of providing service on parcel basis. The principal requirements for fairness of the fees, as they relate to public water service are as follows: 1. Revenues derived from the fee or charge shall not exceed the funds required to provide the propertyrelated service. 2. Revenues derived by the fee or charge shall not be used for any other purpose other than that for which the charge was imposed. 2 California Constitution article X, section 2 only applies to water and RW rates. Two-Year Rate Study Report 3
14 3. The amount of the fee or charge imposed upon any parcel shall not exceed the proportional cost of service attributable to the parcel. 4. No fee or charge may be imposed for a service unless that service is actually used by, or immediately available to, the owner of the property. Fees or charges based on potential or future use of a service are not permitted. Standby charges, whether characterized as charges or assessments, shall be classified as assessments and shall not be imposed without compliance with Article XIII D, section No fee or charge may be imposed for general governmental services including, but not limited to, police, fire, ambulance or library services, where the service is available to the public at large in substantially the same manner as it is to property owners. 6. Reliance by an agency on any parcel map, including, but not limited to, an assessor s parcel map, may be considered a significant factor in determining whether a fee or charge is imposed as an incident of property ownership for purposes of Article XIII D, section 6. In any legal action contesting the validity of a fee or charge, the burden shall be on the agency to demonstrate compliance with Article XIII D, section 6. The rates developed in this Study use a methodology to establish an equitable system of charges that recover the cost of providing service and fairly apportion costs to each customer as required by Proposition 218. STATUTORY AUTHORITY GOVERNMENT CODE SECTION 370 ET SEQ. (ALLOCATION BASED CONSERVATION WATER PRICING) In 2000, the California Legislature adopted AB 2882, establishing a body of law entitled Allocation-Based Conservation Water Pricing (Water Code Section 370 et seq.) AB 2882 is consistent with the abovereferenced constitutional provisions. Water Code Section 370 provides in part as follows: The Legislature hereby finds and declares all of the following: (a) The use of allocation based conservation water pricing by public entities that sell and distribute water is one effective means by which waste or unreasonable use of water can be prevented and water can be saved in the interest of the people and for the public welfare, within the contemplation of Section 2 of Article X of the California Constitution. (b) It is in the best interest of the people of California to encourage public entities to voluntarily use allocation based conservation water pricing, tailored to local needs and conditions, as a means of increasing efficient uses of water, and further discouraging wasteful or unreasonable use of water under both normal and dry year hydrologic conditions. Water Code Section 372 provides as follows: (a) A public entity may employ allocation based conservation water pricing that meets all of the following criteria. (1) Billing is based on metered water use. 4 Rancho California Water District
15 (2) A basic use allocation is established for each customer account that provides a reasonable amount of water for the customer s needs and property characteristics. Factors used to determine the basic use allocation may include, but are not limited to the number of occupants, the type or classification of use, the size of lot or irrigated area, and the local climate data for the billing period. Nothing in this chapter prohibits a customer of the public entity from challenging whether the basic use allocation established for that customer s account is reasonable under the circumstances. Nothing in this chapter is intended to permit public entities to limit the use of property through the establishment of a basic use allocation. (3) A basic charge is imposed for all water used within the customer s basic use allocation, except that at the option of the public entity, a lower rate may be applied to any portion of the basic use allocation that the public entity has determined to represent superior or more than reasonable conservation efforts. (4) A conservation charge shall be imposed on all increments of water use in excess of the basic use allocation. The increments may be fixed or may be determined on a percentage or any other basis, without limitation on the number of increments, or any requirement that the increments or conservation charges be sized, or ascend uniformly, or in a specified relationship. The volumetric prices for the lowest through the highest priced increments shall be established in an ascending relationship that is economically structured to encourage conservation and reduce the inefficient use of water, consistent with Section 2 of Article X of the California Constitution. (b) (1) Except as specified in subdivision (a), the design of an allocation based conservation pricing rate structure shall be determined in the discretion of the public entity. (2) The public entity may impose meter charges or other fixed charges to recover fixed costs of water service in addition to the allocation based conservation pricing rate structure. (c) A public entity may use one or more allocation based conservation water pricing structures for any class of municipal or other service that the public entity provides. As noted in the referenced statutes, an Allocation-Based Conservation Water Pricing Rate Structure is a form of an inclining block rate structure where the amount of water within the first block or blocks is based on the estimated, efficient water needs of the individual customer. Water-budget rates differ from other metered water rate designs in two key ways. First, the blocks are established based on water budgets that represent varying levels of each customer s efficient water use. Second, water-budget rates require the public agency to set specific standards for what is, and what is not, considered efficient water use for an individual customer. The 2017 Water, RW, and WW Rate Study, in conjunction with the District s findings and determinations for individual customers, established a standard for efficient usage and then established a water budget for each individual customer. Each water budget defines how much water is considered efficient for indoor and outdoor water usage. Customers who use water in excess of their water budget pay a higher rate for their Two-Year Rate Study Report 5
16 inefficient or wasteful usage due to the fact that water use in excess of budgeted amounts requires the District to purchase more expensive imported water from MWD. The existing rate structure utilized in this Study therefore conforms to the principles set forth in the enabling statutes for Water Budget Rate Structures. RATE-SETTING METHODOLOGY The American Water Works Association (AWWA), with approximately 50,000 members, is the largest nonprofit, scientific, and educational association dedicated to managing and treating water. AWWA publishes manuals of practice for the efficient operation and management of water systems. The M1 Manual, Principles of Water Rates, Fees, and Charges (M1 Manual) is considered the industry standard for rate setting practice and methodology. As stated in the M1 Manual, the AWWA Rates and Charges Subcommittee agrees with the Proposition 218 requirement that the costs of water rates and charges should be recovered from classes of customers in proportion to the cost of serving those customers. To develop utility rates that comply with Proposition 218 and industry standards while meeting other emerging goals and objectives of the utility, there are four major steps: 1. DETERMINATION OF REVENUE REQUIREMENT: The rate-making process starts with the determination of the revenues required to sufficiently fund the utility s operation and maintenance (O&M), capital replacement and refurbishment (R&R), capital improvements, and perpetuation of the system, and to ensure preservation of the utility s financial integrity. The basic revenue requirements of a utility include O&M expenses, debt service payments, contributions to specified reserves, and the cost of capital expenditures that are not debt financed. 2. COST OF SERVICE ANALYSIS: The annual costs of providing water services should be allocated among the customers commensurate with their service requirements. In this step, costs are identified and allocated to functional cost components of the utility and distributed to respective customer classes according to the industry standards provided in the M1 Manual. California Government Code Section mandates agencies to conduct a thorough cost of service analysis every ten years in determining the utility rates. 3. RATE DESIGN AND CALCULATIONS: Rates do more than simply recover costs. Within the legal framework and industry standards, properly designed rates should support and optimize a blend of various utility objectives, such as conservation, affordability for essential needs, revenue stability, etc. and should work as a public information tool in communicating these objectives to customers. 4. RATE ADOPTION: In the last step of the rate-making process, to comply with the Proposition 218 requirements, the results of the analyses are documented in a study report to help educate the public about the proposed changes, provide the rationale and justifications behind the changes and their anticipated financial impacts in layman terms. Not less than 45-days after mailing out the public notices, the agency shall consider all written protests against the proposed rates at a public hearing. If there is no majority protest, the agency can officially adopt the new rates. 6 Rancho California Water District

17 WATER BUDGET AND TIER DEFINITIONS On July 1, 2010, the District implemented a water budget rate structure to incentivize conservation and water use efficiency. The description of the allocations of water to individual customers and the development of water budgets is described in the following sections. WATER BUDGET DEFINITIONS The American Water Works Association Journal defines a water budget as the quantity of water required for an efficient level of water use by that customer (Source: American Water Works Association Journal, May 2008, Volume 100, Number 5). Therefore, each customer has his or her own allocation of water for indoor and outdoor water usage, or water budget, as shown in the following figures. Figure 3-1 shows an example of how tier breaks are set for water budget customers. Tier 1 is defined by the allotment of water for efficient indoor use and Tier 2 is defined by the allotment of water for efficient outdoor use. Tier 3 is set to a percentage of a customer s total water budget (or Tiers 1 and 2 water usage) combined. Any use beyond Tier 3 is considered excessive and falls into Tier 4. Figure 3-1: Water Budget Tiers It is important to note that water budget rate structures are customized for each customer, which results in different tier breaks (water allotments) for different customers. In the illustrative example shown in Figure 3-2 3, the first 10 units of water 4 consumed by Customer 1 are charged at the Tier 1 rate, whereas Customer 2 has 12 units at the Tier 1 rate for indoor use. The next 12 units of water (11 22 units) consumed by Customer 1 are reserved for outdoor use, and are charged at the Tier 2 rate. Any usage exceeding 29 units 5 will be deemed excessive and charged at the Tier 4 rate. Similarly, for Customer 2, Tier 2 spans from units of water, and usage exceeding 45 units will be charged at the Tier 4 rate. Customer 2 has a larger indoor (Tier 1) and outdoor (Tier 2) water budget or allotment because they have a larger family (more people per household) and a larger landscape area than Customer 1. Each of these factors requires a larger amount of water for 3 For illustrative purposes only; not reflective of actual District rates. 4 One unit of water equals one hundred cubic feet (CCF), or 748 gallons, of water. 5 Tier 3 = 50% of Total Water Budget (TWB) whereas TWB = Indoor WB + Outdoor WB. Two-Year Rate Study Report 7
 The District s water budget allocations and tiered rate structure, also called Budget Based Tiered Rates (BBTR), are designed")
18 Customer 2, and therefore would allow for a larger allotment in Tier 1 and Tier 2, but both customers are charged the same rate per unit of water for each tier. Figure 3-2: Customized Water Budget Tiers (Illustrative Purposes Only) The District s water budget allocations and tiered rate structure, also called Budget Based Tiered Rates (BBTR), are designed for residential and irrigation accounts which include residential (R), multifamily (M), and landscape (L). All other customer types including agriculture (Ag) and commercial, industrial, and institutional (CII) have a three-tiered inclining rate structure. INDOOR WATER BUDGET FOR BBTR ACCOUNTS The indoor water budget (IWB) is determined by a customer s household size and a standard consumption per person. The proposed IWB formula takes into account a number of factors that determine how much water is allocated for indoor use. The IWB formula is as follows: GPCD*Household Size*Units*Days of Service*DF IWB 748 indoor V indoor where» GPCD Gallons per capita per day. GPCD = 55 (from the 2017 Water, RW, and WW Rate Study). 6» Household Size Number of residents for each dwelling unit. o Default household size = 3 o Variance form available for larger household size at the District website and office» Units Number of dwelling units served by the meter.» Days of Service The number of days of service varies with each billing cycle for each customer. The actual number of days of service will be applied to calculate the indoor water budget for each billing cycle GPCD is the provisional standard for indoor residential water use as outlined in the State of California Water Code Section Rancho California Water District
19 » DF indoor Indoor drought factor. The percentage of indoor water budget allotted during drought conditions. The drought factor is determined based on the degree of water shortage and is subject to the approval of the District s Board of Directors. The indoor drought factor is currently set at 100 percent.» V indoor Indoor variance. The additional water allotment to be granted for extenuating circumstances is subject to District s approval or verification as outlined in the District s variance program. Variances can be requested by submitting a Variance/Adjustment Request Form found on the District s website.» 748 is the conversion unit from gallons to billing unit of hundred cubic feet (ccf). OUTDOOR WATER BUDGET FOR BBTR ACCOUNTS The outdoor water budget (OWB) is determined by three main variables: irrigable landscape area, weather data converted into an Evapotranspiration Reference Index (ET 0), and an Evapotranspiration Adjustment Factor (ETAF). The function of the ETAF is to adjust the ET 0 to account for water efficient landscaping consisting of a combination of vegetation and planting density based upon a determination by the District in its review and findings of customer data and appropriateness for the service area. The irrigable landscape area, measured by the square footage of landscape surface on a customer s property, is measured by the District s geographical information systems (GIS). The weather data is based on the reference evapotranspiration (ET 0), which is the amount of water lost to the atmosphere over a given time period at given specific atmospheric conditions. ET 0 is the amount of water (in inches of water) needed for 100 percent of a high-water intensity crop type. The ET Adjustment Factor (ETAF) is a coefficient that adjusts ET 0 values based on the variable proportion of plant types, planting density, and irrigation system efficiency. The formula to calculate the OWB is as follows: OWB Landscape Area * ET * ETAF V outdoor * DF outdoor where» ET 0 is estimated in inches of water during the billing period based on interpolation of weather data for each micro-zone within the service area.» ETAF (% of ET 0) is tiered based upon the landscape area (in square feet). Currently there are four landscape area ranges, or bins. See Table 3-4 for details.» Landscape Area (or Irrigable Landscape Area) (in square feet) is the measured irrigable landscape area served by customer s meter.» DF outdoor Outdoor drought factor. The percentage of outdoor water budget allotted during drought conditions. The drought factor is determined based on the degree of water shortage, and is subject to the approval of the District s Board of Directors. The outdoor drought factor is currently set at 100 percent.» V outdoor Outdoor variance. The additional water allotment to be granted for extenuating circumstances is subject to District s approval or verification as outlined in the variance program. Outdoor variance is subject to outdoor drought factor.» 1200 is the conversion unit from inch*ft 2 to billing unit of hundred cubic feet (ccf). Two-Year Rate Study Report 9

20 WATER ALLOCATIONS FOR AG AND CII ACCOUNTS Ag and CII (commercial, industrial, and institutional) accounts receive an allocation of water based on different factors than BBTR customers. This is due to the fact that these types of customers do not have a homogeneous use of water. CII accounts generally require a specific amount of water to match their business needs. For instance, a microbrewery is a water intensive business that would require a water meter of appropriate size to ensure a sufficient amount of water is available to support its business operations. If that business was located on a property that was serviced by an undersized meter, that business would generally incur the cost to upsize to a larger meter. Conversely, if a business using minimal water was located on a property that had an oversized meter, that business would generally choose to downsize its meter. Due to the variability in water use from one CII customer to another, it was decided to base CII allocations by taking 200 percent of the historical average annual usage for all CII accounts using a ¾ meter with a lot size of a ¼ acre or less. This amount was then applied to larger meter sizes based on relative meter capacity. This results in the allocations presented in Table 3-1. Note that allocations are on an annual rather than monthly basis. Therefore, a CII customer that exceeds its annual allocation part way through a year will be subject to higher tier rates for the remainder of the year. In order to provide a reasonable variance for meters serving larger lots, a large lot variance was created based upon a 2 AF allocation per acre plus the average use for a ¾ meter per year (see Table 3-2 for large lot allocations). In addition to a large lot variance, the District provides for account specific variances when a CII customer can justify a higher allocation due to business needs. Table 3-1: CII Accounts Allocation by Meter Size Table 3-2: CII Accounts Large Lot Variance 10 Rancho California Water District
21 Ag account allocations are more complex than CII account allocations due to the fact that an Ag account s water needs can vary greatly from one Ag customer to another. Agricultural customers are given an indoor (if there is a residence on the property), an outdoor, and an agricultural water budget. The indoor water budget is calculated in the same manner as that used for BBTR customers. The outdoor water budget for an Ag account is determined using the same formula defined previously for BBTR outdoor water budgets. For Ag outdoor water budgets however, the amount of landscape area per parcel is limited to 10 percent of a parcel s agricultural-planted acreage, up to a maximum of 75,000 square feet. This ensures that Ag accounts are allocated water primarily for agricultural purposes and not for ornamental landscape. The agricultural water budget varies the most from one Ag customer to another and is determined by three main variables: ET 0, crop coefficient (K c) which accounts for the crop type, and irrigated acres (IA). Please note that ET 0 for Ag customers is similar to the description in the BBTR section above with the exception that ET 0 for Ag customers is static and is based on weather data from The formula to calculate the agricultural water budget (AWB) in AF is: AWB = ET K IA 12 where» ET 0 is measured in inches of water during the billing period based on daily data acquired from the private weather stations for each micro-zone within the service area.» K c is the crop coefficient based on crop type (see Table 3-3).» 12 is a conversion factor for converting inches to feet.» IA is irrigated acres. Table 3-3: Crop Coefficients for Major Crops Both the outdoor and agricultural water budgets utilize GIS measurements to determine the amount of ornamental landscaping and irrigated acres. WATER BUDGET FACTORS The tier definitions are tailored to the unique consumption patterns of the District s customers and subject to the District s policy decisions. The tier definitions are based on usage and impact analysis and policy discussions with the Board. In 2015, in response to the prolonged drought and to promote further efficiency and conservation, water budget factors were fine-tuned to reflect a new water use efficiency benchmark for indoor and outdoor use. These changes have proven successful in indirectly encouraging water conservation Two-Year Rate Study Report 11
 is 55 and the default household size for a residential account is three.")
22 by sending a price signal that the more a customer uses the more the customer will pay. It is therefore recommended to continue with the existing water budget factors. Table 3-4 displays the existing water budget factors for the Divisions. The gallons per capita per day (GPCD) is 55 and the default household size for a residential account is three. As previously noted, a household with more than three residents may submit a variance form to the District in order to increase its indoor water budget. The outdoor ET adjustment factors for the first 30,000 square feet of landscape will receive 75 percent of ET 0 for medium water use plants, and the next 45,000 square feet will receive 60 percent of ET 0, enough for California native and drought tolerant plants. Residential accounts will not have outdoor water budgets for landscape areas greater than 75,000 square feet. Landscape accounts in the Rancho Division will have a total ETAF of 60 percent of ET 0 for their outdoor water budgets, with 23 percent ET 0 considered ultra-efficient (Tier 1) and 37 percent of ET 0 is in efficient use (Tier 2). Landscape accounts in the Santa Rosa Division have a total ETAF of 60 percent of ET 0 for their outdoor water budgets, with 13 percent of ET 0 considered ultra-efficient (Tier 1) and 47 percent of ET 0 is in efficient use (Tier 2). The differences between Divisions in the percentage of ETAF allocated per tier is intended to reflect the proportional groundwater allowance of each Division. Table 3-4: Water Budget Factors Note: DF indoor and DF outdoor refer to the Drought Factor Indoor (Tier 1) and Outdoor (Tier 2) where budgets might be reduced below 100 percent in the event of a water shortage emergency in accordance with the District s Water Shortage Contingency Plan. TIER DEFINITIONS The tier definitions for water budget based rates are developed as shown in Table 3-5. Landscape accounts do not have indoor water budgets but a portion of their outdoor budget is considered ultra-efficient (UE) and charged at the Tier 1 rate with the remaining outdoor water budget assessed at the Tier 2 rate. The UE amount of water is intended to be representative of the amount of water necessary for efficient irrigation practices for California native drought tolerant plants with minimal water needs. For both landscape and residential 12 Rancho California Water District
 and usage in excess of Tier 3 falls into Tier 4.")
23 accounts, the Tier 1 usage is intended for ultra-efficient usage (indoor or outdoor) in order to reflect the source of water for Tier 1, groundwater, which is the District s lowest cost source of supply. All four-tiered customer types have their Tier 3 allotment defined as 50 percent of their respective total water budget (TWB) and usage in excess of Tier 3 falls into Tier 4. The Tier 3 budget was set at a factor of 50 percent of the Efficient Indoor (Tier 1) and Outdoor (Tier 2) budget as a transitional tier that recognizes that water use above Tiers 1 and 2 is above the standard of efficiency but not yet at a level where it would be considered egregious water waste, which would require the District to purchase the most expensive imported water from MWD. Such a level of water use was determined as appropriate to be assessed a portion of the costs for funding conservation programs, but to a lesser degree than the Tier 4 category. Table 3-5: BBTR Tier Definitions by Customer Type 7 The first priority for water use is essential indoor requirements for health, sanitation, and safety purposes. Along with this is ultra-efficient outdoor use that makes up Tier 1 for landscape customers. Both the indoor use and outdoor use are considered ultra-efficient reflecting the source of water supply for the Tier 1 use, which is groundwater. Maintaining healthy landscapes at efficient water use levels is non-essential, but important for customers. Thus, efficient outdoor water use is required to pay the Tier 2 rate. Tier 3 provides usage up to 50 percent of the total water budget. The 50 percent of the water budget available in Tier 3 provides enough water to more than meet outdoor needs. Usage in excess of that level (Tier 4) is considered to be excessive. Any usage above an efficient level is subject to higher charges to fund conservation programs and supplemental water supply programs. The higher Tier 3 rate indirectly serves as a price signal that the more water a customer inefficiently uses, the more the customer will pay. Tier 4 and recovers the incrementally higher costs of providing water service to the incrementally highest and most inefficient water usage. The tier definitions for CII and Ag accounts are defined in Table 3-6 below. Tier 1 allows for use up to the annual water budget (AWB) amount as described in Section 3.1 above. An AWB is established for each account at the beginning of each calendar year. The cumulative water use for the year is compared to the AWB on a monthly basis to see if the cumulative water use exceeds the AWB. If the cumulative use exceeds the AWB, a customer then enters Tier 2. Tier 2 allows for use above each account s AWB budget up to 150 percent of the AWB. Tier 3 is for usage above 150 percent of an account s AWB. The tier definitions for CII and Ag accounts were established along similar guidelines as the budget based tier rates. Two-Year Rate Study Report 13


24 Table 3-6: CII and Ag Tier Definitions WATER USAGE ANALYSIS Figure 3-3 shows the distribution of BBTR usage between tiers for each Division. Figure 3-4 shows the distribution of CII and Ag usage between tiers for each Division. Both Figure 3-3 and Figure 3-4 are projected based on the trends of actual usage for FY 2016 and FY 2017, FY 2018 to date, and analysis by District staff. The sales projections reflect a recent dry year from the actual usage data. Choosing a recent dry year for forecasting sales takes into consideration a moderate amount of new development while also assuming that customer s conservation efforts over the past several years will continue due to messaging, education and outreach by District staff. Figure 3-3: BBTR Water Sales Distribution by Tier 14 Rancho California Water District
25 Figure 3-4: CII and AG Water Sales Distribution by Tier CURRENT WATER & RW RATES The District s current water rate structure consists of three charges that vary by Division: 1. Fixed Monthly Service Charge ($/meter): varies by meter size 2. Energy Charge ($/ccf): varies by power zone 3. Commodity Charge ($/ccf): varies by customer class and tier Current RW charges are the same for both Divisions, and include a fixed monthly service charge of $20 per month (regardless of meter size) and a uniform commodity charge of $ per AF. Table 3-7 below shows the current fixed monthly service charges for each Division and for RW (which is the same for both Divisions). Two-Year Rate Study Report 15


26 Table 3-7: Current Monthly Service Charge Rates ($/Meter) Table 3-8 shows the current energy rates for the Rancho Division. Table 3-8: Current Energy Charge Rates ($/CCF) Rancho Table 3-9 shows the current energy charge rates for the Santa Rosa Division. Table 3-9: Current Energy Charge Rates ($/CCF) Santa Rosa Table 3-10 shows the current water commodity charge rates for each Division. 16 Rancho California Water District
27 Table 3-10: Current Commodity Charge Rates ($/CCF) Two-Year Rate Study Report 17

28 WATER SUPPLY ALLOCATION The District has limited water resources, consequently they must be used efficiently. These water supplies are allocated to each customer class and division equitably to meet different reasonable demands, including health and sanitation, commercial use, landscaping, etc. Usage in excess of reasonable demand will be subject to the highest marginal water supply costs to reflect the true cost of water. Figure 4-1 below shows projected water demand in each Division for FY 2019 and FY Projected water demands are District staff s estimates that are based on the trends of actual usage for FY 2016 and FY 2017 as well as FY 2018 to date. The projections consider a moderate amount of new development and continued customer conservation due to outreach, messaging and education by the District. Projected customer demand affects certain variable expenses such as the cost of purchased water as well as the revenue from water sales. Customer demand depends on the types of customers, the nature of their demands, the trends in their water use, growth, and climate, among others. Figure 4-1: Projected Water Demand AF Water supply unit costs, other than recycled water, are the costs the District incurs to deliver a unit (AF or ccf) of water from each of the District s sources of water supply to a customer. Currently the main sources of water available to the District in order of least to most expensive are: local native groundwater, untreated imported water at MWD Tier 1 prices, and treated water at MWD Tier 1 prices. The District does not anticipate purchasing MWD Tier 2 treated water for the Study period. Figure 4-2 shows the gross unit costs in each Division for the three different sources of water supply: groundwater, untreated water, and treated water. The extreme cost difference among the different sources of water is clearly illustrated in Figure Rancho California Water District
.")

29 Figure 4-2: Source of Supply Cost Per AF in FY Table 4-1 shows projected annual water sales by customer class for each Division in FY 2019 and FY Total annual water sales for each Division are shown in both ccf and AF (Lines 7 and 8). The bottom of Table 4-1 shows annual water sales in ccf and by percentage share of total sales for the BBTR, CII and Ag categories (Lines 9-12). BBTR includes residential customers. Table 4-1: Projected Water Sales by Customer Class 8 Gross unit costs are reduced by the application of unrestricted revenues. Two-Year Rate Study Report 19

 also shown in Table 4-1.")
30 Table 4-2 through Table 4-4 show the projected distribution of annual water usage in each Division within the tiers for water budget and CII and Ag customers. As described in Section 3.4, the distribution of usage within the tiers for each customer class is based on the trends of recent usage data analyzed by District staff. The allocation of total sales for Rancho is based on the split between BBTR and CII/Ag customers (75%/25%) as shown in Table 4-1. The allocation of total sales for Santa Rosa is based on the split between water BBTR and CII/Ag customers (22%/78%) also shown in Table 4-1. Table 4-2: Projected Water Sales by Tier for BBTR Customers Rancho Table 4-3: Projected Water Sales by Tier for BBTR Customers Santa Rosa Table 4-4: Projected Water Sales by Tier for CII and Ag Customers Table 4-5 shows projected inefficient water usage in FY 2019 for each Division, based on the data detailed in Section 3.4, Water Usage Analysis. Inefficient water usage includes usage in Tier 3 and Tier 4 for BBTR customers and usage in Tier 2 and Tier 3 for CII and Ag customers. The usage values shown in Table 4-5 are from Table 4-2 through Table 4-4, and are utilized in Section 5 to allocate water conservation program costs. 20 Rancho California Water District

31 Table 4-5: Projected Inefficient Water Usage in FY 2019 Two-Year Rate Study Report 21

32 DEVELOPMENT OF FY 2019 WATER RATES This section details the determination of water revenue requirements, the Cost of Service (COS) analysis, and the development of water rates in FY The District s current rate structure includes fixed monthly service charges, energy charges, and commodity charges. WATER REVENUE REQUIREMENTS The revenue requirements analysis considers the short-term and long-term service objectives of the utility over a given planning horizon, including capital facilities and system operations and maintenance, to determine the adequacy of a utility s existing rates to recover its costs. Table 5-1 shows the FY 2019 total revenue requirements for each Division. The basic revenue requirements include operating and maintenance (O&M) expenses (including water supply costs) for each Division as well as capital funding for the Santa Rosa Division only. The recycled water requirement is partially offset by revenues generated through recycled water sales (see Section 7: Development of RW Rates for more information) and the remaining costs are allocated between the two Divisions with 70% allocated to Rancho and 30% allocated to Santa Rosa. The percentage split between Divisions is based on projected build out recycled water sales for each Division. The Engineering line item (Line 6) is allocated among Divisions (Rancho, Santa Rosa, and Sewer) based on the expected capital needs of each Division as defined in the District s Water Facilities Master Plan. Generally, engineering support costs correlate with the amount of capital project activity. The Support line item is primarily allocated among the three Divisions by the total budgeted direct labor of each Division. These expenses are based on the District s FY 2019 budget. See Appendix A for the District s FY 2019 operating budgets. 9 The budgets provide greater detail on the expenses that are utilized in determining the revenue requirements. Table 5-1: Total Revenue Requirements in FY 2019 Table 5-2 shows projected revenues from sources other than water sales in FY 2019 for each Division. These revenues contribute to meeting the total revenue requirements in Table 5-1. The line item Reclass - from Non- Op (Line 8) represents property tax revenues utilized to pay for operating costs. This only represents a portion of the property tax revenues with the bulk of the property taxes utilized in the Non-Operating budget 9 As part of drafting the Study report, rates herein are based on the District s proposed FY 2019 and FY 2020 budgets as of March 9, Rancho California Water District
33 for capital projects. The line item Reclass - Non-Op Interest (Line 9) represents the estimated interest that will be earned on the District s Operating Reserves. Table 5-2: Other Revenues in FY 2019 Table 5-3 shows the revenue requirements of the District s conservation programs. The total conservation program revenue requirement for the District are shown in Column A, which are allocated to the Rancho Division in Column B and to the Santa Rosa Division in Column C based on each Division s respective share of projected inefficient water usage in FY 2019 (from Table 4-5). A brief description of each program is provided below. 1. Core Water Conservation Project: Costs of this program include materials, rebates, software and technical assistance provided to residential customers to improve water use efficiency. 2. Core CII/HOA Water Conservation: Costs of this program are similar to the Core Water Conservation Project but this program is intended for CII and HOA customers. 3. Core Ag Water Use Efficiency: Similar to Core Water Conservation Project but for Agricultural customers. 4. Research Pilots CII: This program funds the costs of research projects that explore new technologies and practices that may improve water use efficiency of CII customers. 5. Research Pilots AG: Similar to Research Pilots CII but for Agricultural customers. 6. Education & Community Outreach (Water Conservation): This program funds the costs of community events and workshops that promote water conservation and efficiency for all customers. 7. Research Pilots Urban: Similar to Education & Community Outreach (Water Conservation) but for residential customers only. Two-Year Rate Study Report 23

, other revenues (Table 5-2, Line 14), conservation program revenue requirements (Table 5-3, Line 8), and special conservation")
34 Table 5-3: Conservation Program Revenue Requirement in FY 2019 Table 5-4 shows the revenue requirements of the District s special conservation programs for highest tiers. Costs are allocated to each Division based on analysis by District staff. The total revenue requirement for special conservation programs for each Division is shown in Line 8 of Table 5-4. Table 5-4: Special Conservation Program Revenue Requirement in FY 2019 Table 5-5 shows the net revenue requirement to be funded from water rates in FY 2019 by each Division. Table 5-5 includes the total revenue requirements (Table 5-1, Line 9), other revenues (Table 5-2, Line 14), conservation program revenue requirements (Table 5-3, Line 8), and special conservation program revenue requirements (Table 5-4, Line 8). As shown in Table 5-5, other revenues (Line 2) function as an offset to the total revenue requirement, and are therefore subtracted from the total revenue requirement to determine the net revenue requirement (Line 3). Conservation-related revenue requirements in Lines 4 and 5 of Table 5-5 are then added to the net revenue requirement in Line 3 to determine the net revenue requirement from rates in Line 6. This represents the amount of revenue that must be generated by water sales in FY Rancho California Water District

35 Table 5-5: Revenue Requirement from Water Rates in FY 2019 COST OF SERVICE ANALYSIS This subsection details the allocation of the revenue requirement to various cost components. This process ensures that the costs of providing water service are allocated among customers and customer classes in proportion to each customer s and customer class s demand on the District s water system. Definition of Cost Components Breaking up the revenue requirement into various cost components allows for the allocation of costs to customer classes and tiers in proportion to the costs incurred by the District. Nine unique cost components were utilized. Each cost component is classified as fixed, variable, or RW. Fixed costs do not vary with water usage and are recovered primarily by the monthly fixed Service Charge. Variable cost components include costs that generally vary with the amount of potable water used and are recovered by potable water Commodity Charges and Energy Charges. Lastly, a single RW cost component includes all RW-related costs to be recovered by RW rates. Each cost component is described below. Fixed Cost Components:» Account: Costs associated with serving customers irrespective of water usage or meter size (billing, customer service, etc.).» Meter: Costs related to servicing, maintaining, and replacing meters.» Capacity: O&M and capital costs associated with meeting peak customer demand. Variable Cost Components:» Water Supply: Costs associated with production of groundwater, recharge and recovery, and purchase of imported water from MWD.» Delivery: Costs associated with operating costs of the water system in providing water to all customers at a constant average rate of use.» Energy: Costs associated with energy used to pump water (to be recovered by Energy Charges).» Supplemental Supply: Consists of two subcomponents. o Unfunded RW: RW costs not recovered by RW rates, as determined by District policy. District policy considers RW a part of the overall District water supply portfolio. As such, a portion of RW O&M costs are allocated to potable water rates at an amount that provides a RW rate that encourages RW sales. RW capital costs are part of the Non-operating budget and paid for with property tax revenues. Two-Year Rate Study Report 25
36 o CP: Costs associated with the District s conservation program and special conservation program for the highest tiers. The special conservation program includes capital costs associated with enhancing or improving the District s water supply.» Capital Surcharge (Santa Rosa Division only): Costs associated with the replacement and refurbishment (R&R) of existing physical assets and the addition of new physical assets. Since the Rancho Division is able to fully fund its capital expenses with other revenue sources such as property tax, it does not require the assessment of a capital surcharge. RW Cost Components:» RW: All remaining costs associated with operations and maintenance of the RW system that are not allocated to the Unfunded RW cost component. The RW cost component represents the total revenue requirement from RW rates. Allocation of Revenue Requirements to Cost Components Table 5-6 shows the allocation of the Rancho Division s revenue requirements to each cost component. The allocation of revenue requirements (including the Conservation Program and Special Programs for Highest Tiers) is shown in Lines 1-9 in Table 5-6. Column A shows the total revenue requirement for each line. The total revenue requirement in each line is allocated among the various cost components in Columns B through J based on cost analyses conducted by the District. In each line in Table 5-6, the sum of Columns B through J equals the total shown in Column A. Line 10 displays the total revenue requirement for each cost component before other revenues are applied as offsets. This total includes all revenue requirements shown in Table 5-1, as well the revenue requirements for the Conservation Program and Special Programs for Highest Tiers shown in Table 5-5. As shown in Table 5-5, other revenues are utilized to partially offset the total revenue requirement. Other revenues must also be allocated to each cost component in order to determine a net revenue requirement for each individual cost component. The allocation of other revenues to each cost component is conducted in the same manner as previously described for individual revenue requirements in Lines 1-9 in Table 5-6. Lines in Table 5-6 show each source of other revenue, with a total amount shown in Column A. This total amount is allocated among the cost components in Columns B through J based on District analysis and policy. Total other revenues are shown in Line 23 of Table 5-6. To then determine the net revenue requirement for each cost component, total other revenues (Line 23) are subtracted from the total revenue requirement (Line 10) for each cost component shown Columns B through J. The net revenue requirement by cost component is utilized later in Section 5 to develop the water and RW charges. 26 Rancho California Water District
37 Line # Revenue Requirements Table 5-6: Allocation of Revenue Requirements to Cost Components Rancho Reference Total (A) Account (B) Fixed Cost Components Meter (C) Capacity (D) Water Supply (E) Delivery (F) Variable Cost Components Energy (G) Unfunded RW (H) 1 Water Supply Cost Table 5-1, Line 1 $26,115,028 $0 $0 $3,701,812 $22,413,216 $0 $0 $0 $0 $0 2 Booster Pumping Table 5-1, Line 2 $1,787,531 $0 $0 $640,813 $0 $0 $1,146,718 $0 $0 $0 3 Transmission & Distribution (T&D) Table 5-1, Line 3 $5,872,895 $0 $75,173 $4,761,266 $0 $1,036,455 $0 $0 $0 $0 4 Customer Service (allocated to Water) Table 5-1, Line 4 $3,685,237 $2,789,350 $895,887 $0 $0 $0 $0 $0 $0 $0 5 Recycled Water Table 5-1, Line 5 $1,627,829 $0 $0 $0 $0 $0 $0 $679,489 $0 $948,340 6 Engineering (allocated to Water) Table 5-1, Line 6 $747,784 $0 $0 $0 $0 $747,784 $0 $0 $0 $0 7 Support (allocated to Water) Table 5-1, Line 7 $1,191,980 $0 $0 $0 $0 $1,191,980 $0 $0 $0 $0 8 Conservation Program Table 5-3, Line 8 $419,378 $0 $0 $0 $0 $0 $0 $0 $419,378 $0 9 Special Conservation Program Table 5-4, Line 8 $1,767,531 $0 $0 $0 $0 $0 $0 $0 $1,767,531 $0 10 Total Revenue Requirements $43,215,193 $2,789,350 $971,060 $9,103,891 $22,413,216 $2,976,220 $1,146,718 $679,489 $2,186,909 $948,340 CP (I) RW RW Rates (J) Other Revenues Reference Total Account Meter Capacity Water Supply Delivery Energy Unfunded RW CP RW Rates 11 Unmetered Construction Water Table 5-3, Line 1 $8,445 $0 $0 $0 $0 $8,445 $0 $0 $0 $0 12 New Service Connections Table 5-3, Line 2 $218,641 $0 $0 $0 $0 $218,641 $0 $0 $0 $0 13 Rental/Lease Income Table 5-3, Line 3 $519,682 $0 $0 $0 $519,682 $0 $0 $0 $0 $0 14 Other Billing Table 5-3, Line 4 $705,721 $0 $0 $0 $705,721 $0 $0 $0 $0 $0 15 Other Engineering Table 5-3, Line 5 $148,606 $0 $0 $0 $0 $148,606 $0 $0 $0 $0 16 Cash Reserve Use Table 5-3, Line 7 -$537,516 $0 $0 $0 -$537,516 $0 $0 $0 $0 $0 17 Reclass- from Non-Op Table 5-3, Line 8 $5,238,047 $0 $0 $0 $5,238,047 $0 $0 $0 $0 $0 18 Reclass - Non-Op Interest Table 5-3, Line 9 $291,000 $0 $0 $0 $0 $291,000 $0 $0 $0 $0 19 Post Retirement Prior Service Table 5-3, Line 10 $121,117 $0 $0 $0 $0 $121,117 $0 $0 $0 $0 20 Fire Service Revenue Table 5-3, Line 11 $490,655 $0 $0 $490,655 $0 $0 $0 $0 $0 $0 21 Metered Construction Water Revenue Table 5-3, Line 12 $268,656 $0 $0 $0 $0 $268,656 $0 $0 $0 $0 22 Tier 3 & 4 Revenue Table 5-3, Line 13 $419,378 $0 $0 $0 $0 $419,378 $0 $0 $0 $0 23 Total Other Revenues $7,892,432 $0 $0 $490,655 $5,925,934 $1,475,843 $0 $0 $0 $0 24 NET REVENUE REQUIREMENTS Table 5-5, Line 6 $35,322,761 $2,789,350 $971,060 $8,613,236 $16,487,282 $1,500,377 $1,146,718 $679,489 $2,186,909 $948,340 The allocation of the Santa Rosa Division s revenue requirements to cost components was conducted using the same methodology as described above for the Rancho Division. Table 5-7 shows the allocation of the Santa Rosa Division s revenue requirements and other revenues. The net revenue requirement for each cost component in Columns B through K is shown in Line 25. Note that the Capital cost component is included for the Santa Rosa Division in Column F, as water rate revenue is used to fund capital expenses in the Santa Rosa Division only. Two-Year Rate Study Report 27
38 Line # Revenue Requirements Table 5-7: Allocation of Revenue Requirements to Cost Components Santa Rosa Reference Total (A) Account (B) Meter (C) Capacity (D) 1 Water Supply Cost Table 5-1, Line 1 $23,382,998 $0 $0 $2,331,932 $21,051,066 $0 $0 $0 $0 $0 $0 2 Booster Pumping Table 5-1, Line 2 $2,469,263 $0 $0 $826,707 $0 $0 $0 $1,642,555 $0 $0 $0 3 Transmission & Distribution (T&D) Table 5-1, Line 3 $3,765,573 $0 $155,744 $2,612,145 $0 $0 $997,684 $0 $0 $0 $0 4 Customer Service (allocated to Water) Table 5-1, Line 4 $1,132,899 $950,781 $182,118 $0 $0 $0 $0 $0 $0 $0 $0 5 Recycled Water Table 5-1, Line 5 $891,197 $0 $0 $0 $0 $0 $0 $0 $486,353 $0 $404,844 6 Engineering (allocated to Water) Table 5-1, Line 6 $623,654 $0 $0 $0 $0 $0 $623,654 $0 $0 $0 $0 7 Support (allocated to Water) Table 5-1, Line 7 $645,725 $0 $0 $0 $0 $0 $645,725 $0 $0 $0 $0 8 Capital / CIP funding Table 5-1, Line 8 $1,004,276 $0 $0 $0 $0 $1,004,276 $0 $0 $0 $0 $0 9 Conservation Program Table 5-3, Line 8 $250,934 $0 $0 $0 $0 $0 $0 $0 $0 $250,934 $0 10 Special Conservation Program Table 5-4, Line 8 $812,022 $0 $0 $0 $0 $0 $0 $0 $0 $812,022 $0 11 Total Revenue Requirements $34,978,540 $950,781 $337,862 $5,770,784 $21,051,066 $1,004,276 $2,267,063 $1,642,555 $486,353 $1,062,956 $404,844 Other Revenues Reference Fixed Cost Components Total (A) Account Meter Capacity Water Supply (E) Capital (F) Fixed Cost Components Delivery (G) Energy (H) Water Supply Capital Delivery Energy Unfunded RW (I) CP (J) RW RW Rates (K) Unfunded RW CP RW Rates 12 New Service Connections Table 5-3, Line 1 $105,181 $0 $0 $0 $0 $0 $105,181 $0 $0 $0 $0 13 Rental/Lease Income Table 5-3, Line 3 $268,042 $0 $0 $0 $268,042 $0 $0 $0 $0 $0 $0 14 Other Billing Table 5-3, Line 4 $295,302 $0 $0 $0 $295,302 $0 $0 $0 $0 $0 $0 15 Other Engineering Table 5-3, Line 5 $54,086 $0 $0 $0 $0 $0 $54,086 $0 $0 $0 $0 16 Wester IDA/Rock Mountain (Job WMS) Table 5-3, Line 6 $126,086 $0 $0 $0 $0 $0 $126,086 $0 $0 $0 $0 17 Cash Reserve Use Table 5-3, Line 7 -$967,995 $0 $0 $0 -$967,995 $0 $0 $0 $0 $0 $0 18 Reclass- from Non-Op Table 5-3, Line 8 $4,647,450 $0 $0 $0 $4,647,450 $0 $0 $0 $0 $0 $0 19 Reclass - Non-Op Interest Table 5-3, Line 9 $183,000 $0 $0 $0 $183,000 $0 $0 $0 $0 $0 $0 20 Post Retirement Prior Service Table 5-3, Line 10 $75,668 $0 $0 $0 $0 $0 $75,668 $0 $0 $0 $0 21 Fire Service Revenue Table 5-3, Line 11 $165,804 $0 $0 $165,804 $0 $0 $0 $0 $0 $0 $0 22 Metered Construction Water Revenue Table 5-3, Line 12 $38,379 $0 $0 $0 $0 $0 $38,379 $0 $0 $0 $0 23 Tier 3 & 4 Revenue Table 5-3, Line 13 $250,934 $0 $0 $0 $0 $0 $250,934 $0 $0 $0 $0 24 Total Other Revenues $5,241,937 $0 $0 $165,804 $4,425,799 $0 $650,334 $0 $0 $0 $0 25 NET REVENUE REQUIREMENTS Table 5-5, Line 6 $29,736,602 $950,781 $337,862 $5,604,980 $16,625,267 $1,004,276 $1,616,729 $1,642,555 $486,353 $1,062,956 $404, Rancho California Water District
39 MONTHLY SERVICE CHARGE RATE DEVELOPMENT The fixed cost components used to determine the monthly Service Charge were briefly outlined in Section 5.2.2, and are described in greater detail below. 1. Account: The Account cost component relates to costs that are based upon the number of accounts the District has. These costs typically relate to efforts such as providing customer service to account holders, calculating and distributing billing, and mailing required notices. Since these costs do not vary with meter size, the Account cost component unit rate is assessed equally to all accounts regardless of meter size. 2. Meter: The Meter cost component relates to costs that are based upon the size of a meter. These costs typically relate to efforts such as the physical maintenance of meters. Larger meters result in higher maintenance costs due to physical size and parts needed. The apportionment of these costs by meter size is determined by a meter equivalency ratio specific to the Meter cost component. Meter equivalency ratios ensure that Meter costs are proportionate to the meter size, and are described in greater detail later in this section. 3. Capacity: The Capacity cost component relates to costs that are based upon the total flow capability of each meter. Capacity costs represent the broadest category of fixed costs, and are comprised of all operating costs necessary to provide water, but that do not fluctuate with the actual amount of water provided. These costs typically are comprised of activities including the operations and maintenance of the water distribution system, legal and regulatory compliance, and certain administrative efforts. The water system must be designed to meet potential water demand regardless of the actual water demand in a particular period of time. The ability to meet capacity demand requires complex facilities with significant maintenance and oversight costs. The apportionment of Capacity costs is determined by using equivalent meter ratios that are based on a gallon per minute flow rate for each meter size. Larger meters have the potential to place larger demands on the water system. The use of meter equivalency ratios (different from the ratios applied to the Meter cost component) ensures that the Capacity cost component is apportioned in a manner that is proportionate to meter size. In order to recover fixed costs from customers in a proportionate and equitable manner, each meter size is assigned a meter equivalency ratio for each cost component relative to a 3/4-inch meter, which has a value of 1. A meter s ratio of costs relative to that of a 3/4-inch meter determines the number of Equivalent Meter Units (EMUs) assigned to that particular meter size. The number of EMUs is calculated using meter equivalency ratios determined by District staff and endorsed by the AWWA M-1 Manual as industry standard. This allows the monthly Service Charge to be assessed by meter size. Please note again that the District uses different meter equivalency ratios for each cost component. Meter equivalency ratios are shown for the Account, Meter, and Capacity components in Table 5-8. Because Account costs are apportioned to all meter sizes equally, the Account meter equivalency ratio is 1.00 for all meter sizes. This results in a uniform Account charge for all meter sizes. In contrast, the Meter and Capacity meter equivalency ratios do escalate as meter size increases. Two-Year Rate Study Report 29

40 To calculate total EMUs, the number of meters for each meter size is multiplied by the corresponding meter equivalency ratio. For example, the number of EMUs from 1-inch meters in the Rancho Division to be used to determine the Meter cost component unit charge is calculated thusly: Number of EMUs from 1-in meters in Rancho Division = [Column B, Line 2] x [Column D, Line 2] This calculation is repeated for each meter size and cost component for both Divisions. Number of EMUs for each meter size are then summed to provide total EMUs for each of the three cost components. This is an intermediate calculation step not explicitly shown in Table 5-8. The total number of EMUs for each cost component are then multiplied by 12 billing periods per year (also not explicitly shown in Table 5-8). This results in total units of service, which are shown by cost component (Columns A through C) for each Division in Lines of Table 5-8. Total units of service are later used in the determination of monthly unit charges per EMU for each of the three fixed cost components. Table 5-8: Meter Ratios by Meter Size 10 Table 5-9 shows the development of FY 2019 unit charges for each of the three fixed cost components that comprise the fixed monthly Service Charge. Revenue Requirements shown in Column A of Table 5-9 are from Tables 5-6 and 5-7, while units of service in Column B are from Lines of Table 5-8. Unit charges are calculated for each cost component by dividing the revenue requirement by the units of service. 10 Lines 11 and 12 in Table 5-8 are rounded to the nearest unit of service. Precise values are used in the unit charge calculation in Table Rancho California Water District
.")
 have unique meter equivalency ratios.")
41 Table 5-9: Unit Charges for Monthly Service Charge Cost Components 11 Column D in Table 5-10 and Table 5-11 show the proposed FY 2019 fixed monthly rates for the Service Charges for the Rancho and Santa Rosa Divisions respectively. The proposed monthly rate for the Service Charge for each meter size is the sum of the charges for each of the three fixed cost components (Columns A through C). Charges for each cost component vary by meter size, and are determined by multiplying the per EMU unit charge for each cost component by the corresponding meter equivalency ratio shown in Table 5-8. As mentioned above, please note that each of the three fixed cost components (Account, Meter, and Capacity) have unique meter equivalency ratios. Table 5-10: Proposed FY 2019 Monthly Service Charge Rates ($/Meter Size) Rancho Column C in Table 5-9 is rounded up to the nearest $ Column D in Table 5-10 is rounded up to the nearest $0.01. Two-Year Rate Study Report 31

42 Table 5-11: Proposed FY 2019 Monthly Service Charge Rates ($/Meter Size) Santa Rosa 13 ENERGY CHARGE RATES The District assesses an energy rate on all water sales to recover the energy costs necessary to move water from the base elevation where the source of water is to higher areas in the District s service area. This ensures that customers only pay their proportionate amount of the costs to deliver water to their point of use at higher elevations. Accordingly, each area of the District is subdivided into pump zones to represent each elevation level. The energy rate per pump zone represents the incremental energy cost to lift water from the base elevation area to that zone. In order to calculate the energy rate per pump zone, the total number of equivalent lift units must be determined. An equivalent lift unit represents pumping one ccf of water to a location one foot higher in elevation. The number of FY 2019 equivalent lift units in each pump zone can therefore be calculated by multiplying projected FY 2019 water sales in ccf by the elevation differential (or lift factor) in feet. Lift factors were provided by District staff, and represent the elevation difference in feet between the base water source elevation and the pump zone elevation. Table 5-12 and Table 5-13 show the calculation of the total equivalent lift units in the Rancho and Santa Rosa Divisions respectively. 13 Column D in Table 5-11 is rounded up to the nearest $ Rancho California Water District

. Table 5-14: FY 2019 Energy Unit Rate Calculation 15 14 Column B in Tables 5-12 and 5-13 is rounded to the nearest ccf.")
43 Table 5-12: Equivalent Lift Units - Rancho 14 Table 5-13: Equivalent Lift Units Santa Rosa Table 5-14 shows the energy unit rate calculation for each Division in FY The energy unit rate is calculated by dividing the energy revenue requirement (from Table 5-6 and Table 5-7) by the number of equivalent lift units (from Table 5-12 and Table 5-13). Table 5-14: FY 2019 Energy Unit Rate Calculation Column B in Tables 5-12 and 5-13 is rounded to the nearest ccf. Precise FY 2019 sales values were used to calculate equivalent lift units in Column C. 15 Line 3 in Table 5-14 is rounded to the nearest $ Two-Year Rate Study Report 33
 by the energy unit rate (from Table 5-14).")
 by Power Zone - Rancho 16 Table 5-16: Proposed FY 2019 Energy Charge Rates ($/CCF) by Power Zone Santa Rosa 17 WATER COMMODITY CHARGE RATES")
44 Column B in Table 5-15 and Table 5-16 show the proposed FY 2019 Energy Charge rates by power zone for the Rancho and Santa Rosa Divisions respectively. Energy Charge rates for each pump zone are calculated by multiplying the lift factor (from Table 5-12 and Table 5-13) by the energy unit rate (from Table 5-14). Current energy rates are shown in Column C of Table 5-15 and Table Table 5-15: Proposed FY 2019 Energy Charge Rates ($/CCF) by Power Zone - Rancho 16 Table 5-16: Proposed FY 2019 Energy Charge Rates ($/CCF) by Power Zone Santa Rosa 17 WATER COMMODITY CHARGE RATES This section details the development of the proposed FY 2019 water Commodity Charge rates based on the allocation of expenses to variable cost components as described in Section The four primary variable cost components are described below. Note that the energy cost component is excluded from this section as it applies only to Energy Charges. The proposed water Commodity Charge rates for each customer class and tier is determined by summing the four variable cost components. This methodology is consistent with Proposition 218, and ensures that customers are assessed water commodity charges that are proportional to the amount of water used. 16 Column B in Table 5-15 is rounded up to the nearest $ Column B in Table 5-16 is rounded up to the nearest $ Rancho California Water District
45 The water commodity cost components were briefly outlined in Section 5.2.2, and are described in greater detail below: 1. Water Supply: The water supply cost component pertains to the costs associated with production of groundwater, untreated water (recharge and recover), and purchase of imported water from MWD. The District utilizes native groundwater as the first source of supply as it has the lowest marginal cost per AF. Native groundwater supplies only meet a portion of the total demand. Therefore, the District must supplement its supply with treated and untreated water purchases from a member agency of MWD. The average purchased water costs of MWD include the direct cost of purchased water and the cost of the sold water, which considers impacts of water losses that are normal in a water system. Water loss is the difference between total water purchased and total water delivered to customers. Total water purchased always exceeds total water delivered primarily due to leaks within a distribution system. Water loss causes the sales price per unit of water to cost more than the purchase price per unit of water. 2. Capital Surcharge (Santa Rosa Division only): The capital surcharge cost component covers the capital facility replacement and rehabilitation costs with otherwise insufficient funding by nonoperating revenue sources such as property assessments which are the primary funding source for capital expenses of the District. These capital costs are necessary for maintaining the facility capacity to provide water service to all customers and recovered as a uniform rate on all units of water sold in the Santa Rosa Division. As previously noted, the Rancho Division fully funds its capital expenses with other revenue sources such as property tax, and therefore does not assess a capital surcharge. 3. Delivery: These costs are associated with operating costs of the water system in providing water to all customers at a constant average rate of use. Therefore, delivery costs are spread over all units of water, irrespective of customer classes or tiers, to calculate a uniform rate. Delivery costs are recovered in Tier 1 for BBTR and CII/Ag customers in order to ensure reliable recovery of revenue to cover the delivery cost component. 4. Supplemental Supply: The supplemental supply cost component covers the costs associated with the District s conservation programs, special conservation program for highest tiers, and a portion of RW costs (as determined by District policy). The special conservation program includes capital costs associated with enhancing or improving the District s water supply. Any usage above an efficient level is subject to higher charges to fund conservation programs, as well as supplemental water supply programs such as recycled water. Those customers who use and place greater demands on the District s water supplies create the need for the District to institute and supplement its conservation programs and supplemental water supply programs in order to accommodate higher water use. The four commodity cost components listed above are applied differently to each tier within the BBTR and CII /Ag customers because of differences in water usage characteristics. Table 5-17 shows how each cost component is applied to each tier within the BBTR and CII/Ag customer classes. Please note that the capital surcharge cost component only applies to the Santa Rosa Division. An x in Columns B and C in Table 5-17 denotes that the cost component applies to the tier in question. Text descriptions in Column A and D in Table 5-17 explain how the water supply and supplemental supply cost component applies to each tier. RW replaces Two-Year Rate Study Report 35

46 and offsets some potable outdoor use and provides additional water reliability for potable outdoor use and higher tier use. A portion of RW costs are recovered in respective tiers as shown in Table Table 5-17: Water Commodity Cost Components *Santa Rosa Division only Table 5-18 shows the percentage of water usage in each tier that is accountable for each cost component. Tier 1 is accountable for recovery of 100 percent of the delivery cost component in order to ensure reliable recovery of fixed costs that comprise the delivery cost component. Projected Tier 1 sales are inherently more certain than sales in higher tiers. Therefore, applying the delivery component solely to Tier 1 sales ensures reliable recovery of fixed costs not allocated to the fixed monthly Service Charge. Note that the three subcomponents (Conservation, Special Programs for Highest Tiers, and Unfunded RW) associated with the supplemental supply cost component are applied to higher tiers, as less efficient water usage generates the need for conservation and supply augmentation. Additionally, 25 percent of BBTR Tier 2 and CII/Ag Tier 1 water usage is accountable for the Unfunded RW cost component. This is because RW reduces reliance on more expensive imported water from MWD, thereby reducing water supply costs to be recovered by BBTR Tier 2 and CII/Ag Tier 1 sales. Additionally, projected water sales in FY 2019 are shown in Column F and Column G of Table 5-18 for the Rancho and Santa Rosa Divisions respectively. 36 Rancho California Water District

47 Table 5-18: Percent of Water Usage by Tier Accountable for Cost Components 18 Table 5-19 shows the development of units of service (in ccf) by tier for BBTR and CII/AG water sales in the Rancho Division. To determine the units of service by tier for each cost component, the percentage of usage accountable for each tier is multiplied by total water sales in each tier. For example, the units of service for the Delivery cost component of BBTR Tier 1 in the Rancho Division (Column A, Line 2 of Table 5-19) is calculated by multiplying Column A, Line 2 of Table 5-18 by Column F, Line 2 of Table Table 5-19 shows total BBTR units of service by cost component in Line 6, which is calculated by summing Lines 2-5 in each column. Total CII/Ag units of service is similarly shown in Line 12 of Table 5-19, which is calculated by summing Lines Units of service by tier are calculated in the same manner for the Santa Rosa Division, and are shown in Table Table 5-19: Units of Service by Tier Rancho Line Delivery Conservation Special Program Unfunded RW # Rancho (A) (B) (C) (D) 1 BBTR Sales 2 Tier 1 4,352, Tier ,218,024 4 Tier , ,209 5 Tier , , ,630 6 BBTR Total 4,352,687 1,207, ,630 2,425, CII/Ag Sales 9 Tier 1 3,435, , Tier , , Tier ,634 42,634 42, CII/Ag Total 3,435, ,871 42, , Column E in Table 5-18 applies to the Santa Rosa Division only. Two-Year Rate Study Report 37

48 Table 5-20: Units of Service by Tier Santa Rosa Line Delivery Conservation Special Program Unfunded RW Capital # Santa Rosa (A) (B) (C) (D) (E) 1 BBTR Sales 2 Tier 1 632, ,572 3 Tier ,718 1,126,870 4 Tier , , ,394 5 Tier , , , ,740 6 BBTR Total 632, , , ,852 2,160, CII/Ag Sales 9 Tier 1 7,486, ,871,623 7,486, Tier , , , Tier ,515 10,515 10,515 10, CII/Ag Total 7,486, ,690 10,515 2,267,313 7,882,182 Table 5-21 shows total units of service for each cost component for BBTR and CII/Ag sales within each Division. Total BBTR and CII/Ag units of service in the Rancho Division (shown in Line 2 and Line 3 in Table 5-21) are from Line 6 and Line 12 in Table 5-19 respectively. Similarly, total BBTR and CII/Ag units of service in the Santa Rosa Division (shown in Line 6 and Line 7 in Table 5-21) are from Line 6 and Line 12 in Table 5-20 respectively. Line 1 and Line 5 of Table 5-21 show the sum of BBTR and CII/Ag units of service by cost component for the Rancho and Santa Rosa Divisions respectively. For example, Line 1 in Table 5-21 is simply the sum of Line 2 and Line 3 in each column of Table Table 5-21: Units of Service for Cost Components Water Supply Cost Component The District has three distinct sources of supply. Groundwater production is the cheapest source of supply. Each year staff evaluates the District s aquifer levels to determine how much groundwater can be drawn from the aquifer without causing long-term damage. The second source of supply is the District s Recharge and Recovery program that uses MWD untreated Tier 1 water that is treated naturally through percolation via a recharge spreading ground and recovered for use. Lastly, the District buys fully treated imported water to supplement groundwater and Recharge and Recovery water. Table 5-22 presents the unit rate for each water supply source and annual production in AF by source for the Rancho Division in FY Rancho California Water District


49 Annual production is allocated between BBTR and CII/Ag customers based on projected water sales shown previously in Table 4-1. Water available for sales in Table 5-22 adjusts production based on a 3.5% water loss factor, which represents the percentage of water supply lost to leaks during the transmission and distribution process and therefore not delivered to customers for use. Table 5-22: FY 2019 Water Supply Cost Component Allocation by Source Rancho 19 The water supply cost component can be calculated for each tier based on the unit water supply cost and supply allocation by source. Table 5-23 and Table 5-24 show the FY 2019 water supply cost component of the Commodity Charge rates for BBTR and CII/Ag sales respectively in the Rancho Division. Table 5-23: FY 2019 BBTR Supply Cost Component Rates ($/CCF) by Tier Rancho The net unit rate in Table 5-22 incorporates revenue offsets associated with each supply source, is adjusted by a water loss factor of 3.5 percent, and is then converted to $/ccf (rounded up to the nearest $0.01). 20 The net unit cost in Table 5-23 incorporates revenue offsets associated with each supply source (rounded to the nearest $0.01). Two-Year Rate Study Report 39


50 Table 5-24: FY 2019 CII/Ag Budget Supply Cost Component Rates ($/CCF) by Tier Rancho Table 5-25 shows the water supply allocation by source for the Santa Rosa Division. Table 5-26 and Table 5-27 show the FY 2019 supply cost components for BBTR and CII/Ag sales respectively in the Santa Rosa Division. The same methodology as outlined above for the Rancho Division was utilized to determine the supply cost components for the Santa Rosa Division. Table 5-25: FY 2019 Water Supply Cost Component Allocation by Source Santa Rosa The net unit rate in Table 5-25 incorporates revenue offsets associated with each supply source, is adjusted by a water loss factor of 3.5 percent, and is then converted to $/ccf (rounded up to the nearest $0.01). 40 Rancho California Water District


51 Table 5-26: FY 2019 BBTR Supply Cost Component Rates ($/CCF) by Tier Santa Rosa 22 Table 5-27: FY 2019 CII/Ag Supply Cost Component Rates ($/CCF) by Tier Santa Rosa Delivery Cost Component Delivery costs include transmission and distribution expenses, and are equal to the fixed costs of the water system that are not allocated to the fixed monthly service charge. For both Divisions, the delivery revenue requirement is recovered over the units of water sold in Tier 1 only. This results in a different unit cost for BBTR and CII/Ag customers in both Divisions. This is due to the fact that CII/Ag customers have a disproportionate amount of water use in Tier 1 versus BBTR customers. Since CII/Ag customers only have three tiers, a higher percentage of their total use falls in Tier 1, whereas BBTR customers have four tiers so a smaller percentage of their total use falls in Tier 1. Table 5-28 and Table 5-29 show the FY 2019 unit delivery rates for the Rancho and Santa Rosa Divisions respectively. Again, the delivery cost components only are incorporated into Tier 1 rates for both BBTR and 22 The net unit cost in Table 5-26 incorporates revenue offsets associated with each supply source (rounded to the nearest $0.01). Two-Year Rate Study Report 41
 to provide a unit delivery rate (per ccf).")
.")
52 CII/Ag customers. Delivery revenue requirements (from Table 5-6 and Table 5-7) are split between BBTR and CII/Ag customers using the projected sales split for each Division (from Table 4-1). The revenue requirement is divided by the units of service (from Table 5-21) to provide a unit delivery rate (per ccf). Table 5-28: FY 2019 Unit Delivery Rates ($/CCF) Rancho 23 Table 5-29: FY 2019 Unit Delivery Rates Santa Rosa 24 Supplemental Supply Program Cost Component The supplemental supply cost component incorporates the costs of the District s conservation program, special conservation program, and unfunded RW service (RW costs not allocated to RW rates). Table 5-30 shows the development of FY 2019 supplemental supply cost component unit rates for the Rancho Division. Unit rates are calculated by dividing the revenue requirement for each supplemental supply cost component (from Table 5-6) by the corresponding number of units of service (from Table 5-21). Table 5-30: FY 2019 Unit Rates for Supplemental Supply Cost Component Rancho Line 5 in Table 5-28 is rounded up to the nearest $ Line 5 in Table 5-29 is rounded up to the nearest $ Line 3 in Table 5-30 is rounded up to the nearest $ Rancho California Water District


53 As previously shown in Table 5-17, the Conservation cost component only applies to Tiers 3 and 4 for BBTR customers and Tiers 2 and 3 for CII/Ag customers. The Special Program cost component only applies to Tier 4 for BBTR customers and Tier 3 for CII/Ag customers. The Unfunded RW cost component was allocated by calculating a per unit cost based on dividing the total component cost by 25% of Tier 2 BBTR and Tier 1 CII/Ag sales plus 100 percent of Tier 3 and 4 BBTR sales and Tier 2 and 3 CII/Ag sales. Again, the rationale is that higher tiers should recover supplemental supply costs incurred as a result of inefficient/non-essential water usage. CII/Ag Tier 1 is responsible for the Unfunded RW component because water supply costs allocated to this tier are reduced as RW augments purchases of more expensive imported water from MWD, and because Tier 1 includes a significant amount of outdoor use. Table 5-31 shows the calculation of the supplemental supply rate by tier for the Rancho Division in Column D. Table 5-31: FY 2019 Supplemental Supply Cost Component Rates ($/CCF) by Tier Rancho 26 Table 5-32 and Table 5-33 show the development of the FY 2019 supplemental supply rates for the Santa Rosa Division. The same methodology is utilized as outlined above in the development of Rancho Division FY 2019 supplemental supply rates. Table 5-32: FY 2019 Unit Rates ($/CCF) for Supplemental Supply Cost Component Santa Rosa Columns A-C in Table 5-31 are rounded up to the nearest $ Line 3 in Table 5-32 is rounded up to the nearest $0.01. Two-Year Rate Study Report 43


54 Table 5-33: FY 2019 Supplemental Supply Cost Component Rates ($/CCF) by Tier Santa Rosa 28 Capital Surcharge Cost Component Santa Rosa Table 5-34 shows the unit rate calculation for the FY 2019 capital surcharge cost component in the Santa Rosa Division. Note that the Rancho Division is not assessed a capital surcharge. The per ccf unit rate is determined by dividing the capital surcharge revenue requirement (from Table 5-7) by the corresponding units of service (from Table 5-21). Table 5-34: FY 2019 Capital Surcharge 29 Proposed FY 2019 Water Commodity Charge Rates Column D in Table 5-35 shows the FY 2019 unit rates in the Rancho Division for each of the three cost components in Columns A through C (from Table 5-23 and Table 5-24, Table 5-28, and Table 5-31). Note that the capital surcharge cost component is excluded for the Rancho Division only. The proposed Commodity Charge rates are simply the sum of the three cost components for each tier. Table 5-36 shows the current Commodity Charge rates in Column A and the proposed FY 2019 Commodity Charge rates in Column B for the Rancho Division. 28 Columns A-C in Table 5-33 are rounded up to the nearest $ Line 3 in Table 5-34 is rounded up to the nearest $ Rancho California Water District
 in the Santa Rosa Division for each of the four cost components in Columns A through D (shown in Table 5-26 and Table 5-27,")

55 Table 5-35: FY 2019 Water Commodity Charge Rates ($/CCF) by Cost Component Rancho Table 5-36: FY 2019 Water Commodity Charge Rates ($/CCF) Rancho Similarly, Table 5-37 shows the FY 2019 unit rates (column E) in the Santa Rosa Division for each of the four cost components in Columns A through D (shown in Table 5-26 and Table 5-27, Table 5-29, Table 5-33, and Table 5-34). Note that the capital surcharge cost component is included in the commodity charge rates for the Santa Rosa Division. Table 5-38 shows the current Commodity Charge rates in Column A and the proposed FY 2019 Commodity Charge rates in Column B for the Santa Rosa Division. Two-Year Rate Study Report 45

56 Table 5-37: FY 2019 Water Commodity Charge Rates ($/CCF) by Cost Component Santa Rosa Table 5-38: FY 2019 Water Commodity Charge Rates ($/CCF) Santa Rosa WATER CUSTOMER IMPACTS Upon developing proposed monthly water rates, bill impacts were calculated for a typical residential customer under various levels of water usage. Figure 5-1 and Figure 5-2 show the monthly bill impacts for four levels of monthly water usage assuming the following customer characteristics:» Meter Size: ¾-inch» Household Size: 4 people» Landscape Area: 4,000 square feet» Power Zone: 1485 (Rancho) or 1434 (Santa Rosa) 46 Rancho California Water District


57 Figure 5-1: FY 2019 Average Residential Customer Monthly Bill Impacts - Rancho Figure 5-2: FY 2019 Average Residential Customer Monthly Bill Impacts Santa Rosa Two-Year Rate Study Report 47

58 DEVELOPMENT OF FY 2020 WATER RATES Proposed water rates for FY 2020 were calculated by escalating the proposed FY 2019 water rates by the forecasted percentage increase in water revenue requirements in each Division. Therefore, the first step in calculating the proposed FY 2020 water rates was to determine the FY 2020 water revenue requirement in each Division. REVENUE REQUIREMENT INCREASES The forecasted water revenue requirements in FY 2020 for each Division are based on estimated cost escalations provided by District staff (see Appendix A for FY 2020 cost escalations). Table 6-1 and Table 6-2 show water revenue requirements in FY 2019 and FY 2020 for the Rancho and Santa Rosa Divisions respectively. Revenue increase from growth is based on projected increases in new accounts and water sales based on FY 2019 water rates. The percent change between the FY 2019 and FY 2020 revenue requirements is shown in Line 7 of Table 6-1 and Table 6-2. These percentage changes in the water revenue requirement between FY 2019 and FY 2020 provide the basis for determining proposed FY 2020 water rates. Table 6-1: FY 2020 Water Revenue Requirement Rancho *From increase in sales and new meters at FY 2019 Rates Table 6-2: FY 2020 Water Revenue Requirement Santa Rosa *From increase in sales and new meters at FY 2019 Rates 48 Rancho California Water District

59 PROPOSED FY 2020 WATER RATES Table 6-3 through Table 6-5 show the current, proposed FY 2019, and proposed FY 2020 water rates for the Rancho Division. Proposed FY 2020 water rates were calculated by increasing the proposed FY 2019 rates by 3.91%, which is equal to the percent increase in the annual water revenue requirements in the Rancho Division in FY Note that the percent increases in charges/rates between FY 2019 and FY 2020 for some meter sizes and tiers diverge slightly from 3.91% due to rounding up of proposed FY 2020 water rates. Table 6-3: FY 2020 Monthly Service Charge Rates ($/Meter Size) Rancho Table 6-4: FY 2020 Energy Charge Rates ($/CCF) by Power Zone Rancho Table 6-5: FY 2020 Water Commodity Charge Rates ($/CCF) Rancho Two-Year Rate Study Report 49

60 Table 6-6 through Table 6-8 show the current, proposed FY 2019, and proposed FY 2020 water rates for the Santa Rosa Division. Proposed FY 2020 water rates were calculated by increasing the proposed FY 2019 rates by 5.36%, which is equal to the percent increase in the annual water revenue requirements in the Santa Rosa Division in FY Note that percent change in charges/rates for some meter sizes and tiers diverge slightly from 5.36% due to rounding up proposed FY 2020 water rates. Table 6-6: FY 2020 Monthly Service Charge Rates ($/Meter Size) Santa Rosa Table 6-7: FY 2020 Energy Charge Rates ($/CCF) by Power Zone Santa Rosa Table 6-8: FY 2020 Water Commodity Charge Rates ($/CCF) Santa Rosa 50 Rancho California Water District
 to be another source of water within its supply portfolio.")
61 RECYCLED WATER (RW) RATES The District provides recycled water to approximately 137 accounts in the Rancho Division and 96 accounts in the Santa Rosa Division. The District considers recycled water (RW) to be another source of water within its supply portfolio. Due to specific supply and distribution costs, RW rates are calculated independently from potable water rates. RW REVENUE REQUIREMENTS In order to calculate RW rates, the RW revenue requirement must first be determined. Included in the RW revenue requirements are the District s operating and corrective maintenance expenses associated with RW service. As discussed in Section 5, RW costs are partially offset by contributions from potable water commodity charge rate revenue in each Division. Every AF of RW sold represents a benefit to potable water customers, as RW demand serves as an offset to potable water demand. Substituting more expensive MWD Tier 1 water with less expensive recycled water benefits both Divisions financially and allows each Division to diversify its water supply portfolio with a less expensive supply source. RW revenue requirements for each Division in FY 2019 and FY 2020 are shown in Table 7-1 below. Note that the 8.25% and 8.28% increases (from Line 20 in Table 7-1) in the RW revenue requirement between FY 2019 and FY 2020 in the Rancho and Santa Rosa Divisions respectively provide the basis for RW rate increases in FY Table 7-1: RW Revenue Requirements Two-Year Rate Study Report 51

62 DEVELOPMENT OF RW RATES RW Monthly Service Charges The District currently limits the RW fixed monthly Service Charge to $20 per month for all meter sizes in both Divisions in order to provide an incentive for customers to use RW. The proposed RW monthly Service Charges for FY 2019 and FY 2020 are developed utilizing a different methodology. RW accounts share similar customer service and meter service costs as potable water accounts. Therefore, the proposed RW monthly Service Charges utilize the same Account and Meter fixed cost components as potable water (discussed in Section 5.3, Table 5-9 and Table 5-10). However, RW service utilizes a different distribution system than potable water service. Therefore, the Capacity cost component included in the potable water monthly service charge calculation is omitted from the RW monthly service charge calculation. Table 7-2 shows the proposed FY 2019 RW monthly Service Charge in Column E and the proposed FY 2020 monthly Service Charge in Column H for the Rancho Division. The FY 2019 Account charge component shown in Column C of Table 7-2 is from Column A of Table 5-9. The FY 2019 Meter charge component shown in Column D of Table 7-2 is from Column B of Table 5-9. Note that the increase in monthly Service Charge in FY 2020 is based on the increase in RW revenue requirements in FY 2020, as shown in Line 20 in Table 7-1. Total and projected revenue generated by the Rancho Division s current, as well as the proposed FY 2019 and proposed FY 2020 RW monthly service charge is shown at the bottom of Table 7-2. Table 7-2: RW Monthly Service Charges ($/Meter Size) Rancho Proposed two-year RW monthly service charges in the Santa Rosa Division are similarly shown in Table 7-3. Note that the FY 2019 Account charge component shown in Column C of Table 7-3 is from Column A of Table The FY 2019 Meter charge component shown in Column D of Table 7-3 is from Column B of Table Note that the increase in monthly Service Charge in FY 2020 is based on the increase in RW revenue requirements in FY 2020, as shown in Line 20 in Table Rancho California Water District
 from the RW revenue requirement")
 to provide a RW Commodity Charge rate per AF.")
63 Table 7-3: RW Monthly Service Charge Rates Santa Rosa RW Commodity Charge Rates Line 5 in Table 7-4 shows the proposed FY 2019 and FY 2020 RW Commodity Charge rates for each Division. The RW Commodity Charge rates are calculated by first subtracting total projected revenue generated by the RW monthly Service Charges (see Table 7-2 and Table 7-3) from the RW revenue requirement (see Line 19 in Table 7-1). This determines the net RW Commodity Charge revenue requirement. The net RW Commodity Charge revenue requirement is then divided by projected annual RW sales (determined by District staff) to provide a RW Commodity Charge rate per AF. The projected RW sales are based on the trends of actual RW sales for FY 2016 and FY 2017, as well as for FY 2018 to date. The RW Commodity Charge is designed to recover remaining RW costs that are not recovered by the RW fixed monthly Service Charge. Table 7-4: RW Unit Commodity Charge Rates ($/AF) Two-Year Rate Study Report 53

64 WASTEWATER (WW) RATES REVENUE REQUIREMENTS Similar to the rate calculations for water and RW, the wastewater (WW) rate calculations begin with establishing the revenue requirements for the WW enterprise. The WW revenue requirements for FY 2019 and FY 2020 were determined by the District and provided to Raftelis for use in the Study and as detailed in the District s proposed FY 2018/2019 Operating and Non-Operating Budget. The WW revenue requirements include operating costs, necessary capital replacement, and debt service. Table 8-1 details the WW revenue requirements for the District in FY 2019 and FY Table 8-1: WW Revenue Requirements DEVELOPMENT OF WW RATES The District is projected to provide wastewater services to approximately 8,300 equivalent dwelling units (EDUs) within its service area in FY An EDU is the volume of wastewater expected to be generated by one single family dwelling per day. EDUs are assigned to non-single family dwellings based on the type of use the connection will serve (restaurant, car wash, etc.). A list of connection types and their assigned EDUs is detailed in the Rancho California Water District s Rules and Regulations Governing Sewer System Facilities and Service which is available on the District s web site. The District does not expect any substantive changes to the historical flows generated by its customers and only anticipates a slight increase of 30 EDUs in FY 2020 due to growth and based on historical trends. As such, the proposed rates herein are solely based on meeting the District s revenue requirements. A full cost of service study is not needed at this point in time, but it should be determined in the next two years if a full cost of service analysis is warranted. Table 8-2 shows the EDUs for each of the next two fiscal years. Table 8-2: Total District WW EDUs With the revenue requirements and EDUs determined, the proposed WW monthly Service Charges for FY 2019 and FY 2020 were calculated in Table 8-3 and Table 8-4, respectively. Each revenue requirement component 54 Rancho California Water District
 30 Table 8-4: FY 2020 WW Monthly Service Charge Rates ($/EDU) 31 The proposed WW monthly Service Charge rates for each fiscal year")

65 was divided by the total units of service (EDUs) to determine the maximum monthly rate per EDU for the corresponding fiscal year. Table 8-3: FY 2019 WW Monthly Service Charge Rates ($/EDU) 30 Table 8-4: FY 2020 WW Monthly Service Charge Rates ($/EDU) 31 The proposed WW monthly Service Charge rates for each fiscal year calculated above are the maximum rates that the District may charge per EDU. However, the District plans to use a portion of its reserves to reduce each rate slightly. Therefore, the proposed WW monthly Service Charge rates recommended by District Staff are shown in Table 8-5. Table 8-5: Effective WW Monthly Service Charge Rates ($/EDU) for FY 2019 and FY Column B in Table 8-3 is rounded to the nearest $ Column B in Table 8-4 is rounded to the nearest $0.01. Two-Year Rate Study Report 55
66 APPENDIX A: FY 2019 & FY 2020 Operating Budgets (As of March 9, 2018) 56 Rancho California Water District
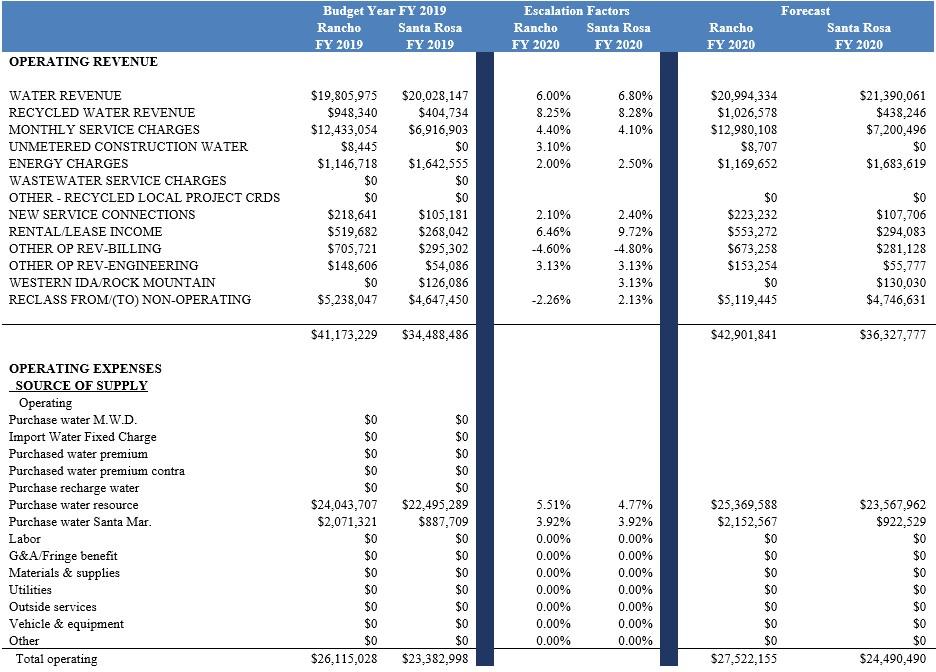
67
2017 WATER, RECYCLED WATER, AND WASTEWATER RATE STUDY REPORT
 2017 WATER, RECYCLED WATER, AND WASTEWATER RATE STUDY REPORT Rancho California Water District [Type here] Table of Contents 1 Introduction... 5 1.1 About Rancho California Water District... 5 1.2 Background
Temescal Valley Water District
 Temescal Valley Water District Comprehensive Water, Recycled Water, and Wastewater Cost of Service Study Draft Report / December 7, 2016 24640 Jefferson Avenue Suite 207 Murrieta, CA 92562 Phone 951.698.0145
LONG BEACH WATER DEPARTMENT COST OF SERVICE AND RATE STUDY
 LONG BEACH WATER DEPARTMENT COST OF SERVICE AND RATE STUDY Final Report / February 1, 2017 445 S. Figueroa Street Suite 2270 Los Angeles, CA 90071 Phone Fax 213. 262. 9300 213. 262. 9303 www.raftelis.com
The City of Sierra Madre
 The City of Sierra Madre Comprehensive Water and Wastewater Cost of Service Study Report / December 24, 2018 24640 Jefferson Avenue Suite 207 Murrieta, CA 92562 Phone 951.698.0145 www.raftelis.com December
Santa Clarita Water Division
 Santa Clarita Water Division Retail Water Rate Cost of Service Study Report September 2017 445 S Figueroa St Suite 2270 Los Angeles, CA 90039 Phone 213.262.9300 www.raftelis.com September 11, 2017 Mr.
YORBA LINDA WATER DISTRICT
 YORBA LINDA WATER DISTRICT 2015 Water and Sewer Rate Study Report FINAL August 25, 2015 City of Thousand Oaks Water and Wastewater Financial Plan Study Report 445 S. Figueroa Street Suite #227 Los Angeles,
WATER AND SEWER UTILITIES RATE STUDY
 WATER AND SEWER UTILITIES RATE STUDY RATE DESIGN WORKSHOP WITHCITYCOUNCIL / UTILITIES COMMISSION March 6, 2014 Agenda Overview of Rate Study Process Water / Sewer Developer Impact Fees Sewer Rates Water
Rainbow Municipal Water District
 Rainbow Municipal Water District Potable Water Cost of Service Study November 10, 2015 201 S Lake Ave. Suite 301 Pasadena CA 91101 Phone 626.583.1894 Fax 626.583.1411 www.raftelis.com November 10, 2015
Final COST OF SERVICE STUDY SEPTEMBER City of San Clemente
 Final COST OF SERVICE STUDY SEPTEMBER 2017 City of San Clemente Contents CONTENTS Executive Summary... 1 Study Goals and Drivers... 1 Water Rate Analysis & Adoption... 2 Recycled Water Rate Analysis &
WATER AND WASTEWATER RATE STUDY
 WATER AND WASTEWATER RATE STUDY Draft July 3, 2013 Prepared by: Page 1 Page 2 201 S. Lake Avenue Suite 301 Pasadena, CA 91101 Phone 626. 583. 1894 Fax 626. 583. 1411 www.raftelis.com July 1, 2013 Mr. Don
2016 Water and Recycled Water Rate Study PUBLIC HEARING DECEMBER 12, 2016
 2016 Water and Recycled Water Rate Study PUBLIC HEARING DECEMBER 12, 2016 Agenda Rate Study Overview Financial Plan Water Rate Design Recycled Water Rate Design Drought Rates Capacity Fees 12/12/2016 Public
Town of Hillsborough. City Council Public Hearing. Water Rate Cost-of-Service Study. February 13, 2017
 City Council Public Hearing February 13, 2017 Public Hearing on Proposed Water Rates PRESENTED BY Kelly J. Salt Partner 2016 Best Best & Krieger LLP Article X, section 2 (1928) The general welfare requires
Water and Sewer Rates
 Santa Margarita Water District - Water and Sewer Rates Home Live Chat Sitemap Phone: (949) 459-6420 Your Water Conservation Operations Doing Business News About Us Community Contact Us Your Water Water
WATER AND SEWER RATE STUDY
 FINAL WATER AND SEWER RATE STUDY B&V PROJECT NO. 179322.0100 PREPARED FOR City of Lynwood, CA JANUARY 11, 2017 Black & Veatch Holding Company 2011. All rights reserved. City of Lynwood, CA WATER AND SEWER
WATER USER RATES & FEE STUDY
 WATER USER RATES & FEE STUDY FINAL REPORT February 2016 BARTLE WELLS ASSOCIATES Independent Public Finance Consultants 1889 Alcatraz Avenue Berkeley, California 94703 www.bartlewells.com Tel: 510/653-3399
SANTA FE IRRIGATION DISTRICT
 SANTA FE IRRIGATION DISTRICT Water Rate Study FINAL Report/March 2016 445 S Figueroa Street Suite 2270 Los Angeles, CA 90071 Phone 213 262 9300 Fax 213 262 9303 www.raftelis.com March 21, 2016 Ms. Jeanne
Goleta Water District
 201 S Lake Ave. Suite 301 Pasadena CA 91101 Phone 626 583 1894 www.raftelis.com Water Rates and Cost of Service Study Final Report / June 11, 2015 Water Cost of Service & Rate Study Report 2015 201 S Lake
April 6, Katherine Godbey Director of Finance, Coachella Valley Water District Hovley Lane East Palm Desert, CA 92260
 April 6, 2016 Katherine Godbey Director of Finance, Coachella Valley Water District 75515 Hovley Lane East Palm Desert, CA 92260 Dear Ms. Godbey: Hawksley Consulting (a subsidiary of MWH Global) is pleased
CITY OF THOUSAND OAKS
 CITY OF THOUSAND OAKS 2018 Wastewater Financial Plan Update Final Report / June 23, 2017 445 S. Figueroa Street Suite #2270 Los Angeles, CA 90071 Phone 213.262.9300 Fax 213.262.9303 www.raftelis.com June
Water Shortage Contingency Plan During the California Drought and the Use of Allocation Based Tiered Rates
 Water Shortage Contingency Plan During the California Drought and the Use of Allocation Based Tiered Rates Paul D. Jones II, P.E Multi-State Salinity Coalition February 2018 1 emwd.org Presentation Outline
La Cañada Irrigation District
 La Cañada Irrigation District Water Rate Study Report - 2009 March, 2009 201 S. Lake Blvd, Suite 803 Pasadena CA 91101 Phone Fax 626 583 1894 626 583 1411 www.raftelis.com March 30, 2009 Mr. Douglas M.
FORT COLLINS- LOVELAND WATER DISTRICT
 FORT COLLINS- LOVELAND WATER DISTRICT Water Financial Planning and Rate Study Report March 16, 2018 District of Thousand Oaks Water and Wastewater Financial Plan Study Report March 16, 2018 Board of Directors
MARINA COAST WATER DISTRICT FINANCIAL PLAN AND RATE AND FEE STUDY FINAL REPORT. September 2013
 MARINA COAST WATER DISTRICT FINANCIAL PLAN AND RATE AND FEE STUDY FINAL REPORT September 2013 10540 TALBERT AVENUE, SUITE 200 EAST FOUNTAIN VALLEY, CALIFORNIA 92708 P. 714.593.5100 F. 714.593.5101 MARINA
Notice of Public Hearing for Proposed Change to a Water Budget Rate Structure to be Held at Murrieta City Hall
 May 20, 2011 Notice of Public Hearing for Proposed Change to a Water Budget Rate Structure to be Held at Murrieta City Hall Dear Western Municipal Water District customer, Every Western Municipal Water
July 1, Tier Percent of Allocation Cost per ccf $0.91 $1.27 $2.86 $4.80 $ % % % % 201+%
 1 CHART EXAMPLES OF WATER RATES AND CHARGES OF MWD MEMBER AGENCIES AND THEIR SUBAGENCIES MWD Member Agencies shown: MWDOC, SDCWA, Calleguas, Las Virgenes, West Basin, LADWP, Eastern and Foothill Member
Valencia Water Company. Cost of Service Study
 Valencia Water Company Cost of Service Study 2018 2020 Prepared By: Kenneth J. Petersen, P.E. Beverly Johnson, CPA John Garon, Consultant September 2017 1 P age Contents EXECUTIVE SUMMARY... 1 INTRODUCTION...
Water Rate Study FINAL January 31, 2018
 Water Rate Study FINAL January 31, 2018 1889 Alcatraz Avenue Berkeley, CA 94703 Tel: 510 653 3399 www.bartlewells.com January 31, 2018 Joshua Basin Water District P.O. Box 675 / 61750 Chollita Road Joshua
CASH RESERVE POLICY ADOPTED BY THE BOARD OF DIRECTORS ON DECEMBER 8, 2016
 RANCHO CALIFORNIA WATER DISTRICT 42135 WINCHESTER ROAD/BOX 9017 TEMECULA, CA 92589-9017 CASH RESERVE POLICY ADOPTED BY THE BOARD OF DIRECTORS ON DECEMBER 8, 2016 TABLE OF CONTENTS I. BACKGROUND AND INTRODUCTION...
YORK COUNTY, SOUTH CAROLINA
 YORK COUNTY, SOUTH CAROLINA Water and Sewer Financial Planning and Rate Study Report October 25, 2017 1031 S. Caldwell Street Suite 100 Charlotte, NC 28203 Phone 704.373.1199 Fax 704.373.1113 www.raftelis.com
Comprehensive Water Rate Study
 Final Report Dublin San Ramon Services District Comprehensive Water Rate Study January 213 Prepared by: HDR Engineering, Inc. January 1, 213 Ms. Lori Rose Financial Services Manager Dublin San Ramon Services
Maurice Kaufman, Director of Public Works / City Engineer Bartle Wells Associates DATE: September 7, 2016 MEMORANDUM
 TO: FROM: Maurice Kaufman, Director of Public Works / City Engineer Bartle Wells Associates DATE: September 7, 2016 SUBJECT: - MEMORANDUM Introduction The (City) provides sewer sanitary collection services
Water Rates Rate Restructure and Rate Adjustments
 Water Rates Rate Restructure and Rate Adjustments Community Outreach Meeting Questions We Will Address Why are water rates changing? Where does the water come from? Did the rain from last winter help?
Drought Allocation Plan for the Western Municipal Water District of Riverside County. Updated May 2015
 Drought Allocation Plan for the Western Municipal Water District of Riverside County Updated May 2015 Table of Contents Section 1 Introduction... 1 Section 2 Drought Allocation Plan Preparation... 2 Section
Water Rates Adjustments Phase 2
 Water Rates Adjustments Phase 2 Presented by Shana E. Epstein Director of Public Works, City of Beverly Hills Background Phase 1-Effective January 18, 2018 5-year revenue requirement 3% annual increase
BODEGA BAY PUBLIC UTILITY DISTRICT Water and Wastewater Rate Study
 BODEGA BAY PUBLIC UTILITY DISTRICT Water and Wastewater Rate Study FINAL REPORT March 22, 2018 BARTLE WELLS ASSOCIATES Independent Public Finance Advisors 1889 Alcatraz Avenue Berkeley, CA 94703-2714 Tel.
DRAFT COMPREHENSIVE COST OF SERVICE AND RATE DESIGN ANALYSIS. San Antonio Water System. San Antonio Water System 21 MAY 2015 PREPARED FOR
 Black & Veatch Holding Company 2011. All rights reserved. DRAFT COMPREHENSIVE COST OF SERVICE AND RATE DESIGN ANALYSIS San Antonio Water System PREPARED FOR San Antonio Water System 21 MAY 2015 B&V PROJECT
Water and Sewer Utility Rate Studies
 Final Report Water and Sewer Utility Rate Studies July 2012 Prepared by: HDR Engineering, Inc. July 27, 2012 Mr. Mark Brannigan Director of Utilities 591 Martin Street Lakeport, CA 95453 Subject: Comprehensive
2016 Water and Recycled Water Rate Study WEBINAR WITH DISTRICT STAFF JUNE 29, 2016
 2016 Water and Recycled Water Rate Study WEBINAR WITH DISTRICT STAFF JUNE 29, 2016 Agenda Financial Policy & Financial Plan Capacity Fees Preliminary Results Tier Definitions Next Steps 2016 Water & RW
COMPREHENSIVE COST OF SERVICE AND RATE DESIGN ANALYSIS
 Black & Veatch Holding Company 2011. All rights reserved. COMPREHENSIVE COST OF SERVICE AND RATE DESIGN ANALYSIS San Antonio Water System PREPARED FOR San Antonio Water System 26 MAY 2015 B&V PROJECT NO.
Table 2-2 Projected Water Production and Costs
 Table 2-2 Projected Water Production and Costs Recorded Estimated Budget Forecast Description FY 2007-08 FY 2008-09 FY 2009-10 FY 2010-11 FY 2011-12 FY 2012-13 FY 2013-14 Well Production (OCWD, A-F, a)
City of La Palma Agenda Item No. 5
 City of La Palma Agenda Item No. 5 MEETING DATE: January 19, 2016 TO: FROM: SUBMITTED BY: CITY COUNCIL CITY MANAGER Mike Belknap, Community Services Director AGENDA TITLE: Adopt a Resolution Approving
Water & Sewer Rate Study. Water & Sewer Cost of Service Rate Study. City of Norco, CA. Draft Report for
 Water & Sewer Cost of Service Rate Study for City of Norco, CA October 11, 2016 Table of Contents October 11, 2016 Chad Blais Director of Public Works City of Norco 2870 Clark Avenue Norco, CA 92860 Re:
NALDRAFT SEPTEMBER2015 WASTEWATE
 FI NALDRAFT SEPTEMBER2015 Cos tof S e r v i c e s S T UDY WATE R WASTEWATE R RE CY CL E DWATE R ST ORMWATE R E NVI RONME NT ALRE SOURCE S CITY OF OXNARD PUBLIC WORKS INTEGRATED MASTER PLAN COST OF SERVICE
City of Riverbank. Water Rate Study FINAL 6/18/2015
 Water Rate Study FINAL 6/18/2015 Bartle Wells Associates Independent Public Finance Consultants 1889 Alcatraz Avenue Berkeley, California 94703 www.bartlewells.com Tel: 510-653-3399 June 18, 2015 6707
Sanitation Rate Study Final Report
 Sanitation Rate Study Final Report City of Simi Valley April 24, 2015 Prepared by: Page 1 201 S. Lake Avenue Suite 301 Pasadena, CA 91101 Phone 626.583.1894 Fax 626.583.1411 www.raftelis.com April 24,
Alameda County Water District. Financial Workshop Proposed Rates & Charges
 Alameda County Water District Financial Workshop Proposed Rates & Charges Month, October Day, Year 25, 2018 Presentation Overview Review Financial Workshops Timeline Proposed Development Charges Financial
Phase 1: Water Budget Based Rate Structure Feasibility Analysis
 Attachment #1 SCOPE OF WORK NOTE: All references to meeting(s) will mean face-to-face meetings and not conference calls. Phase 1: Water Budget Based Rate Structure Feasibility Analysis Task 1: Kick-off
VENTURA COUNTY WATERWORKS DISTRICTS Representing: Ventura County Waterworks Districts No. 1, 16, 17 & 19
 VENTURA COUNTY WATERWORKS DISTRICTS Representing: Ventura County Waterworks Districts No. 1, 16, 17 & 19 Board of Ventura County Waterworks District No. 1 800 S. Victoria Avenue Ventura, CA 93009 Subject:
Study Workshops are designed to be both educational and to seek broad direction from the Board
 Study Workshops are designed to be both educational and to seek broad direction from the Board Workshop #1 Financial Forecast & Cost of Service Water, recycled water, & sewer services Revenue requirement
TOWN OF HILLSBOROUGH. Water Rate Cost-of-Service Study
 TOWN OF HILLSBOROUGH December 12, 2016 TOWN OF HILLSBOROUGH 1600 Floribunda Avenue Hillsborough, CA 94010 WATER RATE COST-OF-SERVICE STUDY December 12, 2016 HF&H CONSULTANTS, LLC 201 North Civic Drive,
WATER VALIDATION, COST OF SERVICE & RATE DESIGN ANALYSIS WASTEWATER VALIDATION & RATE ANALYSIS MISCELLANEOUS FEES & OVERHEAD RATE ANALYSIS
 WATER VALIDATION, COST OF SERVICE & RATE DESIGN ANALYSIS WASTEWATER VALIDATION & RATE ANALYSIS MISCELLANEOUS FEES & OVERHEAD RATE ANALYSIS B&V PROJECT NO. 179801.0100 PREPARED FOR Vallecitos Water District,
Notice of a public hearing
 Notice of a public hearing Dear Benicia Resident and/or Business Owner, You are receiving a revised Notice of a Public Hearing to increase the water and sewer rates and add water meter replacement fees.
TAUSSIG DEVELOPMENT IMPACT FEE JUSTIFICATION STUDY CITY OF ESCALON. Public Finance Public Private Partnerships Urban Economics Clean Energy Bonds
 DAVID TAUSSIG & ASSOCIATES, INC. DEVELOPMENT IMPACT FEE JUSTIFICATION STUDY CITY OF ESCALON B. C. SEPTEMBER 12, 2016 Public Finance Public Private Partnerships Urban Economics Clean Energy Bonds Prepared
Water Rate Study Final Report
 Phelan Pinon Hills Community Services District March 6, 2013 Water Rate Study Final Report Corporate Office: Anaheim, California Temecula Office: 27368 Via Industria, Suite 110 Temecula, California 92590
IN THE COURT OF APPEAL OF THE STATE OF CALIFORNIA SECOND APPELLATE DISTRICT DIVISION SEVEN
 Filed 8/9/11; pub. order & mod. 8/25/11 (see end of opn.) IN THE COURT OF APPEAL OF THE STATE OF CALIFORNIA SECOND APPELLATE DISTRICT DIVISION SEVEN CITY OF PALMDALE, Plaintiff and Appellant, v. B224869
TEN YEAR FINANCIAL FORECAST
 TEN YEAR FINANCIAL FORECAST The ability to ensure a reliable supply of high quality water for Metropolitan s 26 member agencies depends on Metropolitan s ongoing ability to fund operations and maintenance,
Managing Revenue in Water Systems
 Managing Revenue in Water Systems Monday, June 1, 2015 2:40 3:55 1.5 CPE Moderator: Speakers: Rodney Greek, San Diego County Water Authority Debby Cherney, Eastern Municipal Water District Jeffrey Hughes,
 2018 Water Connection Fee Update August 17, 2018 Page 4 environmental effect. Further, the incremental fee increase will not to fund capital projects for the expansion of the existing infrastructure system.
Santa Ynez River Water Conservation District, ID No. 1. Water Rates & Finances. December 13, 2016
 Santa Ynez River Water Conservation District, ID No. 1 Water Rates & Finances December 13, 2016 Presentation Overview Objectives & Process District Finances Current & Projected Rates 2 Rate Study Objectives
WHEREAS, the rates of the Proposed Ordinance take into account the cost of service study recently completed by LADWP; and
 RESOLUTION NO. WHEREAS, the City of Los Angeles (City) is at a crossroads with regard to its water future in light of what may be the new normal of prolonged drought and due to its rapidly aging water
City of Cocoa FY 2010 Utility Rate Study. Final Report. Water, Sewer & Reclaimed Water Rates, Fees & Charges Study. Prepared by:
 p FY 2010 Utility Rate Study Water, Sewer & Reclaimed Water Rates, Fees & Charges Study June 29, 2010 Prepared by: June 29, 2010 W.E. Mack Finance Director 65 Stone Street Cocoa, FL 32922 Re: FY 2010
COST OF SERVICE AND RATE STRUCTURE STUDY
 . COST OF SERVICE AND RATE STRUCTURE STUDY 2017 Draft in Progress Not for Public release TABLE OF CONTENTS Executive Summary and Recommendations 1 Objectives 3 Vallecitos Water District Water Rate Structure
WATER, WASTEWATER, STORMWATER, AND MUNICIPAL SOLID WASTE COST OF SERVICE AND RATE DESIGN STUDY
 REPORT January 2017 WATER, WASTEWATER, STORMWATER, AND MUNICIPAL SOLID WASTE COST OF SERVICE AND RATE DESIGN STUDY PREPARED BY: ECONOMICS STRATEGY STAKEHOLDERS SUSTAINABILITY www.newgenstrategies.net 3420
Note: Letter has been updated to reflect changes to proposed rates as ordered by the Board of Directors.
 February 21, 2019 Board of Directors County Sanitation District No. 20 of Los Angeles County Note: Letter has been updated to reflect changes to proposed rates as ordered by the Board of Directors. Dear
San Francisco Public Utilities Commission
 San Francisco Public Utilities Commission Water & Wastewater Rate Study Report March 6, 2009 Prepared by: Table of Contents I. EXECUTIVE SUMMARY...1 A. Pricing Objectives...2 B. Review of Findings Water...2
LAFCo 509 W. WEBER AVENUE SUITE 420 STOCKTON, CA 95203
 SAN JOAQUIN LOCAL AGENCY FORMATION COMMISSION AGENDA ITEM NO. 2 LAFCo 509 W. WEBER AVENUE SUITE 420 STOCKTON, CA 95203 REVISED EXECUTIVE OFFICER S REPORT March 10, 2016 TO: FROM: SUBJECT: LAFCo Commissioners
2017 WATER AND WASTEWATER IMPACT FEE STUDY CITY OF AZLE, TEXAS
 2017 WATER AND WASTEWATER IMPACT FEE STUDY CITY OF AZLE, TEXAS JULY 2017 Prepared by: Weatherford Office Address: 1508 Santa Fe Drive, Suite 203 Weatherford, Texas 76086 (817) 594-9880 www.jacobmartin.com
INLAND EMPIRE UTILITIES AGENCY RESERVE POLICY Updated as of May 2014 Policy Statement. Purpose of Fund Reserve Policy
 INLAND EMPIRE UTILITIES AGENCY RESERVE POLICY Updated as of May 2014 Policy Statement The Inland Empire Utilities Agency (Agency or IEUA) has historically maintained fund reserves to ensure sufficient
WATER UTILITY FINANCIAL PLAN AND RATE STUDY CITY OF WHITEFISH, MT MARCH 2016
 WATER UTILITY FINANCIAL PLAN AND RATE STUDY CITY OF WHITEFISH, MT MARCH 2016 The Financial Link Executive Summary - Water In May 2015, the City of Whitefish (City) retained AE2S to complete a Water and
ES.1 Findings and Recommendations... ES Overview Current Rates Rate Making Objectives
 Table of Contents Executive Summary ES.1 Findings and Recommendations... ES-1 Chapter 1. Introduction 1.1 Overview... 1-1 1.2 Current Rates... 1-1 1.3 Rate Making Objectives... 1-1 Chapter 2. Revenue Requirement
Water Consultancy. Montecito Sanitary District Wastewater Rate Study Report. Montecito Sanitary District
 3585 Maple Street, Suite 250 Ventura, CA 93003 805-404-1467 Montecito Sanitary District Wastewater Rate Study Report March 2016 Montecito Sanitary District 1042 Monte Cristo Lane Santa Barbara CA 93108
STAFF REPORT. ITEM NO. 4 MEETING DATE: March 7, 2017 MEETING: Board of Directors SUBJECT:
 ITEM NO. 4 MEETING DATE: MEETING: Board of Directors STAFF REPORT SUBJECT: SUBMITTED BY: RECOMMENDED ACTION: Proposition 218 Customer Notification of Proposed Rate Increases Krishna Kumar, General Manager
Focused Water Rate Study
 FINAL Report for: Focused Water Rate Study (Includes Connection Fees & Sewer Rates) June 2017 OFFICE LOCATIONS: Temecula Corporate Headquarters 32605 Temecula Parkway, Suite 100 Temecula, CA 92592 San
Final Report COMPREHENSIVE WATER AND WASTEWATER COST OF SERVICE AND RATE STUDY
 Final Report COMPREHENSIVE WATER AND WASTEWATER COST OF SERVICE AND RATE STUDY Phase 2 Cost of Service and Rate Design BLACK & VEATCH PROJECT NO. 192366 Black & Veatch Holding Company 2017. All rights
1. Accept staff report on the updated study of cost of service to provide potable water to San Jose Municipal Water System (SJMWS) customers; and
 customers; and") CITY OF Cr SAN IPSE CAPITAL OF SILICON VALLEY TO: HONORABLE MAYOR AND CITY COUNCIL SUBJECT: MUNICIPAL WATER SYSTEM COST OF SERVICE STUDY COUNCIL AGENDA: 05/09/17 ITEM: 7.2 Memorandum FROM: Kerrie Romanow
CITY OF Cr SAN IPSE CAPITAL OF SILICON VALLEY TO: HONORABLE MAYOR AND CITY COUNCIL SUBJECT: MUNICIPAL WATER SYSTEM COST OF SERVICE STUDY COUNCIL AGENDA: 05/09/17 ITEM: 7.2 Memorandum FROM: Kerrie Romanow
LAS VIRGENES MUNICIPAL WATER DISTRICT 4232 Las Virgenes Road, Calabasas, California 91302
 LAS VIRGENES MUNICIPAL WATER DISTRICT 4232 Las Virgenes Road, Calabasas, California 91302 REQUEST FOR PROPOSALS For FINANCIAL ANALYSIS & RATE STUDY Proposal Issue Date April 9, 2014 Proposal Submittal
SAN ANTONIO WATER SYSTEM (SAWS) RATE ADVISORY COMMITTEE: MEETING 3
 RATE ADVISORY COMMITTEE: MEETING 3") 01 April, 2014 SAN ANTONIO WATER SYSTEM (SAWS) RATE ADVISORY COMMITTEE: MEETING 3 Bill Zieburtz Richard Campbell Robert Chambers RATE SETTING PROCESS STUDY APPROACH RATE SETTING OBJECTIVES FINANCIAL PLAN
01 April, 2014 SAN ANTONIO WATER SYSTEM (SAWS) RATE ADVISORY COMMITTEE: MEETING 3 Bill Zieburtz Richard Campbell Robert Chambers RATE SETTING PROCESS STUDY APPROACH RATE SETTING OBJECTIVES FINANCIAL PLAN
M54. Developing Rates for Small Systems. Second Edition. Copyright 2016 American Water Works Association. All Rights Reserved.
 M54 Developing Rates for Small Systems Second Edition Contents List of Figures, v List of Tables, vii Preface, ix Acknowledgments, xiii Chapter 1 Basics of Water Ratemaking... 1 Basic Premise, 1 Water
CITY OF CALISTOGA WATER RATE STUDY FINAL REPORT
 CITY OF CALISTOGA WATER RATE STUDY FINAL REPORT February 2, 218 This page was intentionally left blank. City of Calistoga Water Rate Study Report Page 2 February 2, 218 Dylan Feik City Manager City of
2017 UTILITY RATE STUDY WORK SESSION #2: BACKGROUND, EDUCATIONAL/INFORMATIONAL
 2017 UTILITY RATE STUDY WORK SESSION #2: BACKGROUND, EDUCATIONAL/INFORMATIONAL Receive a presentation from Lewis Young Robertson & Burningham regarding the 2017 Utility Rate Study The purpose of the Council
Agenda Rio Linda / Elverta Community Water District Planning Committee
 Agenda Rio Linda / Elverta Community Water District Planning Committee Sacramento Metro Fire Dept. Friday, February 5, 2015 6609 Rio Linda Blvd. 2:00 pm Rio Linda, CA 95673 Public documents relating to
Title 6 WATER AND SEWER FEES AND CHARGES
 Title 6 WATER AND SEWER FEES AND CHARGES Chapter 6.04 - GENERAL PROVISIONS Chapter 6.08 - WATER SERVICE CHARGES Chapter 6.12 - SEWER SERVICE CHARGES Chapter 6.16 - OTHER FEES AND CHARGES Chapter 6.04 GENERAL
SUMMERLAND SANITARY DISTRICT
 SUMMERLAND SANITARY DISTRICT Financial Plan and Rate Study December 6, 2017 445 S. Figueroa Street Suite #2270 Los Angeles, CA 90071 Phone 213.262.9300 Fax 213.262.9303 www.raftelis.com December 6, 2017
CITY OF REDLANDS WATER AND WASTEWATER RATE STUDY. Prepared by:
 CITY OF REDLANDS WATER AND WASTEWATER RATE STUDY Prepared by: August 30, 2010 201 S. Lake Blvd, Suite 301 Pasadena CA 91101 Phone Fax 626 583 1894 626 583 1411 www.raftelis.com August 30, 2010 Mr. Chris
CITY OF ANN ARBOR WATER & SEWER COST OF SERVICE STUDY
 1 CITY OF ANN ARBOR WATER & SEWER COST OF SERVICE STUDY 12.20.2017 Overview 1. Sufficiency 2. Rate Classification 3. to Serve 4. Rate Structures 5. Customer Impacts 6. Affordability Program Foundation
TOWN OF ORO VALLEY WATER UTILITY COMMISSION WATER RATES ANALYSIS REPORT OCTOBER 7, 2009
 TOWN OF ORO VALLEY WATER UTILITY COMMISSION WATER RATES ANALYSIS REPORT OCTOBER 7, 2009 EXECUTIVE SUMMARY The functions and duties of the Oro Valley Water Utility Commission include reviewing and developing
Sewer Rate Study CRESCENT CITY CALIFORNIA
 CRESCENT CITY CALIFORNIA Sewer Rate Study 27368 Via Industria, Suite 110, Temecula, California 925904856 T 951.587.3500 800.755.6864 F 888.326.6864 www.willdan.com Mr. Eugene Palazzo City Manager City
The series 2008 Water & Sewer Revenue Bonds Feasibility Report recommended the City perform and implement a rate study for the following reasons:
 Additional Background Information Water and Wastewater The City of Fort Lauderdale supplies water and sewer services on a regional basis to over 250,000 residents of central Broward County. The areas serviced
WASTEWATER FINANCIAL PLAN STUDY REPORT
 WASTEWATER FINANCIAL PLAN STUDY REPORT FINAL October 7, 2013 Prepared by: Page 1 201 S. Lake Avenue Suite 301 Pasadena, CA 91101 Phone 626.583. 1894 Fax 626.583. 1411 www.raftelis.com October 7, 2013 Mr.
3.1. Construction Meter Additional Charges for Temporary Meters OTHER FEES, CHARGES, AND DEPOSITS CAPACITY FEES...
 Table of Contents 1. CHARGES FOR WATER SERVICE... 3 1.1. Metered Service:... 3 1.2. Water Commodity Charge:... 3 1.3. SDCWA and Metropolitan Water District (MWD) Charges:... 4 1.4. Separate Private Fire
Unfunded Pension Liability Accelerated Funding Options
 Unfunded Pension Liability Accelerated Funding Options 131253 May 29, 2018 DISTRICT S CURRENT PENSION FUNDING STATUS $2,000,000 $1,800,000 $1,600,000 $1,400,000 $1,200,000 Annual UAL Payments Status Quo
SPRINGVILLE CITY CULINARY WATER IMPACT FEE ANALYSIS (IFA) MAY 2014
 MAY 2014") SPRINGVILLE CITY CULINARY WATER IMPACT FEE ANALYSIS (IFA) MAY 2014 Adopted May 20, 2014 TABLE OF CONTENTS IMPACT FEE CERTIFICATION... 3 SECTION 1: EXECUTIVE SUMMARY... 4 PROPOSED CULINARY WATER IMPACT
SPRINGVILLE CITY CULINARY WATER IMPACT FEE ANALYSIS (IFA) MAY 2014 Adopted May 20, 2014 TABLE OF CONTENTS IMPACT FEE CERTIFICATION... 3 SECTION 1: EXECUTIVE SUMMARY... 4 PROPOSED CULINARY WATER IMPACT
CITY OF PALM DESERT COMPREHENSIVE GENERAL PLAN
 Comprehensive General Plan/Administration and Implementation CITY OF PALM DESERT COMPREHENSIVE GENERAL PLAN CHAPTER II ADMINISTRATION AND IMPLEMENTATION This Chapter of the General Plan addresses the administration
Sewer Rate Study July 2016
 July 2016 Prepared By The Finance Division TABLE OF CONTENTS SECTION 1: EXECUTIVE SUMMARY... 1 1.1 Background... 1 1.2 Purpose... 1 1.3 Current Sewer Rates... 1 1.4 Five Year Financial Projection... 1
City of Redding, California Development Impact Mitigation Fee Nexus Study
 , California Development Impact Mitigation Fee Nexus Study December 5, 2017 Prepared by helping communities fund to morrow This page intentionally left blank. TABLE OF CONTENTS Executive Summary...1 Background
GREAT OAKS WATER COMPANY
 GREAT OAKS WATER COMPANY California Public Utilities Commission Division of Water and Audits Room 3102 505 Van Ness Avenue San Francisco, CA 94102-3298 May 31, 2018 P.O. Box 23490 San Jose, CA 95153 (408)
Attachment 2. Exhibit A
 Attachment 2 Exhibit A ..L..L..L..L..L..L..L..L..L..L..L..L..L..L..L MODELING EXPERTISE RFC has developed some of the most sophisticated yet userfriendly financialjrate models available in the industry.
EASTERN MUNICIPAL WATER DISTRICT BIENNIAL BUDGET FISCAL YEARS AND
 EASTERN MUNICIPAL WATER DISTRICT BIENNIAL BUDGET FISCAL YEARS 2017-18 AND 2018-19 ADOPTED JUNE 7, 2017 STRATEGIC PLAN... 10 MISSION, VISION, AND GUIDING PRINCIPLES... 10 Mission... 10 Vision... 10 Guiding
Rate Structure Administrative Procedures Handbook FY 2017/18
 FY 2017/18 Page i Table of Contents 1 OVERVIEW... 1 2 RATE STRUCTURE AT-A-GLANCE... 2 2.1 CURRENT RATES... 2 2.2 TWO-YEAR RATE CYCLE & BILLING CYCLE MILESTONES... 3 2.3 WATER SERVICES AND PROGRAMS AND
Rate Structure Administrative Procedures Handbook FY 2018/19
 FY 2018/19 Page i Table of Contents 1 OVERVIEW... 1 2 RATE STRUCTURE AT-A-GLANCE... 2 2.1 CURRENT RATES... 2 2.2 TWO-YEAR RATE CYCLE & BILLING CYCLE MILESTONES... 3 2.3 WATER SERVICES AND PROGRAMS AND