Water Rate Study FINAL January 31, 2018
|
|
|
- Kristopher Lang
- 5 years ago
- Views:
Transcription


1 Water Rate Study FINAL January 31, 2018

2 1889 Alcatraz Avenue Berkeley, CA Tel: January 31, 2018 Joshua Basin Water District P.O. Box 675 / Chollita Road Joshua Tree, CA Bartle Wells Associates is pleased to submit the attached Water Rate Study. The study develops water rates for the next five years based on a cost of service approach. The proposed rates were developed with substantial input from JBWD and the District s Citizens Advisory Committee, and are designed to a) fund JBWD s costs of providing service over the next 5 years, b) fairly apportion costs to JBWD customers, c) and gradually increase conservation incentive while partially reducing the rate impacts on low water users. As noted in the report, JBWD is facing a number of financial challenges in upcoming years. The proposed rate adjustments are needed to ensure adequate funding for ongoing operations, provide increased levels of funding for replacement of aging facilities, and enable JBWD to increase water purchases from the Mojave Water Agency to help replenish the groundwater basin and support a long term sustainable water supply. The proposed rates are gradually phased in over five years to help meet JBWD s financial needs while minimizing the annual impact on ratepayers. While the proposed rate increases do not address all of the District s future financial needs, they will enable JBWD to take substantial steps toward addressing its long term financial challenges. I enjoyed working with JBWD on this assignment and appreciate the ongoing input and assistance received from JBWD staff, Board Members, and the Citizens Advisory Committee. Please contact me anytime if you have questions about this report or other issues related to rates and finances. BARTLE WELLS ASSOCIATES Alex Handlers, CIPMA Principal/Vice President
3 BARTLE WELLS ASSOCIATES TABLE OF CONTENTS 1 Background & Objectives Background Rate Study Objectives Rate Study Process Water Rates & Finances Current Water Rates Historical Water Bills Water Rate Survey Financial Overview Financial Challenges / Key Drivers of Rate Increases Repair and Replace Aging Facilities and Undersized Water Pipelines Fund Imported Water Purchases to Reduce Further Groundwater Depletion Eliminate Budget Deficits & Keep Up with Cost Inflation: Chromium 6 Water Treatment: Water Sales & Impacts on Revenues Legal requirements & Rate Methodology Constitutional Rate Requirements Article 10, Section Article 13D, Section Rate Setting Methodology Financial Projections Financial Projections Overview Key Assumptions Fund Reserves & Reserve Target Financial Projections Proposed Rate Increases Comparison of Financial Scenarios Rate Derivation Rate Structure Modifications Fixed Meter Charge Modifications Variable Water Rate Structure Modifications Fixed & Variable Cost Recovery Fixed Rate Derivation Projected Water Use Variable Water Flow Rate Derivation Private Fire Protection Charges Proposed Rates & Impacts Proposed Water Rates Water Rate Impacts Appendix Financial & Rate Scenarios
4 1 BACKGROUND & OBJECTIVES 1.1 Background Joshua Basin Water District (JBWD or District) provides water service to more than 5,400 homes, businesses, and properties within a 96 square mile service area in the community of Joshua Tree, California. The District is located about 125 miles east of Los Angeles in San Bernardino County. JBWD was formed in 1963 and is governed by a five member Board of Directors elected from the community. JBWD is financially self supporting and relies primarily on revenues from water service charges to fund the costs of operating and maintaining the water system. JBWD s water rates are currently in the lower middle range compared to other regional agencies. However, the District is currently facing a number of substantial financial challenges that will require significant rate increases in upcoming years. JBWD owns and operates roughly 310 miles of water system pipelines, 5 wells, 17 water storage tanks, 11 booster stations and a groundwater recharge facility. Roughly 175 miles of JBWD s water pipelines were installed 40 to 70 years ago and are approaching the end of their useful lives. Other facilities including booster pumps, wells and water tanks are aging and will need to be refurbished in upcoming years. An engineering analysis of the water system developed by Dudek, the District s consulting engineers, identifies the need for approximately $2.5 million of capital improvement funding each year for the next 30 years to gradually replace aging infrastructure, address current deficiencies, and improve system reliability. JBWD relies on groundwater for 100% of the community s water supply. Local water demand exceeds the level of natural recharge. This has resulted in a gradual decrease in groundwater levels. JBWD recently began purchasing imported water from the Mojave Water Agency to help recharge the groundwater basin and reduce further groundwater depletion. While the District is not in any imminent danger of over depleting its groundwater resources, additional funding for imported water purchases will be needed in upcoming years to support the sustainability of the District s long term water supply. The District also faces potential need to fund treatment facilities for Chromium 6, a naturally occurring chemical in the District s groundwater that is a suspected carcinogen. Concentration levels in the District s groundwater are substantially below existing state and federal standards. However, the State is in the process of establishing new, substantially more stringent regulatory standards that would require the District to install and operate new treatment facilities to ensure compliance. BARTLE WELLS ASSOCIATES 1
5 1.2 Rate Study Objectives In 2017, JBWD retained Bartle Wells Associates (BWA) to help the District evaluate financial scenarios and develop a long term financial plan and water rate study. BWA developed the District s prior rate study in Key goals and objectives of this rate study include developing water rates that: Recover the costs of providing water service, including operating, capital, and water supply funding needs; Are fair and equitable to all customers; Are easy to understand and implement; Provide conservation incentive and help minimize the impact of rate increases on customers with low water use; Reflect the cost of providing service and comply with the substantive requirements of the California Constitution, Article 13D, Section 6 (established by Proposition 218) and the general mandate of Article 10, Section 2; Support JBWD s long term operational and financial stability. Final recommendations were developed with substantial input from the District and the District s Citizens Advisory Committee (CAC), a group of community members that has been advising the Board of Directors and providing community input on a wide range of policy issues since This report summarizes findings and recommendations and develops water rate projections for the next five years. The proposed water rates include both a) overall rate increases needed to fund JBWD s costs of providing service as well as b) modifications to the rate structure designed to gradually increase conservation incentive and equitably apportion costs to all customers. BARTLE WELLS ASSOCIATES 2
6 1.3 Rate Study Process The rates recommendations presented in this report were developed via a process that incorporated substantial input via a series of public meetings held with the District s Citizen s Advisory Committee and Board of Directors. Public meetings held during development of the proposed rates include: Sep 12 Water rate study introduction at a Board Meeting; received initial input on study objectives, key issues, and challenges. Oct 18 Presented preliminary findings and received input for development of draft financial and rate projections at CAC and Board Meetings. Nov 1 Presented draft financial scenarios, preliminary rate projections and bill impacts, and received input at CAC and Board Meetings. Nov 14 & 15 Reviewed revised financial scenarios and rate projections, discussed conceptual rate structure alternatives, and received input at CAC and Board Meetings. Dec 6 Presented honed financial and rate scenarios, received CAC approval for proposed rates, and received additional input at CAC and Board Meetings. Dec 20 Presented final recommendations and received Board approval for mailing a Proposition 218 Notice and holding a Public Hearing to consider approval of proposed rates. In early January 2018, the District mailed the required Proposition 218 Notices informing customers of a Public Hearing on the proposed rates. The Public Hearing is scheduled for February 21, At the Public Hearing, the District s Board of Directors will consider adoption of the proposed rates. If the proposed rates are adopted, the initial rate increase would become effective on March 1, 2018 with future year increases becoming effective on January 1 of subsequent years. BARTLE WELLS ASSOCIATES 3
7 2 WATER RATES & FINANCES 2.1 Current Water Rates The following table shows JBWD s current water rates, which have been effective since January These rates were adopted in January 2014 as part of multi year rate increase that gradually raised rates by 7% per year. The rates are based on a prior Water Rate Study completed in Current Water rates BASIC MONTHLY FEE (FIXED CHARGE) Meter Size Capacity (gpm) Monthly Rate Per Day 3/4" & 1" 30 $25.78 $ /2" " " MONTHLY WATER USAGE CHARGES (PER HCF) For 3/4" & 1" Meters Consumption Rate per hcf Per 100 gallons 0 5 units $3.00 $ units units units For 1 1/2", 2" and 3" Meters Rate per hcf Unit rate per all water use $ unit = 1 hcf = one hundred cubic feet = 748 gallons JBWD s water service charges include two components: A fixed Basic Monthly Fee based on meter size purchased. This charge is levied independent of water use and recovers a portion of the District s fixed costs for providing service. JBWD incurs a substantial amount of costs ensuring that water is available at all times to meet customer needs on demand. The Basic Monthly Fee varies by meter size and capacity, with larger meters paying higher charges based on the increased capacity and latent demand placed on the water system associated with each meter size. The Basic Monthly Fee was designed to recover 40% of water rate revenues. However, due to a decrease in the volume of water sales in recent years, revenues from these fixed charges currently recover approximately 46% of total water rate revenues. Volumetric Monthly Water Flow Charges billed based on metered water use. This charge is levied on actual water use and recovers variable costs of providing water service as well as portion of BARTLE WELLS ASSOCIATES 4
8 fixed costs allocated to volumetric cost recovery. Water Flow Charges for customers with 3/4 inch and 1 inch meters are billed according to a 4 tiered inclining rate structure with water purchased first in Tier 1 and then subsequently in higher tiers as water use increases. Accounts with larger meters pay a uniform rate for each unit of metered water use. These volumetric charges currently recover approximately 54% of total water rate revenues. The District s Water Flow Charges are billed in units of 100 cubic feet (hcf), which equates to approximately 748 gallons. Hence the District s current usage based rates of $3.00 to $4.50 per hcf equates to $0.40 to $0.60 per 100 gallons, with the average rate of water around $0.50 per 100 gallons, or about a half cent per gallon. BARTLE WELLS ASSOCIATES 5
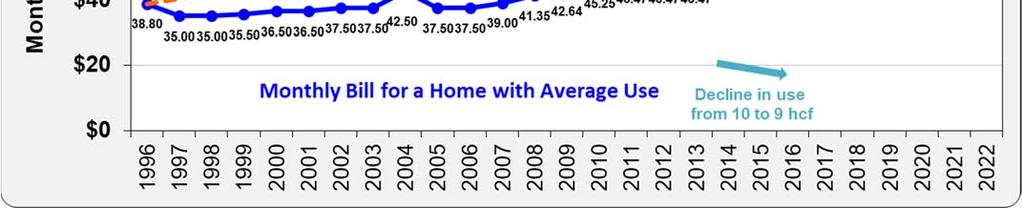
 in subsequent years. Roughly two thirds of residential bills are at or below this level.")
9 2.2 Historical Water Bills The chart below shows historical monthly bills for a customer with average monthly water use of 10 hundred cubic feet (hcf) through 2014, declining to 9 hcf (or about 220 gallons per day) in subsequent years. Roughly two thirds of residential bills are at or below this level. After a decade of minimal to no net rate increases from , the District began implementing small gradual rate increases most years to help restore financial stability and meet basic annual funding needs. Since 1996, the bill for a home with average use has risen by an average of 1.7% per year, below the rate of inflation. BARTLE WELLS ASSOCIATES 6


10 2.3 Water Rate Survey The following chart shows a survey of monthly regional water bills for a home with average monthly water use of 9 hcf. JBWD s rates are currently in the lower middle range compared to other local and regional agencies. JBWD s monthly bill for a single family home with average monthly use of 9 hcf is currently $ This equates to an all in cost of about $0.81 per each 100 gallons of water use, or 8/10 ths of a penny per gallon. The bill for a single family home with median monthly use of 6 hcf is currently $ Half of all single family bills are at or below this level. BARTLE WELLS ASSOCIATES 7


11 The chart below shows a survey of monthly regional water bills for a customer with median monthly use of 6 hcf. The median bill represents the midpoint at which approximately half of the District s residential bills are above or below. BARTLE WELLS ASSOCIATES 8
12 2.4 Financial Overview JBWD is a financially self supporting agency that relies primarily on monthly water service charges to fund the costs of operating and maintaining the water system. Future rates need to be set at levels adequate to fund JBWD s costs of providing service, which generally include costs for a) administration, operations and maintenance, b) water supply, c) capital improvements and associated debt service requirements, d) infrastructure repairs and replacements, and e) costs for maintaining an adequate level of fund reserves to provide financial cushion for revenue shortfalls, unanticipated expenditures, and emergencies. Water rate revenues currently account for a little more than 60% of JBWD s total annual revenues, with the remaining revenues coming from a combination of standby charges, property taxes, private fire service and other miscellaneous charges, interest earnings, and capacity fees from new connections. Hence the District s current and proposed water rates do not recover the full costs of service as rates are supplemented by other revenue sources. JBWD has accrued a healthy level of fund reserves in recent years in anticipation of funding various capital improvements, and anticipates drawing down a portion of these fund reserves in upcoming years as projects are completed, while still maintaining a prudent minimum level of reserves. 2.5 Financial Challenges / Key Drivers of Rate Increases JBWD is facing a number of financial challenges in upcoming years, primarily related to its aging infrastructure and water supply. Rate increases are needed to address these long term financial challenges and help support safe, reliable, and sustainable water service. Key drivers of future rate increases are summarized as follows Repair and Replace Aging Facilities and Undersized Water Pipelines JBWD owns and operates over 310 miles of pipelines, 5 wells, 17 water storage tanks, 11 pump stations, and a groundwater recharge facility. Roughly 175 miles of JBWD s water pipelines were installed 40 to 70 years ago and are approaching the end of their useful lives. Many old pipelines are inadequately sized and no longer meet fire flow requirements. Other aging facilities including old pump stations, wells and water tanks will need to be rebuilt or refurbished in upcoming years. An engineering analysis of the water system developed by Dudek, JBWD s consulting engineers, identifies the need for $2.5 million per year of funding over the next 30 years to gradually replace aging infrastructure, address existing deficiencies, and improve reliability. While the proposed rates will not provide full funding for this level of funding needs, the rates will enable the District to generate an ongoing funding stream for higher priority projects to address current deficiencies, replace old infrastructure, and improve reliability. BARTLE WELLS ASSOCIATES 9
13 2.5.2 Fund Imported Water Purchases to Reduce Further Groundwater Depletion JBWD relies on groundwater for 100% of the community s water supply. Local water demand exceeds the level of natural recharge. This has resulted in a gradual decrease in groundwater levels. JBWD recently began purchasing imported water from the Mojave Water Agency to help recharge the groundwater basin and reduce further groundwater depletion. While the District is not in any imminent danger of over depleting its groundwater resources, additional funding for imported water purchases will be needed in upcoming years to support the sustainability of the District s long term water supply Support Balanced Budgets & Keep Up with Cost Inflation: Rate increases are needed to support balanced budgets and help keep revenues in line with future cost inflation. The District faces ongoing operating cost inflation due to annual increases in a range of expenses including staffing, utilities, insurance, supplies, etc. Rate increases are also needed to ensure an adequate funding stream for a) a five year, $2.5 million meter replacement program to replace old water meters that are now reaching the end of their useful lives, and b) other ongoing non operating expenses the District incurs each year for equipment, technology, vehicles, building improvements, and various studies and reports Chromium 6 Water Treatment: The District also faces potential need to fund new treatment facilities for Chromium 6, a naturally occurring chemical in the District s groundwater. Concentration levels in the District s groundwater are substantially below current state and federal standards. However, the State is in the process of establishing new, substantially more stringent regulatory standards that would require the District to build and operate new Chromium 6 treatment facilities. The District s preliminary cost estimates (in current dollars) for the project include roughly $2 million for planning and design, and $14 million for construction. To help fund these costs, JBWD has been pursuing a combination of grants and low interest rate loans from the California Safe Drinking Water State Revolving Fund (SRF) Financing Program. In addition, JBWD currently estimates annual operating and maintenance expenses for Chromium 6 treatment at approximately $630,000 per year (in current dollars). JBWD currently anticipates it will need to achieve compliance with new Chromium 6 regulations starting around January 2023, in about 6 years. As such, the 5 year rate projections developed in this report do not account for new debt service and operating expenses for Chromium 6 treatment. However, these costs could significantly impact District finances and rates in subsequent years. BARTLE WELLS ASSOCIATES 10


14 2.6 Water Sales & Impacts on Revenues From approximately 2013 to 2016, JBWD experienced a decline in water sales as customers conserved water in response to California s multi year drought. The decline in water use negatively impacted the District water sales revenues. Customers who conserved were able to offset the impacts of recent year rate increases via reduced water purchases. The District s water sales partially rebounded in the prior fiscal year 2016/17 but remains below the recent historical norms before the drought. BARTLE WELLS ASSOCIATES 11
15 3 LEGAL REQUIREMENTS & RATE METHODOLOGY 3.1 Constitutional Rate Requirements The California Constitution includes two key articles that directly govern or impact JBWD s water rates: Article 10 and Article 13D. The water rates developed in this study were designed to comply with both of these constitutional mandates as well as various provisions of the California Water Code and Government Code that support and add further guidance for implementing these constitutional requirements. In accordance with the constitutional provisions, the proposed rates are designed to a) recover the District s cost of providing service, b) recover revenues in proportion to the cost for serving each customer, and c) promote conservation and discourage waste Article 10, Section 2 Article 10, Section 2 of the California Constitution was established by voter approval in 1976 and requires public agencies to maximize the beneficial use of water, prevent waste, and encourage conservation. Section 2 states that: It is hereby declared that because of the conditions prevailing in this State the general welfare requires that the water resources of the State be put to beneficial use to the fullest extent of which they are capable, and that the waste or unreasonable use or unreasonable method of use of water be prevented, and that the conservation of such waters is to be exercised with a view to the reasonable and beneficial use thereof in the interest of the people and for the public welfare Article 13D, Section 6 Proposition 218 was adopted by California voters in 1996 and added Articles 13C and 13D to the California Constitution. Article 13D, Section 6 governs property related charges, which the California Supreme Court subsequently ruled includes ongoing utility service charges such as water, sewer, and garbage rates. Article 13D, Section 6 establishes a) procedural requirements for imposing or increasing property related charges, and b) substantive requirements for those charges. Article 13D also requires voter approval for new or increased property related charges but exempts from this voting requirement rates for water, sewer, and garbage service. The substantive requirements of Article 13D, Section 6 require JBWD s water rates to meet the following conditions: 1) Revenues derived from the fee or charge shall not exceed the funds required to provide the property related service. BARTLE WELLS ASSOCIATES 12
16 2) Revenues derived from the fee or charge shall not be used for any purpose other than that for which the fee or charge was imposed. 3) The amount of a fee or charge imposed upon any parcel or person as an incident of property ownership shall not exceed the proportional cost of the service attributable to the parcel. 4) No fee or charge may be imposed for a service unless that service is actually used by, or immediately available to, the owner of the property in question. 5) No fee or charge may be imposed for general governmental services, such as police or fire services, where the service is available to the public at large in substantially the same manner as it is to property owners. A number of court decisions have added some legal clarification regarding these substantive rate requirements. The water rates derived in this report are based on a cost of service methodology that is designed to fairly apportions costs to all customers and comply with all legal requirements. 3.2 Rate Setting Methodology The rates developed in this report use a straightforward methodology to establish an equitable system of fixed and variable service charges designed to recover costs of providing service and fairly apportion costs to each rate component and customer. The general methodology used in this study is summarized on the diagram on the following page. BARTLE WELLS ASSOCIATES 13
17 Cost of Service Rate Setting Methodology Revenue Requirements Determine future funding requirements from rates Cost Allocation Equitably apportion costs to rate components Rate Design Develop rates that recover revenues in proportion to the cost of providing service Identify near term & long term operating and capital funding needs Allocate costs to fixed and variable rates (based on financial projections) Identify rate objectives and constraints Evaluate financing alternatives for capital improvements Project total accounts by meter size & total volume of water sales Review existing rate structure and identify potential modifications Establish fund reserve targets for financial planning Calculate a common underlying fixed charge per meter equivalent Apply unit costs of service to characteristics of each customer class Evaluate financial scenarios Calculate a common underlying variable rate per unit of water Develop fixed charges that recover costs in proportion to meter size & capacity Determine future annual revenue requirements Allocate costs to tiers to establish parameters for tiered rates Develop volumetric rates that recover costs apportioned to each tier BARTLE WELLS ASSOCIATES 14
18 4 FINANCIAL PROJECTIONS 4.1 Financial Projections Overview Bartle Wells Associates developed long term cash flow projections to determine annual revenue requirements and evaluate water rate increases. During the rate study process, BWA worked with the District to develop and hone a number of financial scenarios. Key scenarios evaluated include: Best Management Scenario designed to fully fund JBWD s financial needs going forward; Reduced Rate Scenario (Phased Approach) that phases in rate increases over 5 years to support increased funding for JBWD s higher priority funding needs, but not full funding of all long term financial needs; Reduced Rate Scenario (Phased Approach) with Debt Service that includes the same 5 year phased rate increases as without debt, but includes some hypothetical debt financing to fund more capital improvements in the near term at the in ongoing annual debt service that reduces funds available for capital improvements over the longer term. The Reduced Rate Scenario (Phased Approach) is recommended for implementation and was supported by the Citizen s Advisory Committee and approved for inclusion in the Proposition 218 Notice by the Board of Directors. While the proposed rate increases do not address all of the District s future financial needs, they will enable the District to take substantial steps toward addressing its long term financial challenges and put the District on a much stronger financial footing. The 5 year rate scenarios do not fully account for the financial impacts of a few issues that should be factored into future financial and rate updates, including: Chromium 6 Treatment Since the State has deferred adoption of new regulatory standards for Chromium 6, JBWD anticipates it will need to achieve compliance with new regulations starting in about 6 years. While some of the planning and construction costs for this project are projected to be incurred within the next 5 years, the 5 year rate projections developed in this report do not account for new debt service and operating expenses for Chromium 6 treatment. However, these costs could significantly impact District finances and rates in subsequent years. Organizational Assessment JBWD has contracted with an independent consulting firm to conduct an organizational assessment to determine the adequacy of existing staffing levels and help ensure the District continues to provide service in a cost effective manner. The financial projections do not account for potential cost increases or reductions due to this assessment. BARTLE WELLS ASSOCIATES 15
19 2019 Union Negotiations These negotiations could result in changes in future staffing and/or benefit expenses that are different than included in the financial projections. The District can re evaluate its financial and rate projections in future years and can adjust course as needed. The financial projections indicate that under all scenarios, the District will likely need to adopt additional rate increases after 5 years. Lower rate increases in near term result in the need for higher rate increases in future years, and vice versa. 4.2 Key Assumptions The financial projections incorporate the latest information available as well as a number of reasonable and slightly conservative assumptions. Key assumptions are listed below: Projections are based on the 2017/18 Budget. Operating cost inflation is projected at 4% per year. Growth is projected at 10 new single family homes or equivalents per year over next 5 years. Water sales are projected to decline by 2% for each 10% of rate increases ( 0.2 elasticity), with higher percentage decreases in water use in higher rate tiers, which pay higher rates. Recharge water purchases from MWA phase in to a target of purchasing 1,000 acre feet within 5 years. The District s Meter Replacement Program includes $500,000 of annual expenditures for the next 5 years to replace old meters. Capital improvement funding increases to $1 million per year for each of the next 5 years. After 5 years, the amount available for capital improvements increases to $1.5 million when the Meter Replacement Program is complete. Annual Project Funding is projected at $250,000 per year for other ongoing non operating expenses including equipment, technology, vehicles, building improvements, and miscellaneous studies and reports. Chromium 6 treatment program costs (impact rates after 5 years): o Planning and design: Some initial costs have already been funded; projections include an additional approximately $1.7 million in 2020/21 which will be funded by an SRF Planning Loan and ultimately rolled into a future SRF construction loan. o Facility construction & equipment: Construction costs are currently estimated at $14 million. JBWD assumes construction costs would be funded by SRF via a $10 million grant (principal forgiveness) and a $4 million 30 year SRF loan. o Annual Chromium 6 operating expenses: Operating costs are currently estimated at $632,000 per year in current dollars, or about $800,000 per year when the facility is projected to comes online in approximately 6 years. BARTLE WELLS ASSOCIATES 16
20 4.3 Fund Reserves & Reserve Target The financial projections assume a partial drawdown of fund reserves while rates are phasing in. The District has accrued some additional fund reserves in recent years that are intended to be used to help fund capital improvements in upcoming years. The projections assume fund reserves are drawn down by a total of roughly $2.5 million over the next 5 years. At the same time, the projections indicate the District will maintain a prudent minimal level of fund reserves in future years. For financial planning purposes, the financial projections assume a Minimum Fund Reserve Target equal to 50% of annual operating and maintenance expenses plus $1 million for emergency capital reserves. Maintaining a prudent minimal level of fund reserves is an important component of financial management. Fund reserves provides a financial cushion for dealing with unanticipated expenses, revenue shortfalls, and non catastrophic emergency capital repairs. The fund reserve targets will escalate over time as JBWD s expenses gradually increase in future years. In future years, it is acceptable if reserves temporarily fall below the minimum target, provided action is taken to achieve the target over the longer run. 4.4 Financial Projections The table on the following pages shows 10 year financial projections under the Reduced Rate Scenario (Phased Approach). A summary of the financial projections is shown below. Projections under the alternative scenarios are included in the appendix. BARTLE WELLS ASSOCIATES 17
21 Reduced Rate Scenario (Phased Approach) with No Debt Summary of Cash Flow Projections ($ millions) Fiscal Year 17/18 18/19 19/20 20/21 21/22 22/23 23/24 24/25 25/26 26/27 Proposed 5 Year Rate Increases Preliminary Estimates for Future Evaluation Overall Rate Increases 18% 16% 14% 12% 10% 16% 14% 12% 6% 6% Beginning Fund Reserves $7.2 $6.6 $5.6 $4.9 $4.5 $4.6 $4.7 $4.9 $5.1 $5.3 REVENUES Water Rate Revenues Standby Revs/Prop Taxes Other Revenues Subtotal Chrome 6 Grants/Loans Total EXPENSES Operating Expenses Chrome 6 Debt Service Total Capital Expenses Total Revenues Less Expenses (0.6) (1.0) (0.7) (0.4) Ending Fund Reserves Min Fund Reserve Target BARTLE WELLS ASSOCIATES 18
22 Cash Flow Projections Reduced Rate Scenario (Phased Approach) Years Projected Projected Projected Projected Projected 2017/ / / / /22 Effective Date of Rate Adjustment Mar 1 Jan 1 Jan 1 Jan 1 Jan 1 Rate Revenue Adjustment % 18% 16% 14% 12% 10% Growth: New EDUs Growth in Billable EDUs % 0.2% 0.2% 0.2% 0.2% 0.2% Wtr Demand Elasticity (Response to Rate In (0.2) (0.2) (0.2) (0.2) (0.2) Change in Water Use After Rate Increase 3.6% 3.2% 2.8% 2.4% 2.0% Water Purchases from MWA (AF) ,000 MWA Rate per AF $569 $597 $627 $658 $691 Interest Earnings Rate 1.0% 1.5% 2.0% 2.0% 2.0% Annual Cost Escalator 4.0% 4.0% 4.0% 4.0% Beginning Fund Reserves $7,151,000 $6,592,000 $5,594,000 $4,923,000 $4,532,000 REVENUES Basic Monthly Fees 1,606,000 1,903,000 2,192,000 2,480,000 2,757,000 Water Usage Charges 1,913,000 2,219,000 2,475,000 2,725,000 2,960,000 Locked Meter Charges 274, , , , ,000 Standby Revenue 1,140,000 1,139,000 1,138,000 1,137,000 1,136,000 Property Taxes 428, , , , ,000 Private Fire Svc & Special Services 137, , , , ,000 Water Capacity & Meter Install Fees 53,000 53,000 54,000 55,000 56,000 Interest Earnings 50,000 99, ,000 98,000 91,000 HDMC WWTP Reimbs (+22%) 200, , , , ,000 Other Revenues 12,000 20,000 20,000 20,000 20,000 Total Revenues 5,813,000 6,515,000 7,132,000 7,714,000 8,276,000 SRF Grant Funding 100, ,000 10,000,000 SRF Planning & Construction Loan 1,510,000 EXPENSES Operating & Maintenance Production 1,324,000 1,377,000 1,432,000 1,489,000 1,549,000 Recharge Water Purchases from MWA 287, , , , ,000 Distribution 1,000,000 1,040,000 1,082,000 1,125,000 1,170,000 Customer Service 489, , , , ,000 Administration 1,048,000 1,090,000 1,134,000 1,179,000 1,226,000 Engineering 237, , , , ,000 Finance 533, , , , ,000 Personnel & Legal 134, , , , ,000 HDMC WWTP Operations (reimburseable) 163, , , , ,000 Chrome 6 Operations Subtotal 5,215,000 5,543,000 5,833,000 6,135,000 6,456,000 Debt Service Debt Service for Capital Improvements Chrome 6 SRF Loan Repayment Subtotal Capital/Non Operating Capital Improvements 700,000 1,000,000 1,000,000 1,000,000 1,000,000 Meter Replacement Program 0 500, , , ,000 Annual Project Funding 237, , , , ,000 Chromium 6 Project (grant & loan funded) 100, ,710,000 10,000,000 Morongo Basin Pipeline Debt Reimbs 220, , , ,000 0 Subtotal 1,257,000 1,970,000 1,970,000 3,680,000 11,750,000 Total Expenses 6,472,000 7,513,000 7,803,000 9,815,000 18,206,000 Revenues Less Expenses (559,000) (998,000) (671,000) (391,000) 70,000 Ending Fund Reserves 6,592,000 5,594,000 4,923,000 4,532,000 4,602,000 Min Fund Rsrv Target (50% O&M + $1M) 3,607,500 3,771,500 3,916,500 4,067,500 4,228,000 Debt Service Coverage Pay go funding generated for CIP/Other 378, ,000 1,079,000 1,359,000 1,820,000 BARTLE WELLS ASSOCIATES 19
23 Cash Flow Projections Reduced Rate Scenario (Phased Approach) Year Projected Projected Projected Projected Projected Esc 2022/ / / / /27 Factor Effective Date of Rate Adjustment Jan 1 Jan 1 Jan 1 Jan 1 Jan 1 Rate Revenue Adjustment % 16% 14% 12% 6% 6% Growth: New EDUs Growth in Billable EDUs % 0.2% 0.2% 0.2% 0.2% 0.2% Wtr Demand Elasticity (Response to Rate In (0.2) (0.2) (0.2) (0.2) (0.2) Change in Annual Water Consumption 3.2% 2.8% 2.4% 1.2% 1.2% Water Purchases from MWA (AF) 1,000 1,000 1,000 1,000 1,000 MWA Rate per AF $726 $762 $800 $840 $ % Interest Earnings Rate 2.0% 2.0% 2.0% 2.0% 2.0% Annual Cost Escalator 4.0% 4.0% 4.0% 4.0% 4.0% Beginning Fund Reserves $4,602,000 $4,744,000 $4,871,000 $5,102,000 $5,330,000 REVENUES Basic Monthly Fees 3,126,000 3,600,000 4,074,000 4,443,000 4,719,000 Water Usage Charges 3,253,000 3,630,000 3,996,000 4,282,000 4,484,000 Locked Meter Charges 463, , , , ,000 Standby Revenue 1,135,000 1,134,000 1,133,000 1,132,000 1,131,000 Property Taxes 473, , , , , % Private Fire Svc & Special Services 152, , , , , % Water Capacity & Meter Install Fees 57,000 57,000 58,000 59,000 60,000 Interest Earnings 92,000 95,000 97, , ,000 HDMC WWTP Reimbs (+22%) 243, , , , ,000 Other Revenues 20,000 20,000 20,000 20,000 20,000 Total Revenues 9,014,000 9,959,000 10,891,000 11,629,000 12,175,000 SRF Grant Funding SRF Planning & Construction Loan 4,000,000 EXPENSES Operating & Maintenance Production 1,611,000 1,675,000 1,742,000 1,812,000 1,884,000 Recharge Water Purchases from MWA 726, , , , ,000 Distribution 1,217,000 1,266,000 1,317,000 1,370,000 1,425,000 Customer Service 595, , , , ,000 Administration 1,275,000 1,326,000 1,379,000 1,434,000 1,491,000 Engineering 288, , , , ,000 Finance 648, , , , ,000 Personnel & Legal 163, , , , ,000 HDMC WWTP Operations (reimburseable) 199, , , , ,000 Chrome 6 Operations 400, , , , ,000 Subtotal 7,122,000 7,799,000 8,119,000 8,452,000 8,798,000 Debt Service Debt Service for Capital Improvements Chrome 6 SRF Loan Repayment 275, , , ,000 Subtotal 0 275, , , ,000 Capital/Non Operating Capital Improvements (Pipes/Wells/Boosters 1,000,000 1,500,000 2,000,000 2,400,000 2,700,000 Meter Replacement Program 500, Annual Project Funding 250, , , , , % Chromium 6 Project (grant & loan funded) 4,000, Morongo Basin Pipeline Debt Reimbs Subtotal 5,750,000 1,758,000 2,266,000 2,674,000 2,982,000 Total Expenses 12,872,000 9,832,000 10,660,000 11,401,000 12,055,000 Revenues Less Expenses 142, , , , ,000 Ending Fund Reserves 4,744,000 4,871,000 5,102,000 5,330,000 5,450,000 Min Fund Rsrv Target (50% O&M + $1M) 4,561,000 4,899,500 5,059,500 5,226,000 5,399,000 Debt Service Coverage Pay go funding generated for CIP/Other 1,892,000 1,885,000 2,497,000 2,902,000 3,102,000 BARTLE WELLS ASSOCIATES 20


24 The following chart shows a 10 year breakdown of projected expenses and future revenues with the proposed rate increases. The red dashed line shows total estimated 2017/18 revenues. Current year revenues are substantially below the cost of providing service, particularly in future years. The proposed rate increases are needed to make up the funding shortfall and help ensure that future revenues are in line with future costs of providing service. BARTLE WELLS ASSOCIATES 21
25 4.5 Proposed Rate Increases The following table shows a summary of overall proposed rate increases under the Reduced Rate Scenario (Phased Approach). The proposed rate increases are phased in over 5 years in order to keep revenues in line with funding needs and help minimize the annual impact on ratepayers. Actual billing impacts will vary depending on each customer s meter size and water consumption, as the proposed rates also include some modifications to the District s rate structure. While rate increases in early years are higher in percentage terms compared to the rate increases in later years, due to compounding, the actual dollar impacts on customer bills are more constant from year to year. Proposed Water Rates Increases Mar 1 Jan 1 Jan 1 Jan 1 Jan Overall Rate Adjustment 18% 16% 14% 12% 10% In future years, JBWD can re evaluate its finances and revenue requirements and adjust rates as needed based on updated financial projections. However, as previously noted, while the proposed rate increases do not address all of the District s future financial needs, they will enable the District to take substantial steps toward addressing its long term financial challenges and put the District on a much stronger financial footing. JBWD always has the flexibility to implement rates that are lower than those adopted pursuant to the Proposition 218 process. However, future rates cannot exceed the adopted rate increases without going through the Proposition 218 process for any additional future increase. Hence rates adopted pursuant to Proposition 218 are essentially maximum allowable rates. 4.6 Comparison of Financial Scenarios For informational purposes, the tables on the following page show a summary comparison of the financial scenarios developed as part of this study. The full financial projections for each scenario are included in the appendix. BARTLE WELLS ASSOCIATES 22
26 Scenario 1: Best Management Practice, Deferred Cr / / / / /22 Key Assumptions Capital Improvement Projects $700,000 $2,500,000 $2,500,000 $2,500,000 $2,500,000 Meter Replacement Program $0 $500,000 $500,000 $500,000 $500,000 Annual Project Funding $237,000 $250,000 $250,000 $250,000 $250,000 Recharge Water Purchases $287,000 $597,000 $627,000 $658,000 $691,000 Recharge (Acre Feet) 500 1,000 1,000 1,000 1,000 Rate Increases Effective Date of Rate Increase Mar 1, 2018 Jan 1, 2019 Jan 1, 2020 Jan 1, 2021 Jan 1, 2022 Rate Revenue Increase % 40% 30% 20% 10% 5% Bill Impacts Low Use (3 hcf) $34.78 $44.69 $57.39 $68.38 $74.97 $78.53 Median Use (6 hcf) Typical Residential Bill (9 hcf) Higher Use (20 hcf) Scenario 2: Reduced Rate Scenario (Phased Approach) 2017/ / / / /22 Key Assumptions Capital Improvement Projects $700,000 $1,000,000 $1,000,000 $1,000,000 $1,000,000 Meter Replacement Program $0 $500,000 $500,000 $500,000 $500,000 Annual Project Funding $237,000 $250,000 $250,000 $250,000 $250,000 Recharge Water Purchases $287,000 $418,000 $502,000 $592,000 $691,000 Recharge (Acre Feet) ,000 Rate Increases Effective Date of Rate Increase Mar 1, 2018 Jan 1, 2019 Jan 1, 2020 Jan 1, 2021 Jan 1, 2022 Rate Revenue Increase % 18% 16% 14% 12% 10% Bill Impacts Low Use (3 hcf) $34.78 $38.06 $43.90 $49.58 $55.13 $59.95 Median Use (6 hcf) Typical Residential Bill (9 hcf) Higher Use (20 hcf) Scenario 3: Reduced Rate Scenario with $5 Million Debt 2017/ / / / /22 Key Assumptions Capital Improvement Projects (Pay Go) $700,000 $0 $1,000,000 $1,000,000 Capital Projects (Debt Financed) $5,000,000 Meter Replacement Program $0 $500,000 $500,000 $500,000 $500,000 Annual Project Funding $237,000 $250,000 $250,000 $250,000 $250,000 Recharge Water Purchases $287,000 $418,000 $502,000 $592,000 $691,000 Recharge (Acre Feet) ,000 New Debt Service $0 $325,000 $325,000 $325,000 $325,000 Rate Increases Effective Date of Rate Increase Mar 1, 2018 Jan 1, 2019 Jan 1, 2020 Jan 1, 2021 Jan 1, 2022 Rate Revenue Increase % 18% 16% 14% 12% 10% Bill Impacts Low Use (3 hcf) $34.78 $38.06 $43.90 $49.58 $55.13 $59.95 Median Use (6 hcf) Typical Residential Bill (9 hcf) Higher Use (20 hcf) BARTLE WELLS ASSOCIATES 23
27 5 RATE DERIVATION 5.1 Rate Structure Modifications The District s current rate structure was developed during the prior rate study in 2013 and reflects input from the District s Citizen s Advisory Committee and Board of Directors. Based on evaluation of rate structure alternatives and additional input received during the rate study process, the proposed rates developed in this report incorporate some relatively minor modifications to JBWD s water rate structure. These modifications are designed to a) provide a reasonable and appropriate balance of fixed vs. usage based revenue recovery, b) gradually increase conservation incentive while helping to minimize the financial impact on customers with low to moderate water use, c) fairly apportion costs of service to all JBWD customers in accordance with the substantive requirements of Article 13D, Section 6 of the California Constitution, and d) reflect the policy preferences of the District and the Citizens Advisory Committee. Rate structure modifications are summarized as follows Fixed Meter Charge Modifications Reduce Fixed Rate Revenue Recovery from 46% to 40% of Total Rate Revenues The District s fixed meter charges were designed to recover 40% of total rate revenues. However, due to a decrease in water sales which resulted in lower than expected volumetric water rate revenues, the fixed charges currently generate an estimated 46% of rate revenues. Under the proposed rates, the percentage of rate revenues recovered from JBWD s fixed Basic Monthly Fees is targeted at 40% of total rate revenues Variable Water Rate Structure Modifications The proposed rates incorporate two modifications to JBWD s variable Water Flow Charges. These modifications will result in a gradual increase in conservation incentive and help lessen the impact of the proposed rate increases on customers with low to moderate water use. The proposed modifications include: Increase Variable Rate Revenue Recovery from 54% to 60% of Total Rate Revenues Under the proposed rates, JBWD s usage based Water Flow Charges are targeted to recover 60% of total rate revenues. These charges currently recover an estimated 54% of rate revenues. Gradually Increase the Steepness of Tiered Rates The District s Water Flow Charges for accounts with 3/4 inch and 1 inch meters (mostly residential customers) are billed according a 4 tiered inclining rate structure with water first purchased in Tier 1 and subsequently in higher tiers as water use increases. Hence, even higher use customers purchase a substantial amount of water in the lower tiers as their use increases. Under the proposed rates, the BARTLE WELLS ASSOCIATES 24


28 rate differential between each tier gradually increases over 5 years. This increase in tier steepness will result in lower rate impacts to low and moderate use customers, and higher impacts to customers with high to very high water use. At the same time, these high use customers benefit from paying the same fixed monthly charges as lower use customers, even though they put more demand on the water system. The following charts shows a breakdown of the percentage of predominantly residential water bills (for 3/4 inch and 1 inch meters) ending in each tier and the percentage of water use billed in each tier. The proposed rates include no changes to the tier breakpoints. BARTLE WELLS ASSOCIATES 25


29 The following chart shows a breakdown of monthly water bills at each level of water use for accounts with 3/4 inch and 1 inch meters that pay tiered water rates. BARTLE WELLS ASSOCIATES 26
30 5.2 Fixed & Variable Cost Recovery Rates developed in this report are based on a reasonable allocation of costs to fixed and variable rate recovery as shown on the following table. Costs are allocated based on projected expenses in 2021/22, the final year of the proposed rates. Revenues derived from sources other than water rates are applied toward reducing cost recovery from fixed rates. Based on these cost allocations, water rates are designed to recover 40% of rate revenues from JBWD s fixed Basic Monthly Fees and 60% of rate revenues from volumetric Water Flow Charges. Fixed vs. Variable Rate Recovery Year 5 Cost Recovery % Cost Recovery $ 2021/22 Fixed Variable Fixed Variable EXPENSES Operating & Maintenance Production 1,549,000 0% 100% 0 1,549,000 Recharge Water Purchases from MWA 691,000 0% 100% 0 691,000 Distribution 1,170,000 0% 100% 0 1,170,000 Customer Service (10% for Conservation Prog) 572,000 90% 10% 514,800 57,200 Administration 1,226, % 0% 1,226,000 0 Engineering 277, % 0% 277,000 0 Finance 623, % 0% 623,000 0 Personnel & Legal 157, % 0% 157,000 0 HDMC WWTP Operations (reimburseable) 191, % 0% 191,000 0 Subtotal 6,456,000 46% 54% 2,988,800 3,467,200 Non Operating/Discretionary Capital Improvements 1,000,000 50% 50% 500, ,000 Meter Replacement Program 500, % 0% 500,000 0 Annual Project Funding 250, % 0% 250,000 0 Subtotal 1,750,000 71% 29% 1,250, ,000 Total Expenses 8,206,000 52% 48% 4,238,800 3,967,200 NET FUNDING REQUIRED FROM WATER RATES Total Expenses 8,206,000 52% 48% 4,238,800 3,967,200 Less Funding Sources Other Than Rates (2,559,000) 80% 20% (2,047,200) (511,800) Net Funding Requirement from Water Rates 5,647,000 39% 61% 2,191,600 3,455,400 Rounded Target 40% 60% Excludes capital improvement projects funded by grants and debt, but includes associated debt service. BARTLE WELLS ASSOCIATES 27
31 Depending on perspective, many costs can reasonably be allocated to either fixed rate revenue recovery, to usage based rate recovery, or to some combination of the two. Many of the District s costs are fixed costs that do not vary with changes in water consumption, such as salaries, benefits, and costs for building and maintaining infrastructure. However, even though these are fixed expenses, revenue recovery for these costs can equitably be funded from variable, usage based rates. For example, the fixed costs related to water production can reasonably be recovered from usagebased charges as these costs are incurred to provide water supply to meet customer demand, hence it is reasonable to recover these costs based on water use. While there is no single correct approach to revenue recovery, BWA believes that costs should be allocated within a reasonable range that reflects both a) underlying cost causation, to the extent such causation can reasonably be determined or estimated, and b) policy preferences in cases where a range of reasonable approaches can be justified. As shown on the table: Costs related to water production, groundwater recharge, and distribution are allocated for cost recovery from volumetric, usage based rates. Under this approach, the costs related to water supply and distribution are recovered based on each customer s metered water consumption. Costs for administration and other support functions such as finance, engineering, legal, and to a large degree customer service, are allocated for cost recovery from fixed Basic Service Fees. Capital improvement expenses are allocated for 50% cost recovery from fixed charges (which are based on the capacity needs for serving each meter size) and 50% cost recovery from volumetric, usage based rates. This reflects a balance in revenue recovery recognizing that a) infrastructure is needed to meet the demands of each meter size regardless of actual use, and also b) customers who use more water place a higher demand on the system. Hence a portion of costs is recovered from both fixed meter charges, and volumetric water quantity charges. Costs for the District s meter replacement program and other annual project funding needs (for vehicles, equipment, building improvements, studies, etc.) are allocated for cost recovery from fixed service charges. Revenues received from sources other than rates (property taxes, standby charges, interest earnings, etc.) are used to offset the revenue requirement from rates. 80% of these revenues are applied to offset the revenue requirements from fixed charges, and 20% of these revenues are applied to offset the revenue requirements from usage based quantity charges. BARTLE WELLS ASSOCIATES 28
32 5.3 Fixed Rate Derivation The proposed fixed meter charges are designed to recover costs from each meter in proportion to meter capacity and the associated demand placed on the water system by each meter size. The table below derives fixed meter charges for the next 5 years. Revenue requirements from fixed charges are calculated by multiplying a) the annualized revenue requirements from each rate increase by b) 40%, the percentage of costs allocated for fixed rate revenue recovery. This fixed rate funding target is then divided by the total number of projected meter equivalents the District will serve each year in order to determine a fixed charge per meter equivalent. A meter equivalent represents the capacity of a base 3/4 inch or 1 inch meter. Fixed rates for larger meters are then calculated based on the capacity of each meter size in relation to that of the base meter size. Fixed Rate Calculation Mar 1 Jan 1 Jan 1 Jan 1 Jan Water Rate Revenue Recovery Annualized Revenues w/ Increase $3,861,000 $4,405,000 $4,951,000 $5,480,000 $5,971,000 Fixed Rate Recovery Cost Recovery Allocation % 40% 40% 40% 40% 40% Cost Recovery Allocation $ $1,544,400 $1,762,000 $1,980,400 $2,192,000 $2,388,400 Meter Equivalents Existing Meter Equivalents 4,764 4,774 4,784 4,794 4,804 Projected Growth Total 4,774 4,784 4,794 4,804 4,814 Rate per Meter Equivalent Annual $ $ $ $ $ Monthly Projected Fixed Monthly Meter Charges Meter Size Capacity (gpm) 3/4" & 1" 30 $26.96 $30.70 $34.43 $38.03 $ /2" " " BARTLE WELLS ASSOCIATES 29
33 5.4 Projected Water Use The following table shows a 5 year projection of water use by rate class. Projected water use is based on actual use from the prior fiscal year 2016/17 adjusted to account for a) growth in demand from new development, b) overall elasticity of water purchases in response to rate increases, with each 10% of volumetric rate increases projected to result in a corresponding 2% reduction in water sales, and c) higher levels of water reduction in the higher rate tiers, and less reduction in lower rate tiers. If a customer cuts back water use by 10%, from 20 hcf to 18 hcf, they have reduced their Tier 3 consumption by 2 hcf, but are still using the full amount of water in the first two tiers. Hence, agencies experiencing a decline in water use typically face only minimal reductions in the lowest rate tiers coupled with more substantial reductions in higher tiers. This also makes sense as customers with high water use typically can cut back water use much easier than customers with minimal use. Based on the projections, total water consumption is projected to decrease by a little more than 13% over the next 5 years. Projected Water Use 2016/ / / / / /22 Projected Water Use Change in Use After Rate Increase 3.6% 3.2% 2.8% 2.4% 2.0% Billed Use by Tier for 3/4" & 1" Meters (hcf) Includes more reduction in higher tiers, less reduction in lower tiers. Tier 1 188, , , , , ,000 Tier 2 91,526 86,600 82,400 78,900 76,100 73,800 Tier 3 76,742 71,800 67,700 64,300 61,500 59,300 Tier 4 86,482 79,600 74,000 69,400 65,700 62,800 Subtotal 442, , , , , ,900 All Other Use (hcf) 85,275 83,700 82,400 81,200 80,200 79,400 Total (hcf) 528, , , , , ,300 Total (acre feet) 1,213 1,167 1,130 1,098 1,073 1,052 Annual Change 3.7% 3.2% 2.8% 2.3% 1.9% Cumulative Change 3.7% 6.8% 9.4% 11.6% 13.2% BARTLE WELLS ASSOCIATES 30
34 5.5 Variable Water Flow Rate Derivation The District s variable water flow charges are designed to recover 60% of total rate revenues. For purposes of deriving water flow charges for each of the District s water rate tiers, costs allocated for recovery from variable rates are further broken down and allocated to Base vs. Extra Capacity expenses. Base costs are generally defined as expenses associated with providing system capacity and water service under average daily demand or normal use conditions. These costs benefit all water use on a pro rata basis. For example, the costs of water production are recovered based on each customer s proportionate share of total water consumption. Hence, Base Costs are recovered equally from each unit of water sold. Extra Capacity costs are generally defined as expenses related to providing system capacity and water service to meet peak demands in excess of average use. Some water system facilities must be oversized to meet peak day and peak hour demands, not just average day demands. For example, a smaller water booster pump station may be adequate to pump water under average use conditions, but may be inadequate to meet water demands during periods of peak use. Additionally, there are some costs that should be recovered more from higher levels of use, such as costs related to the District s conservation program and costs for importing water to replenish the groundwater basin to reduce overdraft. Higher levels of use are driving the need to incur these costs, hence these costs should be recovered from rates charged to higher tiers and not recovered from low levels of water use. The table on the following page allocates costs slated for variable rate recovery to Base and Extra Capacity. Most costs are assigned as Base costs. Costs allocated to Extra Capacity include: Recharge water purchase expenses are recovered first from the highest levels of water use, and then from lower levels of use until the total volume of imported water supply is accounted for. Moderate to higher levels of use pay for recharge water on a unit per unit basis, since this use is driving the need to import water for groundwater replenishment. 10% of customer service expenses are assigned for variable rate recovery. These costs are related to the District s conservation program which is included in the customer service budget. A higher share of these costs are recovered from higher levels of water use in recognition that program costs are incurred largely due to the need to reduce water consumption of customers with higher levels of water use. Of the 50% of capital improvement costs allocated for variable rate recovery, 20% of these costs are allocated to Extra Capacity, resulting in 10% of total capital improvement costs BARTLE WELLS ASSOCIATES 31
35 allocated to Extra Capacity. 10% is a conservative estimate of the share of water system costs associated with meeting peak demands in excess of average use. In total, a little over 10% of projected annual expenses are allocated to Extra Capacity. Variable Rate Base vs. Extra Capacity Cost Allocation REVENUE REQUIREMENT FROM WATER CONSUMPTION CHARGES Projected Fixed Rate Quantity Charge Cost Recovery Extra Capacity 2021/22 Recovery % of Total Var % Alloc $ % of Total Production 1,549,000 0% 100% 1,549,000 Base 100% 1,549,000 Extra Capacity 0% 0 0.0% Recharge Water Purchases from MWA 691,000 0% 100% 691,000 Base 0% 0 Extra Capacity 100% 691, % Distribution 1,170,000 0% 100% 1,170,000 Base 100% 1,170,000 Extra Capacity 0% 0 0.0% Customer Service 572,000 90% 10% 57,200 Base 0% 0 Extra Capacity 100% 57, % Engineering 277, % 0% 0 Base 100% 0 Extra Capacity 0% 0 0.0% Admin/Finance/Pers & Legal/Other 2,197, % 0% 0 Base 100% 0 Extra Capacity 0% 0 0.0% Capital Improvements 1,000,000 50% 50% 500,000 Base 80% 400,000 Extra Capacity 20% 100, % Meter Repls/Annual Project Funding 750, % 0% 0 Base 100% 0 Extra Capacity 0% 0 0.0% Total Expenses 8,206,000 52% 48% 3,967,200 Base 78.6% 3,119,000 Extra Capacity 21.4% 848, % NET REVENUE RECOVERY FROM WATER CONSUMPTION CHARGES Base Costs (Recovered Proportionately from All Water Use) 3,119,000 Extra Capacity (Allocated for Recovery Based on Extra Capacity Demands) 848,200 Less Application of Discretionary Revenues (511,800) Total 3,455,400 BARTLE WELLS ASSOCIATES 32
36 The following table derives water usage rates for each tier based on a) the costs allocated to each tier, divided by b) projected water use in each tier. Base costs are allocated on a pro rata basis to all water use; each unit of water pays the same. For example, 39.9% of Base Costs are allocated to Tier 1 rates since Tier 1 water use accounts for 39.9% of total water use. Extra Capacity costs are allocated for recovery more from higher levels of use and less from lower levels of use, resulting in higher rates for higher rate tiers. For example, a shown on the table, 90% of water use in the highest Tier 4 is assigned for Extra Capacity cost recovery, while only 20% of water use in Tier 1 is assigned for Extra Capacity cost recovery. Variable Rate Calculation 3/4" and 1" Meters Tier 1 Tier 2 Tier 3 Tier Subtotal Water Use (hcf) 183,000 73,800 59,300 62, ,900 A) Base Cost Allocation % of Total Use 39.9% 16.1% 12.9% 13.7% 82.7% B) Extra Capacity Cost Allocation % of Water in Class/Tier for Peak Cost Recovery 20.0% 40.0% 60.0% 90.0% 41.8% Volume of Water for Peak Cost Recovery 36,600 29,520 35,580 56, ,220 % of Total Water for Peak Cost Recovery 21.3% 17.2% 20.7% 32.9% 92.0% VARIABLE RATE COST RECOVERY Base Expenses $3,119,000 A Base 1,245, , , ,391 Extra Capacity Expenses 848,200 B Extra 180, , , ,761 Less Application of Base Non Rate Revenue (291,800) A Base (116,516) (46,989) (37,756) (39,985) Less Application of Discretionary Revenues (220,000) (185,000) (35,000) 0 0 Total 3,455,400 1,124, , , ,167 Water Use (hcf) 183,000 73,800 59,300 62,800 Quantity Charge Components Base Expenses $6.81 $6.81 $6.81 $6.81 Extra Capacity Expenses Offset for Revenue Offset (0.64) (0.64) (0.64) (0.64) Offset for Application of Discretionary Revenues (1.01) (0.47) Total Charge per hcf Rounded BARTLE WELLS ASSOCIATES 33
37 The net costs allocated to each rate tier include a) Base expenses allocated on a pro rata basis to all units of water use, b) Extra Capacity expenses allocated more to higher tiers and less to lower tiers, offset by c) application of some non rate revenues to all water use on a pro rata basis, and d) application of a portion of discretionary revenues (e.g. property tax revenues) to partially offset revenue requirements from the lowest tier water use. These offsets help reduce the level of cost recovery from all tiers to levels below the full cost of service, and further help reduce the rates for the lowest levels of usage. The District s 4 tiered rate structure applies to all customers with 3/4 inch and 1 inch meters, who include mostly residential customers along with some smaller commercial accounts. All of these customers benefit from the lower rates in the lower tiers. Low water users may only purchase water in the first tier or two, while high water users would get the benefit of buying water in the lowest tiers first with only subsequent use purchased in higher tiers. Customers with meters larger than 1 inch pay a uniform rate for all water use that is set at the weighted average rate for the District s tiered rates to ensure equity between customer classes. These larger customers are not a homogenous group and can include anything from an office or apartment building to a hospital or school. As such, it is challenging and problematic to establish tiers that can reasonably apply to such a wide range of customer types and usage levels. Hence, most water agencies in California charge a uniform rate to larger commercial and institutional customers. 5.6 Private Fire Protection Charges JBWD provides private fire service connections to 18 customers. While the District s entire water system is sized to provide fire protection, these customers receive additional benefit for having direct fire service connections. Unlike regular ongoing water service, private fire service is essentially a stand by service that is rarely used. In line with industry standards, Private Fire Protection Charges are recommended at 10% of the standard Basic Monthly Fee (for regular water service) proportionally applied to the capacity of each service size. Current & Proposed Private Fire Protection Charges Basic Monthly Fee 30 gpm $25.78 $26.96 $30.70 $34.43 $38.03 $ % Allocation per gpm Private Fire Protection Charges Svc Size Accounts Capacity Monthly Rate 2" gpm $12.62 $14.38 $16.37 $18.36 $20.28 $ " gpm " gpm " 4 1,000 gpm " 7 1,600 gpm BARTLE WELLS ASSOCIATES 34
38 6 PROPOSED RATES & IMPACTS 6.1 Proposed Water Rates The following table shows a 5 year schedule of proposed water rates incorporating a) the proposed overall level of rate increases needed to fund JBWD s projected costs of providing service, and b) the proposed rate structure adjustments supported by the cost allocations. Rate increases are gradually phased in over the next 5 years. Current & Proposed Water Rates Current Mar 1 Jan 1 Jan 1 Jan 1 Jan 1 Effective Rates BASIC MONTHLY FEE Meter Size Accounts Capacity Monthly Rate 3/4" & 1" 4, gpm $25.78 $26.96 $30.70 $34.43 $38.03 $ /2" gpm " gpm " gpm MONTHLY WATER FLOW CHARGES For 3/4" and 1" Meters Rate Per Unit ($/hcf) Tier units $3.00 $3.70 $4.40 $5.05 $5.70 $6.20 Tier units Tier units Tier units unit = one hundred cubic feet = 748 gallons For 1 1/2", 2" and 3" Meters Rate Per Unit ($/hcf) Unit rate for all water use $3.79 $4.60 $5.40 $6.20 $7.00 $ unit = one hundred cubic feet = 748 gallons PRIVATE FIRE PROTECTION CHARGES Svc Size Accounts Capacity Monthly Rate 2" gpm $12.62 $14.38 $16.37 $18.36 $20.28 $ " gpm " gpm " 4 1,000 gpm " 7 1,600 gpm BARTLE WELLS ASSOCIATES 35
39 6.2 Water Rate Impacts The following table shows the impacts of the proposed water rates on a customer with a 3/4 inch or 1 inch meter at a range of levels of water use. With the proposed rate increases, the monthly bill for a customer with median use of 6 hcf would gradually increase from the current level of $44.28 to $80.05 over the next 5 years resulting in a 5 year increase of $35.77 per month. This equates to an average annual compounded increase of 12.6%. Approximately half of the District s bills are currently at or below this level of use. These are substantial increases, but are needed to restore financial stability and provide funding for high priority capital improvements and water supply for groundwater replenishment. The billing impacts shown on the table do not account for any potential reduction in future water use due to additional conservation. Customers can help mitigate the impact of the proposed rate increases by reducing water use. Note that water consumption, particularly for single family customers, typically varies from month to month due to seasonal variations in weather and/or other factors. Hence customers could face a range of impacts throughout the year depending on their level of water use in each billing period. Projected Rate Impacts Level Monthly % of Bills Projected Monthly Water Bills 5 Year Avg Yearly of Use Use at or Below Current Impact Impact LOW 3 hcf 30% $34.78 $38.06 $43.90 $49.58 $55.13 $59.95 Increase $ Increase % 9.4% 15.3% 12.9% 11.2% 8.7% 72.4% 11.5% MEDIAN 6 hcf 55% $44.28 $49.86 $58.00 $65.83 $73.53 $80.05 Increase $ Increase % 12.6% 16.3% 13.5% 11.7% 8.9% 80.8% 12.6% AVERAGE 9 hcf 73% $54.78 $63.06 $73.90 $84.28 $94.53 $ Increase $ Increase % 15.1% 17.2% 14.0% 12.2% 9.1% 88.3% 13.5% MOD HIGH 20 hcf 90% $98.28 $ $ $ $ $ Increase $ Increase % 20.5% 19.2% 15.4% 13.3% 9.9% 106.4% 15.6% HIGH 30 hcf 95% $ $ $ $ $ $ Increase $ Increase % 24.5% 20.8% 16.5% 14.1% 10.7% 121.4% 17.2% Note: Impacts shown above assume no reduction in future water use due to conservation. BARTLE WELLS ASSOCIATES 36

40 The following charts show historical and projected monthly charges for a customer with a 3/4 inch or 1 inch meter with Low Use, Median Use, and Average Use, to put the proposed rates in context of a longer term history. With the proposed rate increases, the long term average annual rate increase since 1996 equates to 2.8% for a Low Use customer, 3.3% for a Median Use customer, and 3.8% for an Average Use customer. These long term increases are nominal increases that do not account for inflation. From 1996 to 2017, inflation as measured by the Consumer Price Index (CPI U) increased by approximately 60% equating to an average annual compounded rate of 2.15%. Discounting for inflation, the long term average annual rate increase since 1996 equates to about 0.7% for a Low Use customer, 1.1% for a Median Use customer, and 1.6% for an Average Use customer in inflationadjusted terms. While the proposed rates will result in substantial increases from current levels, over the longer term they bill bring rates up to where they would have been had the District raised rates each year by a little more than inflation. The District has had a long standing commitment to keeping rates as low as possible. While this has benefitted ratepayers via lower bills for many years, it is also resulting in the need for larger rate increases in upcoming years to restore financial stability and address longterm financial challenges. BARTLE WELLS ASSOCIATES 37

41 BARTLE WELLS ASSOCIATES 38
City of San Carlos Sewer Financial Plan & Rate Update
 City of San Carlos Sewer Financial Plan & Rate Update Revised 06/13/16 1889 Alcatraz Avenue Berkeley, CA 94703 Tel: 510 653 3399 www.bartlewells.com June 13, 2016 City of San Carlos Department of Public
BODEGA BAY PUBLIC UTILITY DISTRICT Water and Wastewater Rate Study
 BODEGA BAY PUBLIC UTILITY DISTRICT Water and Wastewater Rate Study FINAL REPORT March 22, 2018 BARTLE WELLS ASSOCIATES Independent Public Finance Advisors 1889 Alcatraz Avenue Berkeley, CA 94703-2714 Tel.
The City of Sierra Madre
 The City of Sierra Madre Comprehensive Water and Wastewater Cost of Service Study Report / December 24, 2018 24640 Jefferson Avenue Suite 207 Murrieta, CA 92562 Phone 951.698.0145 www.raftelis.com December
Santa Clarita Water Division
 Santa Clarita Water Division Retail Water Rate Cost of Service Study Report September 2017 445 S Figueroa St Suite 2270 Los Angeles, CA 90039 Phone 213.262.9300 www.raftelis.com September 11, 2017 Mr.
WATER USER RATES & FEE STUDY
 WATER USER RATES & FEE STUDY FINAL REPORT February 2016 BARTLE WELLS ASSOCIATES Independent Public Finance Consultants 1889 Alcatraz Avenue Berkeley, California 94703 www.bartlewells.com Tel: 510/653-3399
CITY OF CALISTOGA WATER RATE STUDY FINAL REPORT
 CITY OF CALISTOGA WATER RATE STUDY FINAL REPORT February 2, 218 This page was intentionally left blank. City of Calistoga Water Rate Study Report Page 2 February 2, 218 Dylan Feik City Manager City of
Santa Ynez River Water Conservation District, ID No. 1. Water Rates & Finances. December 13, 2016
 Santa Ynez River Water Conservation District, ID No. 1 Water Rates & Finances December 13, 2016 Presentation Overview Objectives & Process District Finances Current & Projected Rates 2 Rate Study Objectives
City of Riverbank. Water Rate Study FINAL 6/18/2015
 Water Rate Study FINAL 6/18/2015 Bartle Wells Associates Independent Public Finance Consultants 1889 Alcatraz Avenue Berkeley, California 94703 www.bartlewells.com Tel: 510-653-3399 June 18, 2015 6707
WATER AND SEWER RATE STUDY
 FINAL WATER AND SEWER RATE STUDY B&V PROJECT NO. 179322.0100 PREPARED FOR City of Lynwood, CA JANUARY 11, 2017 Black & Veatch Holding Company 2011. All rights reserved. City of Lynwood, CA WATER AND SEWER
Town of Hillsborough. City Council Public Hearing. Water Rate Cost-of-Service Study. February 13, 2017
 City Council Public Hearing February 13, 2017 Public Hearing on Proposed Water Rates PRESENTED BY Kelly J. Salt Partner 2016 Best Best & Krieger LLP Article X, section 2 (1928) The general welfare requires
MARINA COAST WATER DISTRICT FINANCIAL PLAN AND RATE AND FEE STUDY FINAL REPORT. September 2013
 MARINA COAST WATER DISTRICT FINANCIAL PLAN AND RATE AND FEE STUDY FINAL REPORT September 2013 10540 TALBERT AVENUE, SUITE 200 EAST FOUNTAIN VALLEY, CALIFORNIA 92708 P. 714.593.5100 F. 714.593.5101 MARINA
West Valley Sanitation District FINANCIAL PLAN & RATE STUDY. January 2018
 West Valley Sanitation District FINANCIAL PLAN & RATE STUDY January 2018 BARTLE WELLS ASSOCIATES Independent Public Finance Consultants 1889 Alcatraz Avenue Berkeley, California 94703 www.bartlewells.com
Water and Sewer Utility Rate Studies
 Final Report Water and Sewer Utility Rate Studies July 2012 Prepared by: HDR Engineering, Inc. July 27, 2012 Mr. Mark Brannigan Director of Utilities 591 Martin Street Lakeport, CA 95453 Subject: Comprehensive
YORBA LINDA WATER DISTRICT
 YORBA LINDA WATER DISTRICT 2015 Water and Sewer Rate Study Report FINAL August 25, 2015 City of Thousand Oaks Water and Wastewater Financial Plan Study Report 445 S. Figueroa Street Suite #227 Los Angeles,
Water Rate Study for City of Lemoore
 Water Rate Study for City of Lemoore June 17, 2016 Prepared by: Dan Bergmann, Principal 15 Shasta Lane, Walnut Creek, CA 94597 Email: dan@igservice.com Office: 925-946-9090 Water Rate Study for City of
Water Rate Study Final Report
 Phelan Pinon Hills Community Services District March 6, 2013 Water Rate Study Final Report Corporate Office: Anaheim, California Temecula Office: 27368 Via Industria, Suite 110 Temecula, California 92590
Lorie Tinfow, City Manager, City of Pacifica Lorenzo Hines Jr., Assistant City Manager, City of Pacifica
 DATE: March 7, 2017 TO: FROM: SUBJECT: Lorie Tinfow, City Manager, Lorenzo Hines Jr., Assistant City Manager, Douglas Dove, President Michael DeGroot, Financial Analyst Abigail Seaman, Financial Analyst
Temescal Valley Water District
 Temescal Valley Water District Comprehensive Water, Recycled Water, and Wastewater Cost of Service Study Draft Report / December 7, 2016 24640 Jefferson Avenue Suite 207 Murrieta, CA 92562 Phone 951.698.0145
Water Consultancy. Montecito Sanitary District Wastewater Rate Study Report. Montecito Sanitary District
 3585 Maple Street, Suite 250 Ventura, CA 93003 805-404-1467 Montecito Sanitary District Wastewater Rate Study Report March 2016 Montecito Sanitary District 1042 Monte Cristo Lane Santa Barbara CA 93108
April 6, Katherine Godbey Director of Finance, Coachella Valley Water District Hovley Lane East Palm Desert, CA 92260
 April 6, 2016 Katherine Godbey Director of Finance, Coachella Valley Water District 75515 Hovley Lane East Palm Desert, CA 92260 Dear Ms. Godbey: Hawksley Consulting (a subsidiary of MWH Global) is pleased
Notice of a public hearing
 Notice of a public hearing Dear Benicia Resident and/or Business Owner, You are receiving a revised Notice of a Public Hearing to increase the water and sewer rates and add water meter replacement fees.
La Cañada Irrigation District
 La Cañada Irrigation District Water Rate Study Report - 2009 March, 2009 201 S. Lake Blvd, Suite 803 Pasadena CA 91101 Phone Fax 626 583 1894 626 583 1411 www.raftelis.com March 30, 2009 Mr. Douglas M.
Valencia Water Company. Cost of Service Study
 Valencia Water Company Cost of Service Study 2018 2020 Prepared By: Kenneth J. Petersen, P.E. Beverly Johnson, CPA John Garon, Consultant September 2017 1 P age Contents EXECUTIVE SUMMARY... 1 INTRODUCTION...
Maurice Kaufman, Director of Public Works / City Engineer Bartle Wells Associates DATE: September 7, 2016 MEMORANDUM
 TO: FROM: Maurice Kaufman, Director of Public Works / City Engineer Bartle Wells Associates DATE: September 7, 2016 SUBJECT: - MEMORANDUM Introduction The (City) provides sewer sanitary collection services
WATER AND WASTEWATER RATE STUDY
 WATER AND WASTEWATER RATE STUDY Draft July 3, 2013 Prepared by: Page 1 Page 2 201 S. Lake Avenue Suite 301 Pasadena, CA 91101 Phone 626. 583. 1894 Fax 626. 583. 1411 www.raftelis.com July 1, 2013 Mr. Don
City of Benicia. Rate Study Update: Water & Wastewater Rates
 City of Benicia Rate Study Update: Water & Wastewater Rates March 1, 2016 Prepared by: Karin Schnaider, Finance Director, City of Benicia Greg Clumpner, Director, NBS Carmen Narayanan, Consultant, NBS
Water & Sewer Rate Study. Water & Sewer Cost of Service Rate Study. City of Norco, CA. Draft Report for
 Water & Sewer Cost of Service Rate Study for City of Norco, CA October 11, 2016 Table of Contents October 11, 2016 Chad Blais Director of Public Works City of Norco 2870 Clark Avenue Norco, CA 92860 Re:
City of Signal Hill Cherry Avenue Signal Hill, CA RESOLUTION DECLARING INTENTION TO AMEND SIGNAL HILL
 City of Signal Hill 2175 Cherry Avenue Signal Hill, CA 90755-3799 AGENDA ITEM TO: FROM: SUBJECT: HONORABLE MAYOR AND MEMBERS OF THE CITY COUNCIL BARBARA MUÑOZ DIRECTOR OF PUBLIC WORKS RESOLUTION DECLARING
Water Rates Adjustments Phase 2
 Water Rates Adjustments Phase 2 Presented by Shana E. Epstein Director of Public Works, City of Beverly Hills Background Phase 1-Effective January 18, 2018 5-year revenue requirement 3% annual increase
LONG BEACH WATER DEPARTMENT COST OF SERVICE AND RATE STUDY
 LONG BEACH WATER DEPARTMENT COST OF SERVICE AND RATE STUDY Final Report / February 1, 2017 445 S. Figueroa Street Suite 2270 Los Angeles, CA 90071 Phone Fax 213. 262. 9300 213. 262. 9303 www.raftelis.com
CITY OF REDLANDS WATER AND WASTEWATER RATE STUDY. Prepared by:
 CITY OF REDLANDS WATER AND WASTEWATER RATE STUDY Prepared by: August 30, 2010 201 S. Lake Blvd, Suite 301 Pasadena CA 91101 Phone Fax 626 583 1894 626 583 1411 www.raftelis.com August 30, 2010 Mr. Chris
Final COST OF SERVICE STUDY SEPTEMBER City of San Clemente
 Final COST OF SERVICE STUDY SEPTEMBER 2017 City of San Clemente Contents CONTENTS Executive Summary... 1 Study Goals and Drivers... 1 Water Rate Analysis & Adoption... 2 Recycled Water Rate Analysis &
TOWN OF ORO VALLEY WATER UTILITY COMMISSION WATER RATES ANALYSIS REPORT OCTOBER 7, 2009
 TOWN OF ORO VALLEY WATER UTILITY COMMISSION WATER RATES ANALYSIS REPORT OCTOBER 7, 2009 EXECUTIVE SUMMARY The functions and duties of the Oro Valley Water Utility Commission include reviewing and developing
Sewer Rate Study July 2016
 July 2016 Prepared By The Finance Division TABLE OF CONTENTS SECTION 1: EXECUTIVE SUMMARY... 1 1.1 Background... 1 1.2 Purpose... 1 1.3 Current Sewer Rates... 1 1.4 Five Year Financial Projection... 1
Sanitation Rate Study Final Report
 Sanitation Rate Study Final Report City of Simi Valley April 24, 2015 Prepared by: Page 1 201 S. Lake Avenue Suite 301 Pasadena, CA 91101 Phone 626.583.1894 Fax 626.583.1411 www.raftelis.com April 24,
SANTA FE IRRIGATION DISTRICT
 SANTA FE IRRIGATION DISTRICT Water Rate Study FINAL Report/March 2016 445 S Figueroa Street Suite 2270 Los Angeles, CA 90071 Phone 213 262 9300 Fax 213 262 9303 www.raftelis.com March 21, 2016 Ms. Jeanne
Study Workshops are designed to be both educational and to seek broad direction from the Board
 Study Workshops are designed to be both educational and to seek broad direction from the Board Workshop #1 Financial Forecast & Cost of Service Water, recycled water, & sewer services Revenue requirement
July 1, Tier Percent of Allocation Cost per ccf $0.91 $1.27 $2.86 $4.80 $ % % % % 201+%
 1 CHART EXAMPLES OF WATER RATES AND CHARGES OF MWD MEMBER AGENCIES AND THEIR SUBAGENCIES MWD Member Agencies shown: MWDOC, SDCWA, Calleguas, Las Virgenes, West Basin, LADWP, Eastern and Foothill Member
Alameda County Water District. Financial Workshop Proposed Rates & Charges
 Alameda County Water District Financial Workshop Proposed Rates & Charges Month, October Day, Year 25, 2018 Presentation Overview Review Financial Workshops Timeline Proposed Development Charges Financial
Water and Wastewater Utility Rates
 Water and Wastewater Utility Rates March 1, 2016 Presented By: Diana Langley Public Works Director 1 OVERVIEW 2 Uses of Funds Capital Investment Debt Service Operating Cost = Revenue Requirement 3 Source
NALDRAFT SEPTEMBER2015 WASTEWATE
 FI NALDRAFT SEPTEMBER2015 Cos tof S e r v i c e s S T UDY WATE R WASTEWATE R RE CY CL E DWATE R ST ORMWATE R E NVI RONME NT ALRE SOURCE S CITY OF OXNARD PUBLIC WORKS INTEGRATED MASTER PLAN COST OF SERVICE
WATER VALIDATION, COST OF SERVICE & RATE DESIGN ANALYSIS WASTEWATER VALIDATION & RATE ANALYSIS MISCELLANEOUS FEES & OVERHEAD RATE ANALYSIS
 WATER VALIDATION, COST OF SERVICE & RATE DESIGN ANALYSIS WASTEWATER VALIDATION & RATE ANALYSIS MISCELLANEOUS FEES & OVERHEAD RATE ANALYSIS B&V PROJECT NO. 179801.0100 PREPARED FOR Vallecitos Water District,
STAFF REPORT. ITEM NO. 4 MEETING DATE: March 7, 2017 MEETING: Board of Directors SUBJECT:
 ITEM NO. 4 MEETING DATE: MEETING: Board of Directors STAFF REPORT SUBJECT: SUBMITTED BY: RECOMMENDED ACTION: Proposition 218 Customer Notification of Proposed Rate Increases Krishna Kumar, General Manager
Rainbow Municipal Water District
 Rainbow Municipal Water District Potable Water Cost of Service Study November 10, 2015 201 S Lake Ave. Suite 301 Pasadena CA 91101 Phone 626.583.1894 Fax 626.583.1411 www.raftelis.com November 10, 2015
2016 Water and Recycled Water Rate Study PUBLIC HEARING DECEMBER 12, 2016
 2016 Water and Recycled Water Rate Study PUBLIC HEARING DECEMBER 12, 2016 Agenda Rate Study Overview Financial Plan Water Rate Design Recycled Water Rate Design Drought Rates Capacity Fees 12/12/2016 Public
Revenue Plan. August 12, Dennis Davies Deputy Director of Public Works 200 Civic Center Way El Cajon, CA 92020
 1925 Palomar Oaks Way, Suite 3 Carlsbad, California 928 tel: 76 438 7755 fax: 76 438 7411 Dennis Davies Deputy Director of Public Works 2 Civic Center Way El Cajon, CA 922 Subject: Six Year Revenue Plan
ES.1 Findings and Recommendations... ES Overview Current Rates Rate Making Objectives
 Table of Contents Executive Summary ES.1 Findings and Recommendations... ES-1 Chapter 1. Introduction 1.1 Overview... 1-1 1.2 Current Rates... 1-1 1.3 Rate Making Objectives... 1-1 Chapter 2. Revenue Requirement
City of Arroyo Grande Department of Public Works REQUEST FOR PROPOSAL WATER AND WASTEWATER RATE STUDY UPDATE
 I. INTRODUCTION City of Arroyo Grande Department of Public Works REQUEST FOR PROPOSAL WATER AND WASTEWATER RATE STUDY UPDATE The City of Arroyo Grande, California (the City ) was incorporated as a general
Big Bend Water District Rates and Rules Citizens Advisory Committee WORKING DRAFT - FOR REVIEW ONLY 2017 RECOMMENDATIONS REPORT
 Big Bend Water District Rates and Rules Citizens Advisory Committee WORKING DRAFT - FOR REVIEW ONLY 2017 RECOMMENDATIONS REPORT BIG BEND WATER DISTRICT Rates and Rules Citizens Advisory Committee Table
YORK COUNTY, SOUTH CAROLINA
 YORK COUNTY, SOUTH CAROLINA Water and Sewer Financial Planning and Rate Study Report October 25, 2017 1031 S. Caldwell Street Suite 100 Charlotte, NC 28203 Phone 704.373.1199 Fax 704.373.1113 www.raftelis.com
Goleta Water District
 201 S Lake Ave. Suite 301 Pasadena CA 91101 Phone 626 583 1894 www.raftelis.com Water Rates and Cost of Service Study Final Report / June 11, 2015 Water Cost of Service & Rate Study Report 2015 201 S Lake
2016 Water and Recycled Water Rate Study WEBINAR WITH DISTRICT STAFF JUNE 29, 2016
 2016 Water and Recycled Water Rate Study WEBINAR WITH DISTRICT STAFF JUNE 29, 2016 Agenda Financial Policy & Financial Plan Capacity Fees Preliminary Results Tier Definitions Next Steps 2016 Water & RW
Table 2-2 Projected Water Production and Costs
 Table 2-2 Projected Water Production and Costs Recorded Estimated Budget Forecast Description FY 2007-08 FY 2008-09 FY 2009-10 FY 2010-11 FY 2011-12 FY 2012-13 FY 2013-14 Well Production (OCWD, A-F, a)
SAN ANTONIO WATER SYSTEM (SAWS) RATE ADVISORY COMMITTEE: MEETING 3
 RATE ADVISORY COMMITTEE: MEETING 3") 01 April, 2014 SAN ANTONIO WATER SYSTEM (SAWS) RATE ADVISORY COMMITTEE: MEETING 3 Bill Zieburtz Richard Campbell Robert Chambers RATE SETTING PROCESS STUDY APPROACH RATE SETTING OBJECTIVES FINANCIAL PLAN
01 April, 2014 SAN ANTONIO WATER SYSTEM (SAWS) RATE ADVISORY COMMITTEE: MEETING 3 Bill Zieburtz Richard Campbell Robert Chambers RATE SETTING PROCESS STUDY APPROACH RATE SETTING OBJECTIVES FINANCIAL PLAN
GOLETA SANITARY DISTRICT BUDGET FISCAL YEAR
 GOLETA SANITARY DISTRICT BUDGET FISCAL YEAR 2014-15 BUDGET FOR FISCAL YEAR 2014-2015 Approved by the Governing Board Special Board Meeting June 13, 2014 MEMORANDUM TO: FROM: Members of the Governing Board
CITY OF ANAHEIM WATER UTILITY FUND. Financial Statements. June 30, 2014 and (With Independent Auditors Report Thereon)
") Financial Statements (With Independent Auditors Report Thereon) Table of Contents Page Independent Auditors Report 1 Management s Discussion and Analysis (Unaudited) 3 Financial Statements: Statements
Financial Statements (With Independent Auditors Report Thereon) Table of Contents Page Independent Auditors Report 1 Management s Discussion and Analysis (Unaudited) 3 Financial Statements: Statements
RUNNING SPRINGS WATER DISTRICT ANNUAL FINANCIAL REPORT. Years Ended June 30, 2018 and 2017
 RUNNING SPRINGS WATER DISTRICT ANNUAL FINANCIAL REPORT Years Ended June 30, 2018 and 2017 Running Springs Water District Annual Financial Report Years Ended June 30, 2018 and 2017 I. INTRODUCTORY SECTION
1. Accept staff report on the updated study of cost of service to provide potable water to San Jose Municipal Water System (SJMWS) customers; and
 customers; and") CITY OF Cr SAN IPSE CAPITAL OF SILICON VALLEY TO: HONORABLE MAYOR AND CITY COUNCIL SUBJECT: MUNICIPAL WATER SYSTEM COST OF SERVICE STUDY COUNCIL AGENDA: 05/09/17 ITEM: 7.2 Memorandum FROM: Kerrie Romanow
CITY OF Cr SAN IPSE CAPITAL OF SILICON VALLEY TO: HONORABLE MAYOR AND CITY COUNCIL SUBJECT: MUNICIPAL WATER SYSTEM COST OF SERVICE STUDY COUNCIL AGENDA: 05/09/17 ITEM: 7.2 Memorandum FROM: Kerrie Romanow
City of La Palma Agenda Item No. 5
 City of La Palma Agenda Item No. 5 MEETING DATE: January 19, 2016 TO: FROM: SUBMITTED BY: CITY COUNCIL CITY MANAGER Mike Belknap, Community Services Director AGENDA TITLE: Adopt a Resolution Approving
COUNTY SANITATION. DISTRICTS OF LOS ANGELES COUNTY
 COUNTY SANITATION. DISTRICTS OF LOS ANGELES COUNTY 1955 Workman Mill Road, Whittier, CA 90601-1400 Mailing Address: P.O. Box 4998, Whittier, CA 90607-4998 Telephone: (562) 699-7411, FAX: (562) 699-5422
Rate Structure Administrative Procedures Handbook FY 2017/18
 FY 2017/18 Page i Table of Contents 1 OVERVIEW... 1 2 RATE STRUCTURE AT-A-GLANCE... 2 2.1 CURRENT RATES... 2 2.2 TWO-YEAR RATE CYCLE & BILLING CYCLE MILESTONES... 3 2.3 WATER SERVICES AND PROGRAMS AND
CITY OF SANTA CRUZ WATER DEPARTMENT LONG RANGE FINANCIAL PLAN
 CITY OF SANTA CRUZ WATER DEPARTMENT LONG RANGE FINANCIAL PLAN JUNE 2016 1 LONG RANGE FINANCIAL PLAN TABLE OF CONTENTS Table of Contents... 2 Executive Summary... 4 1. Introduction... 6 2. Background...
Rate Structure Administrative Procedures Handbook FY 2018/19
 FY 2018/19 Page i Table of Contents 1 OVERVIEW... 1 2 RATE STRUCTURE AT-A-GLANCE... 2 2.1 CURRENT RATES... 2 2.2 TWO-YEAR RATE CYCLE & BILLING CYCLE MILESTONES... 3 2.3 WATER SERVICES AND PROGRAMS AND
SANTA MONICA RENT CONTROL BOARD ADMINISTRATION MEMORANDUM
 SANTA MONICA RENT CONTROL BOARD ADMINISTRATION MEMORANDUM DATE: May 10, 2005 TO: FROM: Santa Monica Rent Control Board Mary Ann Yurkonis, Administrator FOR MEETING OF: May 12, 2005 RE: Annual General Adjustment
VENTURA COUNTY WATERWORKS DISTRICTS Representing: Ventura County Waterworks Districts No. 1, 16, 17 & 19
 VENTURA COUNTY WATERWORKS DISTRICTS Representing: Ventura County Waterworks Districts No. 1, 16, 17 & 19 Board of Ventura County Waterworks District No. 1 800 S. Victoria Avenue Ventura, CA 93009 Subject:
Marina Coast Water District Marina, California
 Marina Coast Water District Marina, California Comprehensive Annual Financial Report For The Fiscal Years Ended June 30, 2014 and 2013 11 Reservation Road, Marina California 93933 Marina Coast Water District
Wastewater Rate Study. Villa Park, Illinois
 Wastewater Rate Study Villa Park, Illinois June 2013 Executive Summary General The Village of Villa Park s Wastewater Utility is responsible for operation and maintenance of the Village s separate sanitary
Regional Wastewater System Financial Assessment Technical Memorandum
 Regional Wastewater System Financial Assessment Technical Memorandum To: From: CC: Project: Subject: Sarpy County Tom Gould - HDR David Dechant HDR Judy Dean HDR Joe Roberts HDR File Southern Sarpy County
WATER UTILITY FINANCIAL PLAN AND RATE STUDY CITY OF WHITEFISH, MT MARCH 2016
 WATER UTILITY FINANCIAL PLAN AND RATE STUDY CITY OF WHITEFISH, MT MARCH 2016 The Financial Link Executive Summary - Water In May 2015, the City of Whitefish (City) retained AE2S to complete a Water and
Richard Pearson, Community Development Director Tim Tucker, City Engineer
 CITY OF MARTINEZ CITY COUNCIL AGENDA February 21, 2007 TO: FROM: PREPARED BY: SUBJECT: Mayor and City Council Don Blubaugh, City Manager Richard Pearson, Community Development Director Tim Tucker, City
CITY OF ANN ARBOR WATER & SEWER COST OF SERVICE STUDY
 1 CITY OF ANN ARBOR WATER & SEWER COST OF SERVICE STUDY 12.20.2017 Overview 1. Sufficiency 2. Rate Classification 3. to Serve 4. Rate Structures 5. Customer Impacts 6. Affordability Program Foundation
Marina Coast Water District Marina, California
 Marina Coast Water District Marina, California Comprehensive Annual Financial Report For The Fiscal Year Ended June 30, 2011 11 Reservation Road, Marina California 93933 Marina Coast Water District Marina,
Third Quarter Financial Report Fiscal Year and. Mid-Term Budget Update - Fiscal Year June 15, 2015
 Third Quarter Financial Report Fiscal Year 2014-15 and Mid-Term Budget Update - Fiscal Year 2015-16 June 15, 2015 1 Overview Economic Environment Fiscal Year 2014-2015 Third Quarter Financial Report Fiscal
Squaw Valley PSD. Water & Sewer Rate and Connection Fee Study. Presented by: Shawn Koorn Associate Vice President HDR Engineering, Inc.
 Squaw Valley PSD Water & Sewer Rate and Connection Fee Study February 15, 2017 Presented by: Shawn Koorn Associate Vice President HDR Engineering, Inc. Purpose of the District s Study Provide sufficient
Semitropic Water Storage District. Combined Financial Statements. December 31, 2010 and 2009
 Semitropic Water Storage District Combined Financial Statements December 31, 2010 and 2009 C O N T E N T S Page(s) Independent Auditors Report 1 Management s Discussions and Analysis (Required Supplementary
Beaumont-Cherry Valley Water District 2018 Operating Budget
 Beaumont-Cherry Valley Water District 2018 Operating Budget Table of Contents Introduction Section... 1 Executive Summary... 2 Background... 4 Organization... 5 Basis of Budgeting and Accounting... 6 Budget
CASH RESERVE POLICY ADOPTED BY THE BOARD OF DIRECTORS ON DECEMBER 8, 2016
 RANCHO CALIFORNIA WATER DISTRICT 42135 WINCHESTER ROAD/BOX 9017 TEMECULA, CA 92589-9017 CASH RESERVE POLICY ADOPTED BY THE BOARD OF DIRECTORS ON DECEMBER 8, 2016 TABLE OF CONTENTS I. BACKGROUND AND INTRODUCTION...
Water Rates Rate Restructure and Rate Adjustments
 Water Rates Rate Restructure and Rate Adjustments Community Outreach Meeting Questions We Will Address Why are water rates changing? Where does the water come from? Did the rain from last winter help?
Glacial Lakes Sanitary Sewer & Water District Utility Rate Study. Shelly Eldridge Ehlers Jeanne Vogt - Ehlers
 Glacial Lakes Sanitary Sewer & Water District Utility Rate Study Shelly Eldridge Ehlers Jeanne Vogt - Ehlers 05/30/2017 1 Background What are Utility Funds Utility funds are used to pay for operations,
3.1. Construction Meter Additional Charges for Temporary Meters OTHER FEES, CHARGES, AND DEPOSITS CAPACITY FEES...
 Table of Contents 1. CHARGES FOR WATER SERVICE... 3 1.1. Metered Service:... 3 1.2. Water Commodity Charge:... 3 1.3. SDCWA and Metropolitan Water District (MWD) Charges:... 4 1.4. Separate Private Fire
STEGE SANITARY DISTRICT FINANCIAL PLAN AND RATE REVIEW
 STEGE SANITARY DISTRICT FINANCIAL PLAN AND RATE REVIEW June 2014 BARTLE WELLS ASSOCIATES Independent Public Finance Advisors 1889 Alcatraz Avenue Berkeley CA 94703 Tel. 510/653-3399 TABLE OF CONTENTS
INLAND EMPIRE UTILITIES AGENCY RESERVE POLICY Updated as of May 2014 Policy Statement. Purpose of Fund Reserve Policy
 INLAND EMPIRE UTILITIES AGENCY RESERVE POLICY Updated as of May 2014 Policy Statement The Inland Empire Utilities Agency (Agency or IEUA) has historically maintained fund reserves to ensure sufficient
Through: Finance, Legal, and Administration Committee (3/11/15) Chief Financial Officer/Assistant General Manager
 Chief Financial Officer/Assistant General Manager") Date: To: The Honorable Board of Directors Through: Finance, Legal, and Administration Committee (3/11/15) From: Submitted by: P. Joseph Grindstaff General Manager Christina Valencia Chief Financial Officer/Assistant
Date: To: The Honorable Board of Directors Through: Finance, Legal, and Administration Committee (3/11/15) From: Submitted by: P. Joseph Grindstaff General Manager Christina Valencia Chief Financial Officer/Assistant
Capital Region Water. Water and Wastewater Rate Study Report. November 22, Capital Region Water Water and Wastewater Rate Study
 Capital Region Water Water and Wastewater Rate Study Report November 22, 2017 Capital Region Water Water and Wastewater Rate Study TABLE OF CONTENTS 1. INTRODUCTION...1 1.1 RATE STUDY SCOPE AND OBJECTIVES...1
City of Cocoa FY 2010 Utility Rate Study. Final Report. Water, Sewer & Reclaimed Water Rates, Fees & Charges Study. Prepared by:
 p FY 2010 Utility Rate Study Water, Sewer & Reclaimed Water Rates, Fees & Charges Study June 29, 2010 Prepared by: June 29, 2010 W.E. Mack Finance Director 65 Stone Street Cocoa, FL 32922 Re: FY 2010
Sewer Rate Study CRESCENT CITY CALIFORNIA
 CRESCENT CITY CALIFORNIA Sewer Rate Study 27368 Via Industria, Suite 110, Temecula, California 925904856 T 951.587.3500 800.755.6864 F 888.326.6864 www.willdan.com Mr. Eugene Palazzo City Manager City
FINANCIAL PLAN REVIEW AND FORECAST
 Napa Sanitation District Cost of Service Rate and Capacity Charge Study Technical Memorandum #2 FINANCIAL PLAN REVIEW AND FORECAST DRAFT March 2018 Contents 1 Introduction 1 1.1 Project Background 1 1.1.1
Utility Rate Public Hearing City Council Meeting
 Utility Rate Public Hearing City Council Meeting January 19, 2016 1 Utility Services Recommendation 1. Adopt utility financial policy resolution 2. Provide direction on ratepayer assistance program 3.
WATER, WASTEWATER, STORMWATER, AND MUNICIPAL SOLID WASTE COST OF SERVICE AND RATE DESIGN STUDY
 REPORT January 2017 WATER, WASTEWATER, STORMWATER, AND MUNICIPAL SOLID WASTE COST OF SERVICE AND RATE DESIGN STUDY PREPARED BY: ECONOMICS STRATEGY STAKEHOLDERS SUSTAINABILITY www.newgenstrategies.net 3420
Utility Rates. October 13, 2015
 Utility Rates October 13, 2015 Agenda Summary Process Background Policy Rates Next Steps 2 Financial Needs Driving Rates 1. Bond coverage 2. Reserves Policy 3. Infrastructure - Asset management 3 Rate
Big Chino Water Ranch Project Impact Analysis Prescott & Prescott Valley, Arizona
 Big Chino Water Ranch Project Impact Analysis Prescott & Prescott Valley, Arizona Prepared for: Central Arizona Partnership August 2008 Prepared by: 7505 East 6 th Avenue, Suite 100 Scottsdale, Arizona
Agenda Rio Linda / Elverta Community Water District Planning Committee
 Agenda Rio Linda / Elverta Community Water District Planning Committee Sacramento Metro Fire Dept. Friday, February 5, 2015 6609 Rio Linda Blvd. 2:00 pm Rio Linda, CA 95673 Public documents relating to
Meeting & Outreach efforts
 May 30, 2014 Meeting & Outreach efforts February 27th Proposed Compensation Plan Distributed to Joint Admin/WWOC March 5th Joint Admin/WWOC Meeting First discussion on proposed Compensation Plan April
TEN YEAR FINANCIAL FORECAST
 TEN YEAR FINANCIAL FORECAST The ability to ensure a reliable supply of high quality water for Metropolitan s 26 member agencies depends on Metropolitan s ongoing ability to fund operations and maintenance,
Final Report COMPREHENSIVE WATER AND WASTEWATER COST OF SERVICE AND RATE STUDY
 Final Report COMPREHENSIVE WATER AND WASTEWATER COST OF SERVICE AND RATE STUDY Phase 2 Cost of Service and Rate Design BLACK & VEATCH PROJECT NO. 192366 Black & Veatch Holding Company 2017. All rights
Joshua Basin Water District. Annual Financial Report
 Annual Financial Report Board of Directors as of June 30, 2018 Elected/ Current Name Title Appointed Term Mickey Luckman President Elected 12/16-12/20 Robert Johnson Vice President Elected 12/16-12/20
Town of Yountville Wastewater Rate Study Update 2017/18
 Town of Yountville Wastewater Rate Study Update 2017/18 Draft Report 11/22/2017 BARTLE WELLS ASSOCIATES Independent Public Finance Advisors Town of Yountville: Wastewater Rate Study Executive Summary Bartle
Sonoma County Service Area #41(CSA #41) Water Rate Study
 Water Rate Study") Sonoma County Service Area #41(CSA #41) Water Rate Study September 13, 2016 Prepared by Greg Clumpner, Director, NBS Carmen Narayanan, Consultant, NBS 1 CSA #41 Zones of Benefit 2 Overview of Presentation
Sonoma County Service Area #41(CSA #41) Water Rate Study September 13, 2016 Prepared by Greg Clumpner, Director, NBS Carmen Narayanan, Consultant, NBS 1 CSA #41 Zones of Benefit 2 Overview of Presentation
INDIAN WELLS VALLEY WATER DISTRICT REQUEST FOR PROPOSAL WATER RATE STUDY
 I. PURPOSE INDIAN WELLS VALLEY WATER DISTRICT REQUEST FOR PROPOSAL WATER RATE STUDY The Indian Wells Valley Water District ( District ) is accepting Competitive Sealed Proposals for a cost of service and
2017 WATER, RECYCLED WATER, AND WASTEWATER RATE STUDY REPORT
 2017 WATER, RECYCLED WATER, AND WASTEWATER RATE STUDY REPORT Rancho California Water District [Type here] Table of Contents 1 Introduction... 5 1.1 About Rancho California Water District... 5 1.2 Background