Chapter 7: RECEIVABLES MANAGEMENT CHAPTER 7 RECEIVABLES MANAGEMENT
|
|
|
- Tobias Garrison
- 5 years ago
- Views:
Transcription
1 CHAPTER 7 RECEIVABLES MANAGEMENT 145
2 Trade Credit is a prominent and all pervasive force in the present day competitive industrial environment. This is because, it is highly difficult to a manufacturer to pay cash across the counter, whatever be his liquidity in meeting the debts. In the words of Pandey 1, A firm is said to have granted trade credit when it sells its products or services and does not receive cash immediately. Trade credit is an essential marketing tool which acts as a bridge for the movement of goods from the stage of production to distribution. It acts as a device to protect firm s sales from its competitors and also attracts potential customer, who otherwise finds it difficult to make cash purchases. Trade credit creates receivables, which the firm is expected to collect in the near future. Thus, the book debt or receivables, arising out of credit has three dimensions 2. First, it embraces an element of risk which needs to be assessed, since cash sales are totally riskless. Second, it is based on economic values. To the buyer, the economic value in goods or services is passed on immediately at the time of sale while the seller expects an equivalent value to be received at a later date. Third, it implies futurity. The payment for value received, arises at a future date. But, creation of receivables block the firm s funds for the period between the date of sale and the date of receipt of payment which is to be financed out of working capital funds. This necessitates the firm to arrange funds from banks and other sources. Thus, receivables represent investment, which constitutes a substantial portion of current assets of manufacturing firm. Thus, it needs careful analysis and proper management. Receivables, in the strict accounting sense, include (i) book debts or accounts, (ii) notes and bills and (iii) accrued receivables only. However, in broader sense, the term receivables is used to include further (iv) any pre-payment made against purchase and expenses contract and (v) advance to subsidiaries, employees and officers 3. The quantum of book debts depends upon the volume of credit sales and collection policy. The greater the volume of credit sales and larger the credit period allowed, the more is the investment in trade debtors. Sometimes, the customers, at the time of credit sales, may be asked to sign notes or bills promising therein to pay a specified date the amount extended to them as credit. Again, sale of durable goods on hire purchase basis gives rise to accrued receivables for those installments that 146
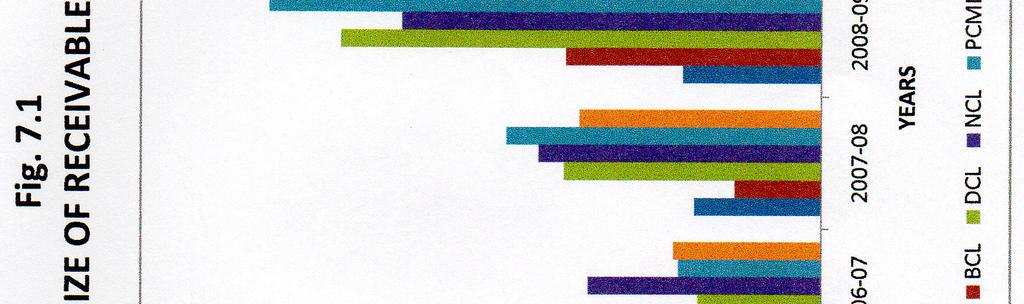
3 become due for payment. Pre-payment arise when payment is made in advance of receipt of goods and services. As pre-payments represent items to be consumed during the course of business, it is different from typical receivables. Insurance premium, rent, etc., are pre-payments of this nature. Pre-paid tax is also considered an asset as it chargeable to a later period. and loans to employees and officers of the company are also current assets. They are, however, good assets only to the extent that the responsibility of the employees or the officers can be relied upon. In the present chapter, the term receivables has been used in its broader sense, that is, to include trade debtors and loans and advances in its purview. In order to evaluate the performance of receivables management in select cement companies, an attempt has been made to analyze the size, composition and efficiency of receivables during the study period. SIZE OF RECEIVABLES This analysis is intended to know the size of receivables in select cement companies. This is done in two stages. In the first stage, the absolute size of receivables, its growth was analyzed and in the second stage, the size of receivables has been studied in relation to other important elements such as total assets, current assets, sales, etc., so as to know its relative importance of receivables in select cement companies. The size of receivables in select cement companies has been presented in the table 7.1. This table reveals that the size of receivables has been on the increase in the industry during the study period. It increased from Rs crore in to Rs crore in registering a base year growth rate of per cent. In select units, the size of receivables varied from one undertaking to another, but has been showing an increasing trend in all select units. The highest rate of growth was registered in APCL ( per cent), where it increased from Rs crore in to Rs crore in The lowest rate of growth was registered in DCL (11.87 per cent) where it showed a fluctuating trend (between Rs crore and Rs crore). In BCL, NCL, PCMIL and SCL, it increased from Rs crore, Rs crore, 147
4 TABLE - 7.1: SIZE AND TREND OF RECEIVABLES IN SELECT CEMENT COMPANIES (Rs.in crore) Year APCL BCL DCL NCL PCMIL SCL Average (100) 7.78 (90.26) (123.78) (220.30) (313.92) (343.74) (491.42) (621.81) (900.58) (982.48) 7.29 (100) 8.95 (122.77) (160.63) (194.10) (254.18) (749.38) (462.00) (530.73) (785.05) (775.31) (100) (79.74) (102.80) (129.44) (270.26) (504.51) (205.05) (280.96) (140.19) (111.87) (100) (103.60) (158.47) (249.28) (302.20) (448.28) (465.02) (577.31) (476.76) (313.89) Notes: Figures in brackets indicate base year growth. Source: Annual Reports of Select Cement Companies (100) (76.92) 4.56 (22.34) (149.68) (330.08) (579.13) (622.24) (608.13) (579.23) (469.72) (100) (140.12) (96.53) (185.53) (304.18) (425.59) (500.88) (662.41) (543.71) (555.65) (100) (99.49) (102.43) (182.97) (298.98) (498.66) (451.41) (535.40) (500.96) (445.13) 148


5 Chapter 7: RECEIVABLES MANAGEMENT 149
6 Rs crore and Rs. 17 crore in to Rs crore, Rs crore, Rs crore and Rs crore in registering per cent, per cent, per cent and per cent growth rate respectively. The net sales are high in size than that of receivables in all select units during the entire study period. But, the progressive growth rate of receivables was more than that of sales in APCL, BCL and SCL, and less in DCL, NCL and PCMIL on an average, which has revealed by the table 7.2. The analysis revealed that the size of receivables is showing an increasing trend in select cement companies irrespective of trend in sales. Increased receivables in select units were unjustifiable and indicate bad financial planning. On the whole, it said the size and growth of receivables had been high in select cement companies. However, in a competitive industry like cement, the size of receivables has a positive relationship with the growth. Thus, no conclusions about the size of receivables can be drawn unless it is related to some important parameters. Hence, the size of receivables has been related to total assets, current assets and sales. For this purpose, the ratios of receivables to total assets, receivables to current assets and receivables to sales have been calculated and presented in the tables 7.3, 7.4 and 7.5. The ratio of receivables to total assets (table 7.3) has fluctuated between per cent and per cent and on an average it was per cent in the industry during the study period. 150
7 TABLE - 7.2: PROGRESSIVE BASE YEAR GROWTH RATE OF RECEIVABLES AND SALES IN SELECT CEMENT COMPANIES (In percentage) Year Component APCL BCL DCL NCL PCMIL SCL Average Receivables Sales Receivables Sales Receivables Sales Receivables Sales Receivables Sales Receivables Sales Receivables Sales Receivables Sales Receivables Sales Receivables Sales Receivables Sales Source: Annual Reports of Select Cement Companies. In select units, it has been showing an increasing trend in APCL and PCMIL as against decreasing trend in DCL, NCL and SCL and fluctuating trend in BCL during the study period. On an average, it was 19 per cent in APCL, per cent in BCL, per cent in DCL, per cent in NCL, per cent in PCMIL and per cent in SCL. The mean values of DCL and NCL varied significantly from that of industry at 1 per cent level. Increasing trend in this ratio in APCL and PCMIL, in spite of increase in the size of fixed assets, only indicates their inefficiency in controlling the size of receivables. Low level of receivables in DCL, NCL and SCL is 151
8 due to increase in the size of fixed assets during the study period. Fluctuating trend in this ratio in BCL is the result of fluctuations in fixed assets of it. The ratio of receivables to current assets (7.4) reveals that the proportion of receivables in current assets has been showing decreasing trend in the industry. It decreased from per cent in to per cent in and on an average it was per cent during the study period. In select units, this ratio has been showing decreasing trend in BCL, DCL, NCL and SCL. In APCL and PCMIL it has showed increasing trend. The average ratio was per cent in APCL, per cent in BCL, per cent in DCL, per cent in NCL, per cent in PCMIL and per cent in SCL. The mean values of PCMIL at 1 per cent level and of DCL and NCL at 5 per cent level varied significantly from that of industry. Thus, in select units the proportion of receivables in current assets is considerable and effective measures are required in this regard to improve the receivables management. TABLE - 7.3: RATIO OF RECEIVABLES TO TOTAL ASSETS IN SELECT CEMENT COMPANIES (In percentage) Year APCL BCL DCL NCL PCMIL SCL Average C.V t * -4.63* 3.25** -1.5 *significant at 1 per cent level. **significant at 5 per cent level. Source: Annual Reports of select cement Companies. 152
9 TABLE - 7.4: RATIO OF RECEIVABLES TO CURRENT ASSETS IN SELECT CEMENT COMPANIES (In percentage) Year APCL BCL DCL NCL PCMIL SCL Average C.V t 3.15** ** -2.3** 6.11* 0.91 *significant at 1 per cent level. **significant at 5 per cent level. Source: Annual Reports of Select Cement Companies. The table 7.5 presents the ratio of receivables to sales in select cement companies. This ratio has been calculated to know whether the select units have utilized the investment in receivables efficiently or not. If this ratio is low and decreasing, it is a sign of effective utilization of investment in receivables and vice versa. The ratio has been showing increasing trend in the industry (from per cent in to per cent in ) and registered an average of 27 per cent during the study period. In select units, APCL, BCL and PCMIL have been showing an increasing trend as against decreasing trend in DCL, NCL and SCL during the study period. On an average, it was per cent in APCL, per cent in BCL, per cent in DCL, per cent in NCL, per cent in PCMIL and per cent in SCL. The mean values of DCL and PCMIL varied significantly from that of industry at 1 153
10 per cent level. This indicates better utilization of investment in receivables in DCL, NCL and SCL. It follows from the above observations that the size of receivables has been high in select units because of lack of proper receivables management. It is especially true in case of APCL, BCL and PCMIL. TABLE - 7.5: RATIO OF RECEIVABLES TO SALES IN SELECT CEMENT COMPANIES (In percentage) Year APCL BCL DCL NCL PCMIL SCL Average C.V t -3.53* 2.74** -3.59* -2.87** 3.75* -8.89* *significant at 1 per cent level. **significant at 5 per cent level. Source: Annual Reports of Select Cement Companies. COMPOSITION OF RECEIVABLS A vital tool for evaluating the management of receivables is study of their composition. It helps to reveal the point where receivables concentrated most. Receivables in any organization comprise the total of sundry debtors and loans and advances. It is desirable to keep minimum investment in loans and advances because 154
11 to that extent firm s funds are blocked up which would have been otherwise used profitably. In other words, investment in loans and advances has high opportunity cost. Investment in debtors, on the other hand, is inevitable in the competitive environment. Further, increasing investment in debtors may increase the sales which in turn may increase profit. The table 7.6 shows the composition of receivables in select cement companies which reveals that first two years of the study period i.e., and , the proportion of sundry debtors dominated the total receivables and later on loans and advances predominated the structure of receivables in the industry. On an average, the proportion of debtors was per cent and loans and advances was per cent in the industry. In select units, the proportion of loans and advances dominated the receivables structure in four units i.e., APCL, DCL, PCMIL and SCL and the proportion of sundry debtors dominated the receivables structure in remaining two units i.e., BCL and NCL. In APCL debtors dominated in first three years with an average of per cent and loans and advances dominated in seven years with an average of per cent. In BCL debtors dominated in eight years with an average of per cent and loans and advances dominated in two years with an average of per cent. In DCL it was the loans and advances which dominated receivables structure throughout the study period. 155
12 TABLE - 7.6: COMPOSITION OF RECEIVABLES IN SELECT CEMENT COMPANIES (In percentage) Year Component APCL BCL DCL NCL PCMIL SCL Average C.V Source: Annual Reports of Select Cement Companies. 156
13 The average of this component was as high as per cent in DCL. The average proportion of sundry debtors was just per cent in DCL. In NCL, it is quite opposite in this regard. The proportion of sundry debtors dominated the receivables structure entire study period with an average of per cent and the average proportion of loans and advances was per cent. In PCMIL, sundry debtors dominated in first two years only with an average of per cent and loans and advances dominated in remaining eight years with an average of per cent. In SCL, sundry debtors dominated in four years with an average of 43 per cent and loans and advances dominated in six years with an average of 57 per cent. The composition analysis revealed that the structure of receivables was dominated by loans and advances in select cement companies during the study period. It indicates huge tie up of funds in various forms of loans and advances in select units. Within the loans and advances, the proportion of advances given for the acquisition of fixed assets, for supply of raw material s and stores and spares (table 7.7) has been high in select units. The advances given to employees and prepaid expenses were another element of total loans and advances, which contributed a very small portion of total loans and advances in select units (table 7.8). Among the various deposits, the proportion of deposits with various Government Agencies like excise, sales tax, electricity and other agencies, has constituted a significant portion of loans and advances in select units (table 7.9). To sum up, the composition of analysis revealed that while the proportion of debtors dominated the receivables structure in BCL and NCL; the loans and advances dominated in APCL, DCL, PCMIL and SCL. 157
14 TABLE - 7.7: PROPORTION OF ADVANCES TO SUPPLIERS OF RAW MATERIAL, STORES AND SPARES AND FIXED ASSETS TO TOTAL LOANS AND ADVANCES IN SELECT CEMENT COMPANIES (In Percentage) Year APCL BCL DCL NCL PCMIL SCL NA NA NA NA NA NA NA NA NA NA NA NA NA NA NA NA NA NA NA NA NA NA NA NA NA Source: Annual Reports of Select Cement Companies. TABLE - 7.8: PROPORTION OF ADVANCES TO EMPLOYEES AND PREPAID EXPENSES IN SELECT CEMENT COMPANIES (In Percentage) Year APCL BCL DCL NCL PCMIL SCL NA NA NA NA NA NA NA NA NA NA NA NA NA NA NA NA NA NA NA NA NA NA NA NA NA NA NA NA NA NA NA NA NA NA NA NA NA Source: Annual Reports of Select Cement Companies. 158
15 TABLE - 7.9: PROPORTION OF DEPOSITS WITH VARIOUS GOVT. AGENCIES TO TOTAL LOANS AND ADVANCES IN SELECT CEMENT COMPANIES (In Percentage) Year APCL BCL DCL NCL PCMIL SCL NA NA NA NA NA NA NA NA NA NA NA NA NA NA NA NA NA NA NA NA NA NA NA NA NA NA NA NA NA NA NA NA Source: Annual Reports of Select Cement Companies. ANALYSIS OF THE EFFICIENCY OF GRANTING CREDIT AND COLLECTING PAST DUE ACCOUNTS The preceding analysis clearly revealed that the receivables constituted a large portion of current assets. It is the first major component of current assets. Hence, it is important to efficiently manage this component of current assets to improve both liquidity and profitability. As already observed loans and advances and sundry debtors are the two major components of receivables, the share of which has varied among the select units. The performance of a unit can be considered as efficient, if it is successful in bringing down the investment in loans and advances and the same time improve its debtors turnover. In this section, the efficiency of the select cement companies in the management of debtors has been analyzed by calculating debtors turnover ratio and average collection period. Further, the aging schedule of debtors has been prepared to know the proportion of the debtors outstanding over six months in select units. 159
16 The debtors turnover ratio indicates the velocity of debt collection of firm. In simple words, it indicates the number of times average debtors are turned over during the year 4. Generally, the higher the value of debtors turnover the more efficient is the management of debtors/sales or more liquid are the debtors. Similarly, low debtors turnover implies inefficient management of debtors/sales and less liquid debtors. But, a precaution is needed while interpreting a very high debtors turnover ratio because a very high ratio may imply a firm s inability due to lack of resources to sell on credit thereby losing sales and profits. A more definite test of the efficiency of the accounts receivables management is the ratio to have by dividing the number of days in the year with the turnover of receivables, i.e., average collection period 5. This gives the time period taken by the firms in collecting the debts from their customers and shows the speed with which they were collected. A high and increasing collection period indicates the inefficiency of accounts receivables management and vice versa. The table 7.10 shows the debtors turnover ratio in select cement companies during the study period. This reveals that the debtors turnover ratio has fluctuated between times and 8.31 times in the industry and on average it was times. In select units, the ratio has been showing fluctuating trend during study period. It fluctuated between 2.87 times and times in different units during the study period. The average debtors turnover ratio was times in APCL, 5.29 times in BCL, times in DCL, 8.61 times in NCL, times in PCMIL and times in SCL. The mean values of DCL and BCL varied significantly from that of industry at 5 per cent level and at 1 per cent level respectively. The turnover of debtors revealed that the efficiency of DCL was better than other units during the study period. The same is reflected in the average collection period (table 7.11). This table reveals that the average collection period in DCL was lower than other units during the study period. The aging schedule is another useful management control device for review of the condition of accounts receivables. Aging schedule is also helpful to determine the liquidity of a concern. This involves tabulation of accounts receivables outstanding according to the length of time they have been outstanding. It also gives more 160
17 information than the collection period and very clearly spots the slow paying accounts receivables 6. The aging schedule of select cement companies has been presented in the table This table reveals that the share of debt outstanding below six months has fluctuated between per cent and per cent in the industry and on average it was per cent during the study period. The efficiency of APCL, BCL, DCL, NCL and SCL except PCMIL was high in this aspect. In PCMIL the situation is quite opposite from that of other units. The share of debt outstanding below six months in PCMIL has fluctuated between per cent and per cent and on average it was per cent during the study period which reveals inefficiency in this aspect. From this analysis it can be concluded that the efficiency of DCL was better than other units in managing the accounts receivables during the study period. APCL, BCL, NCL and SCL were satisfactory in this aspect and PCMIL was inefficient in this regard. TABLE : DEBTORS TURNOVER RATIO IN SELECT CEMENT COMPANIES (In no. of times) Year APCL BCL DCL NCL PCMIL SCL Average C.V t -9.38* * 2.39** * -7.11* *significant at 1 per cent level. **significant at 5 per cent level. Source: Annual Reports of Select Cement Companies. 161

18 Chapter 7: RECEIVABLES MANAGEMENT 162
19 TABLE : AVERAGE DEBT COLLECTION PERIOD IN SELECT CEMENT COMPANIES (In no. of days) Year APCL BCL DCL NCL PCMIL SCL Average C.V t -3.91* 4.73* * * *significant at 1 per cent level. Source: Annual Reports of Select Cement Companies. 163
20 TABLE : AGING SCHEDULE OF DEBTORS IN SELECT CEMENT COMPANIES (In percentage) Year Particulars APCL BCL DCL NCL PCMIL SCL Average bellow 6 months above 6 months bellow 6 months above 6 months bellow 6 months above 6 months bellow 6 months above 6 months bellow 6 months above 6 months bellow 6 months above 6 months bellow 6 months above 6 months bellow 6 months above 6 months bellow 6 months above 6 months bellow 6 months above 6 months bellow 6 months above 6 months Source: Annual Reports of Select Cement Companies. 164
21 RELATIONSHIP BETWEEN SALES AND RECEIVABLES Correlation and Regression Analysis: The correlation analysis has been undertaken to know the degree of relationship between sales and receivables in select cement companies. This is presented in the table This table reveals high degree of correlation between sales and receivables in the industry. In all select units, except DCL, also high degree of correlation existed between sales and receivables. In DCL, a low degree of correlation existed, which implies absence of clear cut credit policy. Based on the relationship between sales and receivables, a regression equation gas been calculated which can be used to forecast the size of receivables and thereby the future needs of funds for this component for a given volume of sales. The value of b was comparatively high in PCMIL, BCL, APCL and SCL which indicates high sensitivity of receivables to changes in sales. High value of a in DCL and NCL indicates their inability in reducing the size of receivables to that extent. Negative value of a in APCL and PCMIL indicates the extent to which these firms can reduce the size of receivables. TABLE : CORRELATION AND REGRESSION RESULTS FOR RECEIVABLES AND SALES Name of Regression equation r r 2 t values the unit Y = a + bx APCL Y = X BCL Y = X DCL Y = X NCL Y = X PCMIL Y = X SCL Y = X Average Y = X
22 Conclusions: The receivables constituted per cent of current assets, on an average, in the industry. The high ratio of receivables to sales in select units indicates that they have not succeeded in utilizing receivables as an effective tool for generating sales. It is especially true in case of APCL, BCL and PCMIL. Further, high proportion of loans and advances during the study period except first two years resulted in high opportunity cost as investment in this component will not directly contribute to sale or profitability. The efficiency of debtors management of select units, except DCL, was unfavorable. This was clearly reflected in their low debtors turnover ratio and the resultant high average collection period. However, one positive feature in the debtors management of select units, except PCMIL, is that their proportion of debts outstanding over six months was on lower side. 166
23 REFERENCES 1. M. Pandey, op.cit. p. 2. V.E. Ramamurthy Working Capital Management, Madras: institute of Financial Management and Research, 1976, p H.L. Verma, op. cit., pp B. Ramachandra Rao, op. cit., p. 167, 5. K V. Rao, op. cit., p P.K. Jain Management of Working Capital, Jaipur: PBSA Publishers, Jaipur, 1993, pp
WORKING CAPITAL ANALYSIS OF SELECT CEMENT COMPANIES IN INDIA
 CHAPTER - IV WORKING CAPITAL ANALYSIS OF SELECT CEMENT COMPANIES IN INDIA CHAPTER IV WORKING CAPITAL ANALYSIS OF SELECT CEMENT COMPANIES IN INDIA In this chapter an attempt has been made to analyse the
LIQUIDITY MANAGEMENT OF SELECT CEMENT COMPANIES OF ANDHRA PRADESH - (A COMPARATIVE STUDY)
") IMPACT: International Journal of Research in Business Management (IMPACT: IJRBM) ISSN (E): 2321-886X; ISSN (P): 2347-4572 Vol. 3, Issue 5, May2015, 31-42 Impact Journals LIQUIDITY MANAGEMENT OF SELECT
IMPACT: International Journal of Research in Business Management (IMPACT: IJRBM) ISSN (E): 2321-886X; ISSN (P): 2347-4572 Vol. 3, Issue 5, May2015, 31-42 Impact Journals LIQUIDITY MANAGEMENT OF SELECT
Liquidity and Profitability Analysis Chapter is divided into four parts. comprising of part I dealing with Liquidity Analysis divided into short-term
 163 5.1 INTRODUCTION Liquidity and Profitability Analysis Chapter is divided into four parts comprising of part I dealing with Liquidity Analysis divided into short-term and long-term. Part II deals with
ACTIVITY RATIO OF THE CEMENT COMPANIES
 ACTIVITY RATIO OF THE CEMENT COMPANIES CHAPTER V ACTIVITY PARAMETERS OF THE CEMENT COMPANIES 5.1. Introduction Having studied the short term and long term solvency of select units in earlier chapters,
US03FBCA01- Financial Accounting and Management. Liquidity ratios Leverage ratios Activity ratios Profitability ratios
 Unit 4 Ratio Analysis and Cost-Volume- Profit (CVP) Analysis Types of Ratio Several ratios, calculated from the accounting data, can be grouped into various classes according to financial activity or function
CHAPTER-5 DATA ANALYSIS PART-3 LIQUIDITY AND SOLVENCY
 CHAPTER-5 DATA ANALYSIS PART-3 LIQUIDITY AND SOLVENCY 190 CHAPTER 5 DATA ANALYSIS PART-3 LIQUIDITY & SOLVENCY 5.1 INTRODUCTION:... 192 5.2 LIQUIDITY & SOLVENCY RATIOS:... 194 5.2.1 CURRENT RATIO:... 194
CHAPTER-4 ANALYSIS OF FINANCIAL EFFICIENCY. The word efficiency as defined by the Oxford dictionary states that:
 CHAPTER-4 ANALYSIS OF FINANCIAL EFFICIENCY 4.1 Concept of Efficiency and Performance The word efficiency as defined by the Oxford dictionary states that: "Efficiency is the accomplishment of or the ability
Downloaded From visit: for more updates & files...
 Downloaded From http://www.cacracker.com, visit: http://www.cacracker.com for more updates & files... 1 PP FTFM December 2011 PROFESSIONAL PROGRAMME EXAMINATION DECEMBER 2011 FINANCIAL, TREASURY AND FOREX
Chapter 4 Financial Strength Analysis
 Chapter 4 Financial Strength Analysis 4.1 Meaning of Financial Strength Finance is an essential requirement for every business enterprise. Various type of finance was needed by the concern for their activity
CHAPTER - VI RATIO ANALYSIS 6.3 UTILITY OF RATIO ANALYSIS 6.4 LIMITATIONS OF RATIO ANALYSIS 6.5 RATIO TABLES, CHARTS, ANALYSIS AND
 CHAPTER - VI RATIO ANALYSIS 6.1 INTRODUCTION 6.2 NATURE OF RATIO 6.3 UTILITY OF RATIO ANALYSIS 6.4 LIMITATIONS OF RATIO ANALYSIS 6.5 RATIO TABLES, CHARTS, ANALYSIS AND INTERPRETATION OF DIFFERENT RATIOS
CHAPTER IV COST STRUCTURE ANALYSIS. Please purchase PDF Split-Merge on to remove this watermark.
 CHAPTER IV COST STRUCTURE ANALYSIS CHAPTER IV COST STRUCTURE ANALYSIS INTRODUCTION This is an age of mass production as a result of which competition in every industry is cut-throat. Therefore, it is utmost
CHAPTER 4. ANALYSIS AND INTERPRETATION OF DATA Ratio Analysis - Meaning of Ratio (A) Return on Investment Ratios
 Return on Investment Ratios") CHAPTER 4 ANALYSIS AND INTERPRETATION OF DATA Ratio Analysis - Meaning of Ratio (A) Return on Investment Ratios - Concept of Return on Investment - Advantages of ROI - Limitations of ROI - Evaluation of
CHAPTER 4 ANALYSIS AND INTERPRETATION OF DATA Ratio Analysis - Meaning of Ratio (A) Return on Investment Ratios - Concept of Return on Investment - Advantages of ROI - Limitations of ROI - Evaluation of
SYLLABUS Class: - B.B.A. II Semester. Subject: - Financial Management
 SYLLABUS Class: - B.B.A. II Semester Subject: - Financial Management UNIT I UNIT II UNIT III UNIT IV Introduction: Concepts, Nature, Scope, Function and Objectives of Financial Management. Basic Financial
SYLLABUS Class: - B.Com Hons II Year. Subject: - Financial Management
 SYLLABUS Class: - B.Com Hons II Year Subject: - Financial Management UNIT I UNIT II UNIT II UNIT IV Introduction: Concepts, Nature, Scope, Function and Objectives of Financial Management. Basic Financial
FINANCIAL STATEMENTS ANALYSIS - AN INTRODUCTION
 Financial Statements Analysis - An Introduction 27 FINANCIAL STATEMENTS ANALYSIS - AN INTRODUCTION You have already learnt about the preparation of financial statements i.e. Balance Sheet and Trading and
A STUDY ON LIQUIDITY MANAGEMENT OF PHARMACEUTICAL COMPANIES IN INDIA
 A STUDY ON LIQUIDITY MANAGEMENT OF PHARMACEUTICAL COMPANIES IN INDIA Dr A.L KAMALAVALLI 1 S.PUSHPAVATHI 2 1 Associate Professor, Department of Commerce, N.G.M College, Pollachi. 2 Research Scholar, Department
DETERMINATION OF WORKING CAPITAL
 E- Module 1 DETERMINATION OF WORKING CAPITAL Operating Cycle Approach The operating cycle can be said to be at the heart of the need for working capital 1. Taking the time lag into account for determining
Scanner Appendix. CS Professional Programme Module - II (New Syllabus) (Solution of June ) Paper - 5 : Financial, Treasury and Forex Management
 (Solution of June ) Paper - 5 : Financial, Treasury and Forex Management") Solved Scanner Appendix CS Professional Programme Module - II (New Syllabus) (Solution of June - 2016) Paper - 5 : Financial, Treasury and Forex Management Chapter - 2 : Capital Budgeting 2016 - June [2]
Solved Scanner Appendix CS Professional Programme Module - II (New Syllabus) (Solution of June - 2016) Paper - 5 : Financial, Treasury and Forex Management Chapter - 2 : Capital Budgeting 2016 - June [2]
condition & operating results in a condensed form. Financial statements are used as a
 2.1 FINANCIAL ANALYSIS Financial statements are formal records of the financial activities of a business, person or other entity and provide an overview of a business or person s financial condition in
Financing the U.S. Trade Deficit
 Order Code RL33274 Financing the U.S. Trade Deficit Updated January 31, 2008 James K. Jackson Specialist in International Trade and Finance Foreign Affairs, Defense, and Trade Division Financing the U.S.
Management of cash in Public sector Enterprises - A case study of ECIL, Hyderabad
 IOSR Journal of Business and Management (IOSR-JBM) e-issn: 2278-487X, p-issn: 2319-7668 PP 50-55 www.iosrjournals.org Management of cash in Public sector Enterprises - A case study of ECIL, Hyderabad Dr.N.Jyothi
IJEMR February Vol 5 Issue 2 - Online - ISSN Print - ISSN
 Financial Performance of Select Cement Industrial Units in Tamil Nadu *Dr. R. Angamuthu *Assistant Professor, Commerce Wing, DDE, Annamalai University, Annamalai Nagar 608 002 Abstract In this paper examine
Working Capital and Liquidity Performance of Cement Companies - An Empirical Analysis
 International Journal of Business and Management Invention (IJBMI) ISSN (Online): 2319 8028, ISSN (Print): 2319 801X Volume 7 Issue 8 Ver. I August. 2018 PP 54-60 Working Capital and Liquidity Performance
2018 VCE Accounting examination report
 General comments The Accounting examination consisted of eight questions, with most containing several parts. One graph was presented for interpretation in. There was also one discuss question, where students
CHAPTER-5 ANALYSIS AND EVALUATION OF WORKING CAPITAL
 CHAPTER-5 ANALYSIS AND EVALUATION OF WORKING CAPITAL 5.1 INTRODUCTION 5.2 CONCEPT OF WORKING CAPITAL MANAGEMENT 5.3 SIGNIFICANCE OF WORKING CAPITAL 5.4 OBJECTIVES OF WORKING CAPITAL 5.5 STRUCTURE OF WORKING
Suggested Answer_Syl2012_Jun2014_Paper_20 FINAL EXAMINATION
 FINAL EXAMINATION GROUP IV (SYLLABUS 2012) SUGGESTED ANSWERS TO QUESTIONS JUNE 2014 Paper- 20 : FINANCIAL ANALYSIS & BUSINESS VALUATION Time Allowed : 3 Hours Full Marks : 100 The figures in the margin
SAKTHI AUTO COMPONENT LIMITED BALANCE SHEET AS AT
 I. SOURCES OF FUNDS : (1) SHAREHOLDERS' FUNDS : BALANCE SHEET AS AT 31-12-2009 Schedule No. Amount (Rs. In Lakhs) (a) Share Capital 1 24631.00 (b) Reserves and Surplus 2 17555.47 42186.47 (2) LOAN FUNDS
Shabd Braham E ISSN
 A Comparative Study of Financial Performance of & Bank Dr.Anjana Gorani (Asst. Prof) R.P.L Maheshwari College CA Omprakash Maheshwari Dr. Hema Mishra (Asst.Prof.) Shree Cloth Market Girls College Indore,
CHAPTER IV RESULTS AND DISCUSSION Efficiency of Working Capital Management
 CHAPTER IV RESULTS AND DISCUSSION This chapter is devoted to presentation and interpretation of the results obtained through the analysis of the data. The collected data were critically analyzed using
Industry Comparative Report
 Industry Comparative Report Real Distributor Company Provided By Narrative Report Industry: Revenue: Periods: 423840 - Industrial Supplies Merchant Wholesalers $10M - $50M 12 months against the same 12
PAPER No. 16: Financial Markets and Institutions MODULE No. 18: Bank Credit: Working Capital & Bank Funds
 Subject Paper No and Title Module No and Title Module Tag 16: Financial Markets and Institutions 18: Bank Credit: Working Capital & Bank Funds Com_P16_M18 TABLE OF CONTENTS 1) Learning Outcomes 2) Introduction-
FINANCIAL PERFORMANCE ANALYSIS OF SELECT CEMENT COMPANIES
 FINANCIAL PERFORMANCE ANALYSIS OF SELECT CEMENT COMPANIES DR. A.Y. KETTIRAMALINGAM 1 K.SOWMIYA 2 P.SANGEETHA 3 1 Associate Professor, School of Commerce PG, Rathnavel Subramaniam College of Arts & Science
CHAPTER 20. Analysis and interpretation of financial statements CONTENTS
 CHAPTER 20 Analysis and interpretation of financial statements CONTENTS 20.1 Horizontal and vertical analysis 20.2 Trend analysis 20.3 Effect of transactions on ratios 20.4 Ratio analysis 20.5 Ratio analysis
not to be republished NCERT You have learnt about the financial statements Analysis of Financial Statements 4
 Analysis of Financial Statements 4 LEARNING OBJECTIVES After studying this chapter, you will be able to : explain the nature and significance of financial analysis; identify the objectives of financial
6.1 Introduction. 6.2 Meaning of Ratio
 6.1 Introduction Ratio analysis has emerged as the principal technique of analysis of financial statements. The system of analysis of financial statements by means of ratio was first made in 1919 be Alexander
Findings, Suggestions and Conclusion
 Findings, Suggestions and Conclusion 214 CHAPTER VI SUMMARY OF FINDINGS, SUGGESTIONS AND CONCLUSION 6.1. INTRODUCTION In the modern times, paper has become a basic material and one of the essential daily
Financing the U.S. Trade Deficit
 Order Code RL33274 Financing the U.S. Trade Deficit Updated September 4, 2007 James K. Jackson Specialist in International Trade and Finance Foreign Affairs, Defense, and Trade Division Financing the U.S.
ACCOUNTING RATIOS ACTIVITY / TURNOVER RATIOS BY- ANUJ JINDAL
 ACCOUNTING RATIOS ACTIVITY / TURNOVER RATIOS BY- ANUJ JINDAL ACTIVITY/ TURNOVER/ EFFICIENCY RATIOS Rapidity with which the resources available to the concern are being used to produce revenue from operations
CHAPTER :- 4 CONCEPTUAL FRAMEWORK OF FINANCIAL PERFORMANCE.
 CHAPTER :- 4 CONCEPTUAL FRAMEWORK OF FINANCIAL PERFORMANCE. 4.1 INTRODUCTION. 4.2 FINANCIAL PERFORMANCE. 4.3 FINANCIAL STATEMENT. 4.4 FINANCIAL STATEMENT ANALYSIS. 4.5 METHODS OF ANALYSIS OF FINANCIAL
FINANCING OF WORKING CAPITAL IN SELECT CEMENT COMPANIES- A POLICY PERSPECTIVE
 FINANCING OF WORKING CAPITAL IN SELECT CEMENT COMPANIES- A POLICY PERSPECTIVE Dr. K. Bhagyalakshmi 1, Dr. P. Krishnama Chary 2 1 Lecturer, Dept. of Commerce and Business Management, University College
An-Najah National University. Prepared by Instructor: E.Shatha Qamhieh Course Title: Managerial Finance
 An-Najah National University Prepared by Instructor: E.Shatha Qamhieh Course Title: Managerial Finance Working Capital Fundamentals Short-term financial management: Management of current assets and current
CHAPTER 5 FINANCIAL PERFORMANCE APPRAISAL OF EASTERN COALFIELDS LIMITED: A FRAMEWORK OF TOOLS AND TECHNIQUES EMPLOYED FOR DATA ANALYSIS
 CHAPTER 5 FINANCIAL PERFORMANCE APPRAISAL OF EASTERN COALFIELDS LIMITED: A FRAMEWORK OF TOOLS AND TECHNIQUES EMPLOYED FOR DATA ANALYSIS Introduction In the previous chapter, we have described the historical
LIQUIDITY SALES BORROWING ASSETS
 Report prepared for: ABC Company Industry: 339999 - All Other Miscellaneous Manufacturing Periods: 12 months against the same 12 months from the previous year LIQUIDITY PROFITS & PROFIT MARGIN SALES BORROWING
An Empirical Study on Working Capital Management of Ammayeppar Textiles Pvt Ltd Chennai
 An Empirical Study on Working Capital Management of Ammayeppar extiles Pvt Ltd Chennai S amil Selvan 1, Dr Ram Babu 2, Dr. Ch. Bala Nageswara Rao 3 1,2,3 Saveetha School of Management, Sriperumbudur, amil
CHAPTER - 4 ANALYSIS OF PERFORMANCE OF SELECTED FMCG COMPANIES
 CHAPTER - 4 ANALYSIS OF PERFORMANCE OF SELECTED FMCG COMPANIES The performance of the FMCG Companies can be evaluated in three ways, they are: (1) Solvency: This is the measure of the firm s ability to
WORKING CAPITAL MANAGEMENT IN DABUR INDIA LTD A CASE STUDY
 International Journal of Accounting and Financial Management Research (IJAFMR) ISSN 2249-6882 Vol.2, Issue 1 Mar 2012 32-45 TJPRC Pvt. Ltd., WORKING CAPITAL MANAGEMENT IN DABUR INDIA LTD A CASE STUDY AARTI
STOCK PRICE, EARNING POWER AND RESERVE: HOW THEY ARE CORRELATED
 7Indian Journal of Accounting (IJA) 74 ISSN : 972-1479 (Print) 2395-6127 (Online) Vol. 5 (2), December, 218, pp. 74-78 STOCK PRICE, EARNING POWER AND RESERVE: HOW THEY ARE CORRELATED Mridul Kumar Ghosh
Cost of Capital And Profitability Analysis (A Case Study of Telecommunication Industry)
") Abstract Cost of Capital And Profitability Analysis (A Case Study of Telecommunication Industry) Asha Sharma* Finance is the supply of funds, which regulates the activities and operations of the industry.
Abstract Cost of Capital And Profitability Analysis (A Case Study of Telecommunication Industry) Asha Sharma* Finance is the supply of funds, which regulates the activities and operations of the industry.
LESSON 6 RATIO ANALYSIS CONTENTS
 LESSON 6 RATIO ANALYSIS CONTENTS 6.0 Aims and Objectives 6.1 Introduction 6.2 Definition 6.3 How the Accounting Ratios are Expressed? 6.4 Purpose, Utility & Limitations of Ratio Analysis 6.5 Classification
International Journal of Academic Research ISSN: ; Vol.5, Issue-4, April, 2018 Impact Factor: 6.023;
 Senior Lecturer in Commerce, Government Degree College, Razole, East Godavari Dist. AP Funds are the wheels on which depends the successful movement of business-cart. The need for funds may arise for short-term
IPCC MAY 2016 QUESTION PAPER PAPER 1 ACCOUNTING
 IPCC MAY 2016 QUESTION PAPER PAPER 1 ACCOUNTING Questions No.1 is compulsory. Candidates are also required to answer any five questions from the remaining six questions. Working notes should form part
CHAPTER - 5 ANALYSIS OF PROFITABILITY
 CHAPTER - 5 ANALYSIS OF PROFITABILITY 5.1 INTRODUCTION 5.2. CONCEPT OF PROFITABILITY 5.3 MEARUREMENT OF PROFITABILITY 5.4 IMPORTANCE OF PROFITABILITY 5.5 ANALYSIS OF PROFITABILITY 5.5.1 Gross Profit Ratio
TOTAL TRAINING SOLUTIONS
 TOTAL TRAINING SOLUTIONS RATIO ANALYSIS TO DETERMINE FINANCIAL STRENGTH Examining a Borrowers Five Vital Signs Jeffery W. Johnson Bankers Insight Group, LLC jeffery.johnson@bankers-insight.com October
Analysis of Working Capital Efficiency of Vegetable Oil Companies in India
 2018 IJSRST Volume 4 Issue 2 Print ISSN: 2395-6011 Online ISSN: 2395-602X Themed Section: Science and Technology Analysis of Working Capital Efficiency of Vegetable Oil Companies in India Dr. S. Sivagnanam
CHAPTER V SUMMARY AND CONCLUSION
 CHAPTER V SUMMARY AND CONCLUSION Indian seed industry has shown a significant growth in size and level since its inception. It is growing at the rate of 12 per cent compared to less than 5 per cent growth
To Evaluate Working Capital Management of Renuka Sugar Pvt. Ltd.
 To Evaluate Working Capital Management of Renuka Sugar Pvt. Ltd. Manisha D. Patel Assistant Professor Humanities and Social Science Department, Shree Swami Atmanand Saraswati Institute of Technology, Surat,
Guidance on Clause 17(l) Guidance on Clause 17A in the Form No.3CD Select Issues in Accounting for State-Level VAT 29-44
 Guidance on Clause 17A in the Form No.3CD Select Issues in Accounting for State-Level VAT 29-44") S. No. Particulars Page No. 1 Clause No.12(a) and (b) Para No.23 of the Guidance Note (2005 Edition) 2 Clause 17(h) of Form 3CD Pra35 of the Guidance Note 2-12 13-17 3 Guidance on Clause 17(l) 18-23 4
S. No. Particulars Page No. 1 Clause No.12(a) and (b) Para No.23 of the Guidance Note (2005 Edition) 2 Clause 17(h) of Form 3CD Pra35 of the Guidance Note 2-12 13-17 3 Guidance on Clause 17(l) 18-23 4
FACTORS AFFECTING BANK CREDIT IN INDIA
 Chapter-6 FACTORS AFFECTING BANK CREDIT IN INDIA Banks deploy credit as per their credit or loan policy. Credit policy of a bank, basically, provides a direction to the use of funds, controls the size
Working Capital Management of Larsen & Turbo
 Volume-8, Issue-5, October 2018 International Journal of Engineering and Management Research Page Number: 56-63 DOI: doi.org/10.31033/ijemr.8.5.02 Working Capital Management of Larsen & Turbo K. Pavithra
A STUDY OF FINANCIAL PERFORMANCE: A COMPARATIVE ANALYSIS OF STATE BANK OF INDIA AND ICICI BANK
 A STUDY OF FINANCIAL PERFORMANCE: A COMPARATIVE ANALYSIS OF STATE BANK OF INDIA AND BANK Chahat Gupta, Assistant Professor, G.G.S. College for Women, Chandigarh, India Amandeep Kaur, Assistant Professor,
FINANCIAL REPORTING STANDARDS OBJECTIVE 1 DEFINITIONS 2-10 STATEMENT OF STANDARD ACCOUNTING PRACTICE SCOPE 11-13
 ACCOUNTINGSTANDARDS BOARDAPRIL1994 FRS 5 CONTENTS SUMMARY Paragraph FINANCIAL REPORTING STANDARD 5 OBJECTIVE 1 DEFINITIONS 2-10 STATEMENT OF STANDARD ACCOUNTING PRACTICE 11-39 SCOPE 11-13 GENERAL 14-15
Dr.M.Manjurani Asst.Professor Dept. of Commerce, T.S.A.Arts Science and Tamil College Perur-10.
 A STUDY ON SOLVENCY AND PROFITABILITY ANALYSIS OF MAHINDRA AND MAHINDRA LIMITED IN POLLACHI INTRODUCTION AND DESIGN OF STUDY Dr.M.Manjurani Asst.Professor Dept. of Commerce, T.S.A.Arts Science and Tamil
Chapter 6. Data Analysis and Interpretation
 Chapter 6 Data Analysis and Interpretation 6.1 Introduction. 6.2 Current Ratio. 6.3 Quick Ratio. 6.4 Debt Equity Ratio. 6.5 Interest Coverage Ratio. 6.6 Operating Profit Margin Ratio. 6.7 Net Profit Margin
Answer to MTP_ Final _Syllabus 2012_Dec2016_Set 2 Paper 19: Cost and Management Audit
 Paper 19: Cost and Management Audit Academics Department, The Institute of Cost Accountants of India (Statutory Body under an Act of Parliament) Page 1 Paper 19 - Cost and Management Audit Full Marks :
CHAPTER: 11 CONCLUSIONS AND SUGGESTIONS
 CHAPTER: 11 CONCLUSIONS AND SUGGESTIONS 11.1 CONCLUSIONS On the basis of analysis of data gathered in the course of this research, following are the conclusions relating to the evaluation of management
TURNOVER (OR) ACTIVITY PERFORMANCE OF UNIT TRUST OF INDIA
 ACTIVITY PERFORMANCE OF UNIT TRUST OF INDIA") TURNOVER (OR) ACTIVITY PERFORMANCE OF UNIT TRUST OF INDIA Dr. M. Gurupandi, Assistant Professor, Department of Commerce, School of Management, Alagappa University, Karaikudi Abstract: Mutual fund is a
TURNOVER (OR) ACTIVITY PERFORMANCE OF UNIT TRUST OF INDIA Dr. M. Gurupandi, Assistant Professor, Department of Commerce, School of Management, Alagappa University, Karaikudi Abstract: Mutual fund is a
SUGGESTIONS AND RECOMMENDATIONS
 CHAPTER VI SUGGESTIONS AND RECOMMENDATIONS This study Impact of Value Added Tax on the Financial and Tax Management Practices of VAT Assessees of Kerala was undertaken to identify the efficiency and effectiveness
Answer to MTP_Intermediate_Syllabus 2016_Jun2017_Set 1 Paper 5- Financial Accounting
 Paper 5- Financial Accounting Academics Department, The Institute of Cost Accountants of India (Statutory Body under an Act of Parliament) Page 1 Paper 5- Financial Accounting Full Marks : 100 Time allowed:
Chapter 2: Analyzing a Company s Financial Statements & Operations
 Chapter 2: Analyzing a Company s Financial Statements & Operations To analyze a company s operations a close look must be taken at the day to day operations as well as examining a company s financial history.
A study on liquidity and profitability position of national thermal power corporation limited New Delhi
 International Journal of Commerce and Management Research ISSN: 2455-627, Impact Factor: RJIF 5.22 www.managejournal.com Volume 3; Issue 2; February 207; Page No. 2-6 A study on liquidity and profitability
CRS Report for Congress
 Order Code RL33274 CRS Report for Congress Received through the CRS Web Financing the U.S. Trade Deficit February 14, 2006 James K. Jackson Specialist in International Trade and Finance Foreign Affairs,
MGT101 Long Questions
 MGT101 Long Questions Question No: 56 ( Marks: 5 ) Write down the five advantages of Limited Company. Answer It is a legal entity created by law and hence has its own recognition, good will and brand equity
CS101 Introduction of computing
 MGT101 Financial Accounting Lecture wise s Answers for Final Term Exam Preparation Write down the five advantages of Limited Company. Answer 1. It is legal entities created by law and hence has its own
BOOKS OF ORIGINAL ENTRIES
 BOOKS OF ORIGINAL ENTRIES These are the books of first entry. The transactions are first recorded in these books before being entered in the ledger books. These books are also called as books of Prime
DOWNLOAD PDF JOURNAL ENTRY EXAMPLES ACCOUNTING
 Chapter 1 : Ledger Accounts Posting Transactions Example Analyzing transactions and recording them as journal entries is the first step in the accounting blog.quintoapp.com begins at the start of an accounting
Unit 1. Final Accounts of Non-Manufacturing Entities. chapter - 6. preparation of final accounts of sole proprietors
 chapter - 6 preparation of final accounts of sole proprietors Unit 1 Final Accounts of Non-Manufacturing Entities Final Accounts of non-manufacturing Entities Learning Objectives After studying this unit
Financing the U.S. Trade Deficit
 James K. Jackson Specialist in International Trade and Finance November 16, 2012 CRS Report for Congress Prepared for Members and Committees of Congress Congressional Research Service 7-5700 www.crs.gov
Sample Performance Review
 Sample Performance Review For the period ended 12/31/2011 Provided by: This report is designed to assist you in your business' development. Below you will find your overall ranking, business snapshot and
Engineering Economics and Financial Accounting
 Engineering Economics and Financial Accounting Unit 5: Accounting Major Topics are: Balance Sheet - Profit & Loss Statement - Evaluation of Investment decisions Average Rate of Return - Payback Period
A Study on Cost of Capital
 International Journal of Empirical Finance Vol. 4, No. 1, 2015, 1-11 A Study on Cost of Capital Ravi Thirumalaisamy 1 Abstract Cost of capital which is used as a financial standard plays a crucial role
PERFORMANCE APPRAISAL OF HPCL THROUGH FREE CASH FLOW
 Indian Journal of Accounting (IJA) 18 ISSN : 0972-1479 (Print) 2395-6127 (Online) Vol. XLVIII (2), December, 2016, pp. 18-24 PERFORMANCE APPRAISAL OF HPCL THROUGH FREE CASH FLOW Dr. S. K. Khatik Dr. Amit
Cost-Profit-Volume Analysis. Samir K Mahajan
 Cost-Profit-Volume Analysis Samir K Mahajan BREAK -EVEN ANALYSIS Break even Analysis refer to a system of determination of activity where total cost equals total selling price. It is also known as cost-volume-
Working Capital Analysis of Pricol Engineering Industries Limited at Coimbatore
 Asia Pacific Journal of Research Vol: I. Issue XXXVIII, April 2016 ISSN (Print) : 2320-5504 ISSN (Online) : 2347-4793 Analysis of Pricol Engineering Industries Limited at Coimbatore Sandhiya. S 1 and Dr.
Guggenheim Variable Insurance Funds Summary Prospectus
 5.1.2017 Guggenheim Variable Insurance Funds Summary Prospectus Rydex Domestic Equity Broad Market Fund Inverse S&P 500 Strategy Fund The Fund is very different from most mutual funds in that it seeks
PTP_Final_Syllabus 2008_Jun 2015_Set 2
 Paper-12: FINANCIAL MANAGEMENT & INTERNATIONAL FINANCE Time Allowed: 3 Hours Full Marks: 100 The figures in the margin on the right side indicate full marks. Answer Question No. 1 from Part A which is
Description of Nature of Financial Instruments and Inherent Risk
 Description of Nature of Financial Instruments and Inherent Risk Applicable from for Danske Bank A/S Estonia branch, Danske Bank A/S Latvia branch and Danske Bank A/S Lithuania branch 1. GENERAL INFORMATION
Financial Services: Issues and Options. R. Kavita Rao NIPFP
 Financial Services: Issues and Options R. Kavita Rao NIPFP The Problem GST is proposed on the input tax credit principle. Every supplier is allowed to take credit for any input taxes that might have been
Ratio Analysis. Assets = Liabilities + Shareholder s Equity
 Ratio Analysis The purpose of a financial statement is to disclose information about the financial position of an entity to interested parties. By reporting the finances, shareholders are able to make
CORNERCAP GROUP OF FUNDS CORNERCAP BALANCED FUND CORNERCAP SMALL-CAP VALUE FUND CORNERCAP LARGE/MID-CAP VALUE FUND
 CORNERCAP GROUP OF FUNDS CORNERCAP BALANCED FUND CORNERCAP SMALL-CAP VALUE FUND CORNERCAP LARGE/MID-CAP VALUE FUND Supplement to the Statement of Additional Information Dated August 14, 2015 This Supplement
CHAPTER- 8 SUMMARY, CONCLUSION AND SUGGESTIONS. 8.1 Conceptual framework of working capital analysis
 CHAPTER- 8 SUMMARY, CONCLUSION AND SUGGESTIONS C H A P T E R - 1 8.1 Conceptual framework of working capital analysis Present research dealt with the study of Analysis of Working Capital of Cement Industry
Derivatives Analysis & Valuation (Futures)
") 6.1 Derivatives Analysis & Valuation (Futures) LOS 1 : Introduction Study Session 6 Define Forward Contract, Future Contract. Forward Contract, In Forward Contract one party agrees to buy, and the counterparty
6.1 Derivatives Analysis & Valuation (Futures) LOS 1 : Introduction Study Session 6 Define Forward Contract, Future Contract. Forward Contract, In Forward Contract one party agrees to buy, and the counterparty
CHAPTER 8 SUMMARY, CONCLUSION AND SUGGESTIONS
 CHAPTER 8 SUMMARY, CONCLUSION AND SUGGESTIONS 8.1 CONCEPTUAL FRAMEWORK OF WORKING CAPITAL NALYSIS 8.1.1 Concept of working capital 8.1.2 Adequacy of working capital 8.1.3 Working capital objectives 8.1.4
MOCK EXAMINATION DECEMBER 2013
 Copyright Reserved MOCK EXAMINATION DECEMBER 2013 Strategic Financial Management Answer No. 01 (a) Option 01 - Rs. Mn Benefit 6 40 15% Project Cost 50 Net present Value -10 Option 02 Cashflow NPV @15%
CHAPTER Time Value of Money
 CHAPTER 6 6.1 Time Value of Money Money has time value. A rupee is less valuable in the future than it is today. Time value of money could be studied under the following heads: Future value of a single
A Critical Study On The Role Of Foreign Direct Investment In India
 A Critical Study On The Role Of Foreign Direct Investment In India Ms. Babita Yadav, Faculty of Management, Research Scholar, R.D.V.V, Jabalpur E:mail: babitas.yadav@rediffmail.com Dr. Anshuja Tiwari,
Downloaded from
 CHAPTER VIII FINANCIAL MANAGEMENT HIGH ORDER THINKING SKILLS QUESTIONS Q. 1 Write the full form of the terms :- a) EBIT b) ROI (1) Q.2 State which type of capital structure (more equity based or debt based)
LIQUIDITY A measure of the company's ability to meet obligations as they come due. Financial Score for Restaurant
 Dear Client: In an effort to bring you more value as a financial management advisor, we have initiated a program to present your financial statements in an easier-to-read and more useful format. We are
Unit 3: Analysis of Financial Statements (marks=12) Contents mapping:
 Contents mapping:") I Unit 3: Analysis of Financial Statements (marks=12) Contents mapping: Financial statements of a company: Statement of Profit and Loss and Balance Sheet in the prescribed form with major headings and
I Unit 3: Analysis of Financial Statements (marks=12) Contents mapping: Financial statements of a company: Statement of Profit and Loss and Balance Sheet in the prescribed form with major headings and
Mohammed Ibrahim Obeidat Al Khawarizmi International College. Adnan Jawabri Al Khawarizmi International College
 The Impact of Working Capital Management on the Profitability of Construction Equipment Firms: Evidence from Listed Construction Equipment Firms in Abu Dhabi Stock Exchange Mohammed Ibrahim Obeidat Al
Cambridge International General Certificate of Secondary Education 0452 Accounting November 2012 Principal Examiner Report for Teachers
 ACCOUNTING Cambridge International General Certificate of Secondary Education Paper 0452/11 Paper 1 Key Messages This question paper contained a mixture of multiple-choice, short-answer and structured