Tourism Forecasting Applied to Destination
|
|
|
- Berniece Wilson
- 6 years ago
- Views:
Transcription

1 Tourism Forecasting Applied to Destination Strategy ETC-UNWTO Forecasting Seminar Vienna, 12 September, 2008 Prepared by: Tourism Economics 121, St Aldates, Oxford, OX1 1HB UK 303 W Lancaster Ave. Wayne PA USA : / :
2 Outline 1. Introduction 2. Why forecast? 3. Examples of forecasting approaches 4. Translating forecasts into strategy 2


3 Oxford Economics Oxford Economics is a world-leader in quantitative economic analysis forecasting, and in evidence-based business and public policy advice. Our reputation is built on: The calibre of our staff: over 50 professional economists in the UK, US and France Our quantitative approach to issues, including our range of models and scenario tools to answer practical questions Our ability to answer the 'So what?' questions, helping our clients to understand, challenges and strategic choices they face 3
4 Oxford Economics Regular quarterly, monthly, weekly & daily reports include: World Economic Prospects Monthly Review Euro Zone and US Weekly Briefs Commodity Price Monitor Emerging Markets Watch These reports are based on the Oxford Global Economic Model 10-year forecasts provided quarterly Flexible and powerful software easy to run simulations Rigorous and consistent structure for forecasting and scenario analysis Most widely used International Macro Model Clients include the IMF, World Bank, ADB, Finance Ministries, central banks, investment banks, fund managers and multi-national companies 4
5 Tourism Economics Tourism Economics is a subsidiary of Oxford Economics founded to tailor our international analysis for multinational businesses in the travel & tourism sector. By combining global economic expertise with an understanding of the real world issues facing tourism development, we assist our clients with: Market opportunity assessments Tourism demand forecasting and scenario analysis Economic impact studies Policy analysis 5


6 Recent clients Abu Dhabi Tourism Authority Dubai Tourism & Commerce Marketing New York City and Company Singapore Tourist Board Gulf Air Etihad Airways InterContinental Hotels Group Airbus Hong Kong Tourist Board World Travel & Tourism Council Bahamas Ministry of Tourism Visit Britain Tourism Ireland Canadian Tourism Commission Hungary Ministry of Tourism Kerzner International 6 Tourism Malaysia Tourism Authority of Thailand Discover America Partnership London Tourism Authority Saudi Tourism Commission Visit Scotland Israel Ministry of Tourism Travel Industry Association Travel Business Roundtable Grand Bahama Promotion US Office of Tourism Industries Marriott Washington DC CVB Alaska Tourism Office
7 Why forecast? The goal is not accuracy for its own sake. (On this basis alone, forecasting is rarely useful.) Purposes of forecasting: Setting political expectations Guiding industry s decisions on capacity and investment (including public sector investments) Provide an input into marketing strategy (to guide prioritization and allocation) 7
8 Essentials of a forecast model Origin market drivers (demographic, economic, travel patterns and preferences) Destination factors (new supply, policies, exchange rates) 8
9 Recent examples: TDM Tourism Decision Metrics (TDM) is based on a 180- country model which predicts origin-destination visits and nights as well as inbound and outbound spending Its primary advantage is that each destination s visitor forecasts are constrained as one piece of the origin demand pie. Capable of scenario analysis by changing key economic assumptions and introducing external shock variables to reflect positive/negative changes in policies or events. 9
 TDM Model Format Outbound Spending by Market (180) Business Leisure Global Tourism Market Inbound Spending by")
 Business / Leisure Air / road / sea Overnight / day Origin-Destination Travel Flows (180 Countries) Visits")
10 Oxford Economics Macroeconomic Model (180 Countries) For each origin market Real GDP Consumer Spending Exchange rates (bi-lateral) TDM Model Format Outbound Spending by Market (180) Business Leisure Global Tourism Market Inbound Spending by Market (180) Business Leisure Destination Competitiveness Indices Policy Infrastructure Attractiveness Inbound Visits by Market (180) Business / Leisure Air / road / sea Overnight / day Origin-Destination Travel Flows (180 Countries) Visits Nights 10
11 TDM: Destination Built on Oxford Economics global macroeconomic model Forecasts of origin market economic growth and currencies drive outbound spending and visits projections. Destination forecasts are predicted on the basis of their weighting of origin markets and a tourism competitiveness index developed by the World Economic Forum / Oxford Economics and adjusted by Tourism Economics. 11 Components of Tourism Competitiveness Index Sub-index A: Regulatory framework Pillar 1: Policy rules and regulations Pillar 2: Environmental regulation Pillar 3: Safety and security Pillar 4: Health and hygiene Pillar 5: Prioritization of tourism strategies Sub-index B: Tourism infrastructure Pillar 6: Air transport infrastructure Pillar 7: Ground transport infrastructure Pillar 8: Tourism infrastructure Pillar 9: ICT infrastructure Pillar 10: Price competitiveness Sub-index C: Human, cultural, natural resources Pillar 11: Human resources Pillar 12: National tourism perception Pillar 13: Natural and cultural resources
12 Model relationships Outbound Spending Exchange Rate and Tourism Spending % Growth in International Tourism Spending (US$) y = 0.656x % Appreciation in currency, Source : Tourism Economics, IMF 12
13 Model relationships Outbound Spending Economic Activity and Tourism Spending % year International Tourism Spending (US$) World GDP (US$) Source : Tourism Economics, Haver Analytics, IMF 13
14 France: Outbound Spending R-Squared = 0.97 Model equation tracks both the trend and cyclical movements of French outbound spending well. Peak and trough years are well identified. The magnitude of growth in such years is not exactly determined, but there is not bias or systematic error. For example growth for the latest trough in 2006 is overestimated while other troughs are underestimated. France: Outbound spending US$ mn 40 France: Outbound spending % growth Estimated growth Estimated growth Data 0-5 Data Source : Tourism Economics Source : Tourism Economics 14
15 UK: Outbound Spending R-Squared = 0.98 Trend and cycles are well determined for UK outbound spending However, data was significantly stronger than equations suggest in 1998 while growth is weaker than suggested by equations in 2004, possibly due to a strong weight in US exchange rates. UK: Outbound spending US$ mn UK: Outbound spending % growth Estimated growth Estimated growth Data 20 Data Source : Tourism Economics Source : Tourism Economics 15
16 US Inbound Visits: France R-Squared = 0.75 The cycle of French inbound visits is tracked accurately, but volatility is not fully captured, especially in recent years when sentiment has been a key factor on this relationship. This is hard to quantify in model equations. But such factors are taken into account when compiling forecasts. France: US Inbound visits '000s France: US Inbound visits % growth Estimated growth Estimated growth Data Data Source : Tourism Economics Source : Tourism Economics 16
17 US Inbound Visits: UK R-Squared = 0.87 Equations track fluctuations well in determining cyclical movements as well as the magnitude of cycles over the cycle. UK: US Inbound visits '000s Estimated growth Data Source : Tourism Economics UK: US Inbound visits % growth Estimated growth Data Source : Tourism Economics 17
18 Recent examples: TIA Travel Industry Association of America semi-annual domestic travel forecast Business Travel Business travel is a function of business activity (profits etc). This is important for origin as well as destination markets Leisure Travel Leisure is a function of income and spending Costs are a more important here than for business Costs cover travel (especially day visits), lodging (for overnight) as well exchange rate costs for international 18
19 Recent examples: TIA (business) Business visits, investment and profits % growth Company profits Real fixed investment Business visits Source : Tourism Economics 19
20 Recent examples: TIA (leisure) Leisure visits, income and costs % growth 10 Domestic cost relative to international costs -10 (inverted - rhs) Real incomes Leisure visits Source : Tourism Economics 20

21 Example: Using external events for scenario analysis 21
22 Example: Using external events for scenario analysis 22
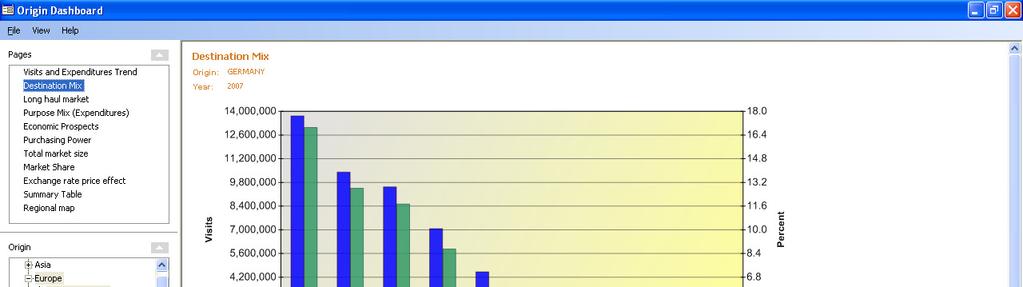
23 Putting forecasts to work: global tracking Good analytical tools can help translate forecasts into strategy. The Tourism Decision Metrics forecast database is housed in a visualization software. This enables ad hoc analysis of forecasts to assess: Overall growth of key markets A destination s market share of a key market Competitor tracking for a destination Track economic trends by market 23


24 Example: Overall growth of key markets 24


25 Example: Track origin market trends 25

26 Example: Destination market share 26


27 Example: Tracking competitors 27

28 Example: Cartographic analysis 28
29 Putting forecasts to work: market strategy Destination marketing strategies are typically based on current market size. However, the goal is to attract new visitors so growth forecasts matter. By combining forecasts with market indicators we can prioritize marketing. TE has developed the Market Analysis Platform (MAP) which incorporates a broad range of metrics including growth forecasts to provide a consistent measurement of market opportunity. 29
30 Example: Market strategy using MAP Growth alone is misleading, other factors affect strategy Market Analysis Platform International Select Outlook and Risk Year: 2008 Current Outlook: Long-term Risk: Balanced Country List Select all {Please select Outlook} {Please select Risk} Australia Select or de-select components. Select all Opportunity Market Size Country Size Growth Saturation Propensity Sentiment Alignment Canada China Egypt France Germany India Italy Japan Italy, 14 Lebanon, 20 Saudi Arabia, 25 Germany, 29 France, 32 Australia, 33 China, 88 India, 66 Value Purchase Power Visitor Value Affordability Presence Lebanon Qatar Russia UK, 34 Russia, 60 Constraint Risks Accessibility Saudi Arabia UK Canada, 34 US US, 38 Egypt, 43 Qatar, 39 Japan, 40 30
31 Example: market strategy using MAP Market Analysis Platform International Select Outlook and Risk Year: 2008 Current Outlook: Long-term Risk: Balanced {Please select Outlook} {Please select Risk} Country List Australia Select all Select or de-select components. Select all Opportunity Market Size Country Size Growth Saturation Canada China Egypt France Germany Egypt, 39 Lebanon, 42 Russia, 35 UK, 61 Germany, 55 Propensity Sentiment Alignment India Italy Japan India, 43 France, 54 Value Purchase Power Visitor Value Affordability Presence Constraint Risks Accessibility Lebanon Qatar Russia Saudi Arabia UK Italy, 44 Japan, 45 Australia, 51 Qatar, 48 US China, 46 Saudi Arabia, 46 US, 47 Canada, 47 31
32 MAP: How does an origin market score? Germany - Market Overview Score Summary Super component score Component Score Component summary score summary - scale = Total Market Score 100 opportunity propensity value constraints Total Market Country Saturatio Growth Sentiment Alignment Purchasin Market Visitor Market Accessibil Affordabili Risk Size Size n g Power Value Presence ity ty Market Size Country Size Growth Saturation Sentiment Alignment Purchasing Power Visitor Value Market Affordability Market Presence Risk Accessibility Opportunity Propensity Value Constraint 32
33 MAP: How do origin markets compare? Market Comparisons Compare component score for Germany with scores for up to 3 other markets {Select 1st market} {Select 2nd market} {Select 3rd market} Score Comparison across Markets Germany France Italy UK Market Country Saturatio Growth Sentiment Alignment Purchasin Market 100 Visitor Market Accessibil Affordabili Risk Size Size n g Power Value Presence ity ty Total Germany France Italy UK Market Size Country Size Growth Saturation Sentiment Alignment Purchasing Power Visitor Value Market Market Affordability Presence Risk Accessibility Total 33
34 MAP: comparing origin markets Top Markets according to following criteria: Expected outbound spending growth {Select Criteria} Top Markets according to: Growth Top markets lie in the upper right-hand quadrant (listed to the right) Lebanon Egypt Japan US QatarSaudi Canada Arabia UK Germany Australia France Italy India Expected GDP growth for each market 1 {Select Criteria} Raw Potential Size - Growth China - Spare Capacity Real Potential - Most Aligned - Least Resistant Markets in upper right quadrant - Yield 1 China C3 Stability 2 Russia 3 India Russia 4 Egypt 5 US 6 Japan 7 Canada Bubble size= - 34
35 MAP: comparing origin markets Top Markets according to following criteria: sentiment) Least resistance (accessibility & {Select Criteria} Top Markets according to: Real Potential Top markets lie in the upper right-hand quadrant (listed to the right) China Canada Japan US Australia India Qatar Saudi Arabia Russia Egypt Italy Alignment score UK Lebanon Germany 1 {Select Criteria} Raw Potential Size - Growth - Spare Capacity Real Potential - Most Aligned - Least Resistant Markets in upper right quadrant - Yield 1 UK C5 Stability 2 Lebanon 3 Saudi Arabia 4 Qatar France 5 Egypt Bubble size= Yield (value & purchasing power score) 35
36 Conclusions The goal of forecasting is not accuracy for its own sake. To maximize the value of forecasting: Tell the story of what is driving the forecast (income, exchange rates, labour markets, supply disruptions) Effectively analyse the results in concert with other indicators of opportunity Present the results in ways to guide strategy 36
37 Thank you! 37
Market Allocation Platform Guiding investment decisions to maximize ROI. Tourism Economics
 Market Allocation Platform Guiding investment decisions to maximize ROI Tourism Economics core services Travel data and forecasts for 190 countries, 50 states, and 300 cities Policy analysis and recommendations
Andrew Goodwin Lead UK Economist, Oxford Economics
 Andrew Goodwin Lead UK Economist, Oxford Economics Brexit and the UK outlook Andrew Goodwin Lead UK Economist 3 rd November 2017 The post-referendum sterling slump has been central to the UK story in 2017
Power of Travel Promotion Evolution
 Power of Travel Promotion Evolution Promotion More Important than Ever Power of Promotion $7 million Median state = marketing budget FY 2014-15 OR 45 seconds worth of Super Bowl ads $100 million = Presidential
Funds Europe & Funds Global - Audience 2018
 Funds Europe & Funds Global - Audience 2018 1 About Funds Europe & Funds Global...Page 3 Readership by Seniority....Page 4 Print Circulation. Page 5 Online Audience Page 6 Email Audience.... Page 8 Media
UAE VALUATION & ADVISORY Q NEWSLETTER
 UAE VALUATION & ADVISORY Q2 2018 NEWSLETTER VALUATIONS NEWSLETTER UAE Q2 2018 IN FOCUS: HEALTHCARE MARKET OVERVIEW IN FOCUS: HEALTHCARE MARKET OVERVIEW Dubai has witnessed average population growth of
An Unparalleled Economic Opportunity
 An Unparalleled Economic Opportunity Tourism is the world s 4th fastest growing industry 1 billion international travellers $1 trillion in revenues 4% growth globally per year Tourism s footprint in Canada
Why Invest In Emerging Markets? Why Now?
 Why Invest In Emerging Markets? Why Now? 2018 Over the long term, Emerging Markets (EM) have been a winning alternative compared to traditional Developed Markets (DM)... 350 300 250 200 150 100 50 1998
Vietnam. HSBC Global Connections Report. October 2013
 HSBC Global Connections Report October 2013 Vietnam The pick-up in GDP growth will be modest this year, with weak domestic demand and exports still dampening industrial confidence. A stronger recovery
International Travel & Tourism Study (Published March 2005)
") International Travel & Tourism Study (Published March 2005) Roy Morgan International conducts surveys in the US,, Australia, New Zealand and Indonesia on a continuous basis. Respondents are asked about
International Travel & Tourism Study (Published March 2005) Roy Morgan International conducts surveys in the US,, Australia, New Zealand and Indonesia on a continuous basis. Respondents are asked about
The Deloitte Talent in Insurance Survey 2015 UAE in Focus
 The Deloitte Talent in Insurance Survey 2015 UAE in Focus Survey findings Figure 1. Popularity of insurance as a career choice among business students, EMEA, 2015 Poland 2.98% Switzerland 2.93% Finland
GLOBAL MARKET OUTLOOK
 GLOBAL MARKET OUTLOOK Max Darnell, Managing Partner, Chief Investment Officer All material has been obtained from sources believed to be reliable, but its accuracy is not guaranteed. performance is no
Why Invest In Emerging Markets? Why Now?
 Why Invest In Emerging Markets? Why Now? 2017 Over the long term, Emerging Markets (EM) have been a winning alternative compared to traditional Developed Markets (DM)... 350 300 250 200 150 100 50 1997
PMITM. The world s leading economic indicator
 PMITM The world s leading economic indicator The Purchasing Managers IndexTM (PMITM) is based on monthly surveys of carefully selected companies representing major and developing economies worldwide. KEY
Stress Testing: Financial Sector Assessment Program (FSAP) Experience
 Experience") Stress Testing: Financial Sector Assessment Program (FSAP) Experience Tomás Baliño Deputy Director Monetary and Financial Systems Department Paper presented at the Expert Forum on Advanced Techniques on
Stress Testing: Financial Sector Assessment Program (FSAP) Experience Tomás Baliño Deputy Director Monetary and Financial Systems Department Paper presented at the Expert Forum on Advanced Techniques on
Progress Towards Strong, Sustainable, and Balanced Growth. Figure 1: Recovery From Financial Crisis (100 = First Quarter of Real GDP contraction)
") Progress Towards Strong, Sustainable, and Balanced Growth Figure 1: Recovery From Financial Crisis ( = First Quarter of Real GDP contraction) 13 125 196-26 AE Recessions' Range*** 196-26 AE Recessions**
Progress Towards Strong, Sustainable, and Balanced Growth Figure 1: Recovery From Financial Crisis ( = First Quarter of Real GDP contraction) 13 125 196-26 AE Recessions' Range*** 196-26 AE Recessions**
Navigator. Now, next and how for business. UAE report
 Navigator Now, next and how for business UAE report 2 UAE An oil-price recovery and improving infrastructure will strengthen the UAE s status as a regional trade hub. Higher oil prices and a positive short-term
Global Debt and The New Neutral
 Global Debt and The New Neutral May 1, 2018 by Nicola Mai of PIMCO Back in 2014, PIMCO developed the concept of The New Neutral as a secular framework for interest rates. After the financial crisis, the
Teetering on the brink: is the world heading for another financial crisis?
 Teetering on the brink: is the world heading for another financial crisis? Adrian Cooper CEO & Chief Economist acooper@oxfordeconomics.com Peter Suomi Director petersuomi@oxfordeconomics.com October 2011
Charting Myanmar s Economy
 Charting Myanmar s Economy Designed to help executives catch up with the economy and incorporate macro impacts into company s planning. Annual subscription includes 2 semiannual issues published in June
Global Edge: to Manage the Risks of Cross-Border Business. Joel Kurtzman Chairman, Kurtzman Group
 Global Edge: Using the Opacity Index to Manage the Risks of Cross-Border Business Joel Kurtzman Chairman, Kurtzman Group Senior Fellow, Milken Institute Approach Today s hypercompetition changes the old
2017 Asia and Pacific Regional Economic Outlook:
 217 Asia and Pacific Regional Economic Outlook: Preparing for Choppy Seas Ranil Salgado International Monetary Fund Asia and Pacific Department May 12, 217 OAP Seminar Key messages and roadmap The near-term
UK ECONOMY SITUATION & PROSPECTS
 UK ECONOMY SITUATION & PROSPECTS 26 November 2013 Hermione Gough Counsellor Europe and Global Issues British Embassy Paris UNCLASSIFIED 1 The pace of recovery picked up further in Q3, with UK GDP expanding
Funds Europe & Funds Global Print and Online Audience 2017
 Funds Europe & Funds Global Print and Online Audience 2017 1 About Funds Europe & Funds Global...Page 3 Readership by Seniority....Page 4 Print Circulation. Page 5 Online Audience Page 6 Email Audience....
Air travel markets over the next two decades
 Air travel markets over the next two decades October 2016 Brian Pearce Chief Economist, IATA We ve enjoyed a long period of above-trend air travel growth 30% Growth in worldwide RPKs 25% 20% 15% 7 years
Global Economic Prospects
 Global Economic Prospects Back from the Brink? Andrew Burns World Bank Prospects Group April 12, 212 1 Amid some signs of improvement, global recovery remains fragile First quarter of 212 has been generally
Multi-asset capability Connecting a global network of expertise
 Multi-asset capability Connecting a global network of expertise For Professional Clients only Solutions aligned with investors' needs We have over 25 years of experience designing multi-asset solutions
2017 Mid-Year Commercial Real Estate Outlook for Asia Pacific
 2017 Mid-Year Commercial Real Estate Outlook for Asia Pacific REAL ASSETS REAL ESTATE INVESTING TEAM INVESTMENT INSIGHT 2017 The global macroeconomic landscape continues its shift away from highly accommodative
Global Consumer Confidence
 Global Consumer Confidence The Conference Board Global Consumer Confidence Survey is conducted in collaboration with Nielsen 4TH QUARTER 2017 RESULTS CONTENTS Global Highlights Asia-Pacific Africa and
Twenty-Third Meeting of the IMF Committee on Balance of Payments Statistics Washington, D.C. October 25-27, 2010
 BOPCOM-10/15 Twenty-Third Meeting of the IMF Committee on Balance of Payments Statistics Washington, D.C. October 25-27, 2010 Bilateral Cross-Border Holdings and Global Imbalances A View on the Eve of
Franklin Templeton Investments Our Global Perspective
 Greg Johnson Chief Executive Officer Franklin Resources, Inc. Franklin Templeton Investments Our Global Perspective Dealer Use Only / Not for Distribution to the Public World-Class Investment Management
Progress towards Strong, Sustainable and Balanced Growth. Figure 1: Recovery from Financial Crisis (100 = First Quarter of Real GDP Contraction)
") Progress towards Strong, Sustainable and Balanced Growth Figure 1: Recovery from Financial Crisis (100 = First Quarter of Real GDP Contraction) Source: OECD May 2014 Forecast, Haver Analytics, Rogoff and
Progress towards Strong, Sustainable and Balanced Growth Figure 1: Recovery from Financial Crisis (100 = First Quarter of Real GDP Contraction) Source: OECD May 2014 Forecast, Haver Analytics, Rogoff and
2016 External Sector Report
 216 External Sector Report Global Imbalances and Policy Challenges September, 216 o Evolution of Global Current Accounts and Exchange Rates Widening and reconfiguration of imbalances in 215 Drivers: Asymmetric
Economic Development. Business Plan to restated. Accountability Statement
 Economic Development Business Plan 1999-2000 to 2001-02 - restated Accountability Statement As a result of government re-organization announced on May 25, 1999, the Ministry Business Plans included in
Foresight March Foresight Issue 101. March visitbritain.org/research Follow us on VisitBritain Group LinkedIn
 Foresight March 2012 Foresight Issue 101 March 2012 visitbritain.org/research Follow us on Twitter: @VisitBritainBiz VisitBritain Group LinkedIn Foresight March 2012 2 Our market intelligence products
Global Helicopter Forecast
 Global Helicopter Forecast C&P untapped demand is rising Key world economies are still underequipped TOP 10 Countries in 2016 ( H/C fleet in service) U.S.A. Russia Canada Brazil Australia United Kingdom
OUTLOOK FOR THE GLOBAL ECONOMY AND TRAVEL
 January 2018 OUTLOOK FOR THE GLOBAL ECONOMY AND TRAVEL Adam Sacks President Tourism Economics @adam_sacks August 2018 Outline The Outlook for the Economy and Travel Views on the global economy Risks Will
Charting Mexico s Economy
 Charting Mexico s Economy Designed to help executives catch up with the economy and incorporate macro impacts into company s planning. Annual subscription includes 2 semiannual issues published in June
The Return on Investment of Brand USA Marketing Fiscal Year Analysis
 The Return on Investment of Brand USA Marketing 2013 Fiscal Year Analysis Contents Executive Summary... 3 1 The Need for Destination Marketing... 5 1.1 Fragmentation of the tourism sector... 6 1.2 The
The IMF s Experience with Macro Stress-Testing
 The IMF s Experience with Macro Stress-Testing ECB High Level Conference on Simulating Financial Instability Frankfurt July 12 13, 2007 Mark Swinburne Assistant Director Monetary and Capital Markets Department
Stress Testing zwischen Granularität und Geschwindigkeit
 Firm-Wide Stress Testing Restricted Stress Testing zwischen Granularität und Geschwindigkeit SAS forum Switzerland 2012 Alexandra Hansis May 2012 Why Stress Testing? Experience of the Crisis Severe losses
Actuarial Supply & Demand. By i.e. muhanna. i.e. muhanna Page 1 of
 By i.e. muhanna i.e. muhanna Page 1 of 8 040506 Additional Perspectives Measuring actuarial supply and demand in terms of GDP is indeed a valid basis for setting the actuarial density of a country and
Market Briefing: S&P 500 Forward Earnings & the Economy
 Market Briefing: S&P Forward Earnings & the Economy January, 18 Dr. Edward Yardeni 516-972-7683 eyardeni@ Joe Abbott 732-497-56 jabbott@ Mali Quintana 48-664-1333 aquintana@ Please visit our sites at www.
Global Select International Select International Select Hedged Emerging Market Select
 International Exchange Traded Fund (ETF) Managed Strategies ETFs provide investors a liquid, transparent, and low-cost avenue to equities around the world. Our research has shown that individual country
Presented at the Conference on China's Exchange Rate Policy, October 19, 2007, at the Peterson Institute, Washington, DC.
 A Scoreboard for Sovereign Wealth Funds Edwin M. Truman Senior Fellow Peterson Institute for International Economics Presented at the Conference on China's Exchange Rate Policy, October 19, 2007, at the
Global/Regional Economic and Financial Outlook. Odd Per Brekk Director IMF Regional Office for Asia and the Pacific APEC SFOM, June
 Global/Regional Economic and Financial Outlook Odd Per Brekk Director IMF Regional Office for Asia and the Pacific APEC SFOM, June 11-12 2015 2015/SFOM13/002 Session: 1 Global/Regional Economic and Financial
Chart Collection for Morning Briefing
 Chart Collection for Morning Briefing February 12, 219 Dr. Edward Yardeni 516-972-7683 eyardeni@ Mali Quintana 48-664-1333 aquintana@ Please visit our sites at blog. thinking outside the box 25 Figure
Funds Europe & Funds Global - Audience 2018
 Funds Europe & Funds Global - Audience 2018 1 About Funds Europe & Funds Global...Page 3 Readership by Seniority....Page 4 Print Circulation. Page 5 Online Audience Page 6 Email Audience.... Page 8 Media
Global Risk Outlook May 2016
 Global Risk Outlook May 2016 Scott Livermore Managing Director and COO slivermore@oxfordeconomics.com About Oxford Economics Oxford Economics is a world leader in global forecasting and quantitative analysis.
Forward-Looking Statements
 SEPTEMBER 15, 2009 Forward-Looking Statements Certain statements in this presentation may contain forward-looking statements. These forward-looking statements are identified by the use of terms and phrases
The Global Economic Crisis: Asia and the role of China Elliott School of International Affairs, George Washington University March 31, 2009
 The Global Economic Crisis: Asia and the role of China Elliott School of International Affairs, George Washington University March 31, 29 Anoop Singh Asia and Pacific Department IMF 1 Five key questions
Eurozone. EY Eurozone Forecast March 2015
 Eurozone EY Eurozone Forecast March 2015 Austria Belgium Cyprus Estonia Finland France Germany Greece Ireland Italy Latvia Lithuania Luxembourg Malta Netherlands Portugal Slovakia Slovenia Spain Outlook
Air Passenger Forecasts
 www.iata.org/pax-forecast Example report: numbers are for illustration purposes only Global report Page Table of Contents 1 Top Markets 2 Top Domestic Markets 3 Top International Country Pairs 4 Largest
Talent in Insurance 2015 The Netherlands in Focus. UK Financial Services Insight
 Talent in Insurance 2015 The Netherlands in Focus UK Financial Services Insight Report contents The Netherlands in Focus Key findings Macroeconomic and industry context Survey findings 2 Key findings 3
First Half 2007 Management Report
 First Half 2007 Management Report H1 2007 key figures in millions of euros H1 2006 H1 2007 07/06 as published 07/06 ex.currency Total revenue 5,483 5,629 +2.7% +6.3%* Operating income recurring 807 856
Appendix 1. Outline of BOP-Related Statistics and Release Schedule. The following is an overview of major BOP-related statistics.
 Appendix 1. Outline of BOP-Related Statistics and Release Schedule Outline of BOP-related statistics BOP-related statistics can be broadly divided into (1) flow data on various transactions and the associated
Highlights and key messages for business and public policy
 Highlights and key messages for business and public policy Key projections 2018 2019 Real GDP growth 1.5% 1.6% Consumer spending growth 1.1% 1.3% Inflation (CPI) 2.7% 2.3% Source: PwC main scenario projections
Recent Recent Developments 0
 Recent Developments 0 Global activity has slowed noticeably World Trade (annualized percent change of three month moving average over previous three month moving average) Purchasing Managers Index (PMI)
FRANKLIN TEMPLETON INVESTMENTS. Franklin Resources, Inc. Bank of America Merrill Lynch Banking and Financial Services Conference November 18, 2010
 Franklin Resources, Inc. Bank of America Merrill Lynch Banking and Financial Services Conference November 18, 2010 Forward-Looking Statements The financial results in this presentation are preliminary.
Teaching Limited by Student Needs Scale, Eighth Grade
 Teaching Limited by Student Needs Scale, Eighth Grade The Teaching Limited by Student Needs (LSN) scale was created based on teachers responses concerning six needs described below. Items in the TIMSS
The Return on Investment of Brand USA Marketing. Fiscal Year 2015
 The Return on Investment of Brand USA Marketing Fiscal Year 2015 May 2016 Table of contents Executive summary 3 Section 1: The vital role of destination promotion 5 Section 2: Market performance 9 Section
Growth has peaked amidst escalating risks
 OECD ECONOMIC OUTLOOK Growth has peaked amidst escalating risks 1 November 18 Ángel Gurría OECD Secretary-General Laurence Boone OECD Chief Economist http://www.oecd.org/eco/outlook/economic-outlook/ ECOSCOPE
Investment Development Authority of Lebanon Arab Spanish Investment Forum 2011
 Investment Development Authority of Lebanon Arab Spanish Investment Forum 2011 Wednesday October 26 th Headlines 1. ABOUT LEBANON 2. CURRENT TRENDS IN SPANISH LEBANESE TRADE 3. SPANISH COMPANIES AND LEBANON
Outlook for the Economy and Travel Outlook for the Global Economy and Travel
 Outlook for the Economy and Travel Outlook for the Global Economy and Travel Adam Sacks President Tourism Economics @adam_sacks Adam Sacks President Tourism Economics @adam_sacks Outline The Outlook for
Saudi Arabia at a Glance
 Invest Saudi Table of Contents Saudi Arabia at a Glance Saudi Arabia Economy Why Invest in Saudi? Key Incentives Available for Investors Strategic Sectors & Opportunities Investments We Value the Most
Re-assessing the Arab-European Financial Relationship: Continuity in the Middle East, Change in Europe
 Re-assessing the Arab-European Financial Relationship: Continuity in the Middle East, Change in Europe Andrew Cunningham Founder Darien Middle East www.darienmiddleeast.com French-Arab Banking Dialogue
The Economic Impact of Tourism in Fairfield County, Ohio. June 2016
 The Economic Impact of Tourism in Fairfield County, Ohio June 2016 Fairfield County tourism summary Fairfield County Tourism Sales ($) Top quintile Middle quintile First quintile 2 Overview Tourism is
EXPORT PERFORMANCE MONITOR
 Export Performance Monitor Statistics department, EEPC Head Office Exports growing steadily According to the provisional data available from DGCI&S up to September 2007, Exports during September, 2007
Market Correlations: CRB Raw Industrials Spot Price Index
 Market Correlations: Spot Price Index December 15, 2017 Dr. Edward Yardeni 516-972-7683 eyardeni@ Debbie Johnson 480-664-1333 djohnson@ Mali Quintana 480-664-1333 aquintana@ Please visit our sites at www.
Travel Insurance and Assistance in the Asia-Pacific Region
 Travel Insurance and Assistance in the Asia-Pacific Region Report Prospectus October 2013 Web: www.finaccord.com. E-mail: info@finaccord.com 1 Prospectus contents Page What is the research? What methodology
A Global Economic and Market Outlook
 A Global Economic and Market Outlook Presented by Dr Chris Caton December 2008 US Housing starts and Permits 2.3 (Millions) Permits Starts 2.1 1.9 1.7 1.5 1.3 1.1 0.9 0.7 96 97 98 99 00 01 02 03 04 05
Capital Account Management in Brazil
 RETHINKING MACRO POLICY II: FIRST STEPS AND EARLY LESSONS APRIL 16 17, 2013 Capital Account Management in Brazil Marcio Holland Secretary of Economic Policy Ministry of Finance, Brazil Paper presented
SANGAM GLOBAL PHARMACEUTICAL & REGULATORY CONSULTANCY
 SANGAM GLOBAL PHARMACEUTICAL & REGULATORY CONSULTANCY Regulatory Affairs Worldwide An ISO 9001:2015 Certified Company Welcome to Sangam Global Pharmaceutical & Regulatory Consultancy (SGPRC) established
Stock Market Briefing: S&P 500 Revenues & the Economy
 Stock Market Briefing: S&P Revenues & the Economy December 21, 217 Dr. Edward Yardeni 16-972-7683 eyardeni@ Joe Abbott 732-497-36 jabbott@ Mali Quintana 48-664-1333 aquintana@ Please visit our sites at
A short history of debt
 A short history of debt In the words of the late Charles Kindleberger, debt/financial crises are a hardy perennial we have been here many times before. Over the past decade and a half the ratio of global
TAX REFORM TO IMPROVE TAX COMPLIANCE
 TAX REFORM TO IMPROVE TAX COMPLIANCE Juan Toro IMF s Fiscal Affairs Department -- Assistant Director 7th IMF-Japan High-Level Tax Conference For Asian Countries Tokyo, April 5-7, 2016 Outline Challenges
ASEAN Snapshot. Special Coverage On Tourism May 2018 ASEAN ESTABLISHMENT ASEAN ECONOMIC PERFORMANCE ASEAN COUNTRIES DECLARED INDEPENDENCE
 Snapshot Special Coverage On Tourism May 2018 The Association of Southeast Asian Nations () was established on 08 August 1967 in Bangkok,, with the signing of the Declaration. -10 was formed when the 10th
10 reasons to invest in France
 October 2009 10 reasons to invest in France IFA Keys to understanding the new France 2 1 An economy with a global outlook Foreign companies employ over 2.8 million people in France at 23,000 different
Stronger growth, but risks loom large
 OECD ECONOMIC OUTLOOK Stronger growth, but risks loom large Ángel Gurría OECD Secretary-General Álvaro S. Pereira OECD Chief Economist ad interim Paris, 3 May Global growth will be around 4% Investment
Unprecedented Change. Investment opportunities in an ageing world JUNE 2010 FOR PROFESSIONAL ADVISERS ONLY
 Unprecedented Change Investment opportunities in an ageing world Baring Asset Management Limited 155 Bishopsgate London EC2M 2XY Tel: +44 (0)20 7628 6000 Fax: +44 (0)20 7638 7928 www.barings.com JUNE 2010
Travel Insurance and Assistance
 Travel Insurance and Assistance Worldwide research covering over 40 countries Series Prospectus Finaccord 1 Prospectus contents Page What is the research? Which countries are covered What methodology has
Charting Brunei s Economy
 Charting Brunei s Economy Designed to help executives catch up with the economy and incorporate macro impacts into company s planning. Annual subscription includes 2 semiannual issues published in June
VEDP QUARTERLY ECONOMIC UPDATE
 VEDP QUARTERLY ECONOMIC UPDATE September 2016 VIRGINIA ECONOMIC DEVELOPMENT PARTNERSHIP YESVIRGINIA.ORG 1 US ECONOMIC OUTLOOK 1 8% - Source: Consensus Forecasts, September 2016 2 US WEEKLY INDICATORS 5%
Chart Collection for Morning Briefing
 Chart Collection for Morning Briefing December 19, 216 Dr. Edward Yardeni 516-972-7683 eyardeni@ Mali Quintana 48-664-1333 aquintana@ Please visit our sites at www. blog. thinking outside the box 38 36
UK Economic Outlook March 2017
 www.pwc.co.uk/economics Contents 1 2 3 4 Global outlook UK economic trends and prospects Consumer spending prospects after Brexit Will robots steal our jobs? 2 Global growth in 2017 should be slightly
Market Briefing: Gold
 Market Briefing: Gold January 3, 218 Dr. Edward Yardeni 516-972-7683 eyardeni@ Mali Quintana 48-664-1333 aquintana@ Please visit our sites at www. blog. thinking outside the box Table Of Contents Table
Global Economic Outlook
 Global Economic Outlook The Institute of Strategic and International Studies Kuala Lumpur, November 2012 Mangal Goswami Mangal Goswami Deputy Director IMF Singapore Regional Training Institute Action Needed
Chart Collection for Morning Briefing
 Chart Collection for Morning Briefing February 7, 1 Dr. Edward Yardeni 1-97-73 eyardeni@ Mali Quintana --1333 aquintana@ Please visit our sites at www. blog. thinking outside the box 3 3 Figure 1. S&P
The effects of the financial crisis on developing countries mapping out the issues. By Julian Jessop
 The effects of the financial crisis on developing countries mapping out the issues By Julian Jessop 1. Plan of My Talk The outlook for advanced economies. Impact on developing countries. Some losers and
COUNTRY COST INDEX JUNE 2013
 COUNTRY COST INDEX JUNE 2013 June 2013 Kissell Research Group, LLC 1010 Northern Blvd., Suite 208 Great Neck, NY 11021 www.kissellresearch.com Kissell Research Group Country Cost Index - June 2013 2 Executive
Marine. Global Programmes. cunninghamlindsey.com. A Cunningham Lindsey service
 Marine Global Programmes A Cunningham Lindsey service Marine global presence Marine Global Programmes Cunningham Lindsey approach Managing your needs With 160 marine surveyors and claims managers in 36
Asia and the Pacific: Economic Outlook and Drivers
 2018/FDM1/004 Session 2.1 Asia and the Pacific: Economic Outlook and Drivers Purpose: Information Submitted by: International Monetary Fund Finance and Central Bank Deputies Meeting Port Moresby, Papua
Chikahisa Sumi Director, Regional Office for Asia and the Pacific International Monetary Fund
 Chikahisa Sumi Director, Regional Office for Asia and the Pacific International Monetary Fund (percent YOY) 8 6 Real GDP Growth ASSUMPTIONS A more gradual monetary policy normalization 4 2 21 211 212
Contents. 1. Working with Barclays 2. Bespoke client solutions 3. Your Barclays team 4. Appendix 5. Client case studies. 2 Offshore Corporate
 Offshore Corporate Contents 1. Working with Barclays 2. Bespoke client solutions 3. Your Barclays team 4. Appendix 5. Client case studies 2 Offshore Corporate Working with Barclays 3 Offshore Corporate
Foreign Investment Statistics
 2012-2013 Released Date: May 2015 Table of Contents Introduction....4 Key Points......5 Total Stock of Foreign Investment (FI) by Economic Activity....6 Foreign Direct Investment (FDI) by Economic Activity.......8
Monthly Update of the ASEAN+3 Regional Economic Outlook (AREO)
") Monthly Update of the ASEAN+3 Regional Economic Outlook (AREO) Special Edition ASEAN+3 Macroeconomic Research Office (AMRO) Singapore January 2018 This Monthly Update of the AREO was prepared by the Regional
Monthly Update of the ASEAN+3 Regional Economic Outlook (AREO) Special Edition ASEAN+3 Macroeconomic Research Office (AMRO) Singapore January 2018 This Monthly Update of the AREO was prepared by the Regional
Travel Insurance and Assistance
 Travel Insurance and Assistance Worldwide research covering over 40 countries Series Prospectus Finaccord Web: www.finaccord.com. E-mail: info@finaccord.com 1 Prospectus contents Page What is the research?
Global growth weakening as some risks materialise
 OECD INTERIM ECONOMIC OUTLOOK Global growth weakening as some risks materialise 6 March 2019 Laurence Boone OECD Chief Economist http://www.oecd.org/eco/outlook/economic-outlook/ ECOSCOPE blog: oecdecoscope.wordpress.com
Tracking the Growth Catalysts in Emerging Markets
 Tracking the Growth Catalysts in Emerging Markets September 14, 2016 by Nick Niziolek of Calamos Investments The following is an excerpt of remarks made on August 30, 2016. The majority of the improved
San Francisco Retiree Health Care Trust Fund Education Materials on Public Equity
 M E K E T A I N V E S T M E N T G R O U P 5796 ARMADA DRIVE SUITE 110 CARLSBAD CA 92008 760 795 3450 fax 760 795 3445 www.meketagroup.com The Global Equity Opportunity Set MSCI All Country World 1 Index
The beat goes on 10 Deloitte A Middle East Point of View Summer 2015
 The beat goes on 10 Deloitte A Middle East Point of View Summer 2015 Construction Despite lower oil prices, the forecast for construction projects awarded in the Gulf Cooperation Council (GCC) countries