Transitions. Population and Economic Trends for Colorado and Garfield County
|
|
|
- Morris Holland
- 6 years ago
- Views:
Transcription
1 Transitions Population and Economic Trends for Colorado and Garfield County Elizabeth Garner State Demography Office Colorado Department of Local Affairs Summer
2 Main Points Growing Forward Income Migration Aging Growth Ethnicity/race.
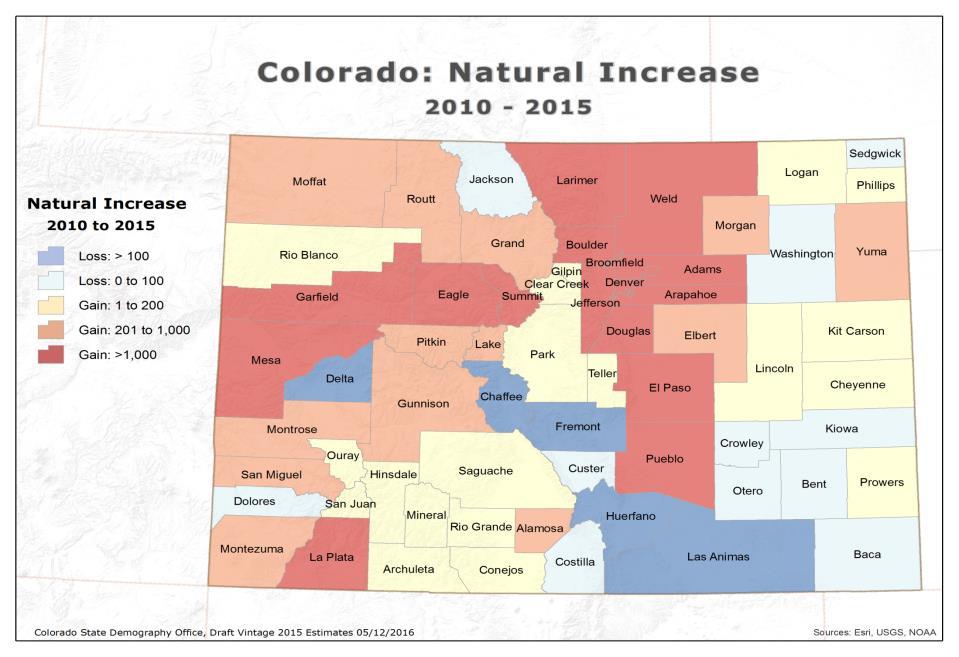
3 Big Picture Pop Change US million, million or.8% Colorado - 5,456,500 Ranked 2 nd fastest 1.9% - ND, 7 th absolute growth 101,000 TX, FL, CA, GA,WA, NC Range in Colorado +18,500 to % to -1.7%

4

5
6
7
8
9 Population Change by Place Areaname Pct Ch Total Ch GARFIELD COUNTY 56,150 56,052 56,835 57,103 57,484 58, % 1932 Carbondale 6,395 6,384 6,463 6,493 6,548 6, % 251 Glenwood Springs 9,571 9,543 9,663 9,816 9,846 9, % 338 New Castle 4,495 4,485 4,541 4,548 4,597 4, % 168 Parachute 1,080 1,074 1,090 1,091 1,095 1, % 23 Rifle 9,136 9,116 9,229 9,246 9,277 9, % 223 Silt 2,915 2,911 2,967 2,978 3,008 3, % 131 Unincorp. Area 22,558 22,539 22,882 22,931 23,113 23, % 798
10
11 1970 5, , , ,000
12

13
14 100,000 80,000 Colorado New Jobs and Net Migration New Jobs Net Migration 60,000 40,000 20, ,000-40,000 Source: State Demography Office

15
16 Garfield County Total Estimated Jobs 37,000 35,000 33,000 31,000 29,000 27,000 25, Recession Employment
17 Garfield Employment in 2015 as a % of 2008 Employment Source: SDO Total Estimated Jobs Series Utilities Education Health Services Admin and waste Agriculture Arts Government Accommodation and food Other services, except public administration Manufacturing Management of companies and enterprise Real estate Professional and business services Total Wholesale trade Finance activities Retail Trade Transportation and warehousing Information Construction Mining 57% 68% 74% 101% 100% 97% 96% 94% 94% 92% 90% 86% 86% 84% 127% 124% 118% 115% 112% 111% 137% 0% 20% 40% 60% 80% 100% 120% 140% 160%
18 Forecast
19 Population forecast methodology Economic forecast Cohort-component Jobs - 2 nd & 3 rd job - Commuters +Births - Deaths + Net Migration X LFPR Labor Demand Labor Supply Differences resolved by net migration

20

21 State 2.8M Front Range 2.4M Denver Metro 1.5 M North Front Range 500K South Front Range 400K Rest of State 400K

22 Forecast 2014v
23
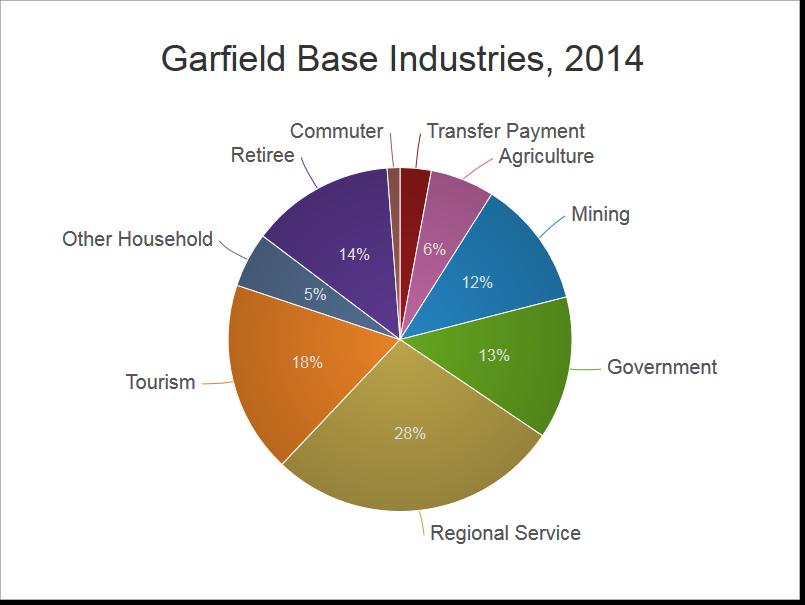
24 Driver and Local Resident Service Jobs and Forecast for Garfield 2015 Jobs Share of Total 2030 Jobs Share of Total TRADITIONAL 5,644 17% 6,952 15% REGIONAL & NATIONAL SERVICES 5,926 18% 7,815 17% TOURISM 3,779 11% 4,308 9% RETIREE GENERATED JOBS 3,047 9% 7,082 15% PUBLIC ASST. GENERATED JOBS 587 2% 672 1% INVESTMENT INCOME & WEALTH 1,078 3% 1,444 3% TOTAL DIRECT BASIC JOBS 20,287 61% 28,381 61% LOCAL RESIDENT SERVICE 13,087 39% 18,318 39% TOTAL JOBS 33, % 46, %

25

26

27 Source: State Demography Office

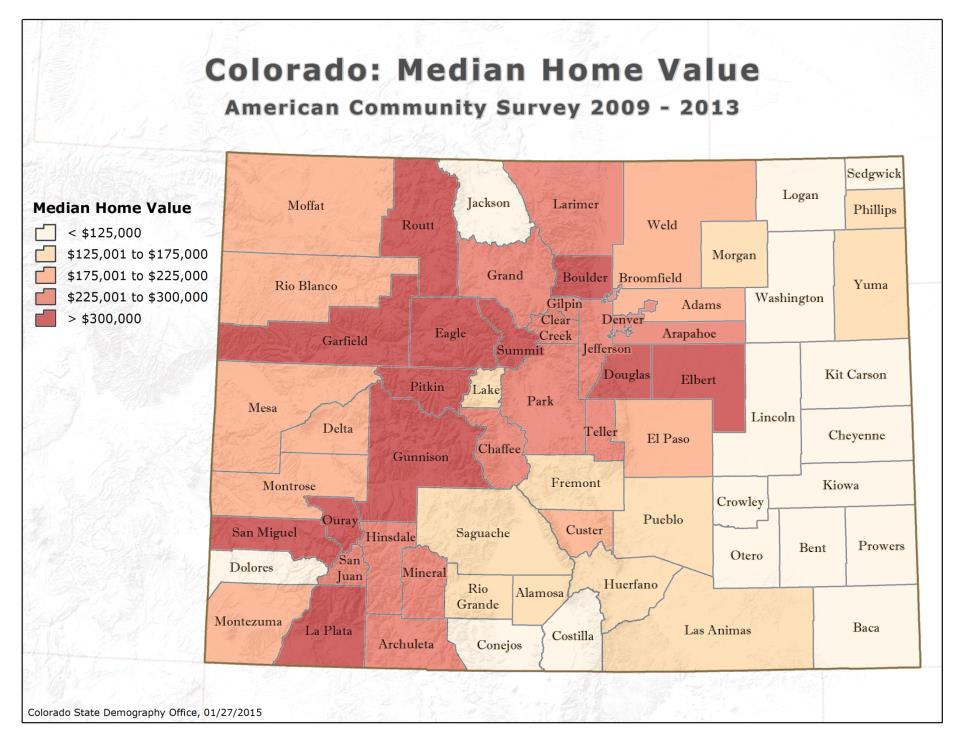
28 Median Home Value
29

30
31 I M Age G E
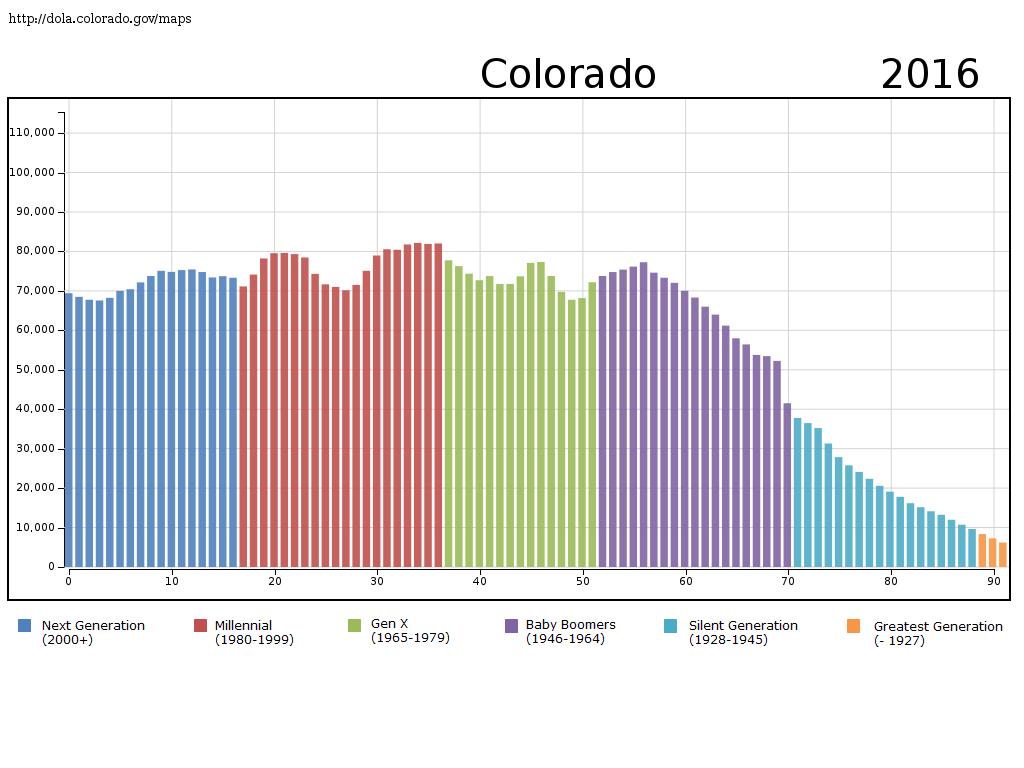
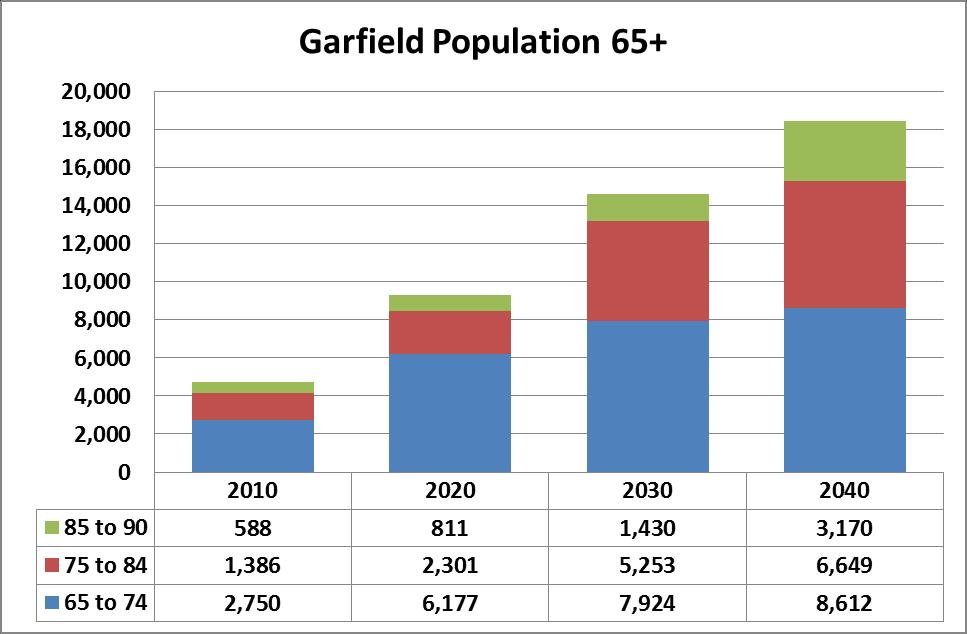
32 Why Are We Getting Old Fast? Currently very few people over the age th lowest share of all states in US (10%) Baby Boomers Born ,340,000 Boomers in Colorado (26% of pop. in 2010) By 2030, Colorado s population 65+ will be 125% larger than it was in 2010 growing from 555,000 to 1,243,000. (just from aging) Transition age distribution from young to more US average between 2010 and State Demography Office, Census Bureau

33
34
35 Map 65+ change
36
37 Aging Issues in the Western Slope Numbers Economic Driver - wealthier. depends Spending of people 65+ supported approximately 137,000 jobs in (.25 jobs per person 65+) Impact on occupational mix Labor Force increase in demand for workers Housing - Retirees aging in place where do new workers live? Incomes Health/Disabilities Transportation How to attract and retain the young adult?
38 Labor Force tightening forces Female share of the labor force peaked in 2010 at 46%. Structural labor force participation rates peaked in Growth in Leavers (exiting the labor force) will create more demand for workers. Fewer Gen X Higher un/under employment for year olds. Other states experiencing same concerns. Aging around the world.
39 Millennial
40 Aging and Public Finance Ratio of 65+ per year olds in CO Becoming more normal End of the demographic dividend Public Finance change in revenue and expenditures. Income tax downward pressure Sales tax downward pressure Property tax downward pressure Health services increasing Medicaid increasing Transition
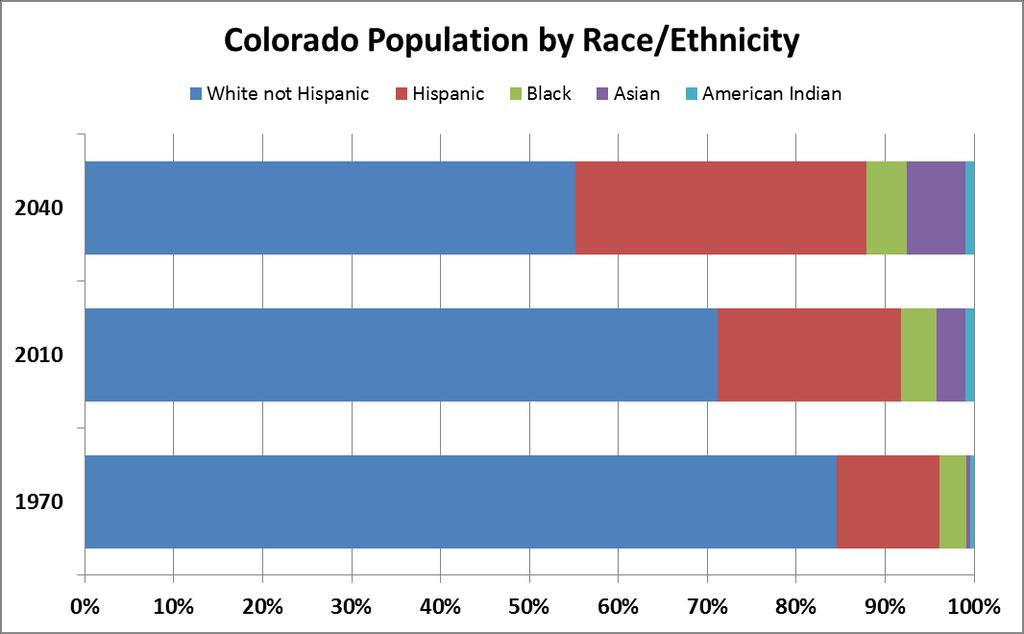
41 I M A G Ethnicity/Race increasing

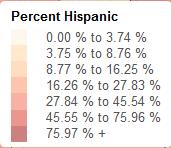
42 Percent Hispanic
43

44 Census Bureau
45 Share of Net Increase in Working Age Population, American Indian, NH Black, NH White, NH Asian, NH Hispanic 0% 20% 40% 60% 80%

46 Source ACS yr PUMS


47 Source ACS yr
48 Income M A G E
49 Household Income.its future is demographically challenged. Age distributions End of Demographic Dividend Occupational Mix high and low service More race/ethnicity diverse especially at young end but achievement gap is growing as well. Household type and size single and smaller. Youth un and under employment - Long term permanent impacts on earnings. State Demography Office
50 To Ponder in My Community Income Challenges how could downward pressure impact our community? Migration how much, where, and can we compete for the best and the brightest? Aging we are getting old fast, is my community ready for the changes to the labor force, income, industrial mix, housing, etc. Growth disparate across the state, what is causing it and what can be done? Ethnic/race diversity increasing and aging into labor force. Educational attainment gap continues putting downward pressure on income.
51 Thank you State Demography Office Department of Local Affairs Elizabeth Garner


52 Source: Bureau of Labor Statistics Consumer Expenditure Survey ( )

53 Source: Bureau of Labor Statistics Consumer Expenditure Survey ( )
Transitions. Population and Economic Trends for Colorado
 Transitions Population and Economic Trends for Colorado Cindy DeGroen State Demography Office Colorado Department of Local Affairs 2016 www.colorado.gov/demography State Demography Office State agency
Colorado and Eagle County
 Colorado and Eagle County Population and Economic Transitions Vail Symposium 2017 Elizabeth Garner State Demography Office Colorado Department of Local Affairs Demography.dola.colorado.gov Ideas Demographics
Transitions. Population and Economic Trends For Northern Colorado
 Transitions Population and Economic Trends For Northern Colorado EDCC 2017 Elizabeth Garner State Demography Office Colorado Department of Local Affairs Demography.dola.colorado.gov Transitions to Watch
Growing Colorado. Population Transitions In Boulder
 Growing Colorado Population Transitions In Boulder Elizabeth Garner State Demography Office Colorado Department of Local Affairs 2018 Demography.dola.colorado.gov Transitions to Watch Disparate growth
Regional Issues Forum Labor Force Trends in Northern Colorado
 Regional Issues Forum Labor Force Trends in Northern Colorado Elizabeth Garner State Demography Office Colorado Department of Local Affairs 2015 www.colorado.gov/demography Big Picture - 2013-2014 Pop
POPULATION AND ECONOMIC OVERVIEW. State Demography Office Colorado Department of Local Affairs February 2014
 POPULATION AND ECONOMIC OVERVIEW State Demography Office Colorado Department of Local Affairs February 2014 Big Picture 2011-2012 Pop Change US 313 million, + 2.3 million or.7% Colorado 5,189,458, + 70,157
Rifle city Demographic and Economic Profile
 Rifle city Demographic and Economic Profile Community Quick Facts Population (2014) 9,289 Population Change 2010 to 2014 156 Place Median HH Income (ACS 10-14) $52,539 State Median HH Income (ACS 10-14)
Monte Vista Population, ,744 4,651 4,564 4,467 4,458 4,432 4,451
 1 Monte Vista 4,8 4,7 4,6 4,5 4,4 4,3 4,2 4,1 4,61 4,612 4,61 4,676 Monte Vista, 2-213 4,744 4,651 4,564 4,467 4,458 4,432 4,451 4,418 4,412 4,355 2 21 22 23 24 25 26 27 28 29 21 211 212 213 Year Monte
DEMOGRAPHY AND THE ECONOMY
 DEMOGRAPHY AND THE ECONOMY David Keyser State Demography Office September 22, 2011 Colorado.gov/demography Demography Powerful Big changes often predictable Informative Today Information about us Role
NORTH CENTRAL COLORADO
 DOLA Planning and Management Region 2 Socioeconomic Profile Regional Profile NORTH CENTRAL COLORADO The central work of the State Demography Office is the research and production of population data and
Regional Socio-Economic Profile
 Overview The central work of the State Demography Office is the research and production of population data and information and of the forces (fertility, mortality, migration) that lead to population change.
ECONOMIC OUTLOOK GROWING BUT SLOWING. Chris Akers State Demography Office November 4, 2016
 z ECONOMIC OUTLOOK GROWING BUT SLOWING Chris Akers State Demography Office November 4, 2016 OVERVIEW Global Economic Outlook Better in 2017 U.S. Economic Overview Slowing Job Growth Colorado 2015 Economic
Minnesota Energy Industry
 Energy Industry Jobs Q3 2000 Q3 2001 Q3 2002 Q3 2003 Q3 2004 Q3 2005 Q3 2006 Q3 2007 Q3 2008 Q3 2009 Q3 2010 Q3 2011 Q3 Q3 Q3 Q3 Q3 2016 Minnesota Energy Consortium April 13, 2017 Cameron Macht DEED Labor
TRENDS ONLINE. Updated Release of Local Economic Data Last updated April 3, 2018; Some annual figures not yet available for 2017
 TRENDS ONLINE Updated Release of Local Economic Data Last updated April 3, 2018; Some annual figures not yet available for 2017 Labor Market Data (Source: US Department of Labor, Bureau of Labor Statistics
Economic Overview City of Tyler, TX. January 8, 2018
 Economic Overview City of Tyler, TX January 8, 2018 DEMOGRAPHIC PROFILE...3 EMPLOYMENT TRENDS...5 WAGE TRENDS...5 COST OF LIVING INDEX...6 INDUSTRY SNAPSHOT...7 OCCUPATION SNAPSHOT...9 INDUSTRY CLUSTERS...
Economic Overview York County, South Carolina. February 14, 2018
 Economic Overview York County, February 14, 2018 DEMOGRAPHIC PROFILE... 3 EMPLOYMENT TRENDS... 5 UNEMPLOYMENT RATE... 5 WAGE TRENDS... 6 COST OF LIVING INDEX... 6 INDUSTRY SNAPSHOT... 7 OCCUPATION SNAPSHOT...
From Crisis to Transition Demographic trends and American housing futures, with lessons from Texas
 From Crisis to Transition Demographic trends and American housing futures, with lessons from Texas Rolf Pendall, Ph.D. The Urban Institute Presentation to the Bipartisan Housing Commission, San Antonio,
Ravenna s most significant growth occurred before Between 1960 and 1980 the city s population declined by 8.5%.
 DRAFT Ravenna Comprehensive Plan Draft May 2008 1 A Profile of Ravenna This section examines demographic trends that will affect Ravenna. The analysis examines population and demographic dynamics, including
CURRENT DEMOGRAPHICS & CONTEXT GROWTH FORECAST SOUTHERN CALIFORNIA ASSOCIATION OF GOVERNMENTS APPENDIX
 CURRENT DEMOGRAPHICS & CONTEXT GROWTH FORECAST SOUTHERN CALIFORNIA ASSOCIATION OF GOVERNMENTS APPENDIX PROPOSED FINAL MARCH 2016 INTRODUCTION 1 FORECASTING PROCESS 1 GROWTH TRENDS 2 REGIONAL GROWTH FORECAST
BROWARD COUNTY LABOR FORCE
 BROWARD COUNTY LABOR FORCE Broward County s has a workforce of 978,000 people, including 54,000 self-employed. Twenty-three percent of residents commute to a job outside Broward County and five percent
ECONOMIC OVERVIEW DuPage County, Illinois
 ECONOMIC OVERVIEW DuPage County, Illinois DEMOGRAPHIC PROFILE... 3 EMPLOYMENT TRENDS... 5 UNEMPLOYMENT RATE... 5 WAGE TRENDS... 6 COST OF LIVING INDEX... 7 INDUSTRY SNAPSHOT... 8 OCCUPATION SNAPSHOT...
The Health of Jefferson County: 2010 Demographic Update
 The Health of : 2010 Demographic Update BACKGROUND How people live the sociodemographic context of their lives influences their health. People who have lower incomes may not have the resources to meet
2016 Labor Market Profile
 2016 Labor Market Profile Prepared by The Tyler Economic Development Council Tyler Area Sponsor June 2016 The ability to demonstrate a regions availability of talented workers has become a vital tool
Sussex Demographic and Labor Market Trends
 Sussex Demographic and Labor Market Trends Ed Simon (302) 672-6845 edward.simon@state.de.us October 2012 Introduction Statistical Update Economic and labor market update for 2012 Is Sussex doing better?
TRENDS ONLINE. Updated Release of Local Economic Data Last updated September 26, 2018
 TRENDS ONLINE Updated Release of Local Economic Data Last updated September 26, 2018 Labor Market Data (Source: US Department of Labor, Bureau of Labor Statistics Annual Employment Data Shows Labor Force
Utah s Long Run Demographic Trends: Evolving Community Contexts
 Utah s Long Run Demographic Trends: Evolving Community Contexts Pamela S. Perlich, Ph.D. Director, Demographic Research Kem C. Gardner Policy Institute, University of Utah GROWTH Intermountain States Population:
Economic Overview. Lawrence, KS MSA
 Economic Overview Lawrence, KS MSA March 5, 2019 DEMOGRAPHIC PROFILE... 3 EMPLOYMENT TRENDS... 5 UNEMPLOYMENT RATE... 5 WAGE TRENDS... 6 COST OF LIVING INDEX... 7 INDUSTRY SNAPSHOT... 8 OCCUPATION SNAPSHOT...
Metro Houston Population Forecast
 Metro Houston Population Forecast Projections to 2050 Prepared by the Greater Houston Partnership Research Department Data from Texas Demographic Center www.houston.org April 2017 Greater Houston Partnership
Mike Alexander, AICP Research and Analytics Division Manager Atlanta Regional Commission
 Making the Case: THE NEW ECONOMY of an Aging Population in Metropolitan Atlanta Mike Alexander, AICP Research and Analytics Division Manager Atlanta Regional Commission malexander@atlantaregional.com For
West Central Colorado Service Area
 West Central Colorado Service Area Region 10 Services Regional Development Services Economic Development District/Economic Development Strategy Regional Transit/Transportation Planning Enterprise Zone
City of Edmonton Population Change by Age,
 Population Change by Age, 1996-2001 2001 Edmonton Demographic Profile The City of Edmonton s 2001population increased by 49,800 since the 1996 census. Migration figures are not available at the municipal
White Pine County Economic Overview
 Economic Overview Population (2016) 10,105 Jobs (2016) 4,597 Average Earnings (2016) $65,033 Unemployed (2/2016) 229 GRP (2014) $996,944,330 Exports (2014) $1,789,478,088 Imports (2014) $1,181,738,119
Community and Economic Development
 192 193 194 195 196 197 198 199 2 21 22 23 24 2-1 Lycoming County Comprehensive Plan Update 218 Community and Economic Development At a Glance Over the last ten years, has experienced a decline in population,
How Economic Security Changes during Retirement
 How Economic Security Changes during Retirement Barbara A. Butrica March 2007 The Retirement Project Discussion Paper 07-02 How Economic Security Changes during Retirement Barbara A. Butrica March 2007
Sussex Demographic and Labor Market Trends
 Sussex Demographic and Labor Market Trends Ed Simon (302) 672-6845 edward.simon@state.de.us October 2013 Introduction Statistical Update Differences among the regions in Sussex Demographic, economic and
Oregon Population Forecast Program Regional Forecast Meeting - September 23, 2014
 Oregon Population Forecast Program Regional Forecast Meeting - September 23, 2014 Presentation by Population Forecast Program Team CURRY COUNTY Oregon Population Forecast Program Project Team Xiaomin Ruan,
THE HOME BUYERS OF TOMORROW. September 8, 2016 Azad Amir-Ghassemi Research Analyst
 THE HOME BUYERS OF TOMORROW September 8, 2016 Azad Amir-Ghassemi Research Analyst METHODOLOGY Online Only Survey conducted from January 2016- February 2016 1871 respondents: 633 Emerging Millennials (18-25);
Economic Overview Western New York
 Report created on August 29, 2017 Economic Overview Western New Contact: Lisa.Montiel@suny.edu DEMOGRAPHIC PROFILE... 3 EMPLOYMENT TRENDS... 5 UNEMPLOYMENT RATE... 5 WAGE TRENDS... 6 COST OF LIVING INDEX...
Town Profiles: Demographic, Economic, and Housing Statistics for De Smet City and Wall Town, SOuth Dakota
 South Dakota State University Open PRAIRIE: Open Public Research Access Institutional Repository and Information Exchange Census Data Center News Releases SDSU Census Data Center 12-7-2017 Town Profiles:
Florida: An Economic Overview
 Florida: An Economic Overview December 26, 2018 Presented by: The Florida Legislature Office of Economic and Demographic Research 850.487.1402 http://edr.state.fl.us Shifting in Key Economic Variables
Garfield County. Socio-Economic Impact Study. Volume 1: Socio-Economic Study and Projections
 Final Report Garfield County Socio-Economic Impact Study Volume 1: Socio-Economic Study and Projections Volume 2: Socio-Economic Model User s Guide and Technical Documentation FINAL REPORT January 17,
Written Statement for the. Subcommittee on Long-Term Growth and Debt Reduction. Senate Committee on Finance
 T-146 Written Statement for the Subcommittee on Long-Term Growth and Debt Reduction Senate Committee on Finance Hearing on: Small Business Pension Plans: How Can We Increase Worker Coverage? Thursday,
Demographic and Economic Profile. North Dakota. Updated June 2006
 Demographic and Economic Profile North Dakota Updated June 2006 Metro and Nonmetro Counties in North Dakota Based on the most recent listing of core based statistical areas by the Office of Management
Economic Overview New York
 Report created on October 20, 2015 Economic Overview Created using: Contact: Lisa.Montiel@suny.edu DEMOGRAPHIC PROFILE...3 EMPLOYMENT TRENDS...5 UNEMPLOYMENT RATE...5 WAGE TRENDS...6 COST OF LIVING INDEX...6
Economic Overview 45-Minute Commute From Airport Park. June 6, 2017
 Economic Overview 45-Minute Commute From Airport Park June 6, 2017 DEMOGRAPHIC PROFILE... 3 EMPLOYMENT TRENDS... 5 WAGE TRENDS... 5 COST OF LIVING INDEX... 6 INDUSTRY SNAPSHOT... 7 OCCUPATION SNAPSHOT...
Economic Overview Monterey County, California. July 22, 2016
 Economic Overview Monterey July 22, 2016 DEMOGRAPHIC PROFILE... 3 EMPLOYMENT TRENDS... 5 UNEMPLOYMENT RATE... 5 WAGE TRENDS... 6 COST OF LIVING INDEX... 6 INDUSTRY SNAPSHOT... 7 OCCUPATION SNAPSHOT...
TABLE OF CONTENTS INTRODUCTION... 1
 TABLE OF CONTENTS INTRODUCTION... GENERAL WORKFORCE TRENDS... 3 General Workforce Trends and Comparisons Overview... 5 State Government Employees to State Population... 6 State Government Full-Time Equivalent
Economic Overview Long Island
 Report created on October 20, 2015 Economic Overview Long Island Created using: Contact: Lisa.Montiel@suny.edu DEMOGRAPHIC PROFILE...3 EMPLOYMENT TRENDS...5 UNEMPLOYMENT RATE...5 WAGE TRENDS...6 COST OF
DEMOGRAPHIC PROFILE...3 EMPLOYMENT TRENDS...5 UNEMPLOYMENT RATE...5 WAGE TRENDS...6 COST OF LIVING INDEX...6 INDUSTRY SNAPSHOT...7
 March 14, 2017 DEMOGRAPHIC PROFILE...3 EMPLOYMENT TRENDS...5 UNEMPLOYMENT RATE...5 WAGE TRENDS...6 COST OF LIVING INDEX...6 INDUSTRY SNAPSHOT...7 OCCUPATION SNAPSHOT...9 INDUSTRY CLUSTERS... 12 EDUCATION
Economic Overview Loudoun County, Virginia. October 23, 2017
 Economic Overview October 23, 2017 DEMOGRAPHIC PROFILE... 3 EMPLOYMENT TRENDS... 5 UNEMPLOYMENT RATE... 5 WAGE TRENDS... 6 COST OF LIVING INDEX... 6 INDUSTRY SNAPSHOT... 7 OCCUPATION SNAPSHOT... 9 INDUSTRY
Economic Overview Long Island
 Report created on August 29, 2017 Economic Overview Long Island Contact: Lisa.Montiel@suny.edu DEMOGRAPHIC PROFILE... 3 EMPLOYMENT TRENDS... 5 UNEMPLOYMENT RATE... 5 WAGE TRENDS... 6 COST OF LIVING INDEX...
Metropolitan Washington Area Key Economic & Demographic Indicators
 Metropolitan Washington Area Key Economic & Demographic Indicators Arlington County Community Facilities Study March 11, 2015 Lisa A. Sturtevant, PhD Vice President of Research National Housing Conference
The State of the Nation s Housing Report 2017
 The State of the Nation s Housing Report 217 Tennessee Governor s Housing Conference Nashville, Tennessee September 2, 217 The Report s Major Themes National home prices have regained their previous peak,
Economic Overview Plant City Region. April 5, 2017
 Economic Overview Plant City Region April 5, 2017 DEMOGRAPHIC PROFILE... 3 EMPLOYMENT TRENDS... 5 WAGE TRENDS... 5 COST OF LIVING INDEX... 6 INDUSTRY SNAPSHOT... 7 OCCUPATION SNAPSHOT... 9 INDUSTRY CLUSTERS...
October 28, Economic Overview Yellowstone County, Montana
 October 28, 2016 Economic Overview Yellowstone DEMOGRAPHIC PROFILE...3 EMPLOYMENT TRENDS...5 UNEMPLOYMENT RATE...5 WAGE TRENDS...6 COST OF LIVING INDEX...6 INDUSTRY SNAPSHOT...7 OCCUPATION SNAPSHOT...9
Demographic and Economic Profile. Nevada. Updated May 2006
 Demographic and Economic Profile Nevada Updated May 2006 Metro and Nonmetro Counties in Nevada Based on the most recent listing of core based statistical areas by the Office of Management and Budget (December
Economic Overview Fairfax / Falls Church. October 23, 2017
 Economic Overview Fairfax / Falls Church October 23, 2017 DEMOGRAPHIC PROFILE... 3 EMPLOYMENT TRENDS... 5 UNEMPLOYMENT RATE... 5 WAGE TRENDS... 6 COST OF LIVING INDEX... 6 INDUSTRY SNAPSHOT... 7 OCCUPATION
REGIONAL SNAPSHOT. Foothills Region, North Carolina
 REGIONAL SNAPSHOT Foothills Region, North Carolina Table of contents 01 Overview 04 Labor force 02 Demography 05 Industry and occupation 03 Human capital 01 overview Foothills Region, NC What is a regional
Economic Overview Capital District
 August 29, 2017 Economic Overview Capital District Contact: Lisa.Montiel@suny.edu DEMOGRAPHIC PROFILE... 3 EMPLOYMENT TRENDS... 5 UNEMPLOYMENT RATE... 5 WAGE TRENDS... 6 COST OF LIVING INDEX... 6 INDUSTRY
REGIONAL SNAPSHOT. Eastern Shore Region, Virginia
 REGIONAL SNAPSHOT Eastern Shore Region, Virginia Table of contents 01 Overview 04 Labor force 02 Demography 05 Industry and occupation 03 Human capital 01 overview Eastern Shore Region, VA What is a regional
TABLE OF CONTENTS INTRODUCTION... 1
 TABLE OF CONTENTS INTRODUCTION... GENERAL WORKFORCE TRENDS... 3 General Workforce Trends and Comparisons Overview... 5 State Government Employees to State Population... 6 State Government Full-Time Equivalent
A Sublette County Profile: Socioeconomics
 JULY 2015 A Sublette County Profile: Socioeconomics Sublette County Board of County Commissioners Andy Nelson, Chair Joel Bousman Jim Latta INTRODUCTION In a rapidly changing world, timely and accurate
June 9, Economic Overview Billings, MT MSA
 June 9, 2016 Economic Overview Billings, MT MSA DEMOGRAPHIC PROFILE... 3 EMPLOYMENT TRENDS... 5 UNEMPLOYMENT RATE... 5 WAGE TRENDS... 6 COST OF LIVING INDEX... 6 INDUSTRY SNAPSHOT... 7 OCCUPATION SNAPSHOT...
Economic Overview Mohawk Valley
 Report created on August 29, 2017 Economic Overview Mohawk Valley Contact: Lisa.Montiel@suny.edu DEMOGRAPHIC PROFILE... 3 EMPLOYMENT TRENDS... 5 UNEMPLOYMENT RATE... 5 WAGE TRENDS... 6 COST OF LIVING INDEX...
Tyler Area Economic Overview
 Tyler Area Economic Overview Demographic Profile. 2 Unemployment Rate. 4 Wage Trends. 4 Cost of Living Index...... 5 Industry Clusters. 5 Occupation Snapshot. 6 Education Levels 7 Gross Domestic Product
Demographic and Economic Profile. New Mexico. Updated June 2006
 Demographic and Economic Profile New Mexico Updated June 2006 Metro and Nonmetro Counties in New Mexico Based on the most recent listing of core based statistical areas by the Office of Management and
Demographic and Economic Profile. Delaware. Updated December 2006
 Demographic and Economic Profile Delaware Updated December 2006 Metro and Nonmetro Counties in Delaware Based on the most recent listing of core based statistical areas by the Office of Management and
Utah. Demographic and Economic Profile. Metro and Nonmetro Counties in Utah
 Demographic and Economic Profile Utah Updated July 2006 Metro and Nonmetro Counties in Utah Based on the most recent listing of core based statistical areas by the Office of Management and Budget (December
WHO S LEFT TO HIRE? WORKFORCE AND UNEMPLOYMENT ANALYSIS PREPARED BY BENJAMIN FRIEDMAN JANUARY 23, 2019
 JANUARY 23, 2019 WHO S LEFT TO HIRE? WORKFORCE AND UNEMPLOYMENT ANALYSIS PREPARED BY BENJAMIN FRIEDMAN 13805 58TH STREET NORTH CLEARNWATER, FL, 33760 727-464-7332 Executive Summary: Pinellas County s unemployment
REGIONAL SNAPSHOT. Partner for Progress Region, NE
 REGIONAL SNAPSHOT Partner for Progress Region, NE Table of contents 01 Overview 04 Labor force 02 Demography 05 Industry and occupation 03 Human capital 01 overview Partner for Progress Region, NE What
Economic Overview Prince William/Manassas. October 23, 2017
 Economic Overview Prince William/Manassas October 23, 2017 DEMOGRAPHIC PROFILE... 3 EMPLOYMENT TRENDS... 5 UNEMPLOYMENT RATE... 5 WAGE TRENDS... 6 COST OF LIVING INDEX... 6 INDUSTRY SNAPSHOT... 7 OCCUPATION
Regional Data Snapshot
 Regional Data Snapshot Population, Economy & Education Features SET Civic Forum Ozark Foothills Region, Missouri Table of Contents 01 Overview 03 Human Capital 02 Demography 04 Labor Force 01 overview
Demographic and Economic Profile. New Jersey. Updated December 2006
 Demographic and Economic Profile New Jersey Updated December 2006 Metro and Nonmetro Counties in New Jersey Based on the most recent listing of core based statistical areas by the Office of Management
Independence, MO Data Profile 2015
 , MO Data Profile 2015 5 year American Community Survey (ACS) Jackson County, Missouri Data sources: U.S. Census Bureau, American Community Survey (ACS), 2011 2015 (released December 8, 2016), compared
Regional Data Snapshot
 Regional Data Snapshot Population, Economy & Education Features SET Civic Forum Forest Country Region (FCR), Texas Table of Contents 01 Overview 03 Human Capital 02 Demography 04 Labor Force 01 overview
Pennsylvania. Demographic and Economic Profile. Metro and Nonmetro Counties in Pennsylvania
 Demographic and Economic Profile Pennsylvania Updated June 2006 Metro and Nonmetro Counties in Pennsylvania Based on the most recent listing of core based statistical areas by the Office of Management
Part 1. Demographics, Socioeconomics, Community Safety
 The Health of 2014 Community Health Assessment Prepared by: Siri Kushner MPH, CPH Presented: February 21, 2014 Part 1. Demographics, Socioeconomics, Community Safety Section A: Population 1. Total Population
Economy Overview Champaign-Urbana, IL
 Economy Overview Champaign-Urbana, IL Emsi Q4 Data Set November Illinois Emsi Q4 Data Set www.economicmodeling.com Page 1/15 Economy Overview Population () 240,355 Jobs () 100,288 Average Earnings () $53,770
E APPENDIX METHODOLOGY FOR LAND USE PROJECTIONS IN THE BOSTON REGION INTRODUCTION
 E APPENDIX METHODOLOGY FOR LAND USE PROJECTIONS IN THE BOSTON REGION INTRODUCTION The Metropolitan Area Planning Council (MAPC), the region s land use planning agency, is responsible for preparing detailed
Demographic and Economic Profile. Florida. Updated May 2006
 Demographic and Economic Profile Florida Updated May 2006 Metro and Nonmetro Counties in Florida Based on the most recent listing of core based statistical areas by the Office of Management and Budget
TABLE OF CONTENTS INTRODUCTION... 1
 TABLE OF CONTENTS INTRODUCTION... GENERAL WORKFORCE TRENDS... 3 General Workforce Trends and Comparisons Overview... 5 State Government Employees to State Population... 6 State Government Full-Time Equivalent
Housing Needs Assessment Update 2016 Venturoni Surveys & Research
 Housing Needs Assessment Update 2016 Venturoni Surveys & Research! Linda Venturoni, President Jim Westkott, Senior Economist and Demographer! Eagle County Housing Needs Assessment Update 2016 Table of
Enhancing Economic Security for the Latino Community
 Enhancing Economic Security for the Latino Community March 21, 2012 Presented at a Symposium Honoring the Center for Policy Research on Aging s 15 th Anniversary Aging in a Minority-Majority Nation: Interracial
San Luis Valley Statistical Profile
 Valley Statistical Profile Revised December 3, 2007 Physical Setting Alamosa Conejos Costilla Mineral Rio Grande Saguache Valley Colorado Land area Total square miles 723 1,287 1,227 876 911 3,168 8,192
Economic Overview Marlboro County Labor Shed. June 29, 2016
 Economic Overview Marlboro County Labor June 29, 2016 DEMOGRAPHIC PROFILE...3 EMPLOYMENT TRENDS...5 UNEMPLOYMENT RATE...5 WAGE TRENDS...6 COST OF LIVING INDEX...6 INDUSTRY SNAPSHOT...7 OCCUPATION SNAPSHOT...9
REGIONAL SNAPSHOT. Indiana 15 Regional Planning Commission Region, Indiana
 REGIONAL SNAPSHOT Indiana 15 Regional Planning Commission Region, Indiana Table of contents 01 Overview 04 Labor force 02 Demography 05 Industry and occupation 03 Human capital 01 overview Indiana 15 Regional
Economy Overview Champaign County, IL
 Economy Overview Champaign County, IL Emsi Q4 2016 Data Set November 2016 Illinois Emsi Q4 2016 Data Set www.economicmodeling.com Page 1/17 Parameters Regions Code Description 17019 Champaign County, IL
REGIONAL SNAPSHOT. Northern Shenandoah Valley Regional Partnership (NSVRP), Virginia
, Virginia") REGIONAL SNAPSHOT Northern Shenandoah Valley Regional Partnership (NSVRP), Virginia Table of contents 01 Overview 04 Labor force 02 Demography 05 Industry and occupation 03 Human capital 01 overview Northern
REGIONAL SNAPSHOT Northern Shenandoah Valley Regional Partnership (NSVRP), Virginia Table of contents 01 Overview 04 Labor force 02 Demography 05 Industry and occupation 03 Human capital 01 overview Northern
EMPLOYEE TENURE IN 2014
 For release 10:00 a.m. (EDT) Thursday, September 18, 2014 USDL-14-1714 Technical information: (202) 691-6378 cpsinfo@bls.gov www.bls.gov/cps Media contact: (202) 691-5902 PressOffice@bls.gov EMPLOYEE TENURE
September Caddo Kiowa Technology Center. Economy Overview
 September 2017 Caddo Kiowa Technology Center Economy Overview Parameters Regions Code Description 40015 Caddo County, OK 40051 Grady County, OK 40075 Kiowa County, OK Timeframe 2001-2016 Datarun 2017.3
Demographic Drivers. Joint Center for Housing Studies of Harvard University 11
 3 Demographic Drivers Household formations were already on the decline when the recession started to hit in December 27. Annual net additions fell from 1.37 million in the first half of the decade to only
Mid - City Industrial
 Minneapolis neighborhood profile October 2011 Mid - City Industrial About this area The Mid-City Industrial neighborhood is bordered by I- 35W, Highway 280, East Hennepin Avenue, and Winter Street Northeast.
Florida: An Economic Overview
 Florida: An Economic Overview February 7, 2018 Presented by: The Florida Legislature Office of Economic and Demographic Research 850.487.1402 http://edr.state.fl.us Residential Credit Still Difficult to
A Summary of The Texas Challenge in the Twenty- First Century: Implications of Population Change for the Future of Texas
 A Summary of The Texas Challenge in the Twenty- First Century: Implications of Population Change for the Future of Texas The Center for Demographic and Socioeconomic Research and Education by Steve H.
REGIONAL SNAPSHOT. Crossing Borders Region (CBR), Oklahoma
, Oklahoma") REGIONAL SNAPSHOT Crossing Borders Region (CBR), Oklahoma Table of contents 01 Overview 04 Labor force 02 Demography 05 Industry and occupation 03 Human capital 01 overview Crossing Borders Region, OK
REGIONAL SNAPSHOT Crossing Borders Region (CBR), Oklahoma Table of contents 01 Overview 04 Labor force 02 Demography 05 Industry and occupation 03 Human capital 01 overview Crossing Borders Region, OK
North Central Wisconsin Labor Market Trends, Information and Updates
 North Central Wisconsin Labor Market Trends, Information and Updates Facts, Strategies, and Resources Derek Heikkinen and Mitchell Rupp North Central Wisconsin Workforce Solutions Summit Wednesday, September
A summary of economic events, data, and trends published by the Community Research Institute. The Workforce Without the Baby Boomers
 Allen County Insight A summary of economic events, data, and trends published by the October 2014 On the web: www.ipfw.edu/cri In this Issue Focus on... Baby Boomers and Labor Force Also... Employment
 http://www.tennessee.gov/tacir/_profile/hardin_profile.htm Page 1 of 13 I. Geography & Demographics VI. Government Finance II. Income & Poverty VII. Public Infrastructure Needs Inventory III. Health &
October Mid-Del Technology Center. Economy Overview
 October 2017 Mid-Del Technology Center Economy Overview Parameters Regions Code Description 40109 Oklahoma County, OK Timeframe 2001-2016 Datarun 2017.3 QCEW Employees, Non-QCEW Employees, and Self-Employed
Shingle Creek. Minneapolis neighborhood profile. About this area. Trends in the area. Neighborhood in Minneapolis. October 2011
 neighborhood profile October 2011 About this area The neighborhood is bordered by 53rd Avenue North, Humboldt Avenue North, 49th Avenue North, and Xerxes Avenue North. It is home to Olson Middle School.