Kempen conference. Amsterdam 30 May 2013
|
|
|
- Scot Lawson
- 5 years ago
- Views:
Transcription

1 Kempen conference Amsterdam 30 May 2013

 in Intervest Offices & Warehouses (listed on Euronext Brussels) NSI, founded in 1993, is publicly listed on Euronext Amsterdam since 1998 and has 66 employees at year-end 2012 In 2011, NSI and")
2 Company snapshot Description Dutch REIT: NSI is a real estate asset management company and qualifies as fiscal investment institution under Dutch law (REIT) Full service in house management The company is engaged in asset management, letting, marketing, development, business development and technical building management High Yield Real Estate portfolio with Benelux focus: - Offices and Retail investments in the Netherlands - Majority interest (54.8%) in Intervest Offices & Warehouses (listed on Euronext Brussels) NSI, founded in 1993, is publicly listed on Euronext Amsterdam since 1998 and has 66 employees at year-end 2012 In 2011, NSI and VastNed Offices (VNOI) completed a merger NSI divested the majority of its Swiss portfolio in April 2013 Portfolio Offices Retail Logistics Geographic breakdown (market value 2 ) Belgium 28.9% Switzerland 1.7% Netherlands 69.4% Key financials Gross initial yield (EUR million 1 ) 2012 Gross rental income 161 Netherlands 2012 Offices 10.7% Asset classes Netherlands (market value 2 ) Asset classes Belgium (market value 2 ) Direct investment result 63 Indirect investment result (167) Real estate investments 2,106 Occupancy rate (year-end) 81.1% Retail 7.7% Retail 38.6% Other 3 6.4% Offices 55.0% Logistics 39.5% Offices 60.5% Loan to Value (year-end) 58.2% Direct investment result per share (EUR) 0.99 Belgium Offices 9.5% Dividend per share (EUR) 0.86 Logistics 8.4% 1. Unless stated otherwise; 2. Based on Q1 2013; 3 Consists of Industrial and Residential 2
3 Strategy 1. Portfolio optimisation focusing on high-yielding Office and Retail assets Balanced mixture of Offices & Retail, consistent with development of the asset cycle in both markets - Offices focus: high-yield locations - Retail focus: local shopping centres Aim to be one of the leading players in each asset class 2. Increase value through active management Full spectrum of in house capabilities created excellent letting platform Use local knowledge and integrated teams to quickly respond to clients needs Redevelopment and rebranding of existing assets Introducing new concepts to improve occupancy and rental income Unique combination of integral management and tenant focus to increase both portfolio value and cash flow generation 3. Solid balance sheet Highly committed to loan-to-value (LtV) < 55% ion the short term, <50% on the long term Diversification of funding Interest fixing of at least 80% 3
4 Highlights Q Occupancy total portfolio improved to 81.3% as per 31 March 2013 from 81.1% as per year end 2012 Direct investment result of 13.4 million in Q1 2013, 0.20 per share Total investment result amounted to million in Q1 2013, consisting of 13.4million direct investment result and million indirect investment result. Revaluations of the real estate portfolio amounted to million. LtV slightly decreased to 58.0% on 31 March 2013 from 58.2% as per year end 2012 Swiss retail center HertiZentrum sold at book value, industrial Belgian asset Kortenberg 15% above book value (transfer both assets end May) New dividend policy adopted by AGM, aimed at retaining cash to fund regular capex EUR million 1Q 13 Gross rental income 37.1 Direct investment result 13.4 Indirect investment result (34.6) Real estate investments 2,040 Occupancy rate (end Q1) 81.3% Loan to Value (end Q1) 58.0% Direct investment result per share (EUR) Interim dividend per share (EUR)
, partly due to the sale of two of (nearly) fully let shopping centres Strong retail mix with a approx. 22% share of supermarkets Stable retention rate at 76%.")
5 Highlights Q1 Retail NL 27% of portfolio Occupancy rate at a solid 92.0%, a decrease from 92.5% (year-end 2012), partly due to the sale of two of (nearly) fully let shopping centres Strong retail mix with a approx. 22% share of supermarkets Stable retention rate at 76%. Offices NL 38% of portfolio 2 nd consecutive quarter of occupancy improvement in Dutch offices portfolio from 71.3% as per year-end 2012 to 72.1% as per 31 March Improving trend is expected to continue over NSI realised 3% of the total take up in the Dutch offices market, while NSI's portfolio represents 1.3% of the total Dutch offices market NSI ranked fourth in the Dutch market in total leasing transaction volume in 2012 Transformation of HNK Hoofddorp and Utrecht commenced and expected to be finalised in the autumn of 2013 The retention rate (78%) increased significantly compared with 2012 (47%) Belgium 29% of portfolio Occupancy decreased to 85% due to sale of semi-industrial asset Sale of semi-industrial asset in Kortenberg 15% above book value Increase in leasing transactions in first quarter compared with first quarter of
6 Our key priorities Reducing LtV NSI is highly committed to reduce LtV to below 55% Continue disposal strategy In million of assets sold, another 75 million announced (and partly yet delivered) in 2013 Approx. 100 million used to redeem debt in 2012, 46 million in Q Operational Building on operational strength Increasing occupancy levels Roll out HNK concept Further improving effectiveness and efficiency Continued cost control and driving efficiencies Optimise value per property and sell 6
7 Changed dividend policy Pay out ratio is geared at funding regular capital requirements Average capital expenditure requirements in general 10-15% of direct result Financial prudency to secure future investments Aligning dividend policy with exceptional market circumstances by linking dividend policy to LtV performance Possibility to offer stock dividend in case the circumstances are supportive Meeting REIT criteria for profit distribution LtV Pay out of direct result < 55% % 55%> LtV < 60% 50% in cash > 60% 50% in stock 7


8 8
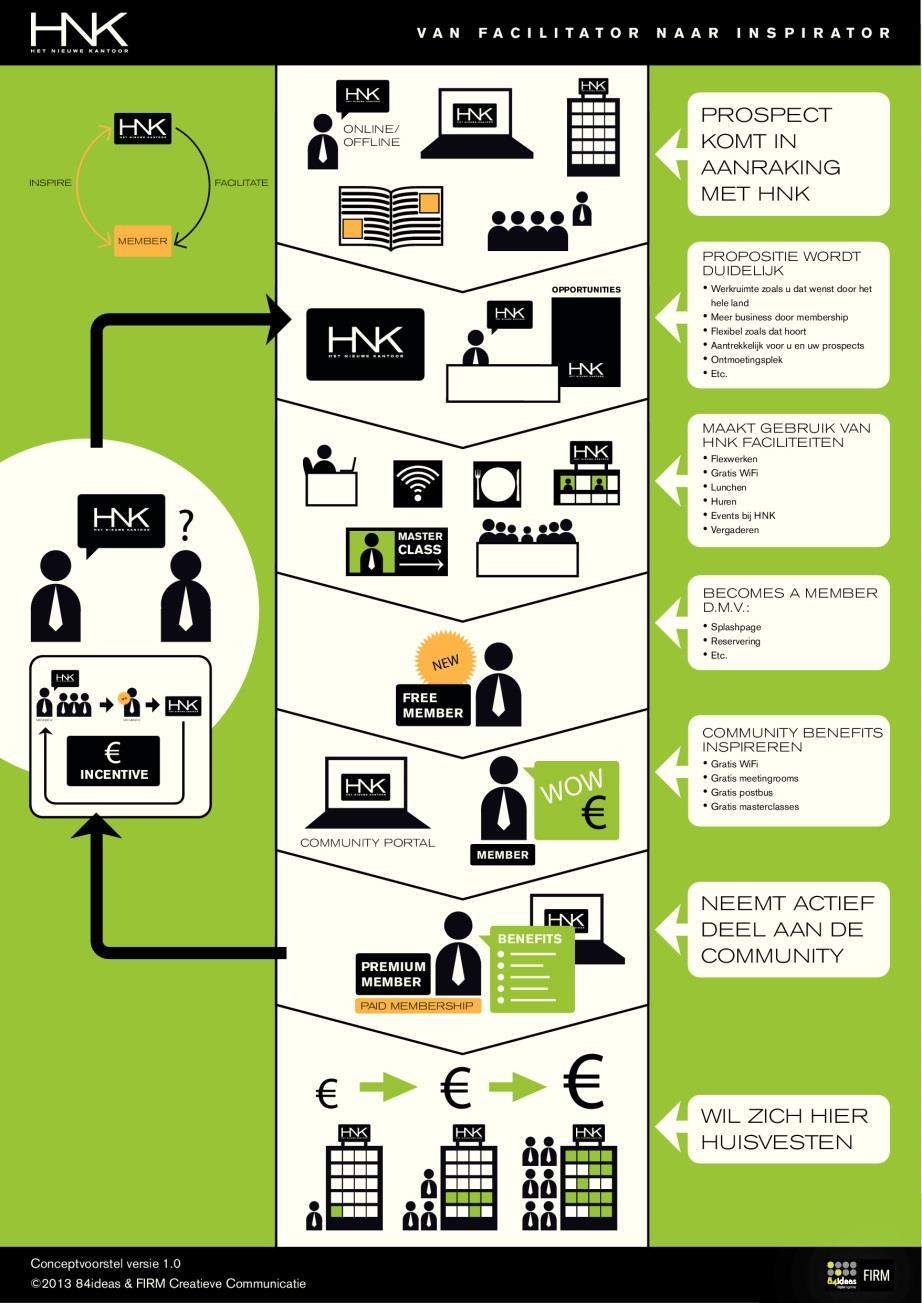
9 HNK servicing a growing market with higher earnings potential HNK anticipates a growing demand for full service and flexible leasing in Dutch market; changing housing needs of corporates due to changes in way of working Positioning perfectly fits the growing SME segment and growing number of freelancers Lower risk due to spread of contract expiries Utilizing office spaces that are difficult to rent out in traditional leases Results in higher rental fees per sqm compared to traditional model, while tenant is able to optimize their costs
10 HNK- distinctive strength A place to be - inspiring meeting place to work and to meet Highly accessible; Free entrance social heart Memberships Managed offices Traditional offices Offering exactly what tenant needs Services Space Flexibility Translates into a well priced solution, benefiting both tenant and NSI Lower total costs for tenants Higher rent per sqm for NSI HNK Rotterdam Occupancy 30% (total property; 18,000 sqm) Investments in HNK 2.8 million Average rent level managed offices' at 287 per sqm 10
11 11
12 12
13 13

14 Expiration of Leases We actively manage and anticipate expiration calendar; smoothening the future expiration levels In both the office and retail portfolio; the 2013 expiration calendar is below average. The office portfolio is significantly below 2012 level (23%) Expirations in 2013 involve a smaller number large single tenant contracts compared with 2012: (number of contract expiries) > 10, ,000-10, ,000-5, ,000-3, Representing total m2: 64,269 25,024 7% 11% 19% 13% 21% Retail Offices Industrial rental income x 1,000 14
 fully let shopping centers Date of merger")
15 Vacancy development Occupancy expected to improve further improvement in 2013 Expiration calendar in 2013 and 2014 below average with limited expiries of large single tenant contracts Increase in vacancy Retail portfolio, for a large part due to disposal of 2 (nearly) fully let shopping centers Date of merger VNOI 15
 The rent level of new leases in Q1 2013 was impacted by relatively large leases in outer")
16 Portfolio Rent Development Average effective rent/sqm (NL) Effective rent levels are adjusted for incentives remains in line with benchmark Dutch market NSI delivered in 2012 on target to stay above 120/sqm effective rent Alternative strategies in place to increase income per sqm *) The rent level of new leases in Q was impacted by relatively large leases in outer regions 16

 Revaluations primarily driven by yield shifts Lack of")

17 Property values NSI wrote down 270 million since 2008 in Dutch office portfolio, 377 including pro forma VNOI revaluations over that period (approx. 38%) Revaluations primarily driven by yield shifts Lack of reference due to lackluster market; increased influence of assumptions Development activity and pipeline all time low Valuation level below replacement costs 17
 415 million 250")
18 Active acquisition & disposal strategy Portfolio Philips Pensioenfonds and Swiss assets Excluding acquisition VNOI ( 971 million) 415 million 250 million 18
19 Consolidated direct and indirect investment result Key observations (x 1,000) Q Q Q Gross rental income (GRI) 41,499 40,317 37,075 Service costs not recharged to tenants - 1,482-1,141-1,136 Operating costs - 4,938-4,884-4,247 Net rental income 35,079 34,292 31,692 Administrative costs - 1,816-1,930-1,525 Financing costs - 14,007-14,464-13,859 Direct investment result before tax 19,284 17,898 16,308 Corporate income tax Direct investment result attributable to noncontrolling interests - 3,023-2,844-2,876 Indirect investment result 16,181 14,958 13,415 Indirect result - 33,302-42,126-34,573 Total result -17,121-27,268-21,158 Gross rental income in Q decreased to 37.1 million (Q4 2012: 40.3 million) as a result of disposals and 2.0 million exceptionals in Q NSI continued its focus on strict cost discipline; operating costs (11.5%) and administrative costs (4%) reflect efficient ratios Financing costs decreased in Q to 14.0 million (Q4 2012: 14.5 million). Higher margins and financing costs were offset by lower Euribor rates and hedging costs and a reduction in outstanding loans ( 43 million). Downward revaluations of 42.4 million mainly related to Dutch offices portfolio ( 33.3 million) LtV slightly decreased from 58.2% at year end 2012 to 58.0% ICR at 2.3 (year end 2012: 2.5) 19
 1,315,693 1,226,432 1,183,219 Loan to value (%) 57.3 58.2 58.0 Average interest rate (%) 4.3 4.8 5.")
20 Financial Highlights Balance sheet x 1, Real estate investments 2,294,260 2,106,091 1,981,787 Shareholders equity 895, , ,779 Shareholders equity NSI 763, , ,679 Debts to credit institutions (excluding derivatives) 1,315,693 1,226,432 1,183,219 Loan to value (%) Average interest rate (%) Average maturity loans (years) Fixed interest debt (%) Interest coverage ratio NAV EPRA NAV
21 Financing Extending average duration of loan portfolio and addressing upcoming maturities well before expiration is key priority Timely addressing million maturing debt in 2013, million (55%) of debt, initially maturing in 2013, already covered in 2012 refinancing arrangements NSIs largest syndicated loan facility ( 243 million outstanding debt), maturing in 2013 and 2014 and reflecting the majority of the debt maturing in 2013, is in an advanced stage of negotiation. Approx. 60% of Dutch outstanding debt ( 507 million) successfully refinanced in 2012 Average maturity 2.1 years Managing interest costs Rising margins vs low swap/euribor rates Lowering hedging costs through expiring swaps Reduction outstanding debt Average cost of funding expected to rise 21
22 capital sum Loan Duration x durations loans until >2019 X 1,000 Fixed Floating Total Working capital Hedged % Fixed Maturity Interest % NL 179, , ,968 80, , % % CH 0 25,781 25, % % BE 75, , ,985 21, , % % Total 254, ,948 1,102, , , % % Hedge portfolio of swaps: No overhedged positions Swaps reviewed for potential redemption or extention 22
23 Prospects Operational Further improvement occupancy in Dutch office portfolio throughout 2013 Further roll out HNK concept to anticipate growing demand for flexible and full service office solutions Continue to actively pursue favorable mix in retail portfolio Financing Further reducing LTV by selling non strategic assets, including sale of remaining assets Switzerland Revised dividend policy Average costs of funding expected to rise Further extending debt maturities Direct result FY 2013 expected to develop in range 50 to 56 million; expected to improve in
24 Q & A 24
Interim report per 30 June 2013
 Interim report per 30 June 2013 NSI N.V. Report of the Management Board NSI: investing in operational performance Results Direct investment result for the 1 st half-year of 2013 amounted to 25.5 million
Kempen European Property Seminar 30 May 2012 in Amsterdam
 Kempen European Property Seminar 30 May 2012 in Amsterdam Profile Top 3 listed Dutch mixed real estate fund Dutch REIT / Listed on Amsterdam Euronext (Midkap AMx) Portfolio: 2.29bn TRI: 203m Outstanding
NSI Strategy update and full year results. Roadshow Tel Aviv 7 & 8 April
 NSI Strategy update and full year results Roadshow Tel Aviv 7 & 8 April Equity issue: full focus on operations Successful equity issue 300 million equity raised in a private placement to qualified investors
Preliminary results 2015
 Preliminary results 2015 Increase in direct result in 2015 ` Highlights Update strategy Significant improvement in quality of portfolio through asset rotation in 2015: Share of region Randstad increased
US Roadshow 1-2 October 2014
 US Roadshow 1-2 October 2014 Contents 1 Introduction 2 Market 3 Portfolio strategy 4 Strategic and operational update 5 Financial 6 Conclusion 7 Appendix 2 1 INTRODUCTION 3 NSI at a glance Description
ING Small Cap conference Frankfurt -15 June 2016-
 ING Small Cap conference Frankfurt -15 June 2016- 1 NSI COPE WITH A CHANGING ENVIRONMENT NSI at a glance Description Entrepreneurial Real Estate management company, founded in the Netherlands in 1993 by
Preliminary results 2014
 Preliminary results 2014 Significant steps in execution strategy: - All non-core office assets sold - Refinancing of 550 million in renewed structure NSI N.V. Highlights 2014 Quality improvement by asset
Interim Results Half Year July 2018
 Interim Results Half Year 2018 July 2018 NSI will be the leading specialist in the Dutch office market, with a strong and efficient platform that will drive returns through pro-active asset management,
Press release nine months results 2010 VASTNED RETAIL REALISES STABLE DIRECT INVESTMENT RESULT AND POSITIVE VALUE MOVEMENTS IN PROPERTY PORTFOLIO
 Press release nine months results VASTNED RETAIL REALISES STABLE DIRECT INVESTMENT RESULT AND POSITIVE VALUE MOVEMENTS IN PROPERTY PORTFOLIO Reinier van Gerrevink, CEO VastNed Retail: The letting market
VASTNED RETAIL REALISES LOWER DIRECT INVESTMENT RESULT, BUT PROPERTY VALUES UP FOR SECOND CONSECUTIVE QUARTER
 Interim report VASTNED RETAIL REALISES LOWER DIRECT INVESTMENT RESULT, BUT PROPERTY VALUES UP FOR SECOND CONSECUTIVE QUARTER Reinier van Gerrevink, CEO VastNed Retail: Lease negotiations provide us with
STEADY STRATEGY ROLLOUT
 Press release STEADY STRATEGY ROLLOUT Negative value movements mostly due to Spanish portfolio Key points 9M 2012 (in brackets: 9M 2011) Direct investment result 47.1 million ( 50.6 million) Values movements
Press release. Annual figures 2008
 Press release Annual figures 2008 VASTNED RETAIL: DIRECT INVESTMENT RESULT 2008 3.71 PER SHARE ( 3.85 BEFORE ONE-OFF COSTS); PROPERTY VALUE DECREASES RESULT IN NEGATIVE INDIRECT INVESTMENT RESULT OF 6.82
Vastned results in line with expectations
 HALF YEAR REPORT 2 AUGUST 2016 2016 HALF-YEAR RESULTS Vastned results in line with expectations Highlights HY1 2016: - Vastned attracts strong and distinctive retailers for several premium city high street
MILLION (+1.0%) VALUE INCREASE VASTNED RETAIL PROPERTY PORTFOLIO IN Q1 2011; DIRECT INVESTMENT RESULT MARGINALLY DOWN
 VALUE INCREASE VASTNED RETAIL PROPERTY PORTFOLIO IN Q1 2011; DIRECT INVESTMENT RESULT MARGINALLY DOWN") Press release first quarter figures 2011 20 MILLION (+1.0%) VALUE INCREASE VASTNED RETAIL PROPERTY PORTFOLIO IN 2011; DIRECT INVESTMENT RESULT MARGINALLY DOWN Reinier van Gerrevink, VastNed Retail CEO:
Press release first quarter figures 2011 20 MILLION (+1.0%) VALUE INCREASE VASTNED RETAIL PROPERTY PORTFOLIO IN 2011; DIRECT INVESTMENT RESULT MARGINALLY DOWN Reinier van Gerrevink, VastNed Retail CEO:
Hansteen. Full Year Results to 31 December Tilburg, Netherlands
 Hansteen Full Year Results to 31 December 2016 Tilburg, Netherlands Contents Introduction Hansteen 2016 results Sale announcement Sale of German and Dutch Portfolio 2016 Annual Results 2016 Property Performance
2017 HALF YEAR 25 JULY 2017
 2017 HALF YEAR RESULTS 25 JULY 2017 Strong financial results and robust balance sheet Driving performance through operational excellence and disciplined capital allocation High quality pipeline of growth
PRESS & ANALYST MEETING
 BEYOND REAL ESTATE PRESS & ANALYST MEETING 2 HALF YEAR RESULTS 31 July 2018 3 Agenda 1. Nature of the portfolio 2. Important activities & developments in 2018 3. Financial results 30 June 2018 4. Property
Admission to trading of new ordinary shares with a nominal value of 0.46 each in the capital of Nieuwe Steen Investments N.V.
 NIEUWE STEEN INVESTMENTS N.V. (a closed end investment company with variable capital (beleggingsmaatschappij met veranderlijk kapitaal) under Dutch law, with its corporate seat in Hoorn, The Netherlands)
Bank and Bondholder presentation
 Bank and Bondholder presentation 19 September 2013 0 Geopost, Enfield Agenda Welcome and strategic overview (David Sleath, CEO) Operational and financial performance (Justin Read, Group Finance Director)
Vastned raises estimated direct result 2014 to 2.35 per share
 PRESS RELEASE 3 November 2014 Q3 2014 TRADING UPDATE Vastned raises estimated direct result 2014 to 2.35 per share Key points Q3 2014: - Occupancy rate stable at 96.5% (30 June 2014: 96.6%) - Acquisitions
PRESS RELEASE ANNUAL RESULTS Results underline strategic choice. 6 March 2014 HEADLINES
 PRESS RELEASE 6 March 2014 2013 ANNUAL RESULTS Results underline strategic choice HEADLINES - Vastned realises strategic objectives through active acquisition and divestment policy - Direct investment
VASTNED MAKES CLEAR PROGRESS ON HIGH STREET SHOP STRATEGY ROLL-OUT UNDER DIFFICULT MARKET CIRCUMSTANCES
 INTERIM REPORT 2013 14 August 2013 VASTNED MAKES CLEAR PROGRESS ON HIGH STREET SHOP STRATEGY ROLL-OUT UNDER DIFFICULT MARKET CIRCUMSTANCES Key points HY1 2013 (in brackets: HY1 2012) Successful acquisitions
annual report 2012 NSI N.V.
 annual report 2012 NSI N.V. annual report 2012 NSI N.V. 3 annual report NSI 2012 This version of NSI s annual report is a translation of the original Dutch version. Although this English version has been
Q HIGHLIGHTS MEUR MEUR % MEUR MEUR 48.4 MEUR 94.8 MEUR % 1.87% +2.2% +1.9 PP +3.5% +73.8% + >100% +19.9% +81.
 Q1-2 2018 HIGHLIGHTS STRENGTHENED OPERATING PERFORMANCE Occupancy rate 94.7% Rental income MEUR 119.0 Rental income lfl MEUR 98.2 +1.9 PP +3.5% +2.2% KPIs SIGNIFICANTLY IMPROVED Results of AM MEUR 94.8
Investor presentation Q results
 Investor presentation Q1 2011 results Recent highlights Successful issue of US$ 300m senior notes (US private placement) Sale non-strategic assets in UK of 15.1m, 7% above latest valuation Sale of a further
Amsterdam Schiphol 1 August Half-year results 2013
 Amsterdam Schiphol 1 August 2013 Half-year results 2013 Introduction CFO Pieter Roozenboom Age 41 Nationality Dutch 2010 2013 CEO Merin (former Uni-Invest Holding) a.o. restructuring CMBS, equity and syndicated
NET OPERATING RESULT OF EUR 3.54 MILLION GROWTH OF 6.3% COMPARED WITH Q1 2013
 REGULATED INFORMATION INTERIM STATEMENT UNDER EMBARGO UNTIL 15/05/2014 8.45 AM NET OPERATING RESULT OF EUR 3.54 MILLION GROWTH OF 6.3% COMPARED WITH Q1 2013 OCCUPANCY RATE OF 95% AVERAGE LEASE TERM UNTIL
Hansteen. Half Year Results to 30 June Castrop-Rauxel, Germany
 Hansteen Half Year Results to 30 June 2016 Castrop-Rauxel, Germany Introduction Hansteen - Pan European Real Estate Investment Trust (REIT) Pan European REIT Five countries Regional teams in 15 offices
WDP FY 2012 results February 13, 2013
 WDP FY 2012 results February 13, 2013 Agenda 2 Introduction WDP in a nutshell Highlights FY 2012 Operational review Financing structure Results analysis WDP share New ambition 2013-16 Outlook 2013 Introduction
Financial Results Q Kari Inkinen, President and CEO Erik Hjelt, CFO Pia Arrhenius, SVP, IR
 Financial Results Q2 2009 Kari Inkinen, President and CEO Erik Hjelt, CFO Pia Arrhenius, SVP, IR Introduction Market review Business overview Financial overview Appendix 2 Overview of reporting segments
Results HALF-YEAR. Presentation of 30 August 2011
 Results HALF-YEAR 2011 Presentation of 30 August 2011 1 Summary Affine Group Property portfolio Development of group companies Analysis of 1H11 accounts A robust financial model Affine on the stock market
NSI PRELIMINARY FULL YEAR RESULTS 2018 PRELIMINARY RESULTS FULL YEAR 2018
 PRELIMINARY RESULTS FULL YEAR 2018 Execution of strategy fully on track - strongly positioned for multiple opportunities ahead Vacancy rate of 13.8% (down 4.6% versus year-end 2017) EPRA NAV of 39.75 per
ASX/Media Announcement
 ASX/Media Announcement 13 February 2018 Propertylink delivers a strong HY18 result, well positioned to deliver FY18 guidance Propertylink Group (ASX:PLG) today announces strong financial and operational
Investor presentation H results
 Investor presentation H1 2011 results Recent highlights New lettings in Belgian and US office portfolio. Occupancy rate improving Heads of terms agreed for hotel in Eilan-project: 20 yr fixed lease, operator
Investor presentation 9M 2012 results
 Investor presentation 9M 2012 results Key results: stabilising in Q3 Direct result p/s: 3.05 (-17.6% yoy) Q3: + 0.01 vs Q2 Revaluation portfolio: -4.75% Q3: -0.25% NAV p/s: 63.72 (-12.9% yoy) Q3: +0.4%
Amsterdam Schiphol 25 July Half-year results 2014
 Amsterdam Schiphol 25 July 2014 Half-year results 2014 Highlights Financial performance H1 2014 H1 2013 Direct result per share 1.73 1.76 Indirect result per share (1.50) (1.15) EPRA NAV per share 62.48
HIGHLIGHTS PROPERTY FOR INDUSTRY 2017 INTERIM RESULTS BRIEFING
 HIGHLIGHTS Internalisation of management on 30 June 2017 Increased guidance: distributable profit of between 7.70 and 7.90 cents per share, cash dividend of 7.45 cents per share Transition of the Penrose
Strategy update Vastned: Focus on growth in selected European cities
 Strategy update Vastned: Focus on growth in selected European cities Divestment of the Turkish portfolio and announcement of share buy-back Strategy update: Focus on growth in selected European cities
Press Release. Züblin concentrates on Germany and France. Zurich, 15 May 2014
 Press Release Zurich, 15 May 2014 Züblin concentrates on Germany and France Züblin ended the financial year 2013/2014 with another substantial loss of CHF 64 million (2012/2013: loss of CHF 89 million).
Autumn Presentation. la foncière parisienne
 Autumn 2017 Presentation I. Background II. Portfolio centered on Paris Central Business District III. Key aspects of TERREÏS Model IV. H1 2017 Results 2 TERREÏS at a glance Property investment company
Vesteda Review 2017: further optimisation of investment portfolio and expansion of acquisition pipeline
 Vesteda Review 2017: further optimisation of investment portfolio and expansion of acquisition pipeline Amsterdam, 11 April 2018 In 2017, the Dutch housing market was again in full swing. The number of
Helvetia Group Helvea Swiss Equities Conference 2016
 Ihre Schweizer Versicherung. Helvetia Group Helvea Swiss Equities Conference 2016 14 January 2016 Photo: Gerry Nitsch, Zurich Pipilotti Rist Aufgeweckter Rosenscheitel, 2014 Who we are Helvetia has a history
CITYCON CAPITAL MARKETS DAY 16 MAY 2017, ISO OMENA CFO, EERO SIHVONEN
 STRONG FINANCING FUNDAMENTALS CITYCON CAPITAL MARKETS DAY 16 MAY 2017, ISO OMENA CFO, EERO SIHVONEN MAIN FINANCING TARGETS Loan to Value 40-45% 47.1% Average maturity of loan portfolio > 5 yrs 5.2 Debt
Financial Results for the Quarter / Year Ended 31 Mar April 2012
 Financial Results for the Quarter / Year Ended 31 Mar 2012 19 April 2012 Disclaimer This Presentation is focused on comparing results for the three months ended 31 Mar 2012 versus results achieved in the
/ Investment portfolio 2.418,2 mln 2.646,0 mln Shareholders equity 3) 1.686,5 mln 1.
 1.686,5 mln 1.") Results 2009 Key items Direct result per share stable at 4.93 (2008: 4.92) Property revaluation -9.1% (until Q3 2009: -8.3%) Net asset value 73.77 per share (2008: 83.74) Solvency stable at 70% (2008:
Results 2009 Key items Direct result per share stable at 4.93 (2008: 4.92) Property revaluation -9.1% (until Q3 2009: -8.3%) Net asset value 73.77 per share (2008: 83.74) Solvency stable at 70% (2008:
SCA PROPERTY GROUP ANNOUNCES FIRST HALF FY19 RESULTS
 MEDIA ANNOUNCEMENT 4 February 2019 SCA PROPERTY GROUP ANNOUNCES FIRST HALF FY19 RESULTS SCA Property Group (ASX: SCP) ( SCP or the Group ) is pleased to announce its results for the six months ended 31
CEO, MARCEL KOKKEEL CFO, EXEC. VP EERO SIHVONEN AUDIOCAST PRESENTATION Q1/2016
 CEO, MARCEL KOKKEEL CFO, EXEC. VP EERO SIHVONEN AUDIOCAST PRESENTATION Q1/2016 SOLID QUARTERLY RESULTS SUPPORTED BY GOOD PERFORMANCE IN NORWAY HIGHLIGHTS Q1/2016 SOLID FINANCIAL RESULTS SUPPORTED BY GOOD
Corporate. Presentation September 2017
 Corporate www.larespana.com Presentation September 2017 Snapshot 2 First IPO of a Spanish REIT listed on the Spanish Stock Exchange Shareholder Structure Focused on creating both sustainable income and
2018 HALF YEAR 26 JULY 2018
 2018 HALF YEAR RESULTS 26 JULY 2018 H1 2018 Another period of delivery Strong financial results and capital structure Disciplined capital allocation improving portfolio scale and quality, reducing risk
MAPLETREE LOGISTICS TRUST S 3Q FY13/14 DISTRIBUTION PER UNIT RISES 7% YEAR-ON-YEAR
 For Immediate Release MAPLETREE LOGISTICS TRUST S 3Q FY13/14 DISTRIBUTION PER UNIT RISES 7% YEAR-ON-YEAR Highlights: Amount Distributable to Unitholders registered 8% year-on-year growth Results underpinned
Year end report. January-December st of January 2018 Mikael Ericson, President and CEO Erik Forsberg, CFO
 Year end report January-December 2017 31 st of January 2018 Mikael Ericson, President and CEO Erik Forsberg, CFO Agenda 1. Highlights for the fourth quarter and FY 2017 2. Key messages from Capital Markets
Portfolio by use (in CHF) Return on equity (in %) Net income (in CHF m) Net yield and vacancy rate (in %) Office. Education
 Return on equity (in %) Net income (in CHF m) Net yield and vacancy rate (in %) Office. Education") Summary 2016 2 Portfolio by use (in CHF) 6% 6% 7% Office Education 39% Light industrial, logistics Retail, restaurants 33% 9% Residential Parking Return on equity (in %) 12 10 8 6 4 2 0 2012 2013 2014
Summary 2016 2 Portfolio by use (in CHF) 6% 6% 7% Office Education 39% Light industrial, logistics Retail, restaurants 33% 9% Residential Parking Return on equity (in %) 12 10 8 6 4 2 0 2012 2013 2014
CITYCON S INTERIM REPORT JANUARY JUNE 2015
 2015 Q2 CITYCON S INTERIM REPORT JANUARY JUNE 2015 01 Citycon Q2: Stable results supported by lower financing expenses SECOND QUARTER OF 2015 Turnover decreased to EUR 60.2 million (Q2/2014: EUR 61.9 million)
2017 Annual Results. 12 March la foncière parisienne
 2017 Annual Results 12 March 2018 Content I. Introduction II. Portfolio III. Rental business IV. Financial results V. Outlook 2 2017 key figures EPRA liquidation NAV Rental income strategic assets (Offices
PRESS RELEASE INTERIM FINANCIAL REPORT OF THE STATUTORY MANAGER
 PRESS RELEASE INTERIM FINANCIAL REPORT OF THE STATUTORY MANAGER UNDER EMBARGO UNTIL 05/11/2015 08:30 AM NET OPERATING RESULT OF EUR 5.33 MILLION (EUR 0.58 PER SHARE), GROWTH OF 40.3% COMPARED WITH THE
Presentation Results. Semi-annual. Züblin Group Semi-annual results 2013_2014
 Presentation Semi-annual Results 2013-2014 1 Agenda > Facts > Portfolio overview > Non-strategic portfolio > Renovation projects > Financials > Corporate Governance > Outlook 2 Facts 3 Facts 2013/2014
Interim statement of the board of directors as at 30 September 2015 on the third quarter of financial year 2015
 Regulated information - embargo till 27.10.2015, 8.00 am Antwerp, 27 October 2015 Interim statement of the board of directors as at 30 September 2015 Strategic focus on premium city high street shops continues
2,50 2,00 1,50 1,00 100% 98% 96% 94% 92% 90% 88% 86%
 Regulated information embargo till 17/02/2009, 12.30 Annual results 2008 Gross dividend per share: 2,14 (+ 46 %) Operating distributable result of Intervest Retail increases with 46 % Value increase of
Multiplex Prime Property Fund
 Multiplex Prime Property Fund 2009 Interim Results 23 February 2009 1 Important Notices Whilst every effort is made to provide accurate and complete information, this presentation has been prepared in
Q1 Q4 Q1 Q4. Full Year Results. Audiocast presentation. CEO Marcel Kokkeel CFO, Exec. VP Eero Sihvonen
 Full Year Results Audiocast presentation CEO Marcel Kokkeel CFO, Exec. VP Eero Sihvonen 2 : A YEAR OF ACTION WITH SOLID PERFORMANCE AND A MUCH STRONGER BALANCE SHEET : A year of action EUR 200 million
Financial Results Q August 2012
 Financial Results Q2 2012 3 August 2012 Agenda 1. Performance highlights and our priorities Kari Inkinen 2. Market Update Kari Inkinen 3. Financials Erik Hjelt 4. Business Update Kari Inkinen 2 1. Performance
Interim Report January - June 2016
 Interim Report January - June AB Sagax is a property company whose business concept is to invest in commercial properties, primarily in the warehouse and light industry segment. The period in brief FIRST
Agenda. About IREIT Global. Key Highlights. Portfolio Summary. Economy & Real Estate Review. Looking Ahead. Appendix : Overview of Tikehau Capital
 4Q 2017 and FY 2017 Results Presentation 14 February 2018 Agenda About IREIT Global Key Highlights Portfolio Summary Economy & Real Estate Review Looking Ahead Appendix : Overview of Tikehau Capital 2
VALUATION PROPERTY PORTFOLIO VASTNED RETAIL: - VALUE INCREASE OF 103 MILLION - NET RETURN 6.0%
 Press release nine months results 2007 VALUATION PROPERTY PORTFOLIO VASTNED RETAIL: - VALUE INCREASE OF 103 MILLION - NET RETURN 6.0% (in brackets: first nine months 2006) Direct investment result: 46.8
Hansteen Holdings PLC Half Year Results
 27 August Hansteen Holdings PLC ( Hansteen or the Group or the Company ) HALF YEAR RESULTS Hansteen (LSE: HSTN), the investor in UK and continental European industrial property, announces its half year
Q INTERIM REPORT JANUARY SEPTEMBER
 Q3 2018 INTERIM REPORT JANUARY SEPTEMBER CITYCON Q3/2018: SOLID OPERATING PERFORMANCE CONTINUED AND ADMINISTRATIVE EXPENSES DECLINED SIGNIFICANTLY. Q3/2018 2 Occupancy remained at a high level of 96.1%.
Financial Results Year February 2013
 Financial Results Year 2012 1 February 2013 Agenda 1. Performance highlights and our priorities Kari Inkinen 2. Market Update Kari Inkinen 3. Financials Erik Hjelt 4. Business Update Kari Inkinen 2 Performance
Agenda. About IREIT Global. Key Highlights. Portfolio Summary. Economy & Real Estate Review. Looking Ahead. Appendix : Overview of Tikehau Capital
 2Q 2017 and 1H 2017 Results Presentation 10 August 2017 Agenda About IREIT Global Key Highlights Portfolio Summary Economy & Real Estate Review Looking Ahead Appendix : Overview of Tikehau Capital 2 About
Triodos Vastgoedfonds
 Quarterly Report Q3 2018 Profile Triodos Vastgoedfonds is an active impact investor making real estate more sustainable. It aims to lead the Dutch office market forward by enhancing environmental performance
AIMS AMP CAPITAL INDUSTRIAL REIT
 AIMS AMP CAPITAL INDUSTRIAL REIT FY2013: 2 nd Quarter Ended 30 September 2012 Results Presentation 24 October 2012 Important Notice Disclaimer This Presentation is focused on comparing actual results for
Next Generation Real Estate. HY 2008 Figures. Colonia Real Estate AG HY 2008 Figures 15 th of August 2008 Cologne
 Next Generation Real Estate HY 2008 Figures Colonia Real Estate AG HY 2008 Figures 15 th of August 2008 Cologne Focused and Integrated Business Model Colonia Real Estate AG Investments Management Principal
FINANCIAL RESULTS Q3 2018
 FINANCIAL RESULTS Q3 2018 November 14, 2018 OVERVIEW & INVESTMENT HIGHLIGHTS Chapter 01 Kapitel Titel ADO THE PURE PLAY BERLIN RESIDENTIAL SPECIALIST Investment highlights 1 Berlin residential pure play
REAL ESTATE PATRIMONY Total lettable surface area (m²) Debt ratio RD 21 June 2006 (max. 65%) (%) 39 % 43 %
 Debt ratio RD 21 June 2006 (max. 65%) (%) 39 % 43 %") Regulated information embargo 03/11/2008, 17:45 Interim statement for the third quarter of 2008 of the board of directors covering the period 01.07.2008 to 30.09.2008 Positive results for Intervest Retail
Regulated information embargo 03/11/2008, 17:45 Interim statement for the third quarter of 2008 of the board of directors covering the period 01.07.2008 to 30.09.2008 Positive results for Intervest Retail
MAS REAL ESTATE INC. Results presentation. New Waverley, Edinburgh, UK. Year ended 30 June 2016
 MAS REAL ESTATE INC Results presentation Year ended 30 June 2016 New Waverley, Edinburgh, UK 1 TABLE OF CONTENTS i. Company profile ii. iii. iv. Strategic update Recurring and potential EPS Highlights
Sponda Financial Results Q November 2015
 Sponda Financial Results Q3 2015 3 November 2015 1. Highlights for the Period Kari Inkinen 2. Strategy Implementation Pia Arrhenius 3. Business environment and Business Update Kari Inkinen 4. Financials
Financial Ambition 2017 ING Investor Day Patrick Flynn CFO, Member Executive Board ING Group. Amsterdam - 31 March 2014
 Financial Ambition 2017 ING Investor Day Patrick Flynn CFO, Member Executive Board ING Group Amsterdam - 31 March 2014 www.ing.com We entered the final phase to become a pure Bank 2009-2011 2012-2013 2014-2017
2015 Annual Results. March 9, la foncière parisienne
 2015 Annual Results March 9, 2016 Content I. Introduction II. Portfolio III. Rental business IV. Financial results V. Outlook 2 2015: key figures EPRA liquidation NAV Rental income Parisian Tertiary Revalued
2009 Half-Year Results. 3 August 2009
 2009 Half-Year Results 3 August 2009 John Nelson, Chairman 2 Agenda Introduction John Richards Financial Results Simon Melliss France Christophe Clamageran UK David Atkins Summary and Conclusion John Richards
DEXUS Property Group. Institutional placement 3 December m securities at $0.73 to $0.84 raising $286m - $329m
 DEXUS Property Group Institutional placement 3 December 2008 391.7m securities at $0.73 to $0.84 raising $286m - $329m DEXUS Funds Management Limited ABN 24 060 920 783 Australian Financial Services Licence
HIGHLIGHTS PROPERTY FOR INDUSTRY 2017 ANNUAL RESULTS BRIEFING
 HIGHLIGHTS Significant acquisition activity: $84.3 million of property acquired, improving portfolio metrics and providing significant medium to long-term development potential Transition of the Penrose
INTERIM STATEMENT ON THE THIRD QUARTER 2009
 Regulated information embargo 02/11/2009, 17:45 INTERIM STATEMENT ON THE THIRD QUARTER 2009 of the board of directors for the period 01.07.2009 to 30.09.2009 Operating distributable result improves by
MAPLETREE LOGISTICS TRUST S 1Q FY14/15 DISTRIBUTION PER UNIT RISES 6% to 1.90 CENTS
 For Immediate Release MAPLETREE LOGISTICS TRUST S 1Q FY14/15 DISTRIBUTION PER UNIT RISES 6% to 1.90 CENTS Highlights: 6% year-on-year growth in amount distributable to Unitholders to S$46.6 million Recent
PRESS RELEASE INTERMEDIATE DECLARATION OF THE BOARD OF DIRECTORS FOR THE PERIOD FROM TO
 INTERMEDIATE DECLARATION OF THE BOARD OF DIRECTORS FOR THE PERIOD FROM 01.01.2014 TO 31.03.2014 Net current result per share Group share (excluding IAS 39 impact) of 1.74 at 31.03.2014 - Compared to a
Financial Results Q May 2012
 Financial Results Q1 2012 4 May 2012 Conference call 11.00 am EET Dial-in number: +44 (0)20 3450 9987 Webcast available at our website: Investors > performance > results and presentations Agenda Performance
2016 Annual Results. March 8, la foncière parisienne
 2016 Annual Results March 8, 2017 Content I. Introduction II. Portfolio III. Rental business IV. Financial results V. Outlook 2 2016: key figures EPRA liquidation NAV Rental income Parisian Tertiary Revalued
Triodos Vastgoedfonds
 Objective Triodos Vastgoedfonds was established in 2004 and is the first sustainable real estate fund in the Netherlands. The fund takes a broad view of sustainability, focusing on climate objectives and
WDP Q results. Roadshow November & December 2012
 WDP Q3 2012 results Roadshow November & December 2012 Agenda WDP in a nutshell Strategic vision Highlights 9M 2012 Acquisition Lake Side Portfolio Update on WDP Netherlands Operational review Portfolio
Q32016 QUARTERLY STATEMENT
 Q3 2016 QUARTERLY STATEMENT DEAR SHAREHOLDERS, In this quarterly statement we are presenting the information on our company s performance in the current year in a new format. Not only is this in conformity
AGENDA. 1. Highlights 2. Portfolio 3. Market & Strategy Annual Results 5. Capital Management 6. Closing & Questions 7.
 AGENDA 1. Highlights 2. Portfolio 3. Market & Strategy 4. 2015 Annual Results 5. Capital Management 6. Closing & Questions 7. Appendices 2 HIGHLIGHTS Profit after tax for the year of $72.8 million or
AUDIOCAST PRESENTATION Q3/2017
 19.10.2017 AUDIOCAST PRESENTATION Q3/2017 Q3/2017: GOOD OPERATIONAL RESULTS IN SWEDEN AND NORWAY HIGHLIGHTS Q3/2017 4.7% INCREASE IN EPRA EPS TO EUR 0.133 - Overall net rental income growth and lower administrative
Results for the Third Quarter ended 30 September October 2008
 Results for the Third Quarter ended 30 September 2008 21 October 2008 Disclaimer This Presentation is focused on comparing results for the three months ended 30 September 2008 versus results achieved in
Refresco Gerber reports solid 2015 results and delivers on strategic goals
 Press release March 10, 2016 Refresco Gerber reports solid 2015 results and delivers on strategic goals Key indicators: Volume in full year 2015 increased 2.1% to 6,095.5 million liters (FY 2014: 5,968.9
For personal use only
 ASX/MEDIA RELEASE 29 May 2012 MARKET & INVESTOR UPDATE Centro Retail Australia ( CRF ) announces an update on a number of recent corporate and strategic activities and releases the attached investor presentation.
9M 2018 RESULTS 09 NOVEMBER 2018 TLG IMMOBILIEN AG 9M 2018 RESULTS
 TLG IMMOBILIEN AG 9M 208 RESULTS DISCLAIMER This presentation includes statements, estimates, opinions and projections with respect to anticipated future performance of TLG IMMOBILIEN ("Forward-Looking
Agenda. WDP in a nutshell Highlights Q Operational review Results analysis Financing structure WDP share New ambition Outlook 2013
 WDP Q1 2013 results Agenda WDP in a nutshell Highlights Q1 2013 Operational review Results analysis Financing structure WDP share New ambition 2013-16 Outlook 2013 2 WDP in a nutshell Pure player in warehouse
Deutsche Wohnen SE.» 9M 2017 results. Conference Call, 14 November 2017
 Deutsche Wohnen SE» 9M 2017 results Conference Call, 14 November 2017 1 » Agenda 1 Highlights 9M 2017 2 Portfolio 3 Financials 4 Appendix 2 » Highlights 9M 2017 Strong operating business L-f-l rental growth
Open minds, open spaces
 Open minds, open spaces A presentation by Laurent Carlier, CFO of Befimmo 18 November 2017 Finance Avenue Speaker Laurent Carlier > CFO of Befimmo since 2006 > 17 years of experience as Finance Director
BASIC-FIT CONTINUES STRONG GROWTH WITH SOLID MARGINS
 BASIC-FIT CONTINUES STRONG GROWTH WITH SOLID MARGINS Club openings pipeline strengthens further; at least 100 club openings in 2018 H1 FINANCIAL HIGHLIGHTS Revenue increased by 22% to 190 million (H1 2017:
Half yearly financial statement 2015
 Half yearly financial statement 2015 Vilvoorde, 23 July 2015 Regulated information Embargo until 24/07/2014, 08:00 AM CONTENTS 1. Overall summary real estate markets 1 2. Interim financial report Key figures
Welcome to Kungsleden Q3 2013
 Welcome to Kungsleden Q3 2013 25 October, 2013 Biljana Pehrsson, CEO Anders Kvist, Deputy CEO and CFO 2013 Kungsleden Aktiebolag Agenda 1. Q3 2013 results 2. Kungsleden's new strategy and targets 3. Portfolio