Amsterdam Schiphol 1 August Half-year results 2013
|
|
|
- Susanna Goodman
- 5 years ago
- Views:
Transcription


1 Amsterdam Schiphol 1 August 2013 Half-year results 2013

2 Introduction CFO Pieter Roozenboom Age 41 Nationality Dutch CEO Merin (former Uni-Invest Holding) a.o. restructuring CMBS, equity and syndicated mezzanine loan, new strategy and businessplan CFO Uni-Invest Holding a.o. preparation IPO COO ING REIM Europe Finance, IT, Risk & Compliance 2 Wereldhave Management Holding BV
3 Main topics Q Core retail portfolio LfL NRI at target with +3.3%; above target in Belgium and Finland, below target in NL Core office portfolio LfL NRI: Paris +6.2%, Madrid -6.6% Occupancy core portfolio remains stable Sale non-core portfolio advancing with 55m in Q2, including mixed portfolio and former head office in NL for 37.6m and two assets in the UK for 14.8m Richmond (UK) sold in July for 24.8m; last UK asset (land parcel) expected to be sold in Q3 Management offices UK & US closed in Q2; Head office moved to Amsterdam Schiphol H result NRI 62.7m (H1 12: 76.7m) LfL growth core portfolio +3.2%, total portfolio +1.3% Occupancy 94.8% (Q1 13: 94.1%) DIR p/s 1.76 (H1 12: 2.07) EPRA NAV (Q4 12: 67.91) * Valuation result -0.5% (FY 12: -6.2%) Outlook FY 2013 Direct result per share between Dividend forecast maintained at 3.30 per share 3 * Adjusted for revised IAS 19 Pensions: per share
4 Key results H H % growth % LFL growth Total NRI core portfolio 46.1m 44.8m 3.0% 3.2% Total NRI non-core portfolio 16.6m 31.9m (48.0)% (11.7)% Total net rental income 62.7m 76.7m (18.2)% 1.3% Occupancy 94.8 % 95.1 %* (30)bps Direct result 43.2m 49.0m (11.9)% Direct result per share (15.0)% Valuation result ( 13.5)m ( 173.8)m June 2013 Dec 2012 EPRA NAV per share ** (5.0)% LTV 28% 44% Investment properties in operation*** 1,760m 2,616m (32.7)% 4 * Portfolio excluding UK and USA ** After adjustment ( p/s) due to changes in IAS 19 (pensions) *** Investment properties in operation including investments held for sale Core portfolio consists of retail FI, NL, BE & offices Paris and ES; Non-core portfolio consists of non-core NL, BE and ES
5 Strategy Regroup Phase Operational Excellence Like for Like rental growth in % Core Retail LFL Index Target 3.5% 3.0% 2.5% 1.25% 2.0% 1.5% 3.3% 1.0% 2.0% 0.5% 0.0% Controlled Development Pipeline 108m invested in H1, m expected for H2 Pipeline on track in Belgium, Finland and France Netherlands challenging, adjusting to new economic reality Maximization value of Itis Development Itis on track Almost fully let, except for current Stockmann unit Total pre-let 68% with rent levels at or above target, target rent 33m in 2015 Yield on cost 7% Overhead reduction in million Occupancy % 100.0% 90.0% 80.0% 70.0% % 97.2% 94.8% 94.1% 97.2% 94.8% 98% Target % 16.0 < B 2013 FC Total Target 2013 Target % 79.1% 2012 EY 2013 Q HY Reinvestments Disposals: Dutch non-core portfolio, Proceeds: 38m, target 150m Furthermore, remaining UK assets have been sold Acquisitions: No acquisitions yet Alignment with all stakeholders Supervisory Board strengthened and extended from 4 to 5 members Anti-take over measures will be evaluated before AGM 2014 Sustainability plan will be ready in H2 2013, execution in 2014 and onwards 5 Core Non Core Total Target
6 Direct result per share ( 0.03) 0.01 ( 0.36) 0.12 ( 0.05) Q2 Standing portfolio Acquisitions Disposals General costs Currency 2013 Q2 Decrease result standing portfolio mainly driven by sales of UK and US portfolio Reduced overhead expenses from closing UK & US offices and reduction in staff had a positive effect Interest charges decreased mainly due to redemption of loans and repurchase of convertible bond Interest rate sensitivity: 50bps change in interest rates changes DIR p/s by 0.07, or 2% annually 6
7 Valuation result standing portfolio 4.0% 3.0% 2.0% 3.7m 1.0% 1.6m 2.1m +1.9% 0.0% +0.5% +0.5% (0.1)% (0.5)% -1.0% (2.7)% ( 12.1)m -2.0% (3.6)% -3.0% ( 15.1)m -4.0% ( 4.4)m Belgium Finland France The Netherlands Spain Total Yield MR / Other 7
8 EPRA NAV per share 1.76 ( 1.15) ( 3.30) 67.91* ( 0.92) EY Direct result Indirect result Dividend Currency Other 2013 Q2 IFRS NAV** 31 Dec. 2012: 63.64* 30 June 2013: EPRA NNNAV 31 Dec. 2012: 65.72* 30 June 2013: * Effect revised IAS 19 Pensions: per share ** Reconciliation IFRS EPRA on sheet 27 of this presentation


9 Belgium Key parameters retail H H Net rental income 12.9m 10.2m LfL 5.8% 4.9% Occupancy 99.4% 99.4% Valuation result +0.6% +0.7% NIY (EPRA) 5.8% n.a. Standing investments 379.5m 362.9m Under construction 68.1m 50.4m Genk Shopping I Shopping centre Nivelles Core retail LfL NRI 5.8%, 420bps above CPI, due to impact opening Nivelles on existing units and renewals in Belle-Ile Occupancy retail high at 99%, reached 100% upon letting remaining space to Desigual in July Non-core consists of 124m office portfolio. LfL NRI +7.5% due to new lettings in Berchem & Vilvoorde. Occupancy increased to 86.6% Project Ghent delayed for a few months; construction of Genk Shopping I on track but tenants somewhat reluctant to pick up bigger units, pre-let at 50% 9 Wereldhave Management Holding BV

10 Finland Key parameters retail H H Net rental income 11.2m 12.7m LfL 4.3% 5.5% Occupancy 99.1% 98.5% Valuation result +0.5% +0.2% NIY (EPRA) n.a. n.a. Standing investments 460.4m 458.2m Under construction 62.9m 11.7m Core retail LfL NRI 4.3%, 220bps above CPI, due to positive reversions at relettings & renewals NRI lower due to vacancy from renovation works New Stockmann flagship store in former Piazza will open in November, well before X-mas season At end 2013, works on Itis completed, except for current Stockmann store, where completion is scheduled mid-2014 Shopping centre Itis, Helsinki 10 Wereldhave Management Holding BV
 6.0% n.a. Standing investments 479.9m 504.9m Under construction 8.7m 2.1m Core retail LfL NRI +1.2%, 120bps below CPI due to bankruptcies and despite pos.")

11 Netherlands Foto sh centre Key parameters retail H H Net rental income 15.3m 14.9m LfL 1.2% 4.0% Occupancy 94.8% 97.3% Valuation result -2.4% -0.5% NIY (EPRA) 6.0% n.a. Standing investments 479.9m 504.9m Under construction 8.7m 2.1m Core retail LfL NRI +1.2%, 120bps below CPI due to bankruptcies and despite pos. Relettings & renewals Economic headwinds continues, consumer confidence low, bankruptcies increasing With recent sales of 38m, disposal non-core portfolio almost completed, one logistic asset left for which new leases were signed in Q3 Modernisation shopping centres adjusted to new reality Shopping centre Kronenburg, Arnhem 11 Wereldhave Management Holding BV


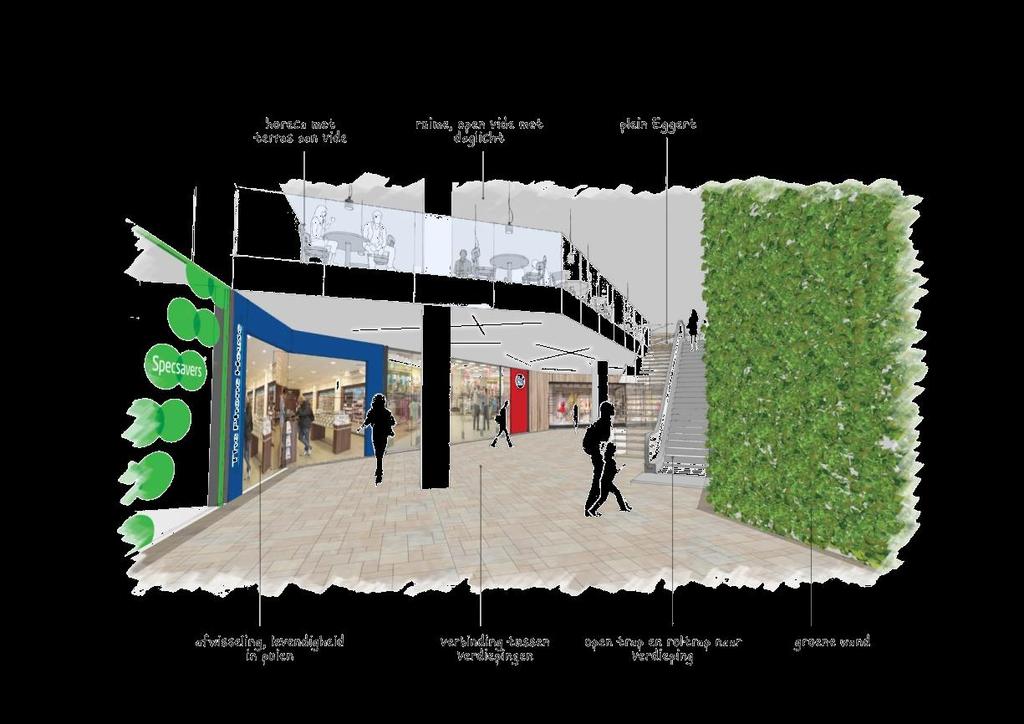
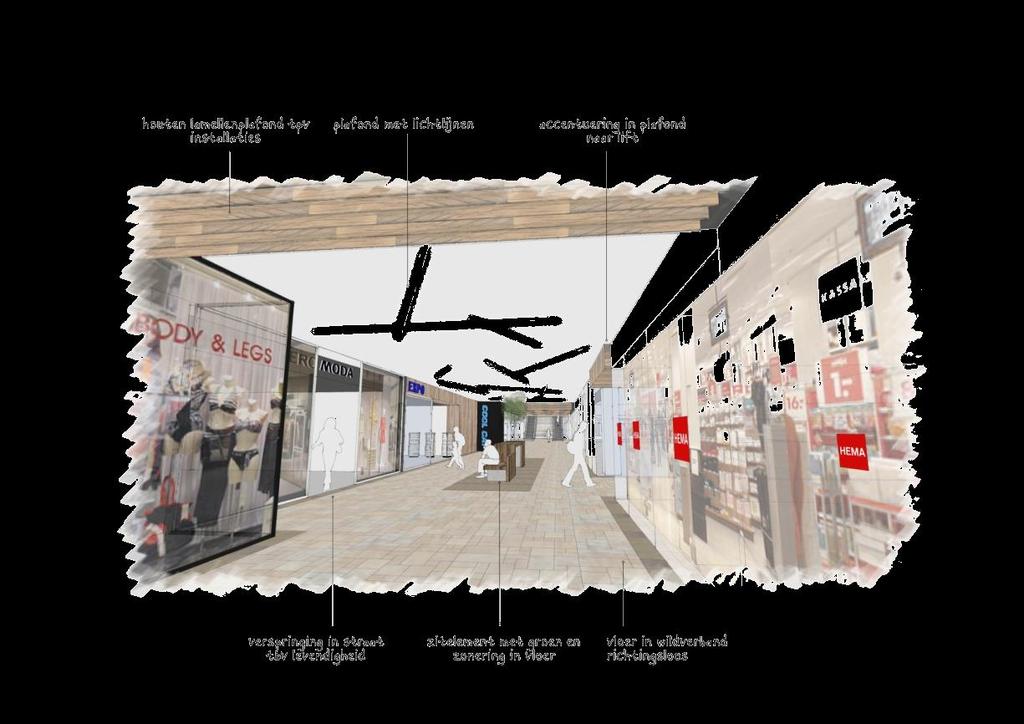

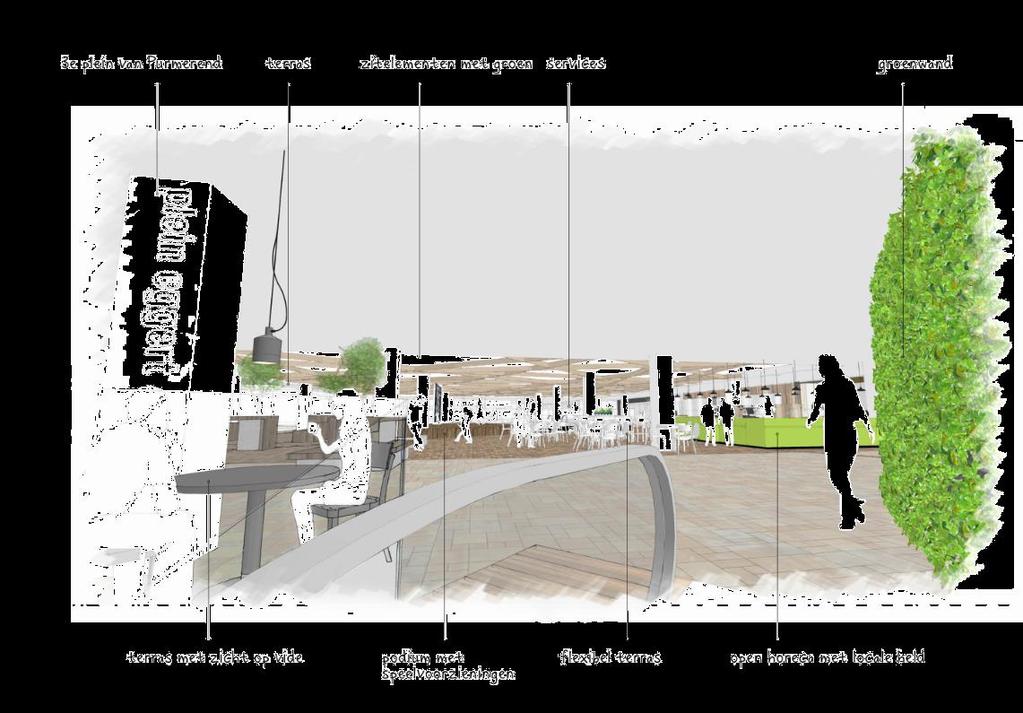

12 Modernising Dutch portfolio: sh. centre Eggert 12 Wereldhave Management Holding BV


13 Current New 13 Bottlenecks Entrances; poorly visible, uninviting and low quality architecture Interior; dark passages, escalators poorly visible, disorderly and badly visible shop fronts Low quality F&B Solutions Upgrading entrances and interior Introduction 100% route Positioning anchors New F&B plaza
14 Shopping centre visitors Core retail portfolio * (x 1,000) H H % growth Belgium 5,063 4, % Netherlands 14,296 14,624 (2.2)% Total 19,359 19, % * No relevant visitors numbers available for Finland, due to refurbishment project and change of counting systems Footfall Dutch retail market-10% vs WH -2.2% and Belgian market -3% vs WH +7,8% (source: Locatus) Belgium: marked increase in footfall mainly due to Nivelles (impact extension) and Tournai. Stable in Belle-Ile Netherlands: footfall is declining, in line with current weakening retail market 14

15 Paris Key parameters office H H Net rental income 4.9m 4.6m LfL 6.2% 0.6% Occupancy 99.0% 99.0% Valuation result +1.9% +2.5% NIY (EPRA) 6.0% n.a. Standing investments 179.3m 168.1m Under construction 163.2m 72.6m LfL NRI +6.2% due to lease in Le Cap already in Q Occupancy remains high at 99% Construction of Noda well on track. Heads-of-terms (9 yr fixed lease) signed with blue-chip company for 65% of sqm BREEAM Outstanding for Noda at interim assessment Pre-sold Joinville project to be completed at year-end 2013 Joinville office development, Paris 15 Wereldhave Management Holding BV
16 Development projects Committed (in m) Total Investment Capex so far Expected NIY Percentage pre-let Completion Ghent (BEL) % % 70% Q Joinville-le-Pont (FR) pre-sold Q / Q Itis (FIN) % 68% Q Issy-Les-Moulineaux (Noda, FR) % - 7.5% 0% Q Genk (BEL) % - 7.0% 50%* Q Total * 50% of the final 27,100 sqm Committed (in m) Total Investment Capex so far Expected NIY Percentage pre-let Completion Tournai Retail Parc (BEL) % % 30% Q Nivelles Retail Parc (BEL) % % - Q Waterloo (BEL) % % Tournai (BEL) % - 7.0% - Q Total
17 Finance Key parameters 30 June December 2012 Covenants Interest bearing debt * 689m 1,282m Average cost of debt** 2.7% 2.7% Fixed vs floating debt 57% / 43% 49% / 51% LTV 28% 44% 60% ICR 6.1x 4.6x 2.0x Diversification debt profile Maturity profile ( m) 6% 20% Debt Undrawn 33% 176 Revolving credit facilities 41% USPP Convertible bond Debenture * Nominal value of interest bearing debt ** Net financial expenses including US 17
18 Loan-to-Value (24.8)% 43.6% 4.4% 2.5% 2.2% 27.9% The LTV increased during Q2 from 24.2% to 27.9% due to the dividend distribution and Capex, which was mitigated by the Q2 result and the sale of the Dutch non-core portfolio FY 2012 Disposals Capex Dividend & Result Other H Development capex in H was 108m. For H2 2013, between 95m and 115m is budgeted, depending on the progress of the works. This will increase the LTV The sale of Richmond and Joinville will lower the LTV with 1% and 3% respectively The overall ambition to reinvest 400m in core markets during the next two years, while maintaining a LTV between 30 and 40%, is still on track 18
19 Outlook Direct result per share FY 2013 between , with a proviso for further deterioration of economic conditions Dividend forecast maintained at 3.30 per share Investment product on offer has increased, but quality is scarce. Selectively exploring opportunities to invest Sale of non-core property to continue but at slower pace 19

20 Appendix De Eggert - The Netherlands 20
21 Portfolio composition 21% 2% 14% 10% 77% 76% Retail Offices Other Core retail Core offices Non-core 28% 5% 29% 11% 27% Belgium Finland France Netherlands Spain 21
22 Top 10 Tenants & Top 5 Properties Rank Tenant % of rent 1 EDF 7.9% 2 Hennes & Mauritz 3.0% 3 Ahold 2.7% 4 Stockmann 2.7% 5 Ergo Services KDV 2.3% 6 C&A 1.9% 7 Excellent Retail Brands 1.7% 8 Kesko 1.6% 9 Blokker 1.5% 10 Groupe Canal+ 1.2% Total top 10 tenants 26.6% Rank Property Sector Value June 2013 % of Total 1 Itis (Helsinki, FIN) Sh.centre 461m 26.5% 2 Belle-Ile (Liège, BEL) Sh.centre 162m 9.3% 3 Carré Vert (Paris, FRA) Office 150m 8.6% 4 Nivelles (BEL) Sh.centre 114m 6.6% 5 Kronenburg (Arnhem, NL) Sh.centre 112m 6.4% 999m 57.4% 31 properties in total 1,739m* 100% * Appraisal value 22
23 Occupancy Occupancy Value * Core portfolio Q Q Q June 2013 Belgium 99.4% 98.9% 98.7% 380m 21.8% Finland 99.1% 99.1% 98.5% 461m 26.5% Netherlands 94.8% 95.3% 97.1% 480m 27.6% Total core retail 97.4% 97.5% 98.0% 1,321m 75.9% Paris 99.0% 99.0% 99.0% 189m 10.9% Spain 87.8% 87.5% 87.5% 61m 3.5% Total core offices 95.9% 95.8% 95.8% 250m 14.4% Total 97.2% 97.2% 97.7% 1,571m 90.3% Non-core portfolio Belgium 86.6% 85.0% 81.3% 124m 7.1% Netherlands 46.0% 76.8% 88.0% 10m 0.6% Spain 70.2% 65.7% 67.4% 34m 2.0% Total 79.1% 78.7% 79.9% 168m 9.7% Total portfolio 94.8% 94.1% 94.8% 1,739m 100.0% * Appraisal value 23
24 Lease expiry profile per sector 1.1% 1.5% Other 1.9% 1.5% Core Offices Core Retail 3.2% 0.9% 1.7% 2.3% 1.2% 4.2% 8.5% 5.2% 14.8% 22.1% 8.1% 7.3% 4.9% 0.7% 2.2% 0.3% 5.4% 1.0% > 2022 Excluding indefinite contracts (6.6% of total) 24
25 Valuation: Core and non-core portfolios Core portfolios In m H FY 2012 % growth Belgium % Finland % Netherlands (2.3)% Paris % Spain (2.3)% Total 1, ,563.7 (0.3)% Non-core portfolios In m H FY 2012 % growth Belgium % Netherlands* (74.1)% Spain (6.3)% Total (18.6)% UK (89.9)% US (100)% Total (96.3)% NB Valuations include investments held for sale *Including former head office Nassaulaan, the Hague 2m 25
26 EPRA Net Initial Yield In % Core Retail Core Office Non-Core Total Belgium Finland n.a. - - n.a. Netherlands Paris Spain EPRA NIY As per 30 June 2013 Wereldhave implemented the EPRA Net Initial Yield* EPRA Net Yield: 5.9% (topped-up: 6.1%) Due to refurbishment Itis has been excluded. The Itis EPRA NIY at completion has been valued at 5.45% Average cap rate decreased in H1 20bps to 6.3%, mainly due to asset disposals Valuation result: 0% from yield movements, -0.5% from market rent and other * Annualised rental income, based on the cash rents passing at the balance sheet date, less non-recoverable property operating expenses, divided by the gross market value of the portfolio (see 26
27 NAV reconciliation (IFRS EPRA) in per share IFRS NAV 30 June Effect of conversion 2.14 Diluted NAV Fair value derivatives (0.71) Deferred tax 3.43 Goodwill (0.08) EPRA NAV Fair value derivatives 0.71 Fair value interest bearing debt (1.23) Deferred tax (2.06) EPRA NNNAV Wereldhave Management Holding BV

28 Overview of redevelopment Itis Level 1 Pasaasi Diagonal Bulevard Stockmann Tenant relocation programme 28
29 Contact details Press: Richard Beentjes T Analysts: Jaap-Jan Fit T
Amsterdam Schiphol 25 July Half-year results 2014
 Amsterdam Schiphol 25 July 2014 Half-year results 2014 Highlights Financial performance H1 2014 H1 2013 Direct result per share 1.73 1.76 Indirect result per share (1.50) (1.15) EPRA NAV per share 62.48
Investor presentation 9M 2012 results
 Investor presentation 9M 2012 results Key results: stabilising in Q3 Direct result p/s: 3.05 (-17.6% yoy) Q3: + 0.01 vs Q2 Revaluation portfolio: -4.75% Q3: -0.25% NAV p/s: 63.72 (-12.9% yoy) Q3: +0.4%
Amsterdam 11 February Strategy update and full year 2012 results
 Amsterdam 11 February 2013 Strategy update and full year 2012 results Main topics 2012 H1 2012 Downward valuation of 173.8m Dividend cut to 3.20-3.40 Q3 2012 Stabilisation and restructuring Sale US Announced
Investor presentation Q results
 Investor presentation Q1 2011 results Recent highlights Successful issue of US$ 300m senior notes (US private placement) Sale non-strategic assets in UK of 15.1m, 7% above latest valuation Sale of a further
Investor presentation H results
 Investor presentation H1 2011 results Recent highlights New lettings in Belgian and US office portfolio. Occupancy rate improving Heads of terms agreed for hotel in Eilan-project: 20 yr fixed lease, operator
Update third quarter 2013
 Update third quarter 2013 Schiphol, October 31, 2013 Summary Wereldhave is well on track in achieving its strategic objectives 2013-2015: Like-for-like rental growth of the core retail portfolio for 2013
Schiphol, 21 July 2016 HALF-YEAR RESULTS 2016
 Schiphol, 21 July 2016 HALF-YEAR RESULTS 2016 Financial performance & Operations OPERATIONS H1 2016 H1 2015 Direct result per share 1.77 1.62 Indirect result per share (1.68) 0.64 EPRA NAV per share 50.53
Dutch Property Tour April 15, 2014
 Dutch Property Tour April 5, 204 Today s schedule Introduction, Wereldhave Schiphol Ronald van der Mark, CEO Action Dirk Anbeek, CEO Wereldhave Belinde Bakker, Managing Director NL De Eggert, Purmerend
ANNU AL REPOR ANNUAL T REPORT 2013
 ANNUAL REPORT 2013 ANNUAL REPORT 2013 This is the Annual Report 2013 of Wereldhave N.V. including the report from the Board of Management for the year 2013, the property portfolio overview, the financial
PRESS RELEASE RESULTS FIRST HALF 2017
 PRESS RELEASE RESULTS FIRST HALF 2017 JULY 25, 2017 CONTINUED STRONG PERFORMANCE IN THE NETHERLANDS, STABLE IN BELGIUM, A RECOVERY IN FINLAND AND HEADWIND IN FRANCE (2016: 62.6m) FIRST HALF 2017 CONTINUED
Trading update Q Wereldhave N.V.
 0 Trading update Q3 2018 Wereldhave 19 October 2018 N.V. Executing on the strategic agenda by disposal of Itis in Finland Occupancy increases in all countries to 96.2% overall Footfall increases 2.1% above
/ Investment portfolio 2.418,2 mln 2.646,0 mln Shareholders equity 3) 1.686,5 mln 1.
 1.686,5 mln 1.") Results 2009 Key items Direct result per share stable at 4.93 (2008: 4.92) Property revaluation -9.1% (until Q3 2009: -8.3%) Net asset value 73.77 per share (2008: 83.74) Solvency stable at 70% (2008:
Results 2009 Key items Direct result per share stable at 4.93 (2008: 4.92) Property revaluation -9.1% (until Q3 2009: -8.3%) Net asset value 73.77 per share (2008: 83.74) Solvency stable at 70% (2008:
STEADY STRATEGY ROLLOUT
 Press release STEADY STRATEGY ROLLOUT Negative value movements mostly due to Spanish portfolio Key points 9M 2012 (in brackets: 9M 2011) Direct investment result 47.1 million ( 50.6 million) Values movements
PRESS RELEASE RESULTS FIRST HALF 2016
 PRESS RELEASE RESULTS FIRST HALF 2016 JULY 21, 2016 STRONG LEASING PERFORMANCE: LIKE-FOR-LIKE RENTAL GROWTH AT 1.0%, AND FAST RECOVERING AND IMPROVING OCCUPANCY DESPITE A RETAIL MARKET HIT BY BANKRUPTCIES
VASTNED RETAIL REALISES LOWER DIRECT INVESTMENT RESULT, BUT PROPERTY VALUES UP FOR SECOND CONSECUTIVE QUARTER
 Interim report VASTNED RETAIL REALISES LOWER DIRECT INVESTMENT RESULT, BUT PROPERTY VALUES UP FOR SECOND CONSECUTIVE QUARTER Reinier van Gerrevink, CEO VastNed Retail: Lease negotiations provide us with
Kempen conference. Amsterdam 30 May 2013
 Kempen conference Amsterdam 30 May 2013 Company snapshot Description Dutch REIT: NSI is a real estate asset management company and qualifies as fiscal investment institution under Dutch law (REIT) Full
Q1 Q4 Q1 Q4. Full Year Results. Audiocast presentation. CEO Marcel Kokkeel CFO, Exec. VP Eero Sihvonen
 Full Year Results Audiocast presentation CEO Marcel Kokkeel CFO, Exec. VP Eero Sihvonen 2 : A YEAR OF ACTION WITH SOLID PERFORMANCE AND A MUCH STRONGER BALANCE SHEET : A year of action EUR 200 million
Half yearly financial statement 2015
 Half yearly financial statement 2015 Vilvoorde, 23 July 2015 Regulated information Embargo until 24/07/2014, 08:00 AM CONTENTS 1. Overall summary real estate markets 1 2. Interim financial report Key figures
Half yearly financial statement 2014
 Half yearly financial statement 2014 Vilvoorde, 24 July 2014 Contents 1. Overall summary real estate markets 1 2. Interim report Key figures 3 Profit 3 Direct result 4 Indirect result 4 Shareholders equity
ANNUAL REpoRt _11Annual Report P kopie.indd :14
 ANNUAL REport 2012 ANNUAL REpoRt 2012 This is the Annual Report 2012 of Wereldhave N.V. including the report from the Board of Management for the year 2012, the property portfolio, the financial statements
Results 2018 Wereldhave
 February 8, 2019 Results 2018 Wereldhave Direct result: 146.7m (2017: 150.1m), or 3.33 per share (2017: 3.43) Indirect result: - 202.3m (2017: - 65.8m) Total result: -55.6m (2017: 84.3m) Occupancy rate
Press release nine months results 2010 VASTNED RETAIL REALISES STABLE DIRECT INVESTMENT RESULT AND POSITIVE VALUE MOVEMENTS IN PROPERTY PORTFOLIO
 Press release nine months results VASTNED RETAIL REALISES STABLE DIRECT INVESTMENT RESULT AND POSITIVE VALUE MOVEMENTS IN PROPERTY PORTFOLIO Reinier van Gerrevink, CEO VastNed Retail: The letting market
Vastned results in line with expectations
 HALF YEAR REPORT 2 AUGUST 2016 2016 HALF-YEAR RESULTS Vastned results in line with expectations Highlights HY1 2016: - Vastned attracts strong and distinctive retailers for several premium city high street
CEO, MARCEL KOKKEEL CFO, EXEC. VP EERO SIHVONEN AUDIOCAST PRESENTATION Q1/2016
 CEO, MARCEL KOKKEEL CFO, EXEC. VP EERO SIHVONEN AUDIOCAST PRESENTATION Q1/2016 SOLID QUARTERLY RESULTS SUPPORTED BY GOOD PERFORMANCE IN NORWAY HIGHLIGHTS Q1/2016 SOLID FINANCIAL RESULTS SUPPORTED BY GOOD
Half yearly financial statement 2013
 Half yearly financial statement 2013 Vilvoorde, 31 July 2013 Contents 1. Overall summary real estate markets 1 2. Interim report Key figures 3 Profit 4 Direct result 4 Indirect result 4 Shareholders equity
Operations. Sustainability. Governance. Results. Annual Report part 2 Strategy
 Annual Report 2015 - part 2 Strategy WELCOME... - 4 - STRATEGY... - 5 - COMPOSITION OF THE PORTFOLIO... - 6 - PROPERTY PORTFOLIO AS AT DECEMBER 31, 2015... - 10 - OPERATIONS... - 18 - SUSTAINABILITY...
AUDIOCAST PRESENTATION Q3/2017
 19.10.2017 AUDIOCAST PRESENTATION Q3/2017 Q3/2017: GOOD OPERATIONAL RESULTS IN SWEDEN AND NORWAY HIGHLIGHTS Q3/2017 4.7% INCREASE IN EPRA EPS TO EUR 0.133 - Overall net rental income growth and lower administrative
Operational activities
 Interim statement of the Statutory Management Company 31 March 2017 Rental income for the first quarter 2017: 12.9 mln Value real estate portfolio, including development projects: 818.7 mln Construction
Summary Securities Note Registration Document
 Summary Securities Note Registration Document SUMMARY Summaries are made up of disclosure requirements known as Elements. The Elements are numbered in Sections A E. This Summary contains all the Elements
MILLION (+1.0%) VALUE INCREASE VASTNED RETAIL PROPERTY PORTFOLIO IN Q1 2011; DIRECT INVESTMENT RESULT MARGINALLY DOWN
 VALUE INCREASE VASTNED RETAIL PROPERTY PORTFOLIO IN Q1 2011; DIRECT INVESTMENT RESULT MARGINALLY DOWN") Press release first quarter figures 2011 20 MILLION (+1.0%) VALUE INCREASE VASTNED RETAIL PROPERTY PORTFOLIO IN 2011; DIRECT INVESTMENT RESULT MARGINALLY DOWN Reinier van Gerrevink, VastNed Retail CEO:
Press release first quarter figures 2011 20 MILLION (+1.0%) VALUE INCREASE VASTNED RETAIL PROPERTY PORTFOLIO IN 2011; DIRECT INVESTMENT RESULT MARGINALLY DOWN Reinier van Gerrevink, VastNed Retail CEO:
PRESS RELEASE RESULTS FIRST HALF 2018
 JULY 24, 2018 PRESS RELEASE RESULTS FIRST HALF 2018 Operations well on track: occupancy increases to 96.1% (YE 2017: 95.5%) EPRA EPS 1.70 (H1 2017: 1.72) Direct result 74.5m (H1 2017: 75.2m) Indirect result
Results HALF-YEAR. Presentation of 30 August 2011
 Results HALF-YEAR 2011 Presentation of 30 August 2011 1 Summary Affine Group Property portfolio Development of group companies Analysis of 1H11 accounts A robust financial model Affine on the stock market
Corporate. Presentation September 2017
 Corporate www.larespana.com Presentation September 2017 Snapshot 2 First IPO of a Spanish REIT listed on the Spanish Stock Exchange Shareholder Structure Focused on creating both sustainable income and
Webcast Presentation. Financial Results 2009
 Webcast Presentation Financial Results 2009 Strategy Citycon wants to be the leading shopping centre owner, operator and developer in the Nordic and Baltic countries. invests in shopping centres and retail
Interim report per 30 June 2013
 Interim report per 30 June 2013 NSI N.V. Report of the Management Board NSI: investing in operational performance Results Direct investment result for the 1 st half-year of 2013 amounted to 25.5 million
Corporate. Presentation March 2017
 Corporate www.larespana.com Presentation March 2017 Snapshot 2 First IPO of a Spanish REIT listed on the Spanish Stock Exchange Shareholder Structure Focused on creating both sustainable income and strong
FIRST- HALF 2017 EARNINGS
 FIRST- HALF 2017 EARNINGS KLÉPIERRE, RETAIL ONLY JULY 26, 2017 DISCLAIMER FIRST- HALF 2017 EARNINGS JULY 26, 2017 This document was prepared by Klépierre solely for use of presenting the Klépierre 2017
NSI PRELIMINARY FULL YEAR RESULTS 2018 PRELIMINARY RESULTS FULL YEAR 2018
 PRELIMINARY RESULTS FULL YEAR 2018 Execution of strategy fully on track - strongly positioned for multiple opportunities ahead Vacancy rate of 13.8% (down 4.6% versus year-end 2017) EPRA NAV of 39.75 per
2015 Annual Results. March 9, la foncière parisienne
 2015 Annual Results March 9, 2016 Content I. Introduction II. Portfolio III. Rental business IV. Financial results V. Outlook 2 2015: key figures EPRA liquidation NAV Rental income Parisian Tertiary Revalued
Interim Results Half Year July 2018
 Interim Results Half Year 2018 July 2018 NSI will be the leading specialist in the Dutch office market, with a strong and efficient platform that will drive returns through pro-active asset management,
2017 HALF YEAR 25 JULY 2017
 2017 HALF YEAR RESULTS 25 JULY 2017 Strong financial results and robust balance sheet Driving performance through operational excellence and disciplined capital allocation High quality pipeline of growth
2018 HALF YEAR 26 JULY 2018
 2018 HALF YEAR RESULTS 26 JULY 2018 H1 2018 Another period of delivery Strong financial results and capital structure Disciplined capital allocation improving portfolio scale and quality, reducing risk
WDP Q results. Roadshow November & December 2012
 WDP Q3 2012 results Roadshow November & December 2012 Agenda WDP in a nutshell Strategic vision Highlights 9M 2012 Acquisition Lake Side Portfolio Update on WDP Netherlands Operational review Portfolio
Press release. Annual figures 2008
 Press release Annual figures 2008 VASTNED RETAIL: DIRECT INVESTMENT RESULT 2008 3.71 PER SHARE ( 3.85 BEFORE ONE-OFF COSTS); PROPERTY VALUE DECREASES RESULT IN NEGATIVE INDIRECT INVESTMENT RESULT OF 6.82
Q HIGHLIGHTS MEUR MEUR % MEUR MEUR 48.4 MEUR 94.8 MEUR % 1.87% +2.2% +1.9 PP +3.5% +73.8% + >100% +19.9% +81.
 Q1-2 2018 HIGHLIGHTS STRENGTHENED OPERATING PERFORMANCE Occupancy rate 94.7% Rental income MEUR 119.0 Rental income lfl MEUR 98.2 +1.9 PP +3.5% +2.2% KPIs SIGNIFICANTLY IMPROVED Results of AM MEUR 94.8
H Results July H Results - Lar España Real Estate. July 27 th,
 H1 2018 www.larespana.com Results July 2018 July 27 th, 2018 Agenda 01 02 03 04 05 H1 2018 Highlights Corporate Activity H1 2018 Financial Results Business Performance Closing Remarks 01 H1 2018 Highlights
WDP FY 2012 results February 13, 2013
 WDP FY 2012 results February 13, 2013 Agenda 2 Introduction WDP in a nutshell Highlights FY 2012 Operational review Financing structure Results analysis WDP share New ambition 2013-16 Outlook 2013 Introduction
2017 Annual Results. 12 March la foncière parisienne
 2017 Annual Results 12 March 2018 Content I. Introduction II. Portfolio III. Rental business IV. Financial results V. Outlook 2 2017 key figures EPRA liquidation NAV Rental income strategic assets (Offices
Open minds, open spaces
 Open minds, open spaces A presentation by Laurent Carlier, CFO of Befimmo 18 November 2017 Finance Avenue Speaker Laurent Carlier > CFO of Befimmo since 2006 > 17 years of experience as Finance Director
2016 Annual Results. March 8, la foncière parisienne
 2016 Annual Results March 8, 2017 Content I. Introduction II. Portfolio III. Rental business IV. Financial results V. Outlook 2 2016: key figures EPRA liquidation NAV Rental income Parisian Tertiary Revalued
INTEGRATED ANNUAL REPORT
 Results Strategy Operations Sustainability Governance & risk Financial Statements INTEGRATED ANNUAL REPORT 2018 RESULTS Message from the CEO 5 Key performance indicators 7 Key figures 2014-2018 8 The share
Kempen European Property Seminar 30 May 2012 in Amsterdam
 Kempen European Property Seminar 30 May 2012 in Amsterdam Profile Top 3 listed Dutch mixed real estate fund Dutch REIT / Listed on Amsterdam Euronext (Midkap AMx) Portfolio: 2.29bn TRI: 203m Outstanding
Corio s direct result, m, in line with previous guidance
 Corio s direct result, 229.8 m, in line with previous guidance Utrecht, 12 February 2015 HIGHLIGHTS 2014 1 Operating performance Direct result (EPRA earnings) is 229.8 m or 2.30 per share, in line with
Half yearly Financial statement 30 June
 2018 Half yearly Financial statement 30 June This half yearly financial statement can be obtained, free of charge, at the company s Head Office and is also available on our website www.wereldhavebelgium.com
Results Strategy Operations Sustainability Governance & risk Financial Statements INTEGRATED ANNUAL REPORT
 INTEGRATED ANNUAL REPORT 2017 RESULTS Message from the CEO 5 Key performance indicators 7 Key figures 2013-2017 8 The share 10 FINANCIAL CALENDAR 12 Highlights 2017 13 Results 79 Equity and debt 80 Staff
Audiocast presentation
 Audiocast presentation / CEO, Marcel Kokkeel CFO, Exec. VP Eero Sihvonen 2 / CONSOLIDATION AS NORDIC LEADER Highlights / Stable financial performance Result supported by lower financing expenses Diverging
NET OPERATING RESULT OF EUR 3.54 MILLION GROWTH OF 6.3% COMPARED WITH Q1 2013
 REGULATED INFORMATION INTERIM STATEMENT UNDER EMBARGO UNTIL 15/05/2014 8.45 AM NET OPERATING RESULT OF EUR 3.54 MILLION GROWTH OF 6.3% COMPARED WITH Q1 2013 OCCUPANCY RATE OF 95% AVERAGE LEASE TERM UNTIL
Sponda Financial Results Q November 2015
 Sponda Financial Results Q3 2015 3 November 2015 1. Highlights for the Period Kari Inkinen 2. Strategy Implementation Pia Arrhenius 3. Business environment and Business Update Kari Inkinen 4. Financials
January December 2011 Results
 January December 2011 Results 27 February 2012 Highlights 2011 ASSETS VALUATION As of December 2011, the total asset valuation (GAV) amounted to 4,286 million euro (-4.3% below Dec. 2010), based on market
FY 2013 RESULTS 12 FEBRUARY 2014
 FY 2013 RESULTS 12 FEBRUARY 2014 1 AGENDA > Introduction > WDP in a nutshell > Roll-out growth plan 2013-16 > Operational review > Highlights FY 2013 > Results analysis > Financing structure > WDP share
EUROCOMMERCIAL PROPERTIES N.V. FIRST QUARTER RESULTS 2014/2015
 Date: 7 November 2014 Release: Before opening of Euronext Amsterdam PRESS RELEASE EUROCOMMERCIAL PROPERTIES N.V. FIRST QUARTER RESULTS 2014/2015 Like for like rental growth continues at 1.1% 12 month turnover
Interim Financial Report of the Board of Directors
 Interim Financial Report of the Board of Directors First half of 2016 Table of Contents 1 Key Figures 4 2 Activity report 5 2.2 Strong half-year results 5 2.2.1 Dynamic organic growth 5 2.2.2 Management
Growth, performance and roll-out of the strategy
 Bezannes, 20 September 2018 8.00 am 2018 half-year results Growth, performance and roll-out of the strategy International development: acquisition of a prime asset in Spain Successful capital increase:
NSI Strategy update and full year results. Roadshow Tel Aviv 7 & 8 April
 NSI Strategy update and full year results Roadshow Tel Aviv 7 & 8 April Equity issue: full focus on operations Successful equity issue 300 million equity raised in a private placement to qualified investors
VASTNED MAKES CLEAR PROGRESS ON HIGH STREET SHOP STRATEGY ROLL-OUT UNDER DIFFICULT MARKET CIRCUMSTANCES
 INTERIM REPORT 2013 14 August 2013 VASTNED MAKES CLEAR PROGRESS ON HIGH STREET SHOP STRATEGY ROLL-OUT UNDER DIFFICULT MARKET CIRCUMSTANCES Key points HY1 2013 (in brackets: HY1 2012) Successful acquisitions
Conference call presentation Q
 Conference call presentation Q1 2018 2018 Content 2 I. TAG highlights Q1 2018 II. TAG financials Q1 2018 III. TAG portfolio Q1 2018 IV. TAG outlook FY 2018 V. Appendix 3 5 12 16 19 Portfolio details, vacancy
results Jan de Kreij (CEO) Jan Haars (CFO) Gerard Groener (CEO CNR) Amsterdam, 29 February 2008
 Jan Haars (CFO) Gerard Groener (CEO CNR) Amsterdam, 29 February 2008") 1 2007 results Jan de Kreij (CEO) Jan Haars (CFO) Gerard Groener (CEO CNR) Amsterdam, 29 February 2008 2 Financial highlights 2007 2007 compared to 2006 Net profit 801.5 m / +25.1% 12.10 per share Direct
1 2007 results Jan de Kreij (CEO) Jan Haars (CFO) Gerard Groener (CEO CNR) Amsterdam, 29 February 2008 2 Financial highlights 2007 2007 compared to 2006 Net profit 801.5 m / +25.1% 12.10 per share Direct
2018 HALF YEAR REPORT
 2018 HALF YEAR REPORT CONTENTS 01 DECLARATION BY THE RESPONSIBLE PARTY 1 04 REPORT OF THE STATUTORY AUDITORS 25 Report of the Statutory Auditors on the half year financial information for 2018 26 02 KEY
CONTENT. 01 Highlights. 02 Portfolio Performance. 03 Optimisation of Financing Structure. 04 FY 2017 Results. 05 Outlook FY
 CONTENT 01 Highlights 02 Portfolio Performance 03 Optimisation of Financing Structure 04 FY 2017 Results 05 Outlook FY 2017 2 IMMOFINANZ RESTRUCTURING 5/2015 12/2017 Sale of logistics asset class - focus
SFL First-Half 2018 Results
 PRESS RELEASE Paris, 26 July 2018 SFL First-Half 2018 Results Rental income: 96.1 million (up 4.9% like-for-like) EPRA earnings: 51.7 million (up 4.1%) Attributable net profit: 200.2 million Property portfolio
ATRIUM COMPANY PRESENTATION
 ATRIUM COMPANY PRESENTATION THE LEADING OWNER & MANAGER OF CENTRAL EASTERN EUROPEAN SHOPPING CENTRES 1H2016 ATRIUM LEADING OWNER & MANAGER OF CEE SHOPPING CENTRES A UNIQUE INVESTMENT OPPORTUNITY Strong
PRESS & ANALYST MEETING
 BEYOND REAL ESTATE PRESS & ANALYST MEETING 2 HALF YEAR RESULTS 31 July 2018 3 Agenda 1. Nature of the portfolio 2. Important activities & developments in 2018 3. Financial results 30 June 2018 4. Property
CITYCON CAPITAL MARKETS DAY 16 MAY 2017, ISO OMENA CFO, EERO SIHVONEN
 STRONG FINANCING FUNDAMENTALS CITYCON CAPITAL MARKETS DAY 16 MAY 2017, ISO OMENA CFO, EERO SIHVONEN MAIN FINANCING TARGETS Loan to Value 40-45% 47.1% Average maturity of loan portfolio > 5 yrs 5.2 Debt
EGULATED INFORMATION INTERIM REPORT FROM THE STATUTORY MANAGER
 ² REGULATED INFORMATION INTERIM REPORT FROM THE STATUTORY MANAGER EPRA EARNINGS OF 7.1 MILLION ( 0.61 PER SHARE) FOR THE FIRST 3 MONTHS OF 2018 NET RENTAL INCOME OF 11.1 MILLION FOR THE FIRST 3 MONTHS
Strategy update Vastned: Focus on growth in selected European cities
 Strategy update Vastned: Focus on growth in selected European cities Divestment of the Turkish portfolio and announcement of share buy-back Strategy update: Focus on growth in selected European cities
Preliminary results 2015
 Preliminary results 2015 Increase in direct result in 2015 ` Highlights Update strategy Significant improvement in quality of portfolio through asset rotation in 2015: Share of region Randstad increased
OFFICES SHOPPING CENTRES PROPERTY DEVELOPMENT. Wereldhave. Value for tomorrow.
 Wereldhave. Value for tomorrow. PROPERTY DEVELOPMENT SHOPPING CENTRES OFFICES Half yearly financial statement 2012 Contents Overall summary real estate markets 3 Interim report Key figures 4 Profit 4 Direct
Agenda. WDP in a nutshell Highlights Q Operational review Results analysis Financing structure WDP share New ambition Outlook 2013
 WDP Q1 2013 results Agenda WDP in a nutshell Highlights Q1 2013 Operational review Results analysis Financing structure WDP share New ambition 2013-16 Outlook 2013 2 WDP in a nutshell Pure player in warehouse
Q INTERIM REPORT JANUARY SEPTEMBER
 Q3 2018 INTERIM REPORT JANUARY SEPTEMBER CITYCON Q3/2018: SOLID OPERATING PERFORMANCE CONTINUED AND ADMINISTRATIVE EXPENSES DECLINED SIGNIFICANTLY. Q3/2018 2 Occupancy remained at a high level of 96.1%.
Financial Results Year February 2013
 Financial Results Year 2012 1 February 2013 Agenda 1. Performance highlights and our priorities Kari Inkinen 2. Market Update Kari Inkinen 3. Financials Erik Hjelt 4. Business Update Kari Inkinen 2 Performance
Autumn Presentation. la foncière parisienne
 Autumn 2017 Presentation I. Background II. Portfolio centered on Paris Central Business District III. Key aspects of TERREÏS Model IV. H1 2017 Results 2 TERREÏS at a glance Property investment company
East Capital Explorer Q1 2017
 East Capital Explorer Q1 2017 9 May 2017 1 Today s Presenters Welcome to today s conference call Mia Jurke CEO, East Capital Explorer Kestutis Sasnauskas Chief Investment Officer, East Capital Explorer
CITYCON S INTERIM REPORT JANUARY JUNE 2015
 2015 Q2 CITYCON S INTERIM REPORT JANUARY JUNE 2015 01 Citycon Q2: Stable results supported by lower financing expenses SECOND QUARTER OF 2015 Turnover decreased to EUR 60.2 million (Q2/2014: EUR 61.9 million)
13 th Kepler Cheuvreux German Corporate Conference Frankfurt, 22 January 2014 Rolf Buch, CEO
 1 Syndicate Analyst Presentation May 2013 13 th Kepler Cheuvreux German Corporate Conference Frankfurt, 22 January 2014 Rolf Buch, CEO Deutsche Annington: Innovation leader based on a long-term vision,
2008 Results. 6 March 2009
 2008 Results 6 March 2009 1 Strategy for dealing with the crisis Simplify the Group Cash and debt management Property management focused on tenants Property disposal program Analysis of 2008 financial
2011 first-half earnings
 2011 first-half earnings Bernard Michel Non-executive chairman Christophe Clamageran Chief executive officer Gilles Bonnier Chief financial officer Paris, July 27, 2011 H1 2011 snapshot in mn June 30,
13 May Shareholders meeting 2015
 13 May 2015 Shareholders meeting 2015 Achievements 2014 Koen Van Gerven CEO 2014 3 Our successful and focused strategy in action Generate continued productivity gains Continue to focus on core mail business
NORTHGATE plc Interim Results Six months ended 31 October 2011
 NORTHGATE plc Interim Results Six months ended 31 October 2011 6 December 2011 1 Agenda Group Summary Operational review UK Bob Contreras Spain Financial performance Outlook Chris Muir Bob Contreras 2
Interim Report 1 Jan 30 Jun August 2008 Kari Inkinen, President and CEO Robert Öhman, CFO
 Interim Report 1 Jan 30 Jun 2008 7 August 2008 Kari Inkinen, President and CEO Robert Öhman, CFO Financial review Market overview Operational review Business areas Appendix 2 Financial review Market overview
Financial Results Q Kari Inkinen, President and CEO Erik Hjelt, CFO Pia Arrhenius, SVP, IR
 Financial Results Q2 2009 Kari Inkinen, President and CEO Erik Hjelt, CFO Pia Arrhenius, SVP, IR Introduction Market review Business overview Financial overview Appendix 2 Overview of reporting segments
9M 2018 RESULTS 09 NOVEMBER 2018 TLG IMMOBILIEN AG 9M 2018 RESULTS
 TLG IMMOBILIEN AG 9M 208 RESULTS DISCLAIMER This presentation includes statements, estimates, opinions and projections with respect to anticipated future performance of TLG IMMOBILIEN ("Forward-Looking
ENCORE+ DIVERSIFIED AND BALANCED CORE+ PROPERTY FUND
 ENCORE+ DIVERSIFIED AND BALANCED CORE+ PROPERTY FUND Q1 2017. This document is for professional clients and institutional/qualified investors only. It is not to be distributed to or relied on by retail
Financial results & business update. Quarter and year ended 31 December February 2016
 Financial results & business update Quarter and year ended 31 December 2015 11 February 2016 Disclaimer 3 Any remarks that we may make about future expectations, plans and prospects for the company constitute
2009 Half-Year Results. 3 August 2009
 2009 Half-Year Results 3 August 2009 John Nelson, Chairman 2 Agenda Introduction John Richards Financial Results Simon Melliss France Christophe Clamageran UK David Atkins Summary and Conclusion John Richards
PRESS RELEASE ANNUAL RESULTS Results underline strategic choice. 6 March 2014 HEADLINES
 PRESS RELEASE 6 March 2014 2013 ANNUAL RESULTS Results underline strategic choice HEADLINES - Vastned realises strategic objectives through active acquisition and divestment policy - Direct investment
Press release. Results 2013
 Press release Results 2013 Vilvoorde, 4 February 2014 SUMMARY For 2013, Wereldhave Belgium posted a profit of 34.8 mln (2012: 36.5 mln); the direct result per share amounted to 5.09 (2012: 4.87). A dividend
Hansteen. Full Year Results to 31 December Tilburg, Netherlands
 Hansteen Full Year Results to 31 December 2016 Tilburg, Netherlands Contents Introduction Hansteen 2016 results Sale announcement Sale of German and Dutch Portfolio 2016 Annual Results 2016 Property Performance
June Review and results
 June 2005 - Review and results Contents Business overview Financial highlights Debt structure Property statistics Operational highlights Share capital structure Pipeline 2005/6 2 Business overview Property
ATRIUM COMPANY PRESENTATION
 ATRIUM COMPANY PRESENTATION THE LEADING OWNER & MANAGER OF CENTRAL EASTERN EUROPEAN SHOPPING CENTRES August 2017 ATRIUM LEADING OWNER & MANAGER OF CEE SHOPPING CENTRES Strong management team with a proven
REMUNERATION REPORT Remuneration of the Board of Management
 Policy The remuneration policy 2015 and onwards was adopted by the Extraordinary General Meeting of Shareholders on July 23, 2015, with effect from January 1, 2015. The goals of the remuneration policy