Investor presentation H results
|
|
|
- Brice Atkinson
- 5 years ago
- Views:
Transcription

1 Investor presentation H results
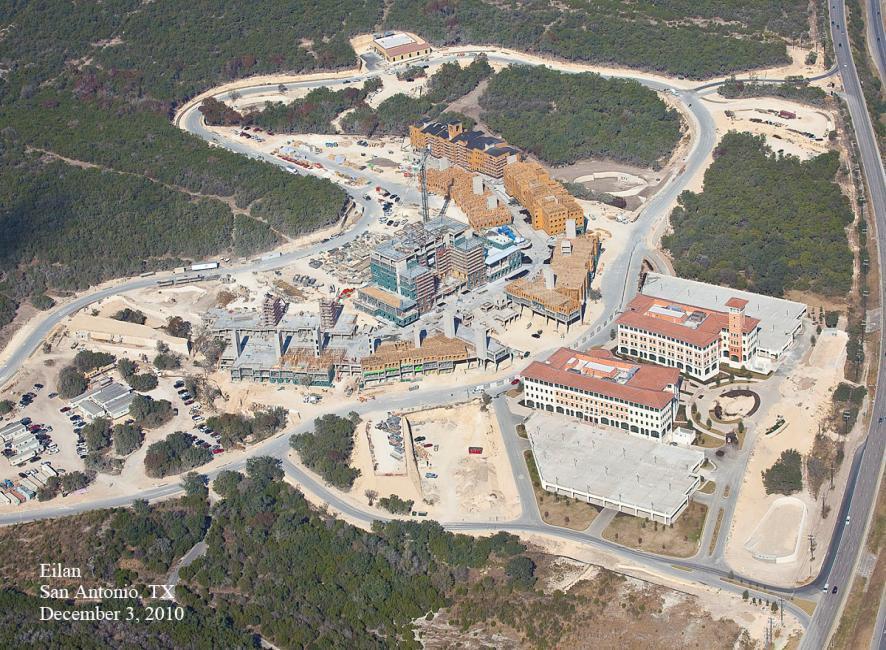
2 Recent highlights New lettings in Belgian and US office portfolio. Occupancy rate improving Heads of terms agreed for hotel in Eilan-project: 20 yr fixed lease, operator targets the Méridien-brand Sale non-strategic assets in UK and The Netherlands of 65m, 4% above latest valuation Acquisition of retail space adjacent to Dolphin shopping centre in Poole, UK for 12.7m 2
3 Business environment GDP outlook largely unchanged. Continuing Euro-crisis and US debt dominating financial markets. Slide of dollar is leveling off. Euro zone inflation appears to stabilize Consumer trust still volatile, spending growth remains limited in most countries Investment markets: volumes decreasing, breaking the trend. Appetite still focused on prime, distressed assets for sale slowly increasing Letting markets: retail demand focused on prime and dominant locations, vacancy moving up in fringes. Polarization in rental growth increasing. Office take up pausing in general; rental levels as well 3
4 H key figures Direct result p/s: 2.51 (-1.2% yoy) Total result p/s: 2.26 Revaluation portfolio: -0.2% NAV p/s: (-6.1% yoy) Investment portfolio: 2,733m (-1% yoy) Development pipeline ± 456m Occupancy 90.2% (EPRA) LTV 40% 4
5 Total result ( m) H H yoy Direct result % Indirect result Profit Minority interest % Profit for shareholders
6 Direct result ( m) H H yoy Gross rental income % Operational costs % Net rental income % General costs % Other % Net financial costs % Taxes % Direct result % Minority interest % Direct Result Shareholders % 6
7 NRI bridge ( m) % - 3.8% 1.1% - 1.3% NRI H Acquisitions Disposals Like for like Currencies NRI H
8 Net rental income ( m) H % total yoy l-f-l Total % 5.5% 1.1% Belgium % -1.7% -4.6% Finland % 0.9% 0.9% France % 77.4% 77.4% The Netherlands % 20.1% 0.9% Spain % -21.0% -21.0% United Kingdom % 19.5% 6.9%* U.S.A % -12.3% -5.5%* * in local currency 8

9 9 Opening T-Mobile store in Kronenburg, Arnhem, July 2011
10 Occupancy (EPRA) Retail Office Other Total Total June 2011 Dec 2010 Belgium 99.6% 73.4% % 87.4% Finland 98.3% - 100% 98.4% 98.0% France 89.0% 99.1% % 97.9% The Netherlands 97.8% 98.1% 89.3% 96.9% 98.2% Spain 54.8% 87.1% 100% 79.2% 85.7% United Kingdom 98.1% 92.2% 100% 95.1% 91.9% U.S.A. 75.3% 80.8% 95.0% 81.9% 85.9% Total June % 83.7% 94.4% 90.2% 91.4% Total Dec % 87.0% 95.5% 91.4% 10
11 Lease expiry (rent as % of contracted rent in June 2011) 20% 18% 16% 1% 1% 14% 12% 10% 8% 6% 4% 2% 0% 0.4% 11% 8% 1% 0.1% 0.3% 6% 9% 0.2% 1% 3% 0.3% 4% 10% 0.2% 3% 8% 6% 6% 1% 4% 0.1% 5% 2% 3% 3% 1% 1% 1% 1% >2020 Offices Retail Other Leases without end date and residentials USA are excluded (7.2 % of total) 11
12 Indirect result
13 Indirect result ( m) H H Revaluation Results on sales Deferred tax Net financial costs Other Indirect result Minority interest Shareholders
14 Yield movements & cap rates H Retail Office Other Resi Cap rate Belgium 0.0% 0.0% % Finland 0.0% -0.2% % France 0.0% 0.0% % The Netherlands 0.0% 0.0% -0.3% 0.0% 6.1% Spain 0.0% -0.3% -0.3% - 7.0% United Kingdom -0.3% -0.1% 0.0% - 6.8% U.S.A. 0.0% -0.1% - 0.0% 6.7% Cap rate 6.0% 6.6% 7.5% 7.5% 6.4% Cap rate movement total portfolio -9 bps in H (-8 bps in Q2) Cap rate = net market rent divided by gross market value including transaction costs 14
15 Balance sheet & Debt profile
16 Sound balance sheet ( m) June Total assets 3, , ,597.0 Interest bearing debt long -1, Interest bearing debt short Deferred tax liabilities Other liabilities Equity 1, , ,686.5 NAV per share (IFRS) NAV per share (EPRA) NNNAV per share (EPRA)
17 Debt: conservative ratio s at low cost Interest bearing debt: 1,173m (2010: 1,174m)* Fixed/floating: 48%/52% (Dec 10: 57%/43%) Average cost: 3.0%* (Dec 10: 2.6%) LTV: 40% (Dec 2010: 39%) ICR: 5.6x (Dec 2010: 6.8x) * On nominal basis. On IFRS basis: 3.4% (Dec 2010: 3.2%) 17
18 Debt profile June 2011 Type of debt total 1,173m* mortgages 3% US PP 17% Maturity profile bank loans (unsecured) 40% convertible bond % convertible bond % debt undrawn * on nominal basis 18
19 Future: 2011/2012 Office portfolio: continued focus on improving occupancy rate Retail portfolio: focus on l-f-l rental growth and refurbishment- /extensionplans Further acquisitions of UK shopping centres and offices in Paris & Madrid Continuation of active sales program non-strategic assets across portfolio Development pipeline potential gradually unlocked, starting with Eilan in Q Q and Nivelles in Q Forecast direct result per share FY 2011 between , enabling dividend to be maintained at
20 Development pipeline
21 Development pipeline overview Project Location Total investment San Antonio I* Texas, US $ 200m/ 140m** Capex sofar Expected net yield Estimated completion 91m**** % Q Q Remarks Heads of terms signed for hotel lease Nivelles I Belgium 44m** 20m**** % % pre-let/heads of terms Tournai I Belgium 23m 0m % 2012 Building permit request to be submitted in Q Tournai II Belgium 15m 0m % 2013 In planning phase Waterloo Belgium 60m 19m*** % 2014 In planning phase Genk Belgium 45m 2m % 2013 In planning phase Joinville-le-Pont France 67m** 3m % 2013 Turnkey, WH takes letting risk Leiderdorp Neth. 35m 1m % In planning phase Richmond UK 27m** 8m*** % % pre-let Total ± 456m ± 171m * Excluding offices completed in 2010 ** Committed *** including value of current investment **** excluding land costs other phases 21
22 San Antonio, progress report Number or Completion Market rent Comments m2 USD Offices 19, Q per sqf, net Hotel 165 rooms 2011 Q4 100 net Rev.PAR 2,000 sqm let Heads of terms signed, 20 yr fixed lease, operator targets Le Méridien franchise (Starwood) Retail/leisure 3, Q per sqf, net Apartments Q Q1 Amenities 2011 Q Q1 1.- per sqf net Marketing started Fitness, trolley, covered parking (800 cars) 22

23 23

24 24

25 25

26 26
27 Appendix
28 Financial cost ( m) H H yoy direct indirect direct indirect direct indirect Interest expenses % Amortised costs of loans % Non-cash option expense convertible bonds % Other non-cash costs % Interest income % Capitalized interest % Net Financial Costs % 28
29 EPRA lease data Average lease length Contract rent expiring in: to break to expiry Year 1 Year 2 Year 3-5 (yr) (x 1,000) Belgium ,013 12,782 Finland ,894 6,631 11,653 France ,982 The Netherlands ,145 6,183 20,191 Spain ,495 3,016 4,111 United Kingdom ,080 10,496 U.S.A ,595 5,874 16,746 Total ,834 33,107 77,962 29
30 Interest rate & currency sensitivity June 2011 Floating rate loans 52% of debt (FY10: 43%) Average interest: 3.0%* (Dec 10: 2.6%) 0.5% change in interest rates EPS change: 0.14 (or 2.8% of DR) * On nominal basis. On IFRS basis: 3.4% (Dec 2010: 3.2%) Hedge on investments (end of period) - USD 45% (Dec 10: 45%) - GBP 63% (Dec 10: 72%) A change of 10% on period-end exchange rates has an impact of 2.56 (or 3.6%) on the NAV p/s On earnings: a change of 10% of average exchange rates (USD+GBP) has an impact of 0.18 (or 3.7%) on DIR p/s 30
31 Investor relations: Charles Bloema/Jaap-Jan Fit tel: +31(0)
Investor presentation Q results
 Investor presentation Q1 2011 results Recent highlights Successful issue of US$ 300m senior notes (US private placement) Sale non-strategic assets in UK of 15.1m, 7% above latest valuation Sale of a further
Investor presentation 9M 2012 results
 Investor presentation 9M 2012 results Key results: stabilising in Q3 Direct result p/s: 3.05 (-17.6% yoy) Q3: + 0.01 vs Q2 Revaluation portfolio: -4.75% Q3: -0.25% NAV p/s: 63.72 (-12.9% yoy) Q3: +0.4%
Amsterdam Schiphol 1 August Half-year results 2013
 Amsterdam Schiphol 1 August 2013 Half-year results 2013 Introduction CFO Pieter Roozenboom Age 41 Nationality Dutch 2010 2013 CEO Merin (former Uni-Invest Holding) a.o. restructuring CMBS, equity and syndicated
Amsterdam Schiphol 25 July Half-year results 2014
 Amsterdam Schiphol 25 July 2014 Half-year results 2014 Highlights Financial performance H1 2014 H1 2013 Direct result per share 1.73 1.76 Indirect result per share (1.50) (1.15) EPRA NAV per share 62.48
/ Investment portfolio 2.418,2 mln 2.646,0 mln Shareholders equity 3) 1.686,5 mln 1.
 1.686,5 mln 1.") Results 2009 Key items Direct result per share stable at 4.93 (2008: 4.92) Property revaluation -9.1% (until Q3 2009: -8.3%) Net asset value 73.77 per share (2008: 83.74) Solvency stable at 70% (2008:
Results 2009 Key items Direct result per share stable at 4.93 (2008: 4.92) Property revaluation -9.1% (until Q3 2009: -8.3%) Net asset value 73.77 per share (2008: 83.74) Solvency stable at 70% (2008:
Amsterdam 11 February Strategy update and full year 2012 results
 Amsterdam 11 February 2013 Strategy update and full year 2012 results Main topics 2012 H1 2012 Downward valuation of 173.8m Dividend cut to 3.20-3.40 Q3 2012 Stabilisation and restructuring Sale US Announced
2017 HALF YEAR 25 JULY 2017
 2017 HALF YEAR RESULTS 25 JULY 2017 Strong financial results and robust balance sheet Driving performance through operational excellence and disciplined capital allocation High quality pipeline of growth
2018 HALF YEAR 26 JULY 2018
 2018 HALF YEAR RESULTS 26 JULY 2018 H1 2018 Another period of delivery Strong financial results and capital structure Disciplined capital allocation improving portfolio scale and quality, reducing risk
Update third quarter 2013
 Update third quarter 2013 Schiphol, October 31, 2013 Summary Wereldhave is well on track in achieving its strategic objectives 2013-2015: Like-for-like rental growth of the core retail portfolio for 2013
AUDIOCAST PRESENTATION Q3/2017
 19.10.2017 AUDIOCAST PRESENTATION Q3/2017 Q3/2017: GOOD OPERATIONAL RESULTS IN SWEDEN AND NORWAY HIGHLIGHTS Q3/2017 4.7% INCREASE IN EPRA EPS TO EUR 0.133 - Overall net rental income growth and lower administrative
Strategy update Vastned: Focus on growth in selected European cities
 Strategy update Vastned: Focus on growth in selected European cities Divestment of the Turkish portfolio and announcement of share buy-back Strategy update: Focus on growth in selected European cities
The Office Property Handbook 4.0 Investment & Financing Keys Spain 2019
 The Office Property Handbook 4.0 Investment & Financing Keys Spain 2019 February 2019 Financial Advisory I Real Estate 1 of 19 The spanish economy keeps growing and remains stable but a lower pace than
Interim Results Half Year July 2018
 Interim Results Half Year 2018 July 2018 NSI will be the leading specialist in the Dutch office market, with a strong and efficient platform that will drive returns through pro-active asset management,
Trading update Q Wereldhave N.V.
 0 Trading update Q3 2018 Wereldhave 19 October 2018 N.V. Executing on the strategic agenda by disposal of Itis in Finland Occupancy increases in all countries to 96.2% overall Footfall increases 2.1% above
Results HALF-YEAR. Presentation of 30 August 2011
 Results HALF-YEAR 2011 Presentation of 30 August 2011 1 Summary Affine Group Property portfolio Development of group companies Analysis of 1H11 accounts A robust financial model Affine on the stock market
Dutch Property Tour April 15, 2014
 Dutch Property Tour April 5, 204 Today s schedule Introduction, Wereldhave Schiphol Ronald van der Mark, CEO Action Dirk Anbeek, CEO Wereldhave Belinde Bakker, Managing Director NL De Eggert, Purmerend
Schiphol, 21 July 2016 HALF-YEAR RESULTS 2016
 Schiphol, 21 July 2016 HALF-YEAR RESULTS 2016 Financial performance & Operations OPERATIONS H1 2016 H1 2015 Direct result per share 1.77 1.62 Indirect result per share (1.68) 0.64 EPRA NAV per share 50.53
Q1 Q4 Q1 Q4. Full Year Results. Audiocast presentation. CEO Marcel Kokkeel CFO, Exec. VP Eero Sihvonen
 Full Year Results Audiocast presentation CEO Marcel Kokkeel CFO, Exec. VP Eero Sihvonen 2 : A YEAR OF ACTION WITH SOLID PERFORMANCE AND A MUCH STRONGER BALANCE SHEET : A year of action EUR 200 million
Kempen conference. Amsterdam 30 May 2013
 Kempen conference Amsterdam 30 May 2013 Company snapshot Description Dutch REIT: NSI is a real estate asset management company and qualifies as fiscal investment institution under Dutch law (REIT) Full
Hansteen. Full Year Results to 31 December Tilburg, Netherlands
 Hansteen Full Year Results to 31 December 2016 Tilburg, Netherlands Contents Introduction Hansteen 2016 results Sale announcement Sale of German and Dutch Portfolio 2016 Annual Results 2016 Property Performance
2011 first-half earnings
 2011 first-half earnings Bernard Michel Non-executive chairman Christophe Clamageran Chief executive officer Gilles Bonnier Chief financial officer Paris, July 27, 2011 H1 2011 snapshot in mn June 30,
2015 Annual Results. March 9, la foncière parisienne
 2015 Annual Results March 9, 2016 Content I. Introduction II. Portfolio III. Rental business IV. Financial results V. Outlook 2 2015: key figures EPRA liquidation NAV Rental income Parisian Tertiary Revalued
CEO, MARCEL KOKKEEL CFO, EXEC. VP EERO SIHVONEN AUDIOCAST PRESENTATION Q1/2016
 CEO, MARCEL KOKKEEL CFO, EXEC. VP EERO SIHVONEN AUDIOCAST PRESENTATION Q1/2016 SOLID QUARTERLY RESULTS SUPPORTED BY GOOD PERFORMANCE IN NORWAY HIGHLIGHTS Q1/2016 SOLID FINANCIAL RESULTS SUPPORTED BY GOOD
Hansteen. Half Year Results to 30 June Castrop-Rauxel, Germany
 Hansteen Half Year Results to 30 June 2016 Castrop-Rauxel, Germany Introduction Hansteen - Pan European Real Estate Investment Trust (REIT) Pan European REIT Five countries Regional teams in 15 offices
Interim Report 1 Jan 30 Jun August 2008 Kari Inkinen, President and CEO Robert Öhman, CFO
 Interim Report 1 Jan 30 Jun 2008 7 August 2008 Kari Inkinen, President and CEO Robert Öhman, CFO Financial review Market overview Operational review Business areas Appendix 2 Financial review Market overview
January December 2011 Results
 January December 2011 Results 27 February 2012 Highlights 2011 ASSETS VALUATION As of December 2011, the total asset valuation (GAV) amounted to 4,286 million euro (-4.3% below Dec. 2010), based on market
2008 RESULTS. Radisson Ambassador Hotel Paris Opéra
 2008 RESULTS Radisson Ambassador Hotel Paris Opéra 11 FEBRUARY 2009 BRUSSELS Kurt Ritter, President & CEO Knut Kleiven, Deputy President & CFO Puneet Chhatwal, Chief Development Officer 1 Dec-08 Apr-08
Q HIGHLIGHTS MEUR MEUR % MEUR MEUR 48.4 MEUR 94.8 MEUR % 1.87% +2.2% +1.9 PP +3.5% +73.8% + >100% +19.9% +81.
 Q1-2 2018 HIGHLIGHTS STRENGTHENED OPERATING PERFORMANCE Occupancy rate 94.7% Rental income MEUR 119.0 Rental income lfl MEUR 98.2 +1.9 PP +3.5% +2.2% KPIs SIGNIFICANTLY IMPROVED Results of AM MEUR 94.8
2009 Half-Year Results. 3 August 2009
 2009 Half-Year Results 3 August 2009 John Nelson, Chairman 2 Agenda Introduction John Richards Financial Results Simon Melliss France Christophe Clamageran UK David Atkins Summary and Conclusion John Richards
9M 2018 RESULTS 09 NOVEMBER 2018 TLG IMMOBILIEN AG 9M 2018 RESULTS
 TLG IMMOBILIEN AG 9M 208 RESULTS DISCLAIMER This presentation includes statements, estimates, opinions and projections with respect to anticipated future performance of TLG IMMOBILIEN ("Forward-Looking
Results 2018 Wereldhave
 February 8, 2019 Results 2018 Wereldhave Direct result: 146.7m (2017: 150.1m), or 3.33 per share (2017: 3.43) Indirect result: - 202.3m (2017: - 65.8m) Total result: -55.6m (2017: 84.3m) Occupancy rate
H Results July H Results - Lar España Real Estate. July 27 th,
 H1 2018 www.larespana.com Results July 2018 July 27 th, 2018 Agenda 01 02 03 04 05 H1 2018 Highlights Corporate Activity H1 2018 Financial Results Business Performance Closing Remarks 01 H1 2018 Highlights
ANNUAL RESULTS FOR THE YEAR ENDED 31 AUGUST Presentation overview
 ANNUAL RESULTS Presentation overview Rebosis highlights Sisa Ngebulana New Frontier results Mike Riley Ascension results Kameel Keshav Rebosis results Sisa Ngebulana 02 1 Key Rebosis Highlights Distribution
VASTNED RETAIL REALISES LOWER DIRECT INVESTMENT RESULT, BUT PROPERTY VALUES UP FOR SECOND CONSECUTIVE QUARTER
 Interim report VASTNED RETAIL REALISES LOWER DIRECT INVESTMENT RESULT, BUT PROPERTY VALUES UP FOR SECOND CONSECUTIVE QUARTER Reinier van Gerrevink, CEO VastNed Retail: Lease negotiations provide us with
Corporate. Presentation September 2017
 Corporate www.larespana.com Presentation September 2017 Snapshot 2 First IPO of a Spanish REIT listed on the Spanish Stock Exchange Shareholder Structure Focused on creating both sustainable income and
Vastned results in line with expectations
 HALF YEAR REPORT 2 AUGUST 2016 2016 HALF-YEAR RESULTS Vastned results in line with expectations Highlights HY1 2016: - Vastned attracts strong and distinctive retailers for several premium city high street
2017 Annual Results. 12 March la foncière parisienne
 2017 Annual Results 12 March 2018 Content I. Introduction II. Portfolio III. Rental business IV. Financial results V. Outlook 2 2017 key figures EPRA liquidation NAV Rental income strategic assets (Offices
2012 first-half earnings
 2012 first-half earnings Bernard Michel Chairman and CEO Gilles Bonnier Chief financial officer Paris, July 24, 2012 H1 2012 Contents 1. MARKET ENVIRONMENT 2. OPERATING ACHIEVEMENTS & TARGETS 3. FINANCIAL
INVESTOR PRESENTATION
 INVESTOR PRESENTATION Table of Contents Introduction to SEGRO 3 Market drivers 10 High quality development pipeline 15 Balance sheet and financing 21 Operating performance 26 Portfolio overview 30 APP
Autumn Presentation. la foncière parisienne
 Autumn 2017 Presentation I. Background II. Portfolio centered on Paris Central Business District III. Key aspects of TERREÏS Model IV. H1 2017 Results 2 TERREÏS at a glance Property investment company
Agenda. About IREIT Global. Key Highlights. Portfolio Summary. Economy & Real Estate Review. Looking Ahead. Appendix : Overview of Tikehau Capital
 4Q 2017 and FY 2017 Results Presentation 14 February 2018 Agenda About IREIT Global Key Highlights Portfolio Summary Economy & Real Estate Review Looking Ahead Appendix : Overview of Tikehau Capital 2
CITYCON CAPITAL MARKETS DAY 16 MAY 2017, ISO OMENA CFO, EERO SIHVONEN
 STRONG FINANCING FUNDAMENTALS CITYCON CAPITAL MARKETS DAY 16 MAY 2017, ISO OMENA CFO, EERO SIHVONEN MAIN FINANCING TARGETS Loan to Value 40-45% 47.1% Average maturity of loan portfolio > 5 yrs 5.2 Debt
Operational activities
 Interim statement of the Statutory Management Company 31 March 2017 Rental income for the first quarter 2017: 12.9 mln Value real estate portfolio, including development projects: 818.7 mln Construction
The financial information included in this release is based on the Westfield Corporation s IFRS financial statements. Non IFRS financial information
 The financial information included in this release is based on the Westfield Corporation s IFRS financial statements. Non IFRS financial information has not been audited or reviewed. This release contains
STEADY STRATEGY ROLLOUT
 Press release STEADY STRATEGY ROLLOUT Negative value movements mostly due to Spanish portfolio Key points 9M 2012 (in brackets: 9M 2011) Direct investment result 47.1 million ( 50.6 million) Values movements
Press release nine months results 2010 VASTNED RETAIL REALISES STABLE DIRECT INVESTMENT RESULT AND POSITIVE VALUE MOVEMENTS IN PROPERTY PORTFOLIO
 Press release nine months results VASTNED RETAIL REALISES STABLE DIRECT INVESTMENT RESULT AND POSITIVE VALUE MOVEMENTS IN PROPERTY PORTFOLIO Reinier van Gerrevink, CEO VastNed Retail: The letting market
Financial Results Q Kari Inkinen, President and CEO Erik Hjelt, CFO Pia Arrhenius, SVP, IR
 Financial Results Q2 2009 Kari Inkinen, President and CEO Erik Hjelt, CFO Pia Arrhenius, SVP, IR Introduction Market review Business overview Financial overview Appendix 2 Overview of reporting segments
2016 Annual Results. March 8, la foncière parisienne
 2016 Annual Results March 8, 2017 Content I. Introduction II. Portfolio III. Rental business IV. Financial results V. Outlook 2 2016: key figures EPRA liquidation NAV Rental income Parisian Tertiary Revalued
NSI PRELIMINARY FULL YEAR RESULTS 2018 PRELIMINARY RESULTS FULL YEAR 2018
 PRELIMINARY RESULTS FULL YEAR 2018 Execution of strategy fully on track - strongly positioned for multiple opportunities ahead Vacancy rate of 13.8% (down 4.6% versus year-end 2017) EPRA NAV of 39.75 per
PRESS RELEASE RESULTS FIRST HALF 2017
 PRESS RELEASE RESULTS FIRST HALF 2017 JULY 25, 2017 CONTINUED STRONG PERFORMANCE IN THE NETHERLANDS, STABLE IN BELGIUM, A RECOVERY IN FINLAND AND HEADWIND IN FRANCE (2016: 62.6m) FIRST HALF 2017 CONTINUED
PALACE CAPITAL PLC (PCA.L)
") COMPANY NOTE Acquisition 07 August 2017 CORPORATE Current price 370.0p Sector Code Listing SHARE PERFORMANCE (K) 300 250 200 150 100 50 Real Estate Investment 0 Jul-15 Oct-15 Jan-16 Apr-16 Jul-16 Oct-16
COMPANY NOTE Acquisition 07 August 2017 CORPORATE Current price 370.0p Sector Code Listing SHARE PERFORMANCE (K) 300 250 200 150 100 50 Real Estate Investment 0 Jul-15 Oct-15 Jan-16 Apr-16 Jul-16 Oct-16
Quarterly Statement A S O F
 Quarterly Statement AS OF KEY FACTS Q3 / 2017 T 1 Key facts RESULTS OF OPERATIONS Q3 2017 Q3 2016 + / % / bp 01.01. 01.01. 30.09.2016 Rental income million 134.7 131.9 2.1 398.4 381.3 4.5 Net rental and
Half yearly financial statement 2014
 Half yearly financial statement 2014 Vilvoorde, 24 July 2014 Contents 1. Overall summary real estate markets 1 2. Interim report Key figures 3 Profit 3 Direct result 4 Indirect result 4 Shareholders equity
Citi-REITAS-SGX C-Suite Singapore REITs and Sponsors Forum
 Citi-REITAS-SGX C-Suite Singapore REITs and Sponsors Forum 23 August 2018 Important Notice This presentation shall be read in conjunction with OUE Commercial REIT s Financial Results announcement for 2Q
Half Year Results 2013
 Half Year Results 2013 1 Contents Overview Financials Portfolio Markets Summary Richard Tice Chief Executive Officer John Whiteley Chief Financial Officer 2 About CLS Top TSR performance since 2008 in
CPI PROPERTY GROUP first-time investment grade rating by Moody s, issuance of Eurobonds and initiation of large-scale refinancing operation
 Press Release Luxembourg, 27 November 2017 CPI PROPERTY GROUP first-time investment grade rating by Moody s, issuance of Eurobonds and initiation of large-scale refinancing operation Capital markets and
Webcast Presentation. Financial Results 2009
 Webcast Presentation Financial Results 2009 Strategy Citycon wants to be the leading shopping centre owner, operator and developer in the Nordic and Baltic countries. invests in shopping centres and retail
Half yearly financial statement 2015
 Half yearly financial statement 2015 Vilvoorde, 23 July 2015 Regulated information Embargo until 24/07/2014, 08:00 AM CONTENTS 1. Overall summary real estate markets 1 2. Interim financial report Key figures
Financial Results Year February 2013
 Financial Results Year 2012 1 February 2013 Agenda 1. Performance highlights and our priorities Kari Inkinen 2. Market Update Kari Inkinen 3. Financials Erik Hjelt 4. Business Update Kari Inkinen 2 Performance
MILLION (+1.0%) VALUE INCREASE VASTNED RETAIL PROPERTY PORTFOLIO IN Q1 2011; DIRECT INVESTMENT RESULT MARGINALLY DOWN
 VALUE INCREASE VASTNED RETAIL PROPERTY PORTFOLIO IN Q1 2011; DIRECT INVESTMENT RESULT MARGINALLY DOWN") Press release first quarter figures 2011 20 MILLION (+1.0%) VALUE INCREASE VASTNED RETAIL PROPERTY PORTFOLIO IN 2011; DIRECT INVESTMENT RESULT MARGINALLY DOWN Reinier van Gerrevink, VastNed Retail CEO:
Press release first quarter figures 2011 20 MILLION (+1.0%) VALUE INCREASE VASTNED RETAIL PROPERTY PORTFOLIO IN 2011; DIRECT INVESTMENT RESULT MARGINALLY DOWN Reinier van Gerrevink, VastNed Retail CEO:
European Investment Bulletin
 European Investment Bulletin Spring 2009 Prime yield decompression per sector (yoy) Rents in decline in line with business sentiment 200 CBD offices Warehouses Shopping Centres European average prime office
Income Statement + 2.2% + 7.2% + 3.9% + 14% EPS 142.1p 118.5p + 20% Dividend per share 36.0p 31.0p + 16% Full Price
 July 2013 Income Statement m July 2013 July 2012* Revenue 1,677 1,640 Operating profit 285 266 Interest (13) (15) Profit before tax 272 251 Taxation (55) (60) Profit after tax 217 191 + 2.2% + 7.2% + 14%
Preliminary Results Preliminary Results. for the year ended 31 December Allied Irish Banks, p.l.c.
 Preliminary Results 2005 Preliminary Results for the year ended 31 December 2005 Allied Irish Banks, p.l.c. Forward looking statements A number of statements we will be making in our presentation and in
ATRIUM COMPANY PRESENTATION
 ATRIUM COMPANY PRESENTATION THE LEADING OWNER & MANAGER OF CENTRAL EASTERN EUROPEAN SHOPPING CENTRES 1H2016 ATRIUM LEADING OWNER & MANAGER OF CEE SHOPPING CENTRES A UNIQUE INVESTMENT OPPORTUNITY Strong
Conference call presentation Q
 Conference call presentation Q1 2018 2018 Content 2 I. TAG highlights Q1 2018 II. TAG financials Q1 2018 III. TAG portfolio Q1 2018 IV. TAG outlook FY 2018 V. Appendix 3 5 12 16 19 Portfolio details, vacancy
MAS REAL ESTATE INC. Results presentation. New Waverley, Edinburgh, UK. Year ended 30 June 2016
 MAS REAL ESTATE INC Results presentation Year ended 30 June 2016 New Waverley, Edinburgh, UK 1 TABLE OF CONTENTS i. Company profile ii. iii. iv. Strategic update Recurring and potential EPS Highlights
Acceleration of Development Pipeline 3-months 2018 Rents. Milan, 12 April 2018
 Acceleration of Development Pipeline 3-months 2018 Rents Milan, 12 April 2018 3M 2018 CONFERENCE CALL SPEAKERS Alexei Dal Pastro General Manager Barbara Pivetta CFO 2 AGENDA > MARKET UPDATE PAGE 4 >3M
CPI PROPERTY GROUP reports financial information for the first quarter of 2018
 Press Release Luxembourg, 31th May 2018 CPI PROPERTY GROUP reports financial information for the first quarter of 2018 CPI PROPERTY GROUP (hereinafter CPIPG, the Company or together with its subsidiaries
HIGHLIGHTS PROPERTY FOR INDUSTRY 2018 INTERIM RESULTS BRIEFING
 HIGHLIGHTS Significant portfolio activity: 58,000 square metres or 8% of the portfolio leased during the interim period to 11 tenants for an average increase in term of 6.5 years Increased earnings and
Growth, performance and roll-out of the strategy
 Bezannes, 20 September 2018 8.00 am 2018 half-year results Growth, performance and roll-out of the strategy International development: acquisition of a prime asset in Spain Successful capital increase:
Next Generation Real Estate. HY 2008 Figures. Colonia Real Estate AG HY 2008 Figures 15 th of August 2008 Cologne
 Next Generation Real Estate HY 2008 Figures Colonia Real Estate AG HY 2008 Figures 15 th of August 2008 Cologne Focused and Integrated Business Model Colonia Real Estate AG Investments Management Principal
Investor Presentation for Tokyo Non-Deal Roadshow. 25 August 2016
 Investor Presentation for Tokyo Non-Deal Roadshow 25 August 2016 Important Notice This presentation shall be read in conjunction with OUE Commercial REIT s Financial Results announcement for 1Q 2016 dated
Tender Offer on Axiare. Barcelona 13/11/17
 Tender Offer on Axiare Barcelona 13/11/17 Disclaimer By accepting this presentation and/or by attending this presentation, you will be taken to have represented, warranted and undertaken that you have
Financial Results Q August 2012
 Financial Results Q2 2012 3 August 2012 Agenda 1. Performance highlights and our priorities Kari Inkinen 2. Market Update Kari Inkinen 3. Financials Erik Hjelt 4. Business Update Kari Inkinen 2 1. Performance
Kempen European Property Seminar 30 May 2012 in Amsterdam
 Kempen European Property Seminar 30 May 2012 in Amsterdam Profile Top 3 listed Dutch mixed real estate fund Dutch REIT / Listed on Amsterdam Euronext (Midkap AMx) Portfolio: 2.29bn TRI: 203m Outstanding
P R E S E N T A T I O N H1/ A U G U S T
 P R E S E N T A T I O N H1/2014 0 5 A U G U S T 2 0 1 4 D I S CLAIMER The statements contained herein may include statements of future expectations and other forward-looking statements that are based on
FY2017 Annual General Meeting 19 April 2018
 FY2017 Annual General Meeting 19 April 2018 Agenda Key Highlights About Tikehau Capital European Market Review Portfolio Overview Financial Highlights Conclusion 2 Key Highlights FY2017 Key Highlights
June 30, Bank Degroof 11/09/2009
 Full Year Results June 30, 2009 Bank Degroof 11/09/2009 Table of contents Achievements Portfolio analysis Financial review Shares and shareholders Outlook Conclusion 2 Growth strategy in Belgium Unfurnished
PRESS RELEASE RESULTS FIRST HALF 2016
 PRESS RELEASE RESULTS FIRST HALF 2016 JULY 21, 2016 STRONG LEASING PERFORMANCE: LIKE-FOR-LIKE RENTAL GROWTH AT 1.0%, AND FAST RECOVERING AND IMPROVING OCCUPANCY DESPITE A RETAIL MARKET HIT BY BANKRUPTCIES
FINANCIAL RESULTS Q3 2018
 FINANCIAL RESULTS Q3 2018 November 14, 2018 OVERVIEW & INVESTMENT HIGHLIGHTS Chapter 01 Kapitel Titel ADO THE PURE PLAY BERLIN RESIDENTIAL SPECIALIST Investment highlights 1 Berlin residential pure play
FIRST- HALF 2017 EARNINGS
 FIRST- HALF 2017 EARNINGS KLÉPIERRE, RETAIL ONLY JULY 26, 2017 DISCLAIMER FIRST- HALF 2017 EARNINGS JULY 26, 2017 This document was prepared by Klépierre solely for use of presenting the Klépierre 2017
Registered office: Old Bank Chambers, La Grande Rue, St Martin s, Guernsey, GY4 6RT
 19 August 2016 ALPHA REAL TRUST LIMITED ( ART OR THE COMPANY ) TRADING UPDATE AND DIVIDEND ANNOUNCEMENT ART today publishes its trading update for the period ended 30 June 2016 and the period up until
Image. Analyst Meeting 21/07/2015 1
 Image Analyst Meeting 21/07/2015 1 Contents Building a Solid Track Record Page 3 Case studies Page 14 Portfolio Page 20 Finance Page 24 Conclusion Page 33 2 Building a Solid Track Record 21 July 2015 3
https://rnssubmit.com/cws/fckeditor/editor/fckeditor.html?instancename=ctl00_pag...
 Page 1 of 7 Real Estate Investors PLC ("REI" or the "Company" or the "Group") Half Year Results for the six months to 30 June 2013 Real Estate Investors PLC (AIM:RLE) the West Midlands based property group,
C e g e r e a l F i r s t h a l f r e s u l t s. First half 2013: Rental income up 19% to 21.7 million
 Press release Paris, July 25, 2013 8.00am Regulated Information C e g e r e a l F i r s t h a l f r e s u l t s First half 2013: Rental income up 19% to 21.7 million Key indicators: Turnover: 27 million
2013 RESULTS INVESTORS PRESENTATION. 20 March 2014
 2013 RESULTS INVESTORS PRESENTATION 20 March 2014 AGENDA 1. 2013 highlights 3 2. Strategy 7 3. Market overview 9 4. Portfolio overview 12 5. Key financial results 17 6. Additional materials 29 2 2013 HIGHLIGHTS
Strong full-year result with PBT of EUR 204 mn - Increase of pay-out ratio for Annual Press Briefing 7 March 2018
 Strong full-year result with PBT of EUR 204 mn - Increase of pay-out ratio for -2019 Annual Press Briefing 7 March 2018 Andreas Arndt CEO/CFO Deutsche Pfandbriefbank AG Strong full-year result with PBT
Press release. Annual figures 2008
 Press release Annual figures 2008 VASTNED RETAIL: DIRECT INVESTMENT RESULT 2008 3.71 PER SHARE ( 3.85 BEFORE ONE-OFF COSTS); PROPERTY VALUE DECREASES RESULT IN NEGATIVE INDIRECT INVESTMENT RESULT OF 6.82
Beni Stabili Siiq: Board approves results for H1 2011
 Beni Stabili Siiq: Board approves results for H1 2011 Key Performance Indicators at 30 June 2011 Group net profit of 37.6m up 17% on 32.0m on H1 2010 Group recurring cash result 1 of 44.4m up on 23.8m
Interim Results Interim Results. for the half-year ended 30 June Allied Irish Banks, p.l.c.
 Interim Results 2006 Interim Results for the half-year ended 30 June 2006 Allied Irish Banks, p.l.c. 1 Forward looking statements A number of statements we will be making in our presentation and in the
CONTENT. 01 Highlights. 02 Portfolio Performance. 03 Optimisation of Financing Structure. 04 FY 2017 Results. 05 Outlook FY
 CONTENT 01 Highlights 02 Portfolio Performance 03 Optimisation of Financing Structure 04 FY 2017 Results 05 Outlook FY 2017 2 IMMOFINANZ RESTRUCTURING 5/2015 12/2017 Sale of logistics asset class - focus
INTERIM RESULTS to 30 June 2010 HANSTEEN HOLDINGS PLC
 INTERIM RESULTS to 30 June 2010 HANSTEEN HOLDINGS PLC Introduction FTSE 250, internally managed, management / shareholders truly aligned Portfolio 1.9 million sqm; 1,800 tenants, five countries Growing
Audiocast presentation
 Audiocast presentation / CEO, Marcel Kokkeel CFO, Exec. VP Eero Sihvonen 2 / CONSOLIDATION AS NORDIC LEADER Highlights / Stable financial performance Result supported by lower financing expenses Diverging
3Q 2017 and 9M 2017 Results Presentation 9 November 2017
 3Q 2017 and 9M 2017 Results Presentation 9 November 2017 Agenda About IREIT Global Key Results Highlights Portfolio Summary Economy & Real Estate Review Looking Ahead Appendix : Overview of Tikehau Capital
Interest Rates, Cap Rates, and the Real Estate Cycle
 Interest Rates, Cap Rates, and the Real Estate Cycle Stephen Hester, Chief Executive We are real estate investors and create value by actively managing, financing and developing prime commercial property
Half yearly financial statement 2013
 Half yearly financial statement 2013 Vilvoorde, 31 July 2013 Contents 1. Overall summary real estate markets 1 2. Interim report Key figures 3 Profit 4 Direct result 4 Indirect result 4 Shareholders equity
DUNA HOUSE GROUP Highlights. March 2018
 DUNA HOUSE GROUP 2017 Highlights March 2018 DISCLAIMER This presentation shall not be considered as an offer or an invitation to tender concerning the purchase, subscription or any other transaction of
Threats and opportunities in Dutch Office Investment Market
 9th April 213 Threats and opportunities in Dutch Office Investment Market Alphons Spaninks Local Head of Asset Management Benelux & Nordics Real Estate Investment Seminar 213 Dutch Real Estate: Office
Schroder European Real Estate Investment Trust
 Schroder European Real Estate Investment Trust Interim results presentation Tony Smedley, Head of Continental European Real Estate Investment Andrew MacDonald, Head of Real Estate Finance 25 May 2017 Jeff
For personal use only
 29 August 203 The Manager Company Announcements Office ASX Limited Level 4, Exchange Centre 20 Bridge Street SYDNEY NSW 2000 Westfield Group Level 30 85 Castlereagh Street Sydney NSW 2000 GPO Box 4004