R E V E N U E S OVERVIEW General Fund Revenues Modest Gains in Local Tax Revenues
|
|
|
- Victor Stafford
- 5 years ago
- Views:
Transcription
1 R E V E N U E S OVERVIEW Fiscal Year (FY) 2015 revenues reflect ongoing modest growth in the Northern Virginia economy. Arlington s proximity to the nation s capital, balanced economy, smart growth planning, and highlyeducated workforce help produce Arlington s slightly positive revenues during a time when many sectors of the national economy are stagnant. Northern Virginia s and Arlington s strong employment and solid real estate market is the foundation for steady incremental growth in the County s major revenue streams. In the aggregate, Arlington s calendar year (CY) 2014 real estate assessments are up 5.8 percent over CY 2013 levels, reflecting strength in the residential market and in apartments as well as new construction in commercial properties. Excluding new construction and apartments, CY 2014 commercial assessments were slightly positive (2.7 percent) over CY This growth was the result of slightly higher office rents, partially offset by a higher than normal office vacancy rate and decreasing hotel revenues. Apartment assessments grew 7.1 percent with 2.4 percent of that growth attributable to new construction; growth was driven by increasing rents and some reductions in vacancies. The residential property assessment base increased 6.1 percent in the aggregate. Detached home and townhome assessments gained 6.2 percent, while condominiums saw slightly less growth (5.9 percent). The average single family home value in Arlington continued to increase gaining 5.3 percent in 2014 increasing from $524,700 in CY 2013 to $552,700 in CY Meanwhile, other revenue streams are experiencing a variety of changes. Local taxes other than real estate are expected to grow 0.7 percent in the aggregate. Local fees, interest, fines, and service charges are anticipated to remain relatively level increasing only 2.5 percent in the aggregate. Revenue from the Commonwealth grows by six percent in, driven primarily by increasing highway aid as well additional human services grants and the appropriation of commuter assistance funding that is normally appropriated after budget adoption. Funds from the federal government are increasing almost five percent primarily due to new grants. General Fund Revenues Excluding fund balance, General Fund revenues for are forecast to be $1,108,457,740, an increase of four percent over the adopted budget levels. This change reflects the increase in the assessment base, the decrease in the real estate tax rate of $0.010 per $100 of value, and almost one percent growth in all other tax revenue combined. Total General Fund revenues including fund balance total $1,147,707,211. Modest Gains in Local Tax Revenues For the adopted budget, General Fund tax revenues are forecast to increase by four percent. This gain is driven by overall real estate assessment increases of 5.8 percent, partially offset by the $0.010 decrease in the real estate tax rate. Other taxes combined are forecast to increase 0.7 percent in. Personal property tax (including business tangible tax) is expected to increase two percent overall. This tax stream is mostly increasing in the personal vehicle segment (up five percent) because of continued gains in new vehicle sales and used vehicles holding their value. Business tangible tax receipts are
2 decreasing almost five percent in. Sales tax is down slightly (two percent) reflecting actual revenues in and slightly slower growth trends in retail sales in. Meals tax (up six percent) is set to realize solid gains over. Business, Professional and Occupational License Tax (BPOL) is projected to experience a modest dip, reflecting the increasing competition in the metropolitan area to attract and maintain business. State and Federal Budget Adjustments revenue from the Commonwealth grows by six percent while federal government revenues increase five percent. The increase in Commonwealth revenue can be attributed to higher highway aid, bringing it in line with actuals and expected revenue. The County has also received additional human services grants. In addition, the appropriation of commuter assistance funding is typically appropriated at close-out; the award amount was announced early enough for next year to include it in the budget. Continued delays by the General Assembly to pass a State budget do create some uncertainty for State revenue. However, the County does not anticipate any significant changes in funding based on budgets that have been proposed; the adopted budget includes conservative estimates of State revenue. Additional funds from the federal government include a new Community Oriented Policing Services (COPS) grant from the U.S. Department of Justice as well as new grant funding from the Bureau of Justice Assistance for a Drug Court Coordinator. Real Estate Tax Rate Remains Among the Lowest in Northern Virginia The adopted budget reflects a CY 2014 real estate rate of $0.996 per $100 of assessed value, which includes the base rate of $0.983 and the county-wide sanitary district rate of $0.013 for stormwater management. Arlington will continue to have one of the lowest real estate tax rates in the Northern Virginia region, maintaining its history of providing excellent value. Because of assessment growth, the average homeowner will pay $227 more in real estate taxes in CY 2014 than in CY 2013, an increase of four percent. Revenue sharing with Arlington Public Schools (APS) The adopted transfer to APS is $432,232,221 million in ongoing local tax revenues a 4.7 percent increase over the adopted budget as well as $8,357,805 of one-time revenue. These funds are generated from a 45.9 percent share of ongoing local tax revenues. Comparison between Budgeted Revenues and Expenditures County budget information compares budgeted revenues and expenditures from the current fiscal year to the next fiscal year. Most of the growth calculations in this section, derived from historical trends and other data, are calculated against revised estimates for the current year. This is especially important for real estate revenue since the County s assessment of real estate occurs each January 1, or half way through the current fiscal year. The value of real estate, determined in the middle of a fiscal year, has a significant impact on the current fiscal year s revenue since the first payment is due in June, prior to the end of the current fiscal year, and drives the forecast for the subsequent fiscal year. Other tax revenues are revised in the current year if the tax receipts indicate higher or lower year-end projected revenues. This revenue surplus or deficit is typically not recognized in the budget until the mid-year or third quarter review of the current fiscal year is completed.
3 Fiscal Outlook Arlington continues to economically surpass much of the region and the nation. Arlington's unemployment rate remains the lowest in the Commonwealth. The County s per capita income remains among the highest in the state. Home prices continue on a positive trajectory, which help balance the commercial real estate sector s slower growth. Arlington is poised to begin with steady revenue streams, an overall positive real estate market, and low unemployment levels. Economic Indicators CY 2011 CY 2012 CY 2013 Consumer Price Index (national CPI-U average) 3.2% 2.1% 1.5% Employment Cost Index (private industry workers) 2.2% 1.8% 2.0% Unemployment US / Arlington (December) 8.9% / 3.6% 7.8% / 3.3% 6.7% / 3.1% Mortgage Rate (annual average 30 year fixed rate) 4.45% & 0.7 pts. 3.66% & 0.7 pts. 3.98% & 0.7 pts. Federal Fund Rate (annualized) 0.10% 0.14% 0.11% Retail Sales (based on 1% of Arlington tax revenue) $3.75 billion $3.91 billion $3.92 billion Office Vacancy Rate (including sublets) 10.7% 16.3% 17.9% Tourism Hotel Occupancy Rate 72% 73% 72% Tourism Average Hotel room rate $ $ $ Sources: Bureau of Labor Statistics, Freddie Mac, Federal Reserve, Smith Travel Research, Costar TAX COMPETITIVENESS Arlington County continues to have a tax structure that is highly competitive with the region and with the nation. The real estate tax rate for calendar year (CY) 2014, which includes a base rate of $0.983 plus a $0.013 stormwater tax, is one of the lowest in the Northern Virginia region. Charts comparing current (CY 2014) tax rates and tax bills for various Northern Virginia jurisdictions can be found later in this section. FINANCIAL STANDING Arlington is one of approximately 39 counties in the United States to be awarded a triple Aaa/AAA/AAA credit rating. In May 2014, the three primary rating agencies all reaffirmed the highest credit rating attainable for jurisdictions. Ratings issued by Fitch, Inc. (AAA), Moody s Investors Service (Aaa), and Standard & Poor s (AAA) validate that Arlington s financial position is outstanding, and it reflects the strong debt position, stable tax base, and sound financial position.
4 TAX RATES, USER CHARGES, AND PERMIT FEE CHANGES FOR The following changes for are reflected in total revenue amounts. General Fund In the General Fund, changes in revenue are reflected in the department narratives and the General Fund total revenues. The budget includes the following: The County Board decreased the base real estate tax rate by $0.010 from $0.993 to $0.983 per $100 of assessment value. In the Department of Environmental Service (DES), there is an increase to Arlington Transit (ART) Transportation System and Specialized Transportation for Arlington Residents (STAR) Zone 1 bus fares to help offset higher operating costs. In the DES, the planned increase in the household solid waste rate is $13.28 from $ to $ per year. However, this rate could change depending on the final mix of services implemented under the new contract, as the fee is charged per refuse unit and achieves the County s objective of 100 percent recovery of household refuse collection, disposal and recycling costs, leaf collection costs, and overtime costs associated with brush and metal collection. In the Department of Parks and Recreation, fee changes and new fees are expected to generate $107,723 in additional revenue in and reduce the County s tax support of DPR. New fees include activities and rentals offered for the first time in including new camp offerings, fees for plaza rental, and a fee for rental of the new Arlington Mill gymnasium as well as a new administrative enrollment deposit fee for camps and long-term programs. Fee changes are designed to more accurately reflect the actual cost of activities and create consistency including a standardization of non-resident surcharges, slight realignment of preschool fees, and changes in some rental fees. In the Police Department, accident report fees increase from $3 to $10 per request, criminal history checks from $5 to $10 per request, and police report verifications from $5 to $10 per request. These increases allow for full recovery of the costs associated with providing these services while remaining consistent with fees charged by neighboring jurisdictions. In the Department of Human Services, a new nursing case management will be assessed on a sliding scale in line with the Community Services Board (CSB) fee schedule. Under this fee scale, eighty-five percent of current Nursing Case Management clients will pay just $13 per month or less. In the Department of Community Planning, Housing, and Development (CPHD) and DES, the Zoning Fee Schedule is amended to include new and readjusted fees for development applications using the Columbia Pike Neighborhoods Special Revitalization District Form Based Code and the commercial centers Columbia Pike Special Revitalization District Form Based Code. The new fees are applicable to new applications using the Neighborhoods Form Based Code and façade plan review during both the permitting phase and administratively reviewed projects; fees for landscape plan review are increased for both the permitting phase and administratively reviewed projects; and all fees are clarified by listing all related fees together in the fee schedule for either use permit or administratively-reviewed applications.
5 Stormwater Fund Maintain the sanitary district tax for stormwater at $0.013 per $100 of assessed value to manage and improve the County s stormwater system. Utilities Fund The water/sewer rate increases $0.43 per thousand gallons to $13.04 per thousand gallons. This corresponds to an estimated annual increase of $30.10 per household annually, assuming 70,000 gallons of water consumption. Crystal City, Potomac Yard, Pentagon City Tax Increment Financing (TIF) Fund Fund the Crystal City, Potomac Yard, and Pentagon City TIF area using CY 2011 district assessments as the base year for valuation. Funding in is 33 percent of the incremental tax payment generated by the projected assessment tax base increase for properties in the defined Crystal City, Potomac Yard, and Pentagon City area. Total revenue for the TIF is projected to be $3,482,480. Columbia Pike Tax Increment Financing (TIF) Fund Fund the Columbia Pike TIF area, established by the County Board in December 2013, using CY 2014 district assessments as the base year for valuation. Funding in is 25 percent of the projected tax revenue generated from the incremental assessment growth forecast for CY 2015 (June 2015 payment) in the defined Columbia Pike area. Total revenue for the TIF is projected to be $119,950. Transportation Capital Fund (formerly the Transportation Investment Fund) Maintain the tax rate for Transportation Capital Fund at $0.125 for each $100 of real estate assessment value to fund major transportation infrastructure projects. This tax rate is in addition to the real estate tax rate and is assessed to commercially zoned properties in Arlington. Special Assessment District Funds The Ballston Business Improvement Service District CY 2014 tax rate remains $0.045 for each $100 of real estate assessment value, no change from the CY 2013 rate. This tax is imposed to fund additional services in the Ballston area. This service district tax rate is in addition to the real estate tax rate and is assessed to commercially zoned properties in the District. The Crystal City Business Improvement Service District CY 2014 tax rate remains at $0.043 for each $100 of real estate assessment value, no change from the CY 2013 rate. This tax is imposed to fund additional services in the downtown Crystal City area. This service district tax rate is in addition to the real estate tax rate. The Rosslyn Business Improvement Service District CY 2014 tax rate remains at $0.078 for each $100 of real estate assessment value, no change from CY 2013 rate. This tax is imposed to fund additional services in the downtown Rosslyn area. This service district tax rate is in addition to the real estate tax rate.
6 GENERAL FUND REVENUE SUMMARY The General Fund budget is financed by a variety of revenue sources, which include local taxes, service charges, fees, and state and federal revenue. General Fund revenues are projected to total $1.15 billion, an increase of $56.2 million (5.1 percent) over the adopted budget. Net of fund balance, General Fund revenues are projected to total $1,108,457,740, an increase of $42.8 million (4.0 percent). Local tax revenues are projected to total $941,271,377, an increase of $36.0 million (4.0 percent) over the adopted budget. Local taxes represent 85 percent of total General Fund revenue. Real estate assessments are up 5.8 percent over last year. The base real estate tax rate is reduced by $0.010 from $0.993 to $0.983 per $100 of assessment value. License, Permits, and Fee revenue are projected to total $10.5 million, a 0.7 percent increase over adopted budget levels. This increase is due to a slight increase in motor vehicle license fees and estimates of expected development and construction, which increase the use of the public right-of-way and highway permit revenues, as well as new and readjusted fees for development applications using the Columbia Pike Neighborhoods Special Revitalization District Form Based Code and the commercial centers Columbia Pike Special Revitalization District Form Based Code. Fines and parking tickets are estimated to generate $8.2 million, a 14.7 percent decrease, primarily due to declines in parking ticket revenue. Interest income is forecast at $1.5 million, no change from. Service charge revenue is projected to increase by $3.0 million or 6.0 percent. This is primarily due to increased reimbursements from the City of Falls Church for services, new and expanded Arlington Transit bus routes, increased fares for ART and STAR, and additional revenue generated by Department of Parks and Recreation programs. State revenue is estimated to total $69.1 million, a 6.5 percent increase from the adopted budget. This is primarily due to the increased highway aid and additional human services grants. Federal Government revenue is forecast to total $15.2 million, an increase of 5.0 percent. This is primarily driven by a new Community Oriented Policing Services (COPS) grant from the U.S. Department of Justice as well as new grant funding from the Bureau of Justice Assistance for a Drug Court Coordinator. Previous year fund balance carryover totals $39.2 million funded by a combination of additional revenue and/or expense savings identified from previous fiscal years. The pie chart on the next page illustrates the major sources of General Fund revenues.


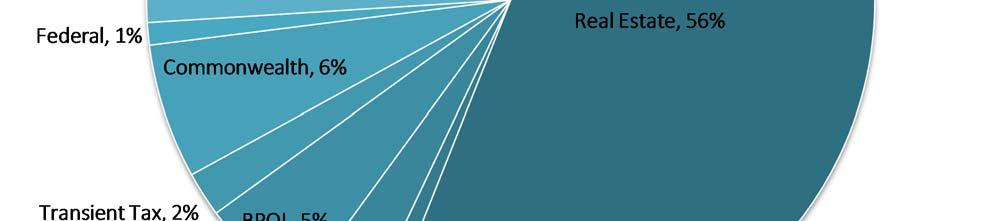

7 General Fund Revenues REVENUES


8 The pie chart below illustrates the local taxes that the County collects. As demonstrated by the chart, real estate and personal property taxes are the largest tax categories. Together, they account for 80 percent of local tax revenue. A description of the local taxes and a discussion of the revenue projections follow. Local Taxes
9 REAL ESTATE TAX Real estate taxes are the largest source of County revenues, generating $637.1 million or 56 percent of all revenues for the General Fund budget and 68 percent of all local tax revenues. Fiscal Year 2015 General Fund revenues reflect the real estate tax rate of $0.983 for each $100 of assessed real property value, a decrease of $0.010 from the CY 2013 rate. Arlington County prorates real estate taxes for the value increase on new construction, a policy adopted in FY Previously, a property owner paid real estate taxes based on the January 1 value of a structure. No additional tax was assessed if the building was completed during the course of the year. With proration, property owners pay a prorated share of the real estate tax increase during the calendar year, based on when the building is substantially completed. CY 2014 assessments showed solid performance with growth primarily fueled by strength in the residential market as well as new construction in commercial properties and strength in apartments. The value of real property in the County excluding Public Service Corporations (PSCs) increased 5.8 percent from CY 2013 to CY New construction added one percent to the tax base, while assessments of existing properties increased 4.7 percent overall. The combined value of commercial and apartment assessments increased 5.4 percent. Apartment buildings showed growth of 7.1 percent driven by increasing rents and some reductions in vacancies. Despite office vacancies and decreasing hotel revenues, commercial properties increased 4.4 percent primarily fueled by new construction which made up 1.7 percent of the increase as well as strength in general commercial properties and slightly higher office rents. Single-family residential assessments increased 6.1 percent in the aggregate. Including new construction, single-family houses (including townhomes) increased 6.2 percent, while condominium assessment totals increased by 5.9 percent in CY The average value of a single-family property increased by 5.3 percent: from $524,700 in CY 2013 to $552,700 in CY At the existing real estate tax rate of $0.996, which includes the 1.3 cent sanitary district stormwater tax, the average single-family residential tax bill will increase by about $227, or four percent, in CY CHANGE IN ASSESSED VALUE OF REAL ESTATE IN ARLINGTON COUNTY Calendar Year 2013 to Calendar Year 2014 (In millions, numbers may not add due to rounding) Single-Family Houses Condominium Apartment Commercial Total Percentage of CY 2013 Tax Base 36% 14% 19% 31% 100% CY 2013 Tax Base $22,886 $8,751 $11,725 $19,529 $62,891 Assessed Value Change $1,339 $516 $561 $533 $2,948 CY 2014 Tax Base (Excluding New Growth) $24,224 $9,266 $12,286 $20,062 $65,839 Percent Change 5.8% 5.9% 4.8% 2.7% 4.7% New Construction $85 - $275 $330 $691 Percent Change 0.4% 0.0% 2.3% 1.7% 1.1% CY 2014 With New Construction $24,310 $9,266 $12,561 $20,392 $66,530 Percent Change CY 2013 to CY % 5.9% 7.1% 4.4% 5.8%
10 Real Estate Tax Revenues & Assessment Base $700 $70 $600 $60 $500 $50 Millions (taxes) $400 $300 $200 $40 $30 $20 Billions (assessments) $100 $10 $0 FY 2011 FY 2012 $- Tax Revenues Assessments The following table shows the projected General Fund revenue generated by the real estate tax rate of $0.983 per $100 of assessed value (excluding the $0.013 rate for the stormwater fund) in. The real estate tax revenues account for $8.0 million in anticipated tax refunds and $1.0 million in penalty and interest revenue. The $644.1 million in real estate tax revenue is net of $4.9 million in tax relief for qualified elderly and disabled taxpayers, $0.4 million in tax relief for disabled veterans (state exemption effective January 1, 2011), $3.5 million set aside for the Crystal City Tax Increment Financing (TIF) fund, and $0.1 million set aside for the Columbia Pike TIF fund. Real Estate Taxes $603,766,303 $608,033,449 $644,059,230 6% Additions, Delinquent Penalty & Interest 974,940 1,000,000 1,000,000 - Tax Refunds (7,922,121) (6,000,000) (8,000,000) 33% Total $596,819,122 $603,033,449 $637,059,230 6%
11 REVISED - REAL ESTATE TAX REVENUES Percent Assessed Tax Tax Percent Total for Total for Description Change Value Rate* Levy Collected Tax Year Fiscal Year REAL ESTATE County Property, CY 2012 $61,672,361,900 Net Change in Assessments 2.0% 1,218,968,400 County Property as of April ,891,330,300 $0.993 $624,510, % $622,012,866 PSC Property in Tax Year 2012 $158,142,520 PSC Estimated Net Change in Assessments 0.0% 0 PSC Property in Tax Year 2013 $158,142,520 $0.993 $1,570, % $1,570,355 Total Taxable Base, Fall 2013 $63,049,472,820 $623,583,221 Taxes Due October 5, 2013 $311,791,610 Less Tax Relief for Elderly and Disabled (2,550,000) Less Tax Relief for Disabled Veterans (185,090) Less Tax Increment for Crytal City TIF (1,234,170) ESTIMATED REVENUE FOR FY FALL 2012 $307,822,350 County Property as of April 2013 $62,891,330,300 Net Change in Assessments 5.8% 3,638,611,300 County Property as of January 1, ,529,941,600 $0.983 $653,989, % $651,373,370 PSC Property in Tax Year 2014 (prior to Fall 2013 adjustment) $153,457,235 $0.983 $1,508, % $1,508,485 Total Taxable Base, Spring 2014 $66,683,398,835 $652,881,855 Taxes Due June 15, 2014 $326,440,927 Less Tax Relief for Elderly and Disabled (2,600,000) Less Tax Relief for Disabled Veterans (185,100) Less Tax Increment for Crystal City TIF (1,741,210) ESTIMATED REVENUE FOR - SPRING 2014 $321,914,617 TOTAL ESTIMATED ASSESSMENT TAX REVENUE FOR FISCAL YEAR 2014 $629,736,967 * The tax rate is per $100 of assessed value. * The tax rate excludes $0.013 stormwater tax, $0.125 commercial transportation tax, and tax rates for other special assessment districts.
12 ADOPTED - REAL ESTATE TAX REVENUES Percent Assessed Tax Tax Percent Total for Total for Description Change Value Rate* Levy Collected Tax Year Fiscal Year REAL ESTATE County Property as of CY 2013 Land Book $62,891,330,300 Net Change in Assessments 5.8% $3,638,611,300 County Property as of January 1, 2014 $66,529,941,600 $0.983 $653,989, % $651,373,370 PSC Property in Tax Year 2013 $153,457,235 PSC Estimated Net Change in Assessments 0.0% $0 PSC Property in Tax Year 2014 $153,457,235 $0.983 $1,508, % $1,508,480 Total Taxable Base, Fall 2014 $66,683,398,835 $652,881,850 Taxes Due October 5, 2014 $326,440,930 Less Tax Relief for Elderly and Disabled (2,400,000) Less Tax Relief for Disabled Veterans (185,100) Less Tax Increment for Crystal City TIF (1,741,240) ESTIMATED REVENUE FOR - FALL 2014 $322,114,590 County Property as of January 1, 2014 $66,529,941,600 Net Change in Assessments 0.0% $0 County Property as of January 1, 2015 $66,529,941,600 $0.983 $653,989, % $651,373,370 PSC Property in Tax Year 2015 (prior to Fall 2014 adjustment) $153,457,235 $0.983 $1,508, % $1,508,480 Total Taxable Base, Spring 2015 $66,683,398,835 $652,881,850 Taxes Due June 15, 2015 $326,440,930 Less Tax Relief for Elderly and Disabled (2,450,000) Less Tax Relief for Disabled Veterans (185,100) Less Tax Increment for Crystal City TIF (1,741,240) Less Tax Increment for Columbia Pike TIF (119,950) ESTIMATED REVENUE FOR - SPRING 2015 $321,944,640 TOTAL ESTIMATED ASSESSMENT TAX REVENUE FOR FISCAL YEAR 2015 $644,059,230 * The tax rate is per $100 of assessed value. * Tax rate excludes the $0.013 stormwater tax, $0.125 commercial transportation tax, and tax rates for other special assessment districts.
13 PERSONAL PROPERTY TAX This tax is levied on the tangible property of individuals and businesses. For individuals, personal property tax is primarily assessed on automobiles. For businesses, examples of tangible property include machines, furniture, computer equipment, fixtures, and tools. Personal property taxes are projected to generate 9.5 percent of the General Fund revenues in. It is anticipated that the County s personal property tax revenues will increase two percent in, from $106.5 million to $108.7 million. This increase reflects growth in motor vehicle property tax, partially offset by a slight decrease in business tangible property tax. motor vehicle personal property tax revenue is projected to increase five percent over adopted amounts primarily a result of new car sales and used cars continuing to hold their value and depreciate slowly. The County bases its vehicle assessments on the National Automobile Dealer s Association s (NADA) assessment figures from January. However, the precise value of the assessment base is not known until July when the Commissioner of Revenue completes its primary assessment of vehicles on the tax rolls. Meanwhile, business tangible tax assessments are expected to decrease five percent in. The personal property tax rate remains unchanged for. The personal property tax rate was last increased in CY 2006 from $4.40 to $5.00 per $100 of assessed valuation in order to fund public safety compensation enhancements. Personal Property and Business Tangible Assessments The assessed value of personal property in the County (excluding Public Service Corporations) for CY 2013 totaled approximately $2.1 billion. Fiscal Year 2015 personal property tax revenue is projected to increase approximately two percent over the adopted levels. Personal Property Tax Revenue $120.0 $100.0 $80.0 $60.0 $40.0 Business Tangible Vehicles $20.0 $- FY 2011 FY 2012
14 Vehicle Assessment Vehicles in Arlington County are assessed using the average loan value from the NADA Used Car Guide, whereas other neighboring jurisdictions (except for Loudoun County) use the average tradein value. Because the average loan value is 10 percent less than the average trade-in value, Arlington s effective personal property tax rate is 4.5 percent. This effective tax rate is among the lowest in the Northern Virginia region. If vehicles are in the County for only part of the year, the tax is prorated for the time the vehicle is located in Arlington. The CY 2014 estimated average assessed value (average loan value) of vehicles in the County is estimated to be approximately $9,284, up five percent from $8,842 last year. The table below shows the ten-year history for average assessed value, tax rate, and average total tax per vehicle. PERSONAL PROPERTY TAX PAID FOR AVERAGE CAR VALUE* Calendar Year Average Assessed Value Tax Rate Total Tax 2005 $7,154 $4.40 $ $7,652 $5.00 $ $7,635 $5.00 $ $7,905 $5.00 $ $7,218 $5.00 $ $7,264 $5.00 $ $7,735 $5.00 $ $8,421 $5.00 $ $8,842 $5.00 $ (projected) $9,284 $5.00 $464 *Does not reflect the State s rebates per the Personal Property Tax Relief Act (prior to CY 2006) or the State s fixed block grant distribution (after CY 2006). The tax rate is per $100 of assessed value. Personal Property Taxes $107,286,191 $107,600,000 $109,552,147 2% Penalty & Interest 1,719,326 1,500,000 1,700,000 13% Tax Refunds - Personal Property (2,048,304) (2,600,000) (2,600,000) - Total $106,957,213 $106,500,000 $108,652,147 2% In June 2004, the State General Assembly fundamentally changed the Personal Property Tax Relief Act (PPTRA) originally enacted in Beginning in CY 2006, Arlington is no longer reimbursed for 70 percent of vehicle taxes for automobiles assessed below $20,000. Rather, the State reimburses Arlington County a fixed amount ($31.3 million) annually as a fixed block grant for vehicle tax reductions.
15 The State requires localities to distribute the fixed block grant to qualifying vehicle value below $20,000. The State allows localities wide discretion in determining how the money should be spread among the qualifying vehicle value range. For CY 2014, the County will provide 100 percent tax relief for assessed vehicle value at or below $3,000. For assessed value between $3,001 and $20,000 for conventional vehicles, it is projected that the taxpayer will pay 73 percent of the tax liability, with the State block grant funds contributing the remaining 27 percent. However, the exact amount of the CY 2014 subsidy on the portion of conventional fuel value between $3,001 and $20,000 will not be known until July 2014, when the Commissioner of Revenue releases vehicle assessment data. Owners of cars that the Virginia Department of Motor Vehicles has designated as clean special fuel vehicles a designation that includes most hybrid vehicles will receive 50 percent tax relief on the portion of vehicle value between $3,000 and $20,000. It is estimated that the average clean fuel vehicle in the County will have an assessed value of roughly $13,850 in CY Thus, under the adopted tax relief formula, the owner of an average clean fuel vehicle would have a tax bill of $271. This CY 2014 bill is roughly $125 less than what the owner of a comparably priced conventional fuel vehicle would pay. Finally, vehicles equipped to transport disabled persons may qualify for additional tax relief. The adopted budget provides that the owners of qualifying vehicles will receive 50 percent tax relief on the portion of vehicle value between $3,000 and $20,000. It is estimated that there are less than 50 of this type of vehicle owned by individuals and registered in Arlington County. Because additional tax relief is being applied through PPTRA, it does not apply to commercially owned vehicles that have been modified to transport the disabled. With the relatively few vehicles anticipated to qualify for this enhanced tax relief, the impact to the average Arlington tax payer is negligible. If a qualifying, altered vehicle is valued at $14,000, then the vehicle owner is estimated to realize a reduction of $127 in their portion of the personal property tax bill compared to a similarly assessed conventional fuel vehicle. The tables on the following page illustrate the projected amount of tax that vehicle owners of conventional fuel vehicles, clean fuel vehicles, and vehicles modified to transport the disabled would be responsible for and the portion of the total tax paid by state grant monies in, based on preliminary estimates.
16 CY 2014 State Block Grant Distribution (Based on Current Projections) Conventional Vehicles Tax on first $3,000 of value paid by State at 100%. Tax on value from $3,001 - $20,000 paid by the State at 27%. Qualified Clean Fuel Vehicles and Qualified Vehicles to Transport the Disabled Tax on first $3,000 of value paid by State at 100%. Tax on value from $3,001 - $20,000 paid by the State at 50%. VEHICLE ASSESSMENT TOTAL TAX PORTION PAID BY STATE PORTION PAID BY TAXPAYER % OF TAX BILL PAID BY TAXPAYER PORTION PAID BY STATE PORTION PAID BY TAXPAYER % OF TAX BILL PAID BY TAXPAYER $1,000 $50 $50 $0 0% $50 $0 0% $2,000 $100 $100 $0 0% $100 $0 0% $3,000 $150 $150 $0 0% $150 $0 0% $4,000 $200 $164 $37 18% $175 $25 13% $5,000 $250 $177 $73 29% $200 $50 20% $6,000 $300 $191 $110 37% $225 $75 25% $7,000 $350 $204 $146 42% $250 $100 29% $8,000 $400 $218 $183 46% $275 $125 31% $9,000 $450 $231 $219 49% $300 $150 33% $10,000 $500 $245 $256 51% $325 $175 35% $11,000 $550 $258 $292 53% $350 $200 36% $12,000 $600 $272 $329 55% $375 $225 38% $13,000 $650 $285 $365 56% $400 $250 38% $14,000 $700 $299 $402 57% $425 $275 39% $15,000 $750 $312 $438 58% $450 $300 40% $16,000 $800 $326 $475 59% $475 $325 41% $17,000 $850 $339 $511 60% $500 $350 41% $18,000 $900 $353 $548 61% $525 $375 42% $19,000 $950 $366 $584 61% $550 $400 42% $20,000 $1,000 $380 $621 62% $575 $425 43% $21,000 $1,050 $380 $671 64% $575 $475 45%
17 BUSINESS, PROFESSIONAL, AND OCCUPATIONAL LICENSE (BPOL) TAX (State Code Section , et al / County Code Section thru 11-84) These taxes are levied on entities doing business in the County and are in the form of fixed fees or a percentage of gross receipts. For the first year of business, a firm is required to obtain a business license within 75 days of operation. The business license tax is based on the previous year's gross receipts (except in the case of new businesses, which must estimate their receipts until they have been in business a full calendar year). All licenses that are paid based on estimates are subject to adjustment when the actual receipts are known. Effective in 2001, the due date for filing and renewal of business licenses changed from January 31 to March 1. A comparison of selected BPOL rates for Arlington and neighboring jurisdictions can be found at the end of this section. For the budget, BPOL revenues are anticipated to decrease two percent reflecting current and expected office vacancies. BPOL Taxes $63,435,966 $63,000,000 $62,000,000-2% Penalty & Interest 302, , ,000 - Tax Refunds - BPOL (2,397,171) (3,000,000) (3,000,000) - Total $61,341,154 $60,520,000 $59,520,000-2% Business, Professional, and Occupational License Tax $65.0 $60.0 $60.5 $61.9 $61.3 $60.5 $59.5 $55.0 $ Millions $50.0 $45.0 $40.0 $35.0 FY 2011 FY 2012
18 LOCAL SALES TAX (State Code Section & 606 / County Code Section 27-6) In Arlington, the total non-food sales tax is currently six percent, of which one percent is a local option tax that is returned to localities by the Commonwealth and supports General Fund expenditures. The sales tax rate on food is currently 2.5 percent, of which one percent is remitted to localities. Food items are defined under the Food Stamp Act of 1977 (7 U.S.C. 2012) to be food for home consumption by humans. This classification includes most grocery food items and cold prepared foods. Excluded from the definition of food are alcoholic beverages, tobacco, and prepared hot foods sold for immediate consumption. Fiscal year 2015 local sales tax revenue is anticipated to decrease two percent compared to the adopted budget, reflecting actual revenues in and slightly slower growth trends in retail sales in. Sales Tax $39,447,636 $40,900,000 $40,000,000-2% TRANSIENT OCCUPANCY TAX (TOT) (State Code Section , 3822 & B / County Code Section 40, et al) A five percent local tax is levied by Arlington on the amount paid for hotel and motel rooms. The TOT projections reflect flat occupancy rates and declining room rates. Fiscal year 2015 revenues are projected to be flat, which has been the trend for the past four years. Transient Occupancy Tax $22,270,626 $21,800,000 $21,800,000 - MEALS TAX (State Code Section & 3840 / County Code Section 65, et al) The restaurant meals tax was enacted effective June 1, The tax of four percent is charged on most prepared foods offered for sale. The tax is in addition to the six percent sales tax. Meals taxes have been common in most Virginia cities and a number of Virginia counties for many years. Airline catering services are assessed at a rate of two percent. In, meals tax is expected to increase six percent over adopted budget levels. Meals Tax $34,707,200 $34,700,000 $36,820,000 6%
19 OTHER LOCAL TAXES The chart below lists other sources of local taxes. Car Rental $6,173,823 $5,400,000 $5,350,000-1% Bank Stock 2,910,052 2,800,000 2,900,000 4% Recordation 6,974,187 6,000,000 6,000,000 - Cigarette 3,109,154 3,200,000 3,000,000-6% Utility 11,815,946 11,700,000 11,800,000 1% Short-Term Rental 47,895 45,000 45,000 - Wills & Adminstration 64,011 80,000 75,000-6% Consumption 800, , ,000 - Communication 7,784,666 7,800,000 7,500,000-4% Total $39,679,862 $37,775,000 $37,420,000-1% Car Rental Tax (State Code Section ) The local car rental tax is collected by the State and remitted to localities where the rental transaction occurred. Arlington local car rental tax is four percent, which is in addition to the State s tax. In 2005, the State General Assembly increased the State tax portion from four percent to six percent. The revenue increase from the additional two percent tax increase was dedicated to the Virginia Public Building Authority for the Statewide Agencies Radio System. For, a one percent decrease in total revenue is projected. Bank Stock Tax (State Code Section / County Code Section 28, et al) The bank stock tax is a franchise tax on the net capital gains of banks and trust companies. The tax is assessed at a rate of $0.80 per $100 of capital. revenue levels are expected to increase based on recent actual receipts. Recordation Tax (State Code Section / County Code Section 27-1) The local recordation tax is assessed at the rate of $ per $100 of value for all transactions including the recording of deeds, deeds of trust, mortgages, leases, contracts, and agreements admitted to record by the Circuit Court Clerk's Office. In Virginia, localities can charge up to onethird of the State rate. Recordation tax revenues fluctuate due to the volume of home sales and mortgage refinancing as a result of lower or higher interest rates and other real estate market conditions. The State increased recordation tax from $0.10 to $0.25 per $100 effective September 1, With the State s legislation change, Arlington s locally imposed recordation tax increased $0.033 to $ per $100 of transaction value.
20 Cigarette Tax (State Code Section / County Code Section 39, et al) The local cigarette tax on every pack of 20 cigarettes sold in Arlington County is $0.30. The State increased cigarette tax from $0.025 to $0.20 per pack effective September 1, 2004, and to $0.30 per pack effective July 1, In July 2004, the Arlington County Board adopted an ordinance increasing the local cigarette tax commensurate with the State s rate. Arlington s tax on a package of cigarettes prior to September 2004 was $0.05. Beginning September 1, 2004, the local tax rate was increased to $0.20 per pack and on July 1, 2005 (FY 2006) to $0.30 per package of 20 cigarettes. revenues are anticipated to decrease six percent based on recent actual receipts. Commercial and Residential Utility Tax (State Code Section / County Code Section 63, et al) Arlington charges a utility tax on commercial users of electricity and natural gas. This tax is based on kilowatt hours (kwh) for electricity and hundred cubic feet (CCF) for natural gas delivered monthly to commercial consumers. The state froze utility tax rates in 2002 to allow supply companies to convert locality taxation from a percentage of cost to a tax rate per unit of utility consumed. This cap was lifted in January 2004, allowing the County future flexibility on this local tax revenue. In FY 2006, the commercial utility tax rate for gas and electricity was increased 30 percent. The new rate for commercial and industrial consumers of natural gas was increased from $ /CCF to $ /CCF. The new rate for electricity was increased from $ /kWh to $ /kWh. The commercial utility tax is projected to generate $10.2 million, consistent with the trend of actual receipts. A residential utility tax was imposed on consumers of electricity and natural gas in FY The County Board dedicated the revenue for environmental initiatives as part of the Arlington Initiative to Reduce Emissions (Fresh AIRE) campaign. The tax on residential consumers is capped at $3.00 per month for each utility. In addition, the first 400 kwh of electricity and the first 20 CCF of natural gas are excluded from taxation. The tax rate for residential consumers was set at $ /kWh for electricity and $0.03/CCF for natural gas. The revenue projected from the residential utility tax in is $1.6 million, a seven percent increase when compared to budgeted levels. Short-term Rental Tax (State Code Section / County Code Section 64, et al) A person is engaged in the short-term rental business if no less than 80 percent of the gross rental receipts of such business in any year arise from transactions involving rental periods between 31 and 92 consecutive days, including all extensions and renewals to the same person or a person affiliated with the lessee. The rate of the tax is one percent on the gross receipts of such business.
21 Wills and Administration Tax (State Code Section / County Code Section 27-19) This tax, which is collected by the Circuit Court Clerk s Office, is imposed on the probate of every will or grant of administration. The tax rate is $0.033 per $100 of estate value. Total revenues in are expected to decrease six percent based on trends in recent actual receipts. Consumption Tax (State Code Section & 2904 / County Code Section 63, et al) The deregulation of electric and gas utilities, enacted during the 1999 and 2000 General Assembly, eliminated the Business, Professional, and Occupational License (BPOL) tax on electric and natural gas companies and created a new tax charged to consumers based on usage. This consumption tax is collected by the utilities and remitted back to localities. Consumption tax revenue is projected to remain flat in. Communications Tax (State Code Section ) Effective January 1, 2007, the State adopted a communications sales tax that is imposed on customers of communication services at the rate of five percent of the sales price of the service. This tax was adopted as part of the 2006 House Bill 568 (Acts of Assembly 2006, Chapter 780) and replaces many of the prior State and local communications taxes and fees with a centrallyadministered communications sales and use tax. Communications tax revenue is projected to decrease four percent in.
22 LICENSES, PERMITS, AND FEES Revenues in this category are levied to offset the cost of licensing certain trades, inspecting various types of construction, and providing other services. Motor Vehicle License Fees $4,971,835 $4,900,000 $5,000,000 2% Highway Permits 1,100,743 1,329,532 1,400,000 5% Site Plan Fees 1,114,585 1,276,255 1,062,840-17% Right-of-Way Fees 861, , ,000 - Other 2,453,447 2,005,850 2,121,892 6% Total $10,502,137 $10,411,637 $10,484,732 1% Motor Vehicle License Fees The annual motor vehicle license fee increased $8 to $33 per vehicle in FY Projected revenues for total $5.0 million, which is based upon recent actual receipts. Funds generated from this incremental rate increase are dedicated to pedestrian and bike safety PAYG projects. Motor vehicle license fee revenue is expected increase by two percent in based on trends in actual receipts. Highway Permits Highway permits are charged to contractors and utilities for right-of-way on County streets when necessary for construction projects, underground utilities repairs, and other purposes. For, this revenue stream is anticipated to increase five percent from adopted budget levels primarily based on estimates of expected development and construction, which increase the use of the public right-of-way. Site Plan Fees Site plan fee revenue is anticipated to decrease 17 percent in based on recent actual receipts. Right-of-Way Fees Revenues from right-of-way fees are based on the current rate imposed by the State at $0.83/line/month. This fee covers the use of highway and street right-of-way by certificated providers of telecommunication services and is charged to the ultimate end user. For, revenues are projected at $900,000 based upon historical receipts. Other Other license, permit and fee revenue comes from rezoning permits, fire system fees, child care permits, and other miscellaneous use permits and fees. In, other revenues are forecast to increase six percent. This is primarily due to increases in miscellaneous fee revenue in order to align the budget with historical actual receipts.
23 FINES, INTEREST, RENTS These revenues include fines, interest, building rents, lease agreements, paid parking, rental, and sale of surplus properties. Fines/Tickets $8,468,253 $9,605,548 $8,195,748-15% Interest (903,813) 1,500,000 1,500,000 - Courthouse Plaza Rent 3,394,743 2,800,000 3,000,000 7% Paid parking 851, , ,000-8% Other Revenue 656, , ,046 4% Total $12,466,788 $15,417,058 $14,165,794-8% Fines/Tickets This category is comprised of traffic moving violations, parking tickets, photo red light fines, arrest fees, false alarm fines, and civil penalties. For, this category is projected to decrease fifteen percent primarily based on actual parking ticket receipts. Interest Interest is earned on County General Fund and bond fund balances, which are invested on a shortterm basis until needed to pay for County expenditures. Interest earned varies due to changing balances and interest rates. Courthouse Plaza The County receives payments from Vornado Realty (formerly Charles E. Smith) for the land under 2100, 2110, and 2150 Clarendon Boulevard. The County shares in the net profit on the buildings operations. revenues are being increased based upon actual receipts. Paid Parking This revenue is generated by the monthly parking charges in various government buildings. revenue is projected to decrease primarily due to adjustments in revenues generated from the Arlington Mill public parking garage. Other Rentals, sales of surplus property, and lease agreements are included in this revenue category. The four percent increase projected in is primarily a reflection of anticipated increased revenue from community center rentals that is based on prior year actual receipts.
24 CHARGES FOR SERVICES This category encompasses revenues received for a variety of County services. Service charges are structured so that the users of a particular service are the ones to pay for a majority of its costs, as opposed to using general tax dollars to fund services that benefit a small segment of the population. The chart below highlights the major sources of revenues. Refuse/Recycling Fee $9,697,424 $9,576,576 $10,163,024 6% Parking Meters 7,885,752 8,301,000 7,965,200-4% Recreation Fees 9,070,436 9,176,212 9,996,359 9% Ambulance Service Fees 3,302,338 3,300,000 3,300,000 - Arlington Transit / Commuter Store 4,229,926 4,180,000 4,786,485 15% Indirect Administrative Charges 3,890,258 3,648,305 4,033,585 11% Mental Health Charges 1,404,140 1,625,022 1,642,237 1% Falls Church Reimbursement 3,240,561 3,421,145 3,849,425 13% Other 8,935,087 7,931,350 8,447,218 7% Total $51,655,922 $51,159,610 $54,183,533 6% Refuse/Recycling Fee For, the combined residential customer rate for refuse collection, disposal, and recycling increases from $ to $ per year. The County s policy for the refuse rate is recovery of 100 percent of disposal and collection costs, which includes refuse and recycling collection, landfill fees, leaf collection, cart management and administration, and associated overhead costs, which are partially offset by revenue from sale of recyclable materials. Parking Meters Parking meter revenue decreases four percent based on actual parking meter receipts. Parking meter rates remain unchanged in the budget. Recreation Fees Recreation fees include charges for summer and holiday camp programs, senior adult programs, competitive swimming, recreation classes, membership in County fitness centers, facility rentals, use of the athletic fields, and many other services. The nine percent growth primarily reflects added capacity in several revenue-producing program areas. Ambulance Service Fees Ambulance service fee revenue is expected to be flat in. Arlington Transit / Commuter Store Arlington Transit / Commuter Store revenue includes ART bus fares and business contributions for transportation demand management programs. revenues are projected to increase due to new and expanded ART bus routes and an increase in fares.
25 Indirect Administrative Charges Indirect administrative charges are reimbursements from the Utilities Fund, the CPHD Development Fund, and the Stormwater Fund for administrative functions (e.g. payroll, technology help desk, accounts payable) performed by County staff on behalf of the fund. Mental Health Service Charges The Department of Human Services provides counseling, case management, and psychiatric services to individuals needing mental health, substance abuse, and intellectual/developmental disability support services. Fees for services are paid by individuals receiving services or Medicaid, if applicable. The slight increase in anticipated fees revenue in is a reflection of recent actual receipts. City of Falls Church Reimbursement Revenue Arlington County provides a number of services to residents of the City of Falls Church (the City), including fire, judicial, and emergency communication services. Fire Station No. 6 is a joint-use facility, which is staffed by Arlington County firefighters, but owned by the City. The City reimburses the County for a portion of fire/ems expenses. In addition, under the terms of the County s judicial and public safety services agreement with the City, the City uses the County s alcohol safety program, Circuit Court, General District Court, Juvenile and Domestic Relations Court, Argus House, and community corrections. The County generally charges the City based on the City s proportionate use of these services. The County s Commonwealth Attorney also prosecutes cases on behalf of the City. Finally, the County answers all emergency 911 calls from the City. The County s Emergency Communications Center staff dispatches fire and ambulance crews for emergencies in the City. Emergency 911 calls necessitating police-related services are routed back to the City s police department. The table below provides greater detail on revenue from Falls Church. Under the terms of the County s agreements with the City, the budgeted revenue from Falls Church is based on the upcoming fiscal year s budget with an adjustment either upwards or downwards to account for the differences between the City s share of the County s budgeted and actual costs from the most recently-ended fiscal year. This reconciliation process explains the substantial swings for some departments budgeted revenue from one year to the next. Circuit Court $26,498 $26,738 $28,364 6% Clerk of the Circuit Court 97, , ,635 32% County Manager's Office (Community Corrections) 12,786 12,417 14,614 18% General District Court 7,262 9,045 7,982-12% Magistrate 2,415 1,911 2,104 10% Juvenile and Domestic Relations Court 110,656 81,790 76,845-6% Commonwealth's Attorney 145, , ,639-10% Sheriff 873, , ,084 3% Fire 1,750,215 1,867,747 2,194,114 17% Emergency Communications Center 208, , ,302 15% Department of Management and Finance 6,182 8,431 8,742 4% Total $3,240,561 $3,421,145 $3,849,425 13%
R E V E N U E S. book 93 web 101
 R E V E N U E S OVERVIEW Fiscal Year (FY) 2019 revenues reflect ongoing modest growth in the Northern Virginia economy. Arlington s proximity to the nation s capital, balanced economy, smart growth planning,
Revenue Overview FY 2019 PROPOSED BUDGET HIGHLIGHTS. County Board Work Session February 28, 2018
 FY 2019 PROPOSED BUDGET HIGHLIGHTS County Board Work Session February 28, 2018 General Fund Revenue by Source 2 Local Tax Revenue by Source (General Fund) Real Estate: Condominium, 9% Personal Property:
Revenue Overview. FY 2018 Proposed Budget
 Revenue Overview FY 2018 Proposed Budget County Board Work Session March 2, 2017 General Fund Revenue by Source 2 Local Tax Revenue by Source (General Fund) 3 FY 2017 to FY 2018 Proposed Revenue Changes
FY 2017 Incremental Change Over Adopted Budget (One- Time) ($ millions)
 ($ millions)") COUNTY MANAGER S OFFICE 2100 Clarendon Boulevard, Suite 314, Arlington, VA 22201 TEL 703.228.3120 FAX 703.228.3218 www.arlingtonva.us Memorandum To: County Board of Arlington, Virginia Date: April 4, 2017
COUNTY MANAGER S OFFICE 2100 Clarendon Boulevard, Suite 314, Arlington, VA 22201 TEL 703.228.3120 FAX 703.228.3218 www.arlingtonva.us Memorandum To: County Board of Arlington, Virginia Date: April 4, 2017
FUND DESCRIPTIONS FY 2015 PROPOSED BUDGET SUMMARY
 FY 2015 PROPOSED BUDGET SUMMARY FUND DESCRIPTIONS GENERAL FUND The General is the primary operating fund of the County and is used to account for the majority of services including fire and police protection,
FY 08/09 ADOPTED GENERAL FUND REVENUES $224,391,325
 GENERAL FUND REVENUES FY 08/09 ADOPTED GENERAL FUND REVENUES $224,391,325 State Revenue 10% Transfers 1% Federal Revenue 2% Fund Balance 0.2% Other Local Revenue 3% Other Local Taxes 22% Gen. Property
FY 09/10 ADOPTED GENERAL FUND REVENUES $218,840,522
 GENERAL FUND REVENUES FY 09/10 ADOPTED GENERAL FUND REVENUES $218,840,522 State Revenue 11% Transfers Federal Revenue1% 2% Fund Balance 0.1% Other Local Revenue 2% Other Local Taxes 21% Gen. Property Taxes
FUND DESCRIPTIONS FY 2016 PROPOSED BUDGET SUMMARY
 FY 2016 PROPOSED BUDGET SUMMARY FUND DESCRIPTIONS GENERAL FUND The General is the primary operating fund of the County and is used to account for the majority of services including fire and police protection,
FUND DESCRIPTIONS FY 2014 PROPOSED BUDGET SUMMARY
 FY 2014 PROPOSED BUDGET SUMMARY FUND DESCRIPTIONS GENERAL FUND The General Fund is the primary operating fund of the County and is used to account for the majority of services including fire and police
Revenues. FY2018 Total County Revenue Sources. (Note: Excludes Operating Transfers In) Other Localities 2.8% Misc 0.7%
 Other Localities 2.8% Misc 0.7%") All Funds Revenue Summary FY2018 Total County Revenue Sources (Note: Excludes Operating Transfers In) Misc 0.7% Other Localities 2.8% Use of Money & Prop 0.7% Fines & Forfeit 0.1% Charges For Serv 13.2%
All Funds Revenue Summary FY2018 Total County Revenue Sources (Note: Excludes Operating Transfers In) Misc 0.7% Other Localities 2.8% Use of Money & Prop 0.7% Fines & Forfeit 0.1% Charges For Serv 13.2%
FUND DESCRIPTIONS FY 2018 PROPOSED BUDGET SUMMARY
 FY 2018 PROPOSED BUDGET SUMMARY FUND DESCRIPTIONS GENERAL FUND The General is the primary operating fund of the County and is used to account for the majority of services including fire and police protection,
Memorandum. Summary. Revenue
 COUNTY MANAGER S OFFICE 2100 Clarendon Boulevard, Suite 314, Arlington, VA 22201 TEL 703.228.3120 FAX 703.228.3218 www.arlingtonva.us Memorandum To: County Board of Arlington, Virginia Date: March 13,
FY 2018 County Board Guidance
 FY 2018 County Board Guidance My Proposed Budget meets County Board guidance: Balanced budget that continues the current level of service within existing tax rate Explore collaborations with APS and regional
FUND DESCRIPTIONS FY 2019 PROPOSED BUDGET SUMMARY
 FY 2019 PROPOSED BUDGET SUMMARY FUND DESCRIPTIONS GENERAL FUND The General is the primary operating fund of the County and is used to account for the majority of services including fire and police protection,
Board Guidance and Notes to Accompany FY 2018 Adopted Budget
 Board Guidance and Notes to Accompany FY 2018 Adopted Budget 1. Real Estate Tax Rate: The total real estate tax rate increased 1 ½ cents from $0.978 to $0.993 (base rate excluding the sanitary district
February 11, 2015 Revenue Overview
 February 11, 2015 Revenue Overview General Fund Revenue By Source FY 2015: $1.15 billion License, Permits & Fees, 1% Charges for Services, 5% State, 6% Local Taxes, 82% Misc., 5% Federal, 1% 2 Legal Limits
ARLINGTON COUNTY, VIRGINIA
 ARLINGTON COUNTY, VIRGINIA County Board Agenda Item Meeting of November 14, 2006 DATE: November 8, 2006 SUBJECT: Fiscal Year (FY) 2008 Budget Guidance C. M. RECOMMENDATION: Provide guidance on the FY 2008
ARLINGTON COUNTY, VIRGINIA. County Board Agenda Item Meeting of October 15, Receive the County Manager s Budget Forecast for Fiscal Year 2018.
 ARLINGTON COUNTY, VIRGINIA County Board Agenda Item Meeting of October 15, 2016 DATE: October 14, 2016 SUBJECT: Presentation of the FY 2018 Financial C. M. RECOMMENDATION: Receive the County Manager s
FY 13 Funding Sources General Fund
 The general fund accounts for all financial transactions and resources in Prince William County other than those required to be accounted for in another fund. Thus, the general fund is the largest and
CITY OF CHARLOTTESVILLE, VIRGINIA
 Page 1 of 5 Revenues Taxes: Real estate $ 32,011,244 $ 32,011,244 $ 32,749,762 $ 738,518 Personal property 4,596,481 4,596,481 4,605,583 9,102 Public service corporation 1,500,000 1,500,000 1,950,118 450,118
ARLINGTON COUNTY, VIRGINIA. County Board Agenda Item Meeting of February 24, 2018
 ARLINGTON COUNTY, VIRGINIA County Board Agenda Item Meeting of February 24, 2018 DATE: February 20, 2018 SUBJECT: Request to authorize advertisement of a public hearing to consider the Calendar Year (CY)
FISCAL YEAR 2018 COUNTY BUDGET RESOLUTION
 BUDGET SUMMARY 17 ATTACHMENT I FISCAL YEAR 2018 COUNTY BUDGET RESOLUTION Be it resolved by the County Board of Arlington County, Virginia, that the following Budget is hereby adopted for the Fiscal Year
1st Quarter Revenue and Expenditures
 1st Quarter Revenue and Expenditures REPORTFY 2019 Published 11/15/2018 1st Quarter FY 2019 Revenues Section 2.09 of the Principles of Sound Financial Management requires quarterly updates to the Board
County Manager s FY 2019 Proposed Budget
 County Manager s FY 2019 Proposed Budget OVERVIEW County Board Work Session Thursday, February 22, 2018 @ 4:00 p.m. Economic Environment $20.5-Million Budget Gap Strong Headwinds in Office Market Growing
County Manager s FY 2017 Proposed Budget. Overview for the Public Hearing On Tax and Fee Rates
 County Manager s 2017 Proposed Budget Overview for the Public Hearing On Tax and Fee Rates Public Tax & Fee Hearing - March 29 & 31, 2016 General Fund Revenue By Source License, Permits & Fees, 1% Charges
General Fund Revenue FY
 General Fund Revenue FY 2003-2014 Actual Actual Actual Actuals Actuals Actuals Actuals Actuals Actuals Actuals Adopted Adopted 2002-2003 2003-2004 2004-2005 2005-2006 2006-2007 2007-2008 2008-2009 2009-2010
Our Mission: To provide critical transportation infrastructure to enhance the community s long-term economic and environmental sustainability.
 Department of Environmental Services Our Mission: To provide critical transportation infrastructure to enhance the community s long-term economic and environmental sustainability. Transportation Capital
FISCAL YEAR 2017 COUNTY BUDGET RESOLUTION
 BUDGET SUMMARY 17 ATTACHMENT I FISCAL YEAR 2017 COUNTY BUDGET RESOLUTION Be it resolved by the County Board of Arlington County, Virginia, that the following Budget is hereby adopted for the Fiscal Year
Revenue Source Descriptions
 Primary Government Property Taxes Revenue Source Descriptions Property Taxes are levied against the assessed taxable valuation of real and personal property in the County. The tax rates are expressed in
ARLINGTON COUNTY, VIRGINIA. County Board Agenda Item Meeting of April 22, 2017
 ARLINGTON COUNTY, VIRGINIA County Board Agenda Item Meeting of April 22, 2017 DATE: April 21, 2017 SUBJECT: Fiscal Year 2018 County Budget Resolution and Appropriations Resolution C. M. RECOMMENDATIONS:
City of Manassas, Virginia City Council Meeting AGENDA. City Council Special Meeting
 City of Manassas, Virginia City Council Meeting AGENDA City Council Special Meeting 9027 Center Street Manassas, VA 20110 Second Floor Conference Room Wednesday, November 08, 2017 Call to Order - 5:30
Our Mission: To provide critical transportation infrastructure to enhance the community s long-term economic and environmental sustainability.
 Department of Environmental Services Our Mission: To provide critical transportation infrastructure to enhance the community s long-term economic and environmental sustainability. Transportation Capital
Revenue Account Codes for FY Reporting Account Code
 Account s for FY 13-14 Reporting Account 311000 Ad Valorem Taxes Property Value Taxes Ad Valorem Taxes 312100 Local Option Taxes Local Option, Use and Fuel Taxes General Government Taxes 312300 County
FISCAL YEAR 2016 COUNTY BUDGET RESOLUTION
 BUDGET SUMMARY ATTACHMENT I FISCAL YEAR 2016 COUNTY BUDGET RESOLUTION Be it resolved by the County Board of Arlington County, Virginia, that the following Budget is hereby adopted for the Fiscal Year 2016
FY 12 Funding Sources General Fund
 The General Fund accounts for all financial transactions and resources in Prince William County other than those required to be accounted for in another Fund. Thus, the General Fund is the largest and
2 nd Quarter Revenue and Expenditures
 2 nd Quarter Revenue and Expenditures REPORTFY 218 Published 2/15/218 Revenues Section 2.9 of the Principles of Sound Financial Management requires quarterly updates to the Board of County Supervisors
4 th Quarter Revenue and Expenditures
 4 th Quarter Revenue and Expenditures REPORTFY 2017 Published 8/15/2017 Revenues Section 2.09 of the Principles of Sound Financial Management requires quarterly updates to the Board of County Supervisors
DEPARTMENT OF ENVIRONMENTAL SERVICES Greg Emanuel, Director LINES OF BUSINESS
 Greg Emanuel, Director 2100 CLARENDON BLVD., SUITE 900, ARLINGTON, VA 22201 703-228-4488 des@arlingtonva.us Our Mission: DES strives for excellence as we plan, build, operate, and maintain Arlington s
Budget Introduction Proposed Budget
 Budget Introduction Proposed Budget INTRO - 1 INTRO - 2 Summary of the Budget and Accounting Structure The City of Beverly Hills uses the same basis for budgeting as for accounting. Governmental fund financial
General Fund Revenue Summary
 Summary of General Fund Revenues and Expenditures Budget FY 2017-2018 FISCAL YEAR 2017-2018 General Fund Revenue Summary The City of Decatur has 7 broad revenue categories: taxes, licenses and permits,
Schedule of Ad Valorem Taxes and Required Millage. Summary of Total Budget
 Citrus County, Florida Schedule of Ad Valorem Taxes and Required Millage BOCC County-Wide 2010/2011 2011/2012 Revenue Millage Revenue Millage General Fund $ 47,539,858 4.9447 $ 46,165,753 4.9447 Road &
Arlington County, Virginia
 Arlington County, Virginia METRO METRO 2015 2024 CIP Metro Funding Project Description The Washington Metropolitan Area Transit Authority (WMATA/Metro) is a unique federal-state-local partnership formed
Ad Valorem Taxes. Description of Revenue Source. Revenue Assumptions
 Ad Valorem Taxes Ad Valorem Taxes are taxes paid on real and personal property located within the Village s corporate limits. Taxes for real and personal property, excluding motor vehicles, are levied
ARLINGTON COUNTY, VIRGINIA. County Board Agenda Item Meeting of April 22, 2017
 ARLINGTON COUNTY, VIRGINIA County Board Agenda Item Meeting of April 22, 2017 DATE: April 20, 2017 SUBJECT: Calendar Year (CY) 2017 personal property tax rate and the allocation method of the State s vehicle
Revenue Account Codes for FY12-13 Reporting
 311000 Ad Valorem Taxes Property Value Taxes Ad Valorem Taxes 312100 Local Option Taxes Local Option, Use and Fuel Taxes General Government Taxes 312300 County Ninth-Cent Voted Fuel Tax Local Option, Use
Village of Oak Park, IL Department of Finance. Quarterly Finance and Performance Report 2016, 1st Quarter
 Village of Oak Park, IL Department of Finance Quarterly Finance and Performance Report 2016, 1st Quarter May, 2016 Table of Contents Section 1: Introduction... 3 Section 2: 1 st Quarter Financial Report
Adopted CIP Program Summary
 Arlington County, Virginia Adopted CIP Program Summary The FY 215-224 CIP includes typical capital projects such as maintenance capital, parks, transportation, metro, community conservation, government
DES Director. Facilities & Engineering. Facilities Design & Construction. Engineering Bureau. Real Estate Bureau. Capital Assets Support
 Greg Emanuel, Director 2100 CLARENDON BLVD., SUITE 900, ARLINGTON, VA 22201 703-228-4488 des@arlingtonva.us Our Mission: To bring strategic focus to the critical policy areas of transportation, the environment,
SUPPLEMENT TO THE PROPOSED BUDGET REVENUE OUTLOOK AS PRESENTED BY MAYOR ANTONIO R. VILLARAIGOSA
 SUPPLEMENT TO THE PROPOSED BUDGET REVENUE OUTLOOK AS PRESENTED BY MAYOR ANTONIO R. VILLARAIGOSA CITY OF LOS ANGELES Revenue Outlook Supplement to the 201314 Proposed Budget 2 0 1 3 1 4 Prepared by the
Major Highlights of the Budget
 General Fund Revenues Major Highlights of the The FY 19 keeps the City s Real Estate Tax rate at 95 cents per 100 dollars of assessed value. There are no other tax or fee changes as part of this budget.
FY 2017 Budget Forecast Overview Joint Budget Forum
 FY 2017 Budget Forecast Overview Joint Budget Forum December 7, 2015 Agenda - County Manager & Superintendent Opening Remarks 6:30 7:00 - Small Group Break-out 7:00 7:45 Priorities a. What are your priorities
1 st Quarter Revenue and Expenditures
 1 st Quarter Revenue and Expenditures REPORTFY 2017 Published 11/15/2016 Revenues Section 2.09 of the Principles of Sound Financial Management requires quarterly updates to the Board of County Supervisors
CITY OF BREVARD
 ANNUAL BUDGET ESTIMATE - REVENUE Amended - 2018-2019 CITY OF BREVARD FY 2017-2018 2016-2017 2017-2018 4/30/2018 2017-2018 2018-2019 Account Actual ($) Budget ($) Actual ($) Estimate %Remaining Requested
FY 2019 Proposed Revenue Changes. Targeted Tax Changes
 Changes Title, Description & Targeted Tax Changes Increase Residential Utility Taxes Description: The residential utility tax was established in FY 2008 and increased last in FY 2018. The tax is charged
Fairfax County. Department of Management and Budget Government Center Parkway, Suite 561. Fairfax, VA
 Fairfax County Department of Management and Budget 12000 Government Center Parkway, Suite 561 Fairfax, VA 22035 703-324-2391 Budget Information: www.fairfaxcounty.gov/budget Provide feedback on the FY
DEFINITION OF REVENUE SOURCES GENERAL FUND
 GENERAL FUND PROPERTY TAX: The valuation of property in the City is determined by the Los Angeles County Tax Assessor, except for Public Utility property, which is assessed by the State Board of Equalization.
LOCAL TAX COMPARISONS A Survey of Rates for Major Local Revenue Sources in Selected Virginia Cities and Counties for the Fiscal Year
 LOCAL TAX COMPARISONS A Survey of Rates for Major Local Revenue Sources in Selected Virginia Cities and Counties for the Fiscal Year 2018-19 REVISION Prepared by Budget Department City of Chesapeake July
City of Chesapeake, Virginia FY Operating Budget THE ROLE OF THE ECONOMY
 FY217-18 Operating Budget ECONOMIC ASSUMPTIONS THE ROLE OF THE ECONOMY Revenue is the income a local government needs to pay for all of the services it provides. The major sources of revenue include taxes,
VILLAGE OF KENMORE, NEW YORK
 , NEW YORK 2009-2010 Adopted Budget BUDGET 2009-2010 Exhibit / Schedule Page Summary of Budget by Fund Exhibit A 1 Summary of Appropriations by Fund Exhibit B 2 Summary of Budget - Debt Service Fund Exhibit
CITY OF LANCASTER FISCAL BUDGET REVENUE SOURCES
 CITY OF LANCASTER FISCAL 2007-08 BUDGET REVENUE SOURCES TAXES The tax raising authority of cities has been severely limited for many years. Proposition 13 enacted in 1978 amended the California Constitution
DES Director. Facilities & Engineering. Facilities Design & Construction. Engineering Bureau. Real Estate Bureau. Capital Assets Support
 Greg Emanuel, Director 2100 CLARENDON BLVD., SUITE 900, ARLINGTON, VA 22201 703-228-5022 des@arlingtonva.us Our Mission: DES strives for excellence as we plan, build, operate, and maintain Arlington s
Congressional Budget Office Economic Forecast for Calendar Years 2010 through % -1.3% 3.2% 2.8% 5.6% Real GDP Growth
 REVENUE BUDGET ECONOMIC CONSIDERATIONS ECONOMIC, DEMOGRAPHIC AND OTHER FACTORS AFFECTING REVENUES The revenue budget for the City of Chesapeake consists of over 700 line items representing different sources.
CITY OF LOS ANGELES FISCAL YEAR BUDGET
 CITY OF LOS ANGELES FISCAL YEAR 201516 BUDGET SUPPLEMENT TO THE PROPOSED BUDGET REVENUE OUTLOOK AS PRESENTED BY MAYOR ERIC GARCETTI Back to Basics: A City That Works CITY OF LOS ANGELES Revenue Outlook
AN APPROPRIATION ORDINANCE
 BILL NO. 693 ORDINANCE NO. 693 INTRODUCED BY: GARY N. BECK, SR. FIRST READING: NOVEMBER 15, 2017 FINAL READING: DECEMBER 6, 2017 ADOPTED: AN APPROPRIATION ORDINANCE AN ORDINANCE of the Township of Rostraver,
Indian River County 2030 Comprehensive Plan
 2030 Comprehensive Plan Chapter 6 Supplement #15; Adopted December 5, 2017, Ordinance 2017-015 TABLE OF CONTENTS List of Figures... ii List of Tables... iii Introduction... 1 Existing Conditions... 2 Financial
FY 2016 FY 2017 FY 2017 FY 2018 Percent Ad Valorem Taxes
 Ad Valorem Taxes Ad Valorem Taxes are taxes paid on real and personal property located within the Village s corporate limits. Taxes for real and personal property, excluding motor vehicles, are levied
Crawford County, Ohio
 Financial Forecast For the Years Ended December 31, 2006, 2007, and 2008 Actual; Years Ending December 31, 2009, 2010, and 2011 Forecasted 12/1/2009 1 Financial Forecast Table of Contents Page Schedule
March 1, Honorable Eric Garcetti, Mayor SUBJECT: FINANCIAL FORECAST REPORT MARCH 1, 2016
 March 1, 2016 Honorable Eric Garcetti, Mayor SUBJECT: FINANCIAL FORECAST REPORT MARCH 1, 2016 In accordance with City Charter Section 311(c), I am submitting my revenue forecasts for fiscal years 2015-16
GENERAL FUND EXPENDITURES
 GENERAL FUND EXPENDITURES The recommended fiscal year (FY) 2018-19 General Fund budget totals $616,459,260. This is $8 million (1.3%) more than the budget approved for FY 2017-18. The recommended general
METRO. Metro Funding. Associated Master Plan: Comprehensive Master Transportation Plan (MTP) for Arlington. Neighborhood(s):
 for Arlington. Neighborhood(s):") METRO METRO METRO 2017 2026 CIP Metro Funding Project Description The Washington Metropolitan Area Transit Authority (WMATA/Metro) is a unique federal-state-local partnership formed to provide mass transit
METRO METRO METRO 2017 2026 CIP Metro Funding Project Description The Washington Metropolitan Area Transit Authority (WMATA/Metro) is a unique federal-state-local partnership formed to provide mass transit
Municipal Budget 2019
 Municipal Budget 2019 Adopted as Ordinance 18-09 of 2018 Revenues 301 REAL PROPERTY TAXES 301000 REAL ESTATE TAXES - CURRENT $ 12,431,045.18 302000 REAL ESTATE TAXES - DELINQUENT 285,000.00 302200 BOROUGH-INTERIM
2 February 5-6, 2016
 February 5-6, 2016 Our Priorities for the Community Fiscal Responsibility and Reducing the Tax Burden Education Infrastructure Economic Development Public Safety Service Excellence Annual Planning Meeting
Quarterly Financial Status Report
 Quarterly Financial Status Report Prepared by the Finance Department Third Quarter Ending March 31, 2011 This report summarizes the City s overall financial position for the period of July 1, 2010 through
New Hampshire Fiscal Policy Institute 1
 New Hampshire Fiscal Policy Institute 1 New Hampshire Fiscal Policy Institute 2 Pays for services that help make our communities stronger Tangible and direct: Roads and bridges Police, fire, and emergency
Proposed Budget. Fiscal Year Revenue Overview
 Fiscal Year 1 Revenue Overview Major Revenue Sources T FISCAL YEAR 1 REVENUE OVERVIEW he total estimated revenues from County funds for Fiscal Year 1 is $57 million, a.% increase from Fiscal Year. Total
New Castle County Revenue Summary with Contingencies & Debt Service. Fiscal Year 2018 Recommended Budget
 New Castle County Revenue Summary with Contingencies & Debt Service Fiscal Year 2018 Recommended Budget Table of Contents Revenue Summary Sources of Funds Summary...1 Revenue Assumptions...2 Historical
FY 2018 Budget Forecast Overview Joint Budget Forum
 FY 2018 Budget Forecast Overview Joint Budget Forum November 30, 2016 Agenda - County Manager & Superintendent Opening Remarks 6:00 6:30 - Small Group Discussion and Report-Out 6:30 7:30 What are the important
TOTAL GENERAL FUND REVENUES
 General Fund Revenues Budget Actual Actual Budget Actual Actual FY 2018 12-31-2017 12-31-2016 FY 2018 12-31-2017 12-31-2016 GENERAL PROPERTY TAXES: NON-CATEGORICAL AID: Current Real Estate Taxes 10,400,000
CITY OF LOS ANGELES. Revenue Outlook. Supplement to the Proposed Budg et Prepared by the City Administrative Officer - April 2016
 CITY OF LOS ANGELES Revenue Outlook Supplement to the 201617 Proposed Budg et 20161 7 Prepared by the City Administrative Officer April 2016 TABLE OF CONTENTS Section 1 OVERVIEW Preface 1 Revenue Summary
TAX COLLECTION TAX COLLECTOR SALARY $ 28, BOND PREMIUM TAX COLLECTOR EXPENSE 6, TAX COLLECTION TOTAL $34,800.00
 11/7/2017 BOROUGH OF COPLAY $2,340,299.00 GENERAL FUND 4.130 mills LIBRARY 0.380 mills EMERGENCY SERVICES 0.380 mills TOTAL REAL ESTATE TAX 4.890 mills ADMINISTRATION MAYOR $ 1,800.00 COUNCIL 10,800.00
Round 6.4 Cooperative Forecasts of Population, Households, Housing Units and Employment
 Round 6.4 Cooperative Forecasts of Population, Households, Housing Units and Employment This is the 58th in a series of Planning Information Reports produced by the Planning Research and Analysis Team
Quarterly Budget Report
 City of Chicago Quarterly Report 1st Quarter Mayor Rahm Emanuel Quarterly Report-1st Quarter Content and Purpose This quarterly report presents an overview of the City s operating revenues and expenditures
CITY OF WILSON, NORTH CAROLINA
 STATISTICAL SECTION Financial Trends These schedules contain trend information to help the reader understand how the city s financial performance has changed over time. Table 1 Net Position By Component
REVENUE MANUAL PALM BEACH COUNTY Edition February 2018
 REVENUE MANUAL PALM BEACH COUNTY 218 Edition February 218 TABLE OF CONTENTS About this. 2 Index of Revenues Index of Revenues by Revenue Source Code Index of Revenues by Name. 3 4 1 About this The Palm
Fairfax County Federation of Citizens Associations Resolution Fairfax County Advertised FY 2006 Budget (Membership approved 3/31/05)
") Fairfax County Federation of Citizens Associations Resolution Fairfax County Advertised FY 2006 Budget (Membership approved 3/31/05) Background The County Executive s proposed FY 2006 Budget Plan totals
Fairfax County Federation of Citizens Associations Resolution Fairfax County Advertised FY 2006 Budget (Membership approved 3/31/05) Background The County Executive s proposed FY 2006 Budget Plan totals
FY 2019 Revenue Summary, Contingencies and Debt Service Presentation To County Council
 FY 2019 Revenue Summary, Contingencies and Debt Service Presentation To County Council April 9, 2018 Table of Contents Revenue Summary Sources of Funds Summary...1 Revenue Assumptions...2 Historical General
GENERAL FUND Revenues
 GENERAL FUND Revenues The General Fund is used to account for general purpose revenues, which are used to fund general governmental services, excluding utilities. Following are descriptions of the City's
2019 GENERAL FUND REVENUES
 Beginning Balance 2019 $ 200,000.00 01.301.010 Real Estate Taxes Current Year ($230,120,290 x.00425 mils x 96% collection rate) (1mill=$230,120) $ 938,893.27 01.301.020 Real Estate Taxes Prior Year $ 2,000.00
FY 2019 Budget Forecast Overview
 FY 2019 Budget Forecast Overview October 24, 2017 Arlington Outlook Arlington Continues to Grow Population Service Demands Real Estate Assessment Base / New Construction School Population Real Estate Trends
FY 2018 Revenue Manual CITY OF ST. AUGUSTINE
 FY 2018 Revenue Manual CITY OF ST. AUGUSTINE This Revenue Manual was developed to provide a comprehensive reference source for all revenue collected by the City of St. Augustine. The manual is an in depth
WHAT ARE THE TAX AND REVENUE CHANGES IN THE FY 2014 BUDGET?
 An Affiliate of the Center on Budget and Policy Priorities 820 First Street NE, Suite 510 Washington, DC 20002 (202) 408-1080 Fax (202) 325-8839 www.dcfpi.org WHAT ARE THE TAX AND REVENUE CHANGES IN THE
Q Internal Financial Report (Unaudited)
") Q3 2013 Internal Financial Report (Unaudited) Index Financial Commentary... 1 Summary of All City Funds... 7 Second Quarter Year-to-Date Actuals by Fund compared to Current Budget and Prior Year: General
Q3 2013 Internal Financial Report (Unaudited) Index Financial Commentary... 1 Summary of All City Funds... 7 Second Quarter Year-to-Date Actuals by Fund compared to Current Budget and Prior Year: General
CITY OF LANCASTER FISCAL BUDGET REVENUE SOURCES
 CITY OF LANCASTER FISCAL 2006-07 BUDGET REVENUE SOURCES TAXES The tax raising authority of cities has been severely limited for the past 25 years. Proposition 13 enacted in 1978 amended the California
FY 2014 BUDGET CALENDAR
 FY 2014 BUDGET CALENDAR The calendar for development of the FY 2014 budget is provided below. The fiscal year begins July 1, 2013 and ends June 30, 2014. September 2012 October, November December, January
NEW HANOVER TOWNSHIP
 SUMMARY OF OPERATING, CAPITAL AND TRUST FUNDS BEGINNING ENDING BALANCE REVENUES BALANCE OPERATING FUNDS General Fund $ 2,654,359 $ 4,300,856 $ 4,467,712 $ 2,487,503 Fire Protection Fund 27,635 338,862
BUDGET ORDINANCE NO. O Part I Operation of County Government
 BUDGET ORDINANCE BUDGET ORDINANCE NO. O-17-11 A BUDGET ORDINANCE RELATING TO THE FISCAL AFFAIRS OF SPARTANBURG COUNTY MAKING APPROPRIATIONS THEREFORE, LEVYING TAXES FOR THE FISCAL YEAR BEGINNING JULY 1,
ARLINGTON COUNTY, VIRGINIA. County Board Agenda Item Meeting of October 20, 2018
 ARLINGTON COUNTY, VIRGINIA County Board Agenda Item Meeting of October 20, 2018 DATE: October 17, 2018 SUBJECT: Presentation of Financial Results & Closeout for the Fiscal Year (FY) ended June 30, 2018
NCSL (Summary of States Measures to Balance FY 2010 Budgets - October 21, 2009)
") NCSL (Summary of States Measures to Balance FY 2010 Budgets - October 21, 2009) ACROSS THE BOARD BUDGET CUTS & OTHER MISCELLANEOUS CUTS 13 states have taken across the board budget cuts. The cuts range
NCSL (Summary of States Measures to Balance FY 2010 Budgets - October 21, 2009) ACROSS THE BOARD BUDGET CUTS & OTHER MISCELLANEOUS CUTS 13 states have taken across the board budget cuts. The cuts range
Total Expenditures $ 44,922,702 $ 49,718,336 $ 47,884,092 $ 47,876,610
 ALL FUNDS RECOGNIZED IN BUDGET ORDINANCE ITEM 2014-15 Actual 2015-16 Budget 2015-16 Estimated 2016-17 Budget GOVERNMENTAL FUND General Fund Property Taxes $ 20,189,267 $ 20,076,100 $ 20,091,190 $ 19,819,670
2. Adopt the following factors to be used to calculate the appropriations limit for :
 FORM GEN. 160 CITY OF LOS ANGELES INTER-DEPARTMENTAL CORRESPONDENCE 0590-00098-5138 Date: July 19, 2018 To: The Council From: Richard H. Llewellyn Jr., City Administrativ Subject: 2018-19 APPROPRIATION