THE COMMITMENT TO REDUCING INEQUALITY INDEX
|
|
|
- Miles Hill
- 5 years ago
- Views:
Transcription


1 THE COMMITMENT TO REDUCING INEQUALITY INDEX Measuring and Motivating: Using data to incentivise progressive policies to tackle economic inequality Dr. Chiara Mariotti Inequality Policy Manager Oxfam GB

2 1. Why an index? 2. What are we measuring? 3. Findings Even it up
3 Commitment to Reducing Inequality Index Shift debate FROM Inequality is too high We must fight inequality TO Inequality is not inevitable How to do it Advocate for race to the top Hold governments accountable Measure policies Measure their implementation Measure their direct impact on inequality Measure annually
4 Commitment to Reducing Inequality Index Annual index, report, methodology, database, digital online tool available at: 157 countries 7,000 data points Input from 82 Oxfam offices Input from external experts at IMF, World Bank, ILO, OECD, CEQ

5 Three policy pillars All indicators deflated by: % of informal jobs % unemployment
 Use Sample MIN/MAX Highest score in sample gets 1 Lowest")

6 Standardise to a 0-1 scale S tan dardisedscore x MINx MAXx MINx Choice of approach A) Use Sample MIN/MAX Highest score in sample gets 1 Lowest score in sample gets 0 B) Fixed MIN/MAX based on fixed parameters Eg target 10% spending on education as the MAX No score necessarily gets 0, or 1

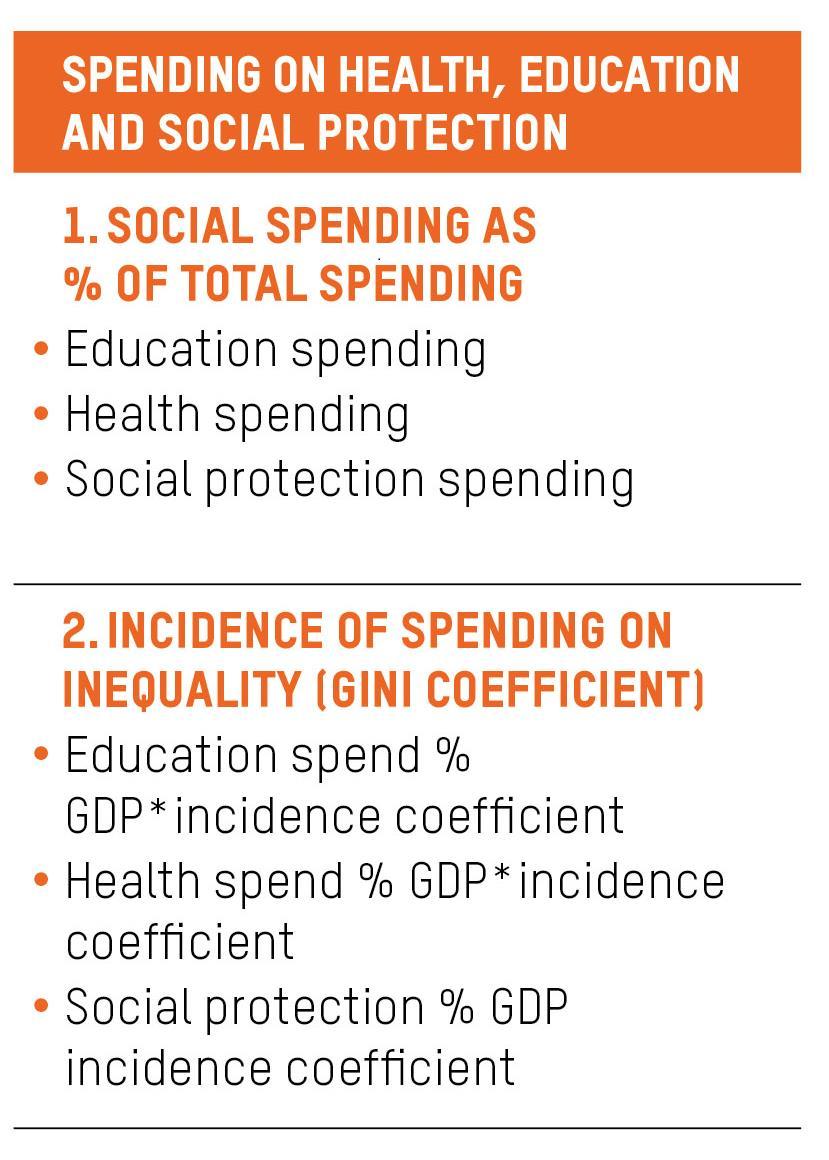
7 Spending
8 Incidence of social spending Average global coefficients for 96 countries For 30 OECD countries, complemented by by national studies of impact of social protection spending on Gini For 31 countries, national coefficients based on CEQ s studies ( Educ% GDP ) ( Health% GDP ) ( Soc Pr % GDP )

9 Top/ bottom 10 countries for social spending


10 Tax
11 Incidence of different tax types Country specific data from OECD (31), the CEQ (31),25 the EU (6) or national sources (2) Average global coefficients used for 87 countries ( PIT% GDP 0.001)...
12 Tax collection: tax productivity and tax effort Tax productivity Based on prevailing tax rate, how well does the government do at collecting the taxes that are due? VATcollected$ Consumption$ VATrate PITcollected$ GDP$ PITrate VATas% GDP Cons% GDPVATrate PITas%GDP PITrate Source: Price Water House Coopers
13 Tax collection: tax productivity and tax effort Tax effort (based on CERDI and IMF studies) Based on economic fundamentals, how well does the government do at collecting the taxes that are due? Potential tax revenue is a function of: GDP per capita [+ve] Trade openness (imports plus exports) [+ve] Agriculture as a share of economy [-ve] Education level (Public expenditure on education) [+ve] Income inequality (Gini) [-ve] Inflation (CPI) [not sig] Corruption (CPI) [-ve] Source: Understanding Countries Tax Effort; by Ricardo Fenochietto, Carola Pessino; IMF Working Paper
14 Harmful Tax Practices
15 Top/ bottom 10 countries for tax policy


16 Labour

17 Data on women s rights and gender equality

18 Deflator for unemployment and informal work Source: ILO,
19 Top/ bottom 10 countries for labor rights

20 Top 10 countries
21 Bottom 10 countries
22 Key findings The vast majority of countries are doing much less than they could: three quarters are doing less than half of what the best do Nobody is doing everything they could, even the top performer Denmark 1 st but 126 th in tax progressivity; Germany 2 nd but 142 nd in education spending You don t have to be rich to make progressive policy choices Poorer countries are outperforming much richer countries in a number of areas (Namibia, Ethiopia) More than one in 5 of the countries in the top 50 are middle income countries (e.g. Namibia, Costa Rica, Tunisia, Georgia). 8 of the 47 high income countries that feature in the index fall well outside the top 50 ranks (Bahrain, Singapore) Positive stories: South Korea and Indonesia
23 Main trends between CRI 2017 and CRI 2018 Only comparison in some indicators performance Small increase in average % of social spending (from 43.15% to 43.22% of total spend), driven by education and health. Mixed progress in taxation: small decrease in CIT, small increase in PIT but weaker collection rates. Mixed progress in labour: less legal violations but no legislation improvements with some exceptions in parental leave (Bhutan, India) and minimum wages (Indonesia, S.Korea).
24 Challenges and next steps Data gathering Huge investment is needed in data on inequality and on policy measures [SDG 10 S targets and indicators] The relationship between CRI and inequality outcome measures is complex Trade off between methodology and data improvement and over-time comparability Comprehensiveness vs simplicity Disalignment btwn a country s ranking and its policy debate Launch at Annual Meetings 2018: 1 st inequality ministerial meeting to build a coalition of champions
25 Change since 2017: Personal Income Tax
26 Change since 2017: Corporate Income Tax
27 Change since 2017: Education spending
28 Change since 2017: Health spending
29 Change since 2017: Social protection spending
30 Measuring and Motivating: Using data to incentivise progressive policies ADDITIONAL SLIDES Didier Jacobs Senior Policy Advisor Oxfam America
31 Complex relationship with level of income inequality Norway Sweden Belgium Denmark Finland Germany Austria Netherlands France Japan Luxembourg Iceland Ireland Canada Australia United Italy Switzerland Kingdom Slovenia Portugal Czech Republic United States Spain Greece Argentina Hungary Israel Cyprus Slovak Croatia Republic Poland Costa Rica Uruguay Estonia Chile Namibia Niger Tunisia Liberia Guyana Romania Latvia Colombia Mauritius Bolivia Armenia Burkina Turkey Faso Mozambique Malawi Samoa Ecuador Lesotho Tajikistan Guinea Jordan Georgia Seychelles Djibouti Kiribati Togo Thailand Benin El Salvador Mexico Mongolia Sierra Leone Papua Lithuania Bulgaria Solomon New Guinea Kazakhstan Islands Nepal Kyrgyz Burundi Algeria Tanzania Vietnam Republic Russian MaldivesChina St. Lucia Peru Federation Zambia Moldova Serbia Mali Ethiopia Indonesia Mauritania Morocco Dominican KenyaRwanda Republic Cambodia Congo, Ghana Honduras Congo, Cote Rep. d'ivoire Dem. Rep. Guatemala Botswana Azerbaijan Malaysia Uganda Philippines Gambia, Paraguay The VanuatuAngola Senegal Jamaica Central African Republic Egypt, Yemen, Arab Rep. Rep. Fiji Sao Tome India and Principe Cabo Verde Guinea-Bissau Lao Madagascar PDRCameroon Ukraine Pakistan Bhutan Swaziland Haiti Bangladesh Sri Lanka Belarus Tonga Albania Timor-Leste Panama South Africa Nigeria Palma
32 For PIT: The Adapted Kakwani Score T.1A log TopRateTax LowestRateTax TopTaxRate ld TopThreshold LowestThreshold MinThresho Term measures rate of change of the tax rate as income levels increase Threshold measured as a ratio of GDP/capita ThresholdLCU TaxThreshold GDPperCap MIN Threshold ($) MIN Threshold ratio MIN Tax rate MAX Threshold ($) MAX Threshold ratio MAX Tax rate Country X 10, % 100, % Country Y 50, % 200, % DIFF rates (%) DIFF thresholds KAKWANI KAKWANI.2 KAKWANI.3 RESCALED Country X % Country Y %
33 Measuring inequality outcomes (SDG 10) Sharedprosperity incomesofpoorest 40% incomesofmean 1

34 Measuring policies in law


35 Measuring policies in practice

36 Increasing available data on spending
37 Social protection spending can boost the incomes of the poorest What is social protection? the public actions taken in response to levels of vulnerability, risk and deprivation which are deemed socially unacceptable within a given polity or society. ODI, (2001), SOCIAL PROTECTION CONCEPTS AND APPROACHES: IMPLICATIONS FOR POLICY AND PRACTICE IN INTERNATIONAL DEVELOPMENT What s included in social protection spending? In the EU-28 in 2015, expenditure on social protection stood at 19.2 % of GDP, 40.6 % of total expenditure. 'old age' = 10.3 % of GDP (pension payments) 'survivors = 1.4 % of GDP (social benefits in cash or in kind) 'Sickness and disability = 2.8 % of GDP (social payments in the operation of social insurance schemes) 'family and children' = 1.7 % of GDP, 'unemployment' = 1.4 % of GDP 'Housing' = 0.5 % of GDP (payments to households to help with the cost of housing as well as of social housing schemes) EUROSTAT, Social protection and inequality In OECD countries, social protection schemes tend to be much larger and have been shown to reduce inequality by as much as 30%. OECD, 2011, In It Together
.")
38 The type of social protection, health and education spending matters Impact of social spending can be limited if not well targeted Bolivia spends five times more than Peru, but because funds are not targeted to the poor, the amount of redistribution is limited and only slightly higher than Peru. N. Lustig et al. (2011). Fiscal Policy and Income Redistribution in Latin America: Challenging the Conventional Wisdom. Tulane University Working Paper Sindh education budget 2017/2018.
39 Incidence of social spending CEQ Analysis: Social spending as % GDP vs redistributive effect Source: CEQ study on Uganday, November XR.pdf
40 Tax types

41 Personal Income Tax

42 Corporate Income Tax
43 VAT

44 Tax is a powerful redistributive mechanism... depending how it is designed
45 Collect data on tax rates


46 Labour union rights

47 Multiple dimensions to fair pay and decent work

48 Women s rights and gender equality

49 Wage setting

50 3. Overall Key Findings and Messages
51 Nigeria Panama Tonga Swaziland Oman India Guinea-Bissau Jamaica Vanuatu Paraguay Gambia, The Congo, Dem. Rep. Serbia Dominican Republic Honduras St. Lucia Burundi Zambia Vietnam Mongolia Papua New Guinea Mexico Georgia Samoa Malawi Mozambique Mauritius Tunisia Namibia Uruguay Slovak Republic Hungary Czech Republic Slovenia Italy Iceland France Norway Analysis by pillar/indicator gives more detail Variation in results for different indicators and pillars for each country Labour Tax Spending 0.00
52 Findings best/worst and surprising Range of results gives us some unsurprising (?) best/worse performers Best Sweden, Worst Nigeria. But also some surprising performers Education spending in Zimbabwe highest in the world as % of budget and according to UNESCO having major impact on reducing poverty and inequality, though could do more by redistributing from tertiary to basic, and improve quality Tax policy in Sweden Swedish tax system 120 th most progressive - large cuts in PIT and CIT under various governments against Sweden s widespread image Progressive policies in Namibia and South Africa realised high level of inequality and doing a lot to fight it Countries have a range of policy tools and they use them to varying degrees based on their commitment to reducing inequality
53 Harmful Tax Practices

54 Change since 2017: Education spending

55 Change since 2017: Health spending
56 Change since 2017: Social protection spending

57 Change since 2017: Personal Income Tax

58 Change since 2017: Corporate Income Tax
Argentina Bahamas Barbados Bermuda Bolivia Brazil British Virgin Islands Canada Cayman Islands Chile
 Americas Argentina (Banking and finance; Capital markets: Debt; Capital markets: Equity; M&A; Project Bahamas (Financial and corporate) Barbados (Financial and corporate) Bermuda (Financial and corporate)
TRENDS AND MARKERS Signatories to the United Nations Convention against Transnational Organised Crime
 A F R I C A WA T C H TRENDS AND MARKERS Signatories to the United Nations Convention against Transnational Organised Crime Afghanistan Albania Algeria Andorra Angola Antigua and Barbuda Argentina Armenia
Household Debt and Business Cycles Worldwide Out-of-sample results based on IMF s new Global Debt Database
 Household Debt and Business Cycles Worldwide Out-of-sample results based on IMF s new Global Debt Database Atif Mian Princeton University and NBER Amir Sufi University of Chicago Booth School of Business
Annex Supporting international mobility: calculating salaries
 Annex 5.2 - Supporting international mobility: calculating salaries Base salary refers to a fixed amount of money paid to an Employee in return for work performed and it is determined in accordance with
INTERNATIONAL BANK FOR RECONSTRUCTION AND DEVELOPMENT BOARD OF GOVERNORS. Resolution No. 612
 INTERNATIONAL BANK FOR RECONSTRUCTION AND DEVELOPMENT BOARD OF GOVERNORS Resolution No. 612 2010 Selective Increase in Authorized Capital Stock to Enhance Voice and Participation of Developing and Transition
2 Albania Algeria , Andorra
 1 Afghanistan LDC 110 80 110 80 219 160 2 Albania 631 460 631 460 1 262 920 3 Algeria 8 628 6,290 8 615 6 280 17 243 12 570 4 Andorra 837 610 837 610 1 674 1 220 5 Angola LDC 316 230 316 230 631 460 6
GEF Evaluation Office MID-TERM REVIEW OF THE GEF RESOURCE ALLOCATION FRAMEWORK. Portfolio Analysis and Historical Allocations
 GEF Evaluation Office MID-TERM REVIEW OF THE GEF RESOURCE ALLOCATION FRAMEWORK Portfolio Analysis and Historical Allocations Statistical Annex #2 30 October 2008 Midterm Review Contents Table 1: Historical
2019 Daily Prayer for Peace Country Cycle
 2019 Daily Prayer for Peace Country Cycle Tuesday January 1, 2019 All Nations Wednesday January 2, 2019 Thailand Thursday January 3, 2019 Sudan Friday January 4, 2019 Solomon Islands Saturday January 5,
Scale of Assessment of Members' Contributions for 2008
 General Conference GC(51)/21 Date: 28 August 2007 General Distribution Original: English Fifty-first regular session Item 13 of the provisional agenda (GC(51)/1) Scale of Assessment of s' Contributions
WGI Ranking for SA8000 System
 Afghanistan not rated Highest Risk ALBANIA 47 High Risk ALGERIA 24 Highest Risk AMERICAN SAMOA 74 Lower Risk ANDORRA 91 Lower Risk ANGOLA 16 Highest Risk ANGUILLA 90 Lower Risk ANTIGUA AND BARBUDA 76 Lower
EMBARGOED UNTIL GMT 1 AUGUST
 2016 Global Breastfeeding Scorecard: Country Scores EMBARGOED UNTIL 00.01 GMT 1 AUGUST Enabling Environment Reporting Practice UN Region Country Donor Funding (USD) Per Live Birth Legal Status of the Code
SURVEY TO DETERMINE THE PERCENTAGE OF NATIONAL REVENUE REPRESENTED BY CUSTOMS DUTIES INTRODUCTION
 SURVEY TO DETERMINE THE PERCENTAGE OF NATIONAL REVENUE REPRESENTED BY CUSTOMS DUTIES INTRODUCTION This publication provides information about the share of national revenues represented by Customs duties.
Request to accept inclusive insurance P6L or EASY Pauschal
 5002001020 page 1 of 7 Request to accept inclusive insurance P6L or EASY Pauschal APPLICANT (INSURANCE POLICY HOLDER) Full company name and address WE ARE APPLYING FOR COVER PRIOR TO DELIVERY (PRE-SHIPMENT
Annual Report on Exchange Arrangements and Exchange Restrictions 2011
 Annual Report on Exchange Arrangements and Exchange Restrictions 2011 Volume 1 of 4 ISBN: 978-1-61839-226-8 Copyright 2010 International Monetary Fund International Monetary Fund, Publication Services
Supplementary Table S1 National mitigation objectives included in INDCs from Jan to Jul. 2017
 1 Supplementary Table S1 National mitigation objectives included in INDCs from Jan. 2015 to Jul. 2017 Country Submitted Date GHG Reduction Target Quantified Unconditional Conditional Asia Afghanistan Oct.,
Total Imports by Volume (Gallons per Country)
") 2/6/2018 Imports by Volume (Gallons per Country) YTD YTD Country 12/2016 12/2017 % Change 2016 2017 % Change MEXICO 50,839,282 54,169,734 6.6 % 682,281,387 712,020,884 4.4 % NETHERLANDS 10,630,799 11,037,475
2/6/2018 Imports by Volume (Gallons per Country) YTD YTD Country 12/2016 12/2017 % Change 2016 2017 % Change MEXICO 50,839,282 54,169,734 6.6 % 682,281,387 712,020,884 4.4 % NETHERLANDS 10,630,799 11,037,475
Legal Indicators for Combining work, family and personal life
 Legal Indicators for Combining work, family and personal life Country Africa Algeria 14 100% Angola 3 months 100% Mixed (if necessary, employer tops up social security) Benin 14 100% Mixed (50% Botswana
INTERNATIONAL BANK FOR RECONSTRUCTION AND DEVELOPMENT BOARD OF GOVERNORS. Resolution No General Capital Increase
 INTERNATIONAL BANK FOR RECONSTRUCTION AND DEVELOPMENT BOARD OF GOVERNORS Resolution No. 663 2018 General Capital Increase WHEREAS the Executive Directors, having considered the question of enlarging the
IBRD/IDA and Blend Countries: Per Capita Incomes, Lending Eligibility, IDA Repayment Terms
 Page 1 of 7 Note: This OP 3.10, Annex D replaces the version dated September 2013. The revised terms are effective for all loans that are approved on or after July 1, 2014. IBRD/IDA and Blend Countries:
MAXIMUM MONTHLY STIPEND RATES FOR FELLOWS AND SCHOLARS. Afghanistan $135 $608 $911 1 March Albania $144 $2,268 $3,402 1 January 2005
 MAXIMUM MONTHLY STIPEND RATES FOR FELLOWS AND SCHOLARS (IN U.S. DOLLARS FOR COST ESTIMATE) COUNTRY DSA(US$) MAX RES RATE MAX TRV RATE EFFECTIVE DATE OF % Afghanistan $135 $608 $911 1 March 1989 Albania
Country Documentation Finder
 Country Shipper s Export Declaration Commercial Invoice Country Documentation Finder Customs Consular Invoice Certificate of Origin Bill of Lading Insurance Certificate Packing List Import License Afghanistan
Total Imports by Volume (Gallons per Country)
") 10/5/2017 Imports by Volume (Gallons per Country) YTD YTD Country 08/2016 08/2017 % Change 2016 2017 % Change MEXICO 51,349,849 67,180,788 30.8 % 475,806,632 503,129,061 5.7 % NETHERLANDS 12,756,776 12,954,789
10/5/2017 Imports by Volume (Gallons per Country) YTD YTD Country 08/2016 08/2017 % Change 2016 2017 % Change MEXICO 51,349,849 67,180,788 30.8 % 475,806,632 503,129,061 5.7 % NETHERLANDS 12,756,776 12,954,789
IBRD/IDA and Blend Countries: Per Capita Incomes, Lending Eligibility, and Repayment Terms
 Page 1 of 7 (Updated ) Note: This OP 3.10, Annex D replaces the version dated March 2013. The revised terms are effective for all loans for which invitations to negotiate are issued on or after July 1,
Total Imports by Volume (Gallons per Country)
") 1/5/2018 Imports by Volume (Gallons per Country) YTD YTD Country 11/2016 11/2017 % Change 2016 2017 % Change MEXICO 50,994,409 48,959,909 (4.0)% 631,442,105 657,851,150 4.2 % NETHERLANDS 9,378,351 11,903,919
1/5/2018 Imports by Volume (Gallons per Country) YTD YTD Country 11/2016 11/2017 % Change 2016 2017 % Change MEXICO 50,994,409 48,959,909 (4.0)% 631,442,105 657,851,150 4.2 % NETHERLANDS 9,378,351 11,903,919
ANNEX 2: Methodology and data of the Starting a Foreign Investment indicators
 ANNEX 2: Methodology and data of the Starting a Foreign Investment indicators Methodology The Starting a Foreign Investment indicators quantify several aspects of business establishment regimes important
COUNTRY DSA(US$) MAX RES RATE MAX TRV RATE EFFECTIVE DATE OF %
 MAX RES RATE MAX TRV RATE EFFECTIVE DATE OF %") MAXIMUM MONTHLY STIPEND RATES FOR FELLOWS AND SCHOLARS IN U.S. DOLLARS FOR COST ESTIMATE COUNTRY DSA(US$) MAX RES RATE MAX TRV RATE EFFECTIVE DATE OF % Afghanistan $165 $1,733 $2,599 1 August 2007 Albania
MAXIMUM MONTHLY STIPEND RATES FOR FELLOWS AND SCHOLARS IN U.S. DOLLARS FOR COST ESTIMATE COUNTRY DSA(US$) MAX RES RATE MAX TRV RATE EFFECTIVE DATE OF % Afghanistan $165 $1,733 $2,599 1 August 2007 Albania
Total Imports by Volume (Gallons per Country)
") 11/2/2018 Imports by Volume (Gallons per Country) YTD YTD Country 09/2017 09/2018 % Change 2017 2018 % Change MEXICO 49,299,573 57,635,840 16.9 % 552,428,635 601,679,687 8.9 % NETHERLANDS 11,656,759 13,024,144
11/2/2018 Imports by Volume (Gallons per Country) YTD YTD Country 09/2017 09/2018 % Change 2017 2018 % Change MEXICO 49,299,573 57,635,840 16.9 % 552,428,635 601,679,687 8.9 % NETHERLANDS 11,656,759 13,024,144
Total Imports by Volume (Gallons per Country)
") 10/5/2018 Imports by Volume (Gallons per Country) YTD YTD Country 08/2017 08/2018 % Change 2017 2018 % Change MEXICO 67,180,788 71,483,563 6.4 % 503,129,061 544,043,847 8.1 % NETHERLANDS 12,954,789 12,582,508
10/5/2018 Imports by Volume (Gallons per Country) YTD YTD Country 08/2017 08/2018 % Change 2017 2018 % Change MEXICO 67,180,788 71,483,563 6.4 % 503,129,061 544,043,847 8.1 % NETHERLANDS 12,954,789 12,582,508
The Changing Wealth of Nations 2018
 The Changing Wealth of Nations 2018 Building a Sustainable Future Editors: Glenn-Marie Lange Quentin Wodon Kevin Carey Wealth accounts available for 141 countries, 1995 to 2014 Market exchange rates Human
Total Imports by Volume (Gallons per Country)
") 12/6/2018 Imports by Volume (Gallons per Country) YTD YTD Country 10/2017 10/2018 % Change 2017 2018 % Change MEXICO 56,462,606 60,951,402 8.0 % 608,891,240 662,631,088 8.8 % NETHERLANDS 11,381,432 10,220,226
12/6/2018 Imports by Volume (Gallons per Country) YTD YTD Country 10/2017 10/2018 % Change 2017 2018 % Change MEXICO 56,462,606 60,951,402 8.0 % 608,891,240 662,631,088 8.8 % NETHERLANDS 11,381,432 10,220,226
Total Imports by Volume (Gallons per Country)
") 3/6/2019 Imports by Volume (Gallons per Country) YTD YTD Country 12/2017 12/2018 % Change 2017 2018 % Change MEXICO 54,169,734 56,505,154 4.3 % 712,020,884 773,421,634 8.6 % NETHERLANDS 11,037,475 8,403,018
3/6/2019 Imports by Volume (Gallons per Country) YTD YTD Country 12/2017 12/2018 % Change 2017 2018 % Change MEXICO 54,169,734 56,505,154 4.3 % 712,020,884 773,421,634 8.6 % NETHERLANDS 11,037,475 8,403,018
Total Imports by Volume (Gallons per Country)
") 2/6/2019 Imports by Volume (Gallons per Country) YTD YTD Country 11/2017 11/2018 % Change 2017 2018 % Change MEXICO 48,959,909 54,285,392 10.9 % 657,851,150 716,916,480 9.0 % NETHERLANDS 11,903,919 10,024,814
2/6/2019 Imports by Volume (Gallons per Country) YTD YTD Country 11/2017 11/2018 % Change 2017 2018 % Change MEXICO 48,959,909 54,285,392 10.9 % 657,851,150 716,916,480 9.0 % NETHERLANDS 11,903,919 10,024,814
The Budget of the International Treaty. Financial Report The Core Administrative Budget
 The Budget of the International Treaty Financial Report 2016 The Core Administrative Budget Including statements of amounts due and received for The Working Capital Reserve and The Third Party Beneficiary
COUNTRY DSA(US$) MAX RES RATE MAX TRV RATE EFFECTIVE DATE OF %
 MAX RES RATE MAX TRV RATE EFFECTIVE DATE OF %") Effective 1 July 2012 Page 1 MAXIMUM MONTHLY STIPEND RATES FOR FELLOWS AND SCHOLARS IN U.S. DOLLARS FOR COST ESTIMATE COUNTRY DSA(US$) MAX RES RATE MAX TRV RATE EFFECTIVE DATE OF % * Afghanistan $188 $1,974
Effective 1 July 2012 Page 1 MAXIMUM MONTHLY STIPEND RATES FOR FELLOWS AND SCHOLARS IN U.S. DOLLARS FOR COST ESTIMATE COUNTRY DSA(US$) MAX RES RATE MAX TRV RATE EFFECTIVE DATE OF % * Afghanistan $188 $1,974
The cost of closing national social protection gaps
 The cost of closing national social protection gaps Michael Cichon Graduate School of Governance, UNU Maastricht International Council on Social Welfare (ICSW) Expert Group meeting, Report on the World
The Concept of Middle Income Countries through a Health Lens
 The Concept of Middle Income Countries through a Health Lens INNOVATION AND ACCESS TO MEDICAL TECHNOLOGIES 5 November 2014 David B Evans Director, Health Systems Governance and Financing World Health Organization,
Dutch tax treaty overview Q3, 2012
 Dutch tax treaty overview Q3, 2012 Hendrik van Duijn DTS Duijn's Tax Solutions Zuidplein 36 (WTC Tower H) 1077 XV Amsterdam The Netherlands T +31 888 387 669 T +31 888 DTS NOW F +31 88 8 387 601 duijn@duijntax.com
WILLIAMS MULLEN. U.S. Trade Preference Programs & Trade Agreements
 WILLIAMS MULLEN U.S. Trade Preference Programs & Trade The attached listing reflects the status of special U.S. trade programs or free trade agreements ("FTA") between the U.S. and identified countries
Total Imports by Volume (Gallons per Country)
") 7/6/2018 Imports by Volume (Gallons per Country) YTD YTD Country 05/2017 05/2018 % Change 2017 2018 % Change MEXICO 71,166,360 74,896,922 5.2 % 302,626,505 328,397,135 8.5 % NETHERLANDS 12,039,171 13,341,929
7/6/2018 Imports by Volume (Gallons per Country) YTD YTD Country 05/2017 05/2018 % Change 2017 2018 % Change MEXICO 71,166,360 74,896,922 5.2 % 302,626,505 328,397,135 8.5 % NETHERLANDS 12,039,171 13,341,929
COUNTRY DSA(US$) MAX RES RATE MAX TRV RATE EFFECTIVE DATE OF %
 MAX RES RATE MAX TRV RATE EFFECTIVE DATE OF %") MAXIMUM MONTHLY STIPEND RATES FOR FELLOWS AND SCHOLARS IN U.S. DOLLARS FOR COST ESTIMATE COUNTRY DSA(US$) MAX RES RATE MAX TRV RATE EFFECTIVE DATE OF % Afghanistan $135 $608 $911 1 March 1989 Albania $166
MAXIMUM MONTHLY STIPEND RATES FOR FELLOWS AND SCHOLARS IN U.S. DOLLARS FOR COST ESTIMATE COUNTRY DSA(US$) MAX RES RATE MAX TRV RATE EFFECTIVE DATE OF % Afghanistan $135 $608 $911 1 March 1989 Albania $166
INTERNATIONAL CONVENTION ON STANDARDS OF TRAINING, CERTIFICATION AND WATCHKEEPING FOR SEAFARERS (STCW), 1978, AS AMENDED
, 1978, AS AMENDED") E 4 ALBERT EMBANKMENT LONDON SE1 7SR Telephone: +44 (0)20 7735 711 Fax: +44 (0)20 7587 3210 1 January 2019 INTERNATIONAL CONVENTION ON STANDARDS OF TRAINING, CERTIFICATION AND WATCHKEEPING FOR SEAFARERS
E 4 ALBERT EMBANKMENT LONDON SE1 7SR Telephone: +44 (0)20 7735 711 Fax: +44 (0)20 7587 3210 1 January 2019 INTERNATIONAL CONVENTION ON STANDARDS OF TRAINING, CERTIFICATION AND WATCHKEEPING FOR SEAFARERS
Memoranda of Understanding
 UNEP/CMS/Inf.10.4 Parties to the CONVENTION ON THE CONSERVATION OF MIGRATORY SPECIES OF WILD ANIMALS and its Agreements as at 1 November 2011 Legend CMS Party n = shows the chronological order of the Parties
Hoi Wai Cheng, Dawn Holland, Ingo Pitterle
 Hoi Wai Cheng, Dawn Holland, Ingo Pitterle United Nations, GEMU/DPAD/DESA Project LINK Meeting 21-23 October 2015, New York Demand-side role Direct impact on the price level and terms of trade Secondary
COUNCIL. Hundred and Fifty-sixth Session. Rome, April Status of Current Assessments and Arrears as at 17 April 2017.
 April 2017 CL 156/LIM/2 Rev.1 E COUNCIL Hundred and Fifty-sixth Session Rome, 24-28 April 2017 Status of Current Assessments and Arrears as at 17 April 2017 Executive summary The document presents the
Report to Donors Sponsored Delegates to the 12th Conference of the Parties Punta del Este, Uruguay 1-9 June 2015
 Report to Donors Sponsored Delegates to the 12th Conference of the Parties Punta dell Este, Uruguay 1-9 June 2015 1 Contents Details of sponsorship Table 1. Fundraising (income from donors) Table 2. Sponsored
International trade transparency: the issue in the World Trade Organization
 Magalhães 11 International trade transparency: the issue in the World Trade Organization João Magalhães Introduction I was asked to participate in the discussion on international trade transparency with
Afghanistan $135 $608 $911 1 March Albania $144 $2,268 $3,402 1 January Angola $286 $5,148 $7,722 1 January 2003
 MAXIMUM MONTHLY STIPEND RATES FOR FELLOWS AND SCHOLARS (IN U.S. DOLLARS FOR COST ESTIMATE) COUNTRY DSA(US$) MAX RES RATE MAX TRV RATE EFFECTIVE DATE OF % Afghanistan $135 $608 $911 1 March 1989 Albania
Long Association List of Jurisdictions Surveyed for Which a Response Has Been Received
 Agenda Item 7-B Long Association List of Jurisdictions Surveed for Which a Has Been Received Jurisdictions Region IFAC Largest 29 G10 G20 EU/EEA IOSCO IFIAR Surve Abu Dhabi Member (UAE) Albania Member
Figure 1. Exposed Countries
 The Global Economic Crisis: Assessing Vulnerability with a Poverty Lens 1 Almost all developed and developing countries are suffering from the global economic crisis. While developed countries are experiencing
Afghanistan $135 $608 $911 1 March Albania $144 $2,268 $3,402 1 January Algeria $208 $624 $936 1 March 1990
 MAXIMUM MONTHLY STIPEND RATES FOR FELLOWS AND SCHOLARS (IN U.S. DOLLARS FOR COST ESTIMATE) COUNTRY DSA(US$) MAX RES RATE MAX TRV RATE EFFECTIVE DATE OF % Afghanistan $135 $608 $911 1 March 1989 Albania
COUNTRY DSA(US$) MAX RES RATE MAX TRV RATE EFFECTIVE DATE OF %
 MAX RES RATE MAX TRV RATE EFFECTIVE DATE OF %") MAXIMUM MONTHLY STIPEND RATES FOR FELLOWS AND SCHOLARS IN U.S. DOLLARS FOR COST ESTIMATE COUNTRY DSA(US$) MAX RES RATE MAX TRV RATE EFFECTIVE DATE OF % Afghanistan $158 $1,659 $2,489 1 August 2007 Albania
MAXIMUM MONTHLY STIPEND RATES FOR FELLOWS AND SCHOLARS IN U.S. DOLLARS FOR COST ESTIMATE COUNTRY DSA(US$) MAX RES RATE MAX TRV RATE EFFECTIVE DATE OF % Afghanistan $158 $1,659 $2,489 1 August 2007 Albania
Fernanda Ruiz Nuñez Senior Economist Infrastructure, PPPs and Guarantees Group The World Bank
 Fernanda Ruiz Nuñez Senior Economist Infrastructure, PPPs and Guarantees Group The World Bank Mikel Tejada Consultant. Topic Leader Procuring Infrastructure PPPs The World Bank 2018 ICGFM 32nd Annual International
Why Corrupt Governments May Receive More Foreign Aid
 Why Corrupt Governments May Receive More Foreign Aid David de la Croix Clara Delavallade Online Appendix Appendix A - Extension with Productive Government Spending The time resource constraint is 1 = l
ANNEX 2. The following 2016 per capita income guidelines apply for operational purposes:
 ANNEX 2 IBRD/IDA and Blend Countries: Per Capita s, Eligibility, and Repayment Terms The financing terms below are effective for all IBRD loans and IDA Financing that are approved by the Executive Directors
ide: FRANCE Appendix A Countries with Double Taxation Agreement with France
 Fiscal operational guide: FRANCE ide: FRANCE Appendix A Countries with Double Taxation Agreement with France Albania Algeria Argentina Armenia 2006 2006 From 1 March 1981 2002 1 1 1 All persons 1 Legal
Total Imports by Volume (Gallons per Country)
") 6/6/2018 Imports by Volume (Gallons per Country) YTD YTD Country 04/2017 04/2018 % Change 2017 2018 % Change MEXICO 60,968,190 71,994,646 18.1 % 231,460,145 253,500,213 9.5 % NETHERLANDS 13,307,731 10,001,693
6/6/2018 Imports by Volume (Gallons per Country) YTD YTD Country 04/2017 04/2018 % Change 2017 2018 % Change MEXICO 60,968,190 71,994,646 18.1 % 231,460,145 253,500,213 9.5 % NETHERLANDS 13,307,731 10,001,693
ANNEX. to the. Report from the Commission to the European Parliament and the Council
 EUROPEAN COMMISSION Brussels, 29.11.2017 COM(2017) 699 final ANNEXES 1 to 3 ANNEX to the Report from the Commission to the European Parliament and the Council on data pertaining to the budgetary impact
Kentucky Cabinet for Economic Development Office of Workforce, Community Development, and Research
 Table 2 Kentucky s Exports to the World -- Inclusive of Year to Date () Values in $ Thousands 2016 Year to Date Total All Countries $ 29,201,010 $ 30,857,275 5.7% $ 20,030,998 $ 20,925,509 4.5% Canada
Chart 1 summarizes the status with respect to assessments as of 30 September 2016 and 30 September 2017.
 Check against delivery Financial situation of the United Nations Statement by Jan Beagle, Under-Secretary-General for Management Fifth Committee of the General Assembly at its 72 nd session 6 October 2017
Withholding Tax Rates 2014*
 Withholding Tax Rates 2014* (Rates are current as of 1 March 2014) Jurisdiction Dividends Interest Royalties Notes Afghanistan 20% 20% 20% International Tax Albania 10% 10% 10% Algeria 15% 10% 24% Andorra
Dutch tax treaty overview Q4, 2013
 Dutch tax treaty overview Q4, 2013 Hendrik van Duijn DTS Duijn's Tax Solutions Zuidplein 36 (WTC Tower H) 1077 XV Amsterdam The Netherlands T +31 888 387 669 T +31 888 DTS NOW F +31 88 8 387 601 duijn@duijntax.com
STATISTICS ON EXTERNAL INDEBTEDNESS
 ORGANISATION FOR ECONOMIC CO-OPERATION AND DEVELOPMENT PARIS BANK FOR INTERNATIONAL SETTLEMENTS BASLE STATISTICS ON EXTERNAL INDEBTEDNESS Bank and trade-related non-bank external claims on individual borrowing
Senior Leadership Programme (SLP) CATA Commonwealth Association of Tax Administrators
 CATA Commonwealth Association of Tax Administrators") Senior Leadership Programme (SLP) CATA Commonwealth Association of Tax Administrators Prospectus 2018 Senior Leadership Programme The Senior Leadership Programme (SLP) is designed to equip senior tax officials
Senior Leadership Programme (SLP) CATA Commonwealth Association of Tax Administrators Prospectus 2018 Senior Leadership Programme The Senior Leadership Programme (SLP) is designed to equip senior tax officials
EXECUTION OF THE CMS BUDGET (Prepared by the Secretariat)
") CONVENTION ON MIGRATORY SPECIES TENTH MEETING OF THE CONFERENCE OF THE PARTIES Bergen, 20-25 November Agenda Item 22a CMS Distribution: General UNEP/CMS/Conf.18a 30 September Original: English EXECUTION
CONVENTION ON MIGRATORY SPECIES TENTH MEETING OF THE CONFERENCE OF THE PARTIES Bergen, 20-25 November Agenda Item 22a CMS Distribution: General UNEP/CMS/Conf.18a 30 September Original: English EXECUTION
1.1 LIST OF DAILY MAXIMUM AMOUNT PER COUNTRY WHICH IS DEEMED TO BEEN EXPENDED
 1 SUBSISTENCE ALLOWANCE FOREIGN TRAVEL 1.1 LIST OF DAILY MAXIMUM AMOUNT PER COUNTRY WHICH IS DEEMED TO BEEN EXPENDED Albania Euro 97 Algeria Euro 161 Angola US $ 312 Antigua and Barbuda US $ 220 Argentina
INTERNATIONAL CONVENTION ON STANDARDS OF TRAINING, CERTIFICATION AND WATCHKEEPING FOR SEAFARERS (STCW), 1978, AS AMENDED
, 1978, AS AMENDED") E 4 ALBERT EMBANKMENT LONDON SE 7SR Telephone: +44 (0)20 7735 76 Fax: +44 (0)20 7587 320 MSC./Circ.64/Rev.5 7 June 205 INTERNATIONAL CONVENTION ON STANDARDS OF TRAINING, CERTIFICATION AND WATCHKEEPING
E 4 ALBERT EMBANKMENT LONDON SE 7SR Telephone: +44 (0)20 7735 76 Fax: +44 (0)20 7587 320 MSC./Circ.64/Rev.5 7 June 205 INTERNATIONAL CONVENTION ON STANDARDS OF TRAINING, CERTIFICATION AND WATCHKEEPING
( Euro) Annual & Monthly Premium Rates. International Healthcare Plan. Geographic Areas. (effective 1st July 2007) Premium Discount
 Annual & Monthly Premium Rates. International Healthcare Plan. Geographic Areas. (effective 1st July 2007) Premium Discount") Annual & Monthly Premium Rates International Healthcare Plan (effective 1st July 2007) ( Euro) This schedule contains information on Your premiums for the International Healthcare Plan in Euros. Simply
Annual & Monthly Premium Rates International Healthcare Plan (effective 1st July 2007) ( Euro) This schedule contains information on Your premiums for the International Healthcare Plan in Euros. Simply
Total Imports by Volume (Gallons per Country)
") 5/4/2016 Imports by Volume (Gallons per Country) YTD YTD Country 03/2015 03/2016 % Change 2015 2016 % Change MEXICO 53,821,885 60,813,992 13.0 % 143,313,133 167,568,280 16.9 % NETHERLANDS 11,031,990 12,362,256
5/4/2016 Imports by Volume (Gallons per Country) YTD YTD Country 03/2015 03/2016 % Change 2015 2016 % Change MEXICO 53,821,885 60,813,992 13.0 % 143,313,133 167,568,280 16.9 % NETHERLANDS 11,031,990 12,362,256
World Development Indicators
 : Afghanistan Albania Algeria American Samoa Andorra Angola Antigua and Barbuda Argentina Armenia Aruba Australia Austria Azerbaijan Bahamas, The Bahrain Bangladesh Barbados Belarus Belgium Belize Benin
IMPENDING CHANGES. Subsistence Allowances
 IMPENDING CHANGES Subsistence Allowances This document serves to keep stakeholders informed of impending changes regarding the amount of a subsistence allowance deemed to have been expended in terms of
Resolution adopted by the General Assembly on 24 December [on the report of the Fifth Committee (A/67/502/Add.1)]
![Resolution adopted by the General Assembly on 24 December [on the report of the Fifth Committee (A/67/502/Add.1)]](/thumbs/94/119685248.jpg "Resolution adopted by the General Assembly on 24 December [on the report of the Fifth Committee (A/67/502/Add.1)]") United Nations General Assembly Distr.: General 11 February 2013 Sixty-seventh session Agenda item 134 Resolution adopted by the General Assembly on 24 December 2012 [on the report of the Fifth Committee
United Nations General Assembly Distr.: General 11 February 2013 Sixty-seventh session Agenda item 134 Resolution adopted by the General Assembly on 24 December 2012 [on the report of the Fifth Committee
Trends, like horses, are easier to ride in the direction they are going
 2050 Hindsight. Trends, like horses, are easier to ride in the direction they are going - John Naisbitt, Megatrends, 1982 CFA Society San Diego Lawrence Speidell Chief Investment Officer, CEO Frontier
Countries with Double Taxation Agreements with the UK rates of withholding tax for the year ended 5 April 2012
 Countries with Double Taxation Agreements with the UK rates of withholding tax for the year ended 5 April 2012 This table shows the maximum rates of tax those countries with a Double Taxation Agreement
Total Imports by Volume (Gallons per Country)
") 4/5/2018 Imports by Volume (Gallons per Country) YTD YTD Country 02/2017 02/2018 % Change 2017 2018 % Change MEXICO 53,961,589 55,268,981 2.4 % 108,197,008 114,206,836 5.6 % NETHERLANDS 12,804,152 11,235,029
4/5/2018 Imports by Volume (Gallons per Country) YTD YTD Country 02/2017 02/2018 % Change 2017 2018 % Change MEXICO 53,961,589 55,268,981 2.4 % 108,197,008 114,206,836 5.6 % NETHERLANDS 12,804,152 11,235,029
Convention on the Conservation of Migratory Species of Wild Animals
 Convention on the Conservation of Migratory Species of Wild Animals 48 th Meeting of the Standing Committee Bonn, Germany, 23 24 October UNEP/CMS/StC48/Doc.9.1 IMPLEMENTATION OF THE CMS BUDGET (as at 31
Hundred and seventieth Session REPORT BY THE DIRECTOR-GENERAL ON THE STATUS OF CONTRIBUTIONS OF MEMBER STATES AND OF PAYMENT PLANS SUMMARY
 ex United Nations Educational, Scientific and Cultural Organization Executive Board Hundred and seventieth Session 170 EX/20 PARIS, 9 August 2004 Original: English Item 7.2 of the provisional agenda REPORT
The Structure, Scope, and Independence of Banking Supervision Issues and International Evidence
 The Structure, Scope, and Independence of Banking Supervision Issues and International Evidence Daniel Nolle Senior Financial Economist Office of the daniel.nolle@occ.treas.gov Presentation July 10, 2003
Note on Revisions. Investing Across Borders 2010 Report
 Note on Revisions Last revision: August 30, 2011 Investing Across Borders 2010 Report This note documents all data and revisions to the Investing Across Borders (IAB) 2010 report since its release on July
PROGRESS REPORT NATIONAL STRATEGIES FOR THE DEVELOPMENT OF STATISTICS. May 2010 NSDS SUMMARY TABLE FOR IDA AND LOWER MIDDLE INCOME COUNTRIES
 NATIONAL STRATEGIES FOR THE DEVELOPMENT OF STATISTICS PROGRESS REPORT NSDS SUMMARY TABLE FOR IDA AND LOWER MIDDLE INCOME COUNTRIES May 2010 The Partnership in for in the 21 st Century NSDS STATUS IN IDA
Today's CPI data: what you need to know
 Trend Macrolytics, LLC Donald Luskin, Chief Investment Officer Thomas Demas, Managing Director Michael Warren, Energy Strategist Data Insights: Consumer Price Index, Producer Price Index Wednesday, December
Today's CPI data: what you need to know
 Trend Macrolytics, LLC Donald Luskin, Chief Investment Officer Thomas Demas, Managing Director Michael Warren, Energy Strategist Data Insights: Consumer Price Index, Producer Price Index Wednesday, February
Institutions, Capital Flight and the Resource Curse. Ragnar Torvik Department of Economics Norwegian University of Science and Technology
 Institutions, Capital Flight and the Resource Curse Ragnar Torvik Department of Economics Norwegian University of Science and Technology The resource curse Wave 1: Case studies, Gelb (1988) The resource
Today's CPI data: what you need to know
 Trend Macrolytics, LLC Donald Luskin, Chief Investment Officer Thomas Demas, Managing Director Michael Warren, Energy Strategist Data Insights: Consumer Price Index, Producer Price Index Thursday, July
Today's CPI data: what you need to know
 Trend Macrolytics, LLC Donald Luskin, Chief Investment Officer Thomas Demas, Managing Director Michael Warren, Energy Strategist Data Insights: Consumer Price Index, Producer Price Index Friday, January
ANNEX 2. The applicable maturity premiums for pricing groups A, B, C and D are set forth in Tables 2, 3, 4 and 5 below, respectively
 ANNEX 2 IBRD/IDA and Blend Countries: Per Capita,, Premiums, and Repayment Terms The financing terms below are effective for all IBRD loans and IDA Financings that are approved by the Board on or after
Premium rates ($) Aetna International Healthcare Plan
 Aetna International Healthcare Plan") Premium rates ($) Aetna International Healthcare Plan www.mitraaca.com Effective 1 st October 2015 This schedule contains information on your premiums for the International Healthcare Plan in US$ Dollars.
Premium rates ($) Aetna International Healthcare Plan www.mitraaca.com Effective 1 st October 2015 This schedule contains information on your premiums for the International Healthcare Plan in US$ Dollars.
Today's CPI data: what you need to know
 Trend Macrolytics, LLC Donald Luskin, Chief Investment Officer Thomas Demas, Managing Director Michael Warren, Energy Strategist Data Insights: Consumer Price Index, Producer Price Index Wednesday, April
Appendix II. Appendix Table II.1. Arrangements approved during financial years ended April 30, Amounts committed under arrangements 1
 Appendix II Appendix Table II.1 Arrangements approved during financial years ended April 30, 2006 2015 Amounts committed under arrangements 1 Number of arrangements (In millions of SDRs) GRA GRA Financial
Today's CPI data: what you need to know
 Trend Macrolytics, LLC Donald Luskin, Chief Investment Officer Thomas Demas, Managing Director Michael Warren, Energy Strategist Data Insights: Consumer Price Index, Producer Price Index Friday, August
Today's CPI data: what you need to know
 Trend Macrolytics, LLC Donald Luskin, Chief Investment Officer Thomas Demas, Managing Director Michael Warren, Energy Strategist Data Insights: Consumer Price Index, Producer Price Index Friday, October
Today's CPI data: what you need to know
 Trend Macrolytics, LLC Donald Luskin, Chief Investment Officer Thomas Demas, Managing Director Michael Warren, Energy Strategist Data Insights: Consumer Price Index, Producer Price Index Wednesday, November
SHARE IN OUR FUTURE AN ADVENTURE IN EMPLOYEE STOCK OWNERSHIP DEBBI MARCUS, UNILEVER
 SHARE IN OUR FUTURE AN ADVENTURE IN EMPLOYEE STOCK OWNERSHIP DEBBI MARCUS, UNILEVER DEBBI.MARCUS@UNILEVER.COM RUTGERS SCHOOL OF MANAGEMENT AND LABOR RELATIONS NJ/NY CENTER FOR EMPLOYEE OWNERSHIP AGENDA
Total Imports by Volume (Gallons per Country)
") 3/7/2018 Imports by Volume (Gallons per Country) YTD YTD Country 01/2017 01/2018 % Change 2017 2018 % Change MEXICO 54,235,419 58,937,856 8.7 % 54,235,419 58,937,856 8.7 % NETHERLANDS 12,265,935 10,356,183
3/7/2018 Imports by Volume (Gallons per Country) YTD YTD Country 01/2017 01/2018 % Change 2017 2018 % Change MEXICO 54,235,419 58,937,856 8.7 % 54,235,419 58,937,856 8.7 % NETHERLANDS 12,265,935 10,356,183
Index of Financial Inclusion. (A concept note)
") Index of Financial Inclusion (A concept note) Mandira Sarma Indian Council for Research on International Economic Relations Core 6A, 4th Floor, India Habitat Centre, Delhi 100003 Email: mandira@icrier.res.in
Index of Financial Inclusion (A concept note) Mandira Sarma Indian Council for Research on International Economic Relations Core 6A, 4th Floor, India Habitat Centre, Delhi 100003 Email: mandira@icrier.res.in
HEALTH WEALTH CAREER 2017 WORLDWIDE BENEFIT & EMPLOYMENT GUIDELINES
 HEALTH WEALTH CAREER 2017 WORLDWIDE BENEFIT & EMPLOYMENT GUIDELINES WORLDWIDE BENEFIT & EMPLOYMENT GUIDELINES AT A GLANCE GEOGRAPHY 77 COUNTRIES COVERED 5 REGIONS Americas Asia Pacific Central & Eastern
The Commodities Roller Coaster: A Fiscal Framework for Uncertain Times
 International Monetary Fund October 215 Fiscal Monitor The Commodities Roller Coaster: A Fiscal Framework for Uncertain Times Tidiane Kinda Fiscal Affairs Department Vienna, November 26, 215 The views
BERMUDA COPYRIGHT AND PERFORMANCES (APPLICATION TO OTHER COUNTRIES) ORDER 2009 BR 71/2009
 ORDER 2009 BR 71/2009") BERMUDA COUNTRIES) ORDER 2009 BR 71/2009 The Minister, in exercise of the powers conferred by sections 194 and 257 of the Copyright and Designs Act 2004, makes the following Order: Citation 1 This Order,
BERMUDA COUNTRIES) ORDER 2009 BR 71/2009 The Minister, in exercise of the powers conferred by sections 194 and 257 of the Copyright and Designs Act 2004, makes the following Order: Citation 1 This Order,
Today's CPI data: what you need to know
 Trend Macrolytics, LLC Donald Luskin, Chief Investment Officer Thomas Demas, Managing Director Michael Warren, Energy Strategist Data Insights: Consumer Price Index, Producer Price Index Friday, July 14,
OP 3.10 Annex D - IBRD/IDA and Blend Countries: Per Capita. Incomes, Lending Eligibility, and Repayment Terms, July 2016, updated December 2016
 Bank Policy OP 3.10 Annex D - IBRD/IDA and Blend Countries: Per Capita s, Eligibility, and Repayment Terms,, updated December 201 Bank Access to Information Policy Designation Public Catalogue Number OPS5.09-POL.159
TABLe A.1 Countries and Their Financial System Characteristics, Averages, Accounts per thousand adults, commercial banks
 GLOBAL financial DEVELOPMEnT REPORT 2013 statistical appendix 161 Statistical appendix TABLe A.1 Countries and Their Financial System Characteristics, Averages, 2008 2010 Private credit to Financial institutions