Trends, like horses, are easier to ride in the direction they are going
|
|
|
- Lorraine Jacobs
- 5 years ago
- Views:
Transcription
1 2050 Hindsight. Trends, like horses, are easier to ride in the direction they are going - John Naisbitt, Megatrends, 1982 CFA Society San Diego Lawrence Speidell Chief Investment Officer, CEO Frontier Market Asset Management larry@frontiermkt.com December 2013
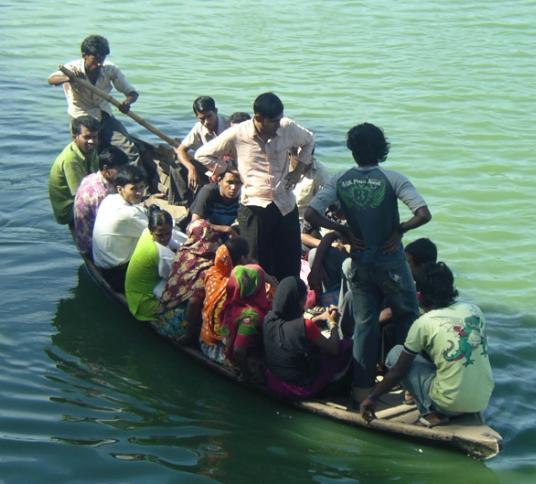
2 2 Dhaka, Bangladesh

3 3 Erbil, Iraq
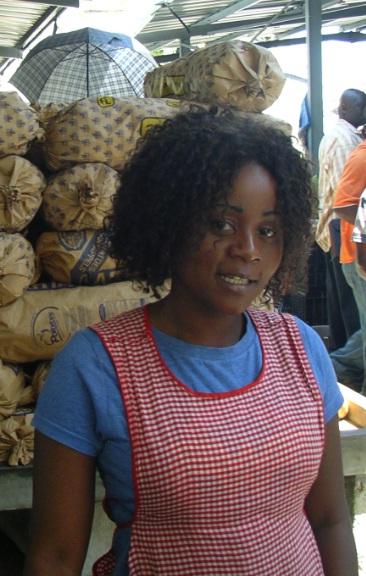
4 4 Maputo, Mozambique

5 Today s World

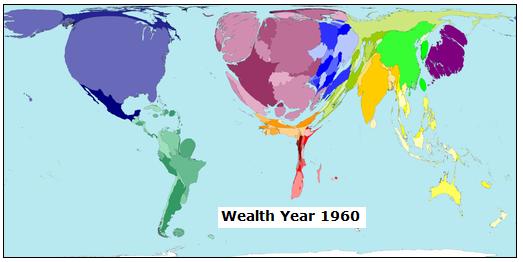
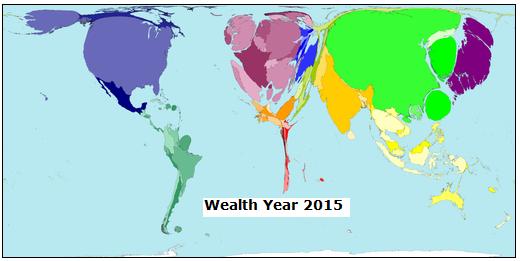
6 World Wealth

7 Today s World Source: databank.worldbank.org, world-development-indicators, WDI1205, WDI Ranks


8 GDP Growth Economic Growth in Frontier & Emerging Economies is High Source: IMF, Jan
 student teacher ratio of 46.")
9 Demographics Bangladesh: Population 150 million 81,508 primary schools 16.5 million students 361,000 teachers (43% female) student teacher ratio of 46. Photo: Frontier Market Asset Management, 2010
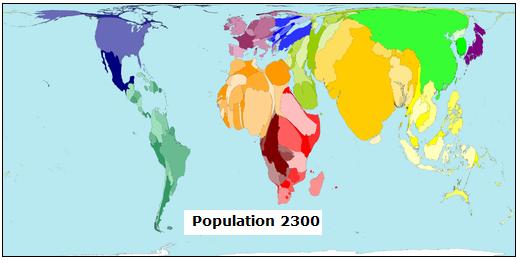
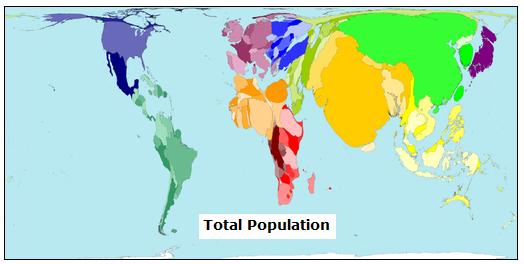
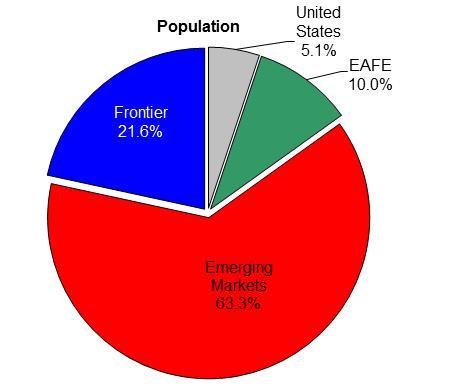
10 Population Now and 2300
11 Demographics Population Growth Rate Bulgaria % Ukraine % Belarus % Moldova % Georgia % Lithuania % Russia % Malawi % Occupied Palestine % Somalia % Benin % Tanzania % Burkina Faso % Afghanistan % Uganda % Niger % 11
12 Demographics - Favor the Developing Countries. Age > Italy Japan Germany Greece Bulgaria Romania Poland Singapore Population Demographics China Ireland Bahrain UAE Argentina Sri Lanka Vietnam Peru Pakistan Developed Markets Emerging Markets Frontier Markets Zambia Uganda Nigeria Age < 15 FrontierCountries0607 Source: World Development Indicators, 2006
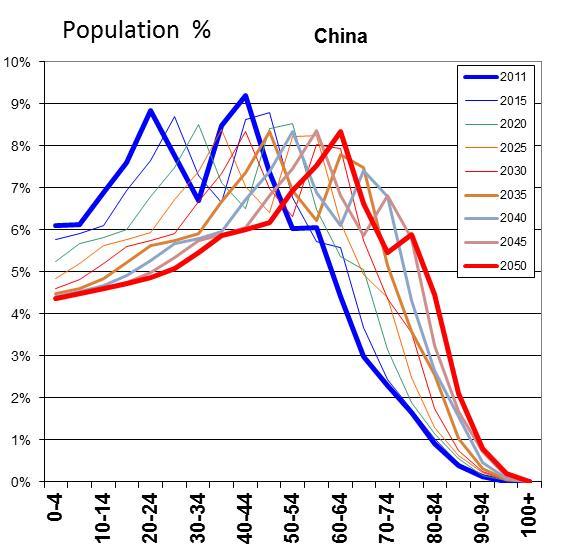
13 Demographics China versus India Today 100+ China 2011 Population 1,385, India 2011 Population (000) 1,240, Females Males Females Males (80,000) (40,000) - 40,000 80,000 Source: United Nations Population Prospects, 2009 (80,000) (40,000) - 40,000 80,000
14 Demographics China versus India in China 2050 Population 1,536, India 2050 Population 1,663, Females Males Females Males (80,000) (40,000) - 40,000 80,000 Source: United Nations Population Prospects, 2009 (80,000) (40,000) - 40,000 80,000
15 Demographics: Japan Now & Females Males Japan 2011 Population 137, Females Males Japan 2050 Population 120, (10,000) (5,000) - 5,000 10,000 (10,000) (5,000) - 5,000 10,000
16 Demographics: U.S. Now & United States of America 2011 Population 335, United States of America 2050 Population 444, Females Males Females Males (20,000) (10,000) - 10,000 20,000 (20,000) (10,000) - 10,000 20,000
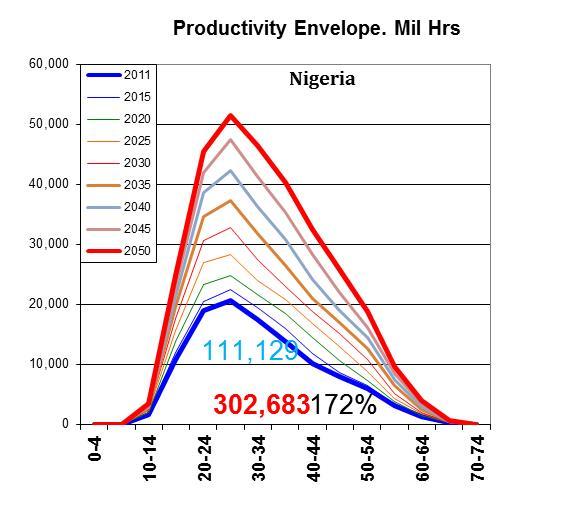
17 Demographics: Nigeria Now & Nigeria 2011 Population 162, Nigeria 2050 Population 291, Females Males Females Males (20,000) (10,000) - 10,000 20,000 (20,000) (10,000) - 10,000 20,000
18 Demographic Destiny - Productivity, Dependency & Maturity
19 Demographic Destiny - Productivity, Dependency & Maturity
20 Demographic Destiny - Productivity, Dependency & Maturity
21 Productivity Employed, Employed, Employed, Employed, 70+ United States 66% 43% 20% 5% Germany 61% 23% 3% 0% Italy 26% 12% 1% 0% Spain 46% 22% 0% 0% Cambodia 16% 1% 0% 0% Productivity Estimates Age US N. Europe S. Europe Japan China India Emerging Frontier PoorFrontier % 0% 0% 0% 0% 0% 5% 5% 20% % 10% 10% 10% 40% 40% 40% 40% 70% % 50% 50% 50% 80% 80% 80% 80% 95% % 75% 75% 75% 100% 100% 100% 100% 100% % 90% 90% 90% 100% 100% 100% 100% 100% % 100% 100% 100% 100% 100% 100% 100% 100% % 100% 100% 100% 100% 95% 95% 95% 95% % 100% 100% 100% 95% 90% 90% 90% 90% % 100% 60% 100% 90% 80% 80% 80% 50% % 80% 40% 90% 70% 50% 50% 50% 20% % 50% 10% 70% 40% 25% 25% 25% 10% % 5% 2% 20% 5% 5% 5% 5% 0% >70 5% 0% 0% 5% 0% 0% 0% 0% 0% Source: FMAM estimates, OECD 21
22 22 Productivity
23 23 Productivity
24 24 Productivity
25 25 Productivity
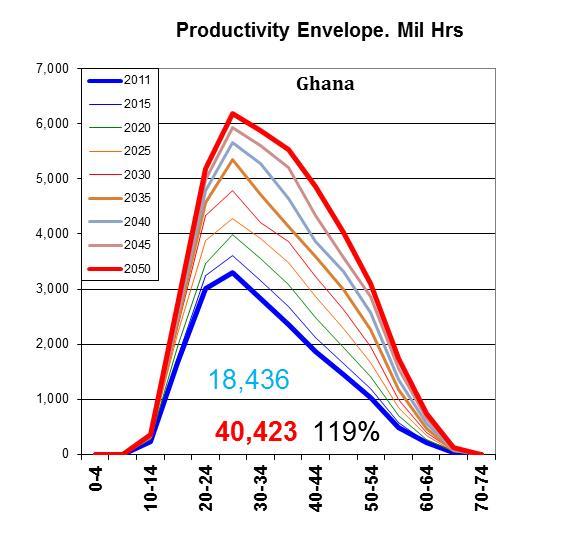
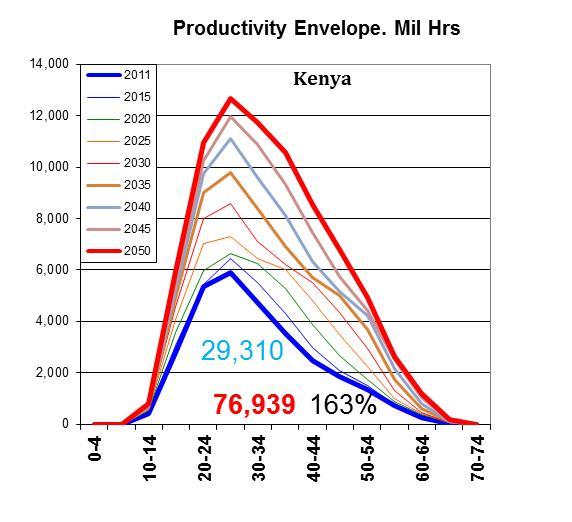
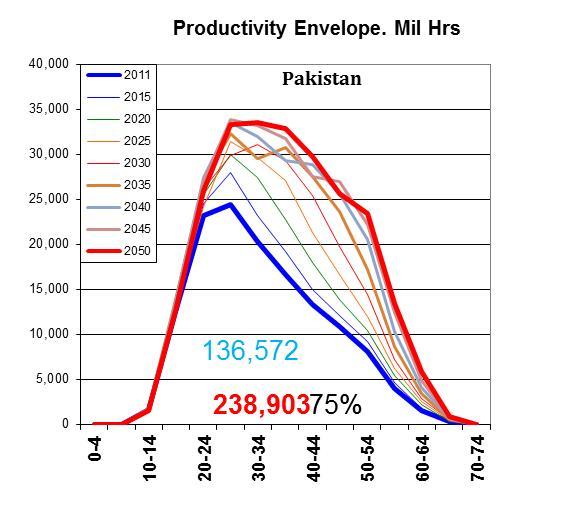
26 Productivity Population (000) Productivity Envelope. Mil Hrs % Chg % Chg Africa Malawi 15,381 49, % 9,824 35, % Africa Zambia 13,475 45, % 8,606 30, % Africa Uganda 34,509 94, % 21,379 73, % Africa Nigeria 162, , % 111, , % Africa Rwanda 10,943 26, % 7,665 20, % Africa Senegal 12,768 28, % 8,809 23, % Africa Kenya 41,610 96, % 29,310 76, % Africa Mozambique 23,930 50, % 15,957 40, % Africa Côte d'ivoire 20,153 40, % 14,097 33, % Africa Ghana 24,966 49,107 97% 18,436 40, % Africa Zimbabwe 12,754 20,614 62% 9,173 18,000 96% Asia Pakistan 176, ,875 56% 136, ,903 75% Mid East Jordan 6,330 9,882 56% 4,835 8,436 74% Lat Am Paraguay 6,568 10,323 57% 5,149 8,554 66% E Europe Romania 21,436 18,535-14% 19,067 12,787-33% E Europe Ukraine 45,190 36,074-20% 40,151 26,005-35% E Europe Georgia 4,329 3,186-26% 3,743 2,238-40% E Europe Bulgaria 7,446 5,459-27% 6,360 3,680-42% 26
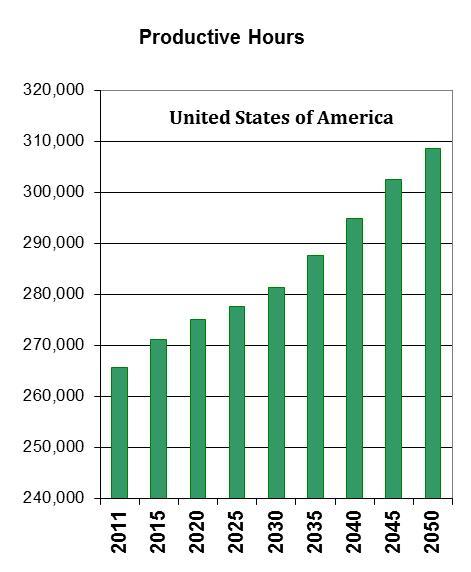
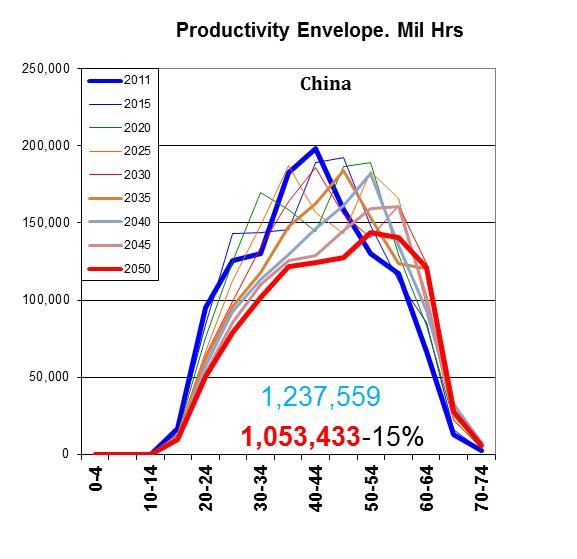
27 27 Productivity Population (000) Productivity Envelope. Mil Hrs % Chg % Chg Developed Australia 22,606 31,385 39% 18,579 22,572 21% Developed United States 313, ,101 29% 265, ,671 16% Developed Canada 34,350 43,642 27% 29,357 31,488 7% Developed United Kingdom 62,417 72,817 17% 50,440 52,614 4% Developed France 63,126 72,442 15% 50,139 50,729 1% Developed Spain 46,455 51,354 11% 40,646 33,686-17% Developed Greece 11,390 11,647 2% 9,688 7,937-18% Developed Italy 60,789 59,158-3% 50,894 38,806-24% Developed Germany 82,163 74,781-9% 68,988 49,886-28% Developed Portugal 10,690 9,379-12% 9,074 6,263-31% Developed Japan 126, ,549-14% 83,633 56,227-33% Emerging Philippines 94, ,939 63% 73, ,661 75% Emerging Israel 7,562 12,029 59% 5,861 9,057 55% Emerging Egypt 82, ,452 50% 66, ,176 53% Emerging Malaysia 28,859 43,455 51% 23,861 35,218 48% Emerging India 1,241,492 1,692,008 36% 1,065,014 1,518,598 43% Emerging Peru 29,400 38,832 32% 24,025 31,472 31% Emerging Colombia 46,927 61,764 32% 39,248 49,182 25% Emerging Mexico 114, ,925 25% 94, ,298 19% Emerging South Africa 50,460 56,757 12% 41,923 49,417 18% Emerging Turkey 73,640 91,617 24% 64,141 72,613 13% Emerging Indonesia 242, ,456 21% 212, ,784 10% Emerging Brazil 196, ,843 13% 171, ,795 0% Emerging Chile 17,270 20,059 16% 14,985 14,894-1% Emerging China 1,347,565 1,295,604-4% 1,237,559 1,053,433-15% Emerging Thailand 69,519 71,037 2% 62,701 52,168-17% Emerging Hungary 9,966 9,243-7% 8,517 6,611-22% Emerging Poland 38,299 34,906-9% 34,007 24,129-29% Emerging Russia 142, ,188-12% 130,098 91,417-30% Emerging S. Korea 48,391 47,050-3% 44,583 30,479-32%
28 Opportunity - Wages Labor Cost $/hour $/month Bangladesh $0.23 $37 India $0.51 $82 Pakistan $0.41 $66 China $1.08 $173 Source: Citi Brokerage, Competitive advantage Average monthly wages*, $ Thailand China Vietnam Source: EIU, * excluding social security Source: 28 Lockheed Corporation

29 Opportunity - Education Strathmore University, Nairobi
30 Source: Breakout Nations, Sharma, 2012 Missed Opportunity - Inequality
31

32 Opportunity - Middle Class in Africa 32 Source: The Economist, Oct 4, 2012 Bashundara City Mall, Dhaka, Bangladesh

33 Opportunity - Middle Class in Bangladesh Bashundara City Mall, Dhaka, Bangladesh 33
34 $2,000 to $12,000 is the sweet spot for consumption (Penetration of durable goods relative to annual income) $2,000 = 15,000 RMB $12,000 = 90,000 RMB

35 35 Opportunity - Middle Class Spending

36 2050 Hindsight Government
37 Veto Points Source: Veto Players, Tsebelis, 2001
38 Culture? Trust is related to income and cultural history Democracy & Trust, Mark Warren, 1999
39 World Values Survey, 2008 Culture?
40 Heritage Foundation Economic Freedom Rank BUSINESS FREEDOM Starting a business procedures (number), time (days), cost (% of income per capita), minimum capital (% of income per capita) Obtaining a license procedures (number), time (days), cost (% of income per capita) Closing a business time (years), cost (% of estate), recovery rate (cents on the dollar) TRADE FREEDOM The trade-weighted average tariff rate Non-tariff barriers: quantity restrictions, price restrictions, regulatory restrictions, investment restrictions, customs restrictions, and direct government intervention FISCAL FREEDOM The top tax rate on individual income and on corporate income Total tax revenue as a percentage of GDP GOVERNMENT SIZE Government spending % of GDP MONETARY FREEDOM The weighted average inflation rate for the most recent three years Price controls INVESTMENT FREEDOM Restrictions in sectors related to national security or real estate Expropriation risk Access to foreign exchange Restrictions on transfers or capital transactions
41 Heritage Foundation Economic Freedom Rank FINANCIAL FREEDOM Central Bank Independence Freedom of credit allocation Contract enforcement Presence of private financial institutions Foreign financial institutions not restricted PROPERTY RIGHTS Private property guaranteed by the government There is no corruption or expropriation The court system enforces contracts efficiently and quickly. The justice system punishes those who unlawfully confiscate private property CORRUPTION Transparency International s Corruption Perceptions Index (CPI) LABOR FREEDOM Ratio of minimum wage to the average value added per worker Hindrance to hiring additional workers Rigidity of hours Difficulty of firing redundant employees Legally mandated notice period


42 Economic Freedom The Heritage Foundation 42 The Heritage Foundation 2013 (Frontier Markets Blue, Emerging Green)
43 Total Scores Source: WDI Database 2013 Human Capital Investment Government Z Score Developed Singapore Frontier United Arab Emirates Developed Hong Kong Emerging China Frontier Vietnam Emerging Chile Frontier Bangladesh Developed Australia Frontier Mongolia Frontier Kazakhstan Frontier Mauritius Frontier Botswana Developed Germany Emerging India Frontier Namibia Developed Japan Frontier Ghana Developed United States Frontier Mozambique Developed France Frontier Argentina Frontier Venezuela Developed United Kingdom Emerging South Africa Emerging Brazil Frontier Tanzania Frontier Uganda Emerging Russia Frontier Rwanda Frontier Pakistan Frontier Senegal Frontier Georgia Frontier Zambia Frontier Cote d'ivoire Frontier Ukraine Developed Italy Frontier Kenya Frontier Zimbabwe Frontier Nigeria Frontier Malawi Developed Greece Frontier Moldova Frontier Swaziland
44 2050 Source: Frontier Market Asset Management, WDI Database, 2012
45 2050 Source: Frontier Market Asset Management, WDI Database, 2012

46 GDP: Now & 2050 Source: Frontier Market Asset Management, WDI Database, 2012
47 Developed in GDP pr Capita (PPP) % Chg GDP pr Capita (PPP) % Chg Developed Luxembourg $86,124 $194, % Frontier Croatia $19,330 $60, % Developed Singapore $57,932 $171, % Emerging Poland $19,885 $60, % Developed Norway $57,231 $146, % Developed Spain $32,230 $60,630 88% Developed Hong Kong $46,502 $139, % Emerging Russia $19,891 $59, % Developed Switzerland $46,384 $115, % Emerging China $7,599 $58, % Frontier UAE $47,213 $108, % Emerging Malaysia $14,731 $58, % Developed United States $47,153 $102, % Frontier Romania $14,524 $58, % Developed Sweden $39,024 $95, % Developed Italy $31,954 $57,373 80% Developed Australia $38,160 $93, % Frontier Vietnam $3,205 $55, % Developed Netherlands $42,165 $93, % Emerging Hungary $20,545 $54, % Developed Belgium $37,631 $91, % Frontier Sri Lanka $5,078 $54, % Developed Denmark $40,163 $88, % Frontier Serbia $11,349 $53, % Developed Austria $40,006 $88, % Emerging Turkey $15,687 $52, % Emerging South Korea $29,101 $87, % Frontier Tunisia $9,550 $51, % Developed Canada $39,050 $86, % Emerging Peru $9,538 $51, % Developed Germany $37,402 $82, % Frontier Lebanon $14,069 $51, % Developed Finland $36,473 $81, % Frontier Costa Rica $11,569 $50, % Developed Ireland $40,464 $77,428 91% Frontier Uruguay $14,108 $49, % Emerging Israel $28,573 $77, % Frontier Bulgaria $13,931 $49, % Developed Japan $33,733 $73, % Emerging Indonesia $4,325 $49, % Developed United Kingdom $35,686 $73, % Frontier Mongolia $4,036 $47, % Developed New Zealand $29,535 $72, % Emerging Thailand $8,554 $47, % Frontier Panama $13,608 $72, % Emerging Colombia $9,453 $46, % Frontier Slovak Republic $23,303 $69, % Frontier Georgia $5,074 $46, % Frontier Iceland $35,642 $66,570 87% Frontier Botswana $13,893 $44, % Emerging Czech Republic $24,518 $66, % Emerging Mexico $14,564 $44, % Frontier Estonia $20,663 $64, % Developed Portugal $25,416 $43,864 73% Frontier Kazakhstan $12,169 $64, % Frontier Argentina $16,012 $43, % Developed France $34,123 $63,990 88% Emerging Brazil $11,210 $42, % Frontier Slovenia $26,925 $62, % Emerging South Africa $10,565 $39, % Emerging Chile $15,779 $61, % Developed Greece $28,408 $36,791 30% Frontier Mauritius $13,697 $61, % Source: Frontier Market Asset Management, WDI Database, 2013
48 Gems and Diamonds in the Rough. GDP pr Capita (PPP) % Chg Asia Frontier Vietnam $3,205 $55, % Asia Frontier Bangladesh $1,659 $24, % Asia Frontier Mongolia $4,036 $47, % Asia Emerging Indonesia $4,325 $49, % Asia Frontier Sri Lanka $5,078 $54, % Africa Frontier Ghana $1,644 $16, % Africa Frontier Uganda $1,272 $13, % Africa Frontier Rwanda $1,163 $11, % E Europe Frontier Georgia $5,074 $46, % Africa Frontier Nigeria $2,399 $21, % Africa Frontier Malawi $882 $7, % Africa Emerging Morocco $4,712 $38, % Asia Emerging China $7,599 $58, % Africa Frontier Tanzania $1,434 $11, % Africa Frontier Zambia $1,562 $12, % LatAm Frontier Paraguay $5,181 $39, % Asia Emerging Philippines $3,969 $28, % Africa Frontier Cote d'ivoire $1,899 $13, % Asia Emerging India $3,425 $23, % LatAm Frontier Bolivia $4,849 $28, % Asia Emerging Thailand $8,554 $47, % Africa Frontier Tunisia $9,550 $51, % LaiAm Emerging Peru $9,538 $51, % LaiAm Frontier Panama $13,608 $72, % Source: Frontier Market Asset Management, WDI Database, 2012
49 Market Cap: Now & 2050 Source: Frontier Market Asset Management, WDI Database, 2012
50 Gems and Diamonds in the Rough. Source: Frontier Market Asset Management, WDI Database, 2012 Est Ann MktCap Growth Frontier Paraguay 21% Frontier Uruguay 17% Frontier Tanzania 14% Frontier Uganda 12% Frontier Costa Rica 11% Frontier Bangladesh 11% Frontier Vietnam 9% Frontier Malawi 9% Frontier Slovak Repub 9% Frontier Zambia 9% Frontier Ghana 9% Frontier Namibia 8% Frontier Nigeria 8% Frontier Georgia 8% Frontier Mongolia 8% Frontier Argentina 7% Frontier Cote d'ivoire 7% Emerging Indonesia 7% Frontier Tunisia 7% Frontier Sri Lanka 6% Emerging Philippines 6%
51 Optimism Pew Survey Life Satisfaction versus Income. % Satisfaction Series1 70 Developed USA 60 Emerging Frontier 50 Log. (Series1) Source: Pew Opinion Survey 2007, Ondine Frontier Countries $100 $1,000 $10,000 $100,000 GDP/Capita USD
52 Optimism Pew Survey Optimism versus Income Mali Bangladesh Senegal India Kenya % Optimistic Pakistan South Africa USA Source: Pew Opinion Survey 2007 $100 $1,000 $10,000 $100,000 GDP / Capita
53 Optimism Pew Survey. "Next 100 Generation Better Off" versus Income Bangladesh China % Optimistic USA Series1 Emerging Developed Frontier Italy Japan Log. (Series1) Source: Pew Opinion Survey 2007 $100 $1,000 $10,000 $100,000 GDP / Capita
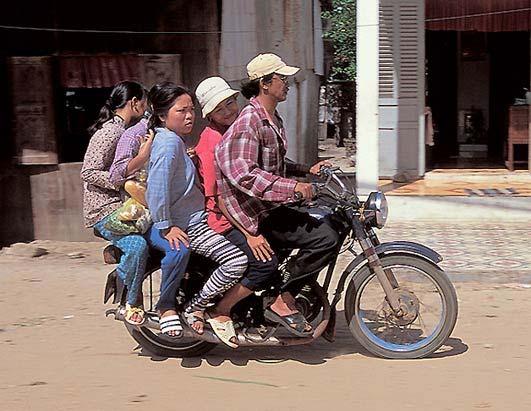
54 Optimism: Determination
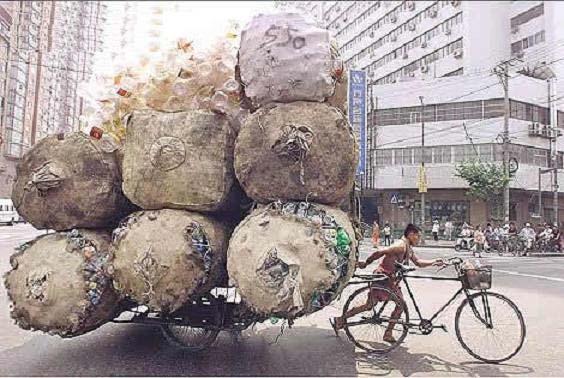
55 Optimism: Determination

56 Optimism: Determination

57
Argentina Bahamas Barbados Bermuda Bolivia Brazil British Virgin Islands Canada Cayman Islands Chile
 Americas Argentina (Banking and finance; Capital markets: Debt; Capital markets: Equity; M&A; Project Bahamas (Financial and corporate) Barbados (Financial and corporate) Bermuda (Financial and corporate)
TRENDS AND MARKERS Signatories to the United Nations Convention against Transnational Organised Crime
 A F R I C A WA T C H TRENDS AND MARKERS Signatories to the United Nations Convention against Transnational Organised Crime Afghanistan Albania Algeria Andorra Angola Antigua and Barbuda Argentina Armenia
Scale of Assessment of Members' Contributions for 2008
 General Conference GC(51)/21 Date: 28 August 2007 General Distribution Original: English Fifty-first regular session Item 13 of the provisional agenda (GC(51)/1) Scale of Assessment of s' Contributions
Dutch tax treaty overview Q3, 2012
 Dutch tax treaty overview Q3, 2012 Hendrik van Duijn DTS Duijn's Tax Solutions Zuidplein 36 (WTC Tower H) 1077 XV Amsterdam The Netherlands T +31 888 387 669 T +31 888 DTS NOW F +31 88 8 387 601 duijn@duijntax.com
Guide to Treatment of Withholding Tax Rates. January 2018
 Guide to Treatment of Withholding Tax Rates Contents 1. Introduction 1 1.1. Aims of the Guide 1 1.2. Withholding Tax Definition 1 1.3. Double Taxation Treaties 1 1.4. Information Sources 1 1.5. Guide Upkeep
SHARE IN OUR FUTURE AN ADVENTURE IN EMPLOYEE STOCK OWNERSHIP DEBBI MARCUS, UNILEVER
 SHARE IN OUR FUTURE AN ADVENTURE IN EMPLOYEE STOCK OWNERSHIP DEBBI MARCUS, UNILEVER DEBBI.MARCUS@UNILEVER.COM RUTGERS SCHOOL OF MANAGEMENT AND LABOR RELATIONS NJ/NY CENTER FOR EMPLOYEE OWNERSHIP AGENDA
Household Debt and Business Cycles Worldwide Out-of-sample results based on IMF s new Global Debt Database
 Household Debt and Business Cycles Worldwide Out-of-sample results based on IMF s new Global Debt Database Atif Mian Princeton University and NBER Amir Sufi University of Chicago Booth School of Business
Dutch tax treaty overview Q4, 2013
 Dutch tax treaty overview Q4, 2013 Hendrik van Duijn DTS Duijn's Tax Solutions Zuidplein 36 (WTC Tower H) 1077 XV Amsterdam The Netherlands T +31 888 387 669 T +31 888 DTS NOW F +31 88 8 387 601 duijn@duijntax.com
ide: FRANCE Appendix A Countries with Double Taxation Agreement with France
 Fiscal operational guide: FRANCE ide: FRANCE Appendix A Countries with Double Taxation Agreement with France Albania Algeria Argentina Armenia 2006 2006 From 1 March 1981 2002 1 1 1 All persons 1 Legal
Request to accept inclusive insurance P6L or EASY Pauschal
 5002001020 page 1 of 7 Request to accept inclusive insurance P6L or EASY Pauschal APPLICANT (INSURANCE POLICY HOLDER) Full company name and address WE ARE APPLYING FOR COVER PRIOR TO DELIVERY (PRE-SHIPMENT
Today's CPI data: what you need to know
 Trend Macrolytics, LLC Donald Luskin, Chief Investment Officer Thomas Demas, Managing Director Michael Warren, Energy Strategist Data Insights: Consumer Price Index, Producer Price Index Friday, October
Today's CPI data: what you need to know
 Trend Macrolytics, LLC Donald Luskin, Chief Investment Officer Thomas Demas, Managing Director Michael Warren, Energy Strategist Data Insights: Consumer Price Index, Producer Price Index Wednesday, November
Today's CPI data: what you need to know
 Trend Macrolytics, LLC Donald Luskin, Chief Investment Officer Thomas Demas, Managing Director Michael Warren, Energy Strategist Data Insights: Consumer Price Index, Producer Price Index Friday, July 14,
Today's CPI data: what you need to know
 Trend Macrolytics, LLC Donald Luskin, Chief Investment Officer Thomas Demas, Managing Director Michael Warren, Energy Strategist Data Insights: Consumer Price Index, Producer Price Index Wednesday, December
Today's CPI data: what you need to know
 Trend Macrolytics, LLC Donald Luskin, Chief Investment Officer Thomas Demas, Managing Director Michael Warren, Energy Strategist Data Insights: Consumer Price Index, Producer Price Index Wednesday, February
HEALTH WEALTH CAREER 2017 WORLDWIDE BENEFIT & EMPLOYMENT GUIDELINES
 HEALTH WEALTH CAREER 2017 WORLDWIDE BENEFIT & EMPLOYMENT GUIDELINES WORLDWIDE BENEFIT & EMPLOYMENT GUIDELINES AT A GLANCE GEOGRAPHY 77 COUNTRIES COVERED 5 REGIONS Americas Asia Pacific Central & Eastern
Today's CPI data: what you need to know
 Trend Macrolytics, LLC Donald Luskin, Chief Investment Officer Thomas Demas, Managing Director Michael Warren, Energy Strategist Data Insights: Consumer Price Index, Producer Price Index Thursday, July
Today's CPI data: what you need to know
 Trend Macrolytics, LLC Donald Luskin, Chief Investment Officer Thomas Demas, Managing Director Michael Warren, Energy Strategist Data Insights: Consumer Price Index, Producer Price Index Friday, January
Today's CPI data: what you need to know
 Trend Macrolytics, LLC Donald Luskin, Chief Investment Officer Thomas Demas, Managing Director Michael Warren, Energy Strategist Data Insights: Consumer Price Index, Producer Price Index Wednesday, April
CNH and China QFII market: Opportunities and Challenges A Fund Custodian and Administrator's Perspective"
 CNH and China QFII market: Opportunities and Challenges A Fund Custodian and Administrator's Perspective" Eric Chow HSBC Securities Services June 2011 2 Agenda About HSBC Securities Services (HSS) Introducing
Today's CPI data: what you need to know
 Trend Macrolytics, LLC Donald Luskin, Chief Investment Officer Thomas Demas, Managing Director Michael Warren, Energy Strategist Data Insights: Consumer Price Index, Producer Price Index Friday, August
Today's CPI data: what you need to know
 Trend Macrolytics, LLC Donald Luskin, Chief Investment Officer Thomas Demas, Managing Director Michael Warren, Energy Strategist Data Insights: Consumer Price Index, Producer Price Index Thursday, October
Total Imports by Volume (Gallons per Country)
") 11/2/2018 Imports by Volume (Gallons per Country) YTD YTD Country 09/2017 09/2018 % Change 2017 2018 % Change MEXICO 49,299,573 57,635,840 16.9 % 552,428,635 601,679,687 8.9 % NETHERLANDS 11,656,759 13,024,144
11/2/2018 Imports by Volume (Gallons per Country) YTD YTD Country 09/2017 09/2018 % Change 2017 2018 % Change MEXICO 49,299,573 57,635,840 16.9 % 552,428,635 601,679,687 8.9 % NETHERLANDS 11,656,759 13,024,144
n O v e m b e R Securities Industry And Financial Markets Global Addendum 2007 Volume I I No. New York n Washington n London n Hong Kong
 ReseaRch RePORT n O v e m b e R 2 7 Securities Industry And Financial Markets Global Addendum 27 Volume I I No. 1 New York n Washington n London n Hong Kong SIFMA RESEARCH AND POLICY DEPARTMENT Michael
Total Imports by Volume (Gallons per Country)
") 10/5/2018 Imports by Volume (Gallons per Country) YTD YTD Country 08/2017 08/2018 % Change 2017 2018 % Change MEXICO 67,180,788 71,483,563 6.4 % 503,129,061 544,043,847 8.1 % NETHERLANDS 12,954,789 12,582,508
10/5/2018 Imports by Volume (Gallons per Country) YTD YTD Country 08/2017 08/2018 % Change 2017 2018 % Change MEXICO 67,180,788 71,483,563 6.4 % 503,129,061 544,043,847 8.1 % NETHERLANDS 12,954,789 12,582,508
Total Imports by Volume (Gallons per Country)
") 3/6/2019 Imports by Volume (Gallons per Country) YTD YTD Country 12/2017 12/2018 % Change 2017 2018 % Change MEXICO 54,169,734 56,505,154 4.3 % 712,020,884 773,421,634 8.6 % NETHERLANDS 11,037,475 8,403,018
3/6/2019 Imports by Volume (Gallons per Country) YTD YTD Country 12/2017 12/2018 % Change 2017 2018 % Change MEXICO 54,169,734 56,505,154 4.3 % 712,020,884 773,421,634 8.6 % NETHERLANDS 11,037,475 8,403,018
Total Imports by Volume (Gallons per Country)
") 12/6/2018 Imports by Volume (Gallons per Country) YTD YTD Country 10/2017 10/2018 % Change 2017 2018 % Change MEXICO 56,462,606 60,951,402 8.0 % 608,891,240 662,631,088 8.8 % NETHERLANDS 11,381,432 10,220,226
12/6/2018 Imports by Volume (Gallons per Country) YTD YTD Country 10/2017 10/2018 % Change 2017 2018 % Change MEXICO 56,462,606 60,951,402 8.0 % 608,891,240 662,631,088 8.8 % NETHERLANDS 11,381,432 10,220,226
Total Imports by Volume (Gallons per Country)
") 2/6/2019 Imports by Volume (Gallons per Country) YTD YTD Country 11/2017 11/2018 % Change 2017 2018 % Change MEXICO 48,959,909 54,285,392 10.9 % 657,851,150 716,916,480 9.0 % NETHERLANDS 11,903,919 10,024,814
2/6/2019 Imports by Volume (Gallons per Country) YTD YTD Country 11/2017 11/2018 % Change 2017 2018 % Change MEXICO 48,959,909 54,285,392 10.9 % 657,851,150 716,916,480 9.0 % NETHERLANDS 11,903,919 10,024,814
YUM! Brands, Inc. Historical Financial Summary. Second Quarter, 2017
 YUM! Brands, Inc. Historical Financial Summary Second Quarter, 2017 YUM! Brands, Inc. Consolidated Statements of Income (in millions, except per share amounts) 2017 2016 2015 YTD Q3 Q4 FY FY Revenues Company
Instruction Deadline. *Settlement Cycle
 Argentina Equity & Fixed Income T+0-T+2 SD+1 2:30 SD+1 2:30 Fixed Income (MAECLEAR) T+0-T+2 SD 23:00 SD 23:00 Physical T+0-T+2 SD 23:00 SD 23:00 Australia Equity T+2 SD 5:30 SD 10:30 Fixed Income T+2 SD
Double Tax Treaties. Necessity of Declaration on Tax Beneficial Ownership In case of capital gains tax. DTA Country Withholding Tax Rates (%)
") Double Tax Treaties DTA Country Withholding Tax Rates (%) Albania 0 0 5/10 1 No No No Armenia 5/10 9 0 5/10 1 Yes 2 No Yes Australia 10 0 15 No No No Austria 0 0 10 No No No Azerbaijan 8 0 8 Yes No Yes
Double Tax Treaties DTA Country Withholding Tax Rates (%) Albania 0 0 5/10 1 No No No Armenia 5/10 9 0 5/10 1 Yes 2 No Yes Australia 10 0 15 No No No Austria 0 0 10 No No No Azerbaijan 8 0 8 Yes No Yes
Total Imports by Volume (Gallons per Country)
") 7/6/2018 Imports by Volume (Gallons per Country) YTD YTD Country 05/2017 05/2018 % Change 2017 2018 % Change MEXICO 71,166,360 74,896,922 5.2 % 302,626,505 328,397,135 8.5 % NETHERLANDS 12,039,171 13,341,929
7/6/2018 Imports by Volume (Gallons per Country) YTD YTD Country 05/2017 05/2018 % Change 2017 2018 % Change MEXICO 71,166,360 74,896,922 5.2 % 302,626,505 328,397,135 8.5 % NETHERLANDS 12,039,171 13,341,929
Total Imports by Volume (Gallons per Country)
") 2/6/2018 Imports by Volume (Gallons per Country) YTD YTD Country 12/2016 12/2017 % Change 2016 2017 % Change MEXICO 50,839,282 54,169,734 6.6 % 682,281,387 712,020,884 4.4 % NETHERLANDS 10,630,799 11,037,475
2/6/2018 Imports by Volume (Gallons per Country) YTD YTD Country 12/2016 12/2017 % Change 2016 2017 % Change MEXICO 50,839,282 54,169,734 6.6 % 682,281,387 712,020,884 4.4 % NETHERLANDS 10,630,799 11,037,475
Long Association List of Jurisdictions Surveyed for Which a Response Has Been Received
 Agenda Item 7-B Long Association List of Jurisdictions Surveed for Which a Has Been Received Jurisdictions Region IFAC Largest 29 G10 G20 EU/EEA IOSCO IFIAR Surve Abu Dhabi Member (UAE) Albania Member
Total Imports by Volume (Gallons per Country)
") 1/5/2018 Imports by Volume (Gallons per Country) YTD YTD Country 11/2016 11/2017 % Change 2016 2017 % Change MEXICO 50,994,409 48,959,909 (4.0)% 631,442,105 657,851,150 4.2 % NETHERLANDS 9,378,351 11,903,919
1/5/2018 Imports by Volume (Gallons per Country) YTD YTD Country 11/2016 11/2017 % Change 2016 2017 % Change MEXICO 50,994,409 48,959,909 (4.0)% 631,442,105 657,851,150 4.2 % NETHERLANDS 9,378,351 11,903,919
Clinical Trials Insurance
 Allianz Global Corporate & Specialty Clinical Trials Insurance Global solutions for clinical trials liability Specialist cover for clinical research The challenges of international clinical research are
Total Imports by Volume (Gallons per Country)
") 10/5/2017 Imports by Volume (Gallons per Country) YTD YTD Country 08/2016 08/2017 % Change 2016 2017 % Change MEXICO 51,349,849 67,180,788 30.8 % 475,806,632 503,129,061 5.7 % NETHERLANDS 12,756,776 12,954,789
10/5/2017 Imports by Volume (Gallons per Country) YTD YTD Country 08/2016 08/2017 % Change 2016 2017 % Change MEXICO 51,349,849 67,180,788 30.8 % 475,806,632 503,129,061 5.7 % NETHERLANDS 12,756,776 12,954,789
Does One Law Fit All? Cross-Country Evidence on Okun s Law
 Does One Law Fit All? Cross-Country Evidence on Okun s Law Laurence Ball Johns Hopkins University Global Labor Markets Workshop Paris, September 1-2, 2016 1 What the paper does and why Provides estimates
Total Imports by Volume (Gallons per Country)
") 6/6/2018 Imports by Volume (Gallons per Country) YTD YTD Country 04/2017 04/2018 % Change 2017 2018 % Change MEXICO 60,968,190 71,994,646 18.1 % 231,460,145 253,500,213 9.5 % NETHERLANDS 13,307,731 10,001,693
6/6/2018 Imports by Volume (Gallons per Country) YTD YTD Country 04/2017 04/2018 % Change 2017 2018 % Change MEXICO 60,968,190 71,994,646 18.1 % 231,460,145 253,500,213 9.5 % NETHERLANDS 13,307,731 10,001,693
DOMESTIC CUSTODY & TRADING SERVICES
 Pricing Structure DOMESTIC CUSTODY & TRADING SERVICES A flat custody fee of 20bps per account type per year is applicable to all holdings and cash, the custody fee is collected each month but will be capped
ANNEX 2: Methodology and data of the Starting a Foreign Investment indicators
 ANNEX 2: Methodology and data of the Starting a Foreign Investment indicators Methodology The Starting a Foreign Investment indicators quantify several aspects of business establishment regimes important
Summary 715 SUMMARY. Minimum Legal Fee Schedule. Loser Pays Statute. Prohibition Against Legal Advertising / Soliciting of Pro bono
 Summary Country Fee Aid Angola No No No Argentina No, with No No No Armenia, with No No No No, however the foreign Attorneys need to be registered at the Chamber of Advocates to be able to practice attorney
STOXX EMERGING MARKETS INDICES. UNDERSTANDA RULES-BA EMERGING MARK TRANSPARENT SIMPLE
 STOXX Limited STOXX EMERGING MARKETS INDICES. EMERGING MARK RULES-BA TRANSPARENT UNDERSTANDA SIMPLE MARKET CLASSIF INTRODUCTION. Many investors are seeking to embrace emerging market investments, because
Appendix. Table S1: Construct Validity Tests for StateHist
 Appendix Table S1: Construct Validity Tests for StateHist (5) (6) Roads Water Hospitals Doctors Mort5 LifeExp GDP/cap 60 4.24 6.72** 0.53* 0.67** 24.37** 6.97** (2.73) (1.59) (0.22) (0.09) (4.72) (0.85)
EQUITY REPORTING & WITHHOLDING. Updated May 2016
 EQUITY REPORTING & WITHHOLDING Updated May 2016 When you exercise stock options or have RSUs lapse, there may be tax implications in any country in which you worked for P&G during the period from the
INVESTING IN FRONTIER MARKETS EQUITY
 INVESTING IN FRONTIER MARKETS EQUITY by Geraldine Miniaou, CFA, Senior Research Analyst Pavilion Advisory Group The International Finance Corporation (IFC) used the term frontier markets for the first
JPMorgan Funds statistics report: Emerging Markets Debt Fund
 NOT FDIC INSURED NO BANK GUARANTEE MAY LOSE VALUE JPMorgan Funds statistics report: Emerging Markets Debt Fund Data as of November 30, 2016 Must be preceded or accompanied by a prospectus. jpmorganfunds.com
Employer Social Charges 13/10/2017 EURO/USD USD 1.20 JPY/USD 0.01 AUD/USD USD 0.73 GBP/USD Charges patronales obligatoires %
 Charges 13/10/2017 Salaire Brut Mensuel Charges patronales obligatoires % Charges patronales totales Pays Albania $4,500.00 16.70% $218 Algeria $4,500.00 28.00% $1,260 Angola $4,500.00 20.7500% $933.75
Total Imports by Volume (Gallons per Country)
") 3/7/2018 Imports by Volume (Gallons per Country) YTD YTD Country 01/2017 01/2018 % Change 2017 2018 % Change MEXICO 54,235,419 58,937,856 8.7 % 54,235,419 58,937,856 8.7 % NETHERLANDS 12,265,935 10,356,183
3/7/2018 Imports by Volume (Gallons per Country) YTD YTD Country 01/2017 01/2018 % Change 2017 2018 % Change MEXICO 54,235,419 58,937,856 8.7 % 54,235,419 58,937,856 8.7 % NETHERLANDS 12,265,935 10,356,183
Global Business Barometer April 2008
 Global Business Barometer April 2008 The Global Business Barometer is a quarterly business-confidence index, conducted for The Economist by the Economist Intelligence Unit What are your expectations of
Other Tax Rates. Non-Resident Withholding Tax Rates for Treaty Countries 1
 Other Tax Rates Non-Resident Withholding Tax Rates for Treaty Countries 1 Country 2 Interest 3 Dividends 4 Royalties 5 Annuities 6 Pensions/ Algeria 15% 15% 0/15% 15/25% Argentina 7 12.5 10/15 3/5/10/15
INTERNATIONAL BANK FOR RECONSTRUCTION AND DEVELOPMENT BOARD OF GOVERNORS. Resolution No. 612
 INTERNATIONAL BANK FOR RECONSTRUCTION AND DEVELOPMENT BOARD OF GOVERNORS Resolution No. 612 2010 Selective Increase in Authorized Capital Stock to Enhance Voice and Participation of Developing and Transition
Overview of FSC-certified forests January January Maps of extend of FSC-certified forest globally and country specific
 Overview of FSCcertified forests January 2009 Maps of extend of FSCcertified forest globally and country specific Global certified forest area: 120.052.350 ha ( = 4,3%) + 11% Hectare FSCcertified forest
Total Imports by Volume (Gallons per Country)
") 5/4/2016 Imports by Volume (Gallons per Country) YTD YTD Country 03/2015 03/2016 % Change 2015 2016 % Change MEXICO 53,821,885 60,813,992 13.0 % 143,313,133 167,568,280 16.9 % NETHERLANDS 11,031,990 12,362,256
5/4/2016 Imports by Volume (Gallons per Country) YTD YTD Country 03/2015 03/2016 % Change 2015 2016 % Change MEXICO 53,821,885 60,813,992 13.0 % 143,313,133 167,568,280 16.9 % NETHERLANDS 11,031,990 12,362,256
Withholding Tax Rate under DTAA
 Withholding Tax Rate under DTAA Country Albania 10% 10% 10% 10% Armenia 10% Australia 15% 15% 10%/15% [Note 2] 10%/15% [Note 2] Austria 10% Bangladesh Belarus a) 10% (if at least 10% of recipient company);
Frontier Markets and a teaser of what is to come. Peter Elam Håkansson, Chairman and Partner
 Frontier Markets and a teaser of what is to come Peter Elam Håkansson, Chairman and Partner The Frontier Markets Have the good old Emerging Markets lost their appeal? We remain convinced that Emerging
Withholding Tax Handbook BELGIUM. Version 1.2 Last Updated: June 20, New York Hong Kong London Madrid Milan Sydney
 Withholding Tax Handbook BELGIUM Version 1.2 Last Updated: June 20, 2014 Globe Tax Services Incorporated 90 Broad Street, New York, NY, USA 10004 Tel +1 212 747 9100 Fax +1 212 747 0029 Info@GlobeTax.com
Countries with Double Taxation Agreements with the UK rates of withholding tax for the year ended 5 April 2012
 Countries with Double Taxation Agreements with the UK rates of withholding tax for the year ended 5 April 2012 This table shows the maximum rates of tax those countries with a Double Taxation Agreement
CREDIT INSURANCE. To ensure peace, you must be prepared for war. CREDIT INSURANCE FUNDAMENTAL SOLUTION IN CREDIT RISK MANAGEMENT
 FUNDAMENTAL SOLUTION IN CREDIT RISK MANAGEMENT I would like to extend my relations with that customer... I would like to enter a new market... We have high exposure for that customer... We have delayed
Total Imports by Volume (Gallons per Country)
") 4/5/2018 Imports by Volume (Gallons per Country) YTD YTD Country 02/2017 02/2018 % Change 2017 2018 % Change MEXICO 53,961,589 55,268,981 2.4 % 108,197,008 114,206,836 5.6 % NETHERLANDS 12,804,152 11,235,029
4/5/2018 Imports by Volume (Gallons per Country) YTD YTD Country 02/2017 02/2018 % Change 2017 2018 % Change MEXICO 53,961,589 55,268,981 2.4 % 108,197,008 114,206,836 5.6 % NETHERLANDS 12,804,152 11,235,029
INTERNATIONAL CONVENTION ON STANDARDS OF TRAINING, CERTIFICATION AND WATCHKEEPING FOR SEAFARERS (STCW), 1978, AS AMENDED
, 1978, AS AMENDED") E 4 ALBERT EMBANKMENT LONDON SE 7SR Telephone: +44 (0)20 7735 76 Fax: +44 (0)20 7587 320 MSC./Circ.64/Rev.5 7 June 205 INTERNATIONAL CONVENTION ON STANDARDS OF TRAINING, CERTIFICATION AND WATCHKEEPING
E 4 ALBERT EMBANKMENT LONDON SE 7SR Telephone: +44 (0)20 7735 76 Fax: +44 (0)20 7587 320 MSC./Circ.64/Rev.5 7 June 205 INTERNATIONAL CONVENTION ON STANDARDS OF TRAINING, CERTIFICATION AND WATCHKEEPING
APA & MAP COUNTRY GUIDE 2017 CANADA
 APA & MAP COUNTRY GUIDE 2017 CANADA Managing uncertainty in the new tax environment CANADA KEY FEATURES Competent authority APA provisions/ guidance Types of APAs available APA acceptance criteria Key
Non-resident withholding tax rates for treaty countries 1
 Non-resident withholding tax rates for treaty countries 1 Country 2 Interest 3 Dividends 4 Royalties 5 Annuities 6 Pensions/ Algeria 15% 15% 0/15% 15/25% Argentina 7 12.5 10/15 3/5/10/15 15/25 Armenia
SANGAM GLOBAL PHARMACEUTICAL & REGULATORY CONSULTANCY
 SANGAM GLOBAL PHARMACEUTICAL & REGULATORY CONSULTANCY Regulatory Affairs Worldwide An ISO 9001:2015 Certified Company Welcome to Sangam Global Pharmaceutical & Regulatory Consultancy (SGPRC) established
Withholding tax rates 2016 as per Finance Act 2016
 Withholding tax rates 2016 as per Finance Act 2016 Sr No Country Dividend Interest Royalty Fee for Technical (not being covered under Section 115-O) Services 1 Albania 10% 10% 10% 10% 2 Armenia 10% 10%
Albania 10% 10%[Note1] 10% 10% Armenia 10% 10% [Note1] 10% 10% Austria 10% 10% [Note1] 10% 10%
![Albania 10% 10%[Note1] 10% 10% Armenia 10% 10% [Note1] 10% 10% Austria 10% 10% [Note1] 10% 10%](/thumbs/88/116150947.jpg "Albania 10% 10%[Note1] 10% 10% Armenia 10% 10% [Note1] 10% 10% Austria 10% 10% [Note1] 10% 10%") Country Dividend (not being covered under Section 115-O) Withholding tax rates Interest Royalty Fee for Technical Services Albania 10% 10%[Note1] 10% 10% Armenia 10% Australia 15% 15% 10%/15% 10%/15% Austria
Country Dividend (not being covered under Section 115-O) Withholding tax rates Interest Royalty Fee for Technical Services Albania 10% 10%[Note1] 10% 10% Armenia 10% Australia 15% 15% 10%/15% 10%/15% Austria
Financial wealth of private households worldwide
 Economic Research Financial wealth of private households worldwide Munich, October 217 Recovery in turbulent times Assets and liabilities of private households worldwide in EUR trillion and annualrate
SURVEY TO DETERMINE THE PERCENTAGE OF NATIONAL REVENUE REPRESENTED BY CUSTOMS DUTIES INTRODUCTION
 SURVEY TO DETERMINE THE PERCENTAGE OF NATIONAL REVENUE REPRESENTED BY CUSTOMS DUTIES INTRODUCTION This publication provides information about the share of national revenues represented by Customs duties.
The Commodities Roller Coaster: A Fiscal Framework for Uncertain Times
 International Monetary Fund October 215 Fiscal Monitor The Commodities Roller Coaster: A Fiscal Framework for Uncertain Times Tidiane Kinda Fiscal Affairs Department Vienna, November 26, 215 The views
Actuarial Supply & Demand. By i.e. muhanna. i.e. muhanna Page 1 of
 By i.e. muhanna i.e. muhanna Page 1 of 8 040506 Additional Perspectives Measuring actuarial supply and demand in terms of GDP is indeed a valid basis for setting the actuarial density of a country and
INTERNATIONAL CONVENTION ON STANDARDS OF TRAINING, CERTIFICATION AND WATCHKEEPING FOR SEAFARERS (STCW), 1978, AS AMENDED
, 1978, AS AMENDED") E 4 ALBERT EMBANKMENT LONDON SE1 7SR Telephone: +44 (0)20 7735 711 Fax: +44 (0)20 7587 3210 1 January 2019 INTERNATIONAL CONVENTION ON STANDARDS OF TRAINING, CERTIFICATION AND WATCHKEEPING FOR SEAFARERS
E 4 ALBERT EMBANKMENT LONDON SE1 7SR Telephone: +44 (0)20 7735 711 Fax: +44 (0)20 7587 3210 1 January 2019 INTERNATIONAL CONVENTION ON STANDARDS OF TRAINING, CERTIFICATION AND WATCHKEEPING FOR SEAFARERS
(of 19 March 2013) Valid from 1 January A. Taxpayers
 Valid from 1 January A. Taxpayers") Leaflet. 29/460 of the Cantonal Tax Office on withholding taxes applicable to pension benefits under private law for persons without domicile or residence in Switzerland (of 19 March 2013) Valid from 1
Leaflet. 29/460 of the Cantonal Tax Office on withholding taxes applicable to pension benefits under private law for persons without domicile or residence in Switzerland (of 19 March 2013) Valid from 1
Fernanda Ruiz Nuñez Senior Economist Infrastructure, PPPs and Guarantees Group The World Bank
 Fernanda Ruiz Nuñez Senior Economist Infrastructure, PPPs and Guarantees Group The World Bank Mikel Tejada Consultant. Topic Leader Procuring Infrastructure PPPs The World Bank 2018 ICGFM 32nd Annual International
MAXIMUM MONTHLY STIPEND RATES FOR FELLOWS AND SCHOLARS. Afghanistan $135 $608 $911 1 March Albania $144 $2,268 $3,402 1 January 2005
 MAXIMUM MONTHLY STIPEND RATES FOR FELLOWS AND SCHOLARS (IN U.S. DOLLARS FOR COST ESTIMATE) COUNTRY DSA(US$) MAX RES RATE MAX TRV RATE EFFECTIVE DATE OF % Afghanistan $135 $608 $911 1 March 1989 Albania
% 5% 18% % 23% 20% % 28% 26% % 43% 37% No response... 1% 1% 1% Male... 63% 64% 63% Female...
 EISENHOWER FELLOWSHIPS SURVEY OF GLOBAL LEADERS N=552 ( n=152, Non- n=400) DECEMBER 14 31, 2016 ONLINE 1. In what year was your fellowship? 59-89... 14% 5% 18% 90-99... 20% 23% 20% 00-09... 26% 28% 26%
TAXATION (IMPLEMENTATION) (CONVENTION ON MUTUAL ADMINISTRATIVE ASSISTANCE IN TAX MATTERS) (AMENDMENT OF REGULATIONS No. 3) (JERSEY) ORDER 2017
 (CONVENTION ON MUTUAL ADMINISTRATIVE ASSISTANCE IN TAX MATTERS) (AMENDMENT OF REGULATIONS No. 3) (JERSEY) ORDER 2017") Taxation (Implementation) (Convention on Mutual Regulations No. 3) (Jersey) Order 2017 Article 1 TAXATION (IMPLEMENTATION) (CONVENTION ON MUTUAL ADMINISTRATIVE ASSISTANCE IN TAX MATTERS) (AMENDMENT OF
Taxation (Implementation) (Convention on Mutual Regulations No. 3) (Jersey) Order 2017 Article 1 TAXATION (IMPLEMENTATION) (CONVENTION ON MUTUAL ADMINISTRATIVE ASSISTANCE IN TAX MATTERS) (AMENDMENT OF
Institutions, Capital Flight and the Resource Curse. Ragnar Torvik Department of Economics Norwegian University of Science and Technology
 Institutions, Capital Flight and the Resource Curse Ragnar Torvik Department of Economics Norwegian University of Science and Technology The resource curse Wave 1: Case studies, Gelb (1988) The resource
Index of Financial Inclusion. (A concept note)
") Index of Financial Inclusion (A concept note) Mandira Sarma Indian Council for Research on International Economic Relations Core 6A, 4th Floor, India Habitat Centre, Delhi 100003 Email: mandira@icrier.res.in
Index of Financial Inclusion (A concept note) Mandira Sarma Indian Council for Research on International Economic Relations Core 6A, 4th Floor, India Habitat Centre, Delhi 100003 Email: mandira@icrier.res.in
FTSE Global Equity Index Series
 Methodology overview FTSE Global Equity Index Series Built for the demands of global investors Indexes for a global market The FTSE Global Equity Index Series (FTSE GEIS) includes objective, rules-based
World Consumer Income and Expenditure Patterns
 World Consumer Income and Expenditure Patterns 2011 www.euromonitor.com iii Summary of Contents Contents Summary of Contents Section 1 Introduction 1 Section 2 Socio-economic parameters 21 Section 3 Annual
Note on Revisions. Investing Across Borders 2010 Report
 Note on Revisions Last revision: August 30, 2011 Investing Across Borders 2010 Report This note documents all data and revisions to the Investing Across Borders (IAB) 2010 report since its release on July
Withholding Tax Rates 2014*
 Withholding Tax Rates 2014* (Rates are current as of 1 March 2014) Jurisdiction Dividends Interest Royalties Notes Afghanistan 20% 20% 20% International Tax Albania 10% 10% 10% Algeria 15% 10% 24% Andorra
Annex Supporting international mobility: calculating salaries
 Annex 5.2 - Supporting international mobility: calculating salaries Base salary refers to a fixed amount of money paid to an Employee in return for work performed and it is determined in accordance with
APA & MAP COUNTRY GUIDE 2017 DENMARK
 APA & MAP COUNTRY GUIDE 2017 DENMARK Managing uncertainty in the new tax environment DENMARK KEY FEATURES Competent authority Danish Tax Office ( SKAT ) APA provisions/ guidance Types of APAs available
Emerging Markets Outlook
 Mark Mobius, Ph.D. Executive Chairman Templeton Emerging Markets Group Emerging Markets Outlook Dealer Use Only / Not for Distribution to the Public Agenda Performance Emerging Markets Equities: Demand
International trade transparency: the issue in the World Trade Organization
 Magalhães 11 International trade transparency: the issue in the World Trade Organization João Magalhães Introduction I was asked to participate in the discussion on international trade transparency with
15 Popular Q&A regarding Transfer Pricing Documentation (TPD) In brief. WTS strong presence in about 100 countries
 In brief. WTS strong presence in about 100 countries") 15 Popular Q&A regarding Transfer Pricing Documentation (TPD) Contacts China Martin Ng Managing Partner Martin.ng@worldtaxservice.cn + 86 21 5047 8665 ext.202 Xiaojie Tang Manager Xiaojie.tang@worldtaxservice.cn
15 Popular Q&A regarding Transfer Pricing Documentation (TPD) Contacts China Martin Ng Managing Partner Martin.ng@worldtaxservice.cn + 86 21 5047 8665 ext.202 Xiaojie Tang Manager Xiaojie.tang@worldtaxservice.cn
Current Issues In Global Risk
 Current Issues In Global Risk US Economic Recovery Terrorism Iraq and Middle East Conflicts Exchange Rate Volatility China s Exchange Rate Policy Corporate Governance World s Health Epidemics Real Estate
The Changing Wealth of Nations 2018
 The Changing Wealth of Nations 2018 Building a Sustainable Future Editors: Glenn-Marie Lange Quentin Wodon Kevin Carey Wealth accounts available for 141 countries, 1995 to 2014 Market exchange rates Human
(ISC)2 Career Impact Survey
2 Career Impact Survey") (ISC)2 Career Impact Survey 1. In what country are you located? Albania 0.0% 0 Andorra 0.0% 1 Angola 0.0% 0 Antigua and Barbuda 0.0% 0 Argentina 0.3% 9 Australia 2.0% 61 Austria 0.2% 6 Azerbaijan 0.0%
(ISC)2 Career Impact Survey 1. In what country are you located? Albania 0.0% 0 Andorra 0.0% 1 Angola 0.0% 0 Antigua and Barbuda 0.0% 0 Argentina 0.3% 9 Australia 2.0% 61 Austria 0.2% 6 Azerbaijan 0.0%
Legal Indicators for Combining work, family and personal life
 Legal Indicators for Combining work, family and personal life Country Africa Algeria 14 100% Angola 3 months 100% Mixed (if necessary, employer tops up social security) Benin 14 100% Mixed (50% Botswana
2 Albania Algeria , Andorra
 1 Afghanistan LDC 110 80 110 80 219 160 2 Albania 631 460 631 460 1 262 920 3 Algeria 8 628 6,290 8 615 6 280 17 243 12 570 4 Andorra 837 610 837 610 1 674 1 220 5 Angola LDC 316 230 316 230 631 460 6
Transfer Pricing in Botswana and Southern Africa. Christian Wiesener KPMG Global Transfer Pricing Services 26 June 2014
 Transfer Pricing in Botswana and Southern Africa Christian Wiesener KPMG Global Transfer Pricing Services 26 June 2014 Agenda Introduction to Transfer Pricing Transfer Pricing Example Africa Transfer Pricing
Export promotion: evaluating the impact on aggregate exports and GDP
 Export promotion: evaluating the impact on aggregate exports and GDP University of Geneva and International Trade Center ETPO meeting, Milan - October 14-16 2015 What do we know? Rose (2007): embassy presence
Reporting practices for domestic and total debt securities
 Last updated: 27 November 2017 Reporting practices for domestic and total debt securities While the BIS debt securities statistics are in principle harmonised with the recommendations in the Handbook on
Pension Payments Made To Foreign Bank Accounts
 West Midlands Pension Fund West Midlands Pension Fund Pension Payments Made To Foreign Bank Accounts A Guide to Worldlink Payment Services August 2012 What does WorldLink Payment Services offer? WorldLink
MEASURES TO STRENGTHEN INTERNATIONAL CO-OPERATION IN NUCLEAR SAFETY AND RADIOLOGICAL PROTECTION. and
 International Atomic Energy Agency GENERAL CONFERENCE 29 August GENERAL Distr. Original: ENGLISH Thirty-second regular session Items 10 and 11 of the provisional agenda (GC(XXXII)/834) MEASURES TO STRENGTHEN
Memoranda of Understanding
 UNEP/CMS/Inf.10.4 Parties to the CONVENTION ON THE CONSERVATION OF MIGRATORY SPECIES OF WILD ANIMALS and its Agreements as at 1 November 2011 Legend CMS Party n = shows the chronological order of the Parties
a closer look GLOBAL TAX WEEKLY ISSUE 249 AUGUST 17, 2017
 GLOBAL TAX WEEKLY a closer look ISSUE 249 AUGUST 17, 2017 SUBJECTS TRANSFER PRICING INTELLECTUAL PROPERTY VAT, GST AND SALES TAX CORPORATE TAXATION INDIVIDUAL TAXATION REAL ESTATE AND PROPERTY TAXES INTERNATIONAL
Convention on the Conservation of Migratory Species of Wild Animals
 Convention on the Conservation of Migratory Species of Wild Animals 48 th Meeting of the Standing Committee Bonn, Germany, 23 24 October UNEP/CMS/StC48/Doc.9.1 IMPLEMENTATION OF THE CMS BUDGET (as at 31