Scarsdale Equities llc
|
|
|
- Britton Owens
- 5 years ago
- Views:
Transcription
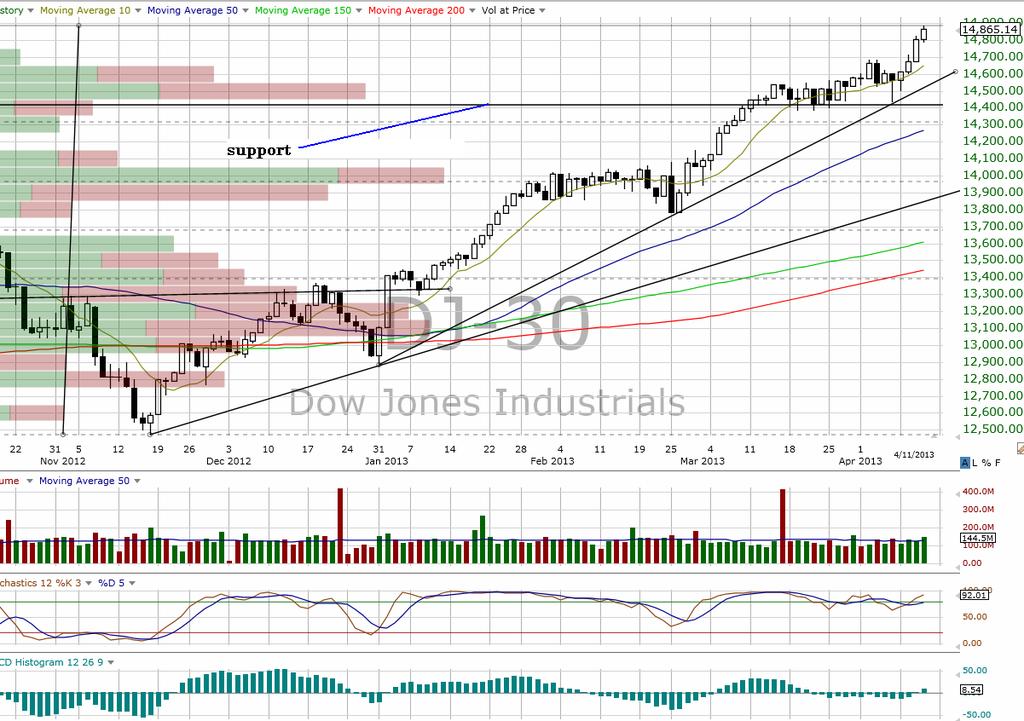
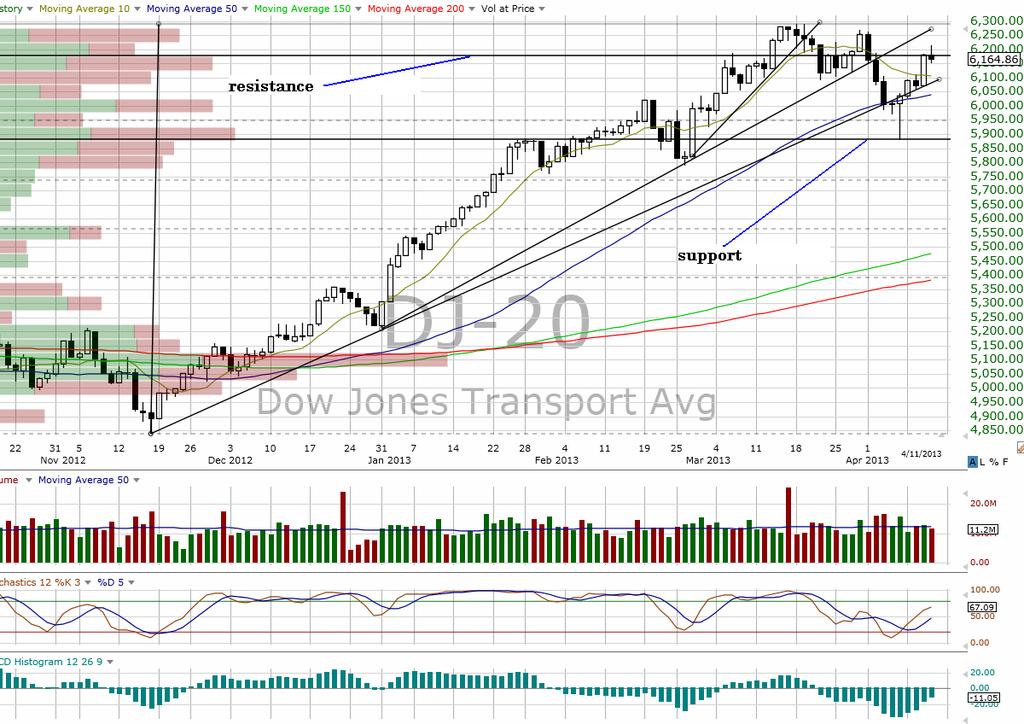
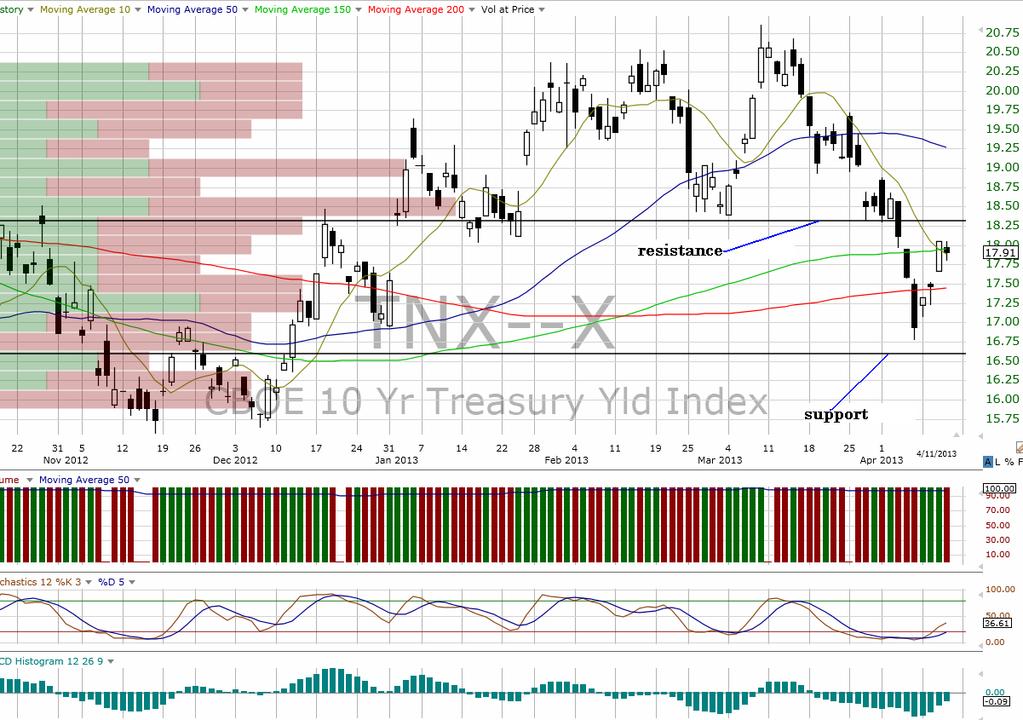
1 Scarsdale Equities llc Morning Note 4/12/2013 Member FINRA, SIPC SSS Technical Research Morning Note 4/12/2013 Indexes Continue With Split Signals McClellan OB/OS Oscillators Remain Neutral Opinion: The short term tea leaves continue to send mixed and conflicting signals from both the data and chart perspectives as will be discussed in detail below. As a result, it is one of those rare times where we find ourselves in a position of not being able form a strong opinion in either direction. It is a frustrating reality. However, as discussed in yesterday s report, the McClellan OB/OS Oscillators remain persistently in neutral territory as they have throughout the recent rally. As such, no overbought conditions yet exist while the charts continue to give diverging messages. On the charts, the Tale of Two Markets continued yesterday as the SPX, DJI and OTC (pages 2 & 3) closed higher on the day. Yet the DJT (page 3) closed lower and continues to send divergent signals versus the DJI. As well, both the DJT and RUT (page4) failed to surpass their respective short term resistance levels. In addition, the move higher for the listed stocks came on lighter volume while the OTC s fractional gains came on a combination of negative breadth, negative up/down volume and higher than prior volume leaving its marginable advance as questionable. As well, the OTC index is making a higher high that is not being confirmed by its A/D line that is making a lower high suggesting a continuation of narrowing breadth. So, we continue to see diverging signals from an overview of the major index charts. The data has become conflicted. The Gambill Insider Buy/Sell Ratio remains at a low and bearish 8% as of 4/10 with the WST Ratio on its fourth consecutive and extremely rare bear alert signal. Both of these are negative. Remarkably, and unless there has been a misprint, the AAII Bear/Bull Ratio (contrary indicator) has seen an almost unbelievable and radical shift in sentiment to 54/19 as of 4/11 versus last week. Their sudden shift to bearish opinions would usually have bullish implications yet the Rydex Ratio (contrary indicator) still shows the crowd of leveraged ETF traders wildly bullish at 48. Frankly, we have never seen this before. Meanwhile, the McClellan OB/OS Oscillators remain neutral across the board for the NYSE (+28.63/+45.21) and OTC (-2.11/+0.76). In conclusion, we find it difficult to come to a conclusion other than waiting to see how things develop over the next few days. For the longer term, we remain bullish on equities as they remain undervalued with a 7.3% forward earnings yield versus the 10 Year Treasury yield of 1.8%. SPX:1,545/??? DJI:14,418/??? OTC:3,215/??? DJT:5,878/6,180 RUT:905/950 Guy S. Ortmann, CMT Senior Technical Analyst SCARSDALE EQUITIES LLC 10 Rockefeller Plaza Suite 720 New York, NY gortmann@scarsdale-equities.com Please see Disclosure Appendix on page 10 for rating definitions, important disclosures and required analyst certifications. does and seeks to do business with companies covered in its research reports. As a result, investors should be aware that the firm may have a conflict of interest that could affect the objectivity of this report. Investors should consider this report as one single factor in conjunction with other factors in making an investment decision. SCARSDALE EQUITIES LLC 1

2 SCARSDALE EQUITIES LLC 2

3 SCARSDALE EQUITIES LLC 3

4 SCARSDALE EQUITIES LLC 4
5 The OTC 1 day and 10 day Arms Index are 1.12 (neutral) and.87 (mildly bearish) respectively. The NYSE one and 10 day Arms Index are.94 (mildly bearish) and.99 (neutral) respectively. SCARSDALE EQUITIES LLC 5
 and 3 week")
6 The Rydex Ratio is 48.0 (bearish). The AAII Poll weekly bear/bull reading as of 4/11/13 is 54/19 (bullish) and 3 week average 37/31 (bullish). SCARSDALE EQUITIES LLC 6
 and 1.63 (bearish) on the 15 DMA. The Gambill Insider Buy/Sell Ratio is 8% as of 4/10 (bearish).")
7 Total and Equity put/call ratios are.87 (mildly bullish) and.62 (neutral) on the 1 day. The 15 DMAs are.91 (bullish) and.66 (neutral) respectively. OEX put/call ratio 1 day is.60 (bullish) and 1.63 (bearish) on the 15 DMA. The Gambill Insider Buy/Sell Ratio is 8% as of 4/10 (bearish). SCARSDALE EQUITIES LLC 7
8 The NYSE McClellan OB/OS ratio adjusted is (neutral) on the 1 day and ratio adjusted (neutral) on the 21 day. The OTC McClellan OB/OS ratio adjusted is (neutral) on the 1 day. The 21 day reading is ratio adjusted (neutral). SCARSDALE EQUITIES LLC 8
9 Data: OTC Arms Index 1.12 (neutral) and 10 day.87 (mildly bearish). NYSE Arms Index.94 (mildly bearish) and 10 day.99 (neutral). AAII bear/bull ratio 54/19 as of 4/11 (bullish). Investors Intelligence Bear/Bull Ratio 20.6/50.5 (bearish) as of 4/10. The Rydex Ratio is 48.0 (bearish). Gambill Insider Buy/Sell Ratio is 8% (bearish) as of 4/10. The WST Ratio 1 day is 73.3 (bearish) Composite (bearish) on bear alert for the fourth consecutive day. (Source: bullsorbears.com). Total and equity put/call ratio 1 day readings are.87 (mildly bullish) and.62 (neutral) respectively. The 15 day averages for the total and equity p/c are.91 (bullish) and.66 (neutral) respectively. OEX put/call one day is.60 (bullish), the 15 DMA 1.63 (bearish). ISEE call/put Sentiment Index 1 day 108 (neutral) and 15 day 95 (bullish). NYSE McClellan OB/OS ratio adjusted is (neutral) 3 week average (neutral). OTC McClellan OB/OS ratio adjusted is (neutral) 3 week average (neutral). NYSE A/D line closed above its 50 DMA. The OTC A/D line closed above its 50 DMA. The DJI, SPX, DJT, RUT and OTC closed above their 50 DMAs. The Nikkei closed above its 50 DMA. The FTSE, DAX and Hang Seng closed below their 50 DMAs. The U.S. dollar as measured by the UUP ETF closed lower at $ Support and resistance levels are $22.18 and $22.65 respectively. Commodities in up trends: DRAMs (closed above its 50 DMA) Commodities in down trends: Gold (below its 50 DMA) Silver (below its 50 DMA) Aluminum (closed above its 50DMA) Copper (closed below its 50 DMA CRB Spot Raw Industrials (closed below its 50 DMA) Stainless steel (closed below its 50 DMA) Commodities trading sideways: Oil closed below its 50 DMA) Copper (closed below its 50 DMA) Baltic Dry Bulk Rate (above its 50 DMA) Market Internals: The markets closed mostly higher yesterday. Internals were positive for the NYSE and negative on the OTC. Volumes were below prior levels for the NYSE and above on the OTC. NYSE: A/D 1849/1160 U/D Volume 398M/234M Total Volume 643M. OTC: A/D 1188/1236 U/D Volume 820M/956M Total Volumes 1.81B. SCARSDALE EQUITIES LLC 9
10 Disclosure Appendix AUTHOR CERTIFICATION Guy S. Ortmann, the author primarily responsible for this report certifies, with respect to each security or issuer in this report, that, based solely on technical analysis: (1) all of the views expressed in this report accurately reflect his own personal views about the subject companies and their securities; (2) part of the author s compensation was, is, or will be, directly or indirectly, related to a portion of the commissions generated by [ SE ] in transactions designated for the author s credit. IMPORTANT U.S. REGULATORY DISCLOSURES Technical Analysis. The research provided in this report is based on technical analysis. Technical analysis involves the study of stock prices, volume or other various technical (non-fundamental) indicators and could offer investment opinions that conflict with other research based on fundamental analysis. The investments discussed in this report in some cases will not be suitable for all investors. Investors should use technical analysis as only one input in formulating an investment opinion. Additional inputs should include, but are not limited to, the review of other research reports generated by a review of the fundamental merits of securities and the issuers discussed. COMPANY SPECIFIC DISCLOSURES All applicable current disclosures on the items referred to in this report is obtainable by contacting Guy S. Ortmann at The following disclosures apply to the securities discussed in this research report: 1, at the time of publication, does not make a market in any security. 2 The author does not have a financial interest in any security covered in this report. 3 Part of the author s compensation consists of a portion of the commissions generated by transactions placed at for the credit of the author. OTHER DISCLAIMERS This report is not directed to, nor intended for use by, any person or entity who is a citizen or resident of or located in any locality, state, country or other jurisdiction where such distribution, publication, availability or use would be contrary to law or regulation or which would subject SE or its subsidiaries or its affiliates to any registration or licensing requirement within such jurisdiction. None of the material, nor its content, nor any copying of it, may be altered in any way, transmitted to, copied or distributed to any other party, without the prior express written permission of SE. All trademarks, service marks and logos used in this report are trademarks or service marks or registered trademarks or service marks of SE. The information, tools and material presented in this report are provided for informational purposes only and are not to be used or considered as an offer or the solicitation of an offer to sell or to buy or subscribe for securities or other financial instruments. SE in some cases will not have taken any steps to ensure that the securities referred to in this report are suitable for any particular investor. SE will not treat recipients as its customers by virtue of their receiving the report. The investments or services contained or referred to in this report in some cases will not be suitable for you and it is recommended that you consult an independent investment advisor if you are in doubt about such investments or investment services. Nothing in this report constitutes investment, legal, accounting, or tax advice or a representation that any investment or strategy is suitable or appropriate to your individual circumstances or otherwise constitutes a personal recommendation to you. SE does not offer advice on the tax consequences of investment and you are advised to contact an independent tax advisor. Please note in particular that the bases and levels of taxation may change. Information and opinions presented in this report were obtained or derived from sources SE believes are reliable, but SE makes no representations as to their accuracy or completeness. Moreover, we are under no obligation to inform you if or when data, information, or opinions in this report change. SE accepts no liability for loss arising from the use of the material presented in this report. This report is not to be relied upon in substitution for the exercise of independent judgment. SE in a report may suggest a trading call. Trading calls are short term trading opportunities based on market events and for technical ratings, the relationship of expected return to expected risk based on a set of technical measures. Past performance should not be taken as an indicator or guarantee of future performance, and no representation or warranty, express or implied, is made regarding future performance. Information, opinions and estimates contained in this report reflect a judgment as its original date of publication by SE and are subject to change without notice. The price, value of, and income from any of the securities or financial instruments mentioned in this report can fall as well as rise. The value of securities and financial instruments is subject to exchange rate fluctuation that may have a positive or adverse effect on the price or income of such securities or financial instruments. Investors in securities such as ADRs, the values of which are influenced by currency volatility, effectively assume this risk. SCARSDALE EQUITIES LLC 10
11 In jurisdictions where SE is not already registered or licensed to trade in securities, transactions will only be effected in accordance with applicable securities legislation, which will vary from jurisdiction to jurisdiction and in some cases will require that the trade be made in accordance with applicable exemptions from registration or licensing requirements. Non-U.S. customers wishing to effect a transaction should contact an SE entity, if any, in their local jurisdiction unless governing law permits otherwise. U.S. customers wishing to effect a transaction should do so only by contacting a representative at SE in the U.S. Any information provided in this communication has been prepared from sources believed to be reliable, but is not guaranteed by SE and is not a complete summary or statement of all available data necessary for making an investment decision. In addition, such information in some cases will be condensed or contain calculated data which should be verified by the recipient. Any information provided is for informational purposes only. To the extent that any financial projections are contained herein, such projections are dependent on the occurrence of future events, which cannot be assumed; therefore, the actual results achieved during the projection period, if applicable, in some cases will vary from the projections. Additional information is available upon request. Write to Guy S. Ortmann at, 10 Rockefeller Plaza, Suite 720 New York, NY to obtain additional information or him at gortmann@scarsdale-equities.com SCARSDALE EQUITIES LLC 11
Scarsdale Equities llc
 Scarsdale Equities llc Morning Note 1/10/2013 Member FINRA, SIPC SSS Technical Research Morning Note 1/10/2013 Slight Downside Remains NYSE McClellan OB/OS Back To Overbought Opinion: Based on our assessment
Scarsdale Equities llc
 Scarsdale Equities llc Morning Note 1/2/2014 Member FINRA, SIPC SSS Technical Research Morning Note 1/2/2014 Uptrends Remain Intact Psychology Readings At Cautionary Extremes Opinion: Psychology readings
Scarsdale Equities llc
 Scarsdale Equities llc Morning Note 1/28/2014 Member FINRA, SIPC SSS Technical Research Morning Note 1/28/2014 Still Expecting Sideways Short Term McClellan 1 Day OB/OS Oversold Opinion: We still are of
Scarsdale Equities llc
 Scarsdale Equities llc Morning Note 10/1/2013 Member FINRA, SIPC SSS Technical Research Morning Note 10/1/2013 Data Warnings Remain SPX & DJI Close Below Support Opinion: We continue to be of the opinion
Scarsdale Equities llc
 Scarsdale Equities llc Morning Note 12/7/2012 Member FINRA, SIPC SSS Technical Research Morning Note 12/7/2012 Insider Buying Still Slowing Stochastics Remain Cautionary Opinion: In spite of the implied
Scarsdale Equities llc
 Scarsdale Equities llc Morning Note 10/4/2013 Member FINRA, SIPC SSS Technical Research Morning Note 10/4/2013 Sentiment Remains A Short Term Concern DJI Closes Below Another Support Level Opinion: Although
Scarsdale Equities llc
 Scarsdale Equities llc Morning Note 11/30/2012 Member FINRA, SIPC SSS Technical Research Morning Note 11/30/2012 Charts Improve But Some Data Stretched McClellan 1 Day Ob/OS Overbought Opinion: Although
Scarsdale Equities llc
 Scarsdale Equities llc Morning Note 12/11/2012 Member FINRA, SIPC SSS Technical Research Morning Note 12/11/2012 DJT Breaks Above Downtrend Line OEX Put/Call Ratio Bearish Opinion: Our short term outlook
Scarsdale Equities llc
 Scarsdale Equities llc Morning Note 11/1/2013 Member FINRA, SIPC SSS Technical Research Morning Note 11/1/2013 Rydex Ratio Suggests Risk Volume Accelerates On Minor Decline Opinion: Our next report will
Scarsdale Equities llc
 Scarsdale Equities llc Morning Note 2/27/2013 Member FINRA, SIPC SSS Technical Research Morning Note 2/27/2013 Not All Indexes Bounced Insiders Remain On The Sidelines Opinion: We continue to have a short
Intelligent Investing, LLC Major Indices Daily Update 02/26/ 19
 Elliot Wave Updates Yesterday I found a move below last Friday s high (SPX2794.20) will be a first sign of lower prices as then the decline can t be a 4 th wave because 4 th and 1 st waves can t overlap
Technical Analysis Workshop Series. Session 11 Semester 2 Week 5 Oscillators Part 2
 Technical Analysis Workshop Series Session 11 Semester 2 Week 5 Oscillators Part 2 DISCLOSURES & DISCLAIMERS This research material has been prepared by NUS Invest. NUS Invest specifically prohibits the
Market Update April 20, 2015
 SeattleTA provides investment managers with technical analysis of the equity, fixed-income, commodity, and The forecast for a high on April 15 was spot-on (there s no kill switch on awesome!). The monthly
Technical Analysis: Market Insight
 Technical Analysis: Market Insight October 1987 vs. October 2017 Today (Oct. 19, 2017) marks the 30 th anniversary of Black Monday a global market crash during which the S&P 500 dropped 20% in one day.
Figure 1. SPX 60 min & NAS 1-min chart.
 BINGO!? Today we reached the ideal SPX2625 target to the T (SPX2625.76) for wave-a. There s now negative divergence again on the hourly RSI5 and the hourly MACD (see Fig 1), while the daily indicators
Weekly Commodity Update Metals & Energy 8 th March Geofin Comtrade Ltd. GEOFIN RESEARCH DESK
 Weekly Commodity Update Metals & Energy 8 th March 2016 Geofin Comtrade Ltd. CONTENTS Currency Dollar Index, USD INR Precious Metals Gold, Silver Energy Crude Oil, Natural Gas Base Metals Copper, Nickel,
Market Maps. Bob Dickey, Technical Strategist, Portfolio Advisory Group. March RBC Capital Markets, LLC / Portfolio Advisory Group
 Market Maps Bob Dickey, Technical Strategist, Portfolio Advisory Group RBC Capital Markets, LLC / Portfolio Advisory Group All values in U.S. dollars and priced as of February 28, 2019, unless otherwise
Morning Trading Comments
 Wednesday, June 13, 2018 1 Morning Trading Comments SUMMARY OF TRADING VIEWS The S&P 500 index is now close to the 2800 area, a potential important resistance zone. It will be interesting to see how this
Market Update March 9, 2015
 SeattleTA provides investment managers with technical analysis of the equity, fixed-income, Stocks dropped and interest rates popped on Fridays payroll report as traders priced in a likely Fed rate hike
Cross Asset Technical Vista
 Cross Asset Technical Vista June, 2015 Markets and Products Analysis INVESTMENT PORTOFOLIO ANALYSIS DIVISION Important Disclaimer in page 2 1 Disclaimer Disclaimer: The information herein is believed to
60 Broad Street, 34th Floor, New York, NY Man vs. Market
 Man vs. Market The Discovery Channel broadcasts Man vs. Wild starring Bear Grylls. On that show you can watch Bear survive being stranded in some god-forsaken uninhabited region and then make it back to
Market Maps. Bob Dickey, Technical Strategist, Portfolio Advisory Group. December RBC Capital Markets, LLC / Portfolio Advisory Group
 Market Maps Bob Dickey, Technical Strategist, Portfolio Advisory Group RBC Capital Markets, LLC / Portfolio Advisory Group All values in U.S. dollars and priced as of market close, December 1, 2017, unless
US Financial Market Update for March Prepared for the Market Technicians Association
 US Financial Market Update for March 2016 Prepared for the Market Technicians Association March 16 th, 2016 About Asbury Research Research, Methodology & Clientele Our Research: Asbury Research, established
6:30pm USD High PPI m/m 0.2% 0.2% 6:30pm USD Medium Core PPI m/m 0.2% 0.2% BIPL Securities Limited. 8:00pm USD Medium
 COMMODITIES CORNER November 08, 2018 Synopsis Gold (Play the Range) US$1,240 US$1,230 US$1,220 US$1,210 Silver (Play the Range) US$14.70 US$14.60 US$14.30 US$14.20 WTI (Play the Range) US$64.50 US$63.50
PRESENTS CHARTING MADE EASY ALL TRADING INFORMATION REVEALED
 PRESENTS CHARTING MADE EASY ALL TRADING INFORMATION REVEALED 1 INTRODUCTION Over the years, investors have developed literally, hundred thousand of different technical market indicators in their efforts
Market Maps. Bob Dickey, Technical Analyst. April 2017
 Market Maps Bob Dickey, Technical Analyst RBC Capital Markets, LLC / Portfolio Advisory Group For Important Disclosures, see slides 14 15; priced as of March 31, 2017, unless otherwise noted DJIA with
Market Maps. April 2016 Bob Dickey, Technical Analyst. RBC Capital Markets, LLC / Portfolio Advisory Group U.S. Equities.
 RBC Capital Markets, LLC / Portfolio Advisory Group U.S. Equities Image Area Market Maps April 2016 Bob Dickey, Technical Analyst For Important Disclosures, see slides 12 13 Priced as of March 30, 2016,
BTIG Technical Strategy Year-End Chart Book December 2014
 BTIG Technical Strategy Year-End Chart Book December 2014 This year has been one for the technicians - trends and momentum have dominated conversations about the markets, and for good reason. The following
SPX for the smaller major-4 triangle or SPX to complete the double zigzag. Figure 1.
 Today s break -finally- below SPX2625 (and SPX2613) places the Ball now firmly in the Bears camp, albeit today s strong rally off the lows. And the two main bear counts remain the focus for now: SPX2579-2568
c=a Figure 1. SPX 60 min & NAS 1-min chart.
 Today s drop came as expected and the S&P moved as low as SPX2562, but as said yesterday A move below today s low SPX2569 will be a first sign intermediate-b is underway, with confirmation below SPX2545.
Figure 1. SPX 60-min chart. Ending diagonal triangle forming, a set of nested 1,2 waves; or simple 3 waves down off SPX2800 to complete major-a?
 In the weekend update I was looking for lower prices, and lower we got, but price did also close higher, i.e. above Fridays close. Another Bullish reversal candle? We ve seen plenty of these one-hit-wonders
COMMODITY DAILY. Global Market Round Up. Commodity Research - Alpha Commodity Pvt Ltd. As on Wednesday, March 15, 2017
 Global Market Round Up Commodities traded lower on Tuesday with Bullion continued selling on growing optimism of Fed rate hike; Base metals traded weak witnessing heavy selling on easing worries of supply
Morning Trading Comments
 Thursday, May 24, 2018 1 Morning Trading Comments SUMMARY OF TRADING VIEWS After two months of ultra-low intraday volatility, core European stockmarket indices corrected sharply yesterday with the overstretched
1 P a g e. Summary. For now, I am looking for a major-a low at
 Summary As all most all my forecasted upside (retrace) and downside (Extension) price targets have been reached over the last 3-4 weeks I then always try to be extra careful, cautious and objective in
MONTHLY TECHNICAL REPORT
 The purpose of producing this report is to present a general view on the market, equities and commodities subject under research, and not to recommend a buy/sell/hold for any security or any other assets.
Market Maps. Bob Dickey, Technical Strategist, Portfolio Advisory Group. January RBC Capital Markets, LLC / Portfolio Advisory Group
 Market Maps Bob Dickey, Technical Strategist, Portfolio Advisory Group RBC Capital Markets, LLC / Portfolio Advisory Group All values in U.S. dollars and priced as of December 31, 2018, unless otherwise
The FRED Report. By Fred Meissner, CMT Chamblee Dunwoody Dunwoody, GA Web:
 The FRED Report Training Manual By Fred Meissner, CMT www.thefredreport.com The FRED Report 4514 Chamblee Dunwoody Dunwoody, GA 30338 Web: www.thefredreport.com Phone: 404 875 FRED fred@thefredreport.com
Asbury Research s US Investment Analysis: A Review of Q Prepared for Interactive Brokers
 Asbury Research s US Investment Analysis: A Review of Q1 2016 Prepared for Interactive Brokers April 14 th. 2016 About Asbury Research Research, Methodology & Clientele Our Research: Asbury Research, established
Market Maps. Bob Dickey, Technical Analyst. June 2016
 Market Maps June 2016 Bob Dickey, Technical Analyst RBC Capital Markets, LLC / Portfolio Advisory Group For Important Disclosures, see slides 12 13; priced as of May 31, 2016, unless otherwise noted DJIA
Last Gasp in the Dollar. Market Update May 18, Seattle Technical Advisors
 SeattleTA provides investment managers with technical analysis of the equity, fixed-income, commodity, and currency markets. While equities are expected to take a hit this week, the big news is expected
Technical Analysis. Weekly Comment. Global. SPX Overbought Relief Rally in Europe!! Equities Sales Trading Commentary
 h Technical Analysis Equities Sales Trading Commentary Weekly Comment Global Michael Riesner Marc Müller 03/07/2012 michael.riesner@ubs.com marc.mueller@ubs.com +41-44-239 1676 +41-44-239 1789 SPX Overbought
iii Figure 1. SPX 60-min chart.
 Today the S&P500 (not the DJIA, NAS and NDX) made a marginally lower low below yesterday s low (SPX2527 vs SPX2529), which forced me to re-assess the short-term Elliott-wave count I have for this move
Market Commentary July 19, 2018
 Baird Market and Investment Strategy Market Commentary July 19, 2018 Please refer to Appendix Important Disclosures. Equity Outflows Fuel Stock Gains Despite Breadth Concerns Key Takeaways: Indexes have
Stock Market Report Review
 January 7, 25 Stock Market Report - 24 Review Market Analysis for Period Ending Friday, December 31, 24 This document presents technical and fundamental analysis commonly used by investment professionals
Market Maps. Bob Dickey, Technical Analyst. October 2016
 Market Maps Bob Dickey, Technical Analyst RBC Capital Markets, LLC / Portfolio Advisory Group For Important Disclosures, see slides 12 13; priced as of September 30, 2016, unless otherwise noted DJIA with
Market Maps. Bob Dickey, Technical Strategist, Portfolio Advisory Group. April RBC Capital Markets, LLC / Portfolio Advisory Group
 Market Maps Bob Dickey, Technical Strategist, Portfolio Advisory Group RBC Capital Markets, LLC / Portfolio Advisory Group All values in U.S. dollars and priced as of March 29, 2018, unless otherwise noted
In addition, a word of advice: when in a Bear market and my Elliot Wave Count suggests either down or a few more subdivisions marginally higher
 WOW, who would have known?! Price went from my upper target zone to my lower (see page 2) in just 11 trading hours: The S&P500 lost ~10p/hour Crazy. Big gap ups one day, followed by a 100p drop the next
Forex Sentiment Report Q2 FORECAST WEAK AS LONG AS BELOW April
 Forex Sentiment Report 08 April 2015 www.ads-securities.com Q2 FORECAST WEAK AS LONG AS BELOW 1.1200 Targets on a break of 1.1534/35: 1.1740/50 1.1870/75 1.2230/35 Targets on a break of 1.0580/70: 1.0160
TMT Deep Dive 2/20/2017
 60 Deep Dive 2/20/2017 Technology continues its surge as absolute and relative prices reach new highs on a cap, equal weight, and global basis. Tech remains our top ranked sector however, our sector rankings
WTI Crude Oil Volatility Skew
 6 WTI Crude Oil Volatility 12 5 11 4 1 3 9 2 8 1 Implied volatility (%, left) Implied volatility 3-day (%, left) Price (USD/barrel, right) 7 6 45 WTI Crude Oil Volatility Skew 15 4 1 35 5 3 25 2 Change
Fukushima Daisies. Market Update July 27, Seattle Technical Advisors
 SeattleTA provides investment managers with technical analysis of the equity, fixed-income, The evidence is all around us that the bull has gone to the slaughterhouse. Like daisies discovered in Fukushima,
COMMODITIES CORNER. Gold set for biggest weekly loss since August as dollar weighs. Synopsis Gold (Play the Range) 2nd Resistance
 2nd Resistance") COMMODITIES CORNER Synopsis Gold (Play the Range) US$1,230 US$1,225 US$1,215 US$1,210 Silver (Play the Range) US$14.70 US$14.60 US$14.30 US$14.20 WTI (Play the Range) US$61.80 US$60.80 US$58.30 US$57.00
COMMODITIES CORNER Synopsis Gold (Play the Range) US$1,230 US$1,225 US$1,215 US$1,210 Silver (Play the Range) US$14.70 US$14.60 US$14.30 US$14.20 WTI (Play the Range) US$61.80 US$60.80 US$58.30 US$57.00
Last Hurrah for the Dollar. Market Update June 15, Seattle Technical Advisors
 SeattleTA provides investment managers with technical analysis of the equity, fixed-income, commodity, and currency markets. This week should see the start of the final push upward by the US Dollar prior
COMMODITIES CORNER. Oil prices rebound slightly after heavy declines over trade dispute. Synopsis Gold (Play the Range) 2nd Resistance
 2nd Resistance") COMMODITIES CORNER Synopsis Gold (Play the Range) US$1,235 US$1,225 US$1,210 US$1,205 Silver (Play the Range) US$15.70 US$15.50 US$15.20 US$14.90 WTI (Play the Range) US$69.40 US$68.10 US$66.40 US$65.50
COMMODITIES CORNER Synopsis Gold (Play the Range) US$1,235 US$1,225 US$1,210 US$1,205 Silver (Play the Range) US$15.70 US$15.50 US$15.20 US$14.90 WTI (Play the Range) US$69.40 US$68.10 US$66.40 US$65.50
Cycle Turn Indicator Direction and Swing Summary. of Select Markets as of the close on. January 8, Daily CTI. Swing
 Cycle Turn Indicator Direction and Swing Summary of Select Markets as of the close on January 8, 2019 Market Daily CTI Daily Swing Weekly CTI Weekly Swing Industrial Positive Low Positive Low Transports
Monthly Investment Compass Charting The Course Of The Markets
 Monthly Investment Compass Charting The Course Of The Markets April 22 nd, 2016 Monthly Investment Compass Executive Summary: April 22 nd 2016 U.S. Stock Market: The most important takeaway from the latest
b/ii c/iii b/ii b/ii Figure 1. SPX 60-min chart. NAS 1-min chart.
 On Monday I concluded Above SPX2690 opens the door for major-a having completed and major-b to SPX2800s is underway. Yesterday I then found that the recent SPX2631 low is an unusual point for a bottom
1 P a g e. Summary. Aloha, Dr. Arnout, aka Soul, ter Schure
 Summary Two weeks ago I was already looking for Ideal lows are in the S&P2670-2600, NASDAQ $7000-6800 and RUT $1460-2480 zones., and last week I determined that Although the ideal c=a target for the S&P500
Bad Breadth. Market Update August 17, Seattle Technical Advisors
 SeattleTA provides investment managers with This week is options expiration week and mid-august is often better for equities than earlier or later in the month. Stock Traders Almanac reports that for the
1 P a g e. Table 1. Ideal wave tracker table for nano and micro-waves of minute-v
 Yesterday I concluded We may get some profit taking over the Holiday; but it should only be corrective (small 4 th waves). And today certainly looked like that with only a 5p range on the S&P. Hence the
COMMODITIES CORNER. Gold edges up ahead of G20 meeting; set to post second weekly gain. Synopsis Gold (Play the Range) 2nd Resistance
 2nd Resistance") COMMODITIES CORNER November 23, 2018 Synopsis Gold (Play the Range) US$1,236 US$1,228 US$1,218 US$1,210 Silver (Play the Range) US$14.70 US$14.60 US$14.30 US$14.20 WTI (Play the Range) US$55.50 US$54.50
COMMODITIES CORNER November 23, 2018 Synopsis Gold (Play the Range) US$1,236 US$1,228 US$1,218 US$1,210 Silver (Play the Range) US$14.70 US$14.60 US$14.30 US$14.20 WTI (Play the Range) US$55.50 US$54.50
EU50 Future (VG1) Futures: Short Term View / Levels. Andy Dodd - MSTA adodd 25th April 2018.
 Futures: Short Term View / Levels. Andy Dodd - MSTA adodd 25th April 2018.") Andy Dodd - MSTA +44 20 7031 4651 Twitter @louiscaptech adodd 2018 EU50 Future (VG1) Daily Chart Position Supports Resistances Position Size Short 3391 3354 3336 3319 3282 3418 3441 3481 3502 100% 3286
Andy Dodd - MSTA +44 20 7031 4651 Twitter @louiscaptech adodd 2018 EU50 Future (VG1) Daily Chart Position Supports Resistances Position Size Short 3391 3354 3336 3319 3282 3418 3441 3481 3502 100% 3286
COMMODITIES CORNER. Gold steadies above 5-week lows as market rally pauses. Synopsis
 COMMODITIES CORNER March 06, 2019 Synopsis Gold (Play the Range) US$1,300 US$1,290 US$1,280 US$1,270 Silver (Play the Range) US$15.50 US$15.30 US$15.00 US$14.80 WTI (Play the Range) US$57.30 US$56.30 US$55.30
ALOHA. Soul, Ph.D. 5 P a g e
 Another day and another ATH for the S&P, DJIA, NYA but still not for the NDX, NAS and RUT. Thus wave-e of minutev is still underway to SPX2675-2725, with an ideal target zone of SPX2680-90. There was a
Market Timing and Why it is Important when Trading Index Iron Condors and Credit Spreads Options
 Market Timing and Why it is Important when Trading Index Iron Condors and Credit Spreads Options Market Timing is the science of analyzing macro level economic indicators along with other "big-picture"
11-15 Mar COMMODITY WEEKLY REPORT Mar.2019
 COMMODITY REPORT 11-15 Mar. 2019 Trade House 426 Alok Nagar, Kanadia Main Road Near Bangali Square Indore-452001 (M.P.) India Mobile :+91-9039261444 E-mail: info@tradenivesh.in COMMODITIES PREVIOUS WEEKS
MACD INDICATOR Moving Average Convergence Divergence Part Three
 MACD INDICATOR Moving Average Convergence Divergence Part Three Reprinted from The Traders Journal Volume 2 Issue 3 By Jason Sidney Following on from the previous article on the MACD indicator we established
Weekly Market Summary
 Weekly Market Summary April 24, 2016 by Urban Carmel of The Fat Pitch Summary: SPY made a new all-time high this week. The short and long term trend is higher. Despite a gain of 16% over the past 10 weeks,
S&P Cash Long Term: Uptrend Intact. Monthly Log Chart
 Andy Dodd MSTA - +44 020 7031 4651 adodd@louiscapital.com Twitter : @louiscaptech S&P Cash Long Term: Uptrend Intact Despite an initial slowdown in momentum following the break above 2120 in July, which
Commodities Corner. REP Synopsis Gold (Play the Range)
") REP-039 www.jamapunji.pk Gold prices set to post fourth consecutive weekly gains GOLD: Gold prices fell initially in the previous session, making a low of US$1,307/oz after traders booked profit as the
REP-039 www.jamapunji.pk Gold prices set to post fourth consecutive weekly gains GOLD: Gold prices fell initially in the previous session, making a low of US$1,307/oz after traders booked profit as the
Weekly technical analysis chart pack 6 th October 2014 James Brodie Chartered Market Technician
 Weekly technical analysis chart pack 6 th October 2014 James Brodie Chartered Market Technician There are now increasing concerns facing the long term bull trends in the U.S. equity markets. Three key
Sector Ratings For ETFs & Mutual Funds
 Ratings For ETFs & Mutual Funds At the beginning of the second quarter of 2017, only the Consumer Staples and Industrials sectors earn an -or-better rating. Our sector ratings are based on the aggregation
COMMODITIES CORNER. Gold rises as dollar slips, set for first weekly gain in three. Synopsis
 COMMODITIES CORNER April 12, 2019 Synopsis Gold (Play the Range) US$1,310 US$1,300 US$1,290 US$1,280 Silver (Play the Range) US$15.50 US$15.20 US$14.90 US$14.80 WTI (Play the Range) US$65.50 US$64.50 US$62.50
Introduction. Leading and Lagging Indicators
 1/12/2013 Introduction to Technical Indicators By Stephen, Research Analyst NUS Students Investment Society NATIONAL UNIVERSITY OF SINGAPORE Introduction Technical analysis comprises two main categories:
Daily Currency outlook
 June 6, 2018 Daily Currency outlook PRODUCT 1 Other Product offerings Recommendation in the report Currency pair Contract Action Price Target Stoploss Duration US$INR June futures Buy 67.18 67.46 67.04
What Does Recent Data Mean for US & European Equities? Investment Research & Advisory. Deltec International Group
 Atul Lele alele@deltecinv.com +1 242 302 4135 David Munoz dmunoz@deltecinv.com +1 242 302 4106 David Frazer dfrazer@deltecinv.com +1 242 302 4156 Vivienne Watts vwatts@deltecinv.com +1 242 302 4155 What
Amsterdam Chapter Meeting Featuring Katie Stockton, CMT Tuesday, November 8th, 2016
 Amsterdam Chapter Meeting Featuring Katie Stockton, CMT Tuesday, November 8th, 2016 Date: Tuesday, November 8th, 2016 Time:8:00 AM 9:30 AM Topic: Technical Tools for Trend Followers Technical tools help
Thursday December 3, Major Market Internals (% Issues above 50 Day MA)
") Thursday December 3, 2015 RenMac s Strategic Global Blueprint 20 day highs surged for the DAX twice in the past week, reaching 60% on Thursday and 53% again on Monday. Despite the bearish trend and the
Thursday December 3, 2015 RenMac s Strategic Global Blueprint 20 day highs surged for the DAX twice in the past week, reaching 60% on Thursday and 53% again on Monday. Despite the bearish trend and the
BULLIONS WEEKLY TECHNICAL LEVELS GOLD(APRIL) MCX WEEKLY CHART
 MCX WEEKLY CHART") BULLIONS WEEKLY TECHNICAL LEVELS GOLD(APRIL) MCX WEEKLY CHART MCX Gold JUNE contract, showed upside movement this week and made a weekly high of 33617 and low of 32600 due to rise in dollar index and global
BULLIONS WEEKLY TECHNICAL LEVELS GOLD(APRIL) MCX WEEKLY CHART MCX Gold JUNE contract, showed upside movement this week and made a weekly high of 33617 and low of 32600 due to rise in dollar index and global
DAILY TECHNICAL REPORT
 RESEARCH TEAM DAILY TECHNICAL REPORT DISCLAIMER & DISCLOSURES Please read the disclaimer and the disclosures which can be found at the end of this report EUR / USD Declining sharply. EUR/USD has broken
Index Return Monitor. January 11, 2017
 Index Return Monitor January 11, 2017 BRAD BROWN, CFA INVESTMENT STRATEGY GROUP See Legal Disclaimer and Important Disclosure Footnotes at the end of this report for disclosures, including potential conflicts
DAILY TECHNICAL REPORT
 RESEARCH TEAM DAILY TECHNICAL REPORT DISCLAIMER & DISCLOSURES Please read the disclaimer and the disclosures which can be found at the end of this report EUR / USD Bouncing further. EUR/USD has broken
Stock Market Report. December 08, 2004
 December 8, 24 Stock Market Report Market Analysis for Period Ending Friday, December 3, 24 This document presents technical and fundamental analysis commonly used by investment professionals to interpret
Déjà vu all over again. Market Update July 20, Seattle Technical Advisors
 SeattleTA provides investment managers with technical analysis of the equity, fixed-income, commodity, and currency markets. Last week the NASDAQ printed a new record high and SPX isn t far behind. The
COMMODITY DAILY. Global Market Round Up. Commodity Research - Alpha Commodity Pvt Ltd. As on Friday, April 28, 2017
 Global Market Round Up Commodities traded lower with Bullion declined in evening session on stronger dollar on US tax reforms. Crude oil prices traded lower after steady trading session on supply overhang
Weekly Market Summary
 Weekly Market Summary June 17, 2017 by Urban Carmel of The Fat Pitch Summary: Most of the US indices made new all-time highs this week. SPY is making 'higher highs' and 'higher lows' and is above all of
COMMODITIES CORNER. Gold falls to 1-week low on stronger dollar, but holds above $1,300 level. Synopsis
 COMMODITIES CORNER February 07, 2019 Synopsis Gold (Play the Range) US$1,320 US$1,310 US$1,300 US$1,295 Silver (Play the Range) US$16.20 US$16.00 US$15.60 US$15.50 WTI (Play the Range) US$56.60 US$55.60
Submerging Markets. Market Update August 3, Seattle Technical Advisors
 SeattleTA provides investment managers with technical analysis of the equity, fixed-income, commodity, and currency markets. A cycle low is expected in emerging markets this week and is confirmed by a
DEALMONEY MARKET BUZZ
 DEALMONEY MARKET BUZZ 20 th August 25 th August Index Equity Commodity Currency Equities Commodities Wealth Mutual Funds Insurance 1 Weekly Performance: Equity S.No Equity View Entry Target SL Outcome
Equities: Weekly Technical Overview 2nd October 2016
 Andy Dodd MSTA - +44 020 7031 4651 adodd@louiscapital.com Twitter : @louiscaptech Equities: Weekly Technical Overview 2nd October 2016 Equity Index Technical Dashboard The table below is intended as an
Coway ( KS) Good start to China water-purifier market entry. Korea Research KRW121,000 KRW103,000. Event. Impact. Action and recommendation
 Good start to China water-purifier market entry. Korea Research KRW121,000 KRW103,000. Event. Impact. Action and recommendation") Korea Research This research report is a product of (Korea) Flashnote Korea / Consumer 1 June 2016 BUY Target price Last price (31 May 2016) KRW121,000 KRW103,000 Upside/downside (%) 17.5 KOSPI 1,983.40
Korea Research This research report is a product of (Korea) Flashnote Korea / Consumer 1 June 2016 BUY Target price Last price (31 May 2016) KRW121,000 KRW103,000 Upside/downside (%) 17.5 KOSPI 1,983.40
Because the AD line made a new ATH, there s simple too much underlying strength to suggest a large third- or c-wave lower is just around the corner
 The short term count remains a bit messy over the past three days, so we ll just look at trendlines instead: see Figure- 1. Hence, please don t focus on the wave labeling as the 2 nd SPX2699 low may have
Managing a Market Correction in your Portfolio
 Managing a Market Correction in your Portfolio October 2015 Gareth Ryan Founder & Managing Director Risk Disclosure Options are leveraged products that involve risk and are not suitable for all investors.
Using 3cANALYSIS Research
 Using 3cANALYSIS Research The firm s analysts have a consistent and accurate track record in forecasting the direction of financial markets and our main goal is to identify profitable trading opportunities.
04-08 June 2018 COMMODITY WEEKLY REPORT. 16thAPR-20th APR
 COMMODITY REPORT 04-08 June 2018 Trade House 426 Alok Nagar, Kanadia Main Road Near Bangali Square Indore-452001 (M.P.) India Mobile :+91-9039261444 E-mail: info@tradenivesh.in COMMODITIES PREVIOUS WEEKS
MONTHLY TECHNICAL REPORT
 The purpose of producing this report is to present a general view on the market, equities and commodities subject under research, and not to recommend a buy/sell/hold for any security or any other assets.
2 P a g e. Elliot Wave Updates
 Summary Last week I concluded Short term there s a possibility to revisit SPX2700-2730 first before moving below SPX2600, but the most likely scenario is a direct move lower with an ultimate target of
Content. Commodities Weekly Technical Report to Weekly Technical Levels. Strategy/Recommendations
 Content Weekly Technical Levels Strategy/Recommendations Prepared by Anuj Gupta - Head Research (Tech.) Commodities & Currencies Anuj.gupta@angelbroking.com (011) 4916 5954 Tejas Anil Shigrekar - Technical
Technical Analysis Workshop Series. Session Eight Commodity Channel Index
 Technical Analysis Workshop Series Session Eight DISCLOSURES & DISCLAIMERS This research material has been prepared by NUS Invest. NUS Invest specifically prohibits the redistribution of this material
Daily Commentary. Developed Markets
 Daily Commentary Seattle Technical Advisors.com Ed Carlson, CMT ed@seattletechnicaladvisors.com Developed Markets US Equities were cast down upon the rocks on Monday giving up most (but not all) of Friday