ILLINOIS EPA INITIATIVE: ILLINOIS LEAKING UNDERGROUND STORAGE TANK PROGRAM CLOSURE AND PROPERTY REUSE STUDY. Hernando Albarracin Meagan Musgrave
|
|
|
- Anissa Campbell
- 5 years ago
- Views:
Transcription
1 ILLINOIS EPA INITIATIVE: ILLINOIS LEAKING UNDERGROUND STORAGE TANK PROGRAM CLOSURE AND PROPERTY REUSE STUDY Hernando Albarracin Meagan Musgrave
2 BACKGROUND 1998 Illinois General Assembly created Illinois UST Fund to provide a mechanism for UST owners and operators to meet their financial obligations more than $900 million in remediation costs Estimated that another $864 million needed to remediate remaining sites From the first fund-eligible leaking UST in 1984 through 2010, 23,407 incidents have been reported


3 OPEN 7,963 CLOSED 15, ,407
4 SAMPLE Area of Illinois Counties Sample Size Northeast Cook, DuPage, Kane 315 Northwest Carrol and Lee 60 Central, Northwest Peoria and Knox 50 Central, East Champaign, Clark, Macon Central, West Sangamon and Brown 40 Central, Southwest St. Clair and Monroe 40 Southern Hamilton, Jackson, Pope 35 Seven Areas Seventeen Counties

5 REGIONS
6 DATA Sample size will be largest from northeast Illinois where more than 50% of the incidents are located Dependent variable is incident s open/closed status Closed incident has taken sufficient corrective action to reduce risks to human health/environment Denoted by No Further Action (NFA) or No Further Remediation (NFR) letter All sites used within this study were chosen randomly to assure that this study has no bias
7 DATA CONTINUED Independent variables are income and crime index by zip code Income attained via U.S. Census Crime index attained via the Illinois State Police Confounding variables are the years the site has been open and groundwater used percentage Years open attained via the IEPA database Groundwater used attained via IEPA Source Water Assessment and Protection Program, Illinois County Health Departments, US EPA Envirofacts Safe Drinking Water
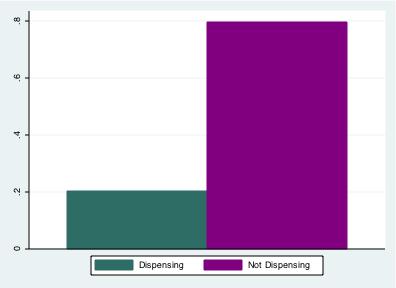
8 DUMMY VARIABLES Explanatory variables are categorical so we use dummy variables to contrast the different categories 0 represents absence of characteristic while a 1 means that the variable has the characteristic of interest For each variable we choose a baseline category and then contrast all remaining categories with the baseline Free Product Yes(1) No(0) Dispensing Yes(1) No(0) Adjacent Property Vacant, Residential, Industrial, Agricultural, Retail Owner Status Out-of-State, Deceased, Available, Unknown Owner Type Government, Private, Educational
9 U.S. EPA ILLINOIS CHAPTER Our descriptive statistics closely mirror the federal government s findings, which indicates that our study has external validity and will provide accurate results Example: Tank Age Federal Study-52 percent of releases are 5 years old or older IEPA Study-54 percent of releases are 5 years old or older


10 30% 70% 79.58% 94% 6% 20.42%


11 1.61% 6.91% 82.96% 39.71% 51.77% 15.27%..16% 1.45% 38.59% 4.98% 10.45% 32.78% 11.9% 8.52% 8.2% 84.73%

12 TANK AGE >10 Years Old CLOSED OPEN >5 Years Old Percentage

13 DEDUCTIBLE OPEN CLOSED $5,000 $15,000 $10,000 $100,000 $50,000 $5,000 $10,000 $15,000 $50,000 $100,000 40% of open releases receive funding 48% of closed releases receive funding 45% of all sites have received funding
14 LOGISTIC REGRESSION Predicts the probability (p) that the dependent variable is 1 rather than 0 P can only range from 0 to 1 and uses maximum likelihood method rather than leastsquared deviations MLM maximizes the probability of getting the observed results given the fitted regression coefficients Logit(p)=logit(p/(1-p)) Logit transformation is non-linear, it does not mean a constant increase in p; so the increase in p associated with a 1-unit increase in x1 changes with the value of x1 you begin with
15 THE MODEL The dependent variable in logistic regression is dichotomous The independent/predictor variables can take any form Do not have to be normally distributed, linearly related, or of equal variance within each group Relationship between predictor and response variables is not a linear function, instead it is the logit transformation of 0 Calculates the probability of success over the probability of failure Logit [ (x)] = [ (x)/1- (x)] = + 1X1+ 2X2...+ ixi +
16 HOSMER-LEMESHOW STATISTIC The idea of the HL test statistic is to compare predicted probabilities with observed data. Logistic Model for Status, Goodness-of-Fit Test Number of Observations 576 Number of Covariate Patterns 573 Pearson chi2(555) Prob>chi2.9086
17 The solid line shows the fraction of observed bases that equal 1 at each of the model s predicted probabilities of observing a 1. The closer to the diagonal, the better the fit of the model.
18 Logit (N-621) Percent Change in Odds Odds of: 1 vs 0 Status B Z P> z Percent Income Free Product Years Open ** -19.7** Dispensing Groundwater ** 0.6** 20 Tanks Tanks Government Education Industrial Agricultural Residential Vacant ** -74.6** Available Out-of-State

19 YEARS OPEN Percentage

20 YEARS OPEN

21 VACANT ADJACENT PROPERTIES Vacant Property Other Open Closed More open sites are next to vacant adjacent properties


22 CONCLUSIONS Vacant Adjacent Property Years Open Lack of Groundwater Usage OPEN SITE
23 MODEL THAT INCLUDES DEDUCTIBLE Logistic Model for Status, Goodness-of- Fit Test Number of Observations 259 Number of Covariate Patters 258 Pearson chi2(239) Prob > chi2.6205

24 This model still has a good fit, but based on this visualization it can be observed that this model explains less about the sites than the previous model
25 Logit (N=285): Percentage Change in Odds Odds of: 1 vs 0 Status B Z P> z Percent Income Free Product Years Open ** -19.7** Dispensing Deductible Tanks * -95.4* Tanks Tanks Government Education ** -79.7** Residential Vacant ** -76.3** Available Out-of State

26 Open Sites that have the option of receiving a lower deductible are remediated more frequently than sites that have higher deductibles

27 CONCLUSIONS WHEN A DEDUCTIBLE IS INVOLVED
28 SURVIVAL ANALYSIS Used Kaplan-Meier method Goal is to estimate population (site) survival curve from a sample Estimates survival over time Probability of surviving to any point is estimated from cumulative probability of surviving each of the preceding time intervals Vertical axis represents estimated probability of survival for hypothetical cohort, not actual percent of surviving

29
30 SUMMARY Longevity in age greatly decreases the probability of a site being remediated Sites located in areas that use large percentages groundwater are remediated faster Being next to a vacant site decreases probability of site being remediated When paying a deductible is involved education facilities have a lesser chance of being remediated than other types of sites
31 FUTURE RESEARCH Vacant property has a statistically significant relationship with crime index Chi-Square- Pr=0.021 Working on building a model that can appropriately capture this relationship Exploring Hierarchical Linear Model Suggestions? with questions: Hernando.Albarracin@illinois.gov
9. Logit and Probit Models For Dichotomous Data
 Sociology 740 John Fox Lecture Notes 9. Logit and Probit Models For Dichotomous Data Copyright 2014 by John Fox Logit and Probit Models for Dichotomous Responses 1 1. Goals: I To show how models similar
**BEGINNING OF EXAMINATION** A random sample of five observations from a population is:
 **BEGINNING OF EXAMINATION** 1. You are given: (i) A random sample of five observations from a population is: 0.2 0.7 0.9 1.1 1.3 (ii) You use the Kolmogorov-Smirnov test for testing the null hypothesis,
Appendix B: Methodology and Finding of Statistical and Econometric Analysis of Enterprise Survey and Portfolio Data
 Appendix B: Methodology and Finding of Statistical and Econometric Analysis of Enterprise Survey and Portfolio Data Part 1: SME Constraints, Financial Access, and Employment Growth Evidence from World
Calculating the Probabilities of Member Engagement
 Calculating the Probabilities of Member Engagement by Larry J. Seibert, Ph.D. Binary logistic regression is a regression technique that is used to calculate the probability of an outcome when there are
Subject CS1 Actuarial Statistics 1 Core Principles. Syllabus. for the 2019 exams. 1 June 2018
 ` Subject CS1 Actuarial Statistics 1 Core Principles Syllabus for the 2019 exams 1 June 2018 Copyright in this Core Reading is the property of the Institute and Faculty of Actuaries who are the sole distributors.
A Comparison of Univariate Probit and Logit. Models Using Simulation
 Applied Mathematical Sciences, Vol. 12, 2018, no. 4, 185-204 HIKARI Ltd, www.m-hikari.com https://doi.org/10.12988/ams.2018.818 A Comparison of Univariate Probit and Logit Models Using Simulation Abeer
Statistical Models of Stocks and Bonds. Zachary D Easterling: Department of Economics. The University of Akron
 Statistical Models of Stocks and Bonds Zachary D Easterling: Department of Economics The University of Akron Abstract One of the key ideas in monetary economics is that the prices of investments tend to
METRO/NON-METRO AREA (County) 1 PERSON 2 PERSON 3 PERSON 4 PERSON 5 PERSON 6 PERSON 7 PERSON 8 PERSON LIMIT LIMIT LIMIT LIMIT LIMIT LIMIT LIMIT LIMIT
 1 PERSON 2 PERSON 3 PERSON 4 PERSON 5 PERSON 6 PERSON 7 PERSON 8 PERSON LIMIT LIMIT LIMIT LIMIT LIMIT LIMIT LIMIT LIMIT") BLOOMINGTON/NORMAL (McLean) 120% $68,640 $78,480 $88,320 $98,040 $105,960 $113,760 $121,680 $129,480 80% $44,750 $51,150 $57,550 $63,900 $69,050 $74,150 $79,250 $84,350 60% $34,320 $39,240 $44,160 $49,020
BLOOMINGTON/NORMAL (McLean) 120% $68,640 $78,480 $88,320 $98,040 $105,960 $113,760 $121,680 $129,480 80% $44,750 $51,150 $57,550 $63,900 $69,050 $74,150 $79,250 $84,350 60% $34,320 $39,240 $44,160 $49,020
Supporting Information for:
 Supporting Information for: Can Political Participation Prevent Crime? Results from a Field Experiment about Citizenship, Participation, and Criminality This appendix contains the following material: Supplemental
Crash Involvement Studies Using Routine Accident and Exposure Data: A Case for Case-Control Designs
 Crash Involvement Studies Using Routine Accident and Exposure Data: A Case for Case-Control Designs H. Hautzinger* *Institute of Applied Transport and Tourism Research (IVT), Kreuzaeckerstr. 15, D-74081
Logit Models for Binary Data
 Chapter 3 Logit Models for Binary Data We now turn our attention to regression models for dichotomous data, including logistic regression and probit analysis These models are appropriate when the response
2014 Economic Impact Study
 2014 Economic Impact Study Locally funded, financially sound. How IMRF helps Illinois IMRF benefit payments have positive economic effects throughout the state. The pension payments that retirees spend
Models of Patterns. Lecture 3, SMMD 2005 Bob Stine
 Models of Patterns Lecture 3, SMMD 2005 Bob Stine Review Speculative investing and portfolios Risk and variance Volatility adjusted return Volatility drag Dependence Covariance Review Example Stock and
Lecture 21: Logit Models for Multinomial Responses Continued
 Lecture 21: Logit Models for Multinomial Responses Continued Dipankar Bandyopadhyay, Ph.D. BMTRY 711: Analysis of Categorical Data Spring 2011 Division of Biostatistics and Epidemiology Medical University
Hardest Hit Fund Homeowner Emergency Loan Program (HHF)
") Hardest Hit Fund Homeowner Emergency Loan Program (HHF) To finance the creation and the preservation of affordable housing throughout the State to increase the supply of decent and safe places for people
Hardest Hit Fund Homeowner Emergency Loan Program (HHF) To finance the creation and the preservation of affordable housing throughout the State to increase the supply of decent and safe places for people
Logistic Regression Analysis
 Revised July 2018 Logistic Regression Analysis This set of notes shows how to use Stata to estimate a logistic regression equation. It assumes that you have set Stata up on your computer (see the Getting
F. ANALYSIS OF FACTORS AFFECTING PROJECT EFFICIENCY AND SUSTAINABILITY
 F. ANALYSIS OF FACTORS AFFECTING PROJECT EFFICIENCY AND SUSTAINABILITY 1. A regression analysis is used to determine the factors that affect efficiency, severity of implementation delay (process efficiency)
STA 4504/5503 Sample questions for exam True-False questions.
 STA 4504/5503 Sample questions for exam 2 1. True-False questions. (a) For General Social Survey data on Y = political ideology (categories liberal, moderate, conservative), X 1 = gender (1 = female, 0
What Firms Know. Mohammad Amin* World Bank. May 2008
 What Firms Know Mohammad Amin* World Bank May 2008 Abstract: A large literature shows that the legal tradition of a country is highly correlated with various dimensions of institutional quality. Broadly,
Analyzing the Determinants of Project Success: A Probit Regression Approach
 2016 Annual Evaluation Review, Linked Document D 1 Analyzing the Determinants of Project Success: A Probit Regression Approach 1. This regression analysis aims to ascertain the factors that determine development
Modelling the potential human capital on the labor market using logistic regression in R
 Modelling the potential human capital on the labor market using logistic regression in R Ana-Maria Ciuhu (dobre.anamaria@hotmail.com) Institute of National Economy, Romanian Academy; National Institute
Data Mining: An Overview of Methods and Technologies for Increasing Profits in Direct Marketing
 Data Mining: An Overview of Methods and Technologies for Increasing Profits in Direct Marketing C. Olivia Rud, President, OptiMine Consulting, West Chester, PA ABSTRACT Data Mining is a new term for the
LOGISTIC REGRESSION ANALYSIS IN PERSONAL LOAN BANKRUPTCY. Siti Mursyida Abdul Karim & Dr. Haliza Abdul Rahman
 LOGISTIC REGRESSION ANALYSIS IN PERSONAL LOAN BANKRUPTCY Abstract Siti Mursyida Abdul Karim & Dr. Haliza Abdul Rahman Personal loan bankruptcy is defined as a person who had been declared as a bankrupt
CREDIT SCORING & CREDIT CONTROL XIV August 2015 Edinburgh. Aneta Ptak-Chmielewska Warsaw School of Ecoomics
 CREDIT SCORING & CREDIT CONTROL XIV 26-28 August 2015 Edinburgh Aneta Ptak-Chmielewska Warsaw School of Ecoomics aptak@sgh.waw.pl 1 Background literature Hypothesis Data and methods Empirical example Conclusions
YIELD EXCLUSION: DESCRIPTION AND GUIDANCE
 FEFO 15-01 January 13, 2015 IELD EXCLUSION: DESCRIPTION AND GUIDANCE The ield Exclusion (E) allows specific years to be dropped from the calculation of guarantee yields for crop insurance. This option
Contents Part I Descriptive Statistics 1 Introduction and Framework Population, Sample, and Observations Variables Quali
 Part I Descriptive Statistics 1 Introduction and Framework... 3 1.1 Population, Sample, and Observations... 3 1.2 Variables.... 4 1.2.1 Qualitative and Quantitative Variables.... 5 1.2.2 Discrete and Continuous
Intro to GLM Day 2: GLM and Maximum Likelihood
 Intro to GLM Day 2: GLM and Maximum Likelihood Federico Vegetti Central European University ECPR Summer School in Methods and Techniques 1 / 32 Generalized Linear Modeling 3 steps of GLM 1. Specify the
International Journal of Business and Administration Research Review, Vol. 1, Issue.1, Jan-March, Page 149
 DEVELOPING RISK SCORECARD FOR APPLICATION SCORING AND OPERATIONAL EFFICIENCY Avisek Kundu* Ms. Seeboli Ghosh Kundu** *Senior consultant Ernst and Young. **Senior Lecturer ITM Business Schooland Research
Lecture 10: Alternatives to OLS with limited dependent variables, part 1. PEA vs APE Logit/Probit
 Lecture 10: Alternatives to OLS with limited dependent variables, part 1 PEA vs APE Logit/Probit PEA vs APE PEA: partial effect at the average The effect of some x on y for a hypothetical case with sample
sociology SO5032 Quantitative Research Methods Brendan Halpin, Sociology, University of Limerick Spring 2018 SO5032 Quantitative Research Methods
 1 SO5032 Quantitative Research Methods Brendan Halpin, Sociology, University of Limerick Spring 2018 Lecture 10: Multinomial regression baseline category extension of binary What if we have multiple possible
proc genmod; model malform/total = alcohol / dist=bin link=identity obstats; title 'Table 2.7'; title2 'Identity Link';
 BIOS 6244 Analysis of Categorical Data Assignment 5 s 1. Consider Exercise 4.4, p. 98. (i) Write the SAS code, including the DATA step, to fit the linear probability model and the logit model to the data
DATA SUMMARIZATION AND VISUALIZATION
 APPENDIX DATA SUMMARIZATION AND VISUALIZATION PART 1 SUMMARIZATION 1: BUILDING BLOCKS OF DATA ANALYSIS 294 PART 2 PART 3 PART 4 VISUALIZATION: GRAPHS AND TABLES FOR SUMMARIZING AND ORGANIZING DATA 296
ME3620. Theory of Engineering Experimentation. Spring Chapter III. Random Variables and Probability Distributions.
 ME3620 Theory of Engineering Experimentation Chapter III. Random Variables and Probability Distributions Chapter III 1 3.2 Random Variables In an experiment, a measurement is usually denoted by a variable
Copyright 2011 Pearson Education, Inc. Publishing as Addison-Wesley.
 Appendix: Statistics in Action Part I Financial Time Series 1. These data show the effects of stock splits. If you investigate further, you ll find that most of these splits (such as in May 1970) are 3-for-1
Dummy Variables. 1. Example: Factors Affecting Monthly Earnings
 Dummy Variables A dummy variable or binary variable is a variable that takes on a value of 0 or 1 as an indicator that the observation has some kind of characteristic. Common examples: Sex (female): FEMALE=1
Non linearity issues in PD modelling. Amrita Juhi Lucas Klinkers
 Non linearity issues in PD modelling Amrita Juhi Lucas Klinkers May 2017 Content Introduction Identifying non-linearity Causes of non-linearity Performance 2 Content Introduction Identifying non-linearity
Average Earnings and Long-Term Mortality: Evidence from Administrative Data
 American Economic Review: Papers & Proceedings 2009, 99:2, 133 138 http://www.aeaweb.org/articles.php?doi=10.1257/aer.99.2.133 Average Earnings and Long-Term Mortality: Evidence from Administrative Data
Valuing Environmental Impacts: Practical Guidelines for the Use of Value Transfer in Policy and Project Appraisal
 Valuing Environmental Impacts: Practical Guidelines for the Use of Value Transfer in Policy and Project Appraisal Annex 3 Glossary of Econometric Terminology Submitted to Department for Environment, Food
o Enrollment requirements for IDPH programs o Contact Information to find a local enrollment specialist
 This packet contains IMPORTANT information about The Affordable Care Act and how it will coordinate with the Illinois Department of Public Health s Ryan White Programs This packet contains: Informational
Econometric Methods for Valuation Analysis
 Econometric Methods for Valuation Analysis Margarita Genius Dept of Economics M. Genius (Univ. of Crete) Econometric Methods for Valuation Analysis Cagliari, 2017 1 / 25 Outline We will consider econometric
NPTEL Project. Econometric Modelling. Module 16: Qualitative Response Regression Modelling. Lecture 20: Qualitative Response Regression Modelling
 1 P age NPTEL Project Econometric Modelling Vinod Gupta School of Management Module 16: Qualitative Response Regression Modelling Lecture 20: Qualitative Response Regression Modelling Rudra P. Pradhan
STATISTICAL METHODS FOR CATEGORICAL DATA ANALYSIS
 STATISTICAL METHODS FOR CATEGORICAL DATA ANALYSIS Daniel A. Powers Department of Sociology University of Texas at Austin YuXie Department of Sociology University of Michigan ACADEMIC PRESS An Imprint of
Session 178 TS, Stats for Health Actuaries. Moderator: Ian G. Duncan, FSA, FCA, FCIA, FIA, MAAA. Presenter: Joan C. Barrett, FSA, MAAA
 Session 178 TS, Stats for Health Actuaries Moderator: Ian G. Duncan, FSA, FCA, FCIA, FIA, MAAA Presenter: Joan C. Barrett, FSA, MAAA Session 178 Statistics for Health Actuaries October 14, 2015 Presented
Lake County. Government Finance Study. Supplemental Material by Geography. Prepared by the Indiana Business Research Center
 County Government Finance Study Supplemental Material by Geography Prepared by the Indiana Business Research www.ibrc.indiana.edu for Sustainable Regional Vitality www.iun.edu/~csrv/index.shtml west Indiana
SEX DISCRIMINATION PROBLEM
 SEX DISCRIMINATION PROBLEM 5. Displaying Relationships between Variables In this section we will use scatterplots to examine the relationship between the dependent variable (starting salary) and each of
CHAPTER 11 Regression with a Binary Dependent Variable. Kazu Matsuda IBEC PHBU 430 Econometrics
 CHAPTER 11 Regression with a Binary Dependent Variable Kazu Matsuda IBEC PHBU 430 Econometrics Mortgage Application Example Two people, identical but for their race, walk into a bank and apply for a mortgage,
County School Facilities Sales Tax
 County School Facilities Sales Tax Presentation for: Capital Area Realtors Association August 9, 08 Illinois County School Facility Tax Public Act 97 054 Illinois County School Facilities Sales Tax Map
Assessment on Credit Risk of Real Estate Based on Logistic Regression Model
 Assessment on Credit Risk of Real Estate Based on Logistic Regression Model Li Hongli 1, a, Song Liwei 2,b 1 Chongqing Engineering Polytechnic College, Chongqing400037, China 2 Division of Planning and
Chapter 7 1. Random Variables
 Chapter 7 1 Random Variables random variable numerical variable whose value depends on the outcome of a chance experiment - discrete if its possible values are isolated points on a number line - continuous
The Impact of a $15 Minimum Wage on Hunger in America
 The Impact of a $15 Minimum Wage on Hunger in America Appendix A: Theoretical Model SEPTEMBER 1, 2016 WILLIAM M. RODGERS III Since I only observe the outcome of whether the household nutritional level
Housing Price Forecasts. Illinois MSAs. Third Quarter, 2016
 Housing Price Forecasts Illinois MSAs Third Quarter, 2016 Presented To Illinois REALTORS From R E A L Regional Economics Applications Laboratory, Institute of Government and Public Affairs University of
Multiple Regression and Logistic Regression II. Dajiang 525 Apr
 Multiple Regression and Logistic Regression II Dajiang Liu @PHS 525 Apr-19-2016 Materials from Last Time Multiple regression model: Include multiple predictors in the model = + + + + How to interpret the
Your Name (Please print) Did you agree to take the optional portion of the final exam Yes No. Directions
 Did you agree to take the optional portion of the final exam Yes No. Directions") Your Name (Please print) Did you agree to take the optional portion of the final exam Yes No (Your online answer will be used to verify your response.) Directions There are two parts to the final exam.
Your Name (Please print) Did you agree to take the optional portion of the final exam Yes No (Your online answer will be used to verify your response.) Directions There are two parts to the final exam.
To be two or not be two, that is a LOGISTIC question
 MWSUG 2016 - Paper AA18 To be two or not be two, that is a LOGISTIC question Robert G. Downer, Grand Valley State University, Allendale, MI ABSTRACT A binary response is very common in logistic regression
Married Women s Labor Supply Decision and Husband s Work Status: The Experience of Taiwan
 Married Women s Labor Supply Decision and Husband s Work Status: The Experience of Taiwan Hwei-Lin Chuang* Professor Department of Economics National Tsing Hua University Hsin Chu, Taiwan 300 Tel: 886-3-5742892
Lake County. Government Finance Study. Supplemental Material by Geography. Prepared by the Indiana Business Research Center
 County Government Finance Study Supplemental Material by Geography Prepared by the Indiana Business Research www.ibrc.indiana.edu for Sustainable Regional Vitality www.iun.edu/~csrv/index.shtml west Indiana
New Health Insurance Tax Credits in Illinois
 EMBargoed until 11 am EDT Thursday, April 4, 2013 New Health Insurance Tax Credits in Illinois Families USA Help Is at Hand: New Health Insurance Tax Credits in Illinois April 2013 by Families USA This
Reinsuring Group Revenue Insurance with. Exchange-Provided Revenue Contracts. Bruce A. Babcock, Dermot J. Hayes, and Steven Griffin
 Reinsuring Group Revenue Insurance with Exchange-Provided Revenue Contracts Bruce A. Babcock, Dermot J. Hayes, and Steven Griffin CARD Working Paper 99-WP 212 Center for Agricultural and Rural Development
*9-BES2_Logistic Regression - Social Economics & Public Policies Marcelo Neri
 Econometric Techniques and Estimated Models *9 (continues in the website) This text details the different statistical techniques used in the analysis, such as logistic regression, applied to discrete variables
Do We Have Enough Money?
 Presented by: John Sherrill Illinois Environmental Protection Agency John Wade Senior Consulting Actuary, Pinnacle Actuarial Resources, Inc. John Sherrill Illinois Environmental Protection Agency Everything
Quantitative Methods for Health Care Professionals PUBH 741 (2013)
") 1 Quantitative Methods for Health Care Professionals PUBH 741 (2013) Instructors: Joanne Garrett, PhD Kim Faurot, PA, MPH e-mail: joanne_garrett@med.unc.edu faurot@med.unc.edu Assigned Readings: Copies
1 Quantitative Methods for Health Care Professionals PUBH 741 (2013) Instructors: Joanne Garrett, PhD Kim Faurot, PA, MPH e-mail: joanne_garrett@med.unc.edu faurot@med.unc.edu Assigned Readings: Copies
State Issue 3 Grants a monopoly for the commercial production and sale of marijuana County Variance Sorted Alphabetically By County
 County Variance Sorted Alphabetically By County 2015 2015 2015 2015 2015 Vote 2015 Percent County Region Media Mkt. ISSUE 3 YES ISSUE 3 YES% *ISSUE 3 NO *ISSUE 3 NO% Variance (I) Variance (I) 2015 (I)
Random Variables and Probability Distributions
 Chapter 3 Random Variables and Probability Distributions Chapter Three Random Variables and Probability Distributions 3. Introduction An event is defined as the possible outcome of an experiment. In engineering
Market Variables and Financial Distress. Giovanni Fernandez Stetson University
 Market Variables and Financial Distress Giovanni Fernandez Stetson University In this paper, I investigate the predictive ability of market variables in correctly predicting and distinguishing going concern
CHAPTER 4 ESTIMATES OF RETIREMENT, SOCIAL SECURITY BENEFIT TAKE-UP, AND EARNINGS AFTER AGE 50
 CHAPTER 4 ESTIMATES OF RETIREMENT, SOCIAL SECURITY BENEFIT TAKE-UP, AND EARNINGS AFTER AGE 5 I. INTRODUCTION This chapter describes the models that MINT uses to simulate earnings from age 5 to death, retirement
Supporting Online Material for
 www.sciencemag.org/cgi/content/full/323/5918/1183/dc1 Supporting Online Material for Predicting Elections: Child s Play! John Antonakis* and Olaf Dalgas *To whom correspondence should be addressed. E-mail:
Multivariate Analysis of Student Loan Defaulters at Prairie View A&M University
 December 2006 Multivariate Analysis of Student Loan Defaulters at Prairie View A&M University Conducted by TG Research and Analytical Services Sandra Barone Multivariate Analysis of Student Loan Defaulters
Northeast Region Baseline Report
 1 Northeast Region Baseline Report 2006-2016 Report R-2009-02 April 2009 Amy Lake Sara Alva Lizarraga Dennis Robinson Tom Johnson 215 Middlebush Hall University of Missouri Columbia, Missouri 65211-6200
IGE: The State of the Literature
 PhD Student, Department of Economics Center for the Economics of Human Development The University of Chicago setzler@uchicago.edu March 10, 2015 1 Literature, Facts, and Open Questions 2 Population-level
The Determinants of Bank Mergers: A Revealed Preference Analysis
 The Determinants of Bank Mergers: A Revealed Preference Analysis Oktay Akkus Department of Economics University of Chicago Ali Hortacsu Department of Economics University of Chicago VERY Preliminary Draft:
Wallingford Public Schools Strategic Plan Date: December 1, 2016 Strategic Plan Area: Facilities
 Goal # 1 : To maintain facilities to meet all federal, state and local safety guidelines and regulatory codes Objective: Support preventative maintenance plan developed based on safety guidelines, regulatory
CPSC 540: Machine Learning
 CPSC 540: Machine Learning Monte Carlo Methods Mark Schmidt University of British Columbia Winter 2019 Last Time: Markov Chains We can use Markov chains for density estimation, d p(x) = p(x 1 ) p(x }{{}
Template Version Date: May 2011
 This document describes the Housing Finance Agency (HFA) Hardest-Hit Fund (HHF) data that state HFAs are required to provide to Bank of New York Mellon. It includes quarterly borrower characteristic data
LATE PLANTING AND CROP INSURANCE
 FEFO 09-09 June 1, 2009 LATE PLANTING AND CROP INSURANCE Adverse planting conditions this spring has resulted in many crop insurance questions related to replant, prevented planting, and late planting
Catherine De Vries, Spyros Kosmidis & Andreas Murr
 APPLIED STATISTICS FOR POLITICAL SCIENTISTS WEEK 8: DEPENDENT CATEGORICAL VARIABLES II Catherine De Vries, Spyros Kosmidis & Andreas Murr Topic: Logistic regression. Predicted probabilities. STATA commands
Chapter 3. Numerical Descriptive Measures. Copyright 2016 Pearson Education, Ltd. Chapter 3, Slide 1
 Chapter 3 Numerical Descriptive Measures Copyright 2016 Pearson Education, Ltd. Chapter 3, Slide 1 Objectives In this chapter, you learn to: Describe the properties of central tendency, variation, and
Illinois HFA Performance Data Reporting- Borrower Characteristics
 This document describes the Housing Finance Agency (HFA) Hardest-Hit Fund (HHF) data that state HFAs are required to provide to Bank of New York Mellon. It includes quarterly borrower characteristic data
Stat 328, Summer 2005
 Stat 328, Summer 2005 Exam #2, 6/18/05 Name (print) UnivID I have neither given nor received any unauthorized aid in completing this exam. Signed Answer each question completely showing your work where
AP Statistics Chapter 6 - Random Variables
 AP Statistics Chapter 6 - Random 6.1 Discrete and Continuous Random Objective: Recognize and define discrete random variables, and construct a probability distribution table and a probability histogram
Commercial Real Estate Program 2012 Impact Analysis- Add On Analysis
 March 19, 2014 Commercial Real Estate Program 2012 Impact Analysis- Add On Analysis Prepared by: Itron 601 Officers Row Vancouver, WA 98661 Northwest Energy Efficiency Alliance PHONE 503-688-5400 FAX 503-688-5447
Module 4 Bivariate Regressions
 AGRODEP Stata Training April 2013 Module 4 Bivariate Regressions Manuel Barron 1 and Pia Basurto 2 1 University of California, Berkeley, Department of Agricultural and Resource Economics 2 University of
Model fit assessment via marginal model plots
 The Stata Journal (2010) 10, Number 2, pp. 215 225 Model fit assessment via marginal model plots Charles Lindsey Texas A & M University Department of Statistics College Station, TX lindseyc@stat.tamu.edu
Market Timing Does Work: Evidence from the NYSE 1
 Market Timing Does Work: Evidence from the NYSE 1 Devraj Basu Alexander Stremme Warwick Business School, University of Warwick November 2005 address for correspondence: Alexander Stremme Warwick Business
Online Appendix for Does mobile money affect saving behavior? Evidence from a developing country Journal of African Economies
 Online Appendix for Does mobile money affect saving behavior? Evidence from a developing country Journal of African Economies Serge Ky, Clovis Rugemintwari and Alain Sauviat In this document we report
Effect of Data Collection Period Length on Marginal Cost Models for Heavy Equipment
 Effect of Data Collection Period Length on Marginal Cost Models for Heavy Equipment Blake T. Dulin, MSCFM and John C. Hildreth, Ph.D. University of North Carolina at Charlotte Charlotte, NC Equipment managers
The Effect of Life Settlement Portfolio Size on Longevity Risk
 The Effect of Life Settlement Portfolio Size on Longevity Risk Published by Insurance Studies Institute August, 2008 Insurance Studies Institute is a non-profit foundation dedicated to advancing knowledge
Clark. Outside of a few technical sections, this is a very process-oriented paper. Practice problems are key!
 Opening Thoughts Outside of a few technical sections, this is a very process-oriented paper. Practice problems are key! Outline I. Introduction Objectives in creating a formal model of loss reserving:
Economic Impacts of the Arkansas Private Option. Chris Brown, John Bennett Regional Economic Models, Inc.
 Economic Impacts of the Arkansas Private Option Chris Brown, John Bennett Regional Economic Models, Inc. August 2015 1 Executive Summary Arkansas increased access to health care by enacting Act 1498, The
Ordinal Multinomial Logistic Regression. Thom M. Suhy Southern Methodist University May14th, 2013
 Ordinal Multinomial Logistic Thom M. Suhy Southern Methodist University May14th, 2013 GLM Generalized Linear Model (GLM) Framework for statistical analysis (Gelman and Hill, 2007, p. 135) Linear Continuous
A MULTIVARIATE ANALYSIS OF FINANCIAL AND MARKET- BASED VARIABLES FOR BOND RATING PREDICTION
 Martina NOVOTNÁ, PhD Technical University of Ostrava Department of Finance Ostrava E-mail: martina.novotna@vsb.cz. A MULTIVARIATE ANALYSIS OF FINANCIAL AND MARKET- BASED VARIABLES FOR BOND RATING PREDICTION
ASSESSING CREDIT DEFAULT USING LOGISTIC REGRESSION AND MULTIPLE DISCRIMINANT ANALYSIS: EMPIRICAL EVIDENCE FROM BOSNIA AND HERZEGOVINA
 Interdisciplinary Description of Complex Systems 13(1), 128-153, 2015 ASSESSING CREDIT DEFAULT USING LOGISTIC REGRESSION AND MULTIPLE DISCRIMINANT ANALYSIS: EMPIRICAL EVIDENCE FROM BOSNIA AND HERZEGOVINA
Unit 5: Study Guide Multilevel models for macro and micro data MIMAS The University of Manchester
 Unit 5: Study Guide Multilevel models for macro and micro data MIMAS The University of Manchester 5.1 Introduction 5.2 Learning objectives 5.3 Single level models 5.4 Multilevel models 5.5 Theoretical
Relating Cash Flow and Total Return: Do Properties with Lower Near-Term Cash Flows Produce Higher Total Returns?
 Publication Reference Do Properties with Lower Near-Term Don MacKay, Ph.D. January 2001 Conventional wisdom among the timberland investment community suggests that timberland properties with a relatively
Jaime Frade Dr. Niu Interest rate modeling
 Interest rate modeling Abstract In this paper, three models were used to forecast short term interest rates for the 3 month LIBOR. Each of the models, regression time series, GARCH, and Cox, Ingersoll,
the display, exploration and transformation of the data are demonstrated and biases typically encountered are highlighted.
 1 Insurance data Generalized linear modeling is a methodology for modeling relationships between variables. It generalizes the classical normal linear model, by relaxing some of its restrictive assumptions,
book 2014/5/6 15:21 page 261 #285
 book 2014/5/6 15:21 page 261 #285 Chapter 10 Simulation Simulations provide a powerful way to answer questions and explore properties of statistical estimators and procedures. In this chapter, we will
Name: 1. Use the data from the following table to answer the questions that follow: (10 points)
") Economics 345 Mid-Term Exam October 8, 2003 Name: Directions: You have the full period (7:20-10:00) to do this exam, though I suspect it won t take that long for most students. You may consult any materials,
Economics 345 Mid-Term Exam October 8, 2003 Name: Directions: You have the full period (7:20-10:00) to do this exam, though I suspect it won t take that long for most students. You may consult any materials,
CPSC 540: Machine Learning
 CPSC 540: Machine Learning Monte Carlo Methods Mark Schmidt University of British Columbia Winter 2018 Last Time: Markov Chains We can use Markov chains for density estimation, p(x) = p(x 1 ) }{{} d p(x
Facility Name, Address, State & Zip Code
 New Business Application for Environmental Impairment Liability Answer all questions, use separate sheets if necessary. NOTE: There are two sections to this application (1-9) and (A - Q) 1. Applicant/Parent
Introduction to Population Modeling
 Introduction to Population Modeling In addition to estimating the size of a population, it is often beneficial to estimate how the population size changes over time. Ecologists often uses models to create