Expectations Surveys in the Philippine Statistical System 1 by Romulo A. Virola and Candido J. Astrologo, Jr. 2
|
|
|
- Bathsheba Hood
- 5 years ago
- Views:
Transcription
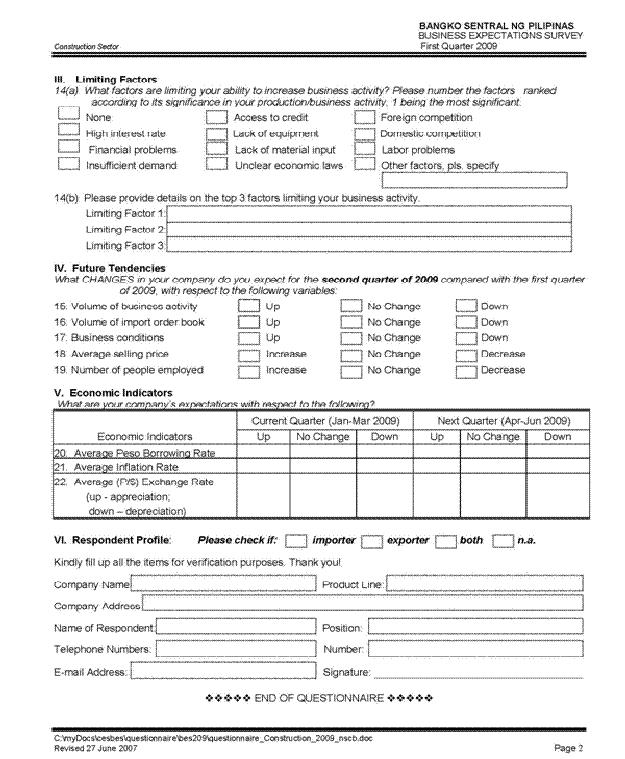
1 Expectations Surveys in the Philippine Statistical System 1 by Romulo A. Virola and Candido J. Astrologo, Jr. 2 I. Introduction As early as 1986, the Philippine Statistical System started implementing expectations surveys that aimed to assess the direction and general state of business and the economy especially during times of economic uncertainties. These surveys consist of two quarterly opinion surveys the Business Expectations Survey of top corporations in the Philippines and the Consumer Expectations Survey of households in the country, both conducted by the Bangko Sentral ng Pilipinas 3 (BSP). They provide quarterly outlook on the economy by businesses and consumers nationwide. This paper presents the profile of the two expectation surveys in terms of its objectives, uses and sampling design. The latest results of the surveys are also included. II. Business Expectations Survey 1. About the Survey The Business Expectations Survey (BES) is a statistical tool that makes use of opinion-testing techniques to collect information from entrepreneurs about business conditions in their own companies. It is likewise a means of obtaining information about entrepreneurs views on the general business situation in their own industry, in the national industrial sector or in the national economy. In 1986, the BSP initiated the conduct of a semestral Survey of Business Expectations to respond to the growing need to feel the pulse of the business industry. The survey was intended primarily to provide the Monetary Board with indicators on the current and prospective outlook of the business sector. The survey was designed to generate quantitative measures of projected semi-annual percentage changes in selected business variables (net sales/revenues, cost of production/sales, current assets/liabilities, among others) that can be used as indicators of general business conditions and tendencies. The survey covered three half-year periods: previous, current and next semesters and was conducted in Metro Manila only 4. A sample size of 300 was drawn from the Securities and Exchange Commission s (SEC s) list of top 1000 corporations in the Philippines (see [1]). Beginning in the second quarter of 2001, the BSP, funded by technical assistance from the Asian Development Bank (ADB), enhanced and strengthened the BES to harmonize it with other tendency surveys conducted in selected Asian countries thereby facilitating inter-country comparison. As a result, the questionnaire was revised to incorporate a core set of standard questions, and the methodology was changed to make it consistent with those of other countries in the region. The core questions were revised to provide qualitative indicators of the expected 1 Paper prepared for the Third International Seminar on Early Warning and Business Cycle Indicators, Moscow, Russian Federation, November Secretary General and Director of the National Statistical Coordination Board, respectively. The views expressed in this paper are those of the authors and do not necessarily reflect the views of the NSCB. The authors would like to acknowledge the assistance of Teresita B. Deveza of the Bangko Sentral ng Pilipinas in the preparation of this paper. 3 The Central Bank of the Philippines 4 Metro Manila or NCR (National Capital Region) is one of the 17 regions of the Philippines as of September 2010 and had a share of 32.5 percent of the total GDP (at constant 1985 prices) of the Philippines in
2 performance of the business sector that would indicate whether it is anticipating an improving, unchanged, or worsening business condition. In addition, the survey sought to get the perceptions of the businesses regarding the short-term prospects of the economy as well as the movements of key economic indicators. Moreover, the frequency and reference periods were revised from semestral to quarterly to make the survey more useful as a leading indicator. The harmonized BES was conducted in Metro Manila using a stratified random sampling of 510 sample firms across four major industry groups and 12 industry sub-groups drawn from the Securities and Exchange Commission s list of Top 3000 Corporations published in 2000 (see [1]). Starting in the fourth quarter of 2003, the BES coverage was expanded to include regions outside the National Capital Region (NCR), namely Regions I, VII and XI. Beginning in the third quarter of 2004, two more regions were included in the survey, i.e, Regions III and IV. To date, the quarterly BES is conducted nationwide among 17 regions in the country with around 1,600 sample firms drawn from SEC s list of Top 7,000 corporations. From a 31 percent response rate at the start of the harmonized BES in NCR during the second quarter of 2001, the average nationwide response rate has improved to 73 percent. The latest results of the BES and a graph showing the results of the BES and the GDP growth rate (at constant 1985 prices) are shown in Annex A. 2. Objectives Given its forward-looking nature, data generated from the survey are intended to provide decision makers and other stakeholders with supplemental indicators for short-term planning, forecasting, risk management and surveillance activities. In the case of the BSP, results of the BES provide monetary authorities with advanced information on the current and near-term economic and business conditions, and other indicators of aggregate demand that are useful inputs for the formulation of monetary policy. The BES presents the perception of different groups on current and near-term business condition including levels of production and economic activity as well as factors that could influence the movement of key economic variables namely, Gross Domestic Product (GDP), interest rate, peso/dollar exchange rate and inflation rate. 3. Uses The BES is used, among others, to: get advanced information on the short-term outlook and on turning points in the business cycle; provide basis for analyzing particular problems such as growing company debt and profitability that may indicate potential bottlenecks; serve as an indicator or signal of financial problems which could lead to an impending financial crisis; serve as basis for forecasting short-term business cycles; and complement quantitative economic indicators The results of the BES could be used to check the consistency of GDP, inflation, and employment figures with the prevailing sentiments of BES respondents. 2
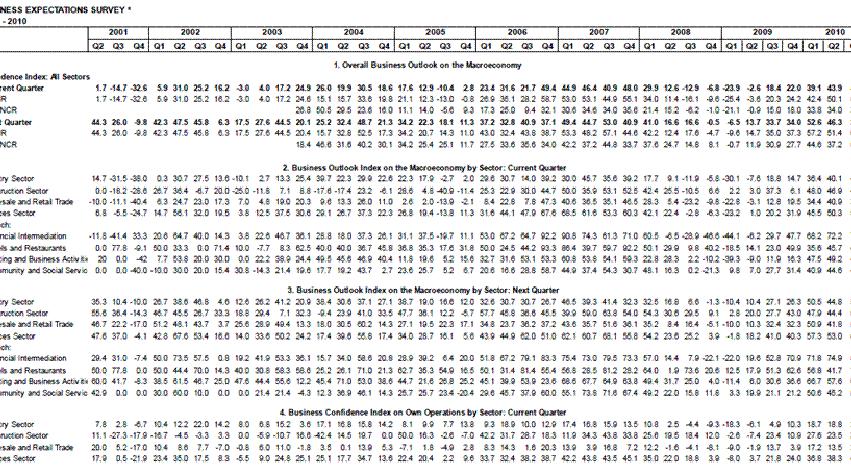
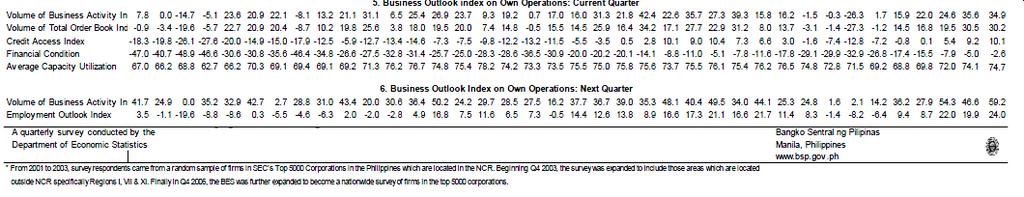
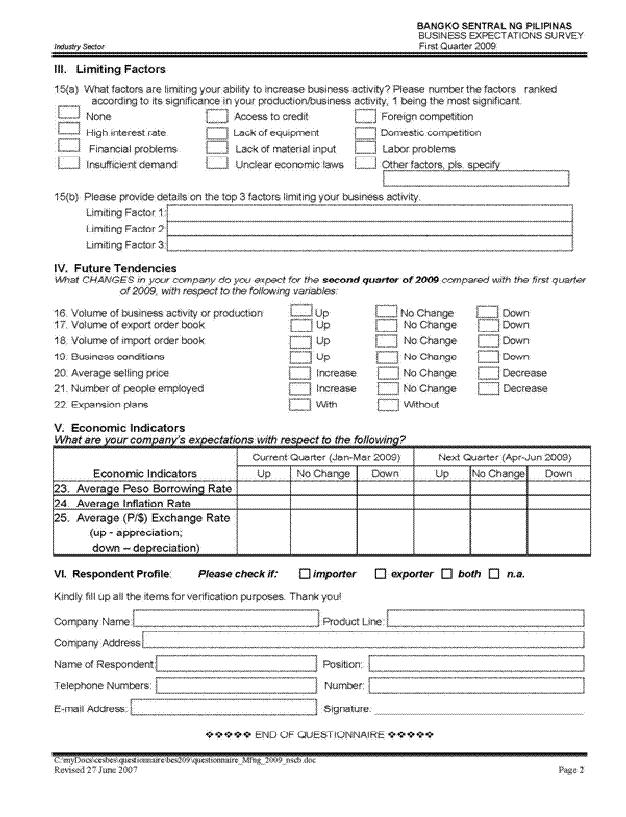
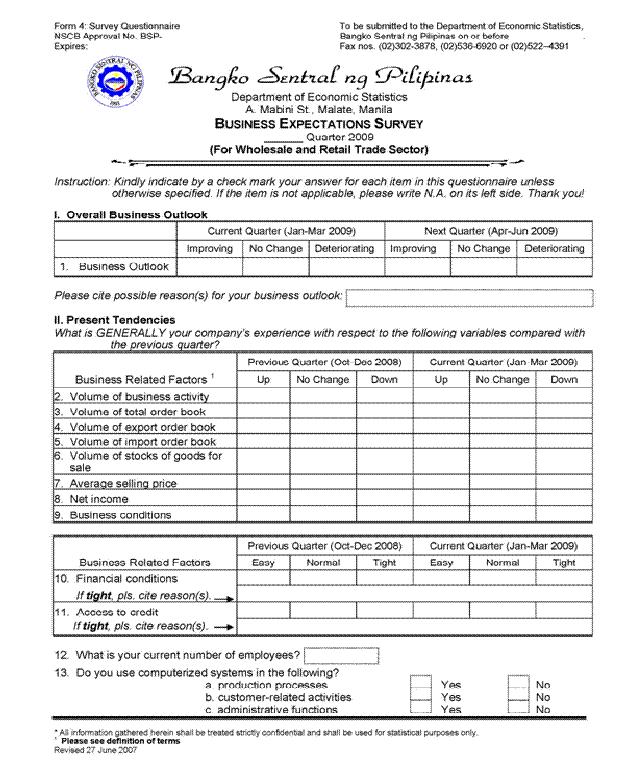
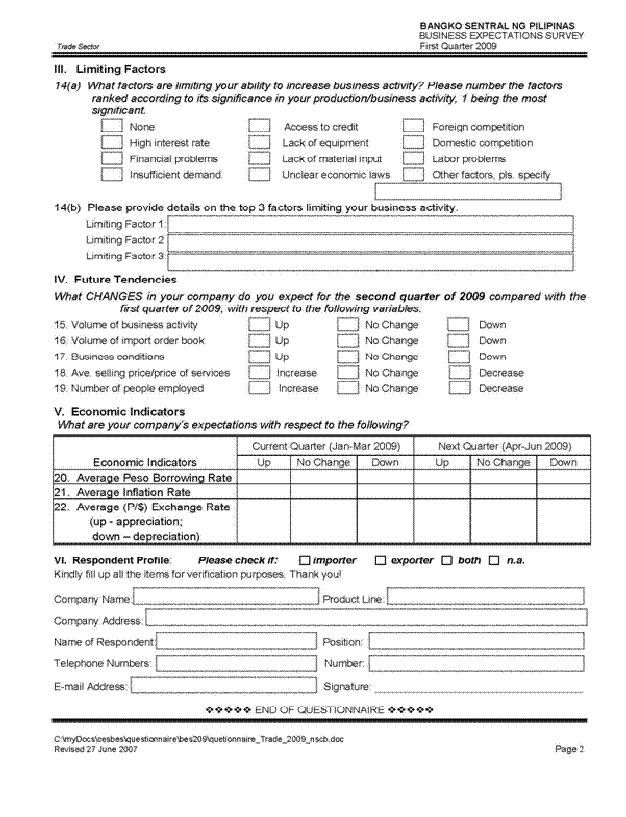
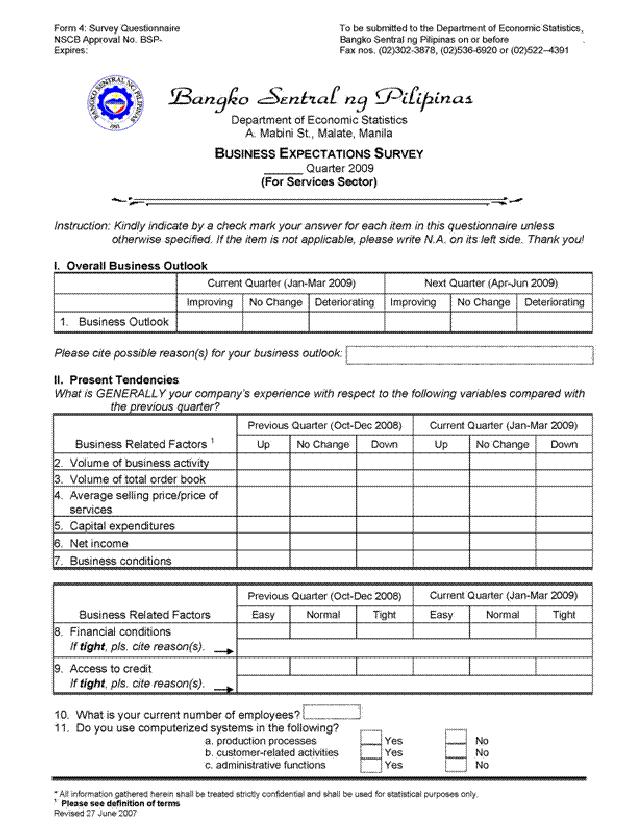
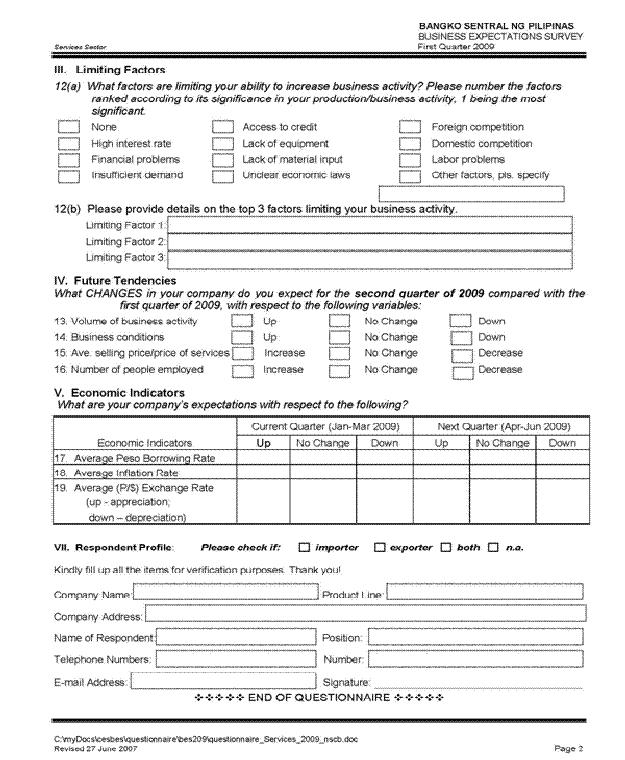
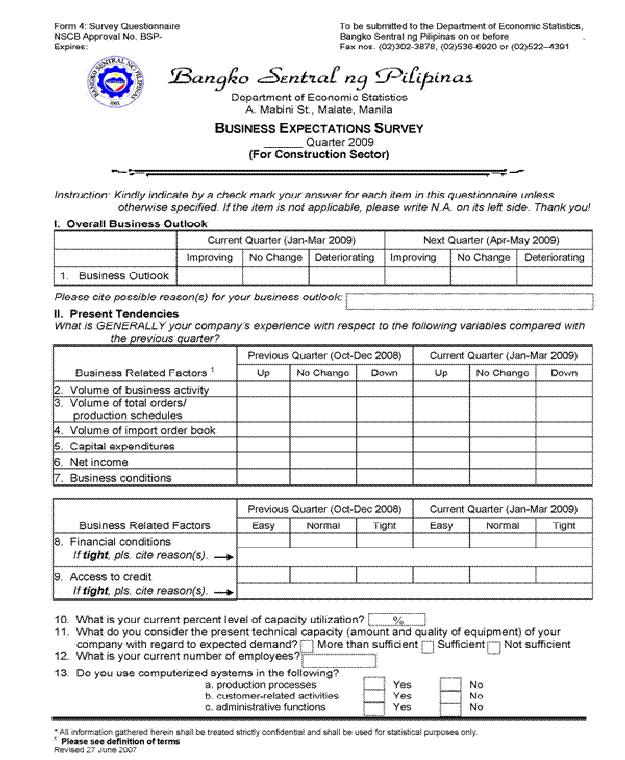
3 4. Sampling Design The BES uses a stratified random sampling design using corporations from the SEC s Top 7000 Corporations (ranked based on Gross Revenues) as sampling units. The top 7000 corporations is subdivided into 196 strata classified by region NCR and Areas Outside NCR (the other 15 regions of the country 5 ) and by 12 industry sub-groups namely: (a) Group 1: Industry, which consists of manufacturing, mining and quarrying, electricity, gas and water and agriculture, fishery and forestry; (b) Group II: Construction; (c) Group III: Wholesale and Retail Trade; and (d) Group IV: Services Sector, which consists of financial intermediation, real estate, renting and business activities, hotels and restaurants, transport, storage and communications and community, social and personal services, using the 1994 Philippine Standard Industrial Classification (PSIC) (see [2]). A questionnaire of the BES is attached as Annex B Sample Selection and Size A simple random sample of firms is drawn from each stratum for a total sample size of 1,631 firms. Due to the small number of top firms (less than 100) located in majority of the regions, a 100% sampling rate was used in all the strata for these regions, namely, Regions 1, 2, 5, 6, 8, 9, 10, 12, CAR, ARMM and Caraga. For the other regions namely NCR, and Regions 3, 4, 7, and 11 random samples were drawn from each stratum Weighting The stratum weight W h is computed as the number of firms within the stratum over the total population size as follows: W h =N h /N where h = 1, 2,,192 N h = total number of firms in the hth stratum N = 6970, the population size or the total number of firms belonging to the Top 7000 with adjustments based on the number of firms which could not be located/no longer existing at the time of the survey. 5. Tables generated from the survey National Tables 1. Overall Business Outlook on the Macroeconomy 2. Business Outlook Index on the Macroeconomy by Sector: Current Quarter 3. Business Outlook Index on the Macroeconomy by Sector: Next Quarter 4. Business Confidence Index on Own Operations by Sector: Current Quarter 5. Business Outlook Index on Own Operations: Current Quarter Regional Tables 1. Overall Business Outlook on the Macroeconomy 2. Business Outlook Index on the Macroeconomy by Sector: Current Quarter 3. Business Outlook Index on the Macroeconomy by Sector: Next Quarter 4. Business Confidence Index on Own Operations by Sector: Current Quarter 5. Business Outlook Index on Own Operations: Current Quarter 5 Areas Outside NCR comprise 16 regions. However, in the BES, Region IV A (CALABARZON) and Region IV B (MIMAROPA) are counted as one region. 3
4 National Tables 6. Business Outlook Index on Own Operations: Next Quarter 7. Companies with Expansion Plans (in percent): Next Quarter 8. Business Constraints: Current Quarter 9. Business Expectations Index on Selected Economic Indicators: Current Quarter 10. Business Expectations Index on Selected Economic Indicators: Next Quarter 11. Percentage Distribution of Respondents by Employment Size 12. Distribution of Respondent Firms by Sector 13. Business Outlook Index on the Macroeconomy by Importer/Exporter Category 14. Business Outlook Index on the Macroeconomy by Employment Size Regional Tables 6. Business Outlook Index on Own Operations: Next Quarter 7. Companies with Expansion Plans (in percent): Next Quarter 8. Business Constraints: Current Quarter 9. Business Expectations Index on Selected Economic Indicators: Current Quarter 10. Business Expectations Index on Selected Economic Indicators: Next Quarter 11. Percentage Distribution of Respondents by Employment Size 12. Distribution of Respondent Firms by Sector 13. Business Outlook Index on the Macroeconomy by Importer/Exporter Category 14. Business Outlook Index on the Macroeconomy by Employment Size 4
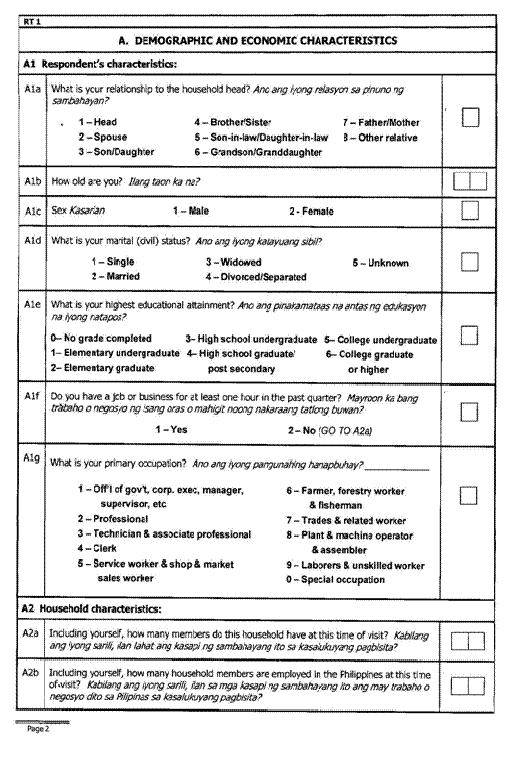
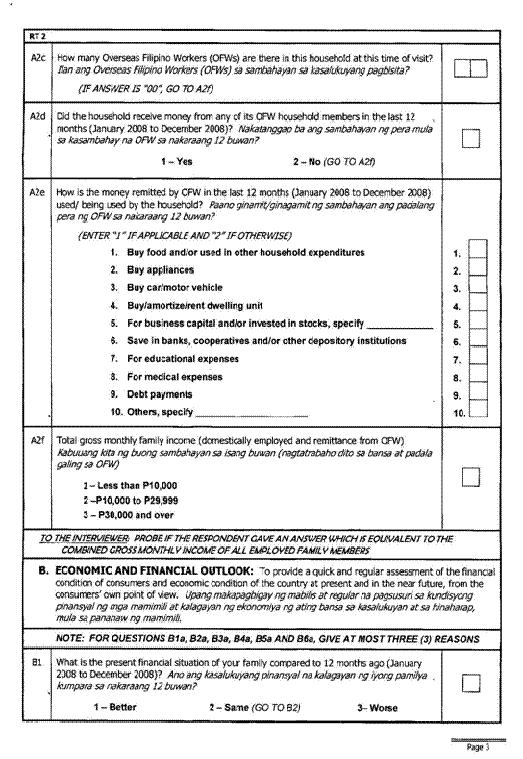
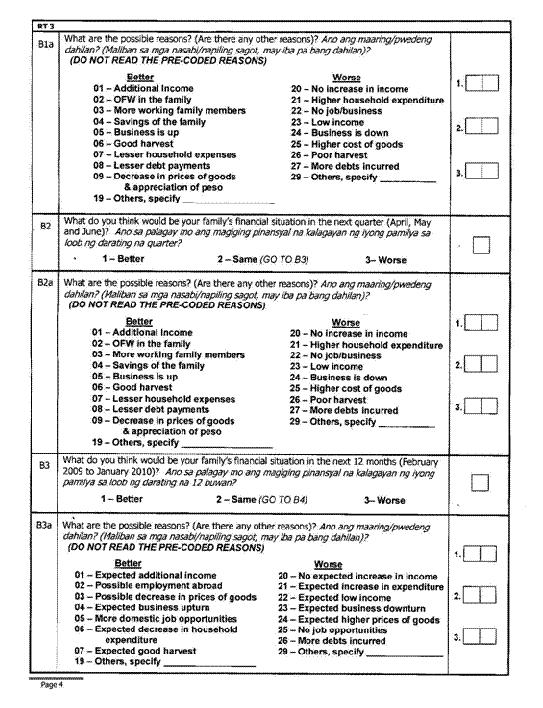
5 III. Consumer Expectations Survey 1. About the Survey The Consumer Expectations Survey (CES) is a statistical tool that makes use of opinion-testing techniques to collect information from households about consumer sentiments, including consumer views on buying and financial conditions, as well as the performance of the national economy. The CES was part of the BSP s project to establish a mechanism to set the pulse of the consuming public. It was intended to complement the BES. Thus, in April 2004, the BSP, in cooperation with the National Statistics Office (NSO) and with technical expertise provided by the UFJ Institute 6, held a technical workshop on the CES to formulate the questions that shall be used in the survey. Utilizing the NCR sample respondents from the NSO, the pilot CES was conducted during the third quarter of After adjustments had been made in the pilot survey, the first official conduct of the CES was done in the fourth quarter of 2004 (see [3]). Starting in the first quarter of 2007, the CES was expanded nationwide with additional samples drawn from areas outside NCR (AONCR). The households interviewed were drawn from the National Statistics Office s (NSO) Master Sample List of Households, which is considered a representative sample of households nationwide. The said master sample was generated using a stratified multi-stage probability sampling scheme. The nationwide sample size is 5,000 households with 50 percent of the households from NCR and 50 percent from AONCR, while the average nationwide survey response rate is 96.0 percent. The latest results of the CES is attached as Annex C. 2. Objectives 3. Uses Given its forward-looking nature, data generated from the survey are intended to provide decision makers and other stakeholders with supplemental indicators for short-term planning, forecasting, risk management and surveillance activities. In the case of the BSP, the results of the CES provide monetary authorities with advanced information on current and near-term consumer tendencies on consumer financial and buying conditions, as well as other economic information that could influence the movement of key economic indicators such as GDP, interest rate, peso/dollar exchange rate and inflation rate. The CES results also include information on the number of households with an Overseas Filipino Worker (OFW) 7 as member and the utilization of OFW remittances. Consumer spending and saving decisions have an important influence in determining the course of the national economy. This has been proven in many countries conducting consumer expectations surveys. Particularly, in the Philippines, the importance of consumer surveys in forecasting the future course of the economy could be even more significant as consumer expenditures account for 69.6% 8 for 2009 of total gross domestic demand for goods and services. 6 Created from a merger in April 2002 between Sanwa Research Institute and Consulting Corporation and Tokai Research & Consulting, Inc. ( 7 In 2009, the compensation of OFWs represents 17.6 percent of GDP at current prices and 18.6% of GDP at constant 1985 prices. 8 As of May 2010, at constant 1985 prices; National Accounts of the Philippines. 5
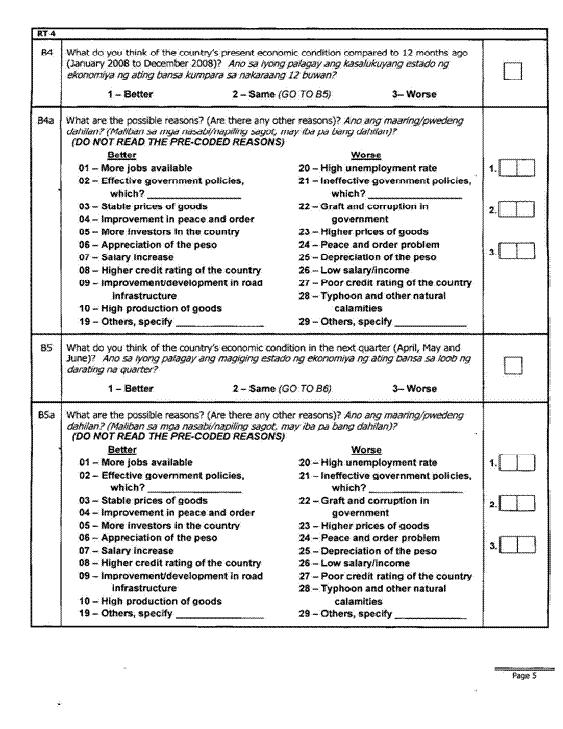
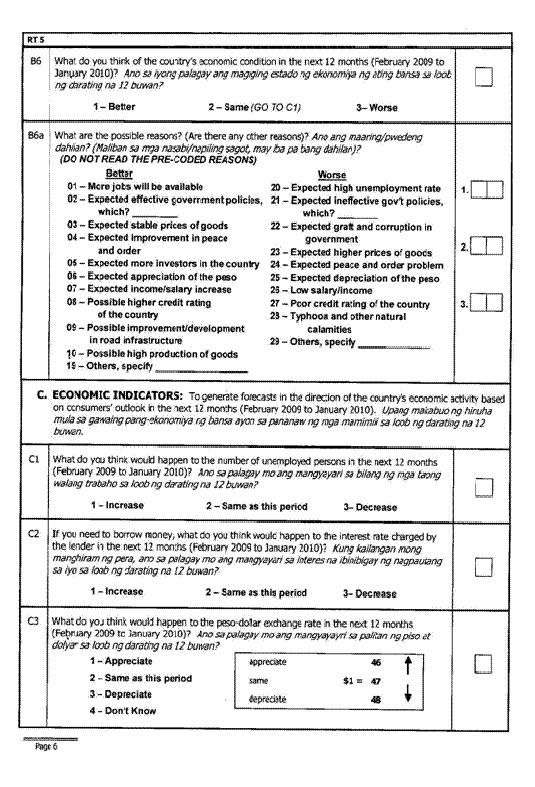
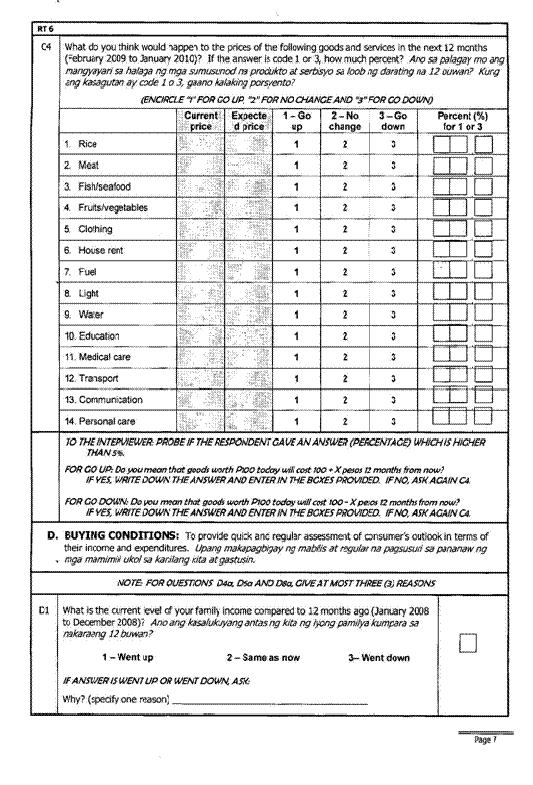
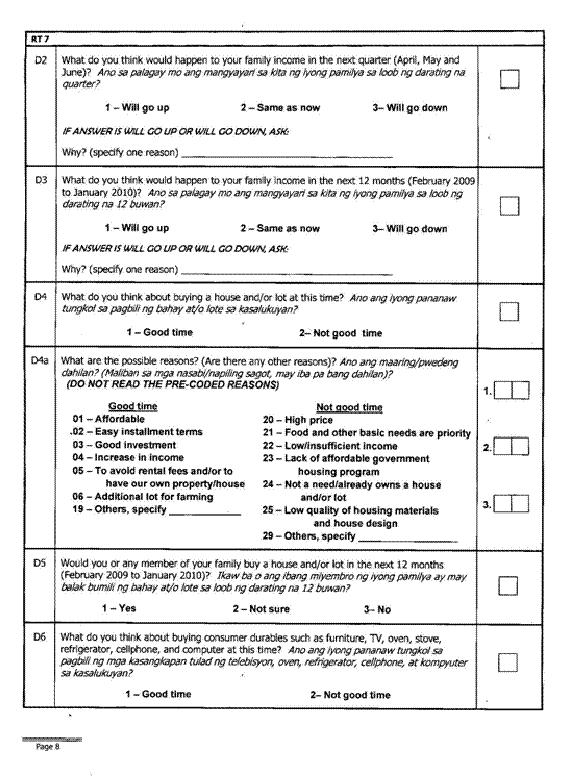
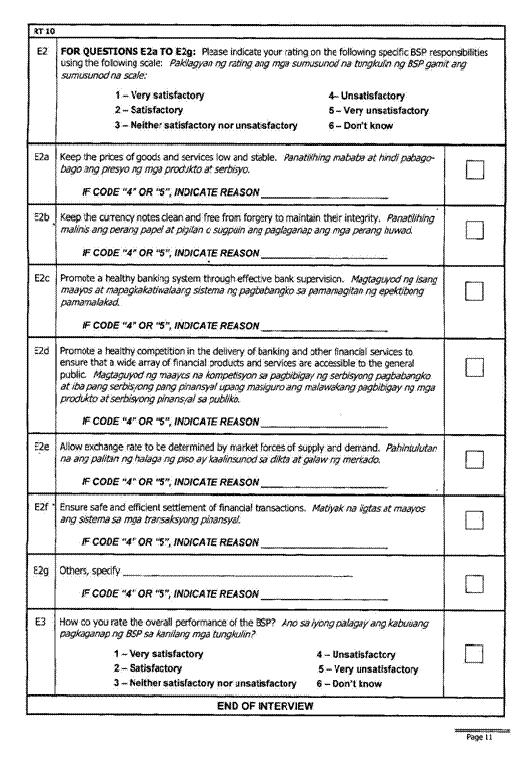
6 The results of the consumer expectations survey will guide planners in forecasting the direction of change of the economy as well as the behavior of key indicators such as inflation rate, interest rates and exchange rates. Specifically, the CES is used, among others, to: obtain advanced information on the short-term outlook of households and turning points in their spending patterns; provide basis for analyzing particular issues on the consumer behavior across income groups, especially on those receiving remittances from Overseas Filipinos; serve as an indicator of inflation, as indicated by the households capacity to purchase goods and services. The core questions of the survey cover three broad areas of consumer sentiment: personal finances, business conditions, and buying conditions. Overall assessments of past and expected changes in personal finances are supplemented by measures of the expected change in nominal family income, as well as expected real income changes. Attitudes towards business conditions in the economy as a whole over the near and the long-term horizon are measured in detail. Specific questionnaire items concerning expected changes in inflation, unemployment, and interest rates, as well as confidence in government economic policies, supplement the more general assessments. Finally, several questions probe for the respondent's appraisal of present market conditions for large household durables, vehicles, and houses. The survey gathers data on the following information: 1. Demographic and Economic Characteristics of the Consumer Respondent 2. Index of Consumer Sentiment and its Components 3. Personal/Family Finances 4. Gene'ral Business Conditions 5. Key Economic Indicators Unemployment Price (Inflation rate) Interest rate Exchange rate Income 6. Buying Conditions House and/or lot Consumer durables (refrigerator, television, computer, furniture, air-con, oven) Motor vehicles (car, jeep, motorcycle) 7. BSP Performance A questionnaire of the CES is attached as Annex D. 6
7 4. Sampling Design The design of the CES used the 2003 Master Sample (MS) for households; thus the stratified multi-stage sampling design of the MS applies. The 2003 MS used individual barangays 9 or combination of barangays as primary sampling unit (PSU) and provides subsampling alternatives such as sub-sampling of PSUs for smaller surveys, i.e., using enumeration area (EA) as subsamples or secondary sampling units (SSUs). The sample households are confined to a single EA within each sample PSU. The EA was introduced as an extra stage of sampling in order to reduce travel time for interviewers. These sub-samples were further classified into four independent replicates (replicates 1, 2, 3, and 4) where a replicate possesses the properties of the full MS (see [3]) Sample Selection and Size Sample PSUs and SSUs were both selected with probability proportional to size (PPS), where size was the number of households based on Census 2000 count. In each sample EA, sample households were selected with equal probability. About 5,000 sample households are covered in the 2007 CES equally allocated at 2,500 households each for the NCR and for areas outside the NCR (AONCR) Samples for NCR The first quarter 2007 CES covered about 2,500 sample housing units representing threefourths of the sample households from the fourth quarter 2006 CES drawn from all replicates and one-fourth new samples from non selected sample housing units of replicate 2. These sample households represent one fourth of the NCR sample households in the MS Samples for AONCR The sub sample size of 2,500 needed from all regions outside NCR, except ARMM, is allocated proportionately according to the population size of each region based on 2000 population census result. 9 As of September 2010, the Philippines had 42,025 barangays. 7
8 Below is a list of regions, proportions and allocated sample sizes of each region (except ARMM), outside NCR: Table 1. Population, Proportion, and Allocated Sample Size of Regions REGION POPULATION as of 2000 ( ) h N b PROPORTION SAMPLE SIZE ALLOCATED ( nh ) 1 Ilocos Region 4,200, Cagayan Valley 2,813, Central Luzon 8,204, a CALABARZON 9,320, b MIMAROPA 2,299, Bicol Region 4,686, Western Visayas 6,208, Central Visayas 5,706, Eastern Visayas 3,610, Zamboanga Peninzula 2,758, Northern Mindanao 3,505, Davao region 3,676, SOCCSKSARGEN 3,222, Cordillera Administrative Region (CAR) 1,365, Caraga 2,095, Philippines 63,673,996 a c Given the allocated sample size per region, a minimum of two (2) provinces are selected randomly per region. In each province, PSUs are selected using Simple Random Sampling without Replacement (SRSWOR). The selection of the number of provinces and PSUs is finished when the allocated sample size is reached. The table below shows the actual sample housing units selected for the first quarter 2007 CES. Region Table2. Distribution of the Actual Sample Number of Sampled PSUs Actual Sample Size (n) a b CAR Caraga 9 81 Total
9 4.2. Weighting Base weights Base weights are provided by the NSO along with the list of samples. Adjustments of base weights after the results of the survey are computed by the NSO. The initial step in the construction of weights is to determine the unit s base weight. This is defined as the inverse of its selection probabilities. The base weight is further adjusted to take into account possible non-response and possibly to make the estimates conform to some known population totals. Details can be found in Annex E Nonresponse Adjustments All surveys experience some degree of unit or total non response in which a sampled and eligible unit fails to participate in the survey (for example, the unit may refuse to participate, or may never be at home at the times the interviewer calls). Adjustments are made to the base weights to compensate for non response by sampled units eligible for the survey. In essence the adjustment inflates the base weights of similar responding units to compensate for each non respondent. The most common form of non response weighting adjustment is a weighting class adjustment and that is the type of adjustment being used for surveys based on the 2003 MS. The full sample of respondents and non respondents is divided into a number of weighting classes or cells and non response adjustment factors are computed for each cell с as w' c = i rc w di + i rc w j mc di w dj = i sc i rc w w di di The denominator of w' c is the sum of the weights of respondents (indexed r) in cell с. The numerator adds together the sum of the weights for respondents and (B) the sum of the weights for eligible non respondents (indexed m for missing) in cell c. Together these two sums in the numerator give the sum of the weights for the total eligible sample (indexed s) in cell c). Thus, the non-response weight adjustment w' c is the inverse of the weighted response rate in cell c. Note that the adjustment is applied with eligible units. Ineligible sampled units (e.g., vacant or demolished housing units and units out of scope for a given survey) are excluded Population Weighting Adjustments The basic weight for the sample household can be expressed as an inverse of the selection probability described in equations (1) and (2) in Annex E. Hence, the base 10 Frequently Asked Questions on the Business Expectations Survey and Consumer Expectations Survey, Bangko Sentral ng Pilipinas, as of June
10 weight for a sampled household in domain d in a housing unit in which all households are included is w d = 1 f ' d The basic weight was adjusted to take into account household non-interviews, followed by an adjustment based on the household projections for the domain. Generally, weighted sample distributions do not conform to known population distributions. In particular, sample estimates of population counts or household counts generally fall short of the true population or household counts because of noncoverage resulting from omission of units and non-responses. Hence, further weighting adjustments, termed as population weighting adjustment, may be made to make the survey estimates based on the adjusted weight estimates consistent with known population distributions. For adjusting household level estimates, the reference count of households is obtained by dividing the total projected population by the average household size. This is resorted to in the absence of projected number of households Final Survey Weight The final survey weight assigned to each responding unit is computed as the product of the base weight, the non response adjustment, and the population weighting adjustment, as described above. The final weights are used in all analyses to produce valid estimates of population parameters. 5. Tables generated from the survey: 1. Overall Consumer Outlook: Composite Index 2. Consumer outlook indices on the current economic and family condition: Current Quarter 3. Consumer outlook indices on economic and family condition: Next Quarter 4. Consumers outlook indices on economic and family condition: Next 12 Months 5. Confidence Index on Amount of Expenditures: Next Quarter 6. Buying Conditions Index: Current Quarter 7. Buying Intentions Index: Next 12 Months 8. Indices on Selected Economic Indicators: Next 12 Months 9. Percentage of OFW Households by Type of Use of OFW Remittances 10. Percentage of Respondents by Income Group 10
11 IV. References [1] Frequently Asked Questions on the Business Expectations Survey and Consumer Expectations Survey, Bangko Sentral ng Pilipinas, as of June 2010 [2] Business Expectations Survey, Third Quarter 2010, Bangko Sentral ng Pilipinas. [3] Enumerator s Manual for the Consumer Expectations Survey, National Statistics Office and Bangko Sentral ng Pilipinas, October 2008 [4] Consumer Expectations Survey, Third Quarter 2010, Bangko Sentral ng Pilipinas. IV. Acronyms ADB - Asian Development Bank AONCR - Areas Outside the National Capital Region BES - Business Expectations Survey BSP - Bangko Sentral ng Pilipinas CES - Consumer Expectations Survey EA - Enumeration Area GDP - Gross Domestic Product MS - Master Sample NCR - National Capital Region NSCB - National Statistical Coordination Board NSO - National Statistics Office OFW - Overseas Filipino Workers PSIC - Philippine Standard Industrial Classification PSU - Primary Sampling Unit SEC - Securities and Exchange Commission SSU - Secondary Sampling Unit V. Annexes A. Annex A 3rd Quarter 2010 Results of the Business Expectations Survey B. Annex B Questionnaire Used in the Business Expectations Survey C. Annex C - 3rd Quarter 2010 Results of the Consumer Expectations Survey D. Annex D Questionnaire Used in the Consumer Expectations Survey E. Annex E Computation of the Base Weight for the Consumer Expectations Survey 11
12 Annex A 3 rd Quarter 2010 Results of the Business Expectations Survey Overall Business Confidence Index and GDP Growth Rate (constant 1985 prices) Q Q
13 13
14 14

15 Annex B - Questionnaire Used in the Business Expectations Survey 15
16 16
17 17
18 18
19 19
20 20
21 21
22 22
23 Annex C 3 rd Quarter 2010 Results of the Consumer Expectations Survey Overall Consumer Outlook Index and Growth Rate of Personal Consumption Expenditures of the GDP (constant 1985 prices) Q Q
24 24
25 25

26 Annex D - Questionnaire Used in the Consumer Expectations Survey 26
27 27
28 28
29 29
30 30
31 31
32 32
33 33
34 34
35 35
36 36
37 Annex E Computation of the Base Weight for the Consumer Expectations Survey In general, the base weight assigned to a sampled unit is the inverse of its selection probability. In particular, the base weight is computed as the inverse of equations 1) Non Self Representing (NSR) and 2) Self Representing (SR) below: P ( hαβγ ) a = hα hα M M hα hα M M hαβ hα C M hα hαβ k K hαβλ hαβγ = f = n N d d (1) P ( hαβγ ) = b hα M M hαβ hα C M hα hαβ k K hαβγ hαβγ = f = n N d d (2) Where: Һ stratum index α index denoting the NSR PSU β index denoting the EA γ index denoting the household (HH) d index denoting the domain/region n d total sample size allocated to region d N d total number of households in region d f d = n d N d overall sampling fraction for region d M hα M hαβ a hα C hα k hαβγ K hαβγ total number of HHs for the αth NSR PSU in stratum h total number of HHs in the βth EA from the αth NSR PSU in stratum h total number of sample NSR PSUs from stratum h total number of sample HHs for each sampled EA number of sampled households per housing unit with three as the maximum total number of households residing in a housing unit 37
38 The base weights for NSR and SR samples are equal to equations 3 and 4, respectively: w 1 = a hα hα M M hα hα M M hα hαβ M c hαβ hα K k hαβγ hαβλ = N n d d (3) w 1 = b M hα hα M hαβ M C hαβ hα K k hαβγ hαβγ = N n d d (4) Note that the last term will equal to 1.0 in cases when all households in the sampled housing unit are enumerated. That is, when households per housing unit do not exceed three. This is so because based on the 2000 Census, some housing units contain two households and a few contain more than two households but the average number of households per housing unit is only Hence, up to three households were sampled within the selected housing units. In the few cases where a housing unit had more than three households, a sample of three households was selected with equal probability 38
Business and Consumer Expectations Surveys in the Philippines
 Business and Consumer Expectations Surveys in the Philippines Gloria A. Cubinar Department of Economic Statistics International Workshop on Short-Term Statistics Beijing, China 18-20 May 2015 Outline of
2006 Family Income and Expenditure Survey (Final Results)
") 2006 Family Income and Expenditure Survey (Final Results) Reference Number: 412 Release Date: Thursday, February 5, 2009 Increase in average annual family income and expenditure In 2006, the average annual
2006 Family Income and Expenditure Survey (Final Results) Reference Number: 412 Release Date: Thursday, February 5, 2009 Increase in average annual family income and expenditure In 2006, the average annual
BNRS IN FIGURES. Monthly Report as of April 2016
 BNRS IN FIGURES Monthly Report as of SCOPE Business Name (BN) Registration by Scope per Source VS April 2015 2016 2015 % Change NEW TELLER RENEWAL NEW WEB RENEWAL NEW Grand NEW TELLER RENEWAL NEW WEB RENEWAL
BNRS IN FIGURES. Monthly Report as of February 2016
 BNRS IN FIGURES Monthly Report as of Business Name (BN) Registration by Scope per Source SCOPE 216 215 216 to TELLER Renewal Total WEB Renewal Total Grand Total TELLER Renewal Total WEB Renewal Total Grand
Assessing the impact of 4Ps on school participation of Filipino children using Propensity Score Matching (PSM)
") Assessing the impact of 4Ps on school participation of Filipino children using Propensity Score Matching (PSM) Celia M. Reyes and Christian D. Mina Making Impact Evaluation Matter: Better Evidence for
Assessing the impact of 4Ps on school participation of Filipino children using Propensity Score Matching (PSM) Celia M. Reyes and Christian D. Mina Making Impact Evaluation Matter: Better Evidence for
Economic Briefing for the Philippine Association of National Advertisers. 24 February 2010
 Economic Briefing for the Philippine Association of National Advertisers 24 February 2010 1 Presentation flow 11 themes for 2011 1. Economic growth is real. 2. Service oriented economy. 3. Consumption
Monitoring the Philippine Economy
 Monitoring the Philippine Economy Second Quarter Report for 2015 Project of Angelo King Institute Mitzie Irene P. Conchada 1 Assistant Professor School of Economics Edgardo Manuel Jopson BS-MS Economics
CONSUMPTION POVERTY IN THE REPUBLIC OF KOSOVO April 2017
 CONSUMPTION POVERTY IN THE REPUBLIC OF KOSOVO 2012-2015 April 2017 The World Bank Europe and Central Asia Region Poverty Reduction and Economic Management Unit www.worldbank.org Kosovo Agency of Statistics
Monitoring the Philippine Economy Third Quarter Report for 2016
 Monitoring the Philippine Economy Third Quarter Report for 2016 Project of Angelo King Institute Mitzie Irene P. Conchada 1 Assistant Professor School of Economics Regina S. Villasor BS Applied Economics
A PROPOSAL FOR MONTH YEAR (ALL CAPS) CHARTBOOK. Market Indicators
 CHARTBOOK. Market Indicators") A PROPOSAL FOR MONTH YEAR (ALL CAPS) CHARTBOOK Market Indicators November 2015 For more information, contact: Janlo de los Reyes Manager Research and Consultancy janlo.delosreyes@ap.cushwake.com Leo De
A PROPOSAL FOR MONTH YEAR (ALL CAPS) CHARTBOOK Market Indicators November 2015 For more information, contact: Janlo de los Reyes Manager Research and Consultancy janlo.delosreyes@ap.cushwake.com Leo De
The Philippine s Socio-economic Performance, Outlook, Challenges, and Vision National Economic and Development Authority
 The Philippine s Socio-economic Performance, Outlook, Challenges, and Vision National Economic and Development Authority ILO Trade on Employment Workshop 6-7 October 2016 Socio-economic Performance 1980
Quantifying Qualitative Data from Expectation Surveys How Well Do Expectation Surveys Forecast Inflation?
 Quantifying Qualitative Data from Expectation Surveys How Well Do Expectation Surveys Forecast Inflation? Teresita Bascos-Deveza Bangko Sentral ng Pilipinas As early as 2001, the Bangko Sentral ng Pilipinas
Quantifying qualitative data from expectation surveys: how well do expectation surveys forecast inflation?
 Quantifying qualitative data from expectation surveys: how well do expectation surveys forecast inflation? Teresita Bascos-Deveza 1 As early as 2001, the Bangko Sentral ng Pilipinas adopted new measures
Monitoring the Philippine Economy First Quarter Report for 2016
 Monitoring the Philippine Economy First Quarter Report for 2016 Project of Angelo King Institute Mitzie Irene P. Conchada 1 Assistant Professor School of Economics Regina S. Villasor BS Applied Economics
2006 Official Poverty Statistics
 2006 Official Poverty Statistics Presented by DR. ROMULO A. VIROLA Secretary General National Statistical Coordination Board 5 March 2008 1 Outline of the Presentation I. Overview of the official poverty
Monitoring the Philippine Economy Second Quarter Report for 2016
 Monitoring the Philippine Economy Second Quarter Report for 20 Project of Angelo King Institute Mitzie Irene P. Conchada 1 Assistant Professor School of Economics Regina S. Villasor BS Applied Economics
Field Operations, Interview Protocol & Survey Weighting
 Workshop on the UN Methodological Guidelines on the Production of Statistics on Asset Ownership from a Gender Perspective EDGE Pilot Surveys in Asia and the Pacific R-CDTA 8243: Statistical Capacity Development
Poverty Measurement in the Philippines 1
 Poverty Measurement in the Philippines 1 Lisa Grace S. Bersales Na;onal Sta;s;cian Philippine Sta;s;cs Authority 1 presented at the Side Event on Mul;dimensional Poverty Measurement, 46 th Session of the
Indicators for Monitoring Poverty
 MIMAP Project Philippines Micro Impacts of Macroeconomic Adjustment Policies Project MIMAP Research Paper No. 37 Indicators for Monitoring Poverty Celia M. Reyes and Kenneth C. Ilarde February 1998 Paper
SPECIAL RELEASE Annual Survey of Philippine Business and Industry (Total Employment of 20 and Over- Final Results) National Capital Region
 National Capital Region") Number: 2015-04 Date Released: June 15, 2015 REPUBLIC OF THE PHILIPPINES PHILIPPINE STATISTICS AUTHORITY NATIONAL CAPITAL REGION SPECIAL RELEASE 2010 Annual Survey of Philippine Business and Industry (
Number: 2015-04 Date Released: June 15, 2015 REPUBLIC OF THE PHILIPPINES PHILIPPINE STATISTICS AUTHORITY NATIONAL CAPITAL REGION SPECIAL RELEASE 2010 Annual Survey of Philippine Business and Industry (
Disparities in Labor Market Performance in the Philippines
 Public Disclosure Authorized Public Disclosure Authorized Public Disclosure Authorized Public Disclosure Authorized Policy Research Working Paper 5124 Disparities in Labor Market Performance in the Philippines
PSA-CAR SPECIAL RELEASE
 PSA-CAR SPECIAL RELEASE PHILIPPINE STATISTICS AUTHORITY Volume 2 No. 03 January 2017 Cordillera Administrative Region LABOR STATISTICS Labor Force Participation in CAR January 2016 The Labor Force Survey
FINANCIAL ACCOUNTABILITY REPORTING
 FINANCIAL ACCOUNTABILITY REPORTING by LUZ M. CANTOR ASSISTANT SECRETARY, DBM Tejeros Hall, AFP Commissioned Officers Club Camp General Emilio Aguinaldo Quezon City July 18, 2013 FINANCIAL ACCOUNTABILITY
Fully digital process, no lines. No forms. No fees. Open an account via our mobile app.
 Savings Account V.1 How is ING Savings Account different? Fully digital process, no lines. No forms. No fees. Open an account via our mobile app. Made for everyone, no minimum amount to open, no maintaining
SURVEY ON THE ACCESS TO FINANCE OF SMALL AND MEDIUM-SIZED ENTERPRISES IN THE EURO AREA APRIL TO SEPTEMBER 2012
 SURVEY ON THE ACCESS TO FINANCE OF SMALL AND MEDIUM-SIZED ENTERPRISES IN THE EURO AREA APRIL TO SEPTEMBER 2012 NOVEMBER 2012 European Central Bank, 2012 Address Kaiserstrasse 29, 60311 Frankfurt am Main,
The Philippine Economy
 The Philippine Economy RECENT PERFORMANCE & PRIORITY REFORMS FOR SUSTAINED GROWTH ADORACION M. NAVARRO Undersecretary, Regional Development Office National Economic and Development Authority 1 8 6 4 PH
Monitoring the Philippine Economy First Quarter Report for 2017
 Monitoring the Philippine Economy First Quarter Report for 2017 Project of Angelo King Institute Dr. Mitzie Irene P. Conchada 1 Associate Professor School of Economics Won Hee Cho BS-MS Economics School
Centrale Bank van Aruba Banco Central di Aruba
 Business Perception Survey Results for the third and fourth Quarter of 2017 July 6, 2018. Centrale Bank van Aruba Banco Central di Aruba Business Activity During the third quarter of 2017, the overall
Philippine Rural Banks and Economic Development 1
 1 Philippine Rural Banks and Economic Development 1 Céline CROUZILLE a, Jessica LOS BANOS b, Emmanuelle NYS a, Alain SAUVIAT a a LAPE, Université de Limoges, 5 rue Félix Eboué, BP 3127, 87 031 Limoges
Workfare for whom? A critical assessment of workfare programs in the Philippines
 Public Disclosure Authorized PHILIPPINE SOCIAL PROTECTION NOTE SEPTEMBER 2016 NO. 12 Public Disclosure Authorized Workfare for whom? A critical assessment of workfare programs in the Philippines Public
2011 Annual Socio- Economic Report
 2011 Annual Socio- Economic Report This abstract contains the Nigerian Unemployment Report 2011 National Bureau of Statistics Page 1 Introduction Employment Statistics is a section under the General Household
HOUSEHOLDS INDEBTEDNESS: A MICROECONOMIC ANALYSIS BASED ON THE RESULTS OF THE HOUSEHOLDS FINANCIAL AND CONSUMPTION SURVEY*
 HOUSEHOLDS INDEBTEDNESS: A MICROECONOMIC ANALYSIS BASED ON THE RESULTS OF THE HOUSEHOLDS FINANCIAL AND CONSUMPTION SURVEY* Sónia Costa** Luísa Farinha** 133 Abstract The analysis of the Portuguese households
Philippines. Key Indicators for Asia and the Pacific Item
 1 POPULATION Total population a million; as of 1 July 76.8 78.4 79.9 81.5 83.1 84.7 86.3 87.9 89.4 91.0 93.1 94.8 96.5 98.2 99.9 101.6 103.2 Population density persons per square kilometer 256 261 266
Discussion paper 1 Comparative labour statistics Labour force survey: first round pilot February 2000
 Discussion paper 1 Comparative labour statistics Labour force survey: first round pilot February 2000 Statistics South Africa 27 March 2001 DISCUSSION PAPER 1: COMPARATIVE LABOUR STATISTICS LABOUR FORCE
Validation of National Accounts Expenditures
 Chapter 21 Validation of National Accounts Expenditures Price data and accounts data are the two pillars of the Inter Comparison Program (ICP). Because purchasing power parities (PPPs) are derived from
MONITORING THE PHILIPPINE ECONOMY
 MONITORING THE PHILIPPINE ECONOMY Volume VI, No. 3, 2016 ISSN # 2094-3342 MONITORING THE PHILIPPINE ECONOMY YEAR-END REPORT FOR 2015 The Philippine economy expanded by 5.9% for the year 2015, fortifying
RESULTS OF THE KOSOVO 2015 LABOUR FORCE SURVEY JUNE Public Disclosure Authorized. Public Disclosure Authorized. Public Disclosure Authorized
 Public Disclosure Authorized Public Disclosure Authorized Public Disclosure Authorized Public Disclosure Authorized RESULTS OF THE KOSOVO 2015 LABOUR FORCE SURVEY JUNE 2016 Kosovo Agency of Statistics
Latest Philippine and Regional Economic Performance, and Socioeconomic Priorities 2018 Onwards
 Latest Philippine and Regional Economic Performance, and Socioeconomic Priorities 2018 Onwards Carlos Bernardo O. Abad Santos ASSISTANT SECRETARY 28 November 2018 PH economic growth in an upward trajectory
Correlation of Personal Factors on Unemployment, Severity of Poverty and Migration in the Northeastern Region of Thailand
 Correlation of Personal Factors on Unemployment, Severity of Poverty and Migration in the Northeastern Region of Thailand Thitiwan Sricharoen Abstract This study examines characteristics of unemployment
PHILIPPINES: AS MICROINSURANCE AGENTS
 RURAL BANKERS ASSOCIATION OF THE PHILIPPINES: ENHANCING THE CAPACITY OF RURAL BANKS AS MICROINSURANCE AGENTS BY: RUTH ASERON Microinsurance Coordinator RBAP-MABS AGENDA Microinsurance in the Philippine
2009 Official Poverty Statistics
 2009 Official Poverty Statistics Presented by DR. ROMULO A. VIROLA Secretary General National Statistical Coordination Board 08 February 2011 NSCB Operations Room, Makati City Slide No. 0 RAV/ 08 February
Capital Stock Conference March 1997 Agenda Item III. National Wealth Survey in Korea
 Capital Stock Conference March 1997 Agenda Item III National Wealth Survey in Korea 1 1. History of the Survey In 1998, the fourth National Wealth Survey (NWS) will be conducted as of December 31, 1997,
LOCALLY ADMINISTERED SALES AND USE TAXES A REPORT PREPARED FOR THE INSTITUTE FOR PROFESSIONALS IN TAXATION
 LOCALLY ADMINISTERED SALES AND USE TAXES A REPORT PREPARED FOR THE INSTITUTE FOR PROFESSIONALS IN TAXATION PART II: ESTIMATED COSTS OF ADMINISTERING AND COMPLYING WITH LOCALLY ADMINISTERED SALES AND USE
BUSINESS DEMOGRAPHY (By December 31, 2008)
") BUSINESS DEMOGRAPHY (By December 31, 2008) PREFACE Similar to statistics of human population, business demography describes the life cycle of the enterprises; their birth, survival and development until
BUSINESS DEMOGRAPHY (By December 31, 2008) PREFACE Similar to statistics of human population, business demography describes the life cycle of the enterprises; their birth, survival and development until
Direct Investment Compilation Practices, Data Sources and Methodology
 This metadata describes the compilation practices, sources and methodology in use in 2003. Please refer to the contact person below for details of any changes that may have been introduced by the country
Philippines: 2017 Economic Performance and Socioeconomic Priorities 2018 Onwards. Carlos Bernardo O. Abad Santos Assistant Secretary 09 March 2018
 Philippines: 2017 Economic Performance and Socioeconomic Priorities 2018 Onwards Carlos Bernardo O. Abad Santos Assistant Secretary 09 March 2018 The Setting: Where We Are Now PH economic growth in sharp
Central Statistical Bureau of Latvia FINAL QUALITY REPORT RELATING TO EU-SILC OPERATIONS
 Central Statistical Bureau of Latvia FINAL QUALITY REPORT RELATING TO EU-SILC OPERATIONS 2007 2010 Riga 2012 CONTENTS CONTENTS... 2 Background... 4 1. Common longitudinal European Union Indicators based
Discussion paper 1 Comparative labour statistics Labour force survey: first round pilot February 2000
 Discussion paper 1 Comparative labour statistics Labour force survey: first round pilot February 2000 Statistics South Africa 27 March 2001 DISCUSSION PAPER 1: COMPARATIVE LABOUR STATISTICS LABOUR FORCE
Russia Longitudinal Monitoring Survey (RLMS) Sample Attrition, Replenishment, and Weighting in Rounds V-VII
 Sample Attrition, Replenishment, and Weighting in Rounds V-VII") Russia Longitudinal Monitoring Survey (RLMS) Sample Attrition, Replenishment, and Weighting in Rounds V-VII Steven G. Heeringa, Director Survey Design and Analysis Unit Institute for Social Research, University
Russia Longitudinal Monitoring Survey (RLMS) Sample Attrition, Replenishment, and Weighting in Rounds V-VII Steven G. Heeringa, Director Survey Design and Analysis Unit Institute for Social Research, University
7 Construction of Survey Weights
 7 Construction of Survey Weights 7.1 Introduction Survey weights are usually constructed for two reasons: first, to make the sample representative of the target population and second, to reduce sampling
Rice Stocks Survey in the Philippines
 Rice Stocks Survey in the Philippines Jacinta U. Estrada Ben-Lor Building, 1184 Quezon Ave., Quezon City, Philippines T: 632 371 20 50 2 nd Joint Workshop on Rice Data for Thailand and the Philippines
From Stability to Prosperity for All
 From Stability to Prosperity for All March 2012 PQU Press Presentation Rogier van den Brink, Lead Economist Karl Kendrick Chua, Country Economist Poverty Reduction and Economic Management (PREM) Unit World
Eighth UNCTAD Debt Management Conference
 Eighth UNCTAD Debt Management Conference Geneva, 14-16 November 2011 Interactions between Government Domestic Borrowing Needs and the Corporate Sector by Mr. Roberto Juanchito T. Dispo President / Director,
Enhanced Regulatory Framework
 Enhanced Regulatory Framework A. Government Policy on Microinsurance On January 2010, the Government launched the Regulatory Framework for Microinsurance that outlines the government s policy thrusts and
The Opportunity for Islamic Banking and Finance in the Philippines
 EXECUTIVE BRIEF ISLAMIC BANKING IN THE PHILIPPINES (PRIMER FOR GCC INVESTORS) APRIL 2018 1 The Opportunity for Islamic Banking and Finance in the Philippines The Philippine banking industry is a $275 billion
The Philippine Rural Development Project (PRDP) Terms of Reference for the Conduct of Mid-term Evaluation Study. 1. Background.
 Terms of Reference for the Conduct of Mid-term Evaluation Study. 1. Background.") The Philippine Rural Development Project (PRDP) Terms of Reference for the Conduct of Mid-term Evaluation Study 1. Background. The Philippine Rural Development Project (PRDP) is a World Bank assisted Project
The Philippine Rural Development Project (PRDP) Terms of Reference for the Conduct of Mid-term Evaluation Study 1. Background. The Philippine Rural Development Project (PRDP) is a World Bank assisted Project
Introduction to the SNA 2008 Accounts, part 1: Basics 1
 Introduction to the SNA 2008 Accounts, part 1: Basics 1 Introduction This paper continues the series dedicated to extending the contents of the Handbook Essential SNA: Building the Basics 2. The aim of
A PROPOSAL FOR CHARTBOOK. Market Indicators
 A PROPOSAL FOR CHARTBOOK Market Indicators DECEMBER 2016 For more information, contact: Janlo de los Reyes Manager Research and Consultancy janlo.delosreyes@ap.cushwake.com Leo De Leon Senior Analyst Research
PSA Small Area Poverty Estimation Project
 PSA Small Area Poverty Estimation Project Workshop on Sex-Disaggregated Data for SDG Indicators May 25-27, 2016, Bangkok, Thailand Outline of Presentation III. Some Results IV. Actual Policy Uses V. Next
Short term indicators
 Short term indicators Seminar on developing the capacity to produce economic statistics, including national accounts in accordance with the 2008 SNA, in the Asian and Pacific region 10-13 October 2011,
Compilation of Quarterly GDP: Methods, Problems, and Solution The case of Thailand
 Strengthening Regional Capacities for Statistical Development in Southeast Asia Project Sponsored by UNSD, ESCAP and ASEAN Secretariat Bangkok, 6-10 August 2001 Compilation of Quarterly GDP: Methods, Problems,
Promoting Financial Integration
 2015/SFOM/S/010 Session: 2 Promoting Financial Integration Purpose: Information Submitted by: Philippines Special Senior Finance Officials Meeting Clark, Philippines 21-22 January 2015 Promoting Financial
Republic of the Philippines NATIONAL STATISTICS OFFICE National Capital Region SPECIAL RELEASE
 Republic of the hilippines NATIONAL STATISTICS OFFICE National Capital Region Number: 2010-10 SECIAL RELEASE UWARD TREND FOR CI, INFLATION RATE NOTED IN NCR FOR THE FIRST FOUR MONTHS OF 2010 The Consumer
Business Partners Limited SME Confidence Index
 Business Partners Limited SME Confidence Index Fourth Quarter of 2017: October December Issued February 2018 1 RATIONALE FOR THE BUSINESS PARTNERS LIMITED SME CONFIDENCE INDEX SMEs are often punted as
Regional Workshop on MAP on Decent work in ASIA June 2010 Bangkok, Thailand. Kabir Uddin Ahmed Deputy Director Bangladesh Bureau of Statistics
 Regional Workshop on MAP on Decent work in ASIA 28-30 June 2010 Bangkok, Thailand Kabir Uddin Ahmed Deputy Director Bangladesh Bureau of Statistics Outline of Presentation Bangladesh at a glance System
Structural changes of Romanian economy
 Bulletin of the Transilvania University of Braşov Series V: Economic Sciences Vol. 8 (57) No. 2-2015 Structural changes of Romanian economy Constantin DUGULEANĂ 1 Abstract: Economic activity in Romania
1. The Armenian Integrated Living Conditions Survey
 MEASURING POVERTY IN ARMENIA: METHODOLOGICAL EXPLANATIONS Since 1996, when the current methodology for surveying well being of households was introduced in Armenia, the National Statistical Service of
PART 4 - ARMENIA: SUBJECTIVE POVERTY IN 2006
 PART 4 - ARMENIA: SUBJECTIVE POVERTY IN 2006 CHAPTER 11: SUBJECTIVE POVERTY AND LIVING CONDITIONS ASSESSMENT Poverty can be considered as both an objective and subjective assessment. Poverty estimates
REPUBLIC OF ZAMBIA CENTRAL STATISTICAL OFFICE PRELIMINARY RESULTS OF THE 2012 LABOUR FORCE SURVEY
 REPUBLIC OF ZAMBIA CENTRAL STATISTICAL OFFICE PRELIMINARY RESULTS OF THE 2012 LABOUR FORCE SURVEY This report presents preliminary results of the 2012 Labour Force Survey. The results presented herein
National Health Accounts (NHA) Development and Institutionalization: Philippines Country Experience. Rachel H. Racelis Draft: September 2008
 Development and Institutionalization: Philippines Country Experience. Rachel H. Racelis Draft: September 2008") National Health Accounts (NHA) Development and Institutionalization: Philippines Country Experience 1. Background Information 1.1 NHA Estimates Rachel H. Racelis Draft: September 2008 The earliest comprehensive
National Health Accounts (NHA) Development and Institutionalization: Philippines Country Experience 1. Background Information 1.1 NHA Estimates Rachel H. Racelis Draft: September 2008 The earliest comprehensive
Making growth work for the poor
 Making growth work for the poor A window of opportunity to eradicate extreme poverty and boost shared prosperity within one generation Karl Kendrick Chua Senior Country Economist The World Bank in the
ADB Economics Working Paper Series
 ADB Economics Working Paper Series Ex-ante Impact Evaluation of Conditional Cash Transfer Program on School Attendance and Poverty: The Case of the Philippines Hyun H. Son and Jhiedon Florentino No. 142
NATIONAL ECONOMIC ACCOUNTS 2010 (Provisional Estimates)
") REPUBLIC OF CYPRUS NATIONAL ECONOMIC ACCOUNTS 2010 (Provisional Estimates) STATISTICAL SERVICE National Accounts Statistics Series II Report No. 27 Obtainable from the Printing Office of the Republic of
REPUBLIC OF CYPRUS NATIONAL ECONOMIC ACCOUNTS 2010 (Provisional Estimates) STATISTICAL SERVICE National Accounts Statistics Series II Report No. 27 Obtainable from the Printing Office of the Republic of
Quarterly financial statistics March 2007
 Statistical release Quarterly financial statistics March 2007 Embargoed until: 27 June 2007 3:00 Enquiries: Forthcoming issue: Expected release date: Nozuko Twala June 2007 26 September 2007 +27(2)30 2938
Final Quality report for the Swedish EU-SILC. The longitudinal component. (Version 2)
") 1(32) Final Quality report for the Swedish EU-SILC The 2004 2005 2006-2007 longitudinal component (Version 2) Statistics Sweden December 2009 2(32) Contents 1. Common Longitudinal European Union indicators
1(32) Final Quality report for the Swedish EU-SILC The 2004 2005 2006-2007 longitudinal component (Version 2) Statistics Sweden December 2009 2(32) Contents 1. Common Longitudinal European Union indicators
Table 1.3 : Demand side growth in GDP, growth contribution and relative share (figures in per cent at market prices) Growth of GDP
 Growth of GDP") Aggregate demand and its composition 1.17 The most important contribution to demand growth during the Tenth Five Year Plan period (2002-07) had come from investment, while the external trade made negligible
Aggregate demand and its composition 1.17 The most important contribution to demand growth during the Tenth Five Year Plan period (2002-07) had come from investment, while the external trade made negligible
Sierra Leone 2014 Labor Force Survey. Basic Information Document
 Sierra Leone 2014 Labor Force Survey Basic Information Document ACRONYMS GIZ ILO LFS SSL Deutsche Gesellschaft für Internationale Zusammenarbeit International Labour Organization Labor Force Survey Statistics
Bulgaria - Integrated Household Survey 2001
 Microdata Library Bulgaria - Integrated Household Survey 2001 Gallup International Report generated on: July 28, 2015 Visit our data catalog at: http://ddghhsn01/index.php 1 2 Sampling Sampling Procedure
PRESS RELEASE. LABOUR FORCE SURVEY: 3rd quarter 2017
 HELLENIC REPUBLIC HELLENIC STATISTICAL AUTHORITY Piraeus, 14 December 2017 PRESS RELEASE LABOUR FORCE SURVEY: 3rd quarter 2017 The Hellenic Statistical Authority (ELSTAT) announces the results of the Labour
Healthy Incentives Pilot (HIP) Interim Report
 Interim Report") Food and Nutrition Service, Office of Policy Support July 2013 Healthy Incentives Pilot (HIP) Interim Report Technical Appendix: Participant Survey Weighting Methodology Prepared by: Abt Associates, Inc.
Food and Nutrition Service, Office of Policy Support July 2013 Healthy Incentives Pilot (HIP) Interim Report Technical Appendix: Participant Survey Weighting Methodology Prepared by: Abt Associates, Inc.
The Serbia 2013 Enterprise Surveys Data Set
 I. Introduction The Serbia 2013 Enterprise Surveys Data Set 1. This document provides additional information on the data collected in Serbia between January 2013 and August 2013 as part of the fifth round
Papua New Guinea. Key Indicators for Asia and the Pacific 2017
 1 POPULATION Total population a million; as of 1 July 5.2 5.4 5.5 5.7 5.9 6.1 6.2 6.4 6.6 6.8 7.1 7.3 7.5 7.7 8.0 8.2 8.5 Population density persons per square kilometer 11 12 12 12 13 13 13 14 14 15 15
Risk management methodology in Latvian economics
 Risk management methodology in Latvian economics Dr.sc.ing. Irina Arhipova irina@cs.llu.lv Latvia University of Agriculture Faculty of Information Technologies, Liela street 2, Jelgava, LV-3001 Fax: +
EMPLOYEES UNDER LABOUR CONTRACT AND GROSS AVERAGE WAGES AND SALARIES, FOURTH QUARTER OF 2016
 EMPLOYEES UNDER LABOUR CONTRACT AND GROSS AVERAGE WAGES AND SALARIES, FOURTH QUARTER OF 2016 According to the preliminary data of the National Statistical Institute (NSI) at the end of December 2016 the
Small Area Estimation of Sub-National Poverty Incidence 1
 1 by ZITA VILLA JUAN-ALBACEA, Ph.D. 2 I. INTRODUCTION Poverty monitoring needs statistics generated at a regular unit of time and for a particular domain of study. Most of the time, the policy makers who
Advancing Methodology on Measuring Asset Ownership from a Gender Perspective
 Advancing Methodology on Measuring Asset Ownership from a Gender Perspective Technical Meeting on the UN Methodological Guidelines on the Production of Statistics on Asset Ownership from a Gender Perspective
Figure 1. Gross average wages and salaries by months
 EMPLOYEES UNDER LABOUR CONTRACT AND GROSS AVERAGE WAGES AND SALARIES, FIRST QUARTER OF 2018 According to the preliminary data of the National Statistical Institute (NSI) at the end of March 2018 the number
COUNTRY REPORT - MAURITIUS
 COUNTRY REPORT - MAURITIUS ORGANISATION OF ECONOMIC STATISTICS General overview of the organization of economic statistics 1. The Central Statistics Office (CSO) is the official organisation responsible
The Financial Performance and Problems of Lending Investors
 Vol 5 No.2 December 2008 ISSN: 2094-1064 doi: http://dx.doi.org/10.7828/ljher.v5i2.37 Liceo Journal of Higher Education Research The Financial Performance and Problems of Lending Investors MARIANO M. LERIN
STANDARD DOCUMENT COVER SHEET FOR SEC FILINGS
 STANDARD DOCUMENT COVER SHEET FOR SEC FILINGS All documents should be submitted under a cover page which clearly identifies the company and the specific document form as follows: SEC Number 121 File Number
Gender Issues in SME Finance: Philippines
 2011/GFPN/WKSP/023 Session 7 Gender Issues in SME Finance: Philippines Submitted by: Philippines Workshop on Microfinance Best Practices Ha Noi, Viet Nam 7-8 April 2011 Gender Issues in SME Finance: Philippines
South African SMME Business Confidence Index Report: 4th Quarter 2013
 ISSN 1811-5187 AFRICAGROWTH INSTITUTE Tel: (021) 914 6778 Fax: (021) 914 4438 www.africagrowth.com South African SMME Business Confidence Index Report: 4th Quarter 13 Compiled by: Africagrowth Institute
GROSS DOMESTIC PRODUCT
 GROSS DOMESTIC PRODUCT September 2014 2013 HIGHLIGHTS GDP = $5.6 billion, marginally up 0.7% in 2013 In 2013, Gross Domestic Product (GDP), which measures the total value of goods and services produced
Final Quality report for the Swedish EU-SILC. The longitudinal component
 1(33) Final Quality report for the Swedish EU-SILC The 2005 2006-2007-2008 longitudinal component Statistics Sweden December 2010-12-27 2(33) Contents 1. Common Longitudinal European Union indicators based
Nauru. Key Indicators for Asia and the Pacific Item
 Key Indicators for Asia and the Pacific 2018 1 POPULATION Total population a as of 1 July ( 000) 10.1 10.1 10.1 9.9 9.7 9.5 9.1 9.2 9.4 9.5 9.7 10.1 10.3 10.8 11.9 12.5 13.0 13.3 Population density (persons/km
THE COMPILATION OF HOUSEHOLD SECTOR ACCOUNTS IN KOREA
 For Official Use STD/NA()18 Organisation de Coopération et de Développement Economiques OLIS : 26-Aug-1 Organisation for Economic Co-operation and Development Dist. : 27-Aug-1 Or. Eng. STATISTICS DIRECTORATE
Integrating Statistics on National Accounts for Sustainable Development Goals
 Integrating Statistics on National Accounts for Sustainable Development Goals VIVIAN R. ILARINA Assistant National Statistician Philippine Statistics Authority Expert Seminar on Integrated Statistics for
CONSUMER SURVEY, APRIL 2015
 CONSUMER SURVEY, APRIL 215 In April 215 the total consumer confidence indicator increases by 2.6 percentage points in comparison with its January level (Annex, Figure 1) as for the urban population the
National Economic and Development Authority
 fa Republic of the Philippines National Economic and Development Authority National Planning and Policy Staff NEDA s Inputs the Project Link s Country Report October 2016 I. Recent Trends 1. The Philippine
SESRIC Training Course on Foreign Investment Survey Central Statistical Bureau, Kuwait
 SESRIC Training Course on Foreign Investment Survey Central Statistical Bureau, Kuwait Second Day, 21 November 2017 (Tuesday) Department of Statistics Malaysia ǀ 20-22 November 2017 1 Overview Second Day