The VAS Voluntary Sector Survey 2017
|
|
|
- Baldwin Smith
- 5 years ago
- Views:
Transcription

1 The VAS Voluntary Sector Survey 2017 A report on the results by Voluntary Action Swindon September 2017
2 Contents 1. Executive Summary Introduction Focus Group Sessions The Survey 4.1 You and Your Organisation Staff & Volunteers Income & Expenditure Beneficiaries The Local Sector Training & Development Appendices 5.1 List of Organisations That Responded to the Survey The Voluntary Sector Survey
3 1. Executive Summary 1. This report sets out the results of a survey of the voluntary and community sector, carried out by VAS, in April-May 2017; and several focus group sessions with voluntary and community sector organisations, carried out by VAS in October-November We obtained a total of 146 responses from people answering on behalf of 111 different organisations, and increase of 19 responses and 7 organisations compared to the previous survey. A total of 49 individuals representing various voluntary and community sector organisations attended and fed into the focus group sessions. 2. Organisations representing the whole range of voluntary and community activity are present in responses to the survey. The majority are registered charities. Around one fifth are sports clubs, and about the same proportion are companies (charitable companies, not-for-profit companies, and Community Interest Companies). Smaller proportions include community centres, associations, trusts and social enterprises. 3. Nearly half of all respondents are paid staff. Nearly one in ten are volunteers. Two-fifths are committee members many of these will also be volunteers, in the case of charity boards who are usually unpaid. This differs substantially from the previous survey, where only a third were paid staff and more than a quarter represented volunteers. This could be due to organisations using fewer volunteers and more part-time paid staff compared to the 2015 results, as reported by respondents. 4. Fewer respondents are using regular, committed volunteers compared to the 2015 survey the proportion has dropped significantly, from 86% to 67%. Those using casual or occasional volunteers has also dropped slightly. The proportion of respondents using part-time paid staff has risen, though not dramatically. One third of respondents use no regular volunteers at all; more than half use no casual volunteers. The majority of respondents use volunteers only and do not have any paid members of staff. Apart from the drop in regular, committed volunteers, staff and volunteer numbers are largely consistent with the results from the 2015 survey. Despite the reduction in regular volunteers, reliance on volunteers was felt to be increasing by half of respondents, and to be static by nearly half. What this means is volunteers are seen as no less essential than before, but organisations are struggling to recruit or retain them, possibly due to lacking resource. 5. Registered charities are more likely to use both volunteers and staff than respondents overall, and in greater numbers. Sports clubs are much less likely to employ anyone, and are also likely to have fewer volunteers. Organisations which are branches or members of larger organisations report having significantly more regular volunteers than organisations that are independent or local. Word of mouth is the most popular way for organisations to recruit new volunteers, which is consistent with the 2015 results. The majority of respondents feel that the volunteers they recruit are a good match for their organisation s needs most of the time. 6. Nearly half of respondents reported that their income has remained static over the past year; just over a quarter reported that it has increased, and a similar proportion reported that it has decreased. Donations from individuals is the most common source of income for respondents, followed by fundraising events, grants from charitable trusts and foundations, 3
4 and public sector grants or contracts. Public sector income has reduced more than any other income stream over the last year. 7. The majority of respondents reported that their expenditure has increased over the past year. Around two-fifths reported that it has stayed the same, and a very small proportion reported a decrease in expenditure. Nearly all groups with increased income also reported increased expenditure. Respondents have taken various actions to make ends meet the most common being reviewing spending on small items, followed by recruiting more volunteers to cover services, and investing in fundraising, marketing or business development. Cutting services or making staff redundant were much less common methods of making ends meet. 8. The most common beneficiary group among respondents is children and young people, with more than two-fifths of respondents supporting this group. This is followed by older people, supported by more than one third of respondents, then by people with mental health problems, supported by three in ten. Nearly three in ten report that they supported between 201 and 500 beneficiaries in the last year. One fifth reported supporting over 2,000 people. Almost half of all respondents report that they are supporting about the same number of beneficiaries as they were a year ago, but more than two-fifths report that they have seen an increase in beneficiary numbers. In total, respondents reported that they have supported 342,963 people in the last twelve months, although this result should be interpreted with caution as one respondent had reported supporting 200,000 people roughly the population of the Borough of Swindon. It seems unlikely that this respondent was referring to direct beneficiaries of their work. 9. Respondents are considerably more familiar with VAS than with other infrastructure organisations (i.e. organisations supporting frontline work, across the public, private, and voluntary and community sectors). Awareness of public sector bodies such as One Swindon and My Care My Support is low, while awareness of voluntary sector organisations such as the Volunteer Centre and Sanford House is relatively high. Awareness of Healthwatch Swindon is also relatively high, and has risen considerably since the 2015 survey. Close to three-fifths of respondents work with Swindon Borough Council, but confidence in their effectiveness is relatively low. More than half of respondents work with VAS, which scored the highest for effectiveness as a partner organisation. 10. Respondents feel more engaged with voluntary and community sector networks than other networks and infrastructure bodies, although Swindon Borough Council and local media also score relatively high in engagement. Charitable funders, local businesses, and public sector bodies score relatively low, indicating respondents do not feel engaged with them. Respondents feel they would benefit most from greater engagement with local businesses and charitable funders. 11. Respondents see their main training and development needs as fundraising and volunteer recruitment. Awareness raising (including marketing, media, advertising and PR) also scores high. Raising income to provide services is identified as respondents primary challenge. Other challenges include recruiting new trustees, engaging with the wider public, replacing lost income streams, meeting core costs, and recruiting new volunteers. 4
5 2. Introduction A survey of the voluntary and community sector in Swindon, funded by Swindon Borough Council, has been undertaken in 2012, 2013, 2014 and The 2013 survey, managed by the Swindon Community Infrastructure Partnership (SCIP), received 137 responses and was written up and presented as an analytical report. The 2014 survey attracted just 76 responses; the results of this have been made available in summary form. The 2015 survey was managed by Phil Back Associates Ltd., received 127 responses, and was written up and presented as an analytical report. Swindon Borough Council commissioned Voluntary Action Swindon (VAS) to repeat this survey in 2017, as part of a wider consultation with the local sector, which included several focus group sessions. Where there is compatibility with previous surveys, this report explores how the result compares with its predecessors. The survey was largely similar to the 2015 survey, in order to enable direct comparison; some questions were added as they were felt to be relevant following focus group sessions. Others, felt to be less relevant, were removed in order to keep the survey to a reasonable length. The survey was placed on a secure online website, and VAS contacted its mailing list to invite participation. A paper version of the survey was also available for those who preferred this method of completion. Only two respondents chose this method of response. The survey is reproduced in full as appendix 6 (p65). The survey was launched on 11 th April 2017, and closed on 11th May. A total of 146 responses were received, representing 111 organisations. This represents an increase from 2015, when 127 respondents filled out the survey, representing 104 organisations. 34% of groups which completed the 2017 survey are confirmed to have also filled out the 2015 version. Not every respondent answered every question, but in each case the total response for a question is shown in the data table. In some tables, responses exceed 100%; this happened where individuals were allowed to choose more than one of the answers on offer in the question. The list of organisations responding to the survey is given in Appendix 1. Some respondents opted not to give the name of their organisation. Some organisations have more than one respondent. None has more than three. In addition to the survey, three focus group sessions were held in late These were attended by 49 people representing various voluntary and community sector groups, to enable VAS to gain a deeper understanding of the issues facing the sector than the survey alone can provide. The sessions were held on the 27 th October at the VAS building on John Street, the 15 th November at Sanford House, and the 24 th November at the VAS building following the VAS AGM. 5
6 3. Focus Group Sessions Three focus group sessions were held in late 2016, with various voluntary and community sector organisations. Relevant discussion points are included in discussion of the survey which makes up the majority of this report, and are also summarised below. Income/Expenditure Some organisations have seen a significant decrease in funding over the last few years, although there are some whose situation is actually improving and their organisations are experiencing growth, including recruiting more staff. Charities hoping to receive Swindon Borough Council funding now go through a tendering process, and their success may depend more on having someone with the right skill set for this process, than having knowledge that is beneficial for working in the local sector. Large charities are felt to be at an advantage here, as they are more likely to be able to afford a larger staff base, including people who are skilled at tendering. There is a concern that, if contracts go to organisations which are not based locally, local knowledge and talent may be lost, and it is beneficiaries who will ultimately lose out. Staff & Volunteers As a result of reduced income, some organisations have cut staff hours and pared services down. As a result, some organisations have found that they do not have the resource for the organisation to operate as much of the time as it used to. While a reduction in income may force organisations to become more efficient by looking at where they can reduce costs, this doesn t necessarily translate to a benefit for their client groups. There is high demand for volunteers across the board, but a lack of resource to manage and coordinate volunteers, or to grow volunteering organisations. Many organisations are in competition for fewer volunteers. Recruitment of volunteers, particularly trustees, was felt to be one of the main issues facing charities. The Local Sector Some organisations felt that there is not much cross-communication between the public, private, and voluntary and community sectors. Improving communication between sectors should not be driven by the Council, but does require engagement at the highest levels of the Council in order for the work to be effective. Civic pride is perceived to be an issue by many groups; there is a need to challenge perceptions of Swindon as a cultural desert. Solutions proposed in the focus group sessions including the development of a brand that is Swindon-positive have since been taken on by the Switch on to Swindon initiative. Organisations were asked what role they see Voluntary Action Swindon and Swindon Borough Council playing in supporting the sector. 6
7 Voluntary Action Swindon It was felt that VAS should focus its support on the following areas of work: Networks being aware of the networks that currently exist and what they are doing Development work with organisations, including trustee development, training for understanding the third sector, governance, and fundraising Community profiling and outreach understanding the communities that VAS exists to support, including smaller organisations who may be unaware of VAS and disconnected from the larger sector Promotion of the sector and the range and scale of work that is done Swindon Borough Council It was felt that Swindon Borough Council should focus its support on the following areas of work: Vulnerable groups who are not supported, and may be at risk if the voluntary and community sector is not strengthened Making clear what they are doing regarding community development greater transparency Allocating more funding to outreach and proactive community work e.g. identifying community groups that need help but are not currently supported Focusing on rural areas as well as urban areas Carrying out genuine consultation with the public at an early stage, and engaging in dialogue with people before consultation is needed Understanding the difference between volunteers and active citizens defining the former as altruistic activity where individuals provide services to charities or community groups for no financial gain, and the latter as individuals fulfilling certain roles and responsibilities to society or their community 7
8 4. The Survey 4.1 You and Your Organisation Type of Organisation Respondents were asked to identify the type of organisation they were filling out the survey on behalf of. This was a multiple choice question, enabling respondents to tick as many options as they felt identified them. The results are shown in the table below. Table 1: Type of Organisation Type of Organisation Proportion of Responses Registered Charity 59% Sports Club 18% Company Limited by Guarantee 15% Association 5% Community Interest Company 4% Community Centre 3% Trust 3% Social Enterprise 1% Co-operative Society 0% Other 11% N(=100%) 146 Chart 1: Type of Organisation A registered charity A sports club A company limited by guarantee An association A Community Interest Company A community centre A trust A social enterprise A co-operative society 0% 10% 20% 30% 40% 50% 60% 70% More than half (59%) were registered charities, and 20% represented limited companies. 12% of respondents are both registered charities and limited companies. This represents four-fifths of companies and one-fifth of charities that responded to the survey. The remainder of companies are Community Interest Companies (CICs) or non-profit companies. 1 The majority of registered charities 1 CICs are social enterprises that are not eligible for charitable status. 8
9 that completed the survey identified themselves only as registered charities and in no other way (60%); the remainder also identified themselves as associations, trusts, community centres, social enterprises and sports clubs. Nearly one-fifth of respondents identified themselves as sports clubs (18%). Nearly all of these respondents identified as sports clubs and nothing else; only one identified as a registered charity in addition to being a sports club. Very few associations, trusts, community centres and social enterprises completed the survey. This is likely to be because there are proportionally fewer organisations of these types, compared to registered charities, limited companies and sports clubs. All community centres and trusts who completed the survey identified themselves as registered charities. A majority of associations who responded identified themselves as registered charities, as did half of social enterprises. No respondents identified their organisation as a co-operative society. As there were too few respondents who identified as community centres, social enterprises, associations and trusts to draw any inferences from, these types of organisation have not been included in the analysis which follows. An Other option and free text field was provided for respondents to identify their organisations in ways not listed. 16 respondents did so. These include a Further Education College, churches, a charity shop, the local authority, a school, a voluntary art organisation, an Industrial & Provident Society, a small theatre training group, and a non-profit organisation. Chart 2: Type of Organisation Limited companies (non-charitable), 6% Non-charitable other, 17% Registered charities (excluding charitable companies), 46% Charitable companies, 12% Sports clubs, 18% That the majority of respondents represent registered charities is not surprising in a voluntary and community sector survey. The proportion of sports clubs (18%) may seem unexpectedly high, but this actually represents a small decrease from the 2015 survey, where around a quarter of respondents were from sports clubs. Those responding were also asked to clarify whether they represented an independent local group, or were part of a larger regional or national organisation. 9
10 Table 2: Type of Organisation Type of Organisation Proportion of Responses Independent 72% 72% Regional or National 28% 28% N(=100%) This question was also asked in 2015, and while far fewer respondents answered the question this time, the proportions were identical, with a large majority (72%) representing an independent local or community group, and the remainder (28%) representing a branch or member of a larger regional or national organisation. The majority (71%) of respondents who represented a branch or member of a regional or national group also identified their organisation as a registered charity; only 39% of independent local groups did so. 10

11 4.2 Staff & Volunteers The survey asked people to identify themselves according to their role in the organisation. This table shows how they break down in this respect. Table 3: Role of Respondent Role of Respondent Proportion of Responses An employee 49% 53% 33% 48% A volunteer 25% 28% 29% 9% A committee member/ 36% 29% 48% 40% Trustee/Director Other 10% 16% 15% 3% N(=100%) Chart 3: Role of Respondent 100% 90% 80% 70% 60% 50% 40% 30% 20% 10% 0% An employee A volunteer A committee member Other Paid staff account for nearly half of all respondents in 2017 (48%). A somewhat smaller proportion are committee members (40%), and a considerably smaller section are volunteers (9%). 19 respondents ticked the other category, which allowed them to fill in their own answer. The majority of these responses were covered by the categories of employee, committee members and volunteers (e.g. Chair, CEO ), and so have been incorporated into these answers. The majority of responses that were not covered by the categories (3%) provided were from members of charities and churches. The most dramatic change from previous years is the proportion of (non-board level) volunteers who filled out the survey dropping from nearly one third to less than one in ten. This is particularly surprising as the proportion of volunteers who filled out the survey had been steadily rising since This could be answers to the next question, which show that organisations are now using fewer volunteers and more part-time paid staff compared to previous years. 11

12 The number of paid staff filling out the survey rose from one third in 2015 to nearly half in 2017, although the 2017 results are largely consistent with the results of the 2013 and 2014 surveys. The proportion of committee members filling out the survey has fallen slightly from 2015, but again is not dissimilar from previous years. As later answers in this survey show, 2 the proportion of organisations using regular volunteers has dropped significantly compared to the 2015 survey, and the proportion of organisations using paid staff (part-time) has risen. This is consistent with there being fewer volunteers and more employees among respondents in 2017 than in previous years. Service Delivery Respondents were asked how their organisation delivers services using full-time paid staff (defined as at least 30 hours per week), part time staff (less than 30 hours per week), regular and committed volunteers, casual or occasional volunteers, and other (interns, Community Payback, etc.) Table 4: How Organisations Deliver Services Method of Service Delivery Proportion of Responses Regular and committed volunteers 86% 67% Casual or occasional volunteers 48% 45% Part-time paid staff 38% 40% Full-time paid staff 32% 29% Other (interns, Community Payback) 14% 10% N(=100%) Chart 4: How Organisations Deliver Services 90.00% 80.00% 70.00% 60.00% 50.00% 40.00% 30.00% 20.00% 10.00% 0.00% Regular and committed volunteers Casual or occasional volunteers Part time paid staff Full time paid staff Other (interns, Community Payback) pp Slightly adjusted from the 2015 analysis to remove 2 Don t know answers. The equivalent response in the 2017 survey would have been to simply skip the question. Respondents who did this were not counted for this question, and so the Don t know responses from 2015 have been excluded too. As such, the percentages of the total from the 2015 report have been slightly adjusted, now based on a total of 111 rather than
13 Two thirds of organisations (67%) rely on regular and committed volunteers to deliver their services, and just under half (45%) use casual or occasional volunteers. Two fifths of organisations (40%) in the survey have part-time paid staff, and a smaller but similar proportion (29%) have full-time paid staff. A smaller proportion (10%) use other opportunities for service delivery, such as interns and Community Payback. The number of organisations relying on regular, committed volunteers has dropped significantly since 2015, from 86% to 67%. Among registered charities, 73% report that they rely on regular and committed volunteers. For companies (including charitable companies limited by guarantee, not-forprofit companies, and Community Interest Companies), this rises to 81%, but this still represents a drop from the overall figures in the 2015 survey. The other results from this question are largely consistent with the 2015 results, although all show a slight decrease apart from part-time paid staff, which shows a slight increase. Casual or occasional volunteers are used somewhat more by registered charities than companies (48% compared to 37%). A majority of companies (63%) and registered charities (56%) rely on part time paid staff. 63% of companies and 42% of registered charities employ full-time staff. In contrast, sports clubs are very unlikely to have any paid staff at all (only 11% employ someone on a part-time basis, and no sports clubs employ anyone on a full-time basis). Other forms of service delivery, such as interns and Community Payback schemes, are rarely used by any of the organisation types identified in this survey. The implication is that voluntary and community sector organisations in Swindon have begun to rely slightly more on part-time paid staff and significantly less on regular, committed volunteers to deliver their services. There are a number of reasons why this may be. As later answers in the survey show, a large number of organisations are experiencing an increase in expenditure and no corresponding rise in income. 4 Organisations which use a large number of volunteers will typically have a named person responsible for coordinating, recruiting, inducting and managing their volunteers, whether this is a specific role or incorporated into another role. If organisations are now struggling to make ends meet, they may no longer be able to afford this type of role, and so may be using fewer volunteers because they can no longer resource someone to coordinate volunteers. However, later answers also show that organisations are not tending to cut staff as a way of making ends meet. 5 The slight rise in part-time paid staff since 2015 also indicates that roles are being created, not cut. An alternative explanation may be that organisations have decided to use part-time staff in place of regular volunteers, possibly because they need a smaller number of people with specific skills, and can no longer rely on unskilled volunteers to carry out a quality service. Recruiting more part-time staff could also result from difficulties in recruiting suitable volunteers, although later answers suggest that, for the most part, organisations feel this has not become more difficult over the last year. 6 4 pp pp pp
14 Respondents were also asked how many staff (full time and part time) and volunteers (regular, casual and other) they use to deliver services. Table 5: Staff and Volunteer Numbers (2017) Staffing numbers Proportion of all organisations Regular volunteers Casual volunteers Full time staff Part time staff Other None 33% 55% 71% 60% 89% 1 2% 0% 9% 7% 0% 2-5 7% 16% 12% 20% 3% % 14% 2% 8% 1% % 8% 4% 4% 3% Over 20 22% 7% 2% 1% 4% N(=100%) 146 Of those organisations that do use regular volunteers, most use at least 6, and nearly a quarter use more than 20. Those using casual volunteers tend to use fewer, with most reporting that they use between 2 and 5, and a slightly smaller proportion using between 6 and 10. Organisations that employ staff tend to employ between 2 and 5 full time staff and between 2 and 5 part time staff. Very few respondents reported that their organisations employ more than 10 members of full time or part time staff. Table 6: Staff and Volunteer Numbers ( ) Staffing numbers Proportion of all organisations Regular volunteers Casual volunteers Full time staff Part time staff None 15% 33% 51% 55% 69% 71% 63% 60% 1 0% 2% 1% 0% 5% 9% 5% 7% % 7% 13% 16% 17% 12% 20% 20% % 22% 16% 14% 1% 2% 7% 8% % 14% 9% 8% 2% 4% 2% 4% Over 20 20% 22% 10% 7% 6% 2% 3% 1% 14

15 Full time paid staff Part time paid staff Casual volunteers Regular committed volunteers Chart 5: Staff and Volunteer Numbers ( ) % 10% 20% 30% 40% 50% 60% 70% 80% 90% Over 20 While the proportion of organisations using regular, committed volunteers has dropped since 2015, the proportion who use more than 20 regular, committed volunteers has risen slightly, from 20% to 22%. Of registered charities that use regular, committed volunteers, 28% report using more than 20. For companies, the number is even higher, at 37%. 22% of sports clubs report using more than 20 regular, committed volunteers. Very few organisations are reliant on only one regular and committed volunteer, with just 2% of charities and 4% of sports clubs reporting this. 15
16 Of the organisations that use casual or occasional volunteers, all types of organisation tend to use fewer than 10. This is consistent with the 2015 results, with a slight decrease in those organisations using more than 20 casual volunteers, from 10% down to 7%. Organisations using part-time staff tend to employ fewer than ten people on part-time contracts, and only 2% of charities and no companies report employing more than 20 people on part-time contracts. This is largely the case for organisations using full-time staff too, though there has been a drop in organisations reporting that they employ more than 20 people on a full-time basis, from 6% to 2%. The proportion of organisations reporting that they employ between people on a full-time basis has correspondingly risen from 2% to 4%. The table below shows the average (mean) number of staff and volunteers for each type of organisation. Table 7: Staff and Volunteers (2017) Type of Organisation Mean Number of Staff & Volunteers Regular volunteers Casual volunteers Full time staff Part time staff Other All Respondents Registered Charities Limited Companies Sports Clubs Independent/Local Groups Branch/Member Organisations Presenting the data in this way gives a somewhat different impression than above, though it is worth keeping in mind that the average number is heavily skewed by a small number of outliers (for example, only two organisations reported having more than 45 casual or occasional volunteers, but their answers were 250 and 1415). On average, registered charities use both volunteers and staff in greater numbers than respondents overall, especially the former. Limited companies use fewer volunteers, and actually use fewer staff than charities. Both charities and companies make greater use of other methods of service delivery, such as Community Payback and internships. Sports clubs use fewer volunteers than respondents overall, and very few staff. Branch or member organisations use significantly more regular volunteers than average, and employ more staff than independent or local groups. 16

17 Organisations involved in the focus groups pointed out the need for volunteer management to be resourced without this, volunteers can become disengaged and stop volunteering. Though there is a misconception that volunteering is free, volunteer management/coordination is one of the hidden costs associated with using volunteers, and this is an area that the focus groups felt has typically been underfunded by central and local government. Respondents were asked if they felt their organisation s reliance on volunteers has increased or decreased over the last 12 months. Table 8: Reliance on Volunteers (2017) Reliance on Volunteers Proportion of Responses Increasing 50% Static 47% Decreasing 3% N(=100%) 106 Half of all respondents felt that their organisation s reliance on volunteers was increasing, while just under half felt that there was no change. A very small percentage reported that their organisation s reliance on volunteers was decreasing. Chart 6: Reliance on Volunteers (2017) It seems surprising that respondents have reported their reliance on volunteers is increasing while fewer organisations report using volunteers, both regular and casual. There are a number of reasons why this might be. First, only 34% of organisations who Increasing Static completed the 2017 survey are confirmed to have also taken part in the 2015 survey. Part of the data used to draw the conclusion that fewer organisations are now using volunteers is from the 2015 survey. It may be that the organisations who completed the Decreasing 0.00% 20.00% 40.00% 60.00% survey in 2015, but not in 2017, are using more or the same number of volunteers now, but this data has not been captured. We could also interpret the results to suggest that organisations may feel they are more reliant on volunteers, but have not been able to recruit or retain the volunteers they need. Alternatively, fewer organisations are using volunteers, but those that are using volunteers are more reliant than they were a year ago. Another possibility is that organisations are experiencing an increased reliance on casual or occasional volunteers, and not regular volunteers, as the proportion of organisations using casual volunteers has not dropped anywhere near as much as those using regular volunteers. One point of note is that the proportion of organisations who report having used more than 20 regular volunteers over the last year are more likely to report that their reliance on volunteers has stayed the same (55%), while those using fewer than 20 regular volunteers in this time are more likely to report that their reliance has increased (55%). This is not a big difference, but it does suggest that organisations with more volunteers have not experienced such an increase in their reliance on volunteers. It could also suggest that those organisations with fewer volunteers are failing to recruit or retain volunteers, despite their increased reliance on them. 17
 100 106 Chart 7: Reliance on Volunteers (2015-17) Stayed about the same Decreased Increased 0.00% 10.00% 20.00% 30.00% 40.00% 50.00% 60.")
18 Table 9: Reliance on Volunteers ( ) Reliance on Volunteers Proportion of Responses Increased 33.5% 50% Static 56% 47% Decreased 10.5% 3% N(=100%) Chart 7: Reliance on Volunteers ( ) Stayed about the same Decreased Increased 0.00% 10.00% 20.00% 30.00% 40.00% 50.00% 60.00% Compared to the 2015 survey, reliance on volunteers has increased considerably. 33.5% of respondents to the 2015 survey felt that their organisation s reliance on volunteers had increased over the previous year, compared to 50% in % felt that their organisation s reliance on volunteers had stayed about the same in 2015, compared to 47% in The proportion of respondents who felt their organisation s reliance on volunteers has decreased has dropped from 10.5% in 2015 to 3% in Table 10: Reliance on Volunteers Type of Organisation Proportion of Responses Increased Static Decreased All Respondents 50% 47% 3% Registered Charities 50% 47% 3% Limited Companies 48% 52% 0% Sports Clubs 37% 58% 5% Breaking down reliance on volunteers into types of organisation shows that there is little variation between the overall results and the results for charities and companies. Sports clubs are less likely to say their reliance on volunteers has increased (37% compared to 50% overall), and the most likely to say their reliance in static or has decreased. 18

19 Organisations that participated in the focus groups reported that their need for volunteers has remained static or increased many organisations would be unable to run without them. Respondents were asked how their organisations recruit new volunteers. Table 11: Recruiting New Volunteers Method Proportion of responses Word of mouth 76% 84% From our service users - 37% Volunteer Centre 41% 41% Open days/fairs 33% 14% Advertising through social media/our website - 46% Advertising through print media - 20% Other - 19% N(=100%) Other responses included: referral from professionals, advertising through partners, events, talking to community groups, contact with local schools/colleges/universities, Indeed website, Involve Swindon, churches, and posters in windows. Chart 8: Recruiting New Volunteers 90.00% 80.00% 70.00% 60.00% 50.00% 40.00% 30.00% 20.00% 10.00% 0.00% Word of mouth From our service users Volunteer Centre Open days / fairs Advertising through social media / our website Advertising through print media Other By far, the most popular way for organisations to recruit new volunteers was by word of mouth (84%), with more than four out of five respondents reporting that this is a way they recruit volunteers. This was followed by advertising through social media or the organisation s website (46%), with less than half of respondents reporting this as a way that they recruit volunteers. Just over two fifths of respondents reported using the Volunteer Centre to find new volunteers (41%), and a slightly smaller proportion said that they recruit volunteers from their service users (37%). One fifth of respondents recruit volunteers by advertising through print media (20%), and only 14% reported that they recruit via open days and fairs. These results are largely consistent among those 7 Only some categories were included in the 2015 survey, so only these categories can be directly compared. 19
20 who reported their reliance on volunteers is increasing, decreasing or static, and among those who use more (20+) or fewer volunteers. Only three of these choices were included in the 2015 survey, and so can be used as a comparison point here. Organisations reporting that they recruit through word of mouth has risen slightly, from 76% to 84%, while the proportion of respondents who recruit through the Volunteer Centre has remained static at 41%. Of note, the proportion who report recruiting through open days and fairs has dropped significantly, from 33% in 2015 to only 14% in This could be because organisations are attending fewer open days and fairs, or perhaps because they are having less success recruiting volunteers in this way. Organisations that participated in the focus group sessions felt that it is particularly difficult to recruit new trustees, and this has only become harder recently. The impact of negative publicity on the sector, such as the Kids Company scandal, has meant there is generally less willingness to act as trustee. In this way, the unethical behaviour of large charities has an impact on the ability of small, local charities to function as effectively as they could. Trustees that these organisations have been able to recruit are feeling more burdened, and this is partly due to staff resource issues trustees are more often taking on areas of work that used to be performed by staff. One issue raised in the focus group sessions was the mismatch between what organisations were hoping to get from recruiting volunteers, and what the volunteers were hoping to get from volunteering. This was particularly the case for employee volunteering, which tended to focus more on what the employee volunteers wanted to do, and less on what would be beneficial to the charity; it was suggested that this is due to the different environment that the large corporations which provide most of the employee volunteers in the town are operating in, compared to charitable SMEs. In terms of regular volunteering, it was felt that there is an increasing mismatch between what volunteers hope to get from volunteering, and what organisations need from volunteers. This was attributed to the changing motivations in volunteers more people are volunteering in order to return to the labour market, and are hoping to develop transferable skills that volunteer roles may not provide them with. Some organisations found that their volunteers lack the appropriate skills for the role, which impacts on the organisation s efficiency and reputation. Following these discussions, two questions were included in the survey, asking if there was a good match between what the organisation needs from volunteers and what volunteers were hoping to get from volunteering with the organisation, and if organisations feel that this has increased, decreased, or remained static over the past year. Table 12: Match Between Organisations and Volunteers Match Proportion of Responses All the time 7% Most of the time 65% Some of the time 21% Rarely 3% Don t know 4% N(=100%)
.")
21 Chart 9: Match Between Organisations and Volunteers Rarely 3% Some of the time 21% Don't know 4% All the time 7% Most of the time 65% Nearly two thirds of respondents reported that there was a good match between what their organisation needed from volunteers, and what their volunteers hoped to get from volunteering, most of the time (65%). 21% felt this was only the case some of the time, while much smaller proportions considered this to be the case all of the time (7%) or rarely (3%). This was consistent among organisations who felt their reliance on volunteers had increased or stayed the same over the last year. Organisations who felt their reliance on volunteers has decreased over the last year are less positive, with views being split almost equally between most of the time, some of the time and rarely. These organisations represent only 3% of respondents who answered the question however, so this sample size may be too small to draw any solid conclusions from. Notably, there was a very strong positive response among those organisations who do recruit through open days and fairs 93% stated that, most of the time, there is a good match between their organisation s needs and what the volunteers were hoping to get out of volunteering. This compares to 73% who recruit through word of mouth, who stated there is a good match most or all of the time, 74% who stated this for the Volunteer Centre, and 71% who stated this for advertising online. This suggests that the smaller number of organisations who recruit through open days and fairs do find it beneficial, and the much larger proportion who do not attend open days and fairs may be missing out on opportunities. The table below shows the results converted into mean scores, to allow for comparison between different types of organisation. 8 Table 13: Match Between Organisations and Volunteers Type of Organisation Mean Score All Respondents 0.56 Registered Charities 0.70 Limited Companies 0.86 Sports Clubs 0.53 N(=100%) 103 All types of organisation feel positive overall about the match between their organisation and their volunteers, but some are more positive than others. Limited companies have the most positive view of all, followed by registered charities. Respondents from sports clubs are more circumspect, more likely to state that there is only a good match some of the time. Sports clubs were actually considerably more likely to state there is a good match all of the time. This perhaps reflects the 8 Each response is assigned a value. All the time and most of the time attract scores of +2 and +1 respectively, while some of the time and rarely attract scores of -1 and -2. Don t know answers are ignored. The resulting scores are averaged for all responses relating to the type of organisation, to arrive at a score between +2 and -2, indicating both the direction of opinion and its comparative strength. 21


22 difference in volunteering for a sports club as opposed to a charity or community group. Sports club volunteers are typically people who have a passion for the sport, and often the club either they play the sport, or used to play the sport and have been involved with the club for some time. A higher level of volunteer engagement can therefore be expected in sports clubs, as compared to charities. Respondents were then asked if this had changed over the last year have they seen more, or fewer volunteers who matched the organisation s needs? Table 14: Trends in Matches Between Organisations and Volunteers Match Proportion of Responses More 15% Fewer 18% About the same 64% Don t know 3% N(=100%) 107 Nearly two thirds felt that there was no change in this regard. Nearly one fifth reported seeing fewer volunteers who matched the organisation s needs, while a slightly smaller proportion reported that they were seeing more volunteers matching the organisation s needs. Those who reported that there is a good match between their organisation and volunteers all of the time felt that this has remained the same or is even improving; none of these groups felt that they were seeing fewer good matches. In contrast, 40% of those reporting a good match only some of the time felt that they were seeing fewer good matches, and only 9% said they were starting to see an improvement in this regard. Those who reported rarely finding a good match between their organisation and volunteers were also more negative, with 33% stating they were seeing fewer good matches now compared to twelve months ago, and none stating this was improving. Respondents who identified themselves as employees were most positive about volunteers in their organisation, with 83% stating that they felt there was a good match between their organisation and its volunteers most or all of the time. 70% felt that this had not changed over the last year, while 16% believed this had improved. Among volunteers themselves, 71% felt there was a good match between them and their organisation most of the time. 71% felt this was consistent with the last year, while 14% believed it had improved. Committee members were somewhat more negative in this regard, with only 66% believing their organisation and its volunteers were a good match most or all of the time. 62% felt this had not changed over the last year, and 14% felt this had improved, though 22% reported seeing fewer good matches now. Chart 10: Trends in Matches Between Organisations and Volunteers More Fewer About the same Don't know 64% 3% 15% 18% 22
 86 92 Chart 11: Trends in Income 60% 50% 40% 30% 20% 10%")
23 4.3 Income & Expenditure Respondents were asked if their organisation s income over the last year had increased, decreased, or stayed about the same. Table 15: Trends in Income Impact Proportion of responses Stayed about the same 51% 46% Increased 28% 27% Decreased 21% 27% N(=100%) Chart 11: Trends in Income 60% 50% 40% 30% 20% 10% 0% Stayed about the same Increased Decreased Nearly half of all respondents (46%) reported that their organisation s income was about the same as it had been twelve months ago. This figure is slightly lower than what was reported in 2015 (51%). Just over a quarter of respondents (27%) said that their organisation s income had increased, representing very little change from 2015 (28%). The same proportion said that their organisation s income had decreased, compared to just over one fifth who said the same in 2015 (21%). Respondents were then asked if their expenditure over the last year had increased, decreased, or stayed about the same. Table 16: Trends in Expenditure Impact Proportion of Responses Increased 56% Stayed about the same 39% Decreased 5% N(=100%) 95 23

24 Chart 12: Trends in Expenditure 60.00% 50.00% 40.00% 30.00% 20.00% 10.00% 0.00% Increased Stayed about the same Decreased This question was not asked in 2015, so there is nothing to directly compare it to in previous years. More than half of respondents in 2017 said that their organisation s expenditure had increased over the last year, while just under two fifths said it had stayed the same, and a small percentage said it has decreased. By comparing reported trends income and expenditure, we can get a clearer picture of the overall financial situation in the sector. The table and chart below show the income situation for respondents whose expenditure has increased, decreased, or stayed the same. Table 17: Trends in Income and Expenditure Trends in Income Proportion of Responses Increased expenditure Decreased expenditure Static expenditure Increased income 46% 0% 3% Decreased income 29% 100% 17% Static income 25% 0% 80% N(=100%) Chart 13: Trends in Income and Expenditure Expenditure increased Expenditure decreased Expenditure static 0% 10% 20% 30% 40% 50% 60% 70% 80% 90% 100% Income increased Income decreased Income static 24
25 Almost half (46%) of respondents with increased expenditure were also seeing their income levels rise. 29% had seen their income levels fall, while a quarter (25%) had seen no change in their level of income. All respondents who reported decreased expenditure had seen decreased income, although this represents a small number of respondents only four organisations have seen their expenditure fall. Four fifths (80%) of respondents who reported static expenditure also reported no change in their income levels. A further 17% of organisations with static expenditure reported decreased income, and 3% reported that their income has increased. The table and chart below shows the expenditure situation for respondents whose income has increased, decreased, or stayed the same. Table 18: Trends in Income and Expenditure Trends in Expenditure Proportion of Responses Increased income Decreased income Static income Increased expenditure 96% 60% 31% Decreased expenditure 0% 16% 0% Static expenditure 4% 24% 69% N(=100%) Chart 14: Trends in Income and Expenditure Income increased Income decreased Income static 0% 10% 20% 30% 40% 50% 60% 70% 80% 90% 100% Expenditure increased Expenditure decreased Expenditure static Nearly all (96%) organisations with increased income have seen their expenditure rise. Only 4% have seen their expenditure stay the same, and no organisations with increased income have seen their expenditure fall. There are two reasons why this would be the case. The more optimistic view is that organisations may be experiencing success at securing new funding, and the increased expenditure refers to them using this new funding to start new projects or take on new areas of work. The more pessimistic view is that groups are responding to rising expenditure, rather than proactively raising income for new or expanded services, and are raising money simply to cover increased costs. The majority (60%) of respondents whose organisations have seen a drop in income have seen an increase in expenditure. A further quarter (24%) have seen no change in their expenditure, and 16% have seen their expenditure fall. 25

26 Organisations with static income mostly report static expenditure (69%). 31% report an increase in expenditure. No organisations with static income levels report a decrease in expenditure. The tables and charts below show income and expenditure, broken down by respondents organisation type. Table 19: Trends in Income by Organisation Type Type of Organisation Proportion of Respondents Increased Income Decreased Income Static Income All Respondents 46% 27% 27% Registered Charities 36% 26% 38% Limited Companies 35% 30% 35% Sports Clubs 7% 20% 73% N(=100%) 92 Chart 15: Trends in Income by Organisation Type All Respondents Registered Charities Limited Companies Sports Clubs 0% 10% 20% 30% 40% 50% 60% 70% 80% Increased Decreased Static Charities, companies and sports clubs were not likely to have seen a rise in income, with sports clubs being the least likely of all (only 7% reported increased income). Companies were more likely to report decreased income than respondents overall (30% compared to 27%). Sports clubs were much more likely than respondents overall to report static income (73% compared to 27%), though charities and companies were also more likely to report this than organisations overall (38% and 35% respectively). Sports clubs are faring worse than charities and companies, with 73% reporting that their income is static, and a further 20% reporting that it has decreased. Table 20: Trends in Expenditure by Organisation Type Type of Organisation Proportion of Respondents Increased Expenditure Decreased Expenditure Static Expenditure All Respondents 56% 5% 39% Registered Charities 63% 5% 32% Limited Companies 65% 0% 35% Sports Clubs 53% 0% 47% N(=100%) 95 26
, followed by charities (63%).")
27 Chart 16: Trends in Expenditure by Organisation Type All Respondents Registered Charities Limited Companies Sports Clubs 0% 10% 20% 30% 40% 50% 60% 70% Increased Decreased Static Comparing trends in expenditure by type of organisation shows that companies are most likely to report increased expenditure (65%), followed by charities (63%). Both of these represent a greater likelihood than organisations overall (56%). Only 5% of charities reported decreased expenditure; no companies or sports clubs said that they were spending less now than they were twelve months ago. The survey next asked respondents where their organisation has received funding from in the last 12 months. Table 21: Sources of Funding Sources of funding Proportion of Responses Donations from individuals 62% Fundraising events 47% Grants from charitable trusts / foundations 46% Contracts / grants from the public sector (e.g. Council, CCG) 36% Charging for membership 31% Selling goods or services 31% Grants from businesses 28% Sponsored events 26% Collection tins 22% Big Lottery Fund 20% Charging beneficiaries 11% Legacies 10% N(=100%) 94 27
28 Chart 17: Sources of Funding Donations from individuals Fundraising events Grants from charitable trusts / foundations Contracts / grants from the public sector (e.g. Charging for membership Selling goods or services Grants from businesses Sponsored events Collection tins Big Lottery Fund Charging beneficiaries Legacies 0.00% 10.00% 20.00% 30.00% 40.00% 50.00% 60.00% 70.00% Donations from individuals is reported as the most popular source of income this is not to say it is the main source of funding, only that more groups raise money through this method than through any other. Close to two thirds of respondents report that they raise money this way. The second most popular way to raise funding is through fundraising events, closely followed by grants from charitable trusts and foundations, both of which are a source of income for slightly less than half of respondents. Just over a third of respondents list contracts and grants from the public sector as a source of income. Just under a third raise money by charging their members and by selling goods and services. Smaller proportions secure grants from businesses, raise money through sponsored events, and use collection tins. One fifth of respondents have secured grants from the Big Lottery Fund. Only one in ten organisations charge their beneficiaries, and a slightly smaller number have had success in generating income through legacies. Among those groups who report both increased income and expenditure, nearly half say they have received income from the Big Lottery Fund, compared to 20% overall. 63% report they have raised income from trusts and foundations, compared to 46% overall. Income from the Big Lottery Fund, and from trusts and foundations, would typically be restricted income which groups secure to fund new areas of work. This lends credence to the idea that organisations reporting increased income and expenditure are proactively seeking out new funding streams. On the other hand, these figures are lower than donations from individuals (88%) and income secured through events (67%) reported by the same organisations. These forms of income would more typically be unrestricted income, which could be used to fund new areas of work, or could be used to cover costs. It is therefore also a possibility that groups are putting more resource into unrestricted fundraising in an attempt to cover an increase in expenditure. Caution should be exercised in reading too much into this data, however, for the simple fact that some forms of income are much easier to secure than others. Most frontline charities secure some amount of funding through individual donations, even if this does not amount to very much as a proportion of their total costs; while securing a Big Lottery Fund grant is a more involved and timeconsuming process with a lower likelihood of success. Groups who do not report that they have received funding from the Big Lottery Fund, or from trusts and foundations, may nevertheless have been attempting to raise funds from these sources in an effort to take on new areas of work. The table and chart below break down these results by organisation type. 28
29 Table 22: Sources of Funding by Organisation Type Source of Funding Proportion of Responses All Registered Limited Sports Clubs Respondents Charities Companies Donations from 62% 77% 27% 100% individuals Fundraising events 47% 62% 20% 100% Grants from charitable 46% 59% 13% 100% trusts / foundations Contracts / grants from 36% 43% 7% 0% the public sector (e.g. Council, CCG) Charging for membership 31% 20% 93% 0% Selling goods or services 31% 41% 7% 75% Grants from businesses 28% 36% 7% 50% Sponsored events 26% 34% 7% 50% Collection tins 22% 28% 13% 0% Big Lottery Fund 20% 30% 0% 0% Charging beneficiaries 11% 13% 0% 0% Legacies 10% 13% 0% 0% Chart 18: Sources of Funding by Organisation Type Donations from individuals Fundraising events Grants from charitable trusts / foundations Contracts / grants from the public sector (e.g. Council, CCG) Charging for membership Selling goods or services Grants from businesses Sponsored events Collection tins Big Lottery Fund Charging beneficiaries Legacies 0% 10% 20% 30% 40% 50% 60% 70% 80% 90% 100% Sports Clubs Limited Companies Registered Charities All Respondents 29
30 Charities have the most diversification of funding, compared to companies and sports clubs. Only charities report raising funding through charging beneficiaries, legacies, and the Big Lottery Fund; only charities and companies report raising income through contracts/grants with the public sector, charging for membership, and by using collection tins. Companies are far more likely (93%) than organisations overall (31%) to raise money by charging beneficiaries. They are less likely than groups overall to raise money through any other method. All sports clubs reported that they raise income through individual donations, fundraising events and grants from charitable trusts/foundations. The majority of sports clubs (75%) also raise funding by selling goods and services, while only 41% of charities and 7% of companies source income by this method. Respondents were next asked, for each of these funding sources, whether their income has increased or decreased compared to the previous year. Table 23: Trends in Funding Income Source Proportion of responses (of those who have this income source) Increased Decreased Stayed about the same Charging beneficiaries 22% 11% 67% Legacies 30% 40% 30% Collection tins 27% 23% 50% Big Lottery Fund 39% 13% 48% Sponsored events 30% 26% 44% Charging for membership 21% 14% 64% Selling goods or services 30% 7% 63% Grants from businesses 29% 29% 42% Contracts / grants from the public sector (Council, CCG, etc.) 3% 46% 51% Grants from charitable trusts / foundations 27% 20% 52% Fundraising events 31% 22% 47% Donations from individuals 34% 23% 43% 30

31 Chart 19: Trends in Funding Donations from individuals Fundraising events Grants from charitable trusts / foundations Contracts / grants from the public sector (Council, CCG, Grants from businesses Selling goods or services Charging for membership Sponsored events Big Lottery Fund Collection tins Legacies Charging beneficiaries Increased Decreased Stayed about the same The biggest increase is groups securing income from the Big Lottery Fund nearly two fifths of respondents reported that they have increased their funding in this area. Around one third of respondents reported that they have increased their income by donations from individuals, fundraising events, legacy fundraising, selling goods and services, and grants from businesses. Only 3% of respondents have increased their income from public sector grants and contracts. Conversely, nearly half of respondents have reported that their income from public sector grants and contracts has decreased over the last year. Two fifths reported a decrease in their income from legacies. Among those who reported an increased income, the biggest increase was in donations from individuals (52%), followed by fundraising events (41%). This compares to 34% and 31% respectively. Among the same group, the number who claimed an increase in Big Lottery funding (29%) is significantly lower than the overall number (39%), although the number claiming an increase in grants from trusts and foundations (32%) is higher than the overall number (27%). These groups did not report any significant decreases in any sources of income. Among those who reported decreased income, grants from trusts and foundations had dropped significantly, with a decrease of 38% - considerably higher than the overall figure of 20%. The biggest decrease by far, though, was a drop of 69% in groups who used to get income from contracts/grants from the public sector but no longer do. This compares to 46% overall. These groups did not report any significant increases in any sources of income. Among those who reported static income, very few (22%) claim income from the Big Lottery Fund, and the majority of those that do report that this income stream is static. These organisations reported no significant increases or decreases in any sources of income. Among those who raise funding through public sector grants and contracts, the majority (61%) report static income, and 30% reported their income from this source had decreased. Only one organisation reported an increase in income from public sector grants and contracts. 31
32 This suggests that those reporting an increase in income are mostly increasing their unrestricted income, through individual donations and fundraising events, with some also gaining income through foundations and trusts. Those reporting a decrease in income are losing out on public sector grants and contracts, and from foundations and trusts which have supported them in the past. Those reporting static income are experiencing little change in their income streams. Respondents were asked what actions their organisations had taken to help reduce expenditure over the last year. Table 24: Actions to make ends meet Actions Taken Proportion of Responses Review spending on small items, e.g. office supplies 37% Recruit more volunteers 35% Invest in fundraising, marketing or business development 23% Limit service provision (fewer hours or beneficiaries) 22% Increase or introduce charges for services 20% Start new chargeable services 14% Reduce the hours of paid staff 11% Cut services 9% Make one or more paid staff redundant 9% Other (please specify) 25% N(=100%) 65 Other responses included encouraging members to take part in fundraising events, reviewing contracts, selling a building, using reserves, and staff giving their own time/equipment and not claiming expenses. Chart 20: Actions to make ends meet Review spending on small items, e.g. office supplies Recruit more volunteers Invest in fundraising, marketing or business development Limit service provision (fewer hours or beneficiaries) Increase or introduce charges for services Start new chargeable services Reduce the hours of paid staff Cut services Make one or more paid staff redundant Other 0% 5% 10% 15% 20% 25% 30% 35% 40% 32
33 More than a third of respondents reported that their organisations reviewed spending on small items such as office supplies (37%), and recruited more volunteers (35%) in an effort to make ends meet. Nearly a quarter have invested in generating new income streams via fundraising, marketing or business development (23%). A slightly smaller proportion have limited their service provision (22%), and one fifth have increased or introduced charges for their services (20%). Less than one in ten have cut services altogether (9%). Making paid staff redundant was the least popular action taken to make ends meet, with less than one in ten respondents reporting that their organisations had done this (9%). Reducing the hours of paid staff was similarly unpopular, scoring only slightly higher than making paid staff redundant (11%). This could indicate that organisations are unwilling to make staff redundant or cut their hours, possibly because they see this as a last resort, or because they are reliant on their current staff to the point that this would leave the organisation unable to function. Those organisations who have cut staff hours or made staff redundant have tended to be those organisations which employ fewer staff to begin with, in most cases 6 or fewer part-time staff members and 3 or fewer full-time staff members. Responses to this question suggest that organisations are meeting greater demand for services by recruiting new volunteers, rather than replacing staff with volunteers. In general, it seems that organisations are investing in new income generation streams rather than cutting staff. Where expenditure has been cut, this has generally been through reviewing spending on small items such as office supplies rather than by reducing staff hours. However, greater demand for services and greater expenditure is also leading, in some cases, to services being reduced or charges introduced. In a small minority of cases, services have been cut altogether. 33
34 4.4 Beneficiaries Respondents were asked to identify the primary beneficiaries of their organisations work. Table 25: Primary Beneficiaries Primary Beneficiaries Proportion of Responses Children & Young People 43% Older People 34% People with Mental Health Problems 30% People with Physical Disabilities 29% People who are Socially Isolated 28% Families & Single Parents 26% People with Long Term & Chronic Illness 25% Women 24% People on Low Incomes 23% People with Learning Disabilities 19% Men 19% Voluntary & Community Groups 19% Carers 18% Unemployed People 16% Other (please specify) 16% Homeless People 15% Tenants and Residents 15% Black & Ethnic Minority People 14% Schools 12% Volunteers 12% Offenders and ex-offenders 11% People with Substance Misuse Issues 11% Faith Groups 9% GLBT (Gay, Lesbian, Bisexual, Transgender) People 9% Victims of Crime 9% Refugees / Asylum Seekers 8% Sports Clubs 8% Businesses / Employees 6% Hospitals 5% Environment 3% Animals 1% N(=100%) 89 Other responses included the visually impaired, all sections of the community, people with a life limiting illness, people facing a financial emergency or crisis, and bereaved people. 34
35 Chart 21: Primary Beneficiaries Children & Young People Older People People with Mental Health Problems People with Physical Disabilities People who are Socially Isolated Families & Single Parents People with Long Term & Chronic Illness Women People on Low Incomes Voluntary & Community Groups Men People with Learning Disabilities Carers Other Unemployed People Tenants and Residents Homeless People Black & Ethnic Minority People Volunteers Schools People with Substance Misuse Issues Offenders and ex-offenders Victims of Crime GLBT (Gay, Lesbian, Bisexual, Transgender) People Faith Groups Sports Clubs Refugees / Asylum Seekers Businesses / Employees Hospitals Environment Animals 0% 5% 10% 15% 20% 25% 30% 35% 40% 45% By far, children and young people are the group most identified by respondents as their main beneficiaries (43%). Older people were next, with just over a third of respondents reporting them as their main beneficiaries (34%). The next main groups identified as primary beneficiaries are people with mental health problems (30%), people with physical disabilities (29%), and people who are socially isolated (28%). The groups least identified as main beneficiaries are animals, with just 1% of responses, and the environment, reported by only 3% of respondents as main beneficiaries. These results are skewed slightly by a small number of respondents who ticked nearly all of the boxes, indicating their full range of beneficiaries rather than their primary beneficiaries. This may be due to the wording of the question being unclear. While it is not possible to show a breakdown for organisations main activities against all other answers there are simply more permutations than can fit into this report a couple of interesting 35
36 facts emerge when comparing these answers with answers to other questions. For instance, organisations whose primary beneficiaries include children and young people, older people, and physical disabilities were considerably more likely to recruit new volunteers by word of mouth (92-93%) than groups overall (84%). Organisations whose primary beneficiaries included children and young people were more likely to report increased expenditure (68%) than groups overall (55%). Respondents were next asked to describe the main activities of their organisation. Table 26: Main Activities Main Activities Proportion of Responses Education & Training 30% Advice & Information Services 28% Events 27% Social Activities & Clubs 25% Sports and Leisure Facilities 23% Other (please specify) 19% Counselling & Therapy 16% Meeting Space 16% Advocacy & Campagining 15% Befriending 14% Healthcare 11% One to One Support 11% Selling Goods and Services 10% Employment Opportunities 8% Arts 7% Respite 7% Giving Grants 6% Religious Services 6% Transport 6% Community Safety 5% Housing Support 5% Mentoring 5% Telephone Helpline 5% Heritage 3% Infrastructure Support 3% Translating & Interpreting 3% Accommodation 2% International Aid 2% Mediation 2% Relief of Poverty 2% Income Support 1% N(=100%) 89 Other responses to this question included special exercise programmes, promoting independence and emotional health, fostering, the promoting of volunteering, and the promotion of language and culture. 36
37 Chart 22: Main Activities Education & Training Advice & Information Services Events Social Activities & Clubs Sports and Leisure Facilities Other Meeting Space Counselling & Therapy Advocacy & Campagining Befriending One to One Support Healthcare Selling Goods and Services Employment Opportunities Respite Arts Transport Religious Services Giving Grants Telephone Helpline Mentoring Housing Support Community Safety Translating & Interpreting Infrastructure Support Heritage Relief of Poverty Mediation International Aid Accommodation Income Support 0% 5% 10% 15% 20% 25% 30% 35% Education and training was identified as the main activity by nearly one third of respondents (30%). This was followed by advice and information services (28%), events (27%), and social activities and clubs (25%). Sports and leisure facilities was reported as a main activity by just less than a quarter of respondents (23%), reflecting the proportion of sports clubs who filled out the survey, although some organisations which identified as charities rather than sports clubs also defined this as their primary activity. Income support was least identified as a main activity, with only 1% of respondents reporting this. Relief of poverty, mediation, international aid and accommodation had similarly low scores, each being the primary activity for only 2% of respondents. Again, while it is not possible to look at every possible permutation or comparison with the results of other questions, some unexpected and interesting findings are worth pointing out here. For instance, the average number of regular and committed volunteers, for all respondents, is 43. For those whose main activity is education/training, this is much higher, at 91. Those delivering 37
38 counselling as a main activity have on average 90 regular, committed volunteers, while those who deliver befriending services as their primary activity report having an average of 102 regular, committed volunteers. For groups who deliver one-to-one support as a main activity, this rises to 103; those delivering healthcare report an average of 111; and those whose main activity is transport report an average of 142 regular and committed volunteers. A similar pattern can be found among casual volunteer usage. The average number of casual volunteers for all respondents is 32, while organisations whose main activity is transport report having an average of 357 casual volunteers. Advocacy organisations report an average of 183, while those delivering training/education report 77. Befriending and one-to-one organisations report fewer casual volunteers 20 and 9 respectively. Education and training charities report an average of 10 part-time staff, transport charities report 6, and advocacy charities report 6; this compares to the overall average of 5. A similar pattern is seen regarding full-time staff, where education and training charities report an average of 13 full-time staff, transport charities report 17, and advocacy charities report 11; this compares to an overall average of 7. Other types of charity report fewer part-time and full-time staff. Respondents who reported increased income over the last year were considerably more likely than respondents overall to report that their primary activities were social activities and clubs (43%), education and training (39%). No organisations whose income was increasing identified accommodation, heritage, housing support, income support, infrastructure support, or relief of poverty as their primary activity. Respondents who reported decreased income were much less likely to report social activities and clubs as a primary activity (9%), although they were even more likely to report education and training as a primary activity than those whose income has increased (41%). No organisations whose income was decreasing identified international aid, religious services or respite as their primary activity. 25% of respondents who reported static income reported social activities and clubs as a primary activity, the same proportion as respondents overall. Education and training was less likely to be reported as a main activity by these organisations (20%). The suggestion here is that new, or increased funding, is available for organisations providing social activities and clubs, as organisations who provide these as their primary activity are much more likely to have seen their income rise over the past year. While education and training is a main activity for a large proportion of respondents, organisations providing this as their primary activity have not necessarily seen increased funding over the past year, and many have seen their income levels fall. Respondents were asked how many people their charity has supported over the last 12 months. 38
 30% 25% 20% 15% 10% 5% 0% 0-50 51-100 101-200 201-500 501-2000 2000+ 2015 2017 Chart 24: Number of Beneficiaries (2017 only) 0-50 51-100 101-200 201-500")
39 Table 27: Number of Beneficiaries ( ) Beneficiaries Proportion of responses % 9% % 19% % 12% % 28% % 13% Over % 19% N(=100%) Chart 23: Number of Beneficiaries ( ) 30% 25% 20% 15% 10% 5% 0% Chart 24: Number of Beneficiaries (2017 only)
40 While the average number of beneficiaries is around 4,000, the reality varies widely from this. 17 of the groups who responded to this question (19%) reported 2,000 or more beneficiaries, with one group reporting that they had 200,000 beneficiaries in the last twelve months. A further four organisations reported more than 10,000 beneficiaries, and three more reported having 4,000 or more beneficiaries. The vast majority of respondents, however, reported far fewer beneficiaries than this. Around one in ten organisations reported that 50 or fewer people had benefited from their work over the last year three groups reported that nobody had benefited at all. One fifth responded that they had between 51 and 100 beneficiaries. 12% reported that they had between 101 and 200 beneficiaries. It was most common for organisations to report between 201 and 500 beneficiaries, with 28% of respondents reporting this. Within this category there is wide variation, though the majority of organisations supported more than 300 people. A further 13% of respondents reported that they had between 501 and 2000 beneficiaries; again, there is wide variation within this category, with some respondents reporting 600 beneficiaries and others reporting Compared to the 2015 survey results, there is a significant rise among organisations supporting between 201 and 500 people, from 21% to 28% of respondents, and also a slight rise in organisations supporting more than 2,000 beneficiaries. The proportion of organisations supporting fewer than 200 people has dropped since This suggests organisations have taken on more beneficiaries compared to Organisations which participated in the focus group sessions reflected on changes in beneficiaries over the last year. In particular, a number of groups reported seeing more people who need support with mental health issues this may be due to awareness around mental health issues being raised, rather than more people suffering from mental health issues. Several groups also reported seeing a rise in younger beneficiaries. Many groups were aware of more potential beneficiaries than they have the resource to deal with, and reported that a sudden large influx of beneficiaries would pose a problem for their organisations. Respondents were then asked if they supported more or fewer people in the last 12 months than the previous year. Table 28: Trends in Beneficiaries Beneficiaries Proportion of responses More people 71% 43% Fewer people 4% 9% About the same 25% 48% N(=100%)

41 Chart 25: Trends in Beneficiaries More people About the same Fewer people 0.00% 10.00% 20.00% 30.00% 40.00% 50.00% 60.00% 70.00% 80.00% Close to half of respondents felt that their organisation supports about the same number of people when they filled out the survey as they had done twelve months previously. Just more than four in ten respondents reported that their organisation supports more people now, while only one in ten reported supporting fewer people. This suggests that, although many organisations (43%) are still experiencing a rise in beneficiary numbers, the rate of increase may have slowed since Only one quarter of respondents reported static beneficiary numbers in 2015, while close to half reported this in The proportion of respondents reporting fewer beneficiaries has also more than doubled since Responses to this and the previous question imply that the rate of beneficiary growth has slowed since 2015 (and even reversed in a small number of cases). This question does not measure the demand for service, so could reflect organisations limited resources it could be that fewer people are accessing services because there aren t enough staff and volunteers to support them, rather than because fewer people are in need of services. Table 29: Trends in Beneficiaries by Organisation Type Type of Organisation Proportion of Responses More Beneficiaries Fewer Beneficiaries Static Beneficiaries All Respondents 43% 9% 48% Registered Charities 48% 4% 48% Limited Companies 52% 11% 37% Sports Clubs 20% 20% 60% N(=100%) 89 41

42 Chart 26: Trends in Beneficiaries by Organisation Type 60% 50% 40% 30% 20% 10% 0% All Respondents Registered Charities Limited Companies Sports Clubs More Beneficiaries Fewer Beneficiaries Static Beneficiaries Breaking down the results by organisation type shows that limited companies are more likely to have increased their beneficiary numbers than other types of organisation. Companies and charities are both more likely than respondents overall to have seen their beneficiary numbers rise over the last year (52% and 48% respectively, compared to an overall result of 43%). Registered charities are less likely than other organisation types to have seen a decrease in beneficiary numbers (4%, compared to 9% overall). Sports clubs are significantly more likely to report that their beneficiary numbers are static than other types of organisation (75% and 60% respectively, compared to 48% overall). Table 30: Trends in Beneficiaries by Trends in Income Income Proportion of Responses More Beneficiaries Fewer Beneficiaries Static Beneficiaries All Respondents 43% 9% 48% Increased Income 65% 4% 31% Decreased Income 36% 23% 41% Static Income 30% 5% 65% N(=100%) Ranges from 22 to 89 42

 Ranges from 3 to 89 Chart 28: Trends in Beneficiaries by Trends in Expenditure Static Expenditure Decreased Expenditure Increased Expenditure All Respondents 0% 10% 20% 30% 40% 50% 60%")
43 Chart 27: Trends in Beneficiaries by Trends in Income All Respondents Increased Income Decreased Income Static Income 0% 10% 20% 30% 40% 50% 60% 70% More Beneficiaries Fewer Beneficiaries Static Beneficiaries Table 31: Trends in Beneficiaries by Trends in Expenditure Income Proportion of Responses More Beneficiaries Fewer Beneficiaries Static Beneficiaries All Respondents 43% 9% 48% Increased Expenditure 53% 10% 37% Decreased Expenditure 33% 67% 0% Static Expenditure 28.5% 3% 68.5% N(=100%) Ranges from 3 to 89 Chart 28: Trends in Beneficiaries by Trends in Expenditure Static Expenditure Decreased Expenditure Increased Expenditure All Respondents 0% 10% 20% 30% 40% 50% 60% 70% Static Beneficiaries Fewer Beneficiaries More Beneficiaries Looking at how trends in beneficiaries compare to trends in income and expenditure yields some interesting results. Those who have seen increased income over the last year are much more likely to have seen a corresponding rise in beneficiaries (65% compared to 43%). Those who have seen their income fall are more likely to have seen their beneficiary numbers remain static (41%), though 43
44 a large proportion (36%) have seen their beneficiary numbers rise, despite seeing a reduction in funding. Those with static income are even more likely to have seen beneficiaries remain static (65%), but again, many (30%) are seeing a rise in beneficiaries without a corresponding rise in funding. Organisations with increased expenditure are also more likely to have seen a rise in beneficiaries (53% compared to 43% overall). Those with decreased expenditure are more likely to have seen a drop in beneficiaries (67%, significantly higher than the 9% for respondents overall). Those with a static level of expenditure are most likely to see their beneficiary numbers also remain static (68.5%). This suggests that the expenditure of organisations which responded to this survey is directly linked to the number of people they support. Those who are spending less are able to support fewer people, and those who are spending more are supporting more people. 44
45 4.5 The Local Sector Respondents were asked how familiar they are with a number of infrastructure organisations, including One Swindon, My Care My Support, Healthwatch Swindon, Sanford House (Swindon Advice & Support Centre), Involve Swindon, Volunteer Centre Swindon, and Voluntary Action Swindon. Table 32: Awareness of Infrastructure Bodies Organisation Proportion of responses Very familiar Fairly familiar Not particularly familiar Know nothing about them One Swindon 13% 11% 31% 22% 40% 38% 16% 29% My Care My - 22% - 23% - 25% - 30% Support Healthwatch 26% 30% 22% 31% 35% 21% 17% 19% Swindon Sanford House - 38% - 28% - 19% - 15% Involve Swindon Volunteer Centre Voluntary Action Swindon - 41% - 16% - 25% - 18% - 46% - 25% - 15% - 14% 56% 58% 32% 26% 11% 9% 1% 7% 45

46 Chart 29: Awareness of Infrastructure Bodies (2017) 100% 90% 80% 70% 60% 50% 40% 30% 20% 10% 0% Voluntary Action Swindon Volunteer Centre Involve Swindon Sanford House Healthwatch Swindon My Care My Support One Swindon Very familiar Fairly familiar Not particularly familiar Know nothing about them Voluntary Action Swindon scored highest for very familiar, with nearly six in ten respondents giving this score. A further quarter of respondents reported that they were fairly familiar with Voluntary Action. One in ten said that they were not particularly familiar, and a slightly smaller proportion reported that they know nothing about the organisation. This was followed by the Volunteer Centre, whom nearly half of respondents said they were very familiar with, and Involve Swindon, which achieved a very familiar score from four in ten respondents. A further quarter of respondents said that they were fairly familiar with the Volunteer Centre, though this drops to 16% for Involve Swindon. These proportions are reversed for the not particularly familiar answer, where a quarter reported this score for Involve, and only 15% said this for the Volunteer Centre. Around a third of respondents said they were very familiar with Healthwatch Swindon, and a further third said they were fairly familiar. Nearly four in ten respondents reported they were very familiar with Sanford House, and nearly three in ten said they were fairly familiar. One in five stated they were not particularly familiar with the charity hub, and 15% said they knew nothing about it. My Care My Support scored significantly lower, with around one in five stating they were very familiar, and nearly a quarter reporting they were fairly familiar with the website. My Care My Support also received the largest number of know nothing about them ratings. One Swindon had the lowest familiarity rating, with only one in ten respondents claiming to be very familiar with the partnership. Nearly four in ten stated they were not particularly familiar with One Swindon, and three in ten stated they knew nothing about it. 46
47 Chart 30: Awareness of Infrastructure Bodies ( ) 100% 90% 80% 70% 60% 50% 40% 30% 20% 10% 0% One Swindon Voluntary Action Swindon Healthwatch Swindon Very familiar Fairly familiar Not particularly familiar Know nothing about them Only Voluntary Action Swindon, One Swindon and Healthwatch Swindon were included in the familiarity question in the 2015 survey. Of the three, both VAS and Healthwatch have seen a rise in very familiar ratings, with Healthwatch seeing the biggest rise (4%), compared to VAS s 2% increase. Very familiar ratings for One Swindon, however, have dropped by 2% since Healthwatch has also seen a large rise in fairly familiar ratings, up by 9%. VAS and One Swindon have seen a drop in fairly familiar ratings, of 6% and 9% respectively. All three organisations have seen a drop in not particularly familiar ratings, and again Healthwatch appears to have been most successful at awareness-raising, its score here having reduced by 6%, compared to VAS and One Swindon s drops of 2%. All three organisations have seen a rise in the proportion of respondents reporting that they know nothing about them. One Swindon s increase is the largest by a significant margin at 13%. VAS s proportion of know nothing about them responses increased by 6%, while Healthwatch s increased by 2%. There is large variation between different types of organisation and their familiarity with infrastructure bodies. The mean scores for familiarity are shown in the table below. Table 33: Awareness of Infrastructure Bodies by Organisation Type Familiarity with Mean Scores Infrastructure All Registered Limited Sports Clubs Organisation Respondents Charities Companies Voluntary Action Swindon Volunteer Centre Involve Swindon Sanford House Healthwatch Swindon My Care My Support One Swindon Registered charities are more familiar with infrastructure bodies, and companies even more so. Sports clubs have a much lower familiarity with infrastructure bodies among sports clubs, only VAS 47
48 and the Volunteer Centre receive any very familiar responses at all, and all organisations score higher than 45% for know nothing about them. It seems that awareness of infrastructure bodies is considerably lower among the sports clubs which responded to the survey than among other groups. Respondents were asked about the effectiveness of a number of infrastructure organisations they may have worked with, including Voluntary Action Swindon, Swindon Borough Council, Wiltshire Police, the NHS, Clinical Commissioning Group, Town or Parish Councils, and local schools or colleges. The results have been converted into mean scores, to facilitate comparison with the 2015 survey s results. Table 34: Partner effectiveness Partners Mean Scores Wiltshire Police VAS Clinical Commissioning Group Local schools or colleges NHS Town or Parish Councils Swindon Borough Council Chart 31: Partner effectiveness (2017) 100% 90% 80% 70% 60% 50% 40% 30% 20% 10% 0% Very effective Fairly effective Not particularly effective 48
49 Chart 32: Partner effectiveness ( ) Voluntary Local schools or Wiltshire Police NHS Clinical Action Swindon colleges Commissioning Group Swindon Borough Council Town or Parish Councils All of the partners achieve a positive score, but some are seen as more effective than others. The strongest positive view is of Voluntary Action Swindon, which secured the highest proportion of very effective and lowest proportion of not particularly effective ratings. Local schools and colleges that respondents have worked with scored the next highest proportion of very effective ratings, and the highest proportion of fairly effective ratings (joint with Swindon Borough Council). Both these scores are consistent with responses the 2015 survey, representing a slight rise for Voluntary Action and a slight drop for schools and colleges. Wiltshire Police s score was similar to local schools and colleges, with a large number of fairly effective ratings. This represents a surprising fall from 2015, when Wiltshire Police achieved the strongest positive view. The NHS received a slightly lower score, representing a slight fall from 2015, but still being seen as fairly effective by the majority of groups who have worked with them. The Clinical Commissioning Group s score has fallen furthest of all from 2015, when it received one of the most positive scores. In this survey, views were largely split between fairly effective and not particularly effective for the CCG, with a few organisations considering them very effective. Views of Swindon Borough Council have also fallen somewhat since 2015, and they received the highest proportion of not particularly effective ratings in this survey; however, they also received the most fairly effective ratings (joint with local schools and colleges), showing that a significant number of organisations who have worked with the Council do take a positive view. Finally, Town or Parish Councils received the lowest score, and the second highest proportion of not particularly effective ratings. Only one respondent considered them to be very effective. Again, this represents a significant drop from their 2015 score. 49
50 Some organisations that participated in the focus group sessions reported more positive engagement now between the voluntary sector and Swindon Borough Council than in previous years. One way in which the Council helps organisations is by allowing them to pay peppercorn rent on land and buildings that they own. It was felt, however, that more could be done with empty office space in the town centre (where the Council owns this many properties are owned by private landlords), which is currently too expensive for any charity or community group to move into. Organisations would benefit from a town centre presence, and the Council would benefit from making money from charging voluntary sector groups a peppercorn rent, rather than allowing these buildings to go derelict. Some organisations who took part in the focus group sessions felt that the CCG was not visible enough, while CCGs in other areas work more closely with their local sector. There were exceptions to this, however, as at least one organisation reported being approached directly by the CCG to work closer together. Feelings about local media were mixed, with some reporting a positive relationship between their organisation and BBC Wiltshire, Swindon 105.5, and Swindon Advertiser. Others took a more negative view of Swindon Advertiser, feeling that the newspaper wants charities to write the story for them, and simply cuts and pastes what organisations send them. Many organisations agreed that My Care My Support was a good concept, but was not well delivered, and is no longer very useful as it is not kept up to date. From the responses to this question, in which respondents were also asked to tick not applicable if they do not work with a particular organisation, we can see how many respondents work with each organisation. Table 35: Partner organisations Partner organisation Proportion of Responses Swindon Borough Council 70% 58% Voluntary Action Swindon 42% 54% Local schools or colleges 41% 43% NHS 29% 39% Wiltshire Police 27% 37% Town or Parish Councils 29% 30% Clinical Commissioning Group 17% 23% N(=100%)
51 Chart 33: Partner organisations Swindon Borough Council Voluntary Action Swindon Local schools or colleges NHS Wiltshire Police Town or Parish Councils Clinical Commissioning Group 0% 10% 20% 30% 40% 50% 60% 70% 80% Most organisations who filled out the survey work with (or have previously worked with) both Swindon Borough Council and Voluntary Action Swindon, with a slightly higher proportion working with (or having worked with) Swindon Borough Council. More than four in ten organisations work with local schools or colleges, which is perhaps not surprising given that children and young people rank first among the beneficiaries of organisations who responded to the survey. Just less than four in ten organisations work with the NHS, which again is unsurprising considering that many respondents work with older people, people with mental health problems, people with physical disabilities, and people with long term and chronic illnesses. Slightly fewer organisations work with Wiltshire Police, and fewer still (around three in ten) work with Town or Parish Councils. Less than one quarter of respondents work with the Clinical Commissioning Group. Mostly, these answers are not dissimilar to 2015 s answers, though the proportion of organisations working with Swindon Borough Council has dropped significantly from 70% to 58%. The proportion of respondents working with VAS, meanwhile, has risen from 42% to 54%. The proportion of groups working with the NHS has risen from 29% to 39%, and those working with Wiltshire Police has risen from 27% to 37%. Respondents were asked how engaged their organisation is with a number of infrastructure organisations and networks, including voluntary and community sector networks, public sector bodies, charitable funders, local businesses and local media. The table and chart below reflect only those respondents who reported that they are aware of these networks. 51
52 Table 36: Engagement with infrastructure networks Network Very engaged Fairly engaged Proportion of Respondents Not particularly engaged Not at all engaged Was not aware of them Voluntary and community sector networks 33% 29% 22% 11% 6% Swindon Borough Council 23% 32% 23% 21% 1% Public sector bodies 17% 31% 28% 20% 4% Charitable funders 21% 26% 26% 23% 5% Local businesses 20% 31% 22% 20% 7% Local media 21% 36% 34% 6% 3% N(=100%) 84 Chart 34: Engagement with infrastructure networks 100% 90% 80% 70% 60% 50% 40% 30% 20% 10% 0% Voluntary and community sector networks Swindon Borough Council Local media Charitable funders Local businesses Public sector bodies Very engaged Fairly engaged Not particularly engaged Not at all engaged One third of respondents felt that they are very engaged with voluntary and community sector networks, and a similar number reported that they are fairly engaged. This is not particularly surprising in a survey which was sent out to the local voluntary and community sector, although a significant number of respondents nearly a quarter said that they are not particularly engaged with voluntary and community sector networks, and a further 11% reported being not at all engaged. 6% of respondents said that they were not aware of voluntary and community sector networks. All other networks scored highest for fairly engaged, with some variation. Swindon Borough Council achieves more very engaged responses than other networks. The results have been converted into mean scores below. 52
53 Table 37: Engagement with infrastructure networks by Organisation Type Network Voluntary and community sector networks Swindon Borough Council Public sector bodies Charitable Mean Scores All Respondents Registered Charities Limited Companies Sports Clubs funders Local businesses Local media Converting the results to mean scores shows that, on average, respondents feel they are most engaged with voluntary and community sector networks, and least engaged with charitable funders. Engagement with all infrastructure groups is in the positives. Among registered charities and companies, engagement with all infrastructure groups scored higher than for groups overall. Charities and companies feel most engaged with voluntary and community sector networks, followed by local businesses and local media. Companies are significantly more engaged with Swindon Borough Council and public sector bodies than are charities. For sports clubs, on the other hand, engagement with the majority of infrastructure groups scored in the negatives. Sports clubs felt least engaged with voluntary and community sector networks, followed by charitable funders and local businesses. Only Swindon Borough Council scored in the positives here, and this is a low score. Table 38: Engagement with infrastructure networks measured against Trends in Income Network Voluntary and community sector networks Swindon Borough Council Public sector Mean scores All respondents Increased income Decreased income Static income bodies Charitable funders Local businesses Local media Compared to overall results, those respondents whose organisations had seen their income increase over the last year felt more engaged with all infrastructure groups they were asked about. Organisations whose income had decreased felt they were less engaged with all infrastructure groups, although the level of engagement with many groups was practically the same as the overall 53
54 result. It is perhaps not surprising that those who have seen a decrease in their income have a much lower level of engagement with charitable funders than the average, and that those with increased income have much higher engagement with both charitable funders, public sector bodies and local businesses, all significant sources of funding. What is surprising is that those organisations reporting static income are less engaged than all other respondents, and even less engaged than those reporting decreased income with the exceptions of public sector bodies and local businesses. This may be a result of organisations who are experiencing a loss of income becoming proactively more engaged with infrastructure groups and networks in their search for replacement funding, while organisations whose income is static do not feel the same pressure to do so. Table 39: Engagement with infrastructure networks measured against Trends in Expenditure Network Voluntary and community sector networks Swindon Borough Council Public sector Mean scores All respondents Increased expenditure Decreased expenditure Static expenditure bodies Charitable funders Local businesses Local media Compared to overall results, respondents with increased expenditure felt somewhat more engaged with all infrastructure groups. Those with decreased expenditure were mostly less engaged, though they reported being more engaged with charitable funders, and particularly with voluntary and community sector networks. Respondents with static expenditure were less engaged than respondents overall with all infrastructure groups. Respondents were then asked which of these networks their organisations would benefit from being more engaged with. Table 40: Engagement that would benefit organisations Network Proportion of Responses Voluntary and community sector networks 56% Swindon Borough Council 44% Public sector bodies 34% Charitable funders 59% Local businesses 63% Local media 56% N(=100%) 80 54


55 Chart 35: Engagement that would benefit organisations Local businesses Charitable funders Local media Voluntary and community sector networks Swindon Borough Council Public sector bodies 0% 10% 20% 30% 40% 50% 60% 70% Close to two thirds of respondents felt that their organisation would benefit from greater engagement with local businesses. A slightly smaller proportion responded that they would benefit from greater engagement with charitable funders, followed by local media and voluntary and community sector networks. Less than half saw the value in becoming more engaged with Swindon Borough Council, and only a third felt that greater engagement with public sector bodies would be of benefit to them. The chart below maps the level of current engagement against networks respondents would benefit from greater engagement with. Chart 36: Current engagement and engagement that would benefit organisations 70% 60% 50% 40% 30% 20% 10% 0% Voluntary and community sector networks Swindon Borough Council Public sector bodies Charitable funders Local businesses Local media Current level of engagement Benefit from more engagement Charitable funders and local businesses score among the lowest for current level of engagement, and the highest for respondents feeling they would benefit from more engagement. Voluntary and community sector networks and local media also scored high for respondents feeling they would benefit from greater engagement, though the level of current engagement with these groups is somewhat higher. Swindon Borough Council and public sector bodies scored lowest for respondents 55
56 reporting they would benefit from greater engagement, while current engagement levels score around the middle. This perhaps reflects the awareness that the Council and other public bodies are less able to fund new work or even existing work at the same level as they could in previous years as the answers to a previous question show, 46% of respondents reported that their income from public sector bodies had decreased over the last year. 9 9 pp

57 4.6 Training & Development Respondents were asked which training courses they felt would be most useful to their organisation. They were asked to rank a number of courses using the ratings very useful, somewhat useful, less useful and not applicable. Table 41: Training courses considered beneficial Training Course Mean Score Fundraising (grant applications) 0.86 Volunteer recruitment 0.82 Marketing, media, advertising, PR 0.79 Demonstrating outputs and outcomes 0.59 Safeguarding vulnerable clients 0.57 Internet and social media 0.54 Reporting and evaluating impact 0.52 Trustee development 0.51 Engaging with the public 0.43 Events management 0.37 Legal structures and liability 0.30 N(=100%) 83 Chart 37: Training courses considered beneficial Respondents were also given the opportunity to suggest other training courses, not listed above, which they would find useful. Answers included Health & Safety, First Aid, Manual Lifting, Data Protection, Food Handling, understanding the Wiltshire demographics, linking with like-minded groups elsewhere in the UK, and adult cycle training. The most beneficial training course was considered by respondents to be fundraising (grant applications). Volunteer recruitment was a close second, followed by marketing, media, advertising 57
58 and PR. Volunteer recruitment actually scored the highest number of very useful ratings. Other courses scored lower. The lowest rated were legal structures and liability, and events management. This could reflect that organisations are confident about their understanding of these topics, so further training would not be useful; or that organisations do not value awareness of these topics. VAS has hosted two courses on legal structures and liability within the last year, so it is possible that organisations feel they are already informed on the subject. On the other hand, VAS has also held courses on grant funding in the same time period, and this is at the top of the list. It is interesting that marketing, media, advertising and PR scores so high, as local media scored high among networks that respondents are already engaged with. It may be the case that organisations do feel relatively well engaged with local media, but see the benefits of even greater engagement, in terms of awareness raising and potential for funding. Organisations participating in the focus group sessions pointed out that marketing and communications work is not easily fundable, so there is often no resource for it. Table 42: Training Courses Considered Beneficial by Organisation Type Training Course Mean Scores All respondents Registered Charities Limited Companies Sports Clubs Fundraising (grant applications) Volunteer recruitment Marketing, media, advertising, PR Demonstrating outputs and outcomes Safeguarding vulnerable clients Internet and social media Reporting and evaluating impact Trustee development Engaging with the public Events management Legal structures and liability N(=100%) 83 Charities see demonstrating outputs and outcomes, and trustee development as significantly more beneficial than respondents overall. Companies consider fundraising (grant applications), volunteer recruitment, and legal structures and liability as significantly less beneficial than respondents overall. Sports clubs consider training in fundraising (grants) as more beneficial than overall results. This may be partly explained by sports clubs reporting a much lower level of increased income than other organisation types, although they also report static income and static expenditure at higher levels than other organisation types. Sports clubs have less diversity of income than other organisation types, though all those who answered the question about income sources reported that they have raised money through grants. That sports clubs also consider training in grant fundraising to be useful may suggest that, while they do manage to get some income through grants, their success rate is not as high as it could be. Sports clubs also consider training in volunteer recruitment as more beneficial than respondents overall. This is despite sports clubs being more likely than other types of organisation to report that 58
59 their reliance on volunteers is unchanged. This possibly suggests that there has a greater need for volunteers among sports clubs for some time, and this need has not been addressed. Outputs and outcomes training is considered much more beneficial by charities, and much less so by sports clubs; the most likely explanation for this is that demonstrating outputs and outcomes is associated with funding from the public sector (i.e. contracts), rather than other sources of funding. 43% of registered charities reported raising income this way, while no sports clubs reported that they do. As such, demonstrating outputs and outcomes is less relevant to sports clubs than charities. Finally, sports clubs consider training in events management more useful than other organisation types. All sports clubs who answered the question on income sources report that they raise income through fundraising events, compared to less than half of overall respondents. One explanation for this is that sports clubs use events more than charities, not only to fundraise but to attract new players to the sport (and members to the club). As such, there is greater relevance in event management training for sports clubs than for charities or companies. Respondents were asked to rank a number of challenges, from most to least challenging for their organisations. Table 43: Challenges Training Course Mean Score Raising income to provide services 1.05 Recruiting new trustees 0.73 Engaging with the wider public/community 0.70 Replacing lost income streams 0.67 Meeting core costs/overheads 0.67 Recruiting new volunteers 0.62 Responding to demand 0.60 Maintaining property 0.36 Time-consuming reporting and monitoring requirements 0.26 Finding suitable and affordable premises 0.13 Liability and legal risks N(=100%) 83 59

60 Chart 38: Challenges By far, the greatest challenge identified by respondents of the survey is the need to raise income to provide services. This is followed by several responses which ranked in a similar position, though considerably lower than raising income: the need to recruit new trustees, to engage with the wider public, to replace lost income, to meet core costs, to recruit new volunteers, and to respond to demand. Smaller proportions found maintaining property, reporting and monitoring requirements, and finding suitable premises to be challenges. Liability and legal risks actually scored in the negatives, indicating that organisations do not see it as a challenge. These results are consistent with the previous question; raising income is seen as a major challenge, hence fundraising is identified as a beneficial area of training. Respondents also reported that engagement with charitable funders and local businesses, two key sources of charitable income, was low, while greater engagement with both would be highly beneficial. Liability and legal risks is not considered a challenge, hence it is considered least useful as an area of training. 60
61 Table 44: Challenges by Organisation Type Training Course Mean Scores All respondents Registered Charities Limited Companies Sports Clubs Raising income to provide services Recruiting new trustees Engaging with the wider public/community Replacing lost income streams Meeting core costs/overheads Recruiting new volunteers Responding to demand Maintaining property Time-consuming reporting and monitoring requirements Finding suitable and affordable premises Liability and legal risks N(=100%) 83 Respondents were given the opportunity to identify other challenges their organisations are facing. These included raising funds to extend activities, difficulties getting people involved in activities, finding funders who are sympathetic to the cause and not only seeking new projects and ideas, a lack of recognition and networking within the community sector and with the Council, meeting the additional support needs of clients, and recruiting suitable staff. Respondents were next asked what success, or greater success, would look like for them. 50 responses to this question were received, though some respondents gave more than one answer. 9 responses referred to the need to get more people engaged, or more opportunities to get more people engaged. 8 responses referred to the need to secure more income, either to increase staff hours and activities or to retain core services. 7 respondents stated that success would involve having more volunteers, and 6 reported that success would involve new or expanded services to meet needs. Respondents were next asked what they would need in order to achieve this success. 50 responses to this question were received, though some respondents gave more than one answer. 19 respondents stated that they would simply need more money. 12 respondents stated they would need more volunteers. 8 stated that they would need increased publicity, awareness or knowledge of their work. 61
62 5. Appendices 5.1 List of Organisations That Responded to the Survey Bishopstone Village Hall British Red Cross Citizens Advice Swindon Community Christ Church Community First Companions of the Longbow Croft Juniors Cruse Bereavement Care DASH DHI Disability Experts C.I.C. Dorcan Church East Wichel Community Association Eastcott Community Organisation Evo FAB (wild Flowers And Butterflies) Ferndale Table Tennis Club Fostering and Adoption Team - SBC Global Group of Unity Haydon Wick Over 60's Club Headway Swindon Healthwatch Swindon Highworth Community Centre Highworth Community Partnership Group Highworth Phoenix Diving Club Horseshoe Amateur Boxing Club Inner Flame Koalas Swindon Opportunity Group Liden Angling Club Littleredrooster Singing Tuition Lydiard Millicent Juniors FC Macmillan Cancer Support Moredon and Rodbourne Cheney Community Association Museum of Computing Music Alive Nationwide Building Society New College Swindon Parkinsons Parkinson's UK - Swindon & District Branch Penhill Forum Pinehurst Gospel Hall Pinehurst Initiative Forum Pluss Organisation Swindon Propsect Hospice Protocol Training Purton Silver Threads Raychem Netball Club 62
63 Rotary Royal National Institute for the Blind SAPAC of Swindon SMIBC Sobs St Michael and All Angels Highworth Supermarine Sports Club Supporting Wellbeing and Developing Stability SWADS Swindon & District Branch Parkinson UK Swindon & District Samaritans Swindon & District Talking Newspaper Association Swindon 10 to 18 Project (STEP) SWINDON Swindon Academy Swindon Advocacy Movement Swindon Bowls Club Swindon Carers Centre Swindon Children's Scrapstore Swindon Civic Voice Swindon Community Centres Network Swindon Dial A Ride Swindon Dog Dancing School Swindon Equality Coalition Swindon Equality Group Swindon Foodbank Swindon Go-Ride Swindon Harriers Swindon Hockey club Swindon IA Swindon Manor Indoor Bowls Club Swindon North Scout District Swindon Osteoporosis Support Group Swindon Shock Wheelchair Basketball Swindon Spitfires Swindon Sports Forum Swindon Tamil Association Swindon Therapy Centre for MS Swindon Walcot and Parks Community Group Swindon Wheelers Swindon Women's Aid Thamesdown Islamic Association The Blagrave Trust The Dorcan Church The Harbour Project The Olive Tree Cafe The Open Door (Swindon & District) Ltd The Salvation Army The Swindon Mela Ltd Threshold TWIGS 63
64 Victim Support Voluntary Action Swindon Volunteer Centre Swindon Walcot Community Shop Wanborough Bowls Club Westleaze and Wroughton Angling Clubs and Swindon Fisheries Forum Willows Counselling Service wiltshire and swindon sport Wiltshire Community Foundation Wiltshire Law Centre Wiltshire Treehouse Charity Wiltshire Wildlife Trust Witness Service Total: 111 N.B. Several of the groups who completed the survey are not present in this list as they were nonspecific in the name of their organisation, e.g. netball, education. Their answers to the survey are reflected in all analysis, but they are not present in the above list. 64

65 5.2 The Voluntary Sector Survey
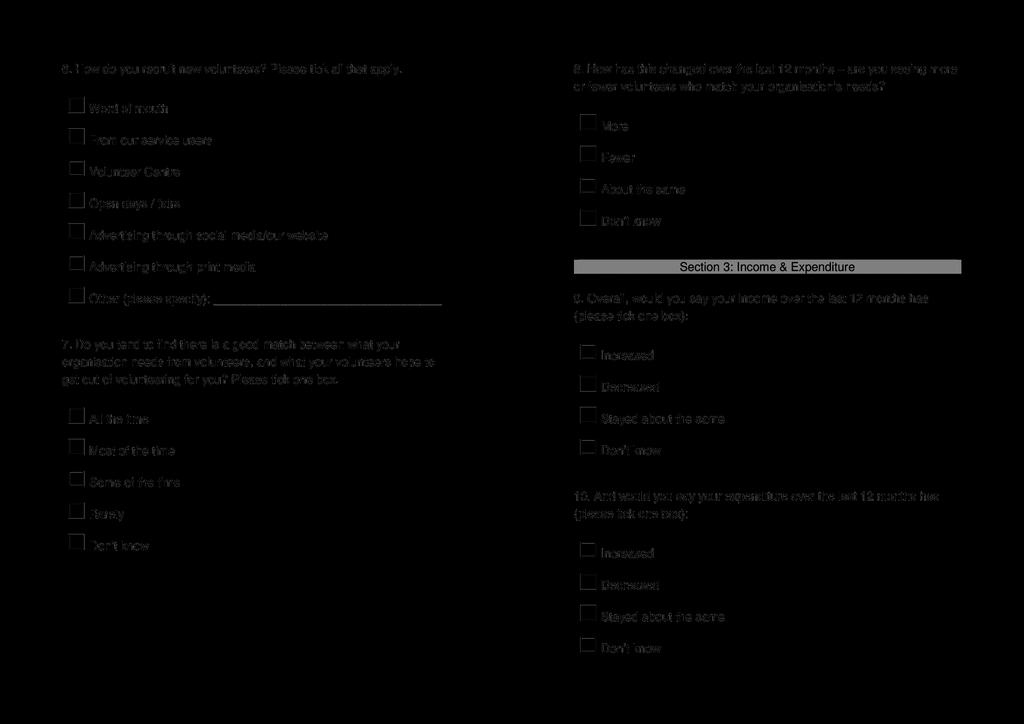
66 66
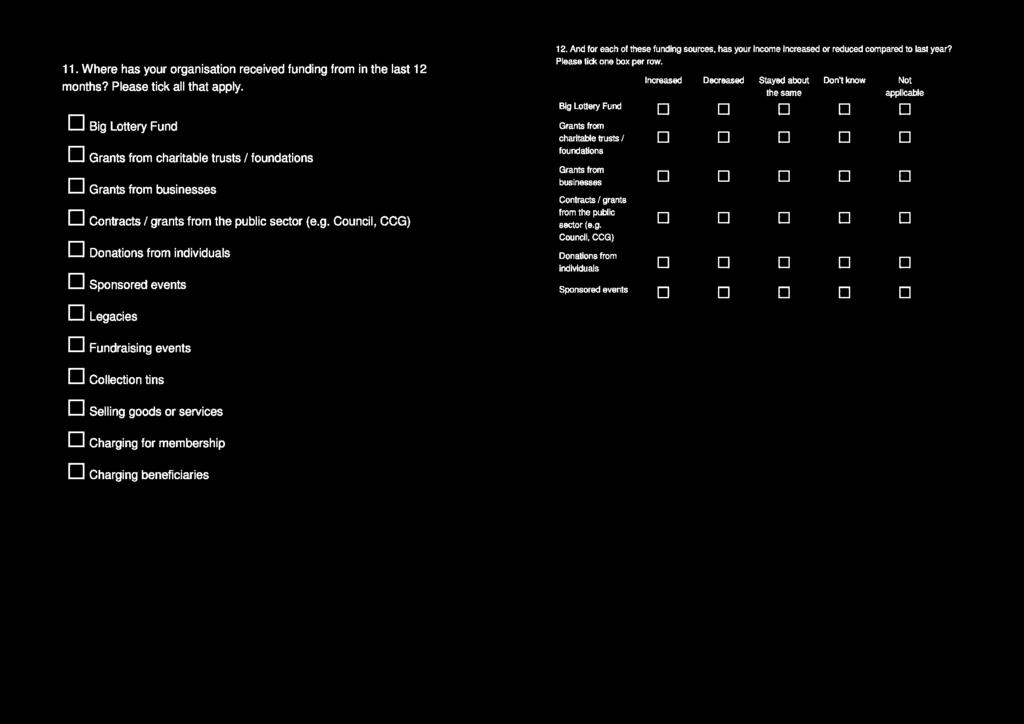
67 67
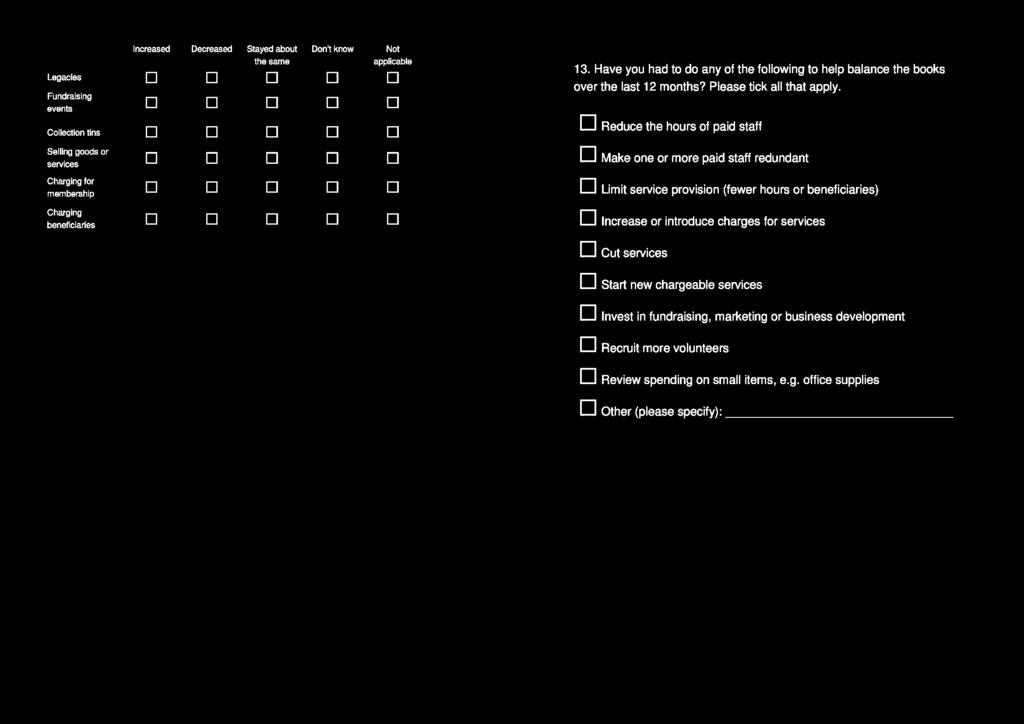
68 68

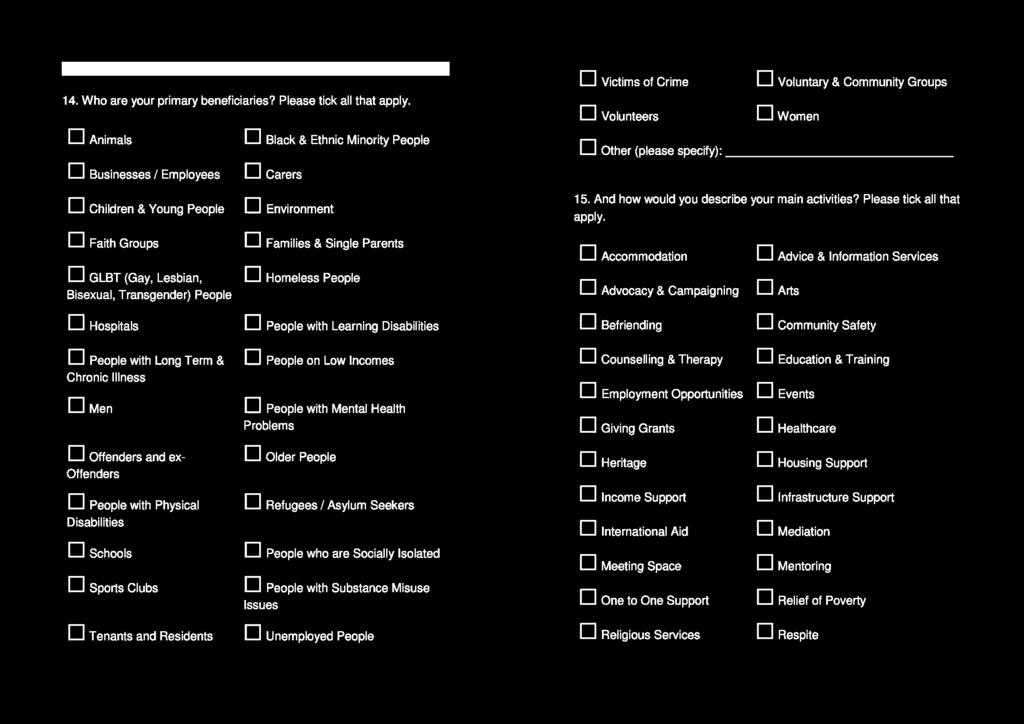
69 69
70 70
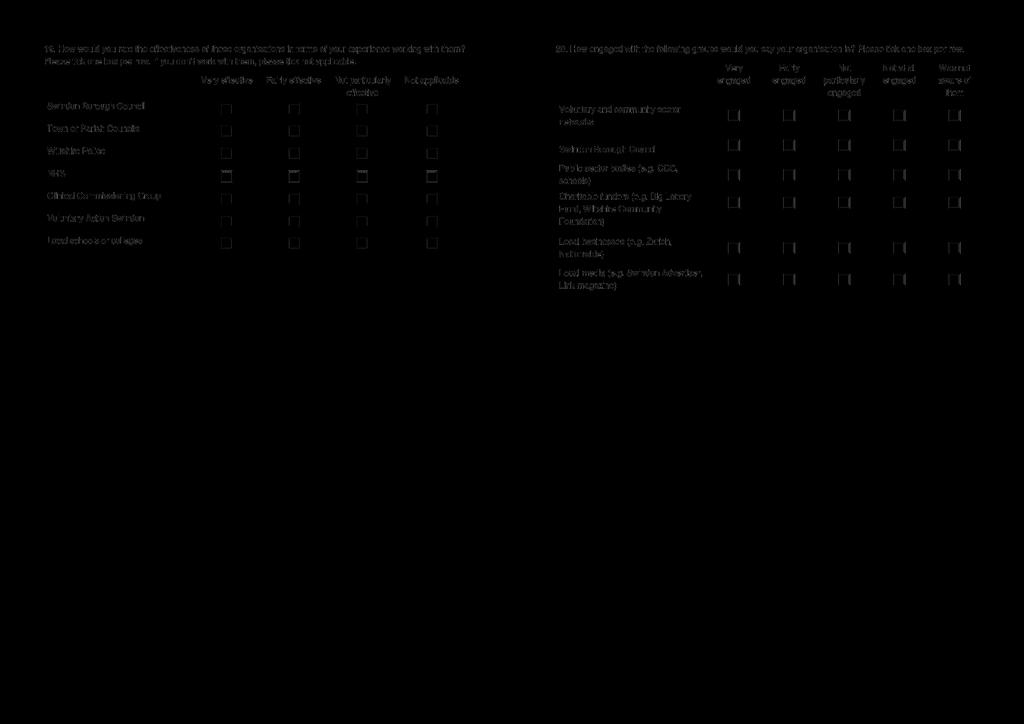
71 71
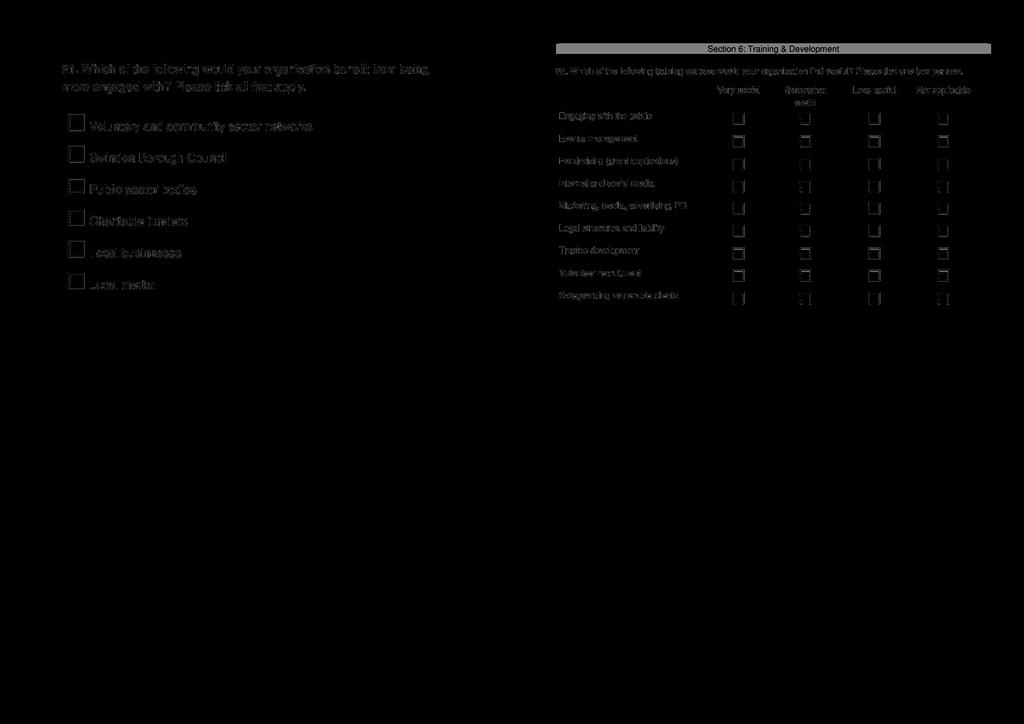
72 72
73 73
74 74

75 75
Digest of key findings from the Third Sector Trends study in East Yorkshire and the City of Kingston upon Hull
 Digest of key findings from the Third Sector Trends study in East Yorkshire and the City of Kingston upon Hull Tony Chapman St Chad s College Durham University November 2017 Third Sector Trends Study The
Digest of key findings from the Third Sector Trends study in Bradford 2016
 Digest of key findings from the Third Sector Trends study in Bradford 2016 Tony Chapman St Chad s College Durham University July 2016 1 Front and back cover photos: Victoria Bell Third Sector Trends Study
A Snap Shot of the LGBT Sector. #LGBTResilience
 A Snap Shot of the LGBT Sector #LGBTResilience August 2016 Foreword Paul Roberts, Chief Executive Officer at LGBT Consortium LGBT Consortium is passionate about working with its Membership to explore how
Building capabilities in the voluntary sector: A review of the market. By Chris Dayson and Elizabeth Sanderson
 Working Paper 127 September 2014 Third Sector Research Centre Working Paper 127 Building capabilities in the voluntary sector: A review of the market By Chris Dayson and Elizabeth Sanderson September 2014
The Nonprofit and Voluntary Sector in Manitoba, Saskatchewan and the Territories
 The Nonprofit and Voluntary Sector in Manitoba, Saskatchewan and the Regional Highlights of the National Survey of Nonprofit and Voluntary Organizations Author: Sid Frankel Imagine Canada, 2006 Copyright
Fannie Mae National Housing Survey. July - September 2010 Quarterly Wave
 Fannie Mae National Housing Survey July - ember 2010 Quarterly Wave Copyright 2010 by Fannie Mae Release Date: November 23, 2010 Consumer attitudes: measure current and track change Attitudinal Questions
Contents TWELFTH ANNUAL REPORT CARD ON CHARITABLE GIVING FOR METRO MILWAUKEE
 TWELFTH ANNUAL REPORT CARD ON CHARITABLE GIVING FOR METRO MILWAUKEE November 2008 PUBLISHED BY GREATER MILWAUKEE FOUNDATION SPONSORS Donors Forum of Wisconsin The Faye McBeath Foundation United Way of
Budget consultation: a survey of public sector organisations.
 Budget consultation: a survey of public sector organisations. 1 of 18 Budget consultation: a survey of public sector organisations. Budget consultation: a survey of public sector organisations. 2 of 18
Business Plan
 Peterborough Our mission is to promote the well-being of all older people and to help make later life a fulfilling and enjoyable experience Business Plan 2010-2013 Contents Page Subject Page Number Purpose
Wealth with Responsibility Study/2000
 Wealth with Responsibility Study/2000 Introduction The 2000 Study on Wealth with Responsibility (WWR) was conducted solely for Deutsche Bank Private Banking by researchers at the Boston College Social
Scope. Summary financial statements 2013 / 14
 Scope Summary financial statements 2013 / 14 1 Contents Our vision, purpose and beliefs 3 Changing society in 2013 / 14 4 Financial performance 7 Where our money came from 8 and how we spent it Trustees
IV. EXPECTATIONS FOR THE FUTURE
 IV. EXPECTATIONS FOR THE FUTURE Young adults in Massachusetts widely view their future in positive terms. Those who are doing well financially now generally see that continuing. Those doing less well express
GLOBAL ENTERPRISE SURVEY REPORT 2009 PROVIDING A UNIQUE PICTURE OF THE OPPORTUNITIES AND CHALLENGES FACING BUSINESSES ACROSS THE GLOBE
 GLOBAL ENTERPRISE SURVEY REPORT 2009 PROVIDING A UNIQUE PICTURE OF THE OPPORTUNITIES AND CHALLENGES FACING BUSINESSES ACROSS THE GLOBE WELCOME TO THE 2009 GLOBAL ENTERPRISE SURVEY REPORT The ICAEW annual
Individual giving survey 2008
 Individual giving survey 2008 BRIEFING FOR NON-PROFIT ORGANISATIONS 18 September 2008 All figures, including percentages, are estimates. Percentages may not add up to 100% due to rounding or multiple answers
2018 Report. July 2018
 2018 Report July 2018 Foreword This year the FCA and FCA Practitioner Panel have, for the second time, carried out a joint survey of regulated firms to monitor the industry s perception of the FCA and
Summary. Recommendations
 Gift Aid Small Donations Scheme Consultation Response July 2016 Charity Finance Group, Institute of Fundraising, National Council for Voluntary Organisations and Small Charities Coalition Summary The scheme
HUMAN RESOURCES INSTITUTE OF ALBERTA
 Purpose of this Report This report is designed to be a regular tool for HR professionals in Alberta. Over the next decade Alberta companies will deal with a significant labour shortage. According to the
SCVO Scottish Third Sector Statistics 2012
 SCVO Scottish Third Sector Statistics 2012 The Scottish third sector touches the lives of people and communities across the country. It encompasses an estimated 45,000 voluntary organisations, of which
GASDS: a change in the rules for donations received after 6 April 2017
 Stewardship Briefing Note 2017/1 GASDS: a change in the rules for donations received after 6 April 2017 March 2017 Stewardship, 1 Lamb s Passage, London EC1Y 8AB t: 020 8502 5600 e: enquiries@stewardship.org.uk
2016 State of the Sector Survey SNAPSHOT
 2016 State of the Sector Survey SNAPSHOT The second Snapshot Survey conducted by ComVoices shows that the stresses on our community organisations are increasing. A survey of over 280 community organisations
The Impact of the September 11 th Events on Ontario s Attractions --Month of September-- Final Report
 The Impact of the September 11 th Events on Ontario s Attractions --Month of September-- Final Report Ontario Ministry of Tourism, Culture and Recreation October 23, 2001 TABLE OF CONTENTS Introduction
Third Sector Trends in North East England 2016 Digest of findings from the Third Sector Trends Study in North East England 2016
 Digest of findings from the Third Sector Trends Study in North East 2016 Tony Chapman St Chad s College Durham University 1 Front cover photograph: B Activ and B Fit, Sunderland, Gilbert Johnston Photography
Impact of the recession on the voluntary and community sector
 Impact of the recession on the voluntary and community sector Key Findings Just over half of respondents (50.8%) stated that the recession has yet to have an impact on their funding streams. Nearly three
Credit Card Market Study Interim Report: Annex 3: Results from the consumer survey
 MS14/6.2: Annex 3 Market Study Interim Report: Annex 3: November 2015 November 2015 0 Contents 1 Introduction 2 Definitions 2 Background to the 3 The structure of this document 4 2 Consumer understanding
December 2018 Financial security and the influence of economic resources.
 December 2018 Financial security and the influence of economic resources. Financial Resilience in Australia 2018 Understanding Financial Resilience 2 Contents Executive Summary Introduction Background
UNCORRECTED SAMPLE PAGES
 468 Chapter 18 Evaluating performance:profitability Where are we headed? After completing this chapter, you should be able to: define profitability, and distinguish between profit and profitability analyse
Hard to Swallow The Facts about Food Poverty
 Hard to Swallow The Facts about Food Poverty Key Findings This report, conducted on behalf of Kellogg s by the Centre for Economics and Business Research (CEBR) 1 attempts to measure food poverty, and
The 2004 Canada Survey of Giving, Volunteering, and Participating: NEWFOUNDLAND AND LABRADOR
 The 2004 Canada Survey of Giving, Volunteering, and Participating: NEWFOUNDLAND AND LABRADOR DONATING: Donations Types of organizations supported Donor characteristics: - Age - Education level Donation
Report on the Findings of the Information Commissioner s Office Annual Track Individuals. Final Report
 Report on the Findings of the Information Commissioner s Office Annual Track 2009 Individuals Final Report December 2009 Contents Page Foreword...3 1.0. Introduction...4 2.0 Research Aims and Objectives...4
Which? Mid Year Review From 1 July to 31 December 2015
 Which? Mid Year Review From 1 July to 31 December 2015 Section one Introduction from the Chair Tim Gardam Chair This mid year review, designed to update our annual report, describes recent developments
Financial Report: Year ended 31 March 2017
 Introduction Financial Report: Year ended 31 March 2017 This report sets out the Centre s financial performance for the year which ended on 31 st March 2017. The summary accounts are shown in the second
SME Future Attitudes. Insight Report Q aldermore.co.uk
 SME Future Attitudes Insight Report aldermore.co.uk Foreword For British businesses, planning for the future in early 2017 is an unenviable task. The uncertainty created by last year s vote to leave the
Imagine Canada s Sector Monitor
 Imagine Canada s Sector Monitor David Lasby, MPhil, Senior Research Associate Cathy Barr, PhD, Vice-president, Operations and Director of Research Vol. 1, No. 1 IN this Report Foreword...1 Acknowledgements...2
NPO FUNDING & SERVICE CUTS
 NPO FUNDING & SERVICE CUTS Findings from the 2013 survey GREATERCAPITAL GREATERGOOD SA BACKROUND The Non Profit Job Losses and Service Cuts Survey in 2012 found that 80% of non profits had experienced
STATE OF THE PROTECTION NATION. March 2017
 STATE OF THE March 2017 INTRODUCTION Royal London commissioned this research to find out how people felt about their own protection needs and the industry as a whole. And to answer questions such as: does
Flash Eurobarometer 386 THE EURO AREA REPORT
 Eurobarometer THE EURO AREA REPORT Fieldwork: October 2013 Publication: November 2013 This survey has been requested by the European Commission, Directorate-General for Economic and Financial Affairs and
2018 Budget Planning Survey General Population Survey Results
 2018 Budget Planning Survey General Population Survey Results Results weighted to ensure statistical validity to the Leduc Population Conducted by: Advanis Inc. Suite 1600, Sun Life Place 10123 99 Street
This is a draft sample document which may be subject to change in line with funders requirements
 WOLVERHAMPTON VOLUNTARY SECTOR COUNCIL - and - NAME OF PARTNER ***** NOTE This is a draft sample document which may be subject to change in line with funders requirements 1 REFERENCE ***** This Service
Job security in the EU: how confident are Europeans about keeping their jobs in these difficult economic times?
 Think... Precise insights for European growth Job security in the EU: how confident are Europeans about keeping their jobs in these difficult economic times? Unemployment is the biggest concern of Europeans
Sustainability in Education 2017
 Sustainability in Education 2017 Survey research by the Environmental Association for Universities and Colleges, National Union of Students, University and College Union, Association of Colleges and the
Read, Milburn & Co 71 Howard Street North Shields Tyne and Wear NE30 1AF
 REGISTERED COMPANY NUMBER: 05834708 (England and Wales) REGISTERED CHARITY NUMBER: SC040713 REPORT OF THE TRUSTEES AND UNAUDITED FINANCIAL STATEMENTS FOR SHOW RACISM THE RED CARD Read, Milburn & Co 71
Legal Services in BC. Final Report. Nobody s Unpredictable. September 2009
 Legal Services in BC Final Report September 2009 Nobody s Unpredictable Table of Contents EXECUTIVE SUMMARY 3 BACKGROUND, OBJECTVES AND METHODOLOGY 10 Background 11 Objectives 12 Research Methodology 13
Introduction 1 Key Findings 1 The Survey Retirement landscape 2
 Contents Introduction 1 Key Findings 1 The Survey 1 1. Retirement landscape 2 2. Aspirations and expectations for a changing retirement 2 The UK is ranked in the middle of the AEGON Retirement Readiness
Giving, Volunteering & Participating
 2007 CANADA SURVEY OF Giving, Volunteering & Participating Lindsey Vodarek David Lasby Brynn Clarke Giving and Volunteering in Québec Findings from the Canada Survey of Giving, Volunteering, and Participating
Taking the Pulse of the Small Charity Sector. December 2015 to February 2016 March to May th Edition
 Taking the Pulse of the Small Charity Sector December 2015 to February 2016 March to May 2016 12th Edition Background of Respondents Geographical spread East 7% London 3 Scotland Midlands(E&W) 8% North(NE
What does it mean to you?
 What does it mean to you? The Life Evaluation Index combines the evaluation of one s present life situation with one s anticipated life situation five years from now. The Emotional Health Index is primarily
About this report Executive summary The Retail Team Salaries Top Level Manager salary... 5
 Salaries 06 Contents About this report... Executive summary... 3 The Retail Team... 4 Salaries... 5 Top Level salary... 5 Performance related bonuses for Top Level s... 5 Salary tables... 6 Impact of the
General public survey after the introduction of the euro in Slovenia. Analytical Report
 1 Flash EB N o 20 Euro Introduction in Slovenia, Citizen Survey Flash Eurobarometer European Commission General public survey after the introduction of the euro in Slovenia Analytical Report Fieldwork:
University Fund. Why I Give
 University Fund MAKE A TANGIBLE IMPACT ON OUR STUDENTS. Funding from the commonwealth addresses less than 35% of the real cost associated with educating a student today, and tuition and fees alone do not
Claiming top-up payment on Gift Aid Small Donations Scheme (GASDS) donations
 donations") Claiming top-up payment on Gift Aid Small Donations Scheme (GASDS) donations GASDS Claims Deadlines: Donations received in Claims can be made from Deadline to send the claim to HMRC by The Bureau Service
Claiming top-up payment on Gift Aid Small Donations Scheme (GASDS) donations GASDS Claims Deadlines: Donations received in Claims can be made from Deadline to send the claim to HMRC by The Bureau Service
acie Independent Examination OSCR Guidance for Charities and Independent Examiners
 Independent Examination OSCR Guidance for Charities and Independent Examiners www.oscr.org.uk OSCR would like to acknowledge the significant contribution made by ACIE in the preparation of this guidance
Young People and Money Report
 Young People and Money Report 2018 marks the Year of Young People, a Scottish Government initiative giving young people a platform to voice issues that affect their lives and allowing us to celebrate their
MYTHS. The Truth about Poverty in Abbotsford
 The Truth about Poverty in Abbotsford MYTHS Abbotsford has experienced tremendous growth in recent years. The population expanded by 7.2% between 2001 and 2006, higher than the provincial average. During
Commissioned by: A National Survey
 Commissioned by: Conducted by: Precision Research Services A National Survey Random (non biased) sample N = 1500 respondents The make up of sample closely resembles the population Multi-stage, stratified
Annex B: Payment and Expenses for Governors
 Annex B: Payment and Expenses for Governors Introduction 1. This document has been produced by the Department for Business, Innovation and Skills (BIS) with advice from the Charity Commission to guide
Saving for children:
 Saving for children: A baseline survey at the inception of the Child Trust Fund Executive Summary Elaine Kempson, Adele Atkinson and Sharon Collard Personal Finance Research Centre University of Bristol
The U.S. Trust Study of the Philanthropic Conversation
 The U.S. Trust Study of the Philanthropic Conversation Understanding advisor approaches and client expectations Executive Summary Conducted in partnership with The Philanthropic Initiative Overview The
Conflicts of interest: a guide for charity trustees
 GUIDANCE Conflicts of interest: a guide for charity trustees MAY 2014 New format February 2017 Contents 1. About this guidance 2 2. Conflicts of interest: at a glance summary 5 3. Identifying conflicts
A Simple Guide to Tax Reliefs for Charities and Social Enterprises:
 A Simple Guide to Tax Reliefs for Charities and Social Enterprises: An overview of tax reliefs for investing into charities and social enterprises July 2018 30 June 2018 Table of Contents A Simple Guide
TO SOCIAL PROTECTION FOR PEOPLE IN ALL FORMS OF EMPLOYMENT IN THE FRAMEWORK OF THE EUROPEAN PILLAR OF SOCIAL RIGHTS
 RESPONSE FIRST PHASE CONSULTATION OF SOCIAL PARTNERS UNDER ARTICLE 154 TFEU ON A POSSIBLE ACTION ADDRESSING THE CHALLENGES OF ACCESS TO SOCIAL PROTECTION FOR PEOPLE IN ALL FORMS OF EMPLOYMENT IN THE FRAMEWORK
Topic 2 Types of Organisations. Higher Business Management
 Topic 2 Types of Organisations Higher Business Management 1 Learning Intentions / Success Criteria Learning Intentions Types of organisations Success Criteria Learners should be aware of the structure
February 2009 BANK FINANCE REPORT. A special report from The Institute of Chartered Accountants in England and Wales
 February 9 BANK FINANCE REPORT A special report from The Institute of Chartered Accountants in England and Wales CONTENTS INTRODUCTION 1 EXECUTIVE SUMMARY 2 FINDINGS I. OVERDRAFTS II. TERM LOANS 6 III.
This complete report including detailed tables and methodology can be found at
 Briefing Note To: House of Commons Standing Committee on Health Author: Shachi Kurl, Executive Director Angus Reid Institute Subject: Canadian Public Opinion Regarding a National Pharmacare Program Summary
Findings from the 2004 Canada Survey of Giving, Volunteering, and Participating
 = = = obpb^o`e bpb^o`e= Giving, Volunteering, and Participating in British Columbia Findings from the 2004 Canada Survey of Giving, Volunteering, and Participating Julie Sperling David Lasby Michael H.
Reserves policies. made simple
 Reserves policies made simple July 2015 1 Sayer Vincent LLP Chartered accountants and statutory auditors Invicta House 108 114 Golden Lane London EC1Y 0TL Offices in London, Bristol and Birmingham 020
SC The Rangers Charity Foundation
 SC033287 The Rangers Charity Foundation Report under section 33 of The Charities and Trustee Investment (Scotland) Act 2005 SC033287 The Rangers Charity Foundation _01 1. Executive summary OSCR has concluded
PERCEPTIONS OF THE VALUE OF FINANCIAL PLANNING ADVICE. Report 2: Phases Two and Three - Perception of Value and Service Style - July 2016
 FUNDING OUR FUTURE: PERCEPTIONS OF THE VALUE OF FINANCIAL PLANNING ADVICE Report 2: Phases Two and Three - Perception of Value and Service Style - July 1 This research was supported under Australian Research
Asset Management Market Study Interim Report: Annex 5 Institutional Demand Side
 MS15/2.2: Annex 5 Market Study Interim Report: Annex 5 November 2016 Annex 5: Institutional demand side In order for competition to work effectively in the institutional asset management sector, institutional
Global Survey of Business Executives
 Global Survey of Business Executives January 2006 Economic confidence is up, but executives say they face a host of worries about society s expectations of their companies, which must and can do better.
Britain s Brexit hopes, fears and expectations
 Britain s Brexit hopes, fears and expectations by John Curtice, Muslihah Albakri, Allison Dunatchik and Neil Smith This report looks at the results of questions on attitudes to Brexit that were included
Measuring Client Outcomes. An overview of StepChange Debt Charity s client outcomes measurement pilot project
 Measuring Client Outcomes An overview of StepChange Debt Charity s client outcomes measurement pilot project February 2019 2 Measuring Client Outcomes February 2019 Introduction Since 2017, StepChange
EBRI EMPLOYEE BENEFIT RESEARCH INSTITUTE
 T-107 EBRI EMPLOYEE BENEFIT RESEARCH INSTITUTE Testimony of Dallas L. Salisbury President, Employee Benefit Research Institute (EBRI) Chairman, American Savings Education Council (ASEC) Before The House
PENSIONS WITH PURPOSE. An opportunity to drive deeper engagement with DC savers
 PENSIONS WITH PURPOSE An opportunity to drive deeper engagement with DC savers CONTENTS FOREWORD PAGE PAGE Simon Rowell, Senior Director, Big Society Capital. Fortunately, the UK has a sophisticated social
Poverty and Employment Precarity in Southern Ontario (PEPSO)
") Poverty and Employment Precarity in Southern Ontario (PEPSO) *note: participants can refuse to answer any or all questions in this survey* Screening Questions 1. Have you worked for pay or profit at any
Poverty and Employment Precarity in Southern Ontario (PEPSO) *note: participants can refuse to answer any or all questions in this survey* Screening Questions 1. Have you worked for pay or profit at any
Business Optimism Survey Report Summer 2017
 Center for Economic and Business Research Business Optimism Survey Report Summer 2017 July 24, 2017 Student Author(s) Elena Rodriguez In Collaboration With Contents Executive Summary..3 Clarifying Notes
B30A. KiwiSaver Annual Report
 B30A KiwiSaver Annual Report 2018 Purpose of this report The main objective of the Financial Markets Authority (FMA) is to promote and facilitate the development of fair, efficient and transparent financial
Issue Brief. Small Employers and Health Benefits: Findings from the 2000 Small Employer Health Benefits Survey
 October 2000 Jan. Small Employers and Health : Findings from the 2000 Small Employer Health Survey by Paul Fronstin, EBRI, and Ruth Helman, MGA Feb. Mar. Apr. May Jun. Jul. Aug. EBRI EMPLOYEE BENEFIT RESEARCH
Overcoming BARRIERS TO GIVING. Report summary. Key findings
 Overcoming BARRIERS TO GIVING Report summary Two-thirds of American donors say they want to give more to charity. So what holds them back and are there ways to overcome the barriers they may face? This
HOW YOUNG NEW ZEALANDERS PERCEIVE POLITICAL & FINANCIAL WELLBEING: A LONGITUDINAL STUDY ELECTION YEAR UPDATE
 HOW YOUNG NEW ZEALANDERS PERCEIVE POLITICAL & FINANCIAL WELLBEING: A LONGITUDINAL STUDY ELECTION YEAR UPDATE FIN ED.MASSEY.AC.NZ ABOUT THE FIN-ED CENTRE Westpac New Zealand and Massey University founded
Saving and Investing Among High Income African-American and White Americans
 The Ariel Mutual Funds/Charles Schwab & Co., Inc. Black Investor Survey: Saving and Investing Among High Income African-American and Americans June 2002 1 Prepared for Ariel Mutual Funds and Charles Schwab
Combatting ageism to improve access to employment. Jemma Mouland February 2019
 Combatting ageism to improve access to employment Jemma Mouland February 2019 Centre for Ageing Better We work for a society where everybody enjoys a good later life An independent charitable foundation
Guidelines for organisers
 Section 1 Guidelines for organisers 1.1 What are Good Neighbour Schemes? 1.2 Start-up costs 1.3 Sources of Funding 1.4 finance Guidelines 1.5 Setting up a bank account 1.6 disclosure and Barring Service
ESRC application and success rate data
 ESRC application and success rate data This analysis accompanies the most recent release of ESRC success rate data: https://esrc.ukri.org/about-us/performance-information/application-and-award-data/ in
Financial Situation of Families with Dependent Children in the Czech Republic, Spring 2017
 Financial Situation of Families with Dependent Children in the Czech Republic, Spring 2017 The financial situation of families is defined by key indicators such as parent/guardian s age, number of dependent
Annual Funding Survey Findings. Arts Council of Northern Ireland
 2017-18 Annual Funding Survey Findings Arts Council of Northern Ireland Strategic Development February 2019 Contents 1 About the survey... 3 1.1 Data verification... 3 1.2 Comparisons with previous years
Meeting the retirement challenge New approaches and solutions for the financial services industry
 Meeting the retirement challenge New approaches and solutions for the financial services industry Sam Friedman Research Leader, Insurance Deloitte Center for Financial Services Val Srinivas Research Leader,
Consultation Response
 Consultation Response FCA cash savings market study report (Jan 2015) 13 February 2015 Ref 0415 All rights reserved. Third parties may only reproduce this paper or parts of it for academic, educational
EMPLOYEE OUTLOOK. Winter EMPLOYEE VIEWS ON WORKING LIFE FOCUS. Employee attitudes to pay and pensions
 EMPLOYEE OUTLOOK EMPLOYEE VIEWS ON WORKING LIFE Winter 2016 17 FOCUS Employee attitudes to pay and pensions The CIPD is the professional body for HR and people development. The not-for-profit organisation
Canadian Mutual Fund Investors Perceptions of Mutual Funds and the Mutual Funds Industry. Report 2017
 Canadian Mutual Fund Investors Perceptions of Mutual Funds and the Mutual Funds Industry Report Table of Contents Research Objectives and Methodology 3 Key Findings 7 Results in Detail 14 Slide Attitudes
ONLINE FUNDHOLDER ENGAGEMENT SURVEY
 ONLINE FUNDHOLDER ENGAGEMENT SURVEY The Oakville Community Foundation May 2016 Sponsor in partnership with & Contents 04 Background, Objectives & Methodology 6 Summary of Findings 9 Satisfaction with the
Results of the PwC Charities Survey 2012
 www.pwc.com/im Results of the PwC Charities Survey 2012 Gordon Wilson 1 Survey respondent profile Approximately 40 respondents, wide range of charitable objects Majority (78%) operating in the Isle of
State of the Sector V. Expenditure
 State of the Sector V Expenditure 7. Expenditure This chapter looks at the voluntary and community sector s total expenditure. The data is for the financial year 2006/07, the latest available. The data
Impact Assessment (IA)
") Title: Abolition of Assessed Income Periods for Pension Credit IA No: Lead department or agency: Department for Work and Pensions Other departments or agencies: Impact Assessment (IA) Date: October 2013
Title: Abolition of Assessed Income Periods for Pension Credit IA No: Lead department or agency: Department for Work and Pensions Other departments or agencies: Impact Assessment (IA) Date: October 2013
D&B (UK) Pension Plan DEFINED CONTRIBUTION (DC) SECTION
 Pension Plan DEFINED CONTRIBUTION (DC) SECTION") D&B (UK) Pension Plan DEFINED CONTRIBUTION (DC) SECTION Contents 1 Welcome to the D&B (UK) Pension Plan Defined Contribution (DC) section The DC section of the D&B (UK) Pension Plan (the Plan ) provides
D&B (UK) Pension Plan DEFINED CONTRIBUTION (DC) SECTION Contents 1 Welcome to the D&B (UK) Pension Plan Defined Contribution (DC) section The DC section of the D&B (UK) Pension Plan (the Plan ) provides
CEPR CENTER FOR ECONOMIC AND POLICY RESEARCH
 CEPR CENTER FOR ECONOMIC AND POLICY RESEARCH The Wealth of Households: An Analysis of the 2016 Survey of Consumer Finance By David Rosnick and Dean Baker* November 2017 Center for Economic and Policy Research
For professional adviser use only.
 For professional adviser use only. 30 In spring 2018 we interviewed 2,000 homeowners aged over 55, to ask them about their goals and aspirations for the future. We wanted to find out what excited them
FACTSHEET. Reserves Policies for Charities July What are charity reserves? Why have a Reserves Policy?
 Reserves Policies for Charities July 2018 What are charity reserves? For the purposes of this document reserves can be understood as income which is available to the charity and which can be spent at the
Sector Monitor David Lasby, MPhil, Director, Research Cathy Barr, PhD, Senior Vice-president
 Sector Monitor David Lasby, MPhil, Director, Research Cathy Barr, PhD, Senior Vice-president Vol. 4, No. 1 IN THIS REPORT Foreword... 1 Acknowledgements... 2 Introduction... 3 Impact of current economic
T. Rowe Price 2015 FAMILY FINANCIAL TRADE-OFFS SURVEY
 T. Rowe Price 2015 FAMILY FINANCIAL TRADE-OFFS SURVEY Contents Perceptions About Saving for Retirement & College Education Respondent College Experience Family Financial Profile Saving for College Paying
REPORT SERIES 2014 NATASHA CORTIS MEGAN BLAXLAND
 REPORT SERIES 2014 NATASHA CORTIS MEGAN BLAXLAND The state of the community service sector in New South Wales 2014 FINAL REPORT REPORT 4/2014 May 2014 For further information Dr Natasha Cortis +61 2 9385