Financial R eport. Comprehensive Annual Financial Report for the year ended September 30, 2014
|
|
|
- Vivien Davis
- 5 years ago
- Views:
Transcription


1 Financial R eport 2014 Comprehensive Annual Financial Report for the year ended September 30, 2014


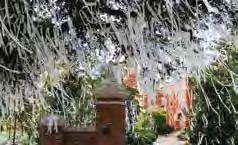
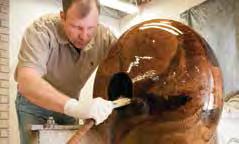
2 REDEEMING THE AUBURN OAKS By Charlotte Hendrix Visitors may view this as a tribute, not only to the trees that were lost, but also to the way that the Auburn Family was able to find a way to reaffirm our belief in humanity. Marilyn Laufer, Director Jule Collins Smith Museum of Fine Art Fall Saturdays on the Auburn Plains mean tailgating, Tiger Walks, and fans honoring lasting traditions. Visitors will experience one campus tradition in a whole new way this fall. A sculptured bowl created from one of the Auburn Oaks is on display at the Jule Collins Smith Museum of Fine Art at Auburn University throughout the season. Third-generation master woodturner Matt Moulthrop of Atlanta followed the national news coverage about the Auburn Oaks and offered to create a work of art for the museum. Before the trees were removed, he identified a section from the College Street tree as the one he wanted to work with and took delivery after the final roll in April One of the things I intentionally did was to leave bark on both sides, he said. I did this for two reasons: one to maximize the size of the final bowl, but also for the Auburn Family who knew the tree. There is a bark inclusion at the very top of the piece where the two major limbs were reaching. This detail is significant to the character and to the historical context of the piece. The sculpture measures 27-inches wide by 15-inches high and joins the museum s permanent collection of more than 2,000 objects. Auburn student Taylor Akers said she felt overwhelmed when she first saw the exhibition. Auburn students, faculty, and fans are going to be able to enjoy the trees for lifetimes to come through this object, even if it holds a different form now, said Akers, a senior majoring in communications and political science from Chattanooga, Tenn. This bowl is important to Auburn because it holds so much history. These trees not only played a part in one of the oldest traditions at Auburn, they were a part of the Auburn spirit. Junior Sara Caitlin Godwin was wowed by Moulthrop s ability to turn the forked tree section into the curved and polished vessel. I m glad they chose to do something so impressive, distinguished, and unique to represent our beloved trees, said Godwin, a kinesiology major. Moulthrop said that the artistry of woodturning is dissecting before you begin. I want to uncover and reveal what s underneath in the best way possible, and you have one shot at that intention. You can see that this bowl had more meaning than just the piece itself. For Marilyn Laufer, museum director, that meaning is something she said she hopes museum goers this fall will experience through this example of creative expression. Visitors may view this as a tribute, not only to the trees that were lost, but also to the way that the Auburn Family was able to find a way to reaffirm our belief in humanity.
3 Fina ncial R eport 2014 Comprehensive Annual Financial Report for the year ended September 30, 2014
4 This page is intentionally left blank. 2
5 Financial R eport 2014 TABLE OF CONTENTS INTRODUCTORY SECTION PRESIDENT S LETTER...6 LETTER OF TRANSMITTAL...7 FINANCIAL SECTION INDEPENDENT AUDITOR S REPORT...10 MANAGEMENT S DISCUSSION AND ANALYSIS...12 AUBURN UNIVERSITY FINANCIAL STATEMENTS STATEMENTS OF NET POSITION...22 STATEMENTS OF REVENUES, EXPENSES AND CHANGES IN NET POSITION...23 STATEMENTS OF CASH FLOWS...24 COMPONENT UNITS FINANCIAL STATEMENTS AUBURN UNIVERSITY FOUNDATION AND AUBURN ALUMNI ASSOCIATION...26 TIGERS UNLIMITED FOUNDATION...28 AUBURN RESEARCH AND TECHNOLOGY FOUNDATION...30 NOTES TO FINANCIAL STATEMENTS...32 DIVISIONAL FINANCIAL STATEMENTS (UNAUDITED) AUBURN UNIVERSITY MAIN CAMPUS...62 AUBURN UNIVERSITY AT MONTGOMERY...64 ALABAMA AGRICULTURAL EXPERIMENT STATION...66 ALABAMA COOPERATIVE EXTENSION SYSTEM...68 REQUIRED SUPPLEMENTAL INFORMATION...72 AUBURN UNIVERSITY BOARD OF TRUSTEES

6 September 9,
7 Financial R eport 2014 Introductory Section 5
8 OFFICE OF THE PRESIDENT January 23, 2015 Dear Members of the Auburn Community and Alabama Citizens: Auburn enjoyed an exciting fiscal year that ended September 30, For starters, we saw a growing demand for the Auburn experience with prospective student applications reaching a record high. The fall freshman class was Auburn s largest and among the most academically strong with an average ACT score of 27. Following are a few additional highlights from this fiscal year: The Edward Via College of Osteopathic Medicine received accreditation, and its first class is scheduled for Fall Located in the Auburn Research Park, this privately funded medical school will work closely with Auburn faculty to improve the wellbeing of Alabama citizens and advance health sciences research on campus. The National Academy of Inventors listed Auburn in the top 100 among universities worldwide in the number of patents. Innovations based on Auburn expertise drive economic opportunity, and credit is due to our faculty scientists and researchers. Auburn ranked #8 nationally by BestColleges.com in student satisfaction based on such criteria as student retention and graduation rates. The Alabama Cooperative Extension System continues to provide much-needed public services around the state. Two examples are helping small business owners prevent identity theft and assisting peach growers protect their crops when threatened by an overnight freeze. Auburn established a new center to augment our aviation and aerospace programs and support state leaders in recruiting, retaining and renewing industry. Auburn s annual financial report summarizes our financial position and activity for the most recent fiscal year. We invite you to learn more at Sincerely, Jay Gogue President 6
9 OFFICE OF THE PRESIDENT January 23, 2015 The Comprehensive Annual Financial Report for Auburn University for 2014 provides comparative financial statements for the years ended September 30, 2014 and September 30, The financial statements on the following pages have been prepared in accordance with the guidelines established by the Governmental Accounting Standards Board, the American Institute of Certified Public Accountants, and general conformance with College and University Business Administration, which sets forth generally accepted accounting principles for colleges and universities. The management of Auburn University is responsible for the integrity and objectivity of the financial statements. Management believes that the University s highly developed system of internal accounting controls provides reasonable assurance that assets are protected and that transactions and events are properly recorded. The system of internal controls is maintained by establishment and communication of fiscal policies and procedures, careful selection of qualified financial staff, and an extensive program of internal audits and management reviews. Sincerely, Donald L. Large, Jr. Executive Vice President 7

10 8
11 Financial R eport 2014 Fina nci a l Section 9
12 Independent Auditor s Report To the Board of Trustees of Auburn University: We have audited the accompanying financial statements of Auburn University (the University ), a component unit of the State of Alabama, as of and for the years ended September 30, 2014 and 2013, and the related notes to the financial statements, which consist of the statements of net position and the related statements of revenues, expenses and changes in net position and statements of cash flows of Auburn University and the statements of financial position and of activities and changes in net assets of the University s discretely presented component units. Management s Responsibility for the Financial Statements Management is responsible for the preparation and fair presentation of the financial statements in accordance with accounting principles generally accepted in the United States of America; this includes the design, implementation, and maintenance of internal control relevant to the preparation and fair presentation of financial statements that are free from material misstatement, whether due to fraud or error. Auditor s Responsibility Our responsibility is to express opinions on the financial statements based on our audits. We did not audit the financial statements of the Auburn University Foundation ( AUF ) and the Auburn Alumni Association (the Association ), two of the University s discretely presented component units, as of and for the years ended September 30, 2014 and We did not audit the financial statements of Tigers Unlimited Foundation ( TUF ), one of the University s discretely presented component units, as of and for the years ended June 30, 2014 and Those statements were audited by other auditors whose reports have been furnished to us, and our opinion, insofar as it relates to the amounts included for the above mentioned discretely presented component units of the University, is based solely on the reports of the other auditors. We conducted our audits in accordance with auditing standards generally accepted in the United States of America. Those standards require that we plan and perform the audit to obtain reasonable assurance about whether the financial statements are free from material misstatement. An audit involves performing procedures to obtain audit evidence about the amounts and disclosures in the financial statements. The procedures selected depend on our judgment, including the assessment of the risks of material misstatement of the financial statements, whether due to fraud or error. In making those risk assessments, we consider internal control relevant to the University s preparation and fair presentation of the financial statements in order to design audit procedures that are appropriate in the circumstances, but not for the purpose of expressing an opinion on the effectiveness of the University s internal control. Accordingly, we express no such opinion. An audit also includes evaluating the appropriateness of accounting policies used and the reasonableness of significant accounting estimates made by management, as well as evaluating the overall presentation of the financial statements. We believe that the audit evidence we have obtained is sufficient and appropriate to provide a basis for our audit opinions. Opinions In our opinion, based on our audits and the reports of the other auditors, the financial statements referred to above present fairly, in all material respects, the respective financial position of the University and its discretely presented component units at September 30, 2014 and 2013, or June 30, 2014 and 2013, as applicable, and the respective changes in financial position and, where applicable, cash flows thereof for the years then ended in accordance with accounting principles generally accepted in the United States of America. PricewaterhouseCoopers LLP, 569 Brookwood Village, Suite 851, Birmingham, AL T: (205) , F: (205) , 10
13 Other Matters The accompanying management's discussion and analysis and the required supplemental information for the year ended September 30, 2014 on pages 12 through 21 and 72 through 74, respectively, are required by accounting principles generally accepted in the United States of America to supplement the basic financial statements. Such information, although not a part of the basic financial statements, is required by the Governmental Accounting Standards Board who considers it to be an essential part of financial reporting for placing the basic financial statements in the appropriate operational, economic, or historical context. We applied certain limited procedures to the required supplementary information in accordance with auditing standards generally accepted in the United States of America, which consisted of inquiries of management about the methods of preparing the information and comparing the information for consistency with management's responses to our inquiries, the basic financial statements, and other knowledge we obtained during our audit of the basic financial statements. We do not express an opinion or provide any assurance on the information because the limited procedures do not provide us with sufficient evidence to express an opinion or provide any assurance. The University has omitted the management's discussion and analysis for the year ended September 30, 2013 that accounting principles generally accepted in the United States of America require to be presented to supplement the basic financial statements. Such missing information, although not a part of the basic financial statements, is required by the Governmental Accounting Standards Board who considers it to be an essential part of financial reporting for placing the basic financial statements in the appropriate operational, economic, or historical context. Our opinions on the basic financial statements are not affected by this missing information. Our audits were conducted for the purpose of forming opinions on the financial statements that collectively comprise the University s basic financial statements. The introductory information on pages 6 to 7 and the supplemental divisional financial statements on pages 62 to 69 are presented for purposes of additional analysis and are not a required part of the basic financial statements. Such information has not been subjected to the auditing procedures applied in the audit of the basic financial statements by us or other auditors, and accordingly, we express no opinion nor provide any assurance on them. January 23,
14 MANAGEMENT S DISCUSSION AND ANALYSIS (UNAUDITED) The following discussion and analysis provides an overview of the financial position and activities of Auburn University (the University) for the year ended September 30, 2014, with a comparison to the year ended September 30, This discussion has been prepared by management and should be read in conjunction with the financial statements and the notes thereto, which follow this section. The financial statements, footnotes, and this discussion are the responsibility of University management. The University is a land-grant institution with two campuses, Auburn (main campus) and Montgomery (AUM). Main campus is classified by the Carnegie Foundation as Doctoral/Research-Extensive, while AUM is classified as Master s I. Fall 2014 enrollment totaled 30,969 students at main campus and AUM. The University offers a diverse range of degree programs in 12 colleges and schools and has approximately 5,300 full-time employees, including approximately 1,400 faculty members, who contribute to the University s mission of serving the citizens of the State of Alabama through its instructional, research, and outreach programs. Using the Annual Report The University s financial statements are prepared in accordance with Governmental Accounting Standards Board (GASB) principles, which establish standards for external financial reporting for public colleges and universities. The financial report includes three financial statements: the Statement of Net Position; the Statement of Revenues, Expenses, and Changes in Net Position; and the Statement of Cash Flows. All references to 2014, 2013, or another year refer to the fiscal year ended September 30, unless otherwise noted. In addition to the University s financial statements, related component unit Statements of Financial Position and Statements of Activities and Changes in Net Assets have been included in this annual report. GASB Statement No. 39, Determining Whether Certain Organizations Are Component Units-an amendment of GASB Statement No. 14, provides criteria for determining which related organizations should be reported as component units based on the nature and significance of their relationship with the primary government, which is the University. GASB Statement No. 39 also clarifies financial reporting requirements for those organizations as amendments to GASB Statement No. 14, The Financial Reporting Entity. The University also evaluated GASB Statement 61, The Financial Reporting Entity: Omnibus-an amendment of GASB Statements No. 14 and No. 34 to ensure proper disclosure. The component units report financial results under principles prescribed by the Financial Accounting Standards Board (FASB) and are subject to standards under the Accounting Standards Codification and the Hierarchy of Generally Accepted Accounting Principles and present net assets in three classes: unrestricted, temporarily restricted, and permanently restricted. The four component units of the University reported herein are as follows: (1) Auburn University Foundation (AUF) - AUF was organized on February 9, 1960, and is the fundraising foundation for the University. As of September 30, 2014, AUF holds endowments and distributes earnings from those endowments to the University. AUF is incorporated as a legally separate, tax-exempt nonprofit organization established to solicit individual and corporate donations for the direct benefit of the University. The Auburn University Real Estate Foundation, Inc. (AUREFI) has been consolidated into AUF s financial statements. The University s financial statements are summarized as follows: The Statement of Net Position presents entity-wide assets, deferred outflows of resources, liabilities, deferred inflows of resources, and net position (assets and deferred outflows of resources minus liabilities and deferred inflows of resources) on the last day of the fiscal year. Distinctions are made in current and noncurrent assets and liabilities. Net position is segregated into unrestricted, restricted (expendable and nonexpendable), and net investment in capital assets. The University s net position is one indicator of the University s financial health. From the data presented, readers of the Statement of Net Position have the information to determine the assets available to continue the operations of the University. They may also determine how much the University owes vendors, investors, and lending institutions. Finally, the Statement of Net Position outlines the net resources available to the University. The Statement of Revenues, Expenses and Changes in Net Position presents the revenues earned and expenses incurred during the year. Activities are reported as either operating or nonoperating. Governmental accounting standards require state appropriations, gifts, and investment earnings to be classified as nonoperating revenues. As a result, the University will typically realize a significant operating loss. The utilization of capital assets is reflected in the Statement of Revenues, Expenses and Changes in Net Position as depreciation expense, which reflects the amortization of the cost of an asset over its expected useful life. The Statement of Cash Flows reports the major sources and uses of cash and reveals further information for assessing the University s ability to meet financial obligations as they become due. Inflows and outflows of cash are summarized by operating, noncapital financing, capital and related financing, and investing activities. (2) Auburn Alumni Association (the Association) - The Association is a nonprofit corporation organized on April 14, 1945, which was created to promote mutually beneficial relationships between the University and its alumni, to encourage loyalty among alumni, and to undertake various other actions for the benefit of the University, its alumni, and the State of Alabama. Membership is comprised of alumni, friends, and students of the University. The Association provides monetary support to the University in the form of faculty awards and student scholarships. (3) Tigers Unlimited Foundation (TUF) - TUF is a legally separate nonprofit organization incorporated in December 2002, which began operations on April 21, TUF was organized exclusively for charitable purposes, pursuant to Sections 501(a) and 501(c)(3) of the Internal Revenue Code to support athletic fundraising and athletic programs. TUF has a June 30 fiscal year end. TUF provides economic resources to the University for athletic scholarships, athletic building maintenance or new construction, and for athletic department programs. (4) Auburn Research and Technology Foundation (ARTF) - ARTF was organized on August 24, 2004, as a separate nonprofit organization to develop and operate the Auburn Research Park and to assist the University with the attraction, development, and commercialization of technology. The vision of ARTF is to establish an entrepreneurial atmosphere for businesses to foster economic diversification and vitality of the local community, state, and region. 12
15 MANAGEMENT S DISCUSSION AND ANALYSIS (UNAUDITED) Financial Highlights Statement of Net Position A summary of assets, deferred outflows of resources, liabilities, deferred inflows of resources, and net position as of September 30, 2014 and 2013, is as follows: Assets Current assets $ 301,408,817 $ 257,011,629 Capital assets 1,550,144,298 1,535,238,933 Other noncurrent assets 861,390, ,559,735 Total assets 2,712,943,257 2,657,810,297 Deferred Outflows of Resources Loss on refunding of bonds 14,442,185 10,911,474 Liabilities Current liabilities 333,782, ,508,943 Noncurrent liabilities 751,013, ,599,661 Total liabilities 1,084,795,804 1,091,108,604 Deferred Inflows of Resources Nonexchange transactions 435, ,994 Net Position Net investment in capital assets 821,520, ,467,398 Restricted-nonexpendable 28,176,521 27,696,563 Restricted-expendable 162,165, ,183,733 Unrestricted 630,291, ,918,479 Total net position $ 1,642,154,435 $ 1,577,266,173 The University s Assets Current assets consist of cash and cash equivalents, operating investments (those investments that are expected to be liquidated during the course of normal operations), net accounts receivable (primarily amounts due from the federal and state governments and other agencies as reimbursements for sponsored programs), net student accounts receivable (including amounts due from third parties on behalf of the students), current portion of loans receivable, accrued interest receivable, inventories, and prepaid expenses. The University s current assets increased $44.4 million from 2013 to Of this increase, cash and cash equivalents and operating investments increased by $51.2 million. This was the result of the University investing excess additional revenues in highly liquid investments while the low interest rate market environment exists. Student accounts receivable increased $3.0 million, which was due to the tuition increase approved by the Board of Trustees and changes in enrollment and scholarship strategies. The University saw decreases in accounts receivable of $10.0 million, which was the result of decreases in federally sponsored projects. The University s long-term investments, shown in other noncurrent assets, decreased by $4.4 million from 2013 to This decrease was due to spending previously-invested bond funds held for construction projects. The University saw increases in capital assets, net of depreciation, shown as Investment in plant, net on the Statement of Net Position, of 1.0% from 2013 to Capital assets generally represent the historical cost of land improvements, buildings, construction in progress, infrastructure, equipment, library books, and livestock, less any accumulated depreciation, with buildings comprising approximately 77.3% of the total net capital asset value. The increase, offset by disposal activity, depreciation, and transfers, was the result of $88.7 million of new additions to property, plant, and equipment, net of construction in progress transfers. The University expended $79.9 million in new construction during fiscal year The following building construction projects totaling $117.1 million were either completed and placed into service or additional work was performed on a previously completed project during the current fiscal year: Bailey Small Animal Teaching Hospital $ 72.2 million South Donahue Residence Halls $ 13.9 million South Donahue Wellness Kitchen $ 6.0 million Olympic Sports Building Renovation $ 5.6 million Telfair Peet Theatre and Dance Studio Addition $ 3.9 million AUM Warhawk Residence Hall $ 2.0 million Facilities Bldg 1 Interior Renovation and Addition $ 1.4 million Facilities Bldg 2 Interior Renovation and Addition $ 1.4 million Equine Research Lab $ 1.3 million Student Recreation and Wellness $ 1.3 million Center for Advanced Science, Innovation & Commerce $ 1.1 million Other Small Projects $ 7.0 million The University s Deferred Outflows of Resources Deferred outflows of resources are a consumption of net assets that are applicable to a future reporting period. In 2010, 2012, and 2014, the University defeased certain outstanding bonds. These refundings resulted in losses (the difference between the acquisition price of the new debt and the net carrying amount of the old debt). In accordance with GASB Statements No. 63 and No. 65, these losses are presented as deferred outflows of resources. The increase in the deferred outflows of resources of $3.5 million is the net of the 2014A Bond loss on refunding of $5.7 million and current year amortization of the loss on refunding for all the bonds of $2.1 million. The loss on refunding is amortized over the life of the old or new bonds, whichever is shorter. The University is amortizing over the life of the defeased bonds (see Note 8). 13
16 MANAGEMENT S DISCUSSION AND ANALYSIS (UNAUDITED) The University s Liabilities Current liabilities consist of accounts payable, accrued salaries and wages, the current portion of compensation-related liabilities, accrued interest payable, student and other deposits (including Perkins and Health Professions loan liability), unearned revenues, the current portion of noncurrent liabilities, and other accrued liabilities. Current liabilities increased by $15.3 million from 2013 to While the University accrued $2.0 million less in payables at year end, unearned revenues increased $10.4 million. Unearned revenue is comprised of tuition, room and board revenue that relates to fiscal year 2015, contracts and grants funding received prior to expenditure as well as athletic revenue related to games played subsequent to September 30. For Fall 2014, the Board of Trustees approved approximately a 4% tuition increase for main campus and AUM. Sixty percent of fall tuition is reported as unearned revenue due to the fiscal year end of September 30. The remaining increase is shown as an additional $5.8 million in the University's current portion of long term liabilities. This increase was the result of the University s debt repayment strategies. Bonds issued in 2011 were structured to begin principal repayments in 2015, aligning payments with generation of corresponding pledged revenue. Noncurrent liabilities include principal amounts due on University bonds payable, accrued compensated absences and other compensation-related liabilities that are payable beyond September 30, Noncurrent liabilities decreased $21.6 million from 2013 to The majority of the decrease was due to debt payments and amortization of bond premium and discounts in the amount of $23.1 million. This decrease was offset by an additional accrual of $1.7 million relating to its obligation for the University's post-employment medical plan. The University s Deferred Inflows of Resources Deferred inflows of resources are an acquisition of net assets that are applicable to a future reporting period. The University engages in certain voluntary nonexchange transactions (grants). Grant funds received for which all eligibility requirements have been met, other than time requirements, are presented as deferred inflows of resources in accordance with GASB Statements No. 63 and No. 65. The University's deferred inflows of resources had virtually no change from 2013 to The small increase was the result of receiving additional funding for which the time requirement for spending had not occurred at year end (see Note 14). The University s Net Position The three major net position categories are discussed below: Net investment in capital assets represents the University s capital assets, net of accumulated depreciation and outstanding principal balances of debt as well as any deferred inflows or outflows of resources, attributable to the acquisition, construction, or improvement of those assets. Net investment in capital assets increased 4.3% from 2013 to This increase was due to capitalization of assets as previously described and payments made on outstanding debt. Restricted (nonexpendable and expendable) net position: Restricted-nonexpendable net position is subject to external restrictions governing its use and consists of the University s permanent endowment funds. This net position increased 1.7% from 2013 to This increase was the result of additional gifts to permanently endowed funds as well as investment earnings that were added back to current permanent endowments. Restricted-expendable net position is also subject to external restrictions governing its use. Items of this nature include gifts, contracts, and grants restricted by federal, state, local governments, or private sources for purposes as determined by donors and/or external entities that have placed time or purpose restrictions on the use of the assets. Restricted funds functioning as endowments, restricted funds available for student loans, and funds restricted for construction purposes are also included in this category. Restricted-expendable net position decreased 6.4% from 2013 to This decrease was due to expending funds on capital projects that did not have associated outstanding debt as well as utilizing gift funds collected in prior years. Unrestricted net position is the third major class of net position, and it is not subject to externally imposed stipulations; however, the majority of the University s unrestricted net position has been internally designated for various mission-related purposes. This category includes funds for general operations of the University, auxiliary operations (including athletics, housing, and the bookstores), unrestricted quasi-endowments, and capital projects. Unrestricted net position increased 7.0% from 2013 to The increase in unrestricted net position was mainly due to holding unrestricted funds for future mission-related priorities and deferred maintenance needs. TOTAL NET POSITION Amount in Millions $1,800 $1,600 $1,400 $1,200 $1,000 $800 $600 $400 $200 $1,336 $1,435 $1,518 $1,577 $1,642 Net Investment of Capital Assets Restricted Nonexpendable Restricted Expendable Unrestricted 14 $ Fiscal Year
17 MANAGEMENT S DISCUSSION AND ANALYSIS (UNAUDITED) Statement of Revenues, Expenses and Changes in Net Position Changes in total net position are the result of activity presented in the Statement of Revenues, Expenses and Changes in Net Position. The purpose of this statement is to present the revenues earned by the University, both operating and nonoperating, and the expenses incurred by the University, operating and nonoperating, and any other revenues, expenses, gains, losses, and changes in net position. A condensed statement is provided below: Operating revenues $ 663,909,152 $ 626,750,002 Operating expenses 928,297, ,283,611 Operating loss (264,388,285) (264,533,609) Net nonoperating revenues and other changes in net position 329,276, ,228,114 Increase in net position 64,888,262 59,694,505 Net position - beginning of year 1,577,266,173 1,517,571,668 Net position - end of year $ 1,642,154,435 $ 1,577,266,173 The 2014 Statement of Revenues, Expenses, and Changes in Net Position reflects an increase in net position at the end of the year of $64.9 million. Operating revenues increased 5.9% from 2013 to The majority of this increase is attributable to the increase in student tuition and fee revenue, net of discounts. The $16.5 million tuition and fee increase over 2013 was the result of the Board-approved increase in tuition for both main campus and AUM and changes to the University's enrollment and scholarship strategies. The University also saw increases in other operating revenue of $5.6 million. This increase was due to revenue generated by new outreach programs. The University saw a net decrease in federal appropriations, federal, state, and nongovernmental contract and grant revenues of $3.9 million, which was primarily the result of a decrease in spending of federal grant funds appropriated and awarded for research. Auxiliary revenue increased approximately $18.9 million. The majority of this increase was due to increased athletic ticket sales, radio and television revenues. In addition, the University saw increased revenues from new dorms and wellness centers being placed into service at main campus and at AUM. Operating expenses increased 4.2% from 2013 to Multiple factors contributed to this net increase. Compensation and benefit costs increased 3.6%. This was the result of Board-approved salary increases and one-time supplement payments. Other supplies and services expenses increased $6.8 million. This increase was attributable to additional noncapitalized maintenance projects in fiscal year Depreciation expense increased 8.7% in This increase was the result of recording depreciation beginning in fiscal year 2014 on projects completed in Some of the buildings completed included the Student Recreation and Wellness Center, South Donahue Residence Hall, AUM Warhawk Residence Hall, and the Kinesiology Building. Net nonoperating revenues increased $30.7 million from 2013 to The University received an increase in appropriations from the State of Alabama of $4.4 million. Revenue recognized on Pell grants awarded to students in fiscal year 2014 increased 5.3%. The University s net investment income increased from $13.1 million in fiscal year 2013 to $38.8 million in fiscal year Due to the improved market environment, the University recognized increases in interest and endowment income of $5.6 million. The University recognized an increase in realized gains of approximately $5.0 million, and as of September 30, 2014, had unrealized gains of $7.9 million, whereas, in fiscal year 2013, the University recognized unrealized losses of $7.2 million. Other changes in net position decreased $25.7 million in fiscal year 2014 from fiscal year This decrease is the direct result of receiving ARRA and state funding for the Center for Advanced Science, Innovations & Commerce and the renovation of the Corley Annex Biological Engineering Research Lab in fiscal year 2013, which the University did not receive in fiscal year


18 MANAGEMENT S DISCUSSION AND ANALYSIS (UNAUDITED) OPERATING REVENUES SUPPORTING CORE ACTIVITIES For the year ended September 30, 2014 Auxiliaries, Net 19% Other Operating Revenue 3% Sales & Services 6% Grants & Contracts 15% Federal Appropriations 2% Tuitio Student Tuition Net & Fees, Net Net 55% 55% OPERATING EXPENSES BY NATURAL CLASSIFICATION For the year ended September 30, 2014 Compensation & Benefits 62% Scholarships & Fellowships 2% Utilities 3% Depreciation 8% Other Supplies & Services 25% OPERATING EXPENSES BY FUNCTION For the year ended September 30, 2014 Student Services 3% Library 1% Institutional Support 8% Academic Support 6% Operation & Maintenance 8% Public Service 11% Scholarships & Fellowships 4% Research 11% Auxiliaries 13% Depreciation 8% Instruction 27% 16
19 Statement of Cash Flows The Statement of Cash Flows presents information about changes in the University s cash position using the direct method of reporting sources and uses of cash. The direct method reports all major gross cash inflows and outflows, differentiating these activities into operating activities; noncapital financing, such as nonexchange grants and The University s cash flows are summarized below: MANAGEMENT S DISCUSSION AND ANALYSIS (UNAUDITED) contributions; capital and related financing, including bond proceeds from debt issued to purchase or construct buildings; and investing activities. Operating activity uses of cash significantly exceed operating activity sources of cash due to classification of state appropriations and gifts as noncapital financing activities Net cash provided by (used in): Operating activities $ (167,488,580) $ (182,145,734) Noncapital financing activities 301,397, ,475,856 Capital and related financing activities (125,797,480) (220,486,064) Investing activities 57,846,593 80,230,333 Net increase (decrease) in cash 65,958,253 (25,925,609) Cash and cash equivalents - beginning of year 71,430,712 97,356,321 Cash and cash equivalents - end of year $ 137,388,965 $ 71,430,712 Net cash used for operating activities decreased from 2013 to 2014 by 8.0%. The majority of this decrease was the result of additional cash provided from tuition and fees of $29.4 million, auxiliary enterprises of $15.4 million, other operating revenues of $8.9 million, and grants and contracts of $2.1 million. These increases in cash were offset by the following additional uses. During fiscal year 2014, payments for employee compensation and benefits increased $19.5 million, as a result of Board-approved salary increases and one-time supplement payments. The University had additional payments to suppliers and for utilities of $5.4 million and $3.2 million, respectively. The payments to suppliers increased primarily due to the additional accruals at the end of fiscal year The increase in payments for utilities was a result of additional costs associated with new university buildings. Due to increased awardings of the Spirit of Auburn Scholarship, additional payments of scholarships and fellowships of $5.0 million occurred in fiscal year Net cash provided by noncapital financing activities increased $4.9 million. This was primarily due to the University s additional allocation of state appropriations of 1.8% over the allocation in fiscal year excellence in service to students, sponsors, the State of Alabama, and other constituents. The University s strong financial position and internal planning processes provide the University some protection against funding reductions and adverse economic conditions. Nonetheless, future reductions in state support must be anticipated and managed carefully to maintain excellence. Neither external nor internal efforts to mitigate the impact, however, are intended to eliminate the effects of future proration or decrease in state funding. As a labor intensive organization, the University faces competitive pressures related to attracting and retaining faculty and staff. The rising cost of health care remains a concern, particularly in light of the post-retirement health care benefits offered to retirees. The University continues to address aging facilities with significant new construction, as well as modernization and renovation of existing facilities. Although funding of these projects through gifts, federal and state funds, and deferred maintenance budget allocations continues, the costs of operating the new and renovated facilities will continue to place additional resource demands on the operating budget of the institution. The University saw a reduction in net cash used in capital and related financing activities of $94.7 million. During fiscal year 2014, the University received $20.4 million less than in fiscal year 2013 related to capital gifts and grants. The University completed several projects funded by bond issuances, which caused funds expended related to those issuances to decrease by $117.3 million. During the fiscal year, the University partially refunded two bond issuances causing a net increase in cash flows provided by capital and related financing activity of $7.6 million. In contrast, payments for interest expense increased $9.5 million. This increase was a direct result of the completion of the previously mentioned construction projects. In the prior years, some payments relating to interest expense were capitalized. These same costs are now shown as interest expense. Net cash provided by investing activities decreased by $22.4 million. Although the University received an additional $3.2 million in investment income, the proceeds from the sale and maturities of investments and the purchasing of new investments decreased 41.5% and 41.6%, respectively. This is a direct result of completing projects in fiscal year 2013 which were financed with bond issuances. The University invests bond funds until project expenditures occur. During fiscal year 2014, the University did not have additional bond funds to invest, as occurred in previous fiscal years. In addition, since the funds were expended in previous fiscal years, the respective investments were sold or matured in those years. Economic factors that will affect the future While the University is impacted by the general economic conditions, management believes the University will continue its high level of The University continues to take steps to enhance student recruitment, both in marketing efforts and in providing additional scholarship funding. Applications, acceptances, and retention are monitored closely to assess the potential impact of general economic conditions on future enrollment. We are cautiously optimistic that demand will remain strong. The University will continue to employ its long-term investment strategy to maximize total returns at an appropriate level of risk, while utilizing a spending rate policy to insulate the University s operations from temporary market volatility. Preservation of capital is regarded as the highest priority in the investing of the cash pool. Diversification through asset allocation is utilized as a fundamental risk strategy for endowed funds. Cautionary note regarding forward-looking statements Certain information provided by the University, including written, as outlined above, or oral statements made by its representatives, may contain forwardlooking statements as defined in the Private Securities Litigation Reform Act of All statements, other than statements of historical fact, which address activities, events, or developments that the University expects or anticipates will or may occur in the future, contain forward-looking information. In reviewing such information, it should be kept in mind that actual results may differ materially from those projected or suggested in such forward looking information. This forward-looking information is based upon various factors and was derived using various assumptions. 17
20 MANAGEMENT S DISCUSSION AND ANALYSIS (UNAUDITED) Auburn Main Campus/ Auburn University at Montgomery UNDERGRADUATE TUITION FOR THE ACADEMIC YEAR Full Time Students: In-State $7,900/$6,730 $8,698/$6,930 $9,446/$7,500 $9,852/$8,425 $10,200/$9,080 Out-of-State $21,916/$19,090 $23,290/$20,790 $25,190/$22,500 $26,364/$24,950 $27,384/$19,640 Auburn Main Campus and Auburn University at Montgomery FALL STUDENT ENROLLMENT Undergraduate and Professional 26,025 25,868 25,442 24,133 25,006 Graduate 4,864 4,906 4,681 5,827 5,963 Auburn Main Campus and Auburn University at Montgomery DEGREES AWARDED FOR THE ACADEMIC YEAR Bachelor 4,700 4,800 4,925 4,834 5,090 Advanced 1,670 1,809 1,827 1,835 1, AUBURN UNIVERSITY MAIN CAMPUS AND AUBURN UNIVERSITY AT MONTGOMERY FULL-TIME FACULTY BY RANK Number of Faculty FALL 2010 FALL 2011 FALL 2012 FALL 2013 FALL 2014 Term Professor Associate Professor Assistant Professor Instructor Visiting 18


21 MANAGEMENT S DISCUSSION AND ANALYSIS (UNAUDITED) AUBURN UNIVERSITY MAIN CAMPUS TOTAL STUDENT CREDIT HOURS BY COLLEGE/SCHOOL College/School 0 50, , , , ,000 Liberal Arts Sciences & Mathematics Business Engineering Education 83,861 64,280 77,824 70,806 58,566 74, ,233 Human Sciences Architecture, Design & Construction Pharmacy Veterinary Medicine 26,937 25,088 20,813 19, Other Agriculture 17,048 16, Nursing Forestry & Wildlife Sciences 9,540 4,262 Other Courses Core Courses AUBURN UNIVERSITY MAIN CAMPUS FRESHMEN ENROLLMENT BY ALABAMA COUNTIES SUMMER/FALL TERMS 2014 Other 29% Jefferson 20% Baldwin 4% Mobile 4% Montgomery 6% Lee 8% Shelby 12% Madison 17% Tennessee 3% Florida 6% Georgia 14% Texas 3% SOURCES OF ENTERING FRESHMEN BY STATE MAIN CAMPUS SUMMER/FALL TERMS 2014 Virginia 2% Other Locations 12% Alabama 60% 19
22 MANAGEMENT S DISCUSSION AND ANALYSIS (UNAUDITED) AUBURN UNIVERSITY FIVE YEAR HIGHLIGHTS (MILLIONS OF DOLLARS) FOR THE FISCAL YEARS ENDED SEPTEMBER Revenues by Source Tuition & fees, net $ $ $ $ $ Federal appropriations 30.3* 38.8* State appropriations Grants & contracts, net Gifts Capital gifts & grants Sales and services, investments and other income, net of interest expense Auxiliary revenue, net Total Revenues by Source $ $ $ $ $ Expenditures by Function Instruction $ $ $ $ $ Research Public service Academic support Library Student services Institutional support Operation and maintenance Scholarships and fellowships Auxiliary enterprises Depreciation Total Expenditures by Function $ $ $ $ $ Expenditures by Natural Classification Compensation & benefits $ $ $ $ $ Scholarships & fellowships Utilities Other supplies and services Depreciation Total Expenditures by Natural Classification $ $ $ $ $ *Includes appropriation from The American Recovery and Reinvestment Act of
23 MANAGEMENT S DISCUSSION AND ANALYSIS (UNAUDITED) AUBURN UNIVERSITY FINANCIAL RATIOS* FOR THE FISCAL YEARS ENDED SEPTEMBER 30 Debt Service Coverage Ratio The debt service coverage ratio measures the ability to cover annual debt service obligations from current year operating cash flows. A ratio of at least 1.0 is desirable The University's debt service coverage ratio decreased due to new debt issuances in 2011 and The ratio began rebounding as the University paid down portions of the outstanding amounts. The ratio remains sufficiently above the desired 1.0 in all years presented Debt Service Burden This ratio measures the percentage of annual operating expenses devoted to debt service. A ratio below 7% is desirable The University's debt service burden increased due to new debt issuances in 2011 and As the University has been paying down some of the outstanding amounts, the ratio began to decrease Primary Reserve Ratio The Primary Reserve Ratio measures the financial strength of the institution by indicating how many years it could operate using expendable net position without relying on additional revenue. It is generally recommended that the ratio be at least The University's primary reserve ratio has remained relatively unchanged Viability Ratio This ratio measures the availability of expendable net position to cover debt obligations should the institution be required to settle them immediately. A ratio of 1.0 indicates that the institution could pay off all debts While new debt issuances in 2011 dropped the ratio below 1.0%, the ratio has since rebounded with an increase in the subsequent three years Return on Net Position Ratio This ratio measures total economic return and can be used to indicate whether the institution is financially stronger or weaker over time. It is generally recommended that the goal be a 3.00% % return over the long-term. While the University's return on net position ratio has fluctuated over the 5 years presented, it remains strong, despite the difficult economic climate and significantly reduced income from state appropriations *These financial ratios are presented for purposes of additional analysis and are not a required part of the basic financial statements. These ratios include only the University s financial statements and may not be comparable to other institutions. 21
24 AUBURN UNIVERSITY STATEMENTS OF NET POSITION SEPTEMBER 30, 2014 AND ASSETS Current assets Cash and cash equivalents $ 137,388,965 $ 71,430,712 Operating investments 45,171,928 59,887,580 Accounts receivable, net 37,295,056 47,339,578 Student accounts receivable, net 37,346,662 34,360,176 Loans receivable, net 2,555,991 2,509,024 Accrued interest receivable 1,814,348 1,713,614 Inventories 4,599,906 4,517,492 Prepaid expenses 35,235,961 35,253,453 Total current assets 301,408, ,011,629 Noncurrent assets Investments 844,273, ,661,718 Loans receivable, net 17,116,551 16,898,017 Investment in plant, net 1,550,144,298 1,535,238,933 Total noncurrent assets 2,411,534,440 2,400,798,668 Total assets 2,712,943,257 2,657,810,297 DEFERRED OUTFLOWS OF RESOURCES Loss on refunding of bonds 14,442,185 10,911,474 LIABILITIES Current liabilities Accounts payable 55,670,506 57,643,073 Accrued salaries and wages 3,025,472 2,637,392 Accrued compensated absences 18,347,365 17,532,179 Accrued interest payable 12,298,575 12,460,524 Other accrued liabilities 8,344,327 7,699,964 Student deposits 3,068,492 2,534,320 Deposits held in custody 19,900,249 21,164,453 Unearned revenues 184,309, ,863,776 Noncurrent liabilities-current portion 28,817,852 22,973,262 Total current liabilities 333,782, ,508, Noncurrent liabilities Bonds and notes payable 716,188, ,255,580 Lease obligations - 200,000 Other noncurrent liabilities 34,825,020 33,144,081 Total noncurrent liabilities 751,013, ,599,661 Total liabilities 1,084,795,804 1,091,108,604 DEFERRED INFLOWS OF RESOURCES Nonexchange transactions 435, ,994 NET POSITION Net investment in capital assets 821,520, ,467,398 Restricted Nonexpendable 28,176,521 27,696,563 Expendable: Scholarships, research, instruction, other 151,931, ,887,301 Loans 5,013,550 3,908,694 Capital projects 5,220,606 9,387,738 Unrestricted 630,291, ,918,479 Total net position $ 1,642,154,435 $ 1,577,266,173 See accompanying notes to financial statements.
25 AUBURN UNIVERSITY STATEMENTS OF REVENUES, EXPENSES AND CHANGES IN NET POSITION FOR THE YEARS ENDED SEPTEMBER 30, 2014 AND OPERATING REVENUES Tuition & fees, net of scholarship allowances of $106,862,517 and $103,722,389, respectively $ 365,946,812 $ 349,204,106 Federal appropriations 12,888,064 13,003,383 Federal grants & contracts, net 65,480,729 69,712,138 State & local grants & contracts, net 16,025,884 17,457,909 Nongovernmental grants & contracts, net 14,871,312 12,965,576 Sales & services of educational departments 42,072,042 41,965,810 Auxiliary revenue, net of scholarship allowances of $7,896,817 and $6,782,033, respectively 123,401, ,801,344 Other operating revenues 23,223,001 17,639,736 Total operating revenues 663,909, ,750,002 OPERATING EXPENSES Compensation & benefits 578,242, ,979,424 Scholarships & fellowships 22,651,077 21,583,184 Utilities 26,003,836 22,842,876 Other supplies & services 229,604, ,813,203 Depreciation 71,795,613 66,064,924 Total operating expenses 928,297, ,283,611 Operating loss (264,388,285) (264,533,609) NONOPERATING REVENUES (EXPENSES) State appropriations 242,982, ,601,180 Gifts 36,622,346 35,354,346 Grants 22,037,644 20,926,014 Net investment income 38,843,549 13,129,982 Interest expense on capital debt (15,435,498) (13,703,285) Nonoperating revenues, net 325,050, ,308,237 Income before other changes in net position 60,661,787 29,774,628 OTHER CHANGES IN NET POSITION Capital appropriations 16, ,188 Capital gifts & grants 3,729,932 28,086,402 Additions to permanent endowments 479,958 1,719,287 Net increase in net position 64,888,262 59,694,505 Net position - beginning of year 1,577,266,173 1,517,571,668 Net position - end of year $ 1,642,154,435 $ 1,577,266,173 See accompanying notes to financial statements. 23
26 AUBURN UNIVERSITY STATEMENTS OF CASH FLOWS FOR THE YEARS ENDED SEPTEMBER 30, 2014 AND CASH FLOWS FROM OPERATING ACTIVITIES Tuition & fees $ 373,885,655 $ 344,457,719 Federal appropriations 11,822,841 12,930,070 Grants & contracts 107,445, ,355,969 Sales & services of educational departments 41,765,348 48,344,842 Auxiliary enterprises 119,881, ,480,389 Other operating revenues 23,686,105 14,762,840 Payments to suppliers (222,067,887) (216,718,691) Payments for utilities (26,003,836) (22,842,876) Payments for employee compensation & benefits (574,905,901) (555,425,011) Payments for scholarships & fellowships (22,507,092) (17,554,004) Student loans issued (3,397,962) (2,545,519) Student loans collected 2,907,997 2,608,538 Net cash used in operating activities (167,488,580) (182,145,734) CASH FLOWS FROM NONCAPITAL FINANCING ACTIVITIES State appropriations 242,982, ,601,180 Gifts and grants for other than capital purposes 59,170,269 58,566,731 Direct loan receipts 177,467, ,713,211 Direct loan disbursements (178,222,504) (178,405,266) Net cash provided by noncapital financing activities 301,397, ,475,856 CASH FLOWS FROM CAPITAL AND RELATED FINANCING ACTIVITIES Proceeds from advanced refunding of debt, net of issuance cost 75,346,556 - Capital appropriations 16, ,188 Capital grants & gifts received 4,611,200 25,014,137 Purchases of capital assets (93,052,995) (210,399,545) Proceeds received from sale of capital assets 81,250 40,280 Principal paid on debt & capital leases (19,596,314) (19,260,538) Interest paid on debt & capital leases (25,503,762) (15,994,586) Payment to escrow on advanced refunding of debt (67,700,000) - Net cash used in capital and related financing activities (125,797,480) (220,486,064) CASH FLOWS FROM INVESTING ACTIVITIES Proceeds from sales and maturities of investments and reinvestments 363,116, ,284,495 Investment income 19,419,490 16,179,986 Purchases of investments (324,689,206) (556,234,148) Net cash provided by investing activities 57,846,593 80,230,333 Net increase (decrease) in cash and cash equivalents 65,958,253 (25,925,609) Cash and cash equivalents - beginning of year 71,430,712 97,356,321 Cash and cash equivalents - end of year $ 137,388,965 $ 71,430,712 See accompanying notes to financial statements. 24
27 AUBURN UNIVERSITY STATEMENTS OF CASH FLOWS (CONTINUED) FOR THE YEARS ENDED SEPTEMBER 30, 2014 AND 2013 RECONCILIATION OF OPERATING LOSS TO NET CASH USED IN OPERATING ACTIVITIES: Operating loss $ (264,388,285) $ (264,533,609) Adjustments to reconcile operating loss to net cash used in operating activities: Depreciation and amortization 71,795,613 66,064,924 Write-off of loans receivable 224,464 1,210,350 Loss on sale of capital assets 1,894, ,103 Changes in assets and liabilities: Accounts receivable 6,747,315 2,703,143 Student accounts receivable (2,986,486) 1,746,381 Inventories (82,414) 174,054 Unearned revenues 10,445,588 4,271,174 Accounts payable 4,791,721 2,925,207 Prepaid expenses 17,492 (67,287) Accrued salaries, wages and compensated absences 1,203, ,966 Student deposits and deposits held in custody 24, ,333 Loans to students (489,965) 63,019 Other accrued liabilities 644,363 3,454,697 Nonexchange transactions 88, ,242 Other noncurrent liabilities 2,581,241 (2,404,431) Net cash used in operating activities $ (167,488,580) $ (182,145,734) SUPPLEMENTAL NONCASH ACTIVITIES INFORMATION Capital assets acquired with a liability at year-end $ 3,234,671 $ 9,986,306 Gifts of capital assets 2,385,618 3,774,237 Capitalized interest 18,485,556 21,004,825 See accompanying notes to financial statements. 25
28 AUBURN UNIVERSITY COMPONENT UNITS STATEMENTS OF FINANCIAL POSITION SEPTEMBER 30, 2014 AND 2013 Auburn University Foundation Auburn Alumni Association ASSETS Cash and cash equivalents $ 3,349,824 $ 1,373,367 $ 72,071 $ 58,870 Investments 418,046, ,370,535 4,776,518 4,173,764 Investment in Auburn University Foundation Securities Pool - - 8,989,525 8,451,707 Accrued interest receivable 79,593 82,936 20,431 15,453 Contributions receivable, net 68,585,013 56,501, , ,515 Other assets 6,467 27, Investment in real estate 4,074,251 3,802, , ,799 Cash surrender value of life insurance 5,082,046 4,633, Beneficial interest in outside trusts 5,405,637 4,533, Property and equipment, net 218, ,175 1,943,453 1,889,526 Prepaid items - - 5, Due from Auburn University 260, , Due from Auburn University Foundation Total assets $ 505,108,478 $ 437,745,655 $ 16,839,576 $ 15,732,322 LIABILITIES Accounts payable and accrued liabilities $ 423,320 $ 215,336 $ 102,396 $ 31,380 Annuities payable 8,637,277 9,032, Due to Auburn University 168,834 48,270-3,211 Due to Auburn University Foundation , ,704 Due to Auburn Alumni Association 8,989,525 8,452, Due to Tigers Unlimited Foundation 8,606,643 7,984, Deferred revenue 1,126 52,626 8,391,185 8,297,710 Total liabilities 26,826,725 25,785,735 8,945,950 8,538,005 NET ASSETS Unrestricted 23,015,641 20,524,121 7,893,626 7,194,317 Temporarily restricted 123,459,727 93,759, Permanently restricted 331,806, ,676, Total net assets 478,281, ,959,920 7,893,626 7,194,317 Total liabilities and net assets $ 505,108,478 $ 437,745,655 $ 16,839,576 $ 15,732,322 See accompanying notes to financial statements. 26
29 AUBURN UNIVERSITY COMPONENT UNITS STATEMENTS OF ACTIVITIES AND CHANGES IN NET ASSETS FOR THE YEARS ENDED SEPTEMBER 30, 2014 AND 2013 Auburn University Foundation Auburn Alumni Association REVENUES AND OTHER SUPPORT Public support - contributions $ 65,670,616 $ 65,656,935 $ 2,374,133 $ 1,748,427 Investment income 2,511,539 2,722, , ,983 Other revenues 2,037,897 2,063, , ,257 Total operating revenues 70,220,052 70,443,167 3,607,586 3,030,667 EXPENSES AND LOSSES Program services Contributions to and support for Auburn University 31,503,530 27,796, Other program services 3,403,546 2,755,692 1,345, ,384 Total program services 34,907,076 30,552,177 1,345, ,384 Support services General and administrative 1,505,924 1,277,134 1,872,704 1,769,421 Fund raising 2,890,611 2,937, , ,158 Total support services 4,396,535 4,214,662 2,131,968 2,036,579 Total expenses 39,303,611 34,766,839 3,477,099 2,768,963 Unrealized gains on investments, net (17,822,794) (28,622,499) (568,822) (497,790) Realized gains on investments, net (16,003,747) (4,771,963) - - Change in valuation of split-interest agreements (1,602,085) (319,601) - - Impairment in real estate 23,234 49, Total expenses, (gains) and losses 3,898,219 1,102,593 2,908,277 2,271,173 *Change in net assets 66,321,833 69,340, , ,494 Net assets - beginning of year 411,959, ,619,346 7,194,317 6,434,823 Net assets - end of year $ 478,281,753 $ 411,959,920 $ 7,893,626 $ 7,194,317 *Change in net assets Unrestricted $ 2,491,520 $ 2,904,471 $ 699,309 $ 759,494 Temporarily restricted 29,700,243 26,355, Permanently restricted 34,130,070 40,080, Total change in net assets $ 66,321,833 $ 69,340,574 $ 699,309 $ 759,494 See accompanying notes to financial statements. 27
30 AUBURN UNIVERSITY COMPONENT UNITS STATEMENTS OF FINANCIAL POSITION JUNE 30, 2014 AND 2013 Tigers Unlimited Foundation ASSETS Cash and cash equivalents $ 756,174 $ 1,026,747 Investments 36,013,989 38,714,112 Investment in Auburn University Foundation Securities Pool 8,629,832 7,543,528 Due from Auburn University - 504,245 Due from Auburn University Foundation - 143,221 Accrued interest receivable 95, ,308 Contributions receivable, net 10,726,457 8,923,837 Other receivables 614, ,255 Other assets 175, ,364 Property and equipment, net 91, ,640 Total assets $ 57,102,984 $ 58,302,257 LIABILITIES Accounts payable and accrued liabilities $ 665,088 $ 523,711 Contracts payable, net 6,719,759 8,779,544 Deferred revenue 1,872,870 1,514,672 Due to Auburn University 2,943,300 2,508,750 Total liabilities 12,201,017 13,326,677 NET ASSETS Unrestricted 22,862,847 23,013,931 Temporarily restricted 14,919,083 14,989,563 Permanently restricted 7,120,037 6,972,086 Total net assets 44,901,967 44,975,580 Total liabilities and net assets $ 57,102,984 $ 58,302,257 See accompanying notes to financial statements. 28
31 AUBURN UNIVERSITY COMPONENT UNITS STATEMENTS OF ACTIVITIES AND CHANGES IN NET ASSETS FOR THE YEARS ENDED JUNE 30, 2014 AND 2013 Tigers Unlimited Foundation REVENUES AND OTHER SUPPORT Public support - contributions $ 37,870,989 $ 29,882,610 Investment income 714, ,399 Other revenues 5,823,499 4,680,650 Total operating revenues 44,408,532 35,169,659 EXPENSES AND LOSSES Program services Contributions to and support for Auburn University 17,217,019 11,212,529 Other program services 17,531,732 23,586,742 Total program services 34,748,751 34,799,271 Support services General and administrative 1,235,573 1,015,323 Fund raising 7,847,297 6,696,726 Total support services 9,082,870 7,712,049 Total expenses 43,831,621 42,511,320 Unrealized (gains) losses on investments, net (1,319,406) 418,852 Realized losses on investments, net 228 1,422 Loss on write-off of contribution receivable 1,969,702 1,303,806 Total expenses, (gains) and losses 44,482,145 44,235,400 *Change in net assets (73,613) (9,065,741) Net assets - beginning of year 44,975,580 54,041,321 Net assets - end of year $ 44,901,967 $ 44,975,580 *Change in net assets Unrestricted $ (151,084) $ (11,201,085) Temporarily restricted (70,480) 2,114,115 Permanently restricted 147,951 21,229 Total change in net assets $ (73,613) $ (9,065,741) See accompanying notes to financial statements. 29
32 AUBURN UNIVERSITY COMPONENT UNITS STATEMENTS OF FINANCIAL POSITION SEPTEMBER 30, 2014 AND 2013 Auburn Research Tigers Unlimited and Technology Foundation Foundation ASSETS Cash and cash equivalents $ 731,782 $ 596,616 Deposits 42,143 39,486 Other assets 26,886 25,846 Accounts receivable 349,836 58,091 Contributions receivable, net 1,070,336 1,127,444 Property and equipment, net 8,549,672 8,860,973 Total assets $ 10,770,655 $ 10,708,456 LIABILITIES Accounts payable $ 100,529 $ 58,707 Deferred revenue 184, ,507 Deposits held in custody 42,143 39,486 Interest payable 36,478 37,924 Note payable to Auburn University 877, ,314 Other payable to Auburn University 77,926 72,018 Total liabilities 1,319,579 1,271,956 NET ASSETS Unrestricted 8,380,699 8,309,016 Temporarily restricted 1,070,377 1,127,484 Total net assets 9,451,076 9,436,500 Total liabilities and net assets $ 10,770,655 $ 10,708,456 See accompanying notes to financial statements. 30
33 AUBURN UNIVERSITY COMPONENT UNITS STATEMENTS OF ACTIVITIES AND CHANGES IN NET ASSETS FOR THE YEARS ENDED SEPTEMBER 30, 2014 AND 2013 Auburn Research and Technology Foundation REVENUES AND OTHER SUPPORT Rental income $ 982,030 $ 681,665 Other contracts 266, ,469 Contributions 24,702 1,133,185 Total operating revenues 1,273,386 1,992,319 EXPENSES AND LOSSES Support services General and administrative 838, ,392 Amortization 65,026 28,313 Depreciation 317, ,961 Interest 37,328 38,804 Total support services 1,258,810 1,139,470 Total expenses 1,258,810 1,139,470 *Change in net assets 14, ,849 Net assets - beginning of year 9,436,500 8,583,651 Net assets - end of year $ 9,451,076 $ 9,436,500 *Change in net assets Unrestricted $ 71,683 $ 82,415 Temporarily restricted (57,107) 770,434 Total change in net assets $ 14,576 $ 852,849 See accompanying notes to financial statements. 31
34 (1) NATURE OF OPERATIONS Auburn University (the University) is a land grant university originally chartered on February 1, 1856, as the East Alabama Male College. The Federal Land Grant Act of 1862, by which the University was established as a land grant university, donated public lands to several states and territories with the intent that the states would use these properties for the benefit of agriculture and the mechanical arts. Several pertinent laws dictate specific purposes for which the land may be used. In 1960, the Alabama State Legislature officially changed the name to Auburn University. The University has two campuses, Auburn and Montgomery, with a combined enrollment of 30,969 students for Fall semester The University serves the State of Alabama, the nation and international business communities through instruction of students and the advancement of research and outreach programs. By statutory laws of the State of Alabama, the University is governed by the Board of Trustees (the Board) who are appointed by the Governor of Alabama, a committee consisting of two trustees and two Alumni Association board members and approved by the Alabama State Senate. The accompanying financial statements of the University have been prepared in accordance with accounting principles generally accepted in the United States of America, as prescribed by the Governmental Accounting Standards Board (GASB). The accompanying financial statements include the following four divisions of the University: Auburn University Main Campus Auburn University at Montgomery Alabama Agricultural Experiment Station Alabama Cooperative Extension System NOTES TO FINANCIAL STATEMENTS of such organizations would render the entity s financial statements misleading or incomplete. Auburn University Real Estate Foundation, Inc. has been consolidated into Auburn University Foundation s financial statements, as an affiliated supporting organization. The University s component units financial statements are presented following the University s statements. The component units are not GASB entities; therefore, their respective financial statements adhere to accounting principles under the Financial Accounting Standards Board (FASB) Accounting Standards Codification (ASC). Auburn University Foundation (AUF) is a qualified charitable organization established in 1960, existing solely for the purpose of receiving and administering funds for the benefit of the University. AUF is exempt from federal income taxes pursuant to Section 501(c)(3) of the Internal Revenue Code. Therefore, no provision has been made for income taxes in their financial statements. AUF s activities are governed by its own Board of Directors. Auburn Alumni Association (the Association) is an independent corporation organized on April 14, 1945, which was created to promote mutually beneficial relationships between the University and its alumni, to encourage loyalty among alumni and to undertake various other actions for the benefit of the University, its alumni and the State of Alabama. Membership is comprised of alumni, friends and students of the University. The Association is exempt from federal income taxes pursuant to Section 501(c)(3) of the Internal Revenue Code. Therefore, no provision has been made for income taxes in their financial statements. The Association s activities are governed by its own Board of Directors. The University, a publicly supported, state funded institution, is a component unit of the State of Alabama and is included in the Comprehensive Annual Financial Report of the State. However, the University is considered a separate reporting entity for financial statement purposes. The University, as a public corporation and instrumentality of the State of Alabama, is exempt from federal income taxes under Section 115 of the Internal Revenue Code. Certain transactions may be taxable as unrelated business income under Internal Revenue Code Sections 511 to 514. Contributions intended for the University s benefit are primarily received through the University's component units and are deductible by donors as provided under Section 170 of the Internal Revenue Code, consistent with the provisions under Section 501(c)(3) and corresponding state law. Component Units The University adheres to GASB Statement No. 39, Determining Whether Certain Organizations Are Component Units-an amendment of GASB Statement No. 14. This statement clarifies GASB Statement No. 14, The Financial Reporting Entity, which provides criteria for determining whether such organizations for which a government is not financially accountable should be reported as component units. In accordance with GASB Statement No. 61, The Financial Reporting Entity: Omnibus an Amendment of GASB Statements No. 14 and No. 34, the University has included statements for Auburn University Foundation, Auburn Alumni Association, Tigers Unlimited Foundation, and Auburn Research and Technology Foundation in these financial statements, as exclusion Tigers Unlimited Foundation (TUF) is an independent corporation that began operations on April 21, It was formed for the sole purpose of obtaining and disbursing funds for the University s Intercollegiate Athletics Department. Tigers Unlimited Foundation is exempt from federal taxes under Section 501(a) as an organization described in Section 501(c)(3). Therefore, no provision has been made for income taxes in their financial statements. TUF s activities are governed by its own Board of Directors with transactions being maintained using a June 30 fiscal year end date. Auburn Research and Technology Foundation (ARTF) is an independent corporation organized on August 24, 2004, to facilitate the acquisition, construction and equipping of a technology and research park on the University s campus. ARTF, created in 2004, was organized under Internal Revenue Code 509(a)(3). ARTF is exempt from federal income taxes under Section 501(c)(3) of the Internal Revenue Code. Therefore, no provision has been made for income taxes in their financial statements. ARTF s activities are governed by its own Board of Directors. Auburn University Real Estate Foundation, Inc. (AUREFI) is a qualified charitable organization created on July 5, 2005, solely for the purpose of receiving and administering real estate gifts. AUREFI was organized in 2005 under Internal Revenue Code 170(b)(1)(A)(vi). This real estate holding corporation is a tax-exempt organization under Section 501(c)(3) of the Internal Revenue Code. AUREFI is owned and controlled by AUF, and its financial statements are consolidated with AUF s financial statements. AUREFI s activities are governed by its own Board of Directors. 32
35 The financial statements of the component units have been prepared on the accrual basis of accounting. Net assets, revenues, expenses, gains, and losses are classified based on the existence or absence of donorimposed restrictions. Accordingly, net assets of the component units and changes therein are classified and reported as unrestricted, temporarily restricted, or permanently restricted. Investments in debt securities, equity securities and mutual funds with readily determinable market values are reported at their fair values based on published market prices. Contributions received, including unconditional promises to give, are recognized as revenues at their fair values in the period received. For financial reporting purposes, the component units distinguish between contributions of unrestricted assets, temporarily restricted assets, and permanently restricted assets. Contributions for which donors have imposed restrictions, which limit the use of the donated assets, are reported as restricted support if the restrictions are not met in the same reporting period. When such donor-imposed restrictions are met in subsequent reporting periods, temporarily restricted net assets are reclassified to unrestricted net assets and reported as net assets released from restrictions when the purpose or time restrictions are met. Contributions of assets which donors have stipulated must be maintained permanently, with only the income earned thereon available for current use, are classified as permanently restricted assets. Contributions for which donors have not stipulated restrictions are reported as unrestricted support. Financial statements for AUF and the Association may be obtained by writing to the applicable entity at 317 South College Street, Auburn University, AL Financial statements for TUF may be obtained by writing to Athletic Complex, 392 South Donahue Drive, Auburn University, AL Financial statements for ARTF may be obtained by writing to 570 Devall Drive, Suite 101, Auburn, AL Financial Statement Presentation For financial reporting purposes, the University adheres to the provisions of GASB Statement No. 34, Basic Financial Statements and Management s Discussion and Analysis-for State and Local Governments, GASB Statement No. 35, Basic Financial Statements and Management s Discussion and Analysis-for Public Colleges and Universities-an amendment of GASB Statement No. 34, GASB Statement No. 63, Financial Reporting of Deferred Outflows of Resources, Deferred Inflows of Resources, and Net Position and GASB Statement No. 65, Items Previously Reported as Assets and Liabilities. These statements establish standards for external financial reporting for public colleges and universities on an entity-wide perspective and require that resources be classified in three net position categories. Net investment in capital assets: This category is defined as capital assets, net of accumulated depreciation, reduced by the outstanding balances of bonds, mortgages, notes, or other borrowings that are attributable to the acquisition, construction, or improvement of those assets. Deferred inflows and outflows of resources attributable to the acquisition, construction, or improvement of those assets or related debt also would be included in this component of net position. Unexpended related debt proceeds and the related debt attributable to the unspent amount as well as deferred inflows of resources, if applicable, are not reported in net investment in capital assets, but in restricted or unrestricted net position. Restricted net position: The restricted component of net position consists of Nonexpendable and Expendable elements. Nonexpendable Nonexpendable restricted net position is the net amount of the assets, deferred outflows of resources, liabilities and deferred-inflows of resources subject to externally imposed stipulations that they be maintained permanently by the University. This element includes the University s permanent endowment funds. Expendable Expendable restricted net position is the net amount of the assets, deferred outflows of resources, liabilities and deferred inflows of resources whose use by the University is subject to externally imposed stipulations that can be fulfilled by actions of the University pursuant to those stipulations, or that expire by the passage of time. Unrestricted net position: This category is defined as the net amount of the assets, deferred outflows of resources, liabilities, and deferred inflows of resources that are not subject to externally imposed stipulations or included in the determination of net investment in capital assets. Unrestricted net position may be designated for specific purposes by action of management or the Board. Substantially all unrestricted net position is designated for academic and research programs and initiatives, capital projects, and auxiliary units. GASB Statements No. 35 and No. 63 also require three statements: the Statement of Net Position; the Statement of Revenues, Expenses and Changes in Net Position; and the Statement of Cash Flows. Basis of Accounting The financial statements of the University have been prepared on the accrual basis of accounting and in accordance with accounting standards of the United States of America, and all significant interdivisional transactions between auxiliary units and other funds have been eliminated. The University reports as a Business Type Activity (BTA) as defined by GASB Statement No. 35. BTAs are those institutions that are financed in whole or in part by fees charged to external parties for goods or services. Under BTA reporting, it is required that statements be prepared using the economic resources measurement focus. GASB Statement No. 35 requires the recording of depreciation on capital assets, accrual or deferral of revenue associated with certain grants and contracts, accrual of interest expense, accounting for certain scholarship allowances as a reduction of revenue, classification of federal refundable loans as a liability, and capitalization and depreciation of equipment with a sponsor reversionary interest. Use of Estimates The preparation of financial statements in conformity with accounting principles generally accepted in the United States of America requires management to make estimates and assumptions that affect the reported amounts of assets and liabilities and disclosure of contingent liabilities at the date of the financial statements and the reported amounts of revenues and expenses during the reporting period. Actual results could differ from those estimates. 33
36 Revision of Previously Issued Financial Statements The University identified an error in the 2013 calculation for tuition discounting. The original calculation overstated the scholarship allowance amount, and as a result, Tuition & fees revenues, net were understated by $3,973,094, Auxiliary revenues, net were understated by $259,078, and Scholarships & fellowships expense was understated by $4,232,172. In addition, the University identified one other immaterial error in the 2013 Statement of Revenues, Expenses, and Changes in Net Position. All of the identified errors resulted in misclassifications on the 2013 Statement of Revenues, Expenses and Changes in Net Position and had no impact on the previously reported Operating loss or Net increase in net position. In addition, these errors had no impact on the previously issued 2013 Statement of Net Position or Statement of Cash Flows. Accordingly, management has corrected these errors by increasing the aforementioned financial statement line items by the amounts disclosed above and by correcting the other immaterial errors. (2) SIGNIFICANT ACCOUNTING POLICIES OF AUBURN UNIVERSITY Cash & Cash Equivalents Cash and cash equivalents are defined as highly liquid debt instruments readily convertible into cash and with maturities at date of acquisition of three months or less, whose use is not restricted for long term purposes. Investments Investments in equity securities, mutual funds, common trust funds, business trust funds, cash value of life insurance, and debt securities are reported at fair value in the Statement of Net Position, with all net realized and unrealized gains and losses reflected in the Statement of Revenues, Expenses and Changes in Net Position. Fair value of these investments is based on quoted market prices or dealer quotes where available. represent funds that are considered by management to be of long duration. Investments received by gift are recorded at fair value on the date of receipt. Investments in real estate are recorded at fair value. For investments other than non-readily marketable investments, investment income is recorded on the accrual basis of accounting. Inventories Units currently holding inventories include Facilities, Scientific Supply Store, Chemistry Glass Shop, Animal Clinic Pharmacy, Alabama Agricultural Experiment Station, Bookstores, Museum Gift Shop, Copycat Duplicating Service, and Ralph Draughon and AUM Libraries. All inventories are valued at the lower of cost or market, on the first-in, first-out basis, and are considered to be current assets. Capital Assets Capital expenditures and gifts of land, buildings, and equipment are carried at cost at date of acquisition or, in the case of gifts, at fair value at the date of donation. Depreciation is computed on a straight line basis over the estimated useful lives of buildings and building improvements (40 years), land improvements and infrastructure (10 40 years), library collection and software costs (10 years) and inventoried equipment (5 18 years). Land and construction in progress are not depreciated. The threshold for capitalizing buildings and infrastructure is $25,000. Expenditures for maintenance, repairs, and minor renewals and replacements are expensed as incurred; major renewals and replacements are capitalized if they meet the $25,000 threshold. Construction in progress expense is capitalized as incurred. Interest expense related to construction is capitalized net of interest income earned on bond proceeds. Equipment is capitalized if the cost exceeds $5,000 and it has a useful life of more than one year. All buildings are insured through the State of Alabama Property Insurance Fund. Under GASB Statement No. 31, Accounting and Financial Reporting for Certain Investments and for External Investment Pools, the University records its initial investment and subsequent contributions in non-readily marketable investments at cost with no adjustments for its share of income/appreciation and losses/depreciation received from the investment (see Note 4). The University performs periodic evaluations in which these investments are monitored for impairment. The University did not incur any material losses related to investment impairment during fiscal years 2014 or Under GASB Statement No. 40, Deposit and Investment Risk Disclosures-an amendment of GASB Statement No. 3, common deposit and investment risks related to credit risk, concentration of credit risk, interest rate risk, and foreign currency risk are addressed. This statement defines custodial risk for deposits as the risk that, in the event of a failure of a depository financial institution, a government will not be able to recover deposits or will not be able to recover collateral securities that are in the possession of an outside party. As an element of interest rate risk, this statement requires certain disclosures of investments that have fair values which are highly sensitive to changes in interest rates. Deposit and investment policies related to the risks identified in this statement are also required to be disclosed (see Note 4). Operating investments consist of cash and investments designated for current operations. Investments for capital and student loan activities represent funds that are intended to be used for the related specific activities. Investments recorded as endowment and life income Art collections and historical treasures are capitalized and valued at cost or fair value at the date of purchase or gift, respectively, but not depreciated. Collections are preserved and held for public exhibition, education and research. In accordance with GASB Statement No. 42, Accounting and Financial Reporting for Impairment of Capital Assets and for Insurance Recoveries, the University continues to evaluate prominent events or changes in circumstance to determine whether an impairment loss should be recorded and whether any insurance recoveries should be offset against the impairment loss. The University did not incur any losses related to capital asset impairment during fiscal year 2014 or Unearned Revenues Unearned revenues include funds received in advance of an event, such as tuition and fees and advance ticket sales for athletic events. Net student tuition and fee revenues and housing revenues for the fall semester are recognized in the fiscal year in which the related revenues are earned. Ticket sale revenues for athletic events are recognized as the related games are played. Unearned revenues also consist of amounts received from grant and contract sponsors that have not yet been earned under the terms of the agreements. Amounts received from grant sponsors for which the only unmet term of the agreement is timing (i.e. funds may not be spent until a certain date) are classified as deferred inflows of resources in accordance with GASB Statement No. 65. All other unearned revenue is classified as a current liability (see Note 13). 34
37 Classification of Revenues The University has classified its revenues as either operating or nonoperating according to the following criteria: as a current liability. Since this amount cannot be known precisely in advance, the current liability is estimated, based on a three year average cost of annual and sick leave taken by eligible employees. Operating Revenues: Operating revenues include activities that have the characteristics of exchange transactions, such as (1) student tuition and fees, net of scholarship discounts and allowances, (2) sales and services of auxiliary enterprises, net of scholarship discounts and allowances, (3) most federal, state, local, private grants and contracts, and federal appropriations, and (4) interest on institutional student loans. Nonoperating Revenues: Nonoperating revenues include activities that have the characteristics of nonexchange transactions, such as gifts and contributions, and other revenue sources that are defined as nonoperating revenues. In accordance with GASB Statement No. 35, certain significant revenues on which the University relies to support its operational mission are required to be recorded as nonoperating revenues. These revenues include state appropriations, private gifts, federal Pell grants, and investment income, including realized and unrealized gains and losses on investments. Student Tuition, Fees and Scholarship Discounts and Allowances Student tuition and fee revenues and certain other revenues from students are reported net of scholarship discounts and allowances in the Statement of Revenues, Expenses and Changes in Net Position. Scholarship discounts and allowances represent the difference between the stated charge for goods and services provided by the University and the amount that is paid by students and/or third parties making payments on the students behalf. Scholarship allowance to students is reported using the alternative method as prescribed by the National Association of College and University Business Officers (NACUBO). The alternative method is an algorithm that computes scholarship allowance on a university-wide basis rather than on an individual student basis. Auxiliary Enterprises Revenues Sales and services of auxiliary enterprises primarily consist of revenues generated by athletics, bookstores, housing, printing, and telecommunications, which are substantially self supporting activities that primarily provide services to students, faculty, administrative and professional employees, and staff. Grants and Contracts Revenues The University receives sponsored funding from governmental and private sources. Revenues from these projects are recognized in accordance with GASB Statement No. 33, Accounting and Financial Reporting for Nonexchange Transactions, based on the terms of the individual grant or contract. Pell grants are recorded as nonoperating revenues in the accompanying Statements of Revenues, Expenses, and Changes in Net Position. Compensated Absences The University reports employees accrued annual leave and sick leave at varying rates depending upon employee classification and length of service, subject to maximum limitations. Upon termination of employment, employees are paid all unused accrued vacation at their regular rates of pay up to a designated maximum number of days. GASB Statement No. 35 requires the amount of compensated absences that are due within one year of the fiscal year end to be classified Donor Pledges The University normally does not receive gift pledges. Pledged revenue representing unconditional promises to give is normally received by AUF or TUF and later disbursed in accordance with the donors wishes for the benefit of the University. Pledges are recorded at their gross, undiscounted amounts. (3) CASH AND CASH EQUIVALENTS Cash consists of petty cash funds and demand deposits held in the name of the University. The Board approves all banks or other institutions as depositories for University funds. GASB Statement No. 40, Deposit and Investment Risk Disclosures-an amendment of GASB Statement No. 3, defines custodial risk for deposits as the risk that, in the event of a failure of a depository financial institution, a government will not be able to recover deposits or will not be able to recover securities which are in the possession of an outside party. Effective January 1, 2001, any depository of University funds must provide annual evidence of its continuing designation as a qualified public depository under the Security for Alabama Fund Enhancement Act (SAFE). The enactment of the SAFE program changed the way all Alabama public deposits are collateralized. In the past, the bank pledged collateral directly to each individual public entity. Under the mandatory SAFE program, each qualified public depository (QPD) is required to hold collateral for all its public deposits on a pooled basis in a custody account established for the State Treasurer as SAFE administrator. In the unlikely event a public entity should suffer a loss due to QPD insolvency or default, a claim form would be filed with the State Treasurer who would use the SAFE pool collateral or other means to reimburse the loss. As a result, the University believes its custodial risk related to cash is remote. In addition, the standard Federal Deposit Insurance Corporation (FDIC) coverage is $250,000 per depositor, per insured bank, for each account ownership category. Cash equivalents may consist of commercial paper, repurchase agreements, banker s acceptances, and money market accounts purchased with maturities at date of acquisition of three months or less. (4) INVESTMENTS The Board is authorized to invest all available cash and is responsible for the management of the University s investments. The endowment funds and the cash pool assets are invested in accordance with policies established by the Board. The Board has engaged a custodian and professional investment managers to manage the investment of the endowment funds while maintaining centralized management of the cash pool. The University periodically monitors these investments. Preservation of capital is regarded as the highest priority in the investing of the cash pool. It is assumed that all investments will be suitable to be held to maturity. The University s investment portfolio is structured in such a manner to help ensure sufficient liquidity to pay obligations as they become due. The portfolio strives to provide a stable return consistent with investment policy. The Cash Pool Investment Policy authorizes investments in the following: money market accounts, repurchase and reverse repurchase agreements, banker s acceptances, commercial paper, certificates of deposit, municipals, U.S. Treasury obligations, U.S. Agency securities and mortgage-backed securities. 35
38 Bond proceeds are invested in accordance with the underlying bond agreements. The University s bond agreements generally permit bond proceeds and debt service funds to be invested in obligations in accordance with University policy in terms maturing on or before the date funds are expected to be required for expenditures or withdrawal. Certain bond indentures require the University to invest amounts held in certain construction funds, redemption funds and bond funds in federal securities or state, local and government series (SLGS) securities. Diversification through asset allocation is utilized as a fundamental risk strategy for endowed funds. These strategic allocations represent a blend of assets best suited, over the long term, to achieve maximum returns without violating the risk parameters established by the Board. The Endowment Investment Policy, approved April 11, 2014, authorizes investment of the endowment portfolio to include the following: cash and cash equivalents, global fixed income, global equity securities, global private capital, absolute return/hedge funds, and real estate assets, collectively referred to as the endowment pool. The Alabama Uniform Prudent Management of Institutional Funds Act (UPMIFA) has been enacted by the Legislature of the State of Alabama and signed into law effective January 1, Among its changes, UPMIFA prescribes new guidelines for expenditure of a donor-restricted endowment fund (in the absence of overriding, explicit donor stipulations). Its predecessor, the Uniform Management of Institutional Funds Act (UMIFA), focused on the prudent spending of the net appreciation of the fund. UPMIFA instead, focuses on the entirety of a donor-restricted endowment fund, that is, both the original gift amount(s) and net appreciation. UPMIFA eliminates UMIFA s historic dollar value-threshold, an amount below which an organization could not spend from the fund, in favor of a more robust set of guidelines about what constitutes prudent spending, explicitly requiring consideration of the duration and preservation of the fund. The earnings distributions are appropriated for expenditure by the Board in a manner consistent with the standard of prudence prescribed by UPMIFA. In order to conform to the standards for prudent fiduciary management of investments, the Board has adopted a spending plan whose long term objective is to maintain the purchasing power of each endowment and provide a predictable and sustainable level of income to support current operations. In the policy approved on April 11, 2014, spending for a given year equals 80% of spending in the previous year, adjusted for inflation (Consumer Price Index (CPI) within a range of 0.0% and 6.0%), plus 20% of the long-term spending rate (4.0%) applied to the twelve-month rolling average of the market values. Under previous approved policies, spending was calculated using different formulas. The net appreciation on endowments and funds functioning as endowments available for authorization for expenditure by the Board amounted to $30,497,147 and $27,353,552 at September 30, 2014 and 2013, respectively, and are recorded as restricted expendable net position. Investment Risks Investments are subject to certain types of risks, including interest rate risk, custodial credit risk, credit quality risk, concentration of credit risk, and foreign currency risk. The following describes those risks: Interest Rate Risk Interest rate or market risk is the potential for changes in the value of financial instruments due to interest rate changes in the market. Certain fixed maturity investments contain call provisions that could result in shorter maturity periods. As previously stated, it is the University s intent to hold all investments in the Cash Pool until maturity. The Board understands that in order to achieve its objectives, investments can experience fluctuations in fair value. Both the Endowment Investment Policy and the Non-Endowment Cash Pool Investment Policy set forth allowable investments and allocations. The following segmented time distribution tables provide information as of September 30, 2014 and 2013, covering the fair value of investments by investment type and related maturity: Auburn University Investments Investment Maturities at Fair Value (in Years) September 30, 2014 Type of Investments < 1 year 1-5 years 6-10 years > 10 years Total Fair Value 36 Fixed Maturity Certificates of Deposit $ - $ 701,842 $ - $ - $ 701,842 U.S. Treasury Obligations 29,440,652 86,260,207 11,751, ,452,697 U.S. Agency Securities 3,733, ,343, ,917,904 44,688, ,683,130 Mortgage Backed Securities - 1,719,046 7,300,256 14,220,481 23,239,783 Municipals - 402,568 1,017,969-1,420,537 $ 33,174,304 $ 465,426,756 $ 124,987,967 $ 58,908,962 $ 682,497,989 Domestic Equities 1,319,513 Alternative Investments at cost: Hedge Funds 49,289,826 Private Capital 14,188,576 Real Assets 22,256,369 Real Estate 740,750 Mutual Funds 106,083,788 Other 4,214,711 Money Market 146,603,997 Total investments 1,027,195,519 Less cash equivalents held in cash pool (137,750,000) Operating and noncurrent investments $ 889,445,519
39 Auburn University Investments Investment Maturities at Fair Value (in Years) September 30, 2013 Type of Investments < 1 year 1-5 years 6-10 years > 10 years Total Fair Value Fixed Maturity Certificates of Deposit $ - $ 709,668 $ - $ - $ 709,668 U.S. Treasury Obligations 31,473,698 67,812,643 34,430, ,716,806 U.S. Agency Securities 17,302, ,813, ,955,643 52,159, ,230,894 Mortgage Backed Securities - 3,039,442 13,442,648 22,176,896 38,658,986 Municipals - 395, ,468-1,386,036 $ 48,775,782 $ 330,771,099 $ 256,819,224 $ 74,336,285 $ 710,702,390 Domestic Equities 1,106,576 Alternative Investments at cost: Hedge Funds 46,800,191 Private Capital 12,849,926 Real Assets 21,104,614 Real Estate 740,750 Mutual Funds 101,534,844 Other 3,878,734 Money Market 77,781,273 Total investments 976,499,298 Less cash equivalents held in cash pool (67,950,000) Operating and noncurrent investments $ 908,549,298 Custodial Credit Risk GASB Statement No. 40 defines investment custodial risk as the risk that, in the event of the failure of the counterparty to a transaction, a government will not be able to recover the value of investment or collateral securities that are in the possession of an outside party. Although no formal policy has been adopted, the University requires its safekeeping agents to hold all securities in the University s name for both the Cash Pool and the Endowment Pool. Certain limited partnership investments in Private Capital and Real Assets represent ownership interests that do not exist in physical or bookentry form. As a result, custodial credit risk is remote. Credit Quality Risk GASB Statement No. 40 defines credit quality risk as the risk that an issuer or other counterparty to an investment will not fulfill its obligations as they become due. The University s Non-Endowment Cash Pool Investment Policy stipulates that commercial paper be rated at least P1 by Moody s or A1 by Standard & Poor s or a comparable rating by another nationally recognized rating agency. Banker s acceptances should hold a long-term debt rating of at least AA or short term debt rating of AAA (or comparable ratings) as provided by one of the nationally recognized rating agencies. The following table provides information as of September 30, 2014 and 2013, concerning credit quality risk: Moody s Rating Fair Value Auburn University Investments Ratings of Fixed Maturities Fair Value as a % of Total Fixed Maturity Fair Value Fair Value Fair value as a % of Total Fixed Maturity Fair Value US Treasury $ 127,452, % $ 133,716, % Aaa 552,922, % 574,889, % Aa 1,420, % 1,386, % Not rated* 701, % 709, % $ 682,497, % $ 710,702, % *Certificates of deposit and repurchase agreements are included in the Not rated category. 37
40 Concentration of Credit Risk GASB Statement No. 40 defines concentration of credit risk as the risk of loss attributed to the magnitude of a government s investment in a single issuer. The University Non-Endowment Cash Pool Investment Policy does not limit the aggregate amounts that can be invested in U.S. Treasury securities with the explicit guarantee of the U.S. Government or U.S. Agency securities that carry the implicit guarantee of the U.S. Government. As of September 30, 2014 and 2013, the University Cash Pool and the University Endowment Pool were in compliance with their respective policies. The University Endowment Investment Policy provides for diversification by identifying asset allocation classes and ranges to provide reasonable assurance that no single security, or class of securities, will have a disproportionate impact on the performance of the total Endowment Pool. Foreign Currency Risk GASB Statement No. 40 defines foreign currency risk as the risk that changes in exchange rates will adversely affect the fair value of an investment or a deposit. No formal University policy has been adopted addressing foreign currency risk. As of September 30, 2014 and 2013, the University held no investments in foreign currency. Securities Lending Program As of September 30, 2014 and 2013, there was no participation in any securities lending program. Interest Sensitive Securities As of September 30, 2014 and 2013, the University held $23,239,783 and $38,658,986, representing 2.3% and 4.0%, respectively, of its total investments in mortgage-backed securities. As of September 30, 2014 and 2013, the University held no investments in asset-backed securities. The mortgage-backed and asset-backed investments have embedded prepayment options that are expected to fluctuate with interest rate changes. Generally, this variance presents itself in variable repayment amounts, uncertain early or extended payments. Certain fixed maturity investments have call provisions that could result in shorter maturity periods. However, it is the intent that the University s Cash Pool fixed maturity investments be held to maturity; therefore, the fixed maturity investments are classified in the above table as if they were held to maturity. As of September 30, 2014 and 2013, the University Cash Pool held $36,336,000 and $40,981,220, representing 3.5%, and 4.2%, respectively, of total investments in continuously callable fixed maturity investments. The University investment policies do not restrict the purchase of mortgage-backed securities, asset-backed securities, or bonds with call provisions. The University owns shares in nine mutual funds and four business trust funds. These funds are invested in global marketable securities, commodities and global debt securities. The University owns an interest in a corporation and limited partnership interests in several non-registered investment partnerships. The goal of the corporation and limited partnerships is to invest in readily marketable securities, privately held companies and properties within different industry sectors. At investment inception, the University enters into a separate subscription agreement with a capital commitment to each corporation or limited partnership. The University has entered into separate subscription agreements with a capital commitment to each alternative investment that expire periodically in the future. The following information pertains to alternative investment capital commitments at September 30, 2014 and 2013: 2014 Unfunded Commitment by Commitment Expiration Type of Alternative Investment Number of Commitments Original Commitments Capital Contributions < 1 Year 1-5 years 6-10 years >10 years Total Unfunded Commitment Hedge Funds 10 $ 49,250,000 $ 49,250,000 $ - $ - $ - $ - $ - Private Capital 14 33,050,000 24,500,571 65,385 1,543,453 2,284,837 4,655,754 8,549,429 Real Assets 13 42,975,000 36,512,574-2,190,378 2,744,988 1,527,060 6,462, $ 125,275,000 $ 110,263,145 $ 65,385 $ 3,733,831 $ 5,029,825 $ 6,182,814 $ 15,011,855 Type of Alternative Investment Number of Commitments Original Commitments Capital Contributions 2013 Unfunded Commitment by Commitment Expiration < 1 Year 1-5 years 6-10 years >10 years Total Unfunded Commitment Hedge Funds 9 $ 47,750,000 $ 47,750,000 $ - $ - $ - $ - $ - Private Capital 12 28,250,000 20,037,628-2,657,317 1,976,321 3,578,734 8,212,372 Real Assets 12 45,800,000 35,762,472-2,264,031 5,749,909 2,023,588 10,037, $ 121,800,000 $ 103,550,100 $ - $ 4,921,348 $ 7,726,230 $ 5,602,322 $ 18,249,900 38
41 Unfunded commitments presented in the tables above are intended to reflect the time of expiration of the commitment, not the timing of future capital calls by the investment. The hedge funds are primarily invested in long/short-term equities, fixed income arbitrage, merger arbitrage, and other event driven strategies through various investment managers, investment partnerships, and offshore funds. The private capital fund commitments are investments in privately held companies in various industries, including alternative fuel technology. The real asset funds include investments in commercial real estate, residential real estate, and oil and gas production. As of September 30, 2014 and 2013, the University s limited partnership investments are carried at cost. As required by GASB Statement No. 31, no adjustment was recorded to recognize net unrealized gains and losses. Limited partnership investments are made in accordance with the University s investment policy, which approves the allocation of funds to various assets classes (i.e., global equity, private capital, hedge funds, real assets, global fixed income, and cash) in order to ensure the proper level of diversification within the endowment pool. The limited partnerships (private equity, hedge funds, and real assets) enhance diversification and provide reductions in overall portfolio volatility. On September 30, 2014 and 2013, the University was not a party in any swap or other derivative contracts. The table entitled, Auburn University Investments, Investment Maturities at Fair Value (in Years), includes funds held for pending capital expenditures at September 30, 2014, as follows: $4,392,146, 2006 General Fee Bond proceeds; $5,287,720, 2011 General Fee Bond proceeds; $300,000, 2012A General Fee Bond proceeds; and $28,023,166, Deferred Maintenance Building Fund. The General Liability Account holds investments of $5,735,301. At September 30, 2013, funds held for pending capital expenditures were as follows: $6,176,976, 2006 General Fee Bond proceeds; $15,562,174, 2011 General Fee Bond proceeds; $3,995,414, 2012A General Fee Bond proceeds; and $53,367,625, Deferred Maintenance Building Fund. The General Liability Account holds investments of $5,728,852. AUF holds endowments and distributes earnings from those endowments to the University. AUF investments at September 30, 2014 and 2013, include the following: Fair Value Cost Fair Value Cost Cash and pooled investments $ 6,678,108 $ 6,678,108 $ 8,362,274 $ 8,362,274 Government bonds, notes and other securities 29,375,822 25,933,035 22,324,015 19,365,409 Corporate stocks 1,887,652 1,006,000 1,582, ,666 Mutual funds, business trust funds and common trust funds 183,034, ,982, ,040, ,809,806 Hedge funds 122,277,034 83,476, ,918,600 75,274,504 Private equity funds 34,106,675 26,055,081 26,891,437 23,013,712 Real asset investment funds 40,686,070 37,934,948 34,251,354 34,077,938 Total investments $ 418,046,081 $ 334,065,905 $ 366,370,535 $ 301,679,309 AUF owns shares in six mutual funds and four business trust funds. These funds are invested in global marketable securities, commodities, and global debt securities. AUF owns an interest in a corporation and limited partnership interests of which the goal is to invest in readily marketable securities, privately held companies, and properties within different industry sectors. At investment inception, AUF enters into a separate subscription agreement with a capital commitment to each corporation or limited partnership. As of September 30, 2014, AUF had entered into subscription agreements with one corporate and thirty-nine limited partnership investments. The aggregate amount of capital committed to these investments is $187,662,200 of which capital contributions of $163,316,398 have been invested. A net unrealized gain of $50,681,563 has been recorded on these investments. Of these thirty-nine commitments, eleven subscriptions relate to hedge funds, sixteen subscriptions relate to private equity funds, and twelve subscriptions relate to real estate asset funds. The hedge funds are primarily invested in long/short equities, fixed-income arbitrage, merger arbitrage, and other event-driven strategies through various investment managers, investment partnerships, and offshore funds. The private equity fund commitments are for investments in privately held companies in various industries, including alternative fuel technology. The real assets funds include investments in commercial real estate, residential real estate, and oil and gas production. Investment income, realized gains and losses, unrealized gains and losses, and changes in values of split-interest agreements are reported on AUF s Consolidated Statements of Activities and Changes in Net Assets net of estimated investment expenses of $3,993,000 and $3,474,000 for the fiscal years ended September 30, 2014 and 2013, respectively. AUF carries its limited partnership investments at fair value. This differs from how the University carries these investments, which is at cost, in accordance with GASB requirements. AUF believes that the carrying amount of its limited partnership investments is a reasonable estimate of fair value as of September 30, Because limited partnership investments are not readily marketable, the estimated value is subject to uncertainty and, therefore, may differ from the value that would have been used had a ready market for the investments existed and such difference could be material. Limited partnership investments are 39
42 made in accordance with AUF s investment policy that approves the allocation of funds to various assets classes (i.e., global equity, private capital, hedge funds, real assets, global fixed income, and cash) in order to ensure the proper level of diversification within the endowment pool. Investments in limited partnerships (private equity, hedge funds, and real assets) are designed to enhance diversification and provide reductions in overall portfolio volatility. These fair values are estimated by the general partner of each limited partnership using various valuation techniques. The fair values of these investments at September 30, 2014 and 2013, were $197,069,779 and $168,061,391, respectively. (5) FUNDS HELD IN TRUST In addition to permanently restricted endowments carried on the University s financial statements, the University is the beneficiary of income earned on a number of AUF endowments. The cost of these funds was $298,979,591 and $268,373,168 and the market value was $378,993,254 and $330,124,702 at September 30, 2014 and 2013, respectively. The portion of endowment income received by the University from these funds was $10,607,752 and $9,243,002 for the fiscal years ended September 30, 2014 and 2013, respectively. Endowment earnings are distributed annually in January, based on the AUF endowment distribution spending rate. These amounts are reported as investment income on the Statement of Revenues, Expenses and Changes in Net Position. In addition, the University has been named as a beneficiary of a foundation with investments having a cost of $2,409,462 and $2,305,701 and a market value of $3,555,272 and $3,308,192 at September 30, 2014 and 2013, respectively. The University is the beneficiary of the income earned on two additional trusts. The cost of investments held by these trusts was $753,000 as of September 30, 2014 and The income received from the two trusts was $69,373 and $70,177 for the fiscal years ended September 30, 2014 and 2013, respectively. (6) ACCOUNTS RECEIVABLE Accounts receivable and the allowances for doubtful accounts at September 30, 2014 and 2013, are summarized as follows: NONSTUDENT ACCOUNTS RECEIVABLE Federal, state & local government, and other restricted expendable $ 23,135,440 $ 31,621,335 Less allowance for doubtful accounts (2,218,796) (2,397,992) Pledged receivables 575, ,519 General 16,049,290 16,090,078 Less allowance for doubtful accounts (13,764,142) (13,355,752) Auxiliary 11,190,244 9,190,418 Capital gifts and grants 2,327,086 5,593,972 Total nonstudent accounts receivable $ 37,295,056 $ 47,339, STUDENT ACCOUNTS RECEIVABLE Unrestricted general $ 35,196,598 $ 32,962,275 Less allowance for doubtful accounts (688,433) (496,853) Unrestricted auxiliary 3,079,458 2,148,652 Less allowance for doubtful accounts (240,961) (253,898) Total student accounts receivable $ 37,346,662 $ 34,360,176 40

43 41
44 (7) CAPITAL ASSETS Capital assets at September 30, 2014 and 2013, are summarized as follows (dollars in thousands): September 30, 2013 Additions/Transfers Deletions/Transfers September 30, 2014 Capital assets not being depreciated Land $ 18,243 $ 280 $ (338) $ 18,185 Art & collectibles 9, (52) 9,938 Construction in progress 84,631 79,923 (145,838) 18,716 Livestock 1, (135) 2,245 Total capital assets not being depreciated 114,145 81,302 (146,363) 49,084 Capital assets being depreciated Land improvements 107,095 2, ,634 Buildings 1,515, ,061-1,632,084 Equipment 240,506 14,603 (16,347) 238,762 Infrastructure 192,527 11, ,481 Library books 169,646 7,056 (575) 176,127 Software system implementation 14, ,448 Total capital assets being depreciated 2,239, ,213 (16,922) 2,375,536 Less accumulated depreciation for Land improvements 38,234 6,979-45,213 Buildings 399,892 34, ,573 Equipment 166,739 15,138 (14,897) 166,980 Infrastructure 63,949 7,164-71,113 Library books 140,006 6,389 (574) 145,821 Software system implementation 9,331 1,445-10,776 Total accumulated depreciation 818,151 71,796 (15,471) 874,476 Total capital assets being depreciated, net 1,421,094 81,417 (1,451) 1,501,060 Capital assets, net $ 1,535,239 $ 162,719 $ (147,814) $ 1,550,144 42
45 Capital assets at September 30, 2013 and 2012, are summarized as follows (dollars in thousands): September 30, 2012 Additions/Transfers Deletions/Transfers September 30, 2013 Capital assets not being depreciated Land $ 16,983 $ 1,260 $ - $ 18,243 Art & collectibles 8, ,334 Construction in progress 184, ,586 (305,310) 84,631 Livestock 2, (209) 1,937 Total capital assets not being depreciated 212, ,305 (305,519) 114,145 Capital assets being depreciated Land improvements 90,792 16, ,095 Buildings 1,265, ,083 (511) 1,515,023 Equipment 228,427 15,342 (3,263) 240,506 Infrastructure 178,819 13,742 (34) 192,527 Library books 163,316 7,201 (871) 169,646 Software system implementation 14, ,448 Total capital assets being depreciated 1,941, ,671 (4,679) 2,239,245 Less accumulated depreciation for Land improvements 32,092 6,142-38,234 Buildings 371,636 28,730 (474) 399,892 Equipment 152,891 16,938 (3,090) 166,739 Infrastructure 57,410 6,541 (2) 63,949 Library books 134,609 6,269 (872) 140,006 Software system implementation 7,886 1,445-9,331 Total accumulated depreciation 756,524 66,065 (4,438) 818,151 Total capital assets being depreciated, net 1,184, ,606 (241) 1,421,094 Capital assets, net $ 1,397,088 $ 443,911 $ (305,760) $ 1,535,239 During the fiscal years ended September 30, 2014 and 2013, approximately $17,000 and $114,000, respectively, was received from the State of Alabama to fund construction. These revenues are classified as capital appropriations on the Statement of Revenues, Expenses and Changes in Net Position. (8) DEFERRED OUTFLOWS OF RESOURCES Deferred outflows of resources are a consumption of net assets that are applicable to a future reporting period. In fiscal years 2010, 2012, and 2014, the University defeased certain outstanding bonds. These refundings resulted in a loss (the difference between the acquisition price of the new debt and the net carrying amount of the old debt). In accordance with GASB Statements No. 63 and No. 65, this loss is presented as a deferred outflow of resources that is amortized over the life of the old or new bonds, whichever is shorter. The University is amortizing each of the deferred losses presented below over the life of the defeased bonds. The components of deferred outflows of resources are summarized below: September 30, 2014 September 30, 2013 Loss on refunding 2009 General Fee refunding $ 2,775,220 $ 3,274, A General Fee refunding 6,150,409 7,260, B General Fee refunding 331, , A General Fee refunding 5,185,344 - $ 14,442,185 $ 10,911,474 43
46 (9) LONG-TERM DEBT Bonds, notes and lease obligations are collateralized by certain real estate, equipment and pledged revenues (See Note 10). Balance at Principal Balance at Bonds and notes payable September 30, 2013 New Debt Repayment September 30, Auburn University at Montgomery Dormitory Revenue Bonds, $3,279,000 face value, 3.0%, due annually through 2018, a reserve of $146,563 and a $138,501 contingency fund. $ 790,000 $ - $ (125,000) $ 665, A Athletic Revenue Bonds, $24,412,607 face value, 2.125% to 5.49%, due annually through ,788,791 - (2,117,349) 11,671, General Fee Revenue Bonds, $76,875,000 face value, 3.0% to 5.25%, due annually through ,800,000 - (1,800,000) A Athletic Revenue Bonds, $24,860,000 face value, 2.0% to 5.0%, due annually through ,000 - (670,000) A General Fee Revenue Bonds, $60,000,000 face value, 3.5% to 5.0%, due annually through ,435,000 - (39,985,000) 13,450, A General Fee Revenue Bonds, $162,530,000 face value, 3.6% to 5.0%, due annually from 2015 through 2022 and annually from 2028 through ,170,000 - (29,725,000) 129,445, B General Fee Revenue Bonds, $14,465,000 face value, 4.625% to 5.125%, due annually through ,175,000 - (3,175,000) General Fee Revenue Bonds, $92,500,000 face value, 3.0% to 5.0%, due annually through ,310,000 - (1,965,000) 83,345, General Fee Revenue Bonds, $79,500,000 face value, 2.0% to 5.0%, due annually through ,790,000 - (2,820,000) 69,970, A General Fee Revenue Bonds, $226,035,000 face value, 4.0% to 5.0%, due annually from 2015 through ,035, ,035, A General Fee Revenue Bonds, $120,135,000 face value, 2.0% to 5.0%, due annually from through ,410,000 - (4,560,000) 110,850, B General Fee Revenue Bonds, $3,505,000 face value, 2.9%, due annually through ,445,000 - (60,000) 3,385, A General Fee Revenue Bonds, $66,415,000 face value, 2.0% to 5.0%, due annually from 2015 through ,415,000-66,415,000 Total bonds payable 735,818,791 66,415,000 (87,002,349) 715,231,442 Plus unamortized bond premium 26,124,255 8,931,556 (5,483,470) 29,572,341 Less unamortized bond discount (8,169) - 8, ,934,877 $ 75,346,556 $ (92,477,650) 744,803,783 Less: current portion Bonds payable (19,302,349) (24,663,361) Unamortized bond premium (3,385,117) (3,951,840) Unamortized bond discount 8,169 - Total noncurrent bonds and notes payable $ 739,255,580 $ 716,188,582 44
47 Balance at Principal Balance at Bonds and notes payable September 30, 2012 New Debt Repayment September 30, Auburn University at Montgomery Dormitory Revenue Bonds, $3,279,000 face value, 3.0%, due annually through 2018, a reserve of $146,538 and a $138,389 contingency fund. $ 910,000 $ - $ (120,000) $ 790, A Athletic Revenue Bonds, $24,412,607 face value, 2.125% to 5.49%, due annually through ,039,329 - (2,250,538) 13,788, General Fee Revenue Bonds, $76,875,000 face value, 3.0% to 5.25%, due annually through ,515,000 - (1,715,000) 1,800, A Athletic Revenue Bonds, $24,860,000 face value, 2.0% to 5.0%, due annually through ,320,000 - (650,000) 670, A General Fee Revenue Bonds, $60,000,000 face value, 3.5% to 5.0%, due annually through ,630,000 - (1,195,000) 53,435, A General Fee Revenue Bonds, $162,530,000 face value, 3.6% to 5.0%, due annually through ,895,000 - (725,000) 159,170, B General Fee Revenue Bonds, $14,465,000 face value, 4.625% to 5.125%, due annually through ,200,000 - (3,025,000) 3,175, General Fee Revenue Bonds, $92,500,000 face value, 3.0% to 5.0%, due annually through ,185,000 - (1,875,000) 85,310, General Fee Revenue Bonds, $79,500,000 face value, 2.0% to 5.0%, due annually through ,525,000 - (2,735,000) 72,790, A General Fee Revenue Bonds, $226,035,000 face value, 4.0% to 5.0%, due annually from 2015 through ,035, ,035, A General Fee Revenue Bonds, $120,135,000 face value, 2.0% to 5.0%, due annually through ,135,000 - (4,725,000) 115,410, B General Fee Revenue Bonds, $3,505,000 face value, 2.9%, due annually through ,505,000 - (60,000) 3,445,000 Total bonds payable 754,894,329 - (19,075,538) 735,818,791 Plus unamortized bond premium 29,605,291 - (3,481,036) 26,124,255 Less unamortized bond discount (15,864) - 7,695 (8,169) 784,483,756 $ - $ (22,548,879) 761,934,877 Less: current portion Bonds payable (19,075,538) (19,302,349) Unamortized bond premium (3,481,036) (3,385,117) Unamortized bond discount 7,695 8,169 Total noncurrent bonds and notes payable $ 761,934,877 $ 739,255,580 45
48 On July 24, 2014, the University issued the 2014A General Fee bonds with a par value of $66,415,000 and interest rates ranging from 2.0% to 5.0% to advance refund $67,700,000 of outstanding 2006A General Fee and 2007A General Fee Bonds with interest rates ranging from 4.0% to 5.0%. The portion of the net proceeds of this new bond issue to be used for refunding were deposited in an irrevocable trust with an escrow agent and were used to purchase U.S. Government securities which will provide sufficient funds to pay all future debt service payments on the previously outstanding bonds. As a result, the previously outstanding bonds are considered to be defeased and the liability for those bonds has been removed from the University s financial statements. This refunding resulted in the University recognizing a deferred outflow of resources of $5,676,319 for the difference between the acquisition price of the new debt and the net carrying amount of the old debt. The refunding decreases the University s total debt service payments over the next 22 years by $6,908,048 and resulted in an economic gain (the difference between the present values of the debt service payments on the old and new bonds) for the University of $4,817,895. This loss on refunding, combined with previous losses, have been classified as deferred outflows of resources on the Statements of Net Position. The University recognized $2,145,607 and $1,902,282 of interest and cost associated with the amortization of these deferred outflows in 2014 and 2013, respectively. Future Debt Service Future debt service payments for each of the five fiscal years subsequent to September 30, 2014, and thereafter, are as follows: Year Ending September 30 Principal Interest 2015 $ 24,663,361 $ 35,362, ,083,719 34,757, ,128,501 33,840, ,237,554 33,016, ,074,123 32,194, ,849, ,403, ,680, ,408, ,990,000 66,330, ,960,000 27,568, ,565,000 2,666,250 Total future debt service $ 715,231,442 $ 503,549,006 Capital Lease Obligations AUM acquired a building under a capital lease agreement which provides for the University to purchase the building over a period of 25 years. The University also leases certain items of equipment which are classified as capital leases. Balance at New Principal Balance at Lease Obligations September 30, 2013 Lease Obligations Repayment September 30, 2014 Building $ 395,000 $ - $ (195,000) $ 200,000 Equipment 98,965 - (98,965) - Total lease obligations $ 493,965 $ - $ (293,965) $ 200,000 Minimum lease payments under capital leases together with the present value of the net minimum lease payments are shown in the table below: Building $ 210, Minimum lease payments 210,000 Less interest (10,000) Present value of minimum 200,000 lease payments Less current portion (200,000) Noncurrent obligations $ - 46
49 The University has entered into various operating leases for equipment. It is expected that, in the normal course of business, such leases will continue to be required. Net expenditures for rentals under operating leases for the years ended September 30, 2014 and 2013, amounted to approximately $4.1 million and $4.2 million, respectively. (10) PLEDGED REVENUES Pledged revenue for 2014 and 2013 as defined by the Series 2004, 2006A, 2007A, 2007B, 2008, 2009, 2011A, 2012A, 2012B and 2014A General Fee Revenue Trust Indentures is as follows: Student fees collected $ 415,790,651 $ 398,180,878 Less fees pledged for specific purposes: Athletic fees ($96 per student per semester) (4,470,048) (4,320,269) Transit fees ($141/$135 as of Fall 2014/2013 per student per semester) (6,565,383) (5,827,995) Student activities fees ($15 per student per semester) (878,139) (673,987) Total general fees pledged $ 403,877,081 $ 387,358,627 The Series 2011A Bonds expands the definition of pledged revenues. General Fees pledged to secure the Series 2011A Bonds and all other Parity Bonds now or hereafter outstanding under the General Fee Revenue Indenture will include the general fees levied against the University s students at both main campus and AUM. Housing Revenues pledged to secure the Series 2011A Bonds and all other Parity Bonds now or hereafter outstanding under the General Fee Revenue Indenture will include the University s housing and dining revenues from the operation of housing and dining facilities on both the main campus and AUM. The pledge of housing and dining revenues under the General Fee Revenue Indenture is subordinate in all respects to the University s prior pledge of certain dormitory revenues at AUM to secure payment of the 1978 Dormitory Revenue Bonds. AUM housing and dining revenue pledged for 2014 and 2013 subordinate to prior pledges of such revenues as defined by the Series 2011A General Fee Revenue Trust Indenture is as follows: AUM housing revenues Room rental $ 4,712,317 $ 3,463,967 Other income 369, ,578 Total housing 5,081,987 3,767,545 AUM dining revenue 1,798,862 1,606,301 Total AUM housing and dining revenues pledged $ 6,880,849 $ 5,373,846 The pledge of Athletic program revenues was added to the General Fee Trust Indenture contemporaneously with the issuance of the Series 2008 Bonds and collateralizes, on a parity basis, all bonds now or hereafter issued under the General Fee Revenue Indenture. Athletic program revenues pledged to the 2008 General Fee Revenue Bonds are subordinate to the Athletic program revenues previously pledged to the Athletic Bonds as described below. Pledged revenue for 2014 and 2013 as defined by the Series 2001A and 2004 Athletic A & B Revenue Trust Indentures is as follows: Jordan-Hare and other revenues: Television and broadcast revenues $ 7,909,714 $ 6,121,751 Conference and NCAA distributions 23,410,336 21,317,678 Sales and services revenues 34,164,211 29,808,653 Student fees 4,470,048 4,320,269 Royalties, advertisements and sponsorships 5,275,554 5,217,605 Other income 2,873,051 2,954,597 Total athletic revenues pledged $ 78,102,914 $ 69,740,553 The Series 2004 Athletic Revenue Bonds and Series 2001A Athletic Revenue Bonds are collateralized by a first-priority pledge of the Athletic program revenues that is senior to, and has priority in all respects over, the subordinate pledge of the Athletic program revenues that was added to the General Fee Trust Indenture concurrently with the issuance of the Series 2008 Bonds. 47
50 The pledge of housing and dining revenues was added to the General Fee Trust Indenture, contemporaneously with the issuance of the University s General Fee Revenue Bonds, Series 2007A and 2007B (taxable) and collateralizes, on a parity basis now or hereafter issued under the General Fee Revenue Indenture. Pledged revenues and related expenses for 2014 and 2013 as defined by the 1978 Auburn University at Montgomery Trust Indenture are as follows: The following summary shows the revenues, expenses and transfers from operations of the West Dormitories of AUM for the years ended September 30, 2014 and 2013: Revenues: Room rental $ 1,074,631 $ 1,230,943 Other income 70,611 19,244 Total revenues 1,145,242 1,250,187 Expenses and transfers: Personnel costs 392, ,519 Operating expenses 578, ,209 Transfers 599, ,567 Total expenses and transfers 1,570, ,295 (Deficit) surplus of revenues over expenses and transfers (425,460) 364,892 AUM student housing net surplus (deficit) at beginning of year 97,938 (266,954) AUM student housing net (deficit) surplus at end of year $ (327,522) $ 97,938 The AUM dormitory occupancy rate for Fall semester 2014 and Fall semester 2013 was 97.7% and 93.5%, respectively, (unaudited). (11) RETIREMENT PROGRAMS The employees of the University are participants in three benefit plans; a 401(a) defined benefit plan, a 403(b) defined contribution plan, and a 457(b) deferred compensation plan as follows: A. Teachers' Retirement System of Alabama The University contributes to the Teachers Retirement System of Alabama (TRS), a cost sharing, multiple-employer, public employee retirement system for the various state-supported educational agencies and institutions. This plan is administered by the Retirement Systems of Alabama. Substantially all non-student employees are members of TRS. Membership is mandatory for eligible employees. During the 2012 regular session of the Alabama Legislature, Act created a new defined benefit plan tier for employees hired on or after January 1, 2013, with no previous creditable service ( Tier 2 ). Employees hired or with creditable service prior to that date are Tier 1 participants. Benefits vest after ten years of creditable service. Vested Tier 1 employees may retire with full benefits at age 60 with ten years of service or at any age with 25 years of service. Retirement benefits for Tier 1 employees are calculated by the formula method by which retirees are allowed % of their final salary (average of the highest three of the last ten years) for each year of service. Vested Tier 2 employees may retire with full benefits at age 62 with 10 years of service. For Tier 2 employees, the percentage is 1.65% of their final salary (average of the highest five of the last ten years) for each year of service. Disability retirement benefits are calculated in the same manner for both Tier 1 and Tier 2 employees. Pre-retirement death benefits are provided to plan members. TRS was established as of October 1, 1941, under the provisions of Act Number 419, of the Acts of Alabama 1939, for the purpose of providing retirement allowances and other specified benefits for qualified persons employed by state-supported educational institutions. The responsibility for general administration and operation of TRS is vested in the Board of Control (currently 15 members). Benefit provisions are established by the Code of Alabama 1975, Sections through , as amended, and Sections 36-27B-1 through 36-27B-6, as amended. The ten-year historical trend information showing TRS s progress in accumulating sufficient assets to pay benefits when due and the significant actuarial assumptions used to compute the pension benefit obligation, including the discount rate, projected salary increases and post-retirement benefit increases, are presented in the September 30, 2013, annual financial report of TRS. The Retirement System of Alabama issues a publicly available financial report that includes financial statements and required supplementary information for TRS. That report may be obtained by writing to the Retirement System of Alabama, 135 South Union Street, Montgomery, AL Funding Policy Tier 1 employees are required by statute to contribute 7.5% of their salary to TRS. Tier 2 employees contribute 6.0% of their salary. The University is required to contribute the remaining amounts necessary to fund the actuarially determined contributions to ensure sufficient assets will be available to pay benefits when due. Each year TRS recommends to the Alabama State Legislature the contribution rate for the following fiscal year, with the Alabama State Legislature setting this rate in the annual appropriations bill. The percentages of the contributions and the amount of contributions made by the University and the University s employees, for both Tier 1 and Tier 2 employees, respectively, equal the required contributions for each year as follows: 48
51 Fiscal year ended September 30, Total percentage of covered payroll 19.21%/17.08% 17.58%/15.44% 17.25% Contributions: Percentage contributed by the employer 11.71%/11.08% 10.08%/9.44% 10.00% Percentage contributed by the employees 7.50%/6.00% 7.50%/6.00% 7.25% Contributed by the employer $ 42,684,405 $ 35,742,024 $ 34,144,425 Contributed by the employees 27,016,081 26,543,214 24,761,049 Total contributions $ 69,700,486 $ 62,285,238 $ 58,905,474 B. Employees Retirement System of Alabama Federally appointed employees of the Alabama Cooperative Extension System are covered by the Employees Retirement System of Alabama (ERS). This program is a multi-employer defined benefit plan. Benefits of the ERS plan are similar to those of the TRS plan with the exception that they are based on half of the employee s average final salary. Upon retirement, these employees will also receive pension benefits under the Federal Civil Service Retirement System. ERS is part of the Retirement Systems of Alabama. Funding Policy Tier 1 employees are required by statute to contribute 3.75% of their salary to ERS. Tier 2 employees contribute 3.0% of their salary. The University is required to contribute the remaining amounts necessary to fund the actuarially determined contributions to ensure sufficient assets will be available to pay benefits when due. Each year ERS recommends to the Legislature the contribution rate for the following fiscal year, with the Legislature setting this rate in the annual appropriations bill. The percentages of the contributions and the amount of contributions made by the University and the University s employees, for Tier 1 and Tier 2 employees, respectively, equal the required contributions for each year as follows: Fiscal year ended September 30, Total percentage of covered payroll 57.52%/56.73% 50.59%/49.80% 39.67% Contributions: Percentage contributed by the employer 53.77%/53.73% 46.84%/46.80% 36.04% Percentage contributed by the employees 3.75%/3.00% 3.75%/3.00% 3.63% Contributed by the employer $ 1,796,181 $ 1,807,654 $ 1,589,969 Contributed by the employees 125, , ,923 Total contributions $ 1,921,722 $ 1,952,359 $ 1,749,892 C. Tax Deferred Annuity Plans This plan is a defined contribution plan under section 403(b) of the Internal Revenue Code. Accordingly, benefits depend solely on amounts contributed to the plan plus investment earnings. This is provided as a supplement to the aforementioned programs. All full-time regular or probationary employees are eligible to participate. Full-time temporary employees are also eligible if their employment period is for a minimum of one year. The University will match 100.0% of elective deferral contributions up to 5.0% of the employee s plan compensation. The matching contributions cannot exceed $1,650 for any plan year (calendar year). An employee enrolling in one of the University s tax deferred annuity plans will not vest in the University s matching portion until he/she has completed five years of full-time continuous service. Upon the employee s completion of the five-year requirement, the University s matching contribution and interest earned will be vested to the participant. Nonparticipating employees with continuous service will be given credit toward the five year requirement upon joining the tax deferred annuity program. The total investment in the annuities is determined by Section 403(b). There are several investment options including fixed and variable annuities and mutual funds. The Universityapproved investment firms employees may select are Valic, TIAA-CREF, Fidelity Investments, and Lincoln Financial. At September 30, 2014 and 2013, 3,299 and 3,264 employees, respectively, participated in the tax deferred annuity program. The contribution for 2014 was $19,334,331 which includes $4,845,278 from the University and $14,489,053 from its employees. The contribution for 2013 was $18,928,378, which includes $4,879,216 from the University and $14,049,162 from its employees. Total salaries and wages during the fiscal year for covered employees participating in the plan were $240,856,614 and $235,219,284 for the fiscal years ended September 30, 2014 and 2013, respectively. D. Deferred Compensation Plans The University follows the provisions of GASB Statement No. 32, Accounting and Financial Reporting for Internal Revenue Code Section 457 Deferred Compensation Plans-a recission of GASB Statement No. 2 and an amendment of GASB Statement No. 31. As of September 30, 2014 and 2013, 212 and 201 employees, respectively, participated in the plans. Contributions of $2,645,296 and $2,358,162 for fiscal years 2014 and 2013, respectively, were funded by employees and no employer contribution was funded. The University-approved investment firms for 457(b) plans include Valic, TIAA-CREF and Fidelity Investments. (12) OTHER POSTEMPLOYMENT BENEFITS (OPEB) The University offers postemployment healthcare benefits to all employees who officially retire from the University. Healthcare benefits are offered through the State of Alabama Public Education Employees Health Insurance Plan (PEEHIP) with TRS or Auburn University s self insured Retiree Medical Plan (the Plan), which is available for select employees who are not eligible for PEEHIP or those who were grandfathered in as Civil Service employees. Eligibility for benefits for Tier 1 employees begins at age 60 with at least ten years of service or at any age with 25 years of service. For Tier 2 employees, eligibility begins at age 62 with at least ten years of service. Retirees must have been enrolled in the active employees healthcare plan for the last six of those years in order to be eligible for coverage under the plan. 49
52 The University applies GASB Statement No. 45, Accounting and Financial Reporting by Employers for Postretirement Benefits Other than Pensions. This statement requires governmental entities to recognize and match other post-retirement benefit costs with related services received and also to provide information regarding the actuarially calculated liability and funding level of the benefits associated with past services. less than 65 (age premium) and to pay the net difference between the active employee subsidy and the non-medicare eligible retiree subsidy (subsidy premium). When the retiree becomes Medicare eligible, the age and subsidy premium will no longer apply. However, the years of service premium (if applicable to the retiree) will continue to be applied throughout retirement. These changes are being phased in over a fiveyear period. A. State of Alabama Public Education Employees Health Insurance Plan (PEEHIP) Alabama Retired Education Employees Health Care Trust is a costsharing multiple-employer defined benefit healthcare plan administered by the Public Education Employees Health Insurance Board (PEEHIB). PEEHIP offers a basic hospital/medical plan that provides basic medical coverage for up to 365 days of care during each hospital confinement. The basic hospital/medical plan also provides for physicians benefits, outpatient care, prescription drugs, and mental health benefits. The Code of Alabama 1975, Section 16-25A-4 provides the PEEHIB with the authority to amend the benefit provisions for the plan, and Section 16-25A-8 provides the authority to set the contribution for retirees and employers. The required contribution rate of the employer was $356 and $336 per employee per month in the years ended September 30, 2014 and 2013, respectively. The University paid $8,614,844 and $8,633,554 for 2,018 and 2,141 retirees for the years ended September 30, 2014 and 2013, respectively. 100% of the required contributions were paid by PEEHIP. The required contribution rate is determined by PEEHIP in accordance with state statute. The required monthly contribution rates for fiscal year 2014 are as follows: Retired Member Rates Individual Coverage/Non-Medicare Eligible - $ Family Coverage/Non-Medicare Eligible Retired Member and Non- Medicare Eligible Dependent(s) - $ Family Coverage/Non-Medicare Eligible Retired Member and Dependent Medicare Eligible - $ Individual Coverage/Medicare Eligible Retired Member - $10.00 Family Coverage/Medicare Eligible Retired Member and Non- Medicare Eligible Dependent(s) - $ Family Coverage/Medicare Eligible Retired Member and Dependent Medicare Eligible - $ Tobacco surcharge - $28.00 per month PEEHIP Supplemental Plan - $0 Optional Plans (Hospital Indemnity, Cancer, Dental, Vision) - up to two optional plans can be taken by retirees at no cost if the retiree is not also enrolled in one of the Hospital Medical Plans. Otherwise, they can purchase the Optional Plans at the normal monthly rate of $38.00 or $45.00 for family dental. Members who retired on or after October 1, 2005, and before January 1, 2012, pay two percent of the employer premium for each year under 25 years of service, and for each year over 25 years of service, the retiree premium is reduced by two percent. Employees who retire on or after January 1, 2012, with less than 25 years of service, are required to pay 4% for each year under 25 years of service. Additionally, non-medicare eligible employees who retire on or after January 1, 2012, are required to pay 1% more for each year Surviving Spouse Rates Surviving Spouse Non-Medicare Eligible - $ Surviving Spouse Non-Medicare Eligible and Dependent Non-Medicare Eligible - $ Surviving Spouse Non-Medicare Eligible and Dependent Medicare Eligible - $ Surviving Spouse Medicare Eligible - $ Surviving Spouse Medicare Eligible and Dependent Non-Medicare Eligible - $ Surviving Spouse Medicare Eligible and Dependent Medicare Eligible $ The complete financial report for PEEHIP can be obtained on the PEEHIP website at under the Trust Fund Financials tab and will be available at the end of January B. Retiree Medical Plan (the Plan) The Plan is considered a single-employer plan and consists of hospital benefits, major medical benefits, a prescription drug program and a preferred care program. The health care benefits cover medical and hospitalization costs for retirees and their dependents. If the retiree is eligible for Medicare, University coverage is secondary. The authority under which the Plan s benefit provisions are established or amended is the University President. Recommendations for modifications are brought to the President by the Insurance and Benefits Committee. Any amendments to the obligations of the plan members or employer(s) to contribute to the plan are brought forth by the Insurance and Benefits Committee and approved by the President. Employees included in the actuarial valuation include retirees and survivors, active eligible Civil Service employees and those retirees who elected the PEEHIP plan on or prior to October 1, 1997, for whom the University pays a subsidy. Expenditures for postretirement health care benefits are recognized monthly and financed on a pay-as-you-go basis. The University funds approximately 60% of the postretirement healthcare premiums, which totaled $877,718 and $933,287 for fiscal years ended September 30, 2014 and 2013, respectively. The retirees are responsible for funding approximately 40% of the healthcare premiums. In compliance with the provisions of GASB Statement No. 45, the University accrued an additional $1,668,406 and $1,329,425 in retiree healthcare expense during fiscal years 2014 and 2013, respectively. The Plan does not issue a stand-alone financial report. For inquiries relating to the Plan, please contact Auburn University Payroll and Employee Benefits, 1550 East Glenn Avenue, Auburn University, AL The required schedule of funding progress, contained in the Required Supplemental Information immediately following the divisional financial statements (see page 74), presents multiyear trend information about whether the actuarial value of plan assets is increasing or decreasing over time relative to the actuarial accrued liability for benefits. 50

53 51
54 Determination of Annual Required Contribution (ARC) and End of Year Accrual for Retiree Medical Plan Cost Element Fiscal Year Ended September 30, 2014 Amount Percent of Payroll 1 1. Unfunded actuarial accrued liability at Oct. 1, 2013 $ 64,259,009 2,098.7% Annual Required Contribution (ARC) 2. Normal cost $ 51, Amortization of the unfunded actuarial accrued liability over 15 years using level dollar amortization 4,940, Annual Required Contribution (ARC = 2 + 3) $ 4,992, % Annual OPEB Cost (Expense) 5. ARC $ 4,992, Interest on beginning of year accrual 291, Adjustment to ARC (1,111,234) 8. Fiscal year 2014 OPEB cost ( ) $ 4,172, % End of Year Accrual (Net OPEB Obligation) 2 9. Beginning of year accrual 1 $ 14,564, Annual OPEB cost 4,172, Employer contribution (benefit payments) 2 (2,504,119) 12. End of year CAFR accrual ( ) 2 $ 16,232, % 1 Annual payroll for 36 participants as of September 30, 2014, was $3,061, Actual amounts paid in fiscal year 2014 include claim costs, administrative fees, and PEEHIP subsidy less participant contributions. Three Year Schedule of Percentage of OPEB Cost Contributed Fiscal Year Ended Annual OPEB Cost Percentage of OPEB Cost Contributed 3 Net OPEB Obligation September 30, 2012 $ 4,044, % $ 13,234,687 September 30, 2013 $ 3,810, % $ 14,564,112 September 30, 2014 $ 4,172, % $ 16,232,518 3 Cost Contributed is shown in the Determination of Annual Required contribution and End of Year Accrual. Summary of Key Actuarial Methods and Assumptions Valuation year October 1, 2013 September 30, 2014 Actuarial cost method Unit Credit, Actuarial Cost Method Amortization method 15 years, level dollar open amortization 4 Asset valuation method Not applicable Discount rate 2.0% Projected payroll growth rate Not applicable Health care cost trend rate for medical and prescription drugs 9.0% in fiscal year 2015, decreasing by one-half percentage point per year to an ultimate of 5.0% in fiscal year 2022 and later. Valuation Date October 1, Open amortization means a fresh-start each year for the cumulative unrecognized amount. 52
55 Monthly Per Capita Claim Costs Age Medical 55 $ $ $ $ $413 Claim costs remained unchanged from last year based on a weighted average of benefit plan premiums. Future claim costs are increased by health care cost trend. Retiree Premiums Retirees contribute 40% and surviving spouses pay 100% of the monthly premiums shown below: As of 1/1/14 As of 1/1/13 Pre-65 Single $472 $472 Pre-65 Family $1,062 $1,062 Post-65 Single $142 $142 Post-65 Family $742 $742 Note: There are several other categories of premiums. Administrative Expenses Included in claim cost. Assumed Health Care Trend Rate Medical and Fiscal Rx Combined Year Rate % % % % % % % % % Spouse Age Difference Mortality Participation Rates Retirement Rates Husbands are assumed to be three years older than wives for current and future retirees who are married. RP-2000 Combined Mortality Projected using Projection Scale BB. 100% of active employees are assumed to elect postretirement health insurance coverage upon retirement. Employees are assumed to retire according to the following schedule: Age Retirement Rate 45 or less 0% % % % 55 10% % 60 20% 61 15% 62 25% % 65 40% % % % Withdrawal Rates None assumed since all are long service Civil Service employees. 53
56 Disability Rates Sample rates are shown below, percent assumed to terminate within one year: Age Male Female % 0.09% % 0.12% % 0.24% % 0.41% % 0.65% % 0.98% % 1.50% (13) SELF INSURANCE PROGRAMS AND OTHER LIABILITIES Self Insurance An actuarially determined rate is used to provide funding for retained risk in the University s self-insurance program. The self-insurance reserves, liabilities and related assets are included in the accompanying financial statements. The estimated liability for general liability and on-the-job injury self-insurance is actuarially determined. These self-insured programs are supplemented with commercial excess insurance. The Comprehensive General Liability Trust Fund is a self-insured retention program that protects the University, its faculty, staff, and volunteers against claims brought by third parties arising from bodily injury, property damage and personal liability (libel, slander, etc.) Funds are held in a separate trust account with a financial institution to be used to pay claims for which the University may become legally liable. The liability at September 30, 2014 and 2013, was $476,765 and $434,682, respectively. The On-The-Job-Injury program provides benefits for job-related injuries or death related from work at the University. This program is designed to cover out-of-pocket expenses of any employee who is not covered by insurance. The program will also pay for medically evidenced disability claims and provide death benefits arising from a job-related death of an employee. This self-funded program is provided to employees since the University is not subject to the workers compensation laws of the State of Alabama. The liability at September 30, 2014 and 2013, was $2,021,882 and $1,996,978, respectively. The University self-insures its health insurance program for all eligible employees. Assets have been set aside to fund the related claims of this program. Should the assets be insufficient to pay the insurance claims, the University would be liable for such claims. The accompanying Statements of Net Position include a self-insurance liability for health insurance as of September 30, 2014 and 2013, of $8,290,610 and $10,161,839, respectively. Other Liabilities Other liabilities include compensated absences, deposits held in custody and unearned revenues. The University allows employees to accrue and carryover annual and sick leave up to certain maximum amounts depending on years of service. Employees will be compensated for accrued annual leave at time of separation from University employment (termination or retirement) up to a maximum of one month s additional compensation. All eligible employees hired before October 1, 1990, may be compensated for unused sick leave at the rate of 25% of their respective balances, subject to a maximum of one month s additional compensation. The liability for compensated absences was $18,347,365 and $17,532,179 at September 30, 2014 and 2013, respectively. Deposits held in custody include the portion of the Federal Perkins Student Loan funds and Health Professions Student Loans which would be refunded in the event the University ceased operations. The refundable amounts were $15,920,432 and $16,763,334 at September 30, 2014 and 2013, respectively. Also included in deposits held in custody of others are the agency funds. These amounts totaled $3,937,118 and $4,331,498 for September 30, 2014 and 2013, respectively. The remaining difference relates to immaterial rental deposits. Unearned revenue includes tuition revenue related to the portion of Fall semester subsequent to September 30, funding received for contracts and grants, which has not been expended as of September 30, as well as athletic revenue related to games played subsequent to September 30. Unearned revenues at September 30, 2014 and 2013, are as follows: Tuition and fees, net $ 136,497,793 $ 127,082,274 Federal, state and local government grants and contracts 13,440,678 11,822,527 Auxiliary, net 33,864,410 34,436,664 Plant 506, ,311 Total unearned revenue $ 184,309,364 $ 173,863,776 54
57 Pollution Remediation Obligations The University follows GASB Statement No. 49, Accounting and Financial Reporting for Pollution Remediation Obligations, which requires recognition of liabilities, recoveries, and related disclosures, as appropriate. The University conducts groundwater monitoring, monitored natural attenuation and clean-up in accordance with the Resource Conservation and Recovery Act (RCRA) and the Toxic Substances and Control Act. Additionally, asbestos abatement is necessary as older buildings on campus are demolished or renovated. During fiscal year 2011, the University, with the assistance of an outside consultant, prepared a 30-year Post Closure Cost Estimate related to all active and inactive solid waste management units managed through the University RCRA Facility permit. As of September 30, 2014 and 2013, the total estimated pollution remediation liability (estimated using the expected cash-flow technique) is $6,972,856 and $6,774,397, respectively. The current portion of this amount ($3,306,421 and $3,220,087, respectively) is included in other accrued liabilities and the long-term portion ($3,666,435 and $3,554,310, respectively) is included in other noncurrent liabilities in the accompanying Statements of Net Position. This estimate may change in future periods as additional information is obtained. The University does not expect to recover any funds from insurance or other third parties related to these obligations. (14) DEFERRED INFLOWS OF RESOURCES Deferred inflows of resources are an acquisition of net assets that are applicable to a future reporting period. The University engages in certain voluntary non-exchange transactions (grants). Grant funds received for which all eligibility requirements have been met, other than time requirements, are presented as deferred inflows of resources in accordance with GASB Statements No. 63 and No. 65. Deferred outflows of resources are summarized below: September 30, 2014 September 30, 2013 Nonexchange transactions $ 435,203 $ 346,994 (15) CONTRACTS AND GRANTS The University has been awarded approximately $6.4 million (unaudited) and $3.9 million (unaudited) in contracts and grants that have not been received or expended as of September 30, 2014 and 2013, respectively. These awards, which represent commitments of sponsors to provide funds for research and training projects, have not been reflected in the financial statements. (17) CONSTRUCTION COMMITMENTS AND FINANCING The University has entered into projects for the construction and renovation of various facilities that are estimated to cost approximately $320.5 million (unaudited). At September 30, 2014, the estimated remaining cost to complete the projects is approximately $37.1 million (unaudited) which will be funded from University funds and bond proceeds. (16) RECOVERY OF FACILITIES AND ADMINISTRATIVE COST FOR SPONSORED PROGRAMS The portion of revenue recognized for all grants and contracts that represents facilities and administrative cost recovery is recognized on the Statements of Revenues, Expenses and Changes in Net Position within contract and grant operating revenues. The University recognized $16,220,174 and $17,624,581 in facilities and administrative cost recovery for the years ended September 30, 2014 and 2013, respectively. 55
58 (18) OPERATING EXPENSES BY FUNCTION Operating expenses by functional classification for the years ended September 30, 2014 and 2013, are listed below. In preparing the financial statements, all significant transactions and balances between auxiliary units and other funds have been eliminated. Some scholarships and fellowships are provided by the instruction or research function and are broken out in the charts below. In addition, the graduate waivers are shown as compensation; however, they are shown functionally as scholarship and fellowship expense. The University is able to capture auxiliary utility expenditures; therefore, those expenditures are shown separately by function. September 30, 2014 Compensation Scholarships Other Supplies and Benefits and Fellowships Utilities and Services Depreciation Total Instruction $ 213,531,303 $ 1,102,162 $ - $ 34,327,058 $ - $ 248,960,523 Research 66,800,529 1,404, ,006,628-99,212,779 Public Service 63,480,429 2,465 74,791 38,918, ,475,743 Academic Support 43,548, ,778,431-53,327,227 Library 7,304, ,401,629-9,705,852 Student Services 21,337, ,847,034-30,184,042 Institutional Support 61,999, ,541,053-70,540,820 Operation and Maintenance 27,312,590-21,019,977 30,432,719-78,765,286 Scholarships and Fellowships 20,006,300 19,977, ,335-40,210,149 Auxiliaries 52,921, ,949 4,908,433 65,125, ,119,403 Depreciation ,795,613 71,795,613 $ 578,242,854 $ 22,651,077 $ 26,003,836 $ 229,604,057 $ 71,795,613 $ 928,297,437 September 30, 2013 Compensation Scholarships Other Supplies and Benefits and Fellowships Utilities and Services Depreciation Total Instruction $ 207,837,651 $ 761,287 $ - $ 34,017,145 $ - $ 242,616,083 Research 67,298,382 1,395,995 10,068 28,715,022-97,419,467 Public Service 62,847,491 2, ,448 41,770, ,723,025 Academic Support 37,177, ,475,153-43,652,878 Library 7,118, ,218,631-8,337,544 Student Services 18,857, ,708,410-27,565,781 Institutional Support 63,944, ,120,302-70,064,409 Operation and Maintenance 26,866,013-18,223,525 39,370,965-84,460,503 Scholarships and Fellowships 19,749,940 19,423, ,108-39,479,450 Auxiliaries 46,281,831-4,506,835 56,110, ,899,547 Depreciation ,064,924 66,064,924 $ 557,979,424 $ 21,583,184 $ 22,842,876 $ 222,813,203 $ 66,064,924 $ 891,283,611 (19) CONTINGENT LIABILITIES The University is a party in various legal actions and administrative proceedings arising in the normal course of its operations. Management does not believe that the outcome of these actions will have a material adverse effect on the University s financial position. (20) RELATED PARTY TRANSACTIONS Auburn University Foundation The majority of funds that AUF raises are donor restricted for specific schools, colleges or programs of the University. These may be transferred to the University for its use, expended by AUF for the benefit of University schools, colleges or programs, or in the case of endowments, invested with only the earnings transferred to or expended on behalf of the University. Amounts transferred to the University or expended on behalf of its programs totaled $34,907,076 and $30,552,177 during the years ended September 30, 2014 and 2013, respectively. Net undistributed grants to the University totaled $27,531 and $48,270 at September 30, 2014 and 2013, respectively. The President of the University serves as an ex officio non-voting member of AUF s Board of Directors. The University is the primary recipient of AUF expenditures and maintains AUF s accounting records as a subsystem within the University s accounting system. AUF and the University entered into an operating agreement (the AUF Agreement), which addresses the general and administrative and development financial relationships between these two entities. In summary, the AUF Agreement states that in return for raising and administering gifts for the benefit of the University, the University will 56
59 provide certain services and facilities to AUF, which primarily consist of personnel and other administrative support, and that AUF will make a quarterly determination of the relative allocable share of these costs and transfer funds as necessary. AUF and the University review the AUF Agreement annually and provide an estimate of the maximum consideration to be paid for the upcoming year for approval by the respective boards. The actual reimbursement is determined based on the actual costs incurred and is as follows: For the years ended September 30, 2014 and 2013, personnel costs were incurred by the University. AUF s share of these costs due to the University was $1,473,856 and $1,376,034, respectively, in accordance with the Agreement. Non-personnel development costs were paid primarily by AUF. The University s share of these costs due to AUF was $2,940,904 and $2,480,551 of which $1,343,367 and $1,142,128 was unpaid at each year end, respectively, and was netted against the amount due to the University by AUF. For the years 2014 and 2013, AUF paid the University $130,489 and $233,906, respectively, as net settlement in accordance with the Agreement. Constituency development operations, which are fund raising programs restricted to one school, college or program of the University, are funded jointly by the University unit involved and the AUF gifts restricted to that unit. These costs are the responsibility of the respective constituency s unit. AUREFI and the University entered into an agreement with the University to provide certain services and facilities. AUREFI reimbursed the University $56,455 and $113,851 during the years ended September 30, 2014 and 2013, respectively, for agreement-related services and facilities. AUREFI reimbursed the University $790 during fiscal year 2013 for general and administrative expenses. AUREFI provided a real property grant to the University of $3,500 during fiscal year restriction for spending directly to the University on behalf of TUF on an annual basis. AUF remits income from investments which are designated by donor restriction for additions to endowment corpus directly to TUF on an annual basis. As of September 30, 2014 and 2013, AUF was committed to TUF for $8,606,643 and $7,984,570, respectively. AUF annually remits a distribution to the University on behalf of TUF. AUF distributed $287,076 and $233,300 during fiscal years 2014 and 2013, respectively. AUF provided TUF grants of $316,516 and $110,883 during fiscal years 2014 and 2013, respectively, for intercollegiate athletics. AUF paid $436,737 and $323,757 to TUF for costs incurred in the cultivation, solicitation and stewardship of contributions during fiscal years 2014 and 2013, respectively. TUF paid $1,514 and $7,186 for general and administrative expenses during fiscal years 2014 and 2013, respectively. Auburn Alumni Association The Association, AUF, Auburn University Offices of Alumni and Development and their related support units jointly utilize operational facilities, personnel and other assets in order to effectively and efficiently carry out their required activities. All personnel are employed by the University and their services are provided to the other organizations under contractual agreements. Other operational costs are paid from budgets of each organization. The combined expenditures are analyzed periodically and, based on each entity s utilization of the facilities, supplies, and services, any necessary reimbursements are made among the organizations. In the Statements of Activities and Changes in Net Assets, amounts received by the Operating Fund from other organizations are used to offset the related expenses. The Executive Director of the Association is an employee of the University, providing services to the Association under a services and facilities contract. The Executive Director also serves as the Vice President for Alumni Affairs for the University. The amount due from AUF to the Association consists of funds from the Association s Life Membership program which are invested with AUF s pooled endowment. AUF remits income from the investments directly to the Association on an annual basis. For the years ended September 30, 2014 and 2013, AUF was committed to the Association for $8,989,525 and $8,452,093, respectively. Of these amounts, $386 relates to payables between the Association and AUF for routine, operating transactions as of September 30, AUF distributed $298,677 and $287,029 during fiscal years 2014 and 2013, respectively. AUF provided the Association grants of $4,110 and $1,650 during fiscal years 2014 and 2013, respectively, for alumni relations. The Association provided endowment grants to AUF of $240,583 and $625,892, during the fiscal years 2014 and 2013, respectively. AUF paid $113,996 and $62,612 to the Association for general and administrative expenses during fiscal years 2014 and 2013, respectively. The Association paid $60,376 and $49,492 to AUF for similar expenses during fiscal years 2014 and 2013, respectively. The amount due from AUF to TUF consists of funds which are invested with AUF s pooled endowment. Of these amounts, $7,956 and $5,195 related to receivables between TUF and AUF for routine, operating transactions as of September 30, 2014 and 2013, respectively. AUF remits income from the investments which are designated by donor A portion of the Association s investments have been pooled with AUF investments and are invested and managed by AUF. Cash receipts and disbursements records of the Association are maintained within the University accounting system. During the years ended September 30, 2014 and 2013, the Association had a salary reimbursement expense of $1,042,275 and $989,349, respectively, to the University under the service and facilities agreement. All of these amounts have been paid at September 30, 2014 and September 30, 2013, respectively. Rental income recorded by the Association from the University totaled $362,961 and $368,358, respectively, for the years ended September 30, 2014 and Rental income recorded by the Association from AUF totaled $3,160 and $4,840 for the years ended September 30, 2014 and 2013, respectively. During the years ended September 30, 2014 and 2013, the University provided for its share of alumni affairs activities costs by establishing a budget within the University s budgetary system; whereby, the University pays a portion of the costs, and reimburses the Association for the balance. The alumni affairs activities costs were $680,190 and $688,000 for the years ended September 30, 2014 and 2013, respectively. 57
60 During the year ended September 30, 2014, the Association contributed $177,071 to the Auburn Alumni Association Endowment for Scholarships held with AUF. During the year ended September 30, 2013, the Association contributed $198,200 to the Auburn Alumni Association Endowment for Scholarships held with AUF. As of September 30, 2014, the Association accrued $250,000 to support alumni scholarships. Tigers Unlimited Foundation The funds that TUF raises are restricted for athletic-related programs of the University. These may be transferred to the University for its use, expended for the benefit of athletic programs or, in the case of endowments, invested according to donor restriction and the earnings transferred to, or expended for, the University s benefit. Amounts transferred to the University, or expended on behalf of its programs, totaled $34,748,751 and $34,799,271 during the years ended June 30, 2014 and 2013, respectively. Included in these amounts is a current year accrual of severance payments due to terminated employees totaling $2,620,161 and $8,779,544, respectively. opportunities for the University s faculty and students. Consideration received by the University from ARTF includes the traditional benefits enjoyed by a University from an affiliated research park, including but not limited to increased exposure for development and commercialization of the University s intellectual property and technologies, increased research opportunities for the University s students and professors, and heightened exposure within the commercial world of the technological campus offerings. The Vice President for Research and Economic Development of the University serves as the President of ARTF and is a member of the ARTF Board of Directors with full voting powers. Contributed services in the amount of approximately $17,000 and $15,000 were recognized by ARTF during fiscal years 2014 and 2013, respectively, related to services provided by the Vice President for Research and Economic Development serving as the President of ARTF. Additionally, ARTF s accounting records are maintained as a subsystem within the University s accounting system. Effective July 1, 2007, TUF and the University entered into an operating agreement (the TUF Agreement), which addresses the general and administrative and development financial relationships between these two entities. In summary, the TUF Agreement states that the University will provide certain services and facilities to TUF, which primarily consist of personnel and other administrative support. TUF will pay to the University an amount equal to the compensation of Auburn University employees for services performed and reimbursement for space and property utilized by such employees, in an amount to be specifically approved by TUF s Board of Directors each year. The TUF Agreement commenced on July 1, 2007, and expired on July 1, 2008, but remains in force in subsequent years unless cancelled in writing by one of the parties. During the years ended June 30, 2014 and 2013, the University incurred obligations of $504,245 each year to TUF for the use of executive suites at University athletic events. Of this amount, $499,125 is recorded as public support-contributions revenue and $5,120 is recorded as other revenue on the Statements of Activities and Changes in Net Assets. At June 30, 2013, a receivable of $504,245 related to these transactions was outstanding. The University paid the 2014 and 2013 obligations during fiscal year During the years ended June 30, 2014 and 2013, TUF paid the University for normal, recurring expense transactions including, but not limited to, purchasing athletic event tickets, reimbursing athletic staff salaries, sponsoring student scholarships, and funding the debt, repair, maintenance and operations of athletic facilities. At June 30, 2014 and 2013, obligations of $2,943,300 and $2,508,750 related to these transactions, respectively, were outstanding. TUF paid the 2013 obligation during fiscal year 2014, and it intends to pay the 2014 obligation during fiscal year As indicated, the above TUF balances are as of June 30, 2014 and 2013; however, the University believes these figures are not materially different than September 30, 2014 and 2013, respectively. Auburn Research and Technology Foundation ARTF s mission is to facilitate the acquisition, construction, and equipping of a technology and research park on the University s campus in order to create new academic and entrepreneurial ARTF and the University entered into an Operating Agreement (the ARTF Agreement), which governs the general and administrative and development financial relationships between these two entities. In summary, the ARTF Agreement states that in return for certain services and facilities that are within the capability and control of the University, ARTF will reimburse and compensate the University for the cost of such services and facilities. ARTF will make an annual determination of its allocable share of these costs and transfer the associated funds. ARTF and the University review the ARTF Agreement annually and provide an estimate of the maximum consideration to be paid for the upcoming year for approval by the respective boards. The actual reimbursement is determined based on the actual costs incurred. In accordance with the ARTF Agreement for fiscal years 2014 and 2013, personnel costs incurred by the University and charged to ARTF were $61,091 and $59,611, respectively. These amounts are included in Other payables to Auburn University at September 30, 2014 and ARTF held lease agreements with three University departments and two University departments in fiscal years 2014 and 2013, respectively, whereby the departments lease office space from ARTF. As leasing tenants, the University departments remit a monthly rental fee to ARTF in accordance with their lease agreements. ARTF entered into a contract with the University during fiscal year 2011 to develop and manage a full-service business incubator. Revenues of $142,577 and $139,969 related to this contract were recognized at September 30, 2014 and 2013, respectively. The remaining amounts of $7,423 and $10,031 are shown as deferred revenue and will be recognized when the expenditures are incurred. (21) DIRECT LOAN PROGRAM The Federal Direct Loan Program (DL) enables an eligible student or parent to obtain a loan directly through the Department of Education. Under DL, files are transmitted via the Federal Common Originator and Disbursement System (COD). Funds are received via G5, a federal website. The Department of Education is responsible for the collection of these loans. The University s main campus disbursed approximately $131.7 million and $127.2 million under these programs during the fiscal years 58
 IMPACT OF RECENTLY ISSUED ACCOUNTING STANDARDS Statement No.")
61 ended September 30, 2014 and 2013, respectively. AUM disbursed approximately $26.7 million and $34.3 million under these programs during the fiscal years ended September 30, 2014 and 2013, respectively. (22) IMPACT OF RECENTLY ISSUED ACCOUNTING STANDARDS Statement No. 68, Accounting and Financial Reporting for Pensions an amendment of GASB Statement No. 27 was issued in June This Statement addresses accounting and financial reporting for pensions that are provided to the employees of state and local governmental employers through pension plans administered through trusts. It establishes standards for measuring and recognizing liabilities, deferred outflows and inflows of resources, and expenses. It also identifies methods and assumptions used to project benefit payments, their net present value, and to attribute it to periods of employee service. Additionally, it addresses disclosure requirements regarding pensions. This Statement is effective for periods beginning after June 15, Earlier application is encouraged. The University is currently evaluating the financial statement impact of this Statement, but expects it will record a material liability and a material reduction of its unrestricted net position upon adoption. Statement No. 69, Government Combinations and Disposals of Government Operations was issued in January This Statement establishes new accounting and financial reporting standards related to government mergers, acquisitions, and transfers of operations and to disposals of government operations. This Statement is effective for periods beginning after December 15, 2013, and should be applied on a prospective basis. Earlier application is encouraged. The University does not believe the adoption of this Statement will have an effect on the University s financial statements. Statement No. 71, Pension Transition for Contributions Made Subsequent to the Measurement Date an amendment of GASB Statement No. 68 was issued in November This Statement addresses an issue regarding application of the transition provisions of Statement No. 68, Accounting and Financial Reporting for Pensions an amendment of GASB Statement No. 27. The provisions of this Statement are required to be applied simultaneously with Statement No. 68. The University is currently evaluating the financial statement impact of this Statement. 59
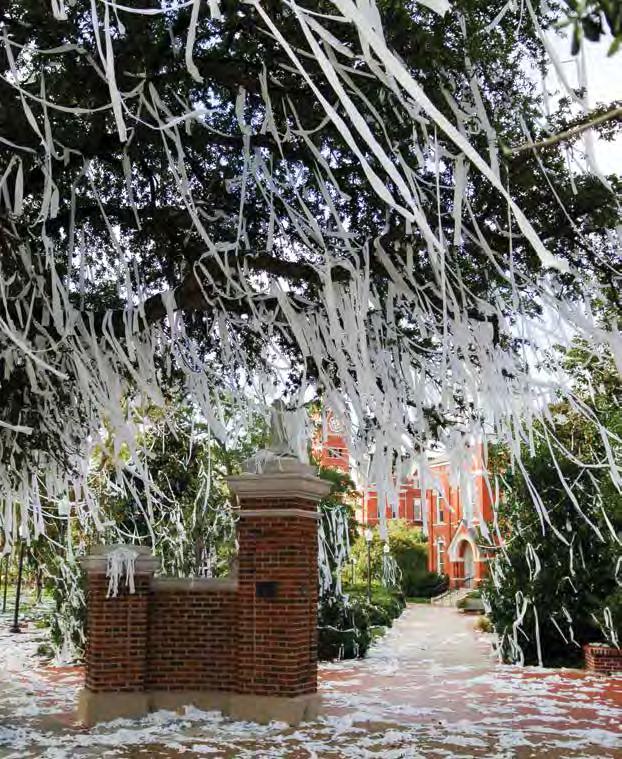
62 60
63 Financial R eport 2014 Unaudited Divisional Fina nci a l Statements 61
64 AUBURN UNIVERSITY MAIN CAMPUS STATEMENTS OF NET POSITION SEPTEMBER 30, 2014 AND 2013 (UNAUDITED) ASSETS Current assets Cash and cash equivalents $ 125,604,475 $ 65,420,672 Operating investments 41,297,322 54,841,430 Accounts receivable, net 27,242,291 35,890,279 Student accounts receivable, net 33,145,907 30,208,202 Loans receivable, net 2,211,440 2,182,507 Accrued interest receivable 1,630,504 1,558,852 Inventories 4,097,851 4,010,334 Prepaid expenses 33,795,828 33,869,886 Due from other funds 2,235,269 1,154,958 Total current assets 271,260, ,137,120 Noncurrent assets Investments 771,856, ,153,154 Loans receivable, net 14,592,344 14,432,677 Investment in plant, net 1,453,016,865 1,436,342,758 Due from other funds 85,445,167 89,120,280 Total noncurrent assets 2,324,910,697 2,317,048,869 Total assets 2,596,171,584 2,546,185,989 DEFERRED OUTFLOWS OF RESOURCES Loss on refunding of bonds 14,442,185 10,911,474 LIABILITIES Current liabilities Accounts payable 52,149,329 53,488,848 Accrued salaries and wages 2,392,583 2,042,033 Accrued compensated absences 13,524,987 12,501,645 Accrued interest payable 12,292,550 12,453,249 Other accrued liabilities 8,344,327 7,699,964 Student deposits 3,055,404 2,532,680 Deposits held in custody 17,072,353 18,378,001 Unearned revenues 164,678, ,982,895 Noncurrent liabilities-current portion 28,490,201 22,653,262 Total current liabilities 301,999, ,732,577 Noncurrent liabilities Bonds and notes payable 715,648, ,590,580 Other noncurrent liabilities 20,109,189 19,998,527 Due to other funds 29,686,099 29,340,767 Total noncurrent liabilities 765,443, ,929,874 Total liabilities 1,067,443,852 1,075,662,451 DEFERRED INFLOWS OF RESOURCES Nonexchange transactions 435, ,994 NET POSITION Net investment in capital assets 809,019, ,445,940 Restricted Nonexpendable 23,033,149 22,579,300 Expendable: Scholarships, research, instruction, other 120,114, ,359,354 Loans 4,656,696 3,553,430 Capital projects 5,044,973 9,214,337 Unrestricted 580,865, ,935,657 Total net position $ 1,542,734,714 $ 1,481,088,018 62
65 AUBURN UNIVERSITY MAIN CAMPUS STATEMENTS OF REVENUES, EXPENSES AND CHANGES IN NET POSITION FOR THE YEARS ENDED SEPTEMBER 30, 2014 AND 2013 (UNAUDITED) OPERATING REVENUES Tuition and fees, net of scholarship allowances of $96,362,204 and $93,844,669, respectively $ 332,881,008 $ 317,648,252 * Federal appropriations 32,530 29,167 Federal grants & contracts, net 40,087,116 43,403,864 State & local grants & contracts, net 6,179,301 4,836,145 Nongovernmental grants & contracts, net 7,766,178 6,442,240 Sales & services of educational departments 35,819,007 35,492,764 Auxiliary revenue, net of scholarship allowances of $6,673,772 and $5,886,367, respectively 115,517,549 98,197,508 * Other operating revenues 19,754,148 14,945,617 * Total operating revenues 558,036, ,995,557 OPERATING EXPENSES Compensation & benefits 449,353, ,520,119 Scholarships & fellowships 19,255,298 18,200,352 * Utilities 20,937,454 19,349,095 Other supplies & services 172,352, ,372,922 * Depreciation 66,983,139 61,171,136 Total operating expenses 728,882, ,613,624 Operating loss (170,845,485) (170,618,067) NONOPERATING REVENUES (EXPENSES) State appropriations 158,179, ,480,564 Gifts 32,617,505 33,138,415 * Grants 14,032,340 13,690,726 Net investment income 36,544,858 10,908,843 Interest expense on capital debt (13,074,828) (13,166,796)* Nonoperating revenues, net 228,299, ,051,752 Income before other changes in net position 57,454,188 29,433,685 OTHER CHANGES IN NET POSITION Capital appropriations 16,585 91,922 Capital gifts & grants 3,722,074 28,080,039 Additions to permanent endowments 453,849 1,681,867 Net increase in net position 61,646,696 59,287,513 * Net position - beginning of year 1,481,088,018 1,421,800,505 * Net position - end of year $ 1,542,734,714 $ 1,481,088,018 *As discussed in Note 1 of the University s financial statements, the University revised its 2013 Statement of Revenues, Expenses, and Changes in Net Position to correct certain immaterial errors. Those errors also impacted the previously presented 2013 unaudited divisional statements. Accordingly, management has corrected those errors as follows: Tuition and fees, net increased by $3,620,089; Auxiliary revenue, net increased by $227,069; Other operating revenue increased by $1,375,780; Scholarships & fellowships expense increased by $3,847,158; Other supplies & services increased $938,853; Gifts revenues decreased $436,927; Interest expense increased $625,716; Net increase in net position decreased $625,716; and Net position beginning of year increased $625,
66 AUBURN UNIVERSITY AT MONTGOMERY STATEMENTS OF NET POSITION SEPTEMBER 30, 2014 AND 2013 (UNAUDITED) ASSETS Current assets Cash and cash equivalents $ 2,486,082 $ 1,517,561 Operating investments 817,395 1,279,652 Accounts receivable, net 1,684,642 2,819,973 Student accounts receivable, net 4,200,755 4,151,974 Loans receivable, net 344, ,517 Accrued interest receivable 183, ,762 Inventories 502, ,158 Prepaid expenses 1,440,133 1,383,567 Total current assets 11,659,457 12,141,164 Noncurrent assets Investments 15,277,306 18,133,838 Loans receivable, net 2,524,207 2,465,340 Investment in plant, net 97,127,433 98,896,175 Due from other funds 29,686,099 29,340,767 Total noncurrent assets 144,615, ,836,120 Total assets 156,274, ,977,284 LIABILITIES Current liabilities Accounts payable 1,799,074 2,658,256 Accrued salaries and wages 251, ,634 Accrued compensated absences 1,543,202 1,596,889 Accrued interest payable 6,025 7,275 Student deposits 13,088 1,640 Deposits held in custody 2,820,596 2,779,652 Unearned revenues 12,480,486 12,181,737 Noncurrent liabilities-current portion 327, ,000 Due to other funds 2,235,269 1,154,958 Total current liabilities 21,476,461 20,949,041 Noncurrent liabilities Bonds and notes payable 540, ,000 Lease obligations - 200,000 Other noncurrent liabilities 275, ,368 Due to other funds 85,445,167 89,120,280 Total noncurrent liabilities 86,260,667 90,240,648 Total liabilities 107,737, ,189,689 NET POSITION Net investment in capital assets 12,500,626 16,021,458 Restricted Nonexpendable 5,143,372 5,117,263 Expendable: Scholarships, research, instruction, other 25,326,481 24,262,044 Loans 356, ,264 Capital projects 138, ,543 Unrestricted 5,071,541 3,894,023 Total net position $ 48,537,374 $ 49,787,595 64
67 AUBURN UNIVERSITY AT MONTGOMERY STATEMENTS OF REVENUES, EXPENSES AND CHANGES IN NET POSITION FOR THE YEARS ENDED SEPTEMBER 30, 2014 AND 2013 (UNAUDITED) OPERATING REVENUES Tuition and fees, net of scholarship allowances of $10,500,313 and $9,877,720, respectively $ 33,065,804 $ 31,555,854 * Federal grants & contracts, net 2,149,692 3,162,680 State & local grants & contracts, net 6,460,315 8,921,273 Nongovernmental grants & contracts, net 672, ,422 Sales & services of educational departments 2,620,387 2,735,000 Auxiliary revenue, net of scholarship allowances of $1,223,045 and $895,666, respectively 7,883,759 6,603,836 * Other operating revenues 1,190,159 1,431,981 Total operating revenues 54,042,427 54,991,046 OPERATING EXPENSES Compensation & benefits 51,802,596 51,194,533 Scholarships & fellowships 3,319,104 3,341,607 * Utilities 3,884,201 2,368,712 Other supplies & services 22,175,617 27,204,760 * Depreciation 4,812,474 4,893,788 Total operating expenses 85,993,992 89,003,400 Operating loss (31,951,565) (34,012,354) NONOPERATING REVENUES (EXPENSES) State appropriations 22,557,727 21,947,664 Gifts 838,122 1,008,618 * Grants 8,005,304 7,235,288 Net investment income 1,626,894 1,625,695 Interest expense on capital debt (2,360,670) (536,489)* Nonoperating revenues, net 30,667,377 31,280,776 Loss before other changes in net position (1,284,188) (2,731,578) OTHER CHANGES IN NET POSITION Capital appropriations - 22,266 Capital gifts & grants 7,858 5,118 Additions to permanent endowments 26,109 37,420 Net decrease in net position (1,250,221) (2,666,774)* Net position - beginning of year 49,787,595 52,454,369 * Net position - end of year $ 48,537,374 $ 49,787,595 *As discussed in Note 1 of the University s financial statements, the University revised its 2013 Statement of Revenues, Expenses, and Changes in Net Position to correct certain immaterial errors. Those errors also impacted the previously presented 2013 unaudited divisional statements. Accordingly, management has corrected those errors as follows: Tuition and fees, net increased by $353,005; Auxiliary revenue, net increased by $32,009; Scholarships & fellowships expense increased by $385,014; Other supplies & services increased $436,927; Gifts revenues increased $436,927; Interest expense decreased $625,716; Net decrease in net position decreased $625,716; and Net position beginning of year decreased $625,
68 ALABAMA AGRICULTURAL EXPERIMENT STATION STATEMENTS OF NET POSITION SEPTEMBER 30, 2014 AND 2013 (UNAUDITED) ASSETS Current assets Cash and cash equivalents $ 5,165,128 $ 2,398,421 Operating investments 1,698,235 2,010,838 Accounts receivable, net 5,615,828 5,087,803 Total current assets 12,479,191 9,497,062 Noncurrent assets Investments 31,740,403 28,495,418 Total noncurrent assets 31,740,403 28,495,418 Total assets 44,219,594 37,992,480 LIABILITIES Current liabilities Accounts payable 1,081, ,700 Accrued salaries and wages 169, ,697 Accrued compensated absences 1,383,110 1,539,911 Deposits held in custody 7,300 6,800 Unearned revenues 6,774,223 4,725,637 Total current liabilities 9,415,968 7,306,745 Noncurrent liabilities Other noncurrent liabilities 99,616 98,769 Total noncurrent liabilities 99,616 98,769 Total liabilities 9,515,584 7,405,514 NET POSITION Restricted Expendable: Scholarships, research, instruction, other 1,721,874 1,295,317 Unrestricted 32,982,136 29,291,649 Total net position $ 34,704,010 $ 30,586,966 66
69 ALABAMA AGRICULTURAL EXPERIMENT STATION STATEMENTS OF REVENUES, EXPENSES AND CHANGES IN NET POSITION FOR THE YEARS ENDED SEPTEMBER 30, 2014 AND 2013 (UNAUDITED) OPERATING REVENUES Federal appropriations $ 5,421,381 $ 6,585,926 Federal grants & contracts 17,014,302 16,461,051 State & local grants & contracts 1,009, ,165 Nongovernmental grants & contracts 5,844,017 5,050,244 Sales & services of educational departments 3,223,980 3,360,518 Other operating revenues 709, ,134 Total operating revenues 33,222,121 32,499,038 OPERATING EXPENSES Compensation & benefits 37,292,011 36,517,308 Scholarships & fellowships 76,675 41,225 Utilities 1,023, ,655 Other supplies & services 24,510,519 19,840,021 Total operating expenses 62,902,299 57,373,209 Operating loss (29,680,178) (24,874,171) NONOPERATING REVENUES State appropriations 30,422,954 29,995,596 Gifts 3,095,561 1,112,235 Net investment income 278, ,263 Nonoperating revenues, net 33,797,222 31,355,094 Net increase in net position 4,117,044 6,480,923 Net position - beginning of year 30,586,966 24,106,043 Net position - end of year $ 34,704,010 $ 30,586,966 67
70 ALABAMA COOPERATIVE EXTENSION SYSTEM STATEMENTS OF NET POSITION SEPTEMBER 30, 2014 AND 2013 (UNAUDITED) ASSETS Current assets Cash and cash equivalents $ 4,133,280 $ 2,094,058 Operating investments 1,358,976 1,755,660 Accounts receivable, net 2,752,295 3,541,523 Total current assets 8,244,551 7,391,241 Noncurrent assets Investments 25,399,561 24,879,308 Total noncurrent assets 25,399,561 24,879,308 Total assets 33,644,112 32,270,549 LIABILITIES Current liabilities Accounts payable 640, ,269 Accrued salaries and wages 212, ,028 Accrued compensated absences 1,896,066 1,893,734 Unearned revenues 376, ,507 Total current liabilities 3,125,060 3,675,538 Noncurrent liabilities Other noncurrent liabilities 14,340,715 12,791,417 Total noncurrent liabilities 14,340,715 12,791,417 Total liabilities 17,465,775 16,466,955 NET POSITION Restricted Expendable: Scholarships, research, instruction, other 4,768,497 4,970,586 Capital projects 37,133 35,858 Unrestricted 11,372,707 10,797,150 Total net position $ 16,178,337 $ 15,803,594 68
71 ALABAMA COOPERATIVE EXTENSION SYSTEM STATEMENTS OF REVENUES, EXPENSES AND CHANGES IN NET POSITION FOR THE YEARS ENDED SEPTEMBER 30, 2014 AND 2013 (UNAUDITED) OPERATING REVENUES Federal appropriations $ 7,434,153 $ 6,388,290 Federal grants & contracts 6,229,619 6,684,543 State & local grants & contracts 2,376,831 2,816,326 Nongovernmental grants & contracts 588, ,670 Sales & services of educational departments 408, ,528 Other operating revenue 1,569,690 1,105,004 Total operating revenues 18,607,767 18,264,361 OPERATING EXPENSES Compensation & benefits 39,794,600 39,747,464 Utilities 159, ,414 Other supplies & services 10,565,137 13,395,500 Total operating expenses 50,518,824 53,293,378 Operating loss (31,911,057) (35,029,017) NONOPERATING REVENUES State appropriations 31,821,552 31,177,356 Gifts 71,158 95,078 Net investment income 393, ,181 Nonoperating revenues, net 32,285,800 31,620,615 Income (loss) before other changes in net position 374,743 (3,408,402) OTHER CHANGES IN NET POSITION Capital gifts and grants - 1,245 Net increase (decrease) in net position 374,743 (3,407,157) Net position - beginning of year 15,803,594 19,210,751 Net position - end of year $ 16,178,337 $ 15,803,594 69

72 70
73 Financial R eport 2014 R equir ed Supplemental Infor m ation 71
74 REQUIRED SUPPLEMENTAL INFORMATION Determination of Annual Required Contribution (ARC) and End of Year Accrual for Retiree Medical Plan Cost Element Fiscal Year Ended September 30, 2014 Amount Percent of Payroll 1 1. Unfunded actuarial accrued liability at Oct. 1, 2013 $ 64,259,009 2,098.7% Annual Required Contribution (ARC) 2. Normal cost $ 51, Amortization of the unfunded actuarial accrued liability over 15 years using level dollar amortization 4,940, Annual Required Contribution (ARC = 2 + 3) $ 4,992, % Annual OPEB Cost (Expense) 5. ARC $ 4,992, Interest on beginning of year accrual 291, Adjustment to ARC (1,111,234) 8. Fiscal year 2014 OPEB cost ( ) $ 4,172, % End of Year Accrual (Net OPEB Obligation) 2 9. Beginning of year accrual 1 $ 14,564, Annual OPEB cost 4,172, Employer contribution (benefit payments) 2 (2,504,119) 12. End of year CAFR accrual ( ) 2 $ 16,232, % 1 Annual payroll for 36 participants as of September 30, 2014, was $3,061, Actual amounts paid in fiscal year 2014 include claim costs, administrative fees, and PEEHIP subsidy less participant contributions. Three Year Schedule of Percentage of OPEB Cost Contributed Fiscal Year Ended Annual OPEB Cost Percentage of OPEB Cost Contributed 3 Net OPEB Obligation September 30, 2012 $ 4,044, % $ 13,234,687 September 30, 2013 $ 3,810, % $ 14,564,112 September 30, 2014 $ 4,172, % $ 16,232,518 3 Cost Contributed is shown in the Determination of Annual Required contribution and End of Year Accrual. Summary of Key Actuarial Methods and Assumptions Valuation year October 1, 2013 September 30, 2014 Actuarial cost method Unit Credit, Actuarial Cost Method Amortization method 15 years, level dollar open amortization 4 Asset valuation method Discount rate 2.0% Projected payroll growth rate Not applicable Not applicable Health care cost trend rate for medical and prescription drugs 9.0% in fiscal year 2015, decreasing by one-half percentage point per year to an ultimate of 5.0% in fiscal year 2022 and later. 4 Open amortization means a fresh-start each year for the cumulative unrecognized amount. 72
75 Valuation Date October 1, 2013 Monthly Per Capita Claim Costs Age Medical 55 $ $ $ $ $413 Claim costs remained unchanged from last year based on a weighted average of benefit plan premiums. Future claim costs are increased by health care cost trend. Retiree Premiums Retirees contribute 40% and surviving spouses pay 100% of the monthly premiums shown below: As of 1/1/14 As of 1/1/13 Pre-65 Single $472 $472 Pre-65 Family $1,062 $1,062 Post-65 Single $142 $142 Post-65 Family $742 $742 Note: There are several other categories of premiums. Administrative Expenses Included in claim cost. Assumed Health Care Trend Rate Medical and Fiscal Rx Combined Year Rate % % % % % % % % % Spouse Age Difference Mortality Participation Rates Retirement Rates Husbands are assumed to be three years older than wives for current and future retirees who are married. RP-2000 Combined Mortality Projected using Projection Scale BB. 100% of active employees are assumed to elect postretirement health insurance coverage upon retirement. Employees are assumed to retire according to the following schedule: Age Retirement Rate 45 or less 0% % % % 55 10% % 60 20% 61 15% 62 25% % 65 40% % % % 73
76 Withdrawal Rates Disability Rates None assumed since all are long service Civil Service employees. Sample rates are shown below, percent assumed to terminate within one year: Age Male Female % 0.09% % 0.12% % 0.24% % 0.41% % 0.65% % 0.98% % 1.50% Schedule of Employer Contributions Fiscal Year Ended Annual Required Contribution Employer Contribution Percentage Contributed September 30, 2012 $ 4,701,385 $ 2,477, % September 30, 2013 $ 4,555,416 $ 2,480, % September 30, 2014 $ 4,992,477 $ 2,504, % Schedule of Funding Progress Fiscal Year Ended Actuarial Value of Assets (a) Actuarial Accrued Liability (AAL)(b) Unfunded (Overfunded) AAL (UAAL) (b)-(a) Funded Ratio (a)/(b) Covered Payroll (c) UAAL as a Percentage of Covered Payroll [(b)-(a)/(c )] September 30, $ 59,795,647 $ 59,795, % $ 3,866, % September 30, $ 58,200,833 $ 58,200, % $ 3,942, % September 30, $ 64,259,009 $ 64,259, % $ 3,061, % 74


77 AUBURN UNIVERSITY BOARD OF TRUSTEES Auburn University is governed by a Board of Trustees consisting of one member from each congressional district, as these districts were constituted on January 1, 1961, one member from Lee County, three at-large members, all of whom shall be residents of the continental United States, and the Governor, who is ex-officio. The Governor is the President of the Board of Trustees. Prior to 2003, trustees were appointed by the Governor, by and with the consent of the State Senate, for a term of 12 years. Any new trustees will be appointed by a committee, by and with the consent of the State Senate, for a term of seven years, and may serve no more than two full seven-year terms. A member may continue to serve until a successor is confirmed, but in no case for more than one year after the completion of a term. Members of the board receive no compensation. By executive order of the Governor in 1971, two non-voting student representatives selected by the student body serve as members ex-officio, one from the Auburn campus and one from the Montgomery campus. Robert Bentley Governor of Alabama President, Montgomery James W. Rane Abbeville, Third Congressional District President Pro Tempore Charles D. McCrary At-Large Member Vice President Pro Tempore B.T. Roberts Mobile, First Congressional District Clark Sahlie Montgomery, Second Congressional District Bob Dumas Auburn, Third Congressional District Jimmy Sanford Prattville, Fourth Congressional District D. Gaines Lanier Lanett, Fifth Congressional District Elizabeth Huntley Clanton, Sixth Congressional District Sarah B. Newton Fayette, Seventh Congressional District Michael A. DeMaioribus Huntsville, Eighth Congressional District James Pratt Birmingham, Ninth Congressional District Raymond J. Harbert At-Large Member Wayne T. Smith At-Large Member 75
78 This page is intentionally left blank. 76

79


80 Produced by the Auburn University Office of Communications and Marketing, January THIS IS AUBURN. Auburn University is an equal opportunity educational institution/employer.
Auburn University Report on Federal Awards in Accordance with OMB Circular A-133 For the Year Ended September 30, 2015 EIN:
 Auburn University Report on Federal Awards in Accordance with OMB Circular A-133 For the Year Ended September 30, 2015 EIN: 63-6000724 Auburn University Report on Federal Awards in Accordance with OMB
Auburn University Report on Federal Awards in Accordance with OMB Circular A-133 For the Year Ended September 30, 2013 EIN:
 Auburn University Report on Federal Awards in Accordance with OMB Circular A-133 For the Year Ended September 30, 2013 EIN: 63-6000724 Auburn University Report on Federal Awards in Accordance with OMB
Auburn University Report on Federal Awards in Accordance with OMB Circular A-133 For the Year Ended September 30, 2012 EIN:
 Auburn University Report on Federal Awards in Accordance with OMB Circular A-133 For the Year Ended September 30, 2012 EIN: 63-6000724 Auburn University Report on Federal Awards in Accordance with OMB
Auburn University Report on Federal Awards in Accordance with the OMB Uniform Guidance For the Year Ended September 30, 2016 EIN:
 Auburn University Report on Federal Awards in Accordance with the OMB Uniform Guidance For the Year Ended September 30, 2016 EIN: 63-6000724 Auburn University Index Year Ended September 30, 2016 Page(s)
FINANCIAL REPORT. Comprehensive Annual Financial Report for the year ended September 30, 2016
 2016 FINANCIAL REPORT Comprehensive Annual Financial Report for the year ended September 30, 2016 Fina ncial R eport 2016 Comprehensive Annual Financial Report for the year ended September 30, 2016 This
Comprehensive Annual Financial Report for the year ended September 30, 2009
 F i n a n c i a l Report 2009 Comprehensive Annual Financial Report for the year ended September 30, 2009 Auburn University 2009 2 2009 Financial Report Table of Contents INTRODUCTORY SECTION PRESIDENT
Auburn University Report on Federal Awards in Accordance with OMB Circular A-133 For the Year Ended September 30, 2008 EIN:
 Report on Federal Awards in Accordance with OMB Circular A-133 For the Year Ended September 30, 2008 EIN: 63-6000724 Report on Federal Awards in Accordance with OMB Circular A-133 Index September 30, 2008
F i n a n c i a l Report. Comprehensive Annual Financial Report for the year ended September 30, 2010
 F i n a n c i a l Report 2010 Comprehensive Annual Financial Report for the year ended September 30, 2010 2 2010 Financial Report Table of Contents INTRODUCTORY SECTION PRESIDENT S LETTER...6 LETTER OF
Fi n a n c i a l Re p o rt. Auburn University
 2008 Fi n a n c i a l Re p o rt Comprehensive Annual Financial Report For the year ended September 30, 2008 Auburn University 2 2008 Financial Report Table of Contents INTRODUCTORY SECTION PRESIDENT S
Comprehensive Annual Financial Report For the year ended September 30, 2007
 2007 Financial Report Comprehensive Annual Financial Report For the year ended September 30, 2007 2007 Financial Report This report was prepared by the Office of Associate Vice President for Business &
January 2019 Auburn University is an equal opportunity educational institution/employer.
 Annual Financial Report for the year ended September 30, 2018 www.auburn.edu January 2019 Auburn University is an equal opportunity educational institution/employer. Annual Financial Report for the year
AUBURN UNIVERSITY FINANCIAL REPORT
 2002-2003 AUBURN UNIVERSITY FINANCIAL REPORT Cover Design by Tracey Spates, Communications & Marketing Photographs by Photographic Services Auburn University Auburn University Comprehensive Annual Financial
MORGAN STATE UNIVERSITY. Financial Statements Together with Report of Independent Public Accountants
 Financial Statements Together with Report of Independent Public Accountants Years Ended JUNE 30, 2016 AND 2015 CONTENTS REPORT OF INDEPENDENT PUBLIC ACCOUNTANTS 1 MANAGEMENT S DISCUSSION AND ANALYSIS 3
WINSTON-SALEM STATE UNIVERSITY
 STATE OF NORTH f CAROLINA OFFICE OF THE STATE AUDITOR BETH A. WOOD, CPA WINSTON-SALEM STATE UNIVERSITY WINSTON-SALEM, NORTH CAROLINA FINANCIAL STATEMENT AUDIT REPORT FOR THE YEAR ENDED JUNE 30, 2018 A
University of NORTH ALABAMA FINANCIAL REPORT 2017
 University of NORTH ALABAMA FINANCIAL REPORT 2017 Table of Contents September 30, 2016 PART I FINANCIAL STATEMENTS Independent Auditor s Report... 1 Management s Discussion and Analysis... 4 Statement
2017 Annual Financial Report
 2017 Annual Financial Report Consolidated Financial Statements as of and for the Years Ended June 30, 2017 and 2016, Independent Auditors Report, and Management s Discussion and Analysis 3 Independent
MORGAN STATE UNIVERSITY. Financial Statements Together with Report of Independent Public Accounts
 Financial Statements Together with Report of Independent Public Accounts For the Years Ended JUNE 30, 2013 AND 2012 CONTENTS REPORT OF INDEPENDENT PUBLIC ACCOUNTANTS 1 MANAGEMENT S DISCUSSION AND ANALYSIS
CALIFORNIA STATE UNIVERSITY, NORTHRIDGE. Financial Statements. June 30, (With Independent Auditors Report Thereon)
") Financial Statements (With Independent Auditors Report Thereon) Table of Contents Page Independent Auditors Report 1 Management s Discussion and Analysis 3 Basic Financial Statements: Statement of Net
Financial Statements (With Independent Auditors Report Thereon) Table of Contents Page Independent Auditors Report 1 Management s Discussion and Analysis 3 Basic Financial Statements: Statement of Net
UNIVERSITY OF SOUTH ALABAMA (A Component Unit of the State of Alabama)
") Basic Financial Statements and Supplementary Information on Federal Awards Programs September 30, 2009 Basic Financial Statements Table of Contents Management s Discussion and Analysis (Unaudited) 1 Independent
Basic Financial Statements and Supplementary Information on Federal Awards Programs September 30, 2009 Basic Financial Statements Table of Contents Management s Discussion and Analysis (Unaudited) 1 Independent
MOREHEAD STATE UNIVERSITY. Single Audit Reports Under Uniform Guidance
 Single Audit Reports Under Uniform Guidance As of and for the Years Ended June 30, 2017 and 2016 with Report of Independent Auditors M CONTENTS Management s Discussion and Analysis... 1 Report of Independent
Table of Contents. On the cover:the YOU OF A
 University of Arkansas Annual Financial Report 2009-2010 Table of Contents Presentation Letter 3 Financial Highlights 4 Enrollment Data 8 Independent Auditor's Report 13 Management Discussion and Analysis
CALIFORNIA STATE UNIVERSITY, CHICO. Financial Statements. June 30, (With Independent Auditors Report Thereon)
") Financial Statements (With Independent Auditors Report Thereon) Table of Contents Page Independent Auditors Report 1 Management s Discussion and Analysis (unaudited) 3 Financial Statements: Statement of
Financial Statements (With Independent Auditors Report Thereon) Table of Contents Page Independent Auditors Report 1 Management s Discussion and Analysis (unaudited) 3 Financial Statements: Statement of
SOUTHEAST MISSOURI STATE UNIVERSITY FINANCIAL STATEMENTS JUNE 30, 2018
 SOUTHEAST MISSOURI STATE UNIVERSITY FINANCIAL STATEMENTS JUNE 30, 2018 Contents Page Independent Auditors Report... 1-3 Management s Discussion And Analysis... 4-11 Financial Statements Statement Of Net
SAN FRANCISCO STATE UNIVERSITY. Financial Statements. June 30, (With Independent Auditors Report Thereon)
") Financial Statements (With Independent Auditors Report Thereon) Table of Contents Page(s) Independent Auditors Report 1 2 Management s Discussion and Analysis (Unaudited) 3 14 Financial Statements: Statement
Financial Statements (With Independent Auditors Report Thereon) Table of Contents Page(s) Independent Auditors Report 1 2 Management s Discussion and Analysis (Unaudited) 3 14 Financial Statements: Statement
University of Montevallo Financial Statements and Report on Federal Financial Assistance Programs In Accordance with the OMB Uniform Guidance For the
 Financial Statements and Report on Federal Financial Assistance Programs In Accordance with the OMB Uniform Guidance For the Year Ended September 30, 2017 EIN 63-6000720 Index Page(s) Report of Independent
Financial Statements and Supplemental Information and Data Together with Report of Independent Public Accountants
 Financial Statements and Supplemental Information and Data Together with Report of Independent Public Accountants For the Years Ended June 30, 2017 and 2016 This page intentionally left blank. UNIVERSITY
UNIVERSITY SYSTEM OF MARYLAND. Financial Statements and Supplemental Data Together with Report of Independent Public Accountants
 Financial Statements and Supplemental Data Together with Report of Independent Public Accountants For the Years Ended June 30, 2014 and 2013 Page REPORT OF INDEPENDENT PUBLIC ACCOUNTANTS 1 MANAGEMENT'S
UNIVERSITY OF SOUTH ALABAMA (A Component Unit of the State of Alabama)
") Basic Financial Statements and Supplementary Information on Federal Awards Programs Table of Contents Management s Discussion and Analysis (Unaudited) 1 Independent Auditors Report 13 Basic Financial Statements:
Basic Financial Statements and Supplementary Information on Federal Awards Programs Table of Contents Management s Discussion and Analysis (Unaudited) 1 Independent Auditors Report 13 Basic Financial Statements:
UNIVERSITY OF SOUTH ALABAMA (A Component Unit of the State of Alabama)
") Basic Financial Statements and Single Audit Reporting in Accordance with the Uniform Guidance Table of Contents Management s Discussion and Analysis (Unaudited) 1 Independent Auditors Report 15 Basic Financial
Basic Financial Statements and Single Audit Reporting in Accordance with the Uniform Guidance Table of Contents Management s Discussion and Analysis (Unaudited) 1 Independent Auditors Report 15 Basic Financial
Table of Contents. On the cover: Morning Clock University Relations
 University of Arkansas Annual Financial Report 2008-2009 Table of Contents Presentation Letter 3 Financial Highlights 4 Enrollment Data 8 Independent Auditor's Report 13 Management Discussion and Analysis
WINSTON-SALEM STATE UNIVERSITY
 STATE OF NORTH f CAROLINA OFFICE OF THE STATE AUDITOR BETH A. WOOD, CPA WINSTON-SALEM STATE UNIVERSITY WINSTON-SALEM, NORTH CAROLINA FINANCIAL STATEMENT AUDIT REPORT FOR THE YEAR ENDED JUNE 30, 2017 A
SOUTHWESTERN OKLAHOMA STATE UNIVERSITY
 SOUTHWESTERN OKLAHOMA STATE UNIVERSITY A DEPARTMENT OF THE REGIONAL UNIVERSITY SYSTEM OF OKLAHOMA ANNUAL FINANCIAL STATEMENTS AND INDEPENDENT AUDITOR S REPORT AS OF AND FOR THE YEAR ENDED JUNE 30, 2016
STATE OF NORTH CAROLINA
 STATE OF NORTH CAROLINA WINSTON-SALEM STATE UNIVERSITY WINSTON-SALEM, NORTH CAROLINA FINANCIAL STATEMENT AUDIT REPORT FOR THE YEAR ENDED JUNE 30, 2010 OFFICE OF THE STATE AUDITOR BETH A. WOOD, CPA STATE
KENTUCKY STATE UNIVERSITY (A Component Unit of the Commonwealth of Kentucky) FINANCIAL STATEMENTS June 30, 2018
 FINANCIAL STATEMENTS June 30, 2018") (A Component Unit of the Commonwealth of Kentucky) FINANCIAL STATEMENTS FINANCIAL STATEMENTS CONTENTS INDEPENDENT AUDITOR S REPORT... 1 MANAGEMENT'S DISCUSSION AND ANALYSIS... 3 FINANCIAL STATEMENTS KENTUCKY
(A Component Unit of the Commonwealth of Kentucky) FINANCIAL STATEMENTS FINANCIAL STATEMENTS CONTENTS INDEPENDENT AUDITOR S REPORT... 1 MANAGEMENT'S DISCUSSION AND ANALYSIS... 3 FINANCIAL STATEMENTS KENTUCKY
Washburn University of Topeka
 Accountants Report and Financial Statements (Including Reports Required Under OMB-133) June 30, 2005 and 2004 June 30, 2005 and 2004 Contents Independent Accountants Report on Financial Statements and
OKLAHOMA STATE UNIVERSITY. June 30, 2011
 OKLAHOMA STATE UNIVERSITY June 30, 2011 OKLAHOMA STATE UNIVERSITY June 30, 2011 AUDITED FINANCIAL STATEMENTS Independent Auditors Report... 1 Management s Discussion and Analysis... 3 Statements of Net
LETTER FROM THE EXECUTIVE VICE CHANCELLOR, CHIEF FINANCIAL OFFICER
 LETTER FROM THE EXECUTIVE VICE CHANCELLOR, CHIEF FINANCIAL OFFICER The California State University is a remarkable institution that is comprised of 23 campuses offering an outstanding education to 438,157
Financial Statements and Supplemental Data Together with Report of Independent Public Accountants
 Financial Statements and Supplemental Data Together with Report of Independent Public Accountants For the Years Ended June 30, 2016 and 2015 This page intentionally left blank. UNIVERSITY SYSTEM OF MARYLAND
UNIVERSITY SYSTEM OF MARYLAND. Financial Statements and Supplemental Data Together with Report of Independent Public Accountants
 Financial Statements and Supplemental Data Together with Report of Independent Public Accountants For the Years Ended June 30, 2013 and 2012 Page REPORT OF INDEPENDENT PUBLIC ACCOUNTANTS 1 MANAGEMENT'S
TRUMAN STATE UNIVERSITY A COMPONENT UNIT OF THE STATE OF MISSOURI FINANCIAL STATEMENTS JUNE 30, 2017
 A COMPONENT UNIT OF THE STATE OF MISSOURI FINANCIAL STATEMENTS JUNE 30, 2017 Contents Page Independent Auditors Report... 1-2 Management s Discussion And Analysis... 3-12 Financial Statements Statement
STATE OF MISSISSIPPI INSTITUTIONS OF HIGHER LEARNING. Financial Statements. June 30, 2017 and (With Independent Auditors Reports Thereon)
") Financial Statements (With Independent Auditors Reports Thereon) (THIS PAGE LEFT BLANK INTENTIONALLY) Table of Contents Independent Auditors Report 1 Management s Discussion and Analysis (Unaudited) 4
Financial Statements (With Independent Auditors Reports Thereon) (THIS PAGE LEFT BLANK INTENTIONALLY) Table of Contents Independent Auditors Report 1 Management s Discussion and Analysis (Unaudited) 4
Jacksonville State University Financial Statements September 30, 2017 and 2016
 Financial Statements September 30, 2017 and 2016 Table of Contents September 30, 2017 and 2016 PART I FINANCIAL STATEMENTS PAGE Independent Auditor s Report... 1 Management s Discussion and Analysis...
ANNUAL FINANCIAL REPORT. June 30, 2016
 ANNUAL FINANCIAL REPORT June 30, 2016 NORTH DAKOTA UNIVERSITY SYSTEM ANNUAL FINANCIAL REPORT Fiscal Year Ended JUNE 30, 2016 Prepared by the North Dakota University System Director of Financial Reporting
SOUTHEAST MISSOURI STATE UNIVERSITY FINANCIAL STATEMENTS JUNE 30, 2016
 SOUTHEAST MISSOURI STATE UNIVERSITY FINANCIAL STATEMENTS JUNE 30, 2016 Contents Page Independent Auditors Report... 1-3 Management s Discussion And Analysis... 4-13 Financial Statements Statement Of Net
ANNUAL FINANCIAL REPORT. June 30, 2017
 ANNUAL FINANCIAL REPORT June 30, 2017 NORTH DAKOTA UNIVERSITY SYSTEM ANNUAL FINANCIAL REPORT Fiscal Year Ended JUNE 30, 2017 Prepared by the North Dakota University System Director of Financial Reporting
Cleveland State University (a component unit of the State of Ohio) Financial Report with Supplemental Information June 30, 2018
 Financial Report with Supplemental Information June 30, 2018") Cleveland State University (a component unit of the State of Ohio) Financial Report with Supplemental Information June 30, 2018 Contents Independent Auditor s Report 1-3 Management s Discussion and Analysis
Cleveland State University (a component unit of the State of Ohio) Financial Report with Supplemental Information June 30, 2018 Contents Independent Auditor s Report 1-3 Management s Discussion and Analysis
Washburn University of Topeka
 Accountants Report and Financial Statements (Including Reports Required Under OMB-133) June 30, 2006 and 2005 June 30, 2006 and 2005 Contents Independent Accountants Report on Financial Statements and
NORTHWESTERN OKLAHOMA STATE UNIVERSITY
 NORTHWESTERN OKLAHOMA STATE UNIVERSITY A DEPARTMENT OF THE REGIONAL UNIVERSITY SYSTEM OF OKLAHOMA ANNUAL FINANCIAL STATEMENTS AND INDEPENDENT AUDITOR S REPORT AS OF AND FOR THE YEAR ENDED JUNE 30, 2015
UNIVERSITY OF ALASKA
 UNIVERSITY OF ALASKA (A Component Unit of the State of Alaska) Financial Statements (With Independent Auditors Report Thereon) University of Alaska (A Component Unit of the State of Alaska) Financial Statements
Missouri Southern State University (A Component Unit of the State of Missouri) Independent Auditor s Reports and Financial Statements
 Independent Auditor s Reports and Financial Statements") (A Component Unit of the State of Missouri) Independent Auditor s Reports and Financial Statements Contents Independent Auditor s Report... 1 Management s Discussion and Analysis... 3 Financial Statements
(A Component Unit of the State of Missouri) Independent Auditor s Reports and Financial Statements Contents Independent Auditor s Report... 1 Management s Discussion and Analysis... 3 Financial Statements
The following document was not prepared by the Office of the State Auditor, but was prepared by and submitted to the Office of the State Auditor by a
 The following document was not prepared by the Office of the State Auditor, but was prepared by and submitted to the Office of the State Auditor by a private CPA firm. The document was placed on this web
(A component unit of the State of Ohio) Financial Report. With Supplemental Information
 Financial Report. With Supplemental Information") (A component unit of the State of Ohio) Financial Report With Supplemental Information June 30, 2017 Board of Trustees The University of Akron 302 Butchel Common Akron, Ohio 44325 We have reviewed the
(A component unit of the State of Ohio) Financial Report With Supplemental Information June 30, 2017 Board of Trustees The University of Akron 302 Butchel Common Akron, Ohio 44325 We have reviewed the
UNIVERSITY OF ALASKA
 UNIVERSITY OF ALASKA (A Component Unit of the State of Alaska) Financial Statements (With Independent Auditors Report Thereon) University of Alaska (A Component Unit of the State of Alaska) Financial Statements
MURRAY STATE UNIVERSITY A COMPONENT UNIT OF THE COMMONWEALTH OF KENTUCKY FINANCIAL STATEMENTS JUNE 30, 2011
 A COMPONENT UNIT OF THE COMMONWEALTH OF KENTUCKY FINANCIAL STATEMENTS JUNE 30, 2011 Contents Page Independent Auditors Report... 1-2 Management s Discussion and Analysis... 3-16 Financial Statements Statements
CALIFORNIA STATE UNIVERSITY, POMONA. Financial Statements. June 30, (With Independent Auditors Report Thereon)
") Financial Statements (With Independent Auditors Report Thereon) Table of Contents Page Independent Auditors Report 1 Management s Discussion and Analysis (Unaudited) 3 Financial Statements: Statement of
Financial Statements (With Independent Auditors Report Thereon) Table of Contents Page Independent Auditors Report 1 Management s Discussion and Analysis (Unaudited) 3 Financial Statements: Statement of
STATE OF NORTH CAROLINA
 STATE OF NORTH CAROLINA WINSTON-SALEM STATE UNIVERSITY WINSTON-SALEM, NORTH CAROLINA FINANCIAL STATEMENT AUDIT REPORT FOR THE YEAR ENDED JUNE 30, 2012 OFFICE OF THE STATE AUDITOR BETH A. WOOD, CPA STATE
Idaho State University
 Idaho State University Financial Statements for the Years Ended June 30, 2003 and 2002 and Independent Auditors Reports Including Single Audit Reports for the Year Ended June 30, 2003 IDAHO STATE UNIVERSITY
WESTERN KENTUCKY UNIVERSITY REPORT ON AUDIT OF INSTITUTION OF HIGHER EDUCATION IN ACCORDANCE WITH OMB CIRCULAR A-133 June 30, 2006 and 2005
 REPORT ON AUDIT OF INSTITUTION OF HIGHER EDUCATION IN ACCORDANCE WITH OMB CIRCULAR A-133 June 30, 2006 and 2005 REPORT ON AUDIT OF INSTITUTION OF HIGHER EDUCATION IN ACCORDANCE WITH OMB CIRCULAR A-133
Washburn University of Topeka
 Accountants Report and Financial Statements (Including Reports Required Under OMB-133) June 30, 2008 and 2007 June 30, 2008 and 2007 Contents Independent Accountants Report on Financial Statements and
CENTRAL STATE UNIVERSITY Wilberforce, Ohio. FINANCIAL STATEMENTS June 30, 2017 and 2016
 Wilberforce, Ohio FINANCIAL STATEMENTS Wilberforce, Ohio FINANCIAL STATEMENTS CONTENTS INDEPENDENT AUDITOR S REPORT... 1 MANAGEMENT S DISCUSSION AND ANALYSIS (UNAUDITED)... 3 FINANCIAL STATEMENTS STATEMENTS
Ohio University (a component unit of the State of Ohio) Financial Statements June 30, 2017 and 2016
 Financial Statements June 30, 2017 and 2016") (a component unit of the State of Ohio) Financial Statements Contents Independent Auditor s Report 1-3 Financial Statements Management s Discussion and Analysis 4-12 Statements of Net Position 13-14 Statements
(a component unit of the State of Ohio) Financial Statements Contents Independent Auditor s Report 1-3 Financial Statements Management s Discussion and Analysis 4-12 Statements of Net Position 13-14 Statements
UNIVERSITY OF CENTRAL MISSOURI A COMPONENT UNIT OF THE STATE OF MISSOURI FINANCIAL STATEMENTS JUNE 30, 2017
 A COMPONENT UNIT OF THE STATE OF MISSOURI FINANCIAL STATEMENTS JUNE 30, 2017 Contents Page Independent Auditors Report... 1-3 Management s Discussion And Analysis... 4-19 Financial Statements Statement
CLARION UNIVERSITY OF PENNSYLVANIA OF THE STATE SYSTEM OF HIGHER EDUCATION FINANCIAL STATEMENTS AND SUPPLEMENTARY INFORMATION
 FINANCIAL STATEMENTS AND SUPPLEMENTARY INFORMATION YEARS ENDED TABLE OF CONTENTS YEARS ENDED INDEPENDENT AUDITORS' REPORT 1 FINANCIAL STATEMENTS BALANCE SHEETS PRIMARY INSTITUTION 3 STATEMENTS OF REVENUES,
WILKES COMMUNITY COLLEGE
 STATE OF NORTH CAROLINA OFFICE OF THE STATE AUDITOR BETH A. WOOD, CPA WILKES COMMUNITY COLLEGE WILKESBORO, NORTH CAROLINA FINANCIAL STATEMENT AUDIT REPORT FOR THE YEAR ENDED JUNE 30, 2018 A COMPONENT UNIT
Table of Contents. On the cover: Old Main Clock Tower University Relations
 Table of Contents Presentation Letter 3 Financial Highlights 4 Enrollment Data 8 Independent Auditor's Report 13 Management Discussion and Analysis 14 Statement of Net Assets 24 Statement of Revenue, Expenses,
STATE OF ILLINOIS ILLINOIS STATE UNIVERSITY. FINANCIAL AUDIT (In Accordance with the Single Audit Act and OMB Circular A-133)
") STATE OF ILLINOIS ILLINOIS STATE UNIVERSITY FINANCIAL AUDIT (In Accordance with the Single Audit Act and OMB Circular A-133) For The Years Ended June 30, 2009 and 2008 Performed as Special Assistant Auditors
STATE OF ILLINOIS ILLINOIS STATE UNIVERSITY FINANCIAL AUDIT (In Accordance with the Single Audit Act and OMB Circular A-133) For The Years Ended June 30, 2009 and 2008 Performed as Special Assistant Auditors
Missouri Southern State University (A Component Unit of the State of Missouri) Independent Auditor s Reports and Financial Statements
 Independent Auditor s Reports and Financial Statements") (A Component Unit of the State of Missouri) Independent Auditor s Reports and Financial Statements Contents Independent Auditor s Report... 1 Management s Discussion and Analysis... 3 Financial Statements
(A Component Unit of the State of Missouri) Independent Auditor s Reports and Financial Statements Contents Independent Auditor s Report... 1 Management s Discussion and Analysis... 3 Financial Statements
2018 Annual Financial Report
 2018 Annual Financial Report 1 Consolidated Financial Statements as of and for the Years Ended June 30, 2018 and 2017, Independent Auditors Report, and Management s Discussion and Analysis 3 Independent
WESTERN KENTUCKY UNIVERSITY Bowling Green, Kentucky
 Bowling Green, Kentucky REPORT ON AUDIT OF INSTITUTION OF HIGHER EDUCATION IN ACCORDANCE WITH UNIFORM GUIDANCE June 30, 2018 Bowling Green, Kentucky REPORT ON AUDIT OF INSTITUTION OF HIGHER EDUCATION IN
SOUTHWESTERN OKLAHOMA STATE UNIVERSITY ANNUAL FINANCIAL STATEMENTS AND INDEPENDENT AUDITOR S REPORTS AS OF AND FOR THE YEAR ENDED JUNE 30, 2014
 SOUTHWESTERN OKLAHOMA STATE UNIVERSITY ANNUAL FINANCIAL STATEMENTS AND INDEPENDENT AUDITOR S REPORTS AS OF AND FOR THE YEAR ENDED JUNE 30, 2014 AUDITED FINANCIAL STATEMENTS Independent Auditors Report...
SAN JOSE STATE UNIVERSITY. Financial Statements. June 30, (With Independent Auditors Report Thereon)
") Financial Statements (With Independent Auditors Report Thereon) Table of Contents Page Independent Auditors Report 1 Management s Discussion and Analysis 3 Financial Statements: Statement of Net Assets
Financial Statements (With Independent Auditors Report Thereon) Table of Contents Page Independent Auditors Report 1 Management s Discussion and Analysis 3 Financial Statements: Statement of Net Assets
 Table of Contents Presentation Letter 3 Financial Highlights 4 Enrollment Data 8 Independent Auditor's Report 13 Management Discussion and Analysis 14 Statement of Net Assets 24 Statement of Revenue, Expenses,
NORTH CAROLINA AGRICULTURAL AND TECHNICAL STATE UNIVERSITY
 STATE OF NORTH f CAROLINA OFFICE OF THE STATE AUDITOR BETH A. WOOD, CPA NORTH CAROLINA AGRICULTURAL AND TECHNICAL STATE UNIVERSITY GREENSBORO, NORTH CAROLINA FINANCIAL STATEMENT AUDIT REPORT FOR THE YEAR
CALIFORNIA POLYTECHNIC STATE UNIVERSITY, SAN LUIS OBISPO. Financial Statements. June 30, (With Independent Auditors Report Thereon)
") Financial Statements (With Independent Auditors Report Thereon) Table of Contents Page Independent Auditors Report 1 Management s Discussion and Analysis 3 Financial Statements: Statement of Net Assets
Financial Statements (With Independent Auditors Report Thereon) Table of Contents Page Independent Auditors Report 1 Management s Discussion and Analysis 3 Financial Statements: Statement of Net Assets
Financial Statements and Reports Required by Uniform Guidance June 30, 2018 and 2017 The University of Oklahoma - Norman Campus
 Financial Statements and Reports Required by Uniform Guidance June 30, 2018 and 2017 The University of Oklahoma - Norman Campus eidebailly.com Table of Contents June 30, 2018 and 2017 Independent Auditor
Cleveland State University (a component unit of the State of Ohio) Financial Report Including Supplemental Information June 30, 2015
 Financial Report Including Supplemental Information June 30, 2015") Cleveland State University (a component unit of the State of Ohio) Financial Report Including Supplemental Information June 30, 2015 Contents Report of Independent Auditors 1-3 Management s Discussion
Cleveland State University (a component unit of the State of Ohio) Financial Report Including Supplemental Information June 30, 2015 Contents Report of Independent Auditors 1-3 Management s Discussion
STATE OF MISSISSIPPI INSTITUTIONS OF HIGHER LEARNING. Financial Statements. June 30, 2014 and (With Independent Auditors Reports Thereon)
") Financial Statements (With Independent Auditors Reports Thereon) (THIS PAGE LEFT BLANK INTENTIONALLY) Table of Contents Independent Auditors Report 1 Management s Discussion and Analysis (Unaudited) 4
Financial Statements (With Independent Auditors Reports Thereon) (THIS PAGE LEFT BLANK INTENTIONALLY) Table of Contents Independent Auditors Report 1 Management s Discussion and Analysis (Unaudited) 4
WESTFIELD STATE UNIVERSITY (an agency of the Commonwealth of Massachusetts) FINANCIAL STATEMENTS AND MANAGEMENT S DISCUSSION AND ANALYSIS
 FINANCIAL STATEMENTS AND MANAGEMENT S DISCUSSION AND ANALYSIS") FINANCIAL STATEMENTS AND MANAGEMENT S DISCUSSION AND ANALYSIS JUNE 30, 2016 Financial Statements and Management s Discussion and Analysis June 30, 2016 C O N T E N T S Independent Auditors Report 1-2 Management
FINANCIAL STATEMENTS AND MANAGEMENT S DISCUSSION AND ANALYSIS JUNE 30, 2016 Financial Statements and Management s Discussion and Analysis June 30, 2016 C O N T E N T S Independent Auditors Report 1-2 Management
ILLINOIS STATE UNIVERSITY 1
 REPORT OF THE COMPTROLLER (In Accordance with the Single Audit Act And OMB Circular A-133) For Years Ended June 30, 2008 and 2007 TABLE OF CONTENTS Page Board of Trustees and Administration 2 Letter of
WESTERN KENTUCKY UNIVERSITY REPORT ON AUDIT OF INSTITUTION OF HIGHER EDUCATION IN ACCORDANCE WITH OMB CIRCULAR A-133 June 30, 2009 and 2008
 REPORT ON AUDIT OF INSTITUTION OF HIGHER EDUCATION IN ACCORDANCE WITH OMB CIRCULAR A-133 REPORT ON AUDIT OF INSTITUTION OF HIGHER EDUCATION IN ACCORDANCE WITH OMB CIRCULAR A-133 CONTENTS REPORT OF INDEPENDENT
WESTERN KENTUCKY UNIVERSITY. REPORT ON AUDIT OF INSTITUTION OF HIGHER EDUCATION IN ACCORDANCE WITH OMB CIRCULAR A-133 June 30, 2010 and 2009
 REPORT ON AUDIT OF INSTITUTION OF HIGHER EDUCATION IN ACCORDANCE WITH OMB CIRCULAR A-133 REPORT ON AUDIT OF INSTITUTION OF HIGHER EDUCATION IN ACCORDANCE WITH OMB CIRCULAR A-133 CONTENTS REPORT OF INDEPENDENT
WESTERN KENTUCKY UNIVERSITY Bowling Green, Kentucky
 Bowling Green, Kentucky REPORT ON AUDIT OF INSTITUTION OF HIGHER EDUCATION IN ACCORDANCE WITH UNIFORM GUIDANCE June 30, 2016 Bowling Green, Kentucky REPORT ON AUDIT OF INSTITUTION OF HIGHER EDUCATION IN
CALIFORNIA STATE UNIVERSITY, CHANNEL ISLANDS FOUNDATION
 CALIFORNIA STATE UNIVERSITY, CHANNEL ISLANDS FOUNDATION Financial Statements and Supplementary Information for the Year Ended June 30, 2017 and Independent Auditors Report TABLE OF CONTENTS Page FINANCIAL
STATE OF MISSISSIPPI INSTITUTIONS OF HIGHER LEARNING. Financial Statements. June 30, 2016 and (With Independent Auditors Reports Thereon)
") Financial Statements (With Independent Auditors Reports Thereon) (THIS PAGE LEFT BLANK INTENTIONALLY) Table of Contents Independent Auditors Report 1 Management s Discussion and Analysis (Unaudited) 4
Financial Statements (With Independent Auditors Reports Thereon) (THIS PAGE LEFT BLANK INTENTIONALLY) Table of Contents Independent Auditors Report 1 Management s Discussion and Analysis (Unaudited) 4
Oklahoma State University
 Oklahoma State University June 30, 2010 OKLAHOMA STATE UNIVERSITY June 30, 2010 AUDITED FINANCIAL STATEMENTS Independent Auditors Report... 1 Management s Discussion and Analysis... 3 Statements of Net
Cleveland State University (a component unit of the State of Ohio) Financial Report Including Supplemental Information June 30, 2017
 Financial Report Including Supplemental Information June 30, 2017") Cleveland State University (a component unit of the State of Ohio) Financial Report Including Supplemental Information June 30, 2017 Contents Report of Independent Auditors 1-3 Management s Discussion
Cleveland State University (a component unit of the State of Ohio) Financial Report Including Supplemental Information June 30, 2017 Contents Report of Independent Auditors 1-3 Management s Discussion
Report on the. Troy University. Troy, Alabama October 1, 2004 through September 30, Filed: August 4, 2006
 Report on the Troy, Alabama October 1, 2004 through September 30, 2005 Filed: August 4, 2006 Department of Examiners of Public Accounts 50 North Ripley Street, Room 3201 P.O. Box 302251 Montgomery, Alabama
SONOMA STATE UNIVERSITY. Financial Statements. June 30, (With Independent Auditors Report Thereon)
") Financial Statements (With Independent Auditors Report Thereon) Table of Contents Page Independent Auditors Report 1 Management s Discussion and Analysis 3 Financial Statements: Statement of Net Assets
Financial Statements (With Independent Auditors Report Thereon) Table of Contents Page Independent Auditors Report 1 Management s Discussion and Analysis 3 Financial Statements: Statement of Net Assets
Missouri Western State University A Component Unit of the State of Missouri
 Accountants Report and Financial Statements (Including Reports Required Under OMB-133) June 30, 2005 and 2004 June 30, 2005 and 2004 Contents Management s Introduction... 1 Independent Accountants Report
ST. CHARLES COMMUNITY COLLEGE FINANCIAL STATEMENTS FOR THE YEARS ENDED JUNE 30, 2018 AND 2017
 ST. CHARLES COMMUNITY COLLEGE FINANCIAL STATEMENTS FOR THE YEARS ENDED JUNE 30, 2018 AND 2017 ST. CHARLES COMMUNITY COLLEGE CONTENTS PAGE INDEPENDENT AUDITORS REPORT 1 MANAGEMENT S DISCUSSION AND ANALYSIS
DURHAM TECHNICAL COMMUNITY COLLEGE
 STATE OF NORTH CAROLINA OFFICE OF THE STATE AUDITOR BETH A. WOOD, CPA DURHAM TECHNICAL COMMUNITY COLLEGE DURHAM, NORTH CAROLINA FINANCIAL STATEMENT AUDIT REPORT FOR THE YEAR ENDED JUNE 30, 2015 A COMPONENT
CALIFORNIA STATE UNIVERSITY, FRESNO. Financial Statements. June 30, (With Independent Auditors Report Thereon)
") Financial Statements (With Independent Auditors Report Thereon) Table of Contents Page Independent Auditors Report 1 Management s Discussion and Analysis 3 Financial Statements: Statement of Net Assets
Financial Statements (With Independent Auditors Report Thereon) Table of Contents Page Independent Auditors Report 1 Management s Discussion and Analysis 3 Financial Statements: Statement of Net Assets
FINANCIAL STATEMENTS University of South Alabama Year ended September 30, 2002 with Report of Independent Auditors
 FINANCIAL STATEMENTS University of South Alabama Year ended September 30, 2002 with Report of Independent Auditors Financial Statements Year ended September 30, 2002 Contents Management s Discussion and
UNIVERSITY OF ALASKA
 UNIVERSITY OF ALASKA (A Component Unit of the State of Alaska) Financial Statements (With Independent Auditors Report Thereon) University of Alaska (A Component Unit of the State of Alaska) Financial Statements
CALIFORNIA STATE UNIVERSITY, EAST BAY. Financial Statements. June 30, (With Independent Auditors Report Thereon)
") Financial Statements (With Independent Auditors Report Thereon) Table of Contents Page Independent Auditors Report 1 Management s Discussion and Analysis 3 Financial Statements: Statement of Net Assets
Financial Statements (With Independent Auditors Report Thereon) Table of Contents Page Independent Auditors Report 1 Management s Discussion and Analysis 3 Financial Statements: Statement of Net Assets
Financial statements and report of independent certified public accountants Oklahoma State University June 30, 2006 and 2005
 Financial statements and report of independent certified public accountants Oklahoma State University June 30, 2006 and 2005 C O N T E N T S Page MANAGEMENT S DISCUSSION AND ANALYSIS i REPORT OF INDEPENDENT
FINANCIAL STATEMENTS AND INDEPENDENT AUDITOR S REPORTS YEAR ENDED JUNE 30, 2017 TABLE OF CONTENTS
 FINANCIAL STATEMENTS AND INDEPENDENT AUDITOR S REPORTS YEAR ENDED JUNE 30, 2017 TABLE OF CONTENTS Page MANAGEMENT S LETTER... 1 INDEPENDENT AUDITOR S REPORT... 2-4 MANAGEMENT S DISCUSSION AND ANALYSIS...
The following document was not prepared by the Office of the State Auditor, but was prepared by and submitted to the Office of the State Auditor by a
 The following document was not prepared by the Office of the State Auditor, but was prepared by and submitted to the Office of the State Auditor by a private CPA firm. The document was placed on this web
INDEPENDENT AUDITORS REPORT 1 MANAGEMENT S DISCUSSION AND ANALYSIS Statements of Net Assets 11
 University of Idaho Financial Statements for the Years Ended June 30, 2003 and 2002 and Independent Auditors Report Including Single Audit Reports for the Year Ended June 30, 2003 UNIVERSITY OF IDAHO TABLE
FINANCIAL STATEMENTS FISCAL YEAR 2017
 FINANCIAL STATEMENTS FISCAL YEAR 2017 REPORT OF INDEPENDENT AUDITORS AND FINANCIAL STATEMENTS JUNE 30, 2017 AND 2016 INCLUDING SINGLE AUDIT REPORTS FOR THE YEAR ENDED JUNE 30, 2017 PHOTO BY BROOKE SUTTON