Table of Contents. On the cover:the YOU OF A
|
|
|
- John Page
- 5 years ago
- Views:
Transcription

1 University of Arkansas Annual Financial Report
2 Table of Contents Presentation Letter 3 Financial Highlights 4 Enrollment Data 8 Independent Auditor's Report 13 Management Discussion and Analysis 14 Statement of Net Assets 26 Statement of Revenue, Expenses, and Changes in Net Assets 28 Statement of Cash Flows 30 Component Unit Schedules 32 Notes to Financial Statements 43 Required Supplemental Information-OPEB 91 On the cover:the YOU OF A
3
4
5 FISCAL YEAR 2010 OPERATING REVENUES Student tuition and fees 104,940,650 Federal appropriations 10,962,787 County appropriations 2,920,742 Federal grants and contracts 33,763,850 State and local grants and contracts 16,308,318 Non-governmental grants and contracts 18,731,077 Sales and services of educational departments 22,799,767 Auxiliary enterprises 107,745,823 Other operating revenues 6,677,248 Total operating revenues 324,850,262 FISCAL YEAR 2010 NONOPERATING REVENUES State appropriations 198,554,670 Gifts 48,714,610 Investment Income 16,143,684 Federal grants (non-exchange) 25,318,612 State & local grants (non-exchange) 11,047,508 Non-governmental grants (non-exchange) 571,587 Other nonoperating revenues 2,266,357 Total nonoperating revenues 302,617,028


 State & local grants (non-exchange) Non-governmental grants (non-exchange)")
6 Fiscal Year 2010 Operating Revenues Auxiliary enterprises 33% Sales and services of educational departments 7% Nongovernmental grants and contracts 6% Other operating revenues 2% Student tuition and fees 32% Federal appropriations 3% County appropriations 1% Federal grants and contracts 11% State and local grants and contracts 5% Student tuition and fees Federal appropriations County appropriations Federal grants and contracts State and local grants and contracts Non-governmental grants and contracts Sales and services of educational departments Auxiliary enterprises Other operating revenues Fiscal Year 2010 Nonoperating Revenues Federal grants (non-exchange) 8% Investment income 5% Gifts 16% State & local grants (nonexchange) 4% Nongovernmental grants (nonexchange) 0% Other nonoperating revenues 1% State appropriations 66% State appropriations Gifts Investment income Federal grants (nonexchange) State & local grants (non-exchange) Non-governmental grants (non-exchange) Other nonoperating revenues
7 FISCAL YEAR 2010 OPERATING EXPENSES BY NATURAL CLASSIFICATION Salaries, wages, and benefits 359,070,547 Scholarships and fellowships 20,488,633 Supplies and other services 172,019,026 Depreciation 66,109,077 Total operating expenses 617,687,283 FISCAL YEAR 2010 OPERATING EXPENSES BY FUNCTION Instruction 131,024,137 Research 96,681,263 Public Service 70,306,277 Academic Support 34,589,392 Student Services 18,136,637 Institutional Support 37,852,287 Scholarships and Fellowships 20,889,729 Operations and Maintenance of Plant 32,208,411 Auxiliary Enterprises 109,890,073 Depreciation 66,109,077 Total 617,687,283


8 Fiscal Year 2010 Operating Expenses by Natural Classification Depreciation 11% Salaries, wages, and benefits Supplies and other services 28% Scholarships and fellowships 3% Salaries, wages, and benefits 58% Scholarships and fellowships Supplies and other services Depreciation Fiscal Year 2010 Operating Expenses by Function Operations and Maintenance of Plant 5% Scholarships and Fellowships 3% Auxiliary Enterprises 18% Depreciation 11% Instruction 21% Instruction Research Public Service Academic Support Student Services Institutional Support Institutional Support 6% Student Services 3% Academic Support 6% Public Service 11% Research 16% Scholarships and Fellowships Operations and Maintenance of Plant Auxiliary Enterprises Depreciation
9 ENROLLMENT TREND OVER LAST FIVE YEARS (FALL SEMESTER) 18,000 16,000 14,000 14,281 14,350 14,948 15,426 15,835 Undergraduate 12,000 10,000 Graduate 8,000 6,000 4,000 3,095 3,146 3,297 3,370 3,616 Law 2,

10 IN-STATE ENROLLMENT BY COUNTY OF ORIGIN
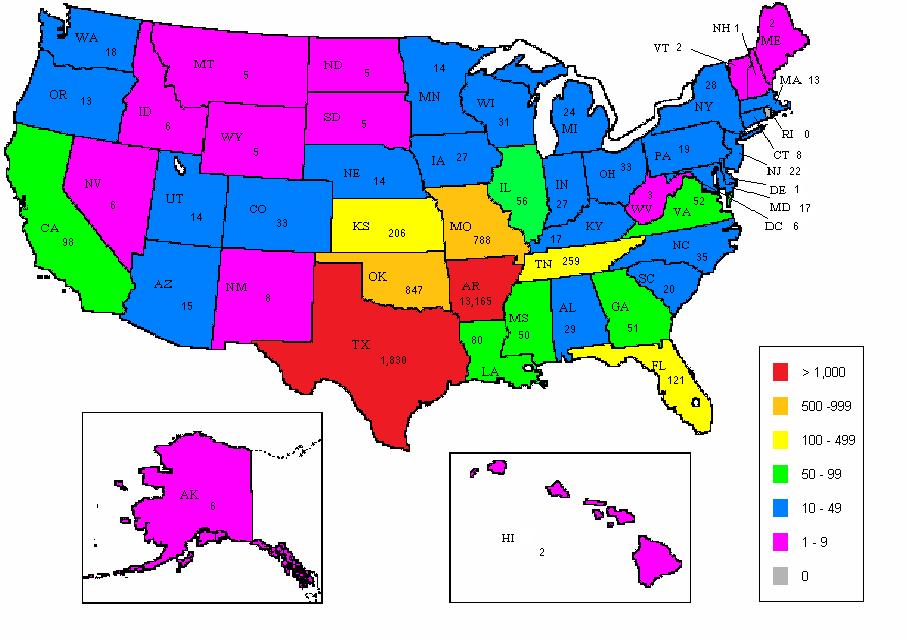
11 ENROLLMENT BY STATE

12 UNIVERSITY OF ARKANSAS, FAYETTEVILLE LOCATION AND LOCATIONS OF OTHER DIVISION SITES

13
14
15 MANAGEMENT S DISCUSSION AND ANALYSIS The following discussion and analysis provides an overview of the financial position of the University of Arkansas, Fayetteville (the University) for the year ended June 30, 2010, with fiscal year ended June 30, 2009 data presented for comparative purposes. The emphasis of the discussion concerning the financial statements will be for the current year. Management has prepared this discussion, along with the financial statements and related note disclosures, and it should be read in conjunction with financial statements and notes to the financial statements. The financial statements, notes and discussion are the responsibility of management. All references to 2010, 2009 or another year refer to the fiscal year ended June 30, unless otherwise noted. The University is the largest and oldest state institution of higher education and the primary state and land-grant university in Arkansas. Established in 1871 under the provisions of the Morrill Act, it is the flagship institution of the University of Arkansas System and the state. Recognized as a Carnegie Research University, it is the state s only comprehensive research university and is classified as an institution with high research activity. Through its teaching, research and outreach the University is positioned to be an economic and cultural engine for the state and beyond. All programs and activities of the University are governed by the University of Arkansas Board of Trustees, which has delegated to the System President the administrative authority for all aspects of operations. The System President has further delegated administrative authority to the Chancellor and Vice President for Agriculture, who have responsibility for the programs and activities of the colleges, schools and divisions presented in this financial report. Overview of the Financial Report and Financial Analysis The University s financial report includes three primary financial statements: the Statement of Net Assets, the Statement of Revenues, Expenses, and Changes in Net Assets and the Statement of Cash Flows. The financial statements of three component units are presented discretely from the University. The notes to the financial statements provide additional information that is essential to understanding the primary financial statements. Other required supplementary information provides additional information related to other post employment benefits. Financial statements are presented in accordance with Governmental Accounting Standards Board (GASB) Statement No. 35, Basic Financial Statements-and Management s Discussion and Analysis-for Public Colleges and Universities. The statement establishes standards for financial reporting of public colleges and universities and requires that financial statements be presented on an entity-wide basis to focus on the University as a whole. Statements are prepared using the accrual basis of accounting, which is consistent with the accounting method used by private-sector entities. All of the current year s revenues and expenses are recognized when earned or incurred, regardless of when cash is received or paid. The University has identified three foundations as component units subject to inclusion in the financial report: the University of Arkansas Fayetteville Campus Foundation, Inc., the Razorback 14
16 Foundation, Inc., and the Arkansas 4-H Foundation, Inc. As component units, their financial information is included in our financial report in accordance with GASB Statement No. 39, Determining Whether Certain Organizations Are Component Units. This statement provides criteria for determining which related organizations should be reported as component units based on the nature and significance of their relationship to the primary government, which is the University. Additional information regarding this reporting requirement is provided at Notes to the Financial Statements (Note) No. 1 Summary of Significant Accounting Policies, under the Component Units heading. Note 17, Other Entity refers to the University of Arkansas Foundation, Inc., (the Foundation). The University is the beneficiary of only 49.4% of the nets assets of the Foundation; therefore the Foundation does not meet the requirements of a component unit. Statement of Net Assets The Statement of Net Assets presents the assets, liabilities and net assets (assets minus liabilities) of the University. The purpose of the statement is to provide a fiscal snapshot of the University as of the end of the fiscal year. Assets and liabilities are presented in the order of their relative liquidity, and are identified as current or noncurrent. Current assets are those assets that can be realized, with relative ease, such as cash, in the coming year. Current liabilities are expected to be paid within the next year. Noncurrent assets and liabilities are not expected to be realized as cash or paid in the subsequent year. Net Assets are presented in four categories. The first category, Invested in capital assets, net of related debt, provides the University s equity in property, plant and equipment net of depreciation. The next category is Restricted net assets non-expendable. The corpus of nonexpendable and restricted resources (endowments) is only available for investment purposes. The third category, Restricted net assets - expendable, are available for expenditure by the University, but must be spent for purposes as determined by donors and/or external entities that have placed time or purpose restrictions on the use of the resources. The final category, Unrestricted net assets, is the net assets available to the University for any lawful purpose of the University. 15
17 The following summarizes the University s assets, liabilities, and net assets as of June 30, 2010, and June 30, 2009: As of As of Assets June 30, 2010 June 30, 2009 Current Assets $ 207,639,943 $ 183,827,423 Capital Assets, net of depreciation 853,630, ,771,988 Other Noncurrent Assets 131,836, ,139,107 Total Assets $ 1,193,106,773 $ 1,127,738,518 Liabilities Current Liabilities $ 91,290,532 $ 86,891,491 Noncurrent Liabilities 466,583, ,408,527 Total Liabilities $ 557,873,774 $ 506,300,018 Net Assets Invested in Capital Assets, net of related debt $ 449,457,190 $ 453,132,923 Restricted Nonexpendable 21,835,408 22,449,562 Restricted Expendable 54,368,748 50,940,264 Unrestricted 109,571,653 94,915,751 Total Net Assets $ 635,232,999 $ 621,438,500 Overall, the University s total assets increased $65.4 million. A review of the statement of net assets reveals that there are several offsetting variances, but the increase was primarily due to an increase in cash and cash equivalents of $28.2 million, an increase in deposits with trustees of $16.3 million and an increase in capital assets of $25.8 million offset by a decrease in investments of $4.7 million. Cash and cash equivalents increased because the financial markets provided little incentive to invest in traditional liquidity investments as rates for these investment types continued to be at record lows. The decrease in investments is a combination of several variables with the most significant being a rebound in values because of unrealized gains of $16 million offset by final distributions from the Commonfund and certificates of deposit that were converted to cash or equivalents totaling $13.9 million and a $7 million redemption of a matured security for a debt service balloon payment. Deposits with bond trustees represent unspent bond proceeds and bond reserve funds. The increase in 2010 reflects the addition of new bonded debt offset by the University s use of bond proceeds. The increase in Capital Assets, net of depreciation, is primarily a reflection of the University acquiring capital assets at a rate greater than these assets are disposed of or depreciated. The section Significant Changes in Capital Assets and Long Term Debt Activity below and Note 13 Property, Plant and Equipment provide additional information about capital assets. 16
18 Overall, liabilities increased $51.6 million. Similar to asset balances, a review of the statement indicates there were several offsetting variances, but most significant was the $10.7 million increase in accounts payable and $38.1 million increase in bonds, notes, capital leases and installment contracts (long-term debt). Accounts payable grew in 2010 because of increases in payables related to construction projects and accumulated contract retainage. The issuance of $52.4 million Various Facilities Revenue Bonds, Series 2009A and the assumption of $11.2 million in additional installment contracts offset by scheduled retirements of $25.9 million were the most significant factors for the net increase in long-term debt. The bond proceeds were used to finance in part the construction of the nanoscale science and engineering building as well as renovations to classrooms, teaching labs and administrative office space at several campus locations. Proceeds also provided financing for renovation and improvements to student housing, expansion of utility tunnel infrastructure as well as the acquisition of various property and equipment. Equipment installation and other required repairs and replacements necessary to fulfill two separate energy savings performance contracts were financed with installment contracts. Additional information about University debt is provided in the Significant Changes in Capital Assets and Long Term Debt Activity discussion below and at Note 9 Compensated Absences, Bonds, Notes, Capital Leases Payable, and Installment Contracts. The increase in assets of $65.4 million netted with the increase in liabilities of $51.6 million resulted in an increase of $13.8 million in net assets. The following summarizes the composition of unrestricted net assets owned by the units of the University of Arkansas Fund: As of June 30, 2010 As of June 30, 2009 Fayetteville Campus $ 58,244,431 $ 48,085,279 Agricultural Experiment Station 29,930,179 27,054,837 Cooperative Extension Service 12,762,059 11,249,985 Arkansas Archeological Survey 554, ,902 Criminal Justice Institute 2,379,561 2,080,386 Clinton School of Public Service 1,703,631 1,375,650 AREON 3,997,394 4,672,712 Total Unrestricted Net Assets $ 109,571,653 $ 94,915,751 17
19 The Unrestricted Net Assets for the Fayetteville Campus are allocated as follows: As of June 30, 2010 As of June 30, 2009 Working Capital $ 750,000 $ 750,000 E & G Department Uses 34,326,877 13,693,053 Service Operations (359,212) (686,140) Auxiliaries 11,085,543 9,764,398 Plant Funds 2,737,983 15,222,514 Quasi-Endowment Funds 9,703,240 9,341,454 Total Fayetteville Campus Unrestricted Net Assets $ 58,244,431 $ 48,085,279 Plant Funds Unrestricted Net Assets includes amounts allocated to an unrestricted reserve fund. Resembling an internal bank, the reserve may be used for interim internal financing for capital projects until permanent financing is finalized. Generally, the permanent financing arrangement is funded by future gifts or bond issues. The reserve may also be used as a funding source for payment of principal amounts due on bonds. Statement of Revenues, Expenses, and Changes in Net Assets Changes in total net assets are the result of activity presented in the Statement of Revenues, Expenses, and Changes in Net Assets. The statement presents the revenues earned by the University, both operating and non-operating, and the expenses incurred by the University, both operating and non-operating, and any other revenues, expenses, gains and losses and changes in net assets. GASB requires that state appropriations, gifts, investment income and certain grants and contracts be classified as non-operating revenues. As a result, the operating loss of $292.8 million is of little significance, but does highlight the University s dependency on non-operating revenues to meet the costs of operations and provide funds for the acquisition of capital assets. The following summarizes the University s revenues, expenses and changes in net assets: Fiscal 2010 Fiscal 2009 Total Total Operating Revenues $ 324,850,262 $ 310,922,323 Operating Expenses 617,687, ,559,978 Operating (loss) (292,837,021) (286, 637,655) Net nonoperating revenues 285,727, ,801,203 Loss before other revenues and changes in net assets (7,109,180) (38,836,452) Other revenues and changes in net assets 20,903,679 26,148,576 Increase (decrease) in Net Assets $ 13,794,499 $ (12,687,876) Representing 61.1% of the $13.9 million increase in operating revenue, auxiliary enterprises revenue attributable to Athletics increased $8.5 million due to the addition of a neutral site football game, bowl game participation and conference distributions for media revenue. 18
20 American Recovery and Reinvestment Act (ARRA) research awards of over $1 million combined with a $2 million increase in Agricultural Experiment Station research awards contributed to the $5.3 million increase in grant and contract operating revenue. The modest increase in net student tuition and fees revenue of $2.7 million was attributable to enrollment growth. Federal appropriations decreased $3.5 million dollars in 2010 primarily due to a shift in funding sources for county extension agents to local sources. Operating expenses increased $20.1 million or 3.4% over Compensation and benefits costs grew $4.4 million reflecting necessary increases in faculty to support enrollment growth, along with accruing an additional $1.2 million for retiree healthcare expenses. Supplies and other services increased $12.2 million primarily due to expenses related to fulfilling energy savings performance contracts requirements. Additional information about energy savings performance contracts is provided in the Significant Changes in Capital Assets and Long Term Debt Activity discussion below and at Note 9 Compensated Absences, Bonds, Notes, Capital Leases Payable, and Installment Contracts. Net nonoperating revenues increased $37.9 million, primarily due to the rebound in investment income. Net investment income for 2010 was $16.1 million, compared to a loss of $12.4 million in 2009, resulting in a net increase of $28.6 million or 75% of the total increase in net nonoperating revenue. Grants experienced a $9.6 million increase due in part to a $5 million increase in federal PELL grants for student financial aid and the receipt of $2 million in federal stimulus funds (ARRA) to support University operating expenses. Gifts reported on the Statement of Revenues, Expenses and Changes in Net Assets only reflect a portion of the gifts available to the University. Most gifts for the benefit of the University are made to the University of Arkansas Foundation, Inc. whose financial information is presented in summary form at Note 17 Other Entity. The overall decrease in Other Revenues and Changes in Net Assets was $5.2 million. The recognition of library holdings in 2009 resulted in a $5.5 million adjustment that was included in other changes. No similar entry was made in Decreases in capital appropriations and capital grants and gifts highlight state funds and gifts received in 2009 for specific projects. These decreases were essentially offset by increases in other State funds earmarked for capital uses. Statement of Cash Flows The Statement of Cash Flows provides information about the cash receipts and disbursements of the University for the year. The statement aids in the assessment of the University s ability to meet obligations as they become due, the need for external financing, and the ability to generate future cash flow. It is prepared using the direct method as required by the GASB. The direct method reports all major gross cash inflows and outflows, differentiating these activities into operating activities, noncapital financing, such as state appropriations and nonexchange grants; capital and related financing, including bond proceeds from debt issued to construct or purchase capital assets; and investing activities. 19
21 The following summarizes the University s cash flows: Fiscal Year Fiscal Year Net cash used by operating activities $ (220,547,742) $ (219,798,287) Net cash provided by noncapital financing activities 286,636, ,598,672 Net cash provided by operating and noncapital financing activities 66,088,828 54,800,385 Net cash used by capital financing activities (59,250,493) (43,041,281) Net cash provided (used) by investing activities 21,384,345 (4,039,095) Net increase in cash $ 28,222,680 $ 7,720,009 The University used $220.5 million of cash for operating activities in 2010 offset by cash provided by noncapital financing activities of $286.6 million. Similar to the operating loss on the Statement of Revenues, Expenses and Changes in Net Assets, net cash provided by operating activities is of little significance to the University. The net cash provided by the combination of operating activities and noncapital financing activities is a much more meaningful number for the University. The positive amount of $66.1 for 2010 indicates that these activities contributed to cash and liquidity for the year. Cash used by capital financing activities reflects the University s continued use of bonded debt to finance the acquisition of capital assets. Net cash provided by investing activities of $21.4 million is a result of matured investments moved to more liquid cash equivalents and the planned redemption of a $7 million security to service a debt balloon maturity. Significant Changes in Capital Assets and Long-Term Debt Activity The University continued progress on several major construction projects during 2010, including the Nanoscale Science and Engineering Building, Garland Avenue Parking Garage and Retail Shops (the Garland Center), Rice Research Facility, Peabody Hall renovation and the Arkansas Research and Education Optical Network. The scope of the Nanoscale Science and Engineering Building project has evolved as additional funding has become available. The project was originally planned as a phased construction, with phase one financed in part by $16 million from Arkansas Department of Higher Education bonds and $5.5 million from state general improvement funds. With the sale of Various Facility Revenue bonds in 2010, (discussed below) additional funding was obtained that made it possible to complete the project, leaving a shelled out third floor and clean room for future expansion. Total estimated cost for the project is $44 million. The Garland Center is expected to be completed in early 2011 and will provide much needed parking for the north end of campus. The retail shopping space is anchored by the Campus 20
22 Bookstore and is expected to include several other specialty shops to serve the needs of the campus and community. The project was financed with Various Facility Revenue Bonds issued in Construction of a new facility at the Rice Research and Extension Center of the Division of Agriculture is also well underway. The complex includes an auditorium, offices, laboratories and sample processing areas. Total cost is estimated at $10 million, funded in part by $6 million from Arkansas Department of Higher Education bonds and a $2 million gift from the Rice Research Promotion Board. Renovations to Peabody Hall include upgrades to classroom and laboratory facilities designed to modernize and expand teaching and research space, as well as other deferred maintenance work. The project was financed with Various Facility Revenue Bonds issued in 2009, with work expected to be complete in Construction continues on the Arkansas Research and Education Optical Network (AREON), a high-speed, fiber-based optical communication network established and operated by a consortium of public four-year universities in Arkansas, with cooperation of the Arkansas Department of Higher Education. The multi-year project launched in 2006 will, when completed, provide a network that will serve as a catalyst to develop and apply advanced communications technologies to support and enhance education, research, public service and economic development in Arkansas. Phase 1 and 2 construction, which includes the Fayetteville campus, is substantially complete with phase 3 began in Funding for the project comes from Arkansas Department of Higher Education bonds, state general improvement funds, mineral lease rights and consortium members. During 2010, the University issued $52,430,000 of Various Facilities Revenue Bonds, Series 2009A to finance the construction of the nanoscale science and engineering building; renovation of classrooms, teaching labs and administrative office space; renovation and improvements to student housing; and expansion of utility tunnel infrastructure as well as the acquisition of various property and equipment. Construction on these projects is beginning and is expected to be completed by The University issued $23,965,000 in Athletic Facilities Revenue Refunding Bonds, Series 2010 (Taxable) to refund Athletic Facilities Revenue Bonds, Series 1999 and 2001 in the amounts of $19.1 and $4 million, respectively. Historic low rates for taxable bonds provided an opportunity to achieve an economic gain of $355,490 over the life of the bonds. The University entered into a second energy savings performance contract with Energy Systems Group, LLC in 2010, The first long term debt obligation was negotiated in 2009 to finance the improvements and equipment necessary to fulfill the obligations of the contract. The 2010 contract provides for additional improvements and equipment that were not economically feasible when the first contract was negotiated. Work continues on both contracts. Under the terms of the financing agreements, the University has available up to $33.5 million to finance its obligations under the energy savings performance contracts. The debt will be serviced with 21
23 realized energy costs savings. The University has drawn down a total of $12.7 million, with project completion expected in A summary of long-term debt (including the current portion) activity is as follows: Bonds Notes Installment Contracts and Leases Balance as of July 1, 2009 $ 380,024,928 $ 17,286,962 $ 10,490,332 Additions 75,353,475 11,797,464 Payments of principal (21,850,000) (3,594,832) (780,645) Refunded (23,145,000) Amortization of deferred loss 288,625 Amortization of net bond premium (616) Balance as of June 30, 2010 $ 410,671,412 $ 13,692,130 $ 21,507,151 Note 9, Compensated Absences, Bonds, Notes, Capital Leases Payable, and Installment Contracts provides additional information related to the University s long-term debt. A summary of the change in Net Assets invested in capital assets, net of depreciation and net of related debt is as follows: Net Assets Invested in capital assets, net of related debt and depreciation as of June 30, 2009 $ 453,132,923 Land Additions and Disposals (net) 819,955 Buildings Additions and Disposals, net of depreciation 3,233,249 Improvements/Infrastructure Additions, net of depreciation (2,169,515) Equipment Additions and Disposals, net of depreciation (20,040,548) Construction In Progress Additions net of transfers to buildings and improvements/infrastructure 28,038,617 Livestock Additions/deductions 14,243 Library Holdings Additions and Disposals, net of depreciation (1,708,398) Intangible Assets, net of amortization 8,903,808 Bond debt moved to Net Assets invested in capital assets (57,460,304) Bond Principal Paid in ,850,000 Bond debt refinanced 23,145,000 Deferred loss on refinanced bond issues, amortized 531,373 Net unamortized bond issue premium 222,141 Capital Leases and Installment Contracts assumed in 2010 (13,430,059) Note, Capital Lease and Installment Contract Principal Paid in ,374,705 Net Assets Invested in capital assets, net of related debt and depreciation as of June 30, 2010 $ 449,457,190 22
24 Conditions and other factors having a significant effect Financial and political support from state government remains a critical element to the continued financial health of the University. Arkansas appears to have successfully weathered the effects of the national economic crisis, as general revenue forecasts are positive and the budget remains balanced. Fluctuations in general revenue distributions did occur during 2010, but conservative budgeting and an emphasis on cost containment allowed the University to continue to operate without eliminating programs or instituting lay-offs. Originally forecast at $197.4 million, cuts totaling a net $5.9 million resulted in a total general revenue distribution from the State, including distributions from the Educational Excellence Trust Fund, of $191.5 million for The cuts were the result of downward revisions to the State revenue forecast throughout the year. The estimated total general revenue distribution from the State for 2011 is $195.3 million, essentially restoring state funding back to 2009 levels. Management will continue to institute both internal and external efforts to minimize the effect of fluctuations in state funding. The University has received $20.5 million in federal stimulus (ARRA) funds in 2009 and 2010, and expects to receive additional federal stimulus funds during These funds provide support for operating expenses, capital projects and research. The AREON project will receive a $41.2 million grant in 2011 to continue construction of the state-wide optical network. Management continues to be challenged to manage the cost of attendance in such a way to balance affordability while achieving necessary revenue to fund operations. For the first time in 20 years, the University did not increase tuition rates for the 2010 academic year. An increase will be necessary in 2011 in order to maintain the facilities, faculty and other support necessary to fulfill our mission. Private support is also fundamental in meeting budgetary needs. The University has enjoyed historically positive trends in giving, with 2010 being no different. The University recorded $86.7 million of private gift support, a 17% increase over Record highs in both the number of gifts and new pledges as well as number of benefactors illustrate the enduring commitment to education by our donors. The number of new benefactors has shown phenomenal growth, with a 75% increase since These outstanding results, sustained through a difficult economic period, underscore the confidence among our alumni, foundations, and other supporters in the quality of the University s programs and the importance of its mission. The University continues to experience record increases in enrollment, which in turn contribute to increased tuition and fee revenue. The ability to recruit and retain high quality students is a key element to growth. Preliminary numbers for Fall 2010 indicate that enrollment is 21,405 representing an increase of 1,557 students, or 7.8%, over Fall The numerical increase was the largest in 64 years with the percentage increase the largest since Total undergraduate enrollment is up 8.9% to 17,247 students, and total graduate enrollment is up 4.3% to 3,770 students. Enrollment at the School of Law remains virtually unchanged at 388 students. While it is encouraging to see record enrollment, further increases in undergraduate enrollment must occur to ensure continued increases in the revenue generated by tuition and to ensure continued 23
25 support from state government. The State instituted a lottery in September 2009 to support scholarships to higher education institutions in Arkansas. The Arkansas Challenge Scholarships, funded by the Arkansas State Lottery, were awarded for the first time for Fall The impact of the lottery to the University appears to be significant with more than 4,000 students receiving Challenge scholarships. Of that number over 1,800 recipients were incoming freshmen, 1,300 were students who were enrolled in the University last year and 300 were non-traditional students. The condition of the University s capital assets is another important measure of the University s overall financial health. Providing and maintaining facilities that create an attractive environment in which to learn and live is vital to attracting new students, as well as recruiting excellent faculty and staff. Management continues to implement a long-range plan (Facility Renewal & Stewardship Plan) to modernize and expand teaching, research and student facilities with small, targeted amounts of new construction, coupled with a primary focus on renewal and renovation of existing facilities. Facilities Management prepared an initial estimate in 2003 of the condition of capital assets in order to accumulate the necessary data to develop an optimized facility renewal plan. The University s goal is to update twenty percent of the square footage contained in the index annually on a rolling basis, addressing all facilities on a five year cycle. A Facilities Condition Index (FCI) between zero, indicating no deficiencies in building systems such as interiors and services, and 1.0, indicating the cost of a building's deficiencies equals its plant replacement value, has been assigned to each building. A building with deficiencies estimated at more than the plant replacement value will have an FCI greater than 1.0. The gross square footage weighted average for all Educational and General Facilities was 0.23 for 2003, 0.22 for 2007 and dropped dramatically to 0.17 in The relatively large improvement from 2007 to 2008 resulted from an across the board updating of plant replacement values, all of which increased. The weighted average FCI continues to decline to 0.15 for An effective method of assessing the management of capital assets is to track the average facility score over time. Factors contributing to the downward trend include renovations to campus educational and general buildings as directed by the Facilities Renewal and Stewardship Plan, ongoing work as a part of Energy Savings Performance Contracts, the demolition of certain old structures and the addition of new structures. The full impact of renovations and upgrades to 32 classrooms, academic support areas and 12 teaching labs completed in 2010 are not wholly reflected in the weighted average FCI because the actual space is only a fraction of the total campus gross square footage. These upgrades provide tangible proof of the University s commitment to learning and teaching, and it is expected that the impact of these improvements will be realized with the recruitment of exceptional students. 24
26 THIS PAGE INTENTIONALLY LEFT BLANK 25
27 UNIVERSITY OF ARKANSAS Statement of Net Assets June 30, 2010 With Comparative Figures at June 30, 2009 June 30, ASSETS Current Assets Cash and cash equivalents $ 95,438,452 $ 67,215,772 Short-term investments 66,953,564 70,069,578 Accounts receivable, net 31,382,232 30,919,635 Accrued interest receivable 726,076 1,097,715 Inventories 4,812,878 4,773,598 Deposits with bond trustees 777,428 2,429,318 Notes receivable, net 3,723,383 3,159,480 Other assets 3,825,930 4,162,327 Total current assets 207,639, ,827,423 Noncurrent Assets Endowment investments 53,061,841 48,568,508 Notes receivable, net 11,563,589 12,602,367 Deposits with bond trustees 53,302,121 35,341,717 Other long-term investments 12,149,173 18,213,703 Other assets 1,759,495 1,412,812 Capital assets, net 853,630, ,771,988 Total noncurrent assets 985,466, ,911,095 Total assets $ 1,193,106,773 $ 1,127,738,518 LIABILITIES Current Liabilities Accounts payable and accrued liabilities $ 26,196,357 $ 15,514,810 Accrued payroll liabilities 14,778,738 15,169,453 Accrued interest expense 3,397,385 3,407,212 Student overpayments 90,588 44,683 Funds held in trust for others 1,280,061 1,294,205 Deferred revenue 26,716,232 24,982,177 Compensated absences payable - current portion 1,019,419 1,019,349 Bonds, notes and capital leases and installment contracts payable - current portion 17,811,752 25,459,602 Total current liabilities 91,290,532 86,891,491 26
28 UNIVERSITY OF ARKANSAS Statement of Net Assets June 30, 2010 With Comparative Figures at June 30, 2009 June 30, Noncurrent Liabilities Refundable federal advance - Perkins loans 13,913,162 13,861,257 Compensated absences payable 16,378,204 16,142,212 Liability for other post employment benefits 8,225,317 7,057,738 Bonds, notes capital leases and installment contracts payable 428,058, ,342,620 Other noncurrent liabilities 7,618 4,700 Total noncurrent liabilities 466,583, ,408,527 Total liabilities $ 557,873,774 $ 506,300,018 NET ASSETS Invested in capital assets, net of related debt $ 449,457,190 $ 453,132,923 Restricted for Nonexpendable Scholarships and fellowships 7,908,428 7,751,573 Research 5,739,659 5,739,659 Instructional department uses 7,547,635 7,188,224 Loans 639,686 1,770,106 Expendable Scholarships and fellowships 7,148,082 6,335,562 Research 21,040,728 18,827,138 Public service 8,948,645 8,136,924 Instructional department uses 7,999,387 6,282,169 Loans 2,516,756 1,398,513 Capital projects 1,865,174 2,745,222 Debt service 1,922,368 4,240,014 Other 2,927,608 2,974,722 Unrestricted 109,571,653 94,915,751 Total net assets $ 635,232,999 $ 621,438,500 27
29 UNIVERSITY OF ARKANSAS Statement of Revenues, Expenses, and Changes in Net Assets For the Year Ended June 30, 2010 With Comparative Figures for 2009 Fiscal 2010 Fiscal 2009 Total Total REVENUES Operating Revenues Student tuition and fees (net of scholarship allowances of $36,354,740 in fiscal year 2010, and $32,485,525 in fiscal year 2009) $ 104,940,650 $ 102,198,541 Federal appropriations 10,962,787 14,509,161 County appropriations 2,920,742 2,919,089 Federal grants and contracts 33,763,850 31,163,852 State and local grants and contracts 16,308,318 14,626,342 Nongovernmental grants and contracts 18,731,077 17,689,475 Sales and services of educational departments 22,799,767 22,229,892 Auxiliary enterprises Residence Life (net of scholarship allowances of $5,585,367 in fiscal year 2010, and $5,106,328 in fiscal year 2009) 21,827,471 21,494,945 Athletics 61,060,107 52,545,992 Bookstore (net of scholarship allowances of $89,306 in fiscal year 2010, and $77,504 in fiscal year 2009) 14,043,074 14,069,703 Arkansas Union 1,245,782 1,158,713 Student Health Services 1,026,452 1,093,942 Transit and Parking 6,143,209 5,850,087 Student Organizations/Activities 237, ,975 Other Auxiliary Enterprises 2,162,635 2,351,093 Other operating revenues 6,677,248 6,701,521 Total operating revenues 324,850, ,922,323 EXPENSES Operating Expenses Salaries, wages, and benefits 359,070, ,718,229 Scholarships and fellowships 20,488,633 18,350,081 Supplies and other services 172,019, ,854,952 Depreciation 66,109,077 64,636,716 Total operating expenses 617,687, ,559,978 Operating loss (292,837,021) (286,637,655) 28
30 UNIVERSITY OF ARKANSAS Statement of Revenues, Expenses, and Changes in Net Assets For the Year Ended June 30, 2010 With Comparative Figures for 2009 Fiscal 2010 Fiscal 2009 Total Total NONOPERATING REVENUES (EXPENSES) State appropriations 198,554, ,726,630 Gifts 48,714,610 46,311,577 Investment income (net of investment expense of $809,491 in fiscal year 2010, and $785,354 in fiscal year 2009) 16,143,684 (12,438,732) Interest on capital asset - related debt (16,423,413) (16,078,544) Federal grants (nonexchange) 25,318,612 16,954,863 State and local grants (nonexchange) 11,047,508 9,532,946 Nongovernmental grants (nonexchange) 571, ,901 Loss on disposal of assets (465,774) (333,048) Other nonoperating revenues 2,266,357 3,269,610 Net nonoperating revenues 285,727, ,801,203 Loss before other revenues and changes in net assets (7,109,180) (38,836,452) OTHER REVENUES AND CHANGES IN NET ASSETS Capital appropriations 416,237 2,300,000 Capital grants and gifts 3,229,224 8,176,944 Bond Proceeds from Act 1282 of ,679,969 9,708,724 Other changes 578,249 5,962,908 Total other revenues and changes in net assets 20,903,679 26,148,576 Increase (Decrease) in net assets 13,794,499 (12,687,876) NET ASSETS Net assets - beginning of year 621,438, ,368,163 Restatement of Prior Year Balance (1,241,787) Net assets - beginning of year as restated 621,438, ,126,376 Net assets - end of year $ 635,232,999 $ 621,438,500 29
31 UNIVERSITY OF ARKANSAS Statement of Cash Flows - Direct Method For the Year Ended June 30, 2010 With Comparative Figures for 2009 Fiscal 2010 Fiscal 2009 Total Total CASH FLOWS FROM OPERATING ACTIVITIES Student tuition and fees $ 104,029,411 $ 101,134,664 Federal appropriations 11,628,918 13,703,461 County appropriations 2,920,742 2,919,089 Grants and contracts 66,632,633 63,183,157 Payments to suppliers (166,918,015) (159,752,059) Payments to employees (283,347,569) (281,234,248) Payments for benefits (74,715,585) (69,449,970) Payments for scholarships and fellowships (20,488,633) (18,350,081) Loans issued to students and employees (1,445,119) (1,035,982) Collections of loans to students 1,814,870 1,415,345 Collections of interest on loans to students (94,108) (9,515) Auxiliary enterprise charges Residence Life 22,003,656 21,262,903 Athletics 62,780,352 52,951,752 Bookstore 14,177,775 14,078,613 Arkansas Union 1,255,896 1,144,561 Student Health Services 1,001,310 1,074,515 Transit and Parking 6,117,158 5,729,051 Student Organizations/Activities 237, ,486 Other Auxiliary Enterprises 2,267,541 2,430,489 Sales and services of educational departments 22,921,431 22,096,993 Other receipts 6,671,681 6,585,489 Net cash used by operating activities (220,547,742) (219,798,287) CASH FLOWS FROM NONCAPITAL FINANCING ACTIVITIES State appropriations 198,554, ,726,630 Gifts and grants for other than capital purposes 48,655,815 44,363,456 Federal grants (nonexchange) 25,128,327 16,618,713 State and local grants (nonexchange) 11,229,832 9,396,784 Nongovernmental grants (nonexchange) 562, ,351 Other non-operating revenue 2,315,227 3,792,019 Net agency fund transactions 189,801 (172,281) Net cash provided by noncapital financing activities 286,636, ,598,672 Net cash provided by operating activities and noncapital financing activities 66,088,828 54,800,385 CASH FLOWS FROM CAPITAL FINANCING ACTIVITIES Realized proceeds related to capital debt transactions 45,080,973 40,701,959 Capital appropriations 416,237 2,300,000 Capital grants and gifts received 2,383,125 3,050,101 Bond proceeds from Act 1282 of ,679,969 4,424,474 Purchases of capital assets (81,193,714) (62,631,794) Principal paid on capital debt and leases (24,821,542) (14,607,134) Interest paid on capital debt and leases (17,795,541) (16,278,887) Net cash used by capital financing activities (59,250,493) (43,041,281) 30
32 UNIVERSITY OF ARKANSAS Statement of Cash Flows - Direct Method For the Year Ended June 30, 2010 With Comparative Figures for 2009 Fiscal 2009 Fiscal 2009 Total Total CASH FLOWS FROM INVESTING ACTIVITIES Proceeds from sales and maturities of investments $ 21,011,098 $ 56,998,488 Investment income 920,228 1,600,486 Purchase of investments (546,981) (62,638,069) Net cash provided (used) by investing activities 21,384,345 (4,039,095) NET INCREASE IN CASH 28,222,680 7,720,009 Cash - beginning of year 67,215,772 59,495,763 Cash - end of year $ 95,438,452 $ 67,215,772 RECONCILIATION OF NET OPERATING LOSS TO NET CASH USED BY OPERATING ACTIVITIES Operating loss $ (292,837,021) $ (286,637,655) Adjustments to reconcile net loss to net cash used by operating activities: Depreciation expense 66,109,077 64,636,716 Changes in assets and liabilities Receivables (net) (2,044,494) (2,351,688) Inventories (39,279) 563,825 Prepaid expenses 249,265 (255,137) Other assets (59,492) Accounts payable and accrued liabilities 4,913,433 (311,344) Accrued payroll liabilities (Employees) (578,054) 664,409 Accrued payroll liabilities (Benefits) 181, ,654 Student overpayments 45,905 (226,644) Deferred revenue 1,734, ,460 Refundable federal advance 51, ,162 Deposits 2, Compensated absences 236, ,169 Retiree benefits 1,167,579 1,966,779 Loans to students and employees 318, ,307 Net cash used by operating activities $ (220,547,742) $ (219,798,287) NONCASH TRANSACTIONS Donations of land, buildings, improvements, and infrastructure $ 329,961 $ 4,613,492 Equipment donations 506, ,006 Payments to bond escrow directly from bond proceeds 23,689,487 Payment of bond proceeds directly into deposits with trustees 52,430,000 Payment of premium and accrued interest on bonds directly into deposits with trustees 572,002 Bond issuance costs and underwriter's discounts paid directly from bond proceeds 743, ,406 Interest on long-term debt paid directly from deposits with trustees 2,351,451 2,170,005 Payment of long-term debt directly from University of Arkansas Foundation, Inc. accounts 1,403,936 1,432,879 Capital outlay paid directly from bond proceeds from Act 1282 of ,284,250 Capital outlay paid directly from proceeds of University of Arkansas long-term debt instruments 580,820 3,020,626 Loss on disposal of assets 69, ,835 31
33 UNIVERSITY OF ARKANSAS FAYETTEVILLE CAMPUS FOUNDATION, INC. Statements of Financial Position June 30, 2010 and Assets Investments $ 389,875,967 $ 356,635,626 Liabilities and Net Assets Accounts payable $ 96,394 Net Assets: Temporarily restricted $ 21,400,707 $ 17,999,284 Permanently restricted 368,378, ,636,342 Total net assets 389,779, ,635,626 Total liabilities and net assets $ 389,875,967 $ 356,635,626 32
34 UNIVERSITY OF ARKANSAS FAYETTEVILLE CAMPUS FOUNDATION, INC. Statement of Activities For the Years Ended June 30, 2010 and Temporarily Permanently Temporarily Permanently Unrestricted Restricted Restricted Total Unrestricted Restricted Restricted Total Revenue, gains and other support: Interest and dividends $ 3,189,698 $ 220,921 $ 3,410,619 $ 2,867,284 $ 243,159 $ 3,110,443 Net unrealized and realized gains on investments 14,734,998 29,521,603 44,256,601 15,555,906 (133,925,360) (118,369,454) Net assets released from restrictions $ 14,523,273 (14,523,273) $ 14,958,796 (14,958,796) Total revenue, gains and other support 14,523,273 3,401,423 29,742,524 47,667,220 14,958,796 3,464,394 (133,682,201) (115,259,011) Expenses and Losses: Program Services- Research 1,225,284 1,225,284 1,000,233 1,000,233 Faculty/staff support 2,046,577 2,046,577 1,600,010 1,600,010 Scholarships and awards 9,631,908 9,631,908 10,105,493 10,105,493 Equipment and technology 1,298,848 1,298,848 1,553,454 1,553,454 Other 320, , , ,606 Total program services 14,523,273 14,523,273 14,958,796 14,958,796 Change in net assets 3,401,423 29,742,524 33,143,947 3,464,394 (133,682,201) (130,217,807) Net assets, beginning of year 17,999, ,636, ,635,626 14,534, ,318, ,853,433 Net assets, end of year $ $ 21,400,707 $ 368,378,866 $ 389,779,573 $ $ 17,999,284 $ 338,636,342 $ 356,635,626 33
35 THE RAZORBACK FOUNDATION, INC. Statement of Financial Position June 30, 2010 Deferred Land, Total Operating Compensation Building and Endowment All Funds Fund Fund Equipment Fund Fund ASSETS ASSETS Cash in bank $ 1,980,550 $ 1,980,550 Pledges receivable-unrestricted, less allowance for uncollectible pledges 3,571,845 3,571,845 Investments 9,624,743 7,060,733 $ 844,009 $ 1,720,001 Land, building and equipment, at cost, less accumulated depreciation 45,224 $ 45,224 Prepaid rent 1,479,553 1,479,553 Intrafund receivable 86,480 86,480 Other assets 10,100 10,100 TOTAL ASSETS $ 16,798,495 $ 14,189,261 $ 844,009 $ 45,224 $ 1,720,001 LIABILITIES AND NET ASSETS LIABILITIES Accounts payable $ 2,026,480 $ 2,026,480 Intrafund payable 86,480 $ 86,480 Deferred compensation payable 3,740,511 2,896,502 $ 844,009 TOTAL LIABILITIES 5,853,471 4,922, ,009 86,480 NET ASSETS Unrestricted 9,266,279 9,266,279 Board designated-unrestricted 45,224 45,224 Permanently restricted 1,633,521 1,633,521 TOTAL NET ASSETS 10,945,024 9,266,279 45,224 1,633,521 TOTAL LIABILITIES AND NET ASSETS $ 16,798,495 $ 14,189,261 $ 844,009 $ 45,224 $ 1,720,001 34
36 THE RAZORBACK FOUNDATION, INC. Statement of Financial Position June 30, 2009 Deferred Land, Total Operating Compensation Building and Endowment All Funds Fund Fund Equipment Fund Fund Assets: Cash in bank $ 2,077,314 $ 2,077,314 Pledges receivable-unrestricted, less allowance for uncollectible pledges 4,293,273 4,293,273 Investments 6,407,618 4,520,046 $ 822,164 $ 1,065,408 Land, building and equipment, at cost, less accumulated depreciation 316,747 $ 316,747 Prepaid rent 1,494,966 1,494,966 Intrafund receivable 85,803 85,803 Other assets 11,100 11,100 Total assets $ 14,686,821 $ 12,482,502 $ 822,164 $ 316,747 $ 1,065,408 Liabilities: Accounts payable $ 840,034 $ 840,034 Intrafund payable 85,803 $ 85,803 Deferred compensation payable 3,292,356 2,470,192 $ 822,164 Total liabilities $ 4,218,193 $ 3,310,226 $ 822,164 $ $ 85,803 Net Assets: Unrestricted $ 9,172,276 $ 9,172,276 Board designated-unrestricted 316,747 $ 316,747 Permanently restricted 979,605 $ 979,605 Total net assets 10,468,628 9,172, , ,605 Total liabilities and net assets $ 14,686,821 $ 12,482,502 $ 822,164 $ 316,747 $ 1,065,408 35
37 THE RAZORBACK FOUNDATION, INC. Statement of Activities Year Ended June 30, 2010 Deferred Land, Total Operating Compensation Building and Endowment All Funds Fund Fund Equipment Fund Fund Changes in unrestricted net assets: Revenues: Public support - contributions $ 12,812,250 $ 12,812,250 $ $ $ Investment income (loss) and other 202, ,877 Total unrestricted revenues 13,015,127 13,015,127 Expenses: Program services: Directly allocated to: Football 1,148,764 1,148,764 Basketball 186, ,179 Baseball 126, ,812 Track and field 29,445 29,445 Other sports 18,638 18,638 Women's sports 128, ,123 Athletic department operations 8,267,121 8,267,121 Fundraising 1,266,654 1,266,654 Administrative 978, ,746 Deferred compensation expense 492, ,287 Provision for uncollectible pledges 70,255 70,255 Total expenses 12,713,024 12,713,024 36
Table of Contents. On the cover: Morning Clock University Relations
 University of Arkansas Annual Financial Report 2008-2009 Table of Contents Presentation Letter 3 Financial Highlights 4 Enrollment Data 8 Independent Auditor's Report 13 Management Discussion and Analysis
Table of Contents. On the cover: Statue of J. William Fulbright University Relations
 Table of Contents Presentation Letter 3 Financial Highlights 4 Enrollment Data 8 Independent Auditor's Report 13 Management Discussion and Analysis 14 Statement of Net Assets 24 Statement of Revenue, Expenses,
Table of Contents. On the cover: Old Main Clock Tower University Relations
 Table of Contents Presentation Letter 3 Financial Highlights 4 Enrollment Data 8 Independent Auditor's Report 13 Management Discussion and Analysis 14 Statement of Net Assets 24 Statement of Revenue, Expenses,
 Table of Contents Presentation Letter 3 Financial Highlights 4 Enrollment Data 8 Independent Auditor's Report 13 Management Discussion and Analysis 14 Statement of Net Assets 24 Statement of Revenue, Expenses,
Table of Contents. On the cover: Fulbright Statue with Peace Fountain
 University of Arkansas Annual Financial Report 2010-2011 Table of Contents Presentation Letter 3 Financial Highlights 4 Enrollment Data 8 Independent Auditor's Report 13 Management Discussion and Analysis
Table of Contents. On the cover: Yellow Leaves (in front of Old Main)
") University of Arkansas Annual Financial Report 2011-2012 Table of Contents Presentation Letter 3 Financial Highlights 4 Enrollment Data 8 Independent Auditor's Report 12 Management Discussion and Analysis
University of Arkansas Annual Financial Report 2011-2012 Table of Contents Presentation Letter 3 Financial Highlights 4 Enrollment Data 8 Independent Auditor's Report 12 Management Discussion and Analysis
Table of Contents. On the cover: Pi Phi Gate
 Table of Contents Presentation Letter 3 Financial Highlights 4 Enrollment Data 8 Independent Auditor's Report 12 Management Discussion and Analysis 14 Statement of Net Position 30 Statement of Revenue,
Cleveland State University (a component unit of the State of Ohio) Financial Report with Supplemental Information June 30, 2018
 Financial Report with Supplemental Information June 30, 2018") Cleveland State University (a component unit of the State of Ohio) Financial Report with Supplemental Information June 30, 2018 Contents Independent Auditor s Report 1-3 Management s Discussion and Analysis
Cleveland State University (a component unit of the State of Ohio) Financial Report with Supplemental Information June 30, 2018 Contents Independent Auditor s Report 1-3 Management s Discussion and Analysis
WINSTON-SALEM STATE UNIVERSITY
 STATE OF NORTH f CAROLINA OFFICE OF THE STATE AUDITOR BETH A. WOOD, CPA WINSTON-SALEM STATE UNIVERSITY WINSTON-SALEM, NORTH CAROLINA FINANCIAL STATEMENT AUDIT REPORT FOR THE YEAR ENDED JUNE 30, 2018 A
Cleveland State University (a component unit of the State of Ohio) Financial Report Including Supplemental Information June 30, 2017
 Financial Report Including Supplemental Information June 30, 2017") Cleveland State University (a component unit of the State of Ohio) Financial Report Including Supplemental Information June 30, 2017 Contents Report of Independent Auditors 1-3 Management s Discussion
Cleveland State University (a component unit of the State of Ohio) Financial Report Including Supplemental Information June 30, 2017 Contents Report of Independent Auditors 1-3 Management s Discussion
Auburn University Report on Federal Awards in Accordance with OMB Circular A-133 For the Year Ended September 30, 2008 EIN:
 Report on Federal Awards in Accordance with OMB Circular A-133 For the Year Ended September 30, 2008 EIN: 63-6000724 Report on Federal Awards in Accordance with OMB Circular A-133 Index September 30, 2008
CALIFORNIA STATE UNIVERSITY, NORTHRIDGE. Financial Statements. June 30, (With Independent Auditors Report Thereon)
") Financial Statements (With Independent Auditors Report Thereon) Table of Contents Page Independent Auditors Report 1 Management s Discussion and Analysis 3 Basic Financial Statements: Statement of Net
Financial Statements (With Independent Auditors Report Thereon) Table of Contents Page Independent Auditors Report 1 Management s Discussion and Analysis 3 Basic Financial Statements: Statement of Net
Central Michigan University. Financial Report. As of and for the Years Ended June 30, 2004 and 2003
 Central Michigan University Financial Report As of and for the Years Ended June 30, 2004 and 2003 Central Michigan University Board of Trustees James C. Fabiano Sr., Mount Pleasant Chair John G. Kulhavi,
STATE OF NORTH CAROLINA
 STATE OF NORTH CAROLINA WINSTON-SALEM STATE UNIVERSITY WINSTON-SALEM, NORTH CAROLINA FINANCIAL STATEMENT AUDIT REPORT FOR THE YEAR ENDED JUNE 30, 2010 OFFICE OF THE STATE AUDITOR BETH A. WOOD, CPA STATE
Cleveland State University (a component unit of the State of Ohio) Financial Report Including Supplemental Information June 30, 2015
 Financial Report Including Supplemental Information June 30, 2015") Cleveland State University (a component unit of the State of Ohio) Financial Report Including Supplemental Information June 30, 2015 Contents Report of Independent Auditors 1-3 Management s Discussion
Cleveland State University (a component unit of the State of Ohio) Financial Report Including Supplemental Information June 30, 2015 Contents Report of Independent Auditors 1-3 Management s Discussion
INDEPENDENT AUDITORS REPORT 1 MANAGEMENT S DISCUSSION AND ANALYSIS Statements of Net Assets 11
 University of Idaho Financial Statements for the Years Ended June 30, 2003 and 2002 and Independent Auditors Report Including Single Audit Reports for the Year Ended June 30, 2003 UNIVERSITY OF IDAHO TABLE
CALIFORNIA STATE UNIVERSITY, FULLERTON. Financial Statements. June 30, (With Independent Auditors Report Thereon)
") Financial Statements (With Independent Auditors Report Thereon) Table of Contents Page Independent Auditors Report 1 Management s Discussion and Analysis (Unaudited) 3 Financial Statements: Statement of
Financial Statements (With Independent Auditors Report Thereon) Table of Contents Page Independent Auditors Report 1 Management s Discussion and Analysis (Unaudited) 3 Financial Statements: Statement of
CENTRAL STATE UNIVERSITY Wilberforce, Ohio. FINANCIAL STATEMENTS June 30, 2017 and 2016
 Wilberforce, Ohio FINANCIAL STATEMENTS Wilberforce, Ohio FINANCIAL STATEMENTS CONTENTS INDEPENDENT AUDITOR S REPORT... 1 MANAGEMENT S DISCUSSION AND ANALYSIS (UNAUDITED)... 3 FINANCIAL STATEMENTS STATEMENTS
ANNUAL FINANCIAL REPORT. June 30, 2017
 ANNUAL FINANCIAL REPORT June 30, 2017 NORTH DAKOTA UNIVERSITY SYSTEM ANNUAL FINANCIAL REPORT Fiscal Year Ended JUNE 30, 2017 Prepared by the North Dakota University System Director of Financial Reporting
CALIFORNIA POLYTECHNIC STATE UNIVERSITY, SAN LUIS OBISPO. Financial Statements. June 30, (With Independent Auditors Report Thereon)
") Financial Statements (With Independent Auditors Report Thereon) Table of Contents Page Independent Auditors Report 1 Management s Discussion and Analysis 3 Financial Statements: Statement of Net Assets
Financial Statements (With Independent Auditors Report Thereon) Table of Contents Page Independent Auditors Report 1 Management s Discussion and Analysis 3 Financial Statements: Statement of Net Assets
WINSTON-SALEM STATE UNIVERSITY
 STATE OF NORTH f CAROLINA OFFICE OF THE STATE AUDITOR BETH A. WOOD, CPA WINSTON-SALEM STATE UNIVERSITY WINSTON-SALEM, NORTH CAROLINA FINANCIAL STATEMENT AUDIT REPORT FOR THE YEAR ENDED JUNE 30, 2017 A
MOREHEAD STATE UNIVERSITY. Single Audit Reports Under Uniform Guidance
 Single Audit Reports Under Uniform Guidance As of and for the Years Ended June 30, 2017 and 2016 with Report of Independent Auditors M CONTENTS Management s Discussion and Analysis... 1 Report of Independent
STATE OF NORTH CAROLINA
 STATE OF NORTH CAROLINA WINSTON-SALEM STATE UNIVERSITY WINSTON-SALEM, NORTH CAROLINA FINANCIAL STATEMENT AUDIT REPORT FOR THE YEAR ENDED JUNE 30, 2012 OFFICE OF THE STATE AUDITOR BETH A. WOOD, CPA STATE
UNIVERSITY OF SOUTH ALABAMA (A Component Unit of the State of Alabama)
") Basic Financial Statements and Single Audit Reporting in Accordance with the Uniform Guidance Table of Contents Management s Discussion and Analysis (Unaudited) 1 Independent Auditors Report 15 Basic Financial
Basic Financial Statements and Single Audit Reporting in Accordance with the Uniform Guidance Table of Contents Management s Discussion and Analysis (Unaudited) 1 Independent Auditors Report 15 Basic Financial
STATEMENTS FINANCIAL. Unaudited Fiscal Year 2016
 STATEMENTS FINANCIAL Unaudited Fiscal Year 2016 TABLE OF CONTENTS 2 Management s Discussion and Analysis 16 Financial Statements 16 Statements of Net Position The University of Mississippi 18 Statements
University of NORTH ALABAMA FINANCIAL REPORT 2017
 University of NORTH ALABAMA FINANCIAL REPORT 2017 Table of Contents September 30, 2016 PART I FINANCIAL STATEMENTS Independent Auditor s Report... 1 Management s Discussion and Analysis... 4 Statement
Missouri Southern State University (A Component Unit of the State of Missouri) Independent Auditor s Reports and Financial Statements
 Independent Auditor s Reports and Financial Statements") (A Component Unit of the State of Missouri) Independent Auditor s Reports and Financial Statements Contents Independent Auditor s Report... 1 Management s Discussion and Analysis... 3 Financial Statements
(A Component Unit of the State of Missouri) Independent Auditor s Reports and Financial Statements Contents Independent Auditor s Report... 1 Management s Discussion and Analysis... 3 Financial Statements
UNIVERSITY OF SOUTH ALABAMA (A Component Unit of the State of Alabama)
") Basic Financial Statements and Supplementary Information on Federal Awards Programs September 30, 2009 Basic Financial Statements Table of Contents Management s Discussion and Analysis (Unaudited) 1 Independent
Basic Financial Statements and Supplementary Information on Federal Awards Programs September 30, 2009 Basic Financial Statements Table of Contents Management s Discussion and Analysis (Unaudited) 1 Independent
UNIVERSITY SYSTEM OF MARYLAND. Financial Statements and Supplemental Data Together with Report of Independent Public Accountants
 Financial Statements and Supplemental Data Together with Report of Independent Public Accountants For the Years Ended June 30, 2014 and 2013 Page REPORT OF INDEPENDENT PUBLIC ACCOUNTANTS 1 MANAGEMENT'S
CALIFORNIA STATE UNIVERSITY, POMONA. Financial Statements. June 30, (With Independent Auditors Report Thereon)
") Financial Statements (With Independent Auditors Report Thereon) Table of Contents Page Independent Auditors Report 1 Management s Discussion and Analysis (Unaudited) 3 Financial Statements: Statement of
Financial Statements (With Independent Auditors Report Thereon) Table of Contents Page Independent Auditors Report 1 Management s Discussion and Analysis (Unaudited) 3 Financial Statements: Statement of
SAN JOSE STATE UNIVERSITY. Financial Statements. June 30, (With Independent Auditors Report Thereon)
") Financial Statements (With Independent Auditors Report Thereon) Table of Contents Page Independent Auditors Report 1 Management s Discussion and Analysis 3 Financial Statements: Statement of Net Assets
Financial Statements (With Independent Auditors Report Thereon) Table of Contents Page Independent Auditors Report 1 Management s Discussion and Analysis 3 Financial Statements: Statement of Net Assets
CALIFORNIA STATE UNIVERSITY, CHICO. Financial Statements. June 30, (With Independent Auditors Report Thereon)
") Financial Statements (With Independent Auditors Report Thereon) Table of Contents Page Independent Auditors Report 1 Management s Discussion and Analysis (unaudited) 3 Financial Statements: Statement of
Financial Statements (With Independent Auditors Report Thereon) Table of Contents Page Independent Auditors Report 1 Management s Discussion and Analysis (unaudited) 3 Financial Statements: Statement of
Basic Financial Statements, Management s Discussion and Analysis and Supplementary Information. June 30, 2012 and 2011
 Basic Financial Statements, Management s Discussion and Analysis and Supplementary Information (With Independent Auditors Report Thereon) Table of Contents Independent Auditors Report 1 Management s Discussion
STATE OF ILLINOIS ILLINOIS STATE UNIVERSITY. FINANCIAL AUDIT (In Accordance with the Single Audit Act and OMB Circular A-133)
") STATE OF ILLINOIS ILLINOIS STATE UNIVERSITY FINANCIAL AUDIT (In Accordance with the Single Audit Act and OMB Circular A-133) For The Years Ended June 30, 2009 and 2008 Performed as Special Assistant Auditors
STATE OF ILLINOIS ILLINOIS STATE UNIVERSITY FINANCIAL AUDIT (In Accordance with the Single Audit Act and OMB Circular A-133) For The Years Ended June 30, 2009 and 2008 Performed as Special Assistant Auditors
UNIVERSITY OF SOUTH ALABAMA (A Component Unit of the State of Alabama)
") Basic Financial Statements and Supplementary Information on Federal Awards Programs Table of Contents Management s Discussion and Analysis (Unaudited) 1 Independent Auditors Report 13 Basic Financial Statements:
Basic Financial Statements and Supplementary Information on Federal Awards Programs Table of Contents Management s Discussion and Analysis (Unaudited) 1 Independent Auditors Report 13 Basic Financial Statements:
SOUTHWESTERN OKLAHOMA STATE UNIVERSITY ANNUAL FINANCIAL STATEMENTS AND INDEPENDENT AUDITOR S REPORTS AS OF AND FOR THE YEAR ENDED JUNE 30, 2014
 SOUTHWESTERN OKLAHOMA STATE UNIVERSITY ANNUAL FINANCIAL STATEMENTS AND INDEPENDENT AUDITOR S REPORTS AS OF AND FOR THE YEAR ENDED JUNE 30, 2014 AUDITED FINANCIAL STATEMENTS Independent Auditors Report...
ANNUAL FINANCIAL REPORT. June 30, 2016
 ANNUAL FINANCIAL REPORT June 30, 2016 NORTH DAKOTA UNIVERSITY SYSTEM ANNUAL FINANCIAL REPORT Fiscal Year Ended JUNE 30, 2016 Prepared by the North Dakota University System Director of Financial Reporting
NORTH CAROLINA AGRICULTURAL AND TECHNICAL STATE UNIVERSITY
 STATE OF NORTH f CAROLINA OFFICE OF THE STATE AUDITOR BETH A. WOOD, CPA NORTH CAROLINA AGRICULTURAL AND TECHNICAL STATE UNIVERSITY GREENSBORO, NORTH CAROLINA FINANCIAL STATEMENT AUDIT REPORT FOR THE YEAR
MURRAY STATE UNIVERSITY A COMPONENT UNIT OF THE COMMONWEALTH OF KENTUCKY FINANCIAL STATEMENTS JUNE 30, 2011
 A COMPONENT UNIT OF THE COMMONWEALTH OF KENTUCKY FINANCIAL STATEMENTS JUNE 30, 2011 Contents Page Independent Auditors Report... 1-2 Management s Discussion and Analysis... 3-16 Financial Statements Statements
SONOMA STATE UNIVERSITY. Financial Statements. June 30, (With Independent Auditors Report Thereon)
") Financial Statements (With Independent Auditors Report Thereon) Table of Contents Page Independent Auditors Report 1 Management s Discussion and Analysis 3 Financial Statements: Statement of Net Assets
Financial Statements (With Independent Auditors Report Thereon) Table of Contents Page Independent Auditors Report 1 Management s Discussion and Analysis 3 Financial Statements: Statement of Net Assets
Financial Statements and Report of Independent Certified Public Accountants
 Financial Statements and Report of Independent Certified Public Accountants Community College of Philadelphia Contents Page Report of Independent Certified Public Accountants 3 Management s discussion
CALIFORNIA STATE UNIVERSITY, EAST BAY. Financial Statements. June 30, (With Independent Auditors Report Thereon)
") Financial Statements (With Independent Auditors Report Thereon) Table of Contents Page Independent Auditors Report 1 Management s Discussion and Analysis 3 Financial Statements: Statement of Net Assets
Financial Statements (With Independent Auditors Report Thereon) Table of Contents Page Independent Auditors Report 1 Management s Discussion and Analysis 3 Financial Statements: Statement of Net Assets
HUMBOLDT STATE UNIVERSITY. Financial Statements. June 30, 2011
 Financial Statements Table of Contents Page Management s Discussion and Analysis 2 Financial Statements: Statement of Net Assets 11 Statement of Revenues, Expenses, and Changes in Net Assets 12 Statement
ST. CHARLES COMMUNITY COLLEGE FINANCIAL STATEMENTS FOR THE YEARS ENDED JUNE 30, 2018 AND 2017
 ST. CHARLES COMMUNITY COLLEGE FINANCIAL STATEMENTS FOR THE YEARS ENDED JUNE 30, 2018 AND 2017 ST. CHARLES COMMUNITY COLLEGE CONTENTS PAGE INDEPENDENT AUDITORS REPORT 1 MANAGEMENT S DISCUSSION AND ANALYSIS
JOHNSON COUNTY COMMUNITY COLLEGE FINANCIAL STATEMENTS JUNE 30, 2018
 JOHNSON COUNTY COMMUNITY COLLEGE FINANCIAL STATEMENTS JUNE 30, 2018 Contents Independent Auditor s Report 1 2 Management s Discussion and Analysis 3 13 Financial Statements Statements of net position 14
WESTERN CAROLINA UNIVERSITY
 STATE OF NORTH ff CAROLINA OFFICE OF THE STATE AUDITOR BETH A. WOOD, CPA WESTERN CAROLINA UNIVERSITY CULLOWHEE, NORTH CAROLINA FINANCIAL STATEMENT AUDIT REPORT FOR THE YEAR ENDED JUNE 30, 2017 A CONSTITUENT
Financial Statements and Reports Required by Uniform Guidance June 30, 2018 and 2017 The University of Oklahoma - Norman Campus
 Financial Statements and Reports Required by Uniform Guidance June 30, 2018 and 2017 The University of Oklahoma - Norman Campus eidebailly.com Table of Contents June 30, 2018 and 2017 Independent Auditor
SAN FRANCISCO STATE UNIVERSITY. Financial Statements. June 30, (With Independent Auditors Report Thereon)
") Financial Statements (With Independent Auditors Report Thereon) Table of Contents Page(s) Independent Auditors Report 1 2 Management s Discussion and Analysis (Unaudited) 3 14 Financial Statements: Statement
Financial Statements (With Independent Auditors Report Thereon) Table of Contents Page(s) Independent Auditors Report 1 2 Management s Discussion and Analysis (Unaudited) 3 14 Financial Statements: Statement
OKLAHOMA STATE UNIVERSITY. June 30, 2011
 OKLAHOMA STATE UNIVERSITY June 30, 2011 OKLAHOMA STATE UNIVERSITY June 30, 2011 AUDITED FINANCIAL STATEMENTS Independent Auditors Report... 1 Management s Discussion and Analysis... 3 Statements of Net
Ohio University (a component unit of the State of Ohio) Financial Statements June 30, 2017 and 2016
 Financial Statements June 30, 2017 and 2016") (a component unit of the State of Ohio) Financial Statements Contents Independent Auditor s Report 1-3 Financial Statements Management s Discussion and Analysis 4-12 Statements of Net Position 13-14 Statements
(a component unit of the State of Ohio) Financial Statements Contents Independent Auditor s Report 1-3 Financial Statements Management s Discussion and Analysis 4-12 Statements of Net Position 13-14 Statements
Auburn University Report on Federal Awards in Accordance with OMB Circular A-133 For the Year Ended September 30, 2012 EIN:
 Auburn University Report on Federal Awards in Accordance with OMB Circular A-133 For the Year Ended September 30, 2012 EIN: 63-6000724 Auburn University Report on Federal Awards in Accordance with OMB
NORTH CAROLINA AGRICULTURAL & TECHNICAL STATE UNIVERSITY
 STATE OF NORTH CAROLINA OFFICE OF THE STATE AUDITOR BETH A. WOOD, CPA NORTH CAROLINA AGRICULTURAL & TECHNICAL STATE UNIVERSITY GREENSBORO, NORTH CAROLINA FINANCIAL STATEMENT AUDIT REPORT FOR THE YEAR ENDED
MORGAN STATE UNIVERSITY. Financial Statements Together with Report of Independent Public Accountants
 Financial Statements Together with Report of Independent Public Accountants Years Ended JUNE 30, 2016 AND 2015 CONTENTS REPORT OF INDEPENDENT PUBLIC ACCOUNTANTS 1 MANAGEMENT S DISCUSSION AND ANALYSIS 3
TRUMAN STATE UNIVERSITY A COMPONENT UNIT OF THE STATE OF MISSOURI FINANCIAL STATEMENTS JUNE 30, 2017
 A COMPONENT UNIT OF THE STATE OF MISSOURI FINANCIAL STATEMENTS JUNE 30, 2017 Contents Page Independent Auditors Report... 1-2 Management s Discussion And Analysis... 3-12 Financial Statements Statement
UNIVERSITY SYSTEM OF MARYLAND. Financial Statements and Supplemental Data Together with Report of Independent Public Accountants
 Financial Statements and Supplemental Data Together with Report of Independent Public Accountants For the Years Ended June 30, 2013 and 2012 Page REPORT OF INDEPENDENT PUBLIC ACCOUNTANTS 1 MANAGEMENT'S
Jacksonville State University Financial Statements September 30, 2017 and 2016
 Financial Statements September 30, 2017 and 2016 Table of Contents September 30, 2017 and 2016 PART I FINANCIAL STATEMENTS PAGE Independent Auditor s Report... 1 Management s Discussion and Analysis...
Fairmont State University
 Fairmont State University Financial Statements Years Ended June 30, 2017 and 2016 and Independent Auditor s Reports TABLE OF CONTENTS INDEPENDENT AUDITOR S REPORT 3-4 MANAGEMENT S DISCUSSION AND ANALYSIS
The University of Mississippi. Financial Statements. Fiscal Year 2009 Unaudited
 The University of Mississippi Financial Statements Fiscal Year 2009 Unaudited Table of Contents Management Discussion & Analysis 3 Financial Statements 13 Statement of Net Assets University of Mississippi
UNIVERSITY OF ALASKA
 UNIVERSITY OF ALASKA (A Component Unit of the State of Alaska) Financial Statements (With Independent Auditors Report Thereon) University of Alaska (A Component Unit of the State of Alaska) Financial Statements
UNIVERSITY OF CALIFORNIA, BERKELEY. Annual Financial Report
 UNIVERSITY OF CALIFORNIA, BERKELEY Annual Financial Report 2008-09 TABLE OF CONTENTS Management's Discussion and Analysis 1 Financial Statements: Statements of Net Assets at June 30, 2009 and 2008 11 Statements
Financial statements and report of independent certified public accountants Oklahoma State University June 30, 2006 and 2005
 Financial statements and report of independent certified public accountants Oklahoma State University June 30, 2006 and 2005 C O N T E N T S Page MANAGEMENT S DISCUSSION AND ANALYSIS i REPORT OF INDEPENDENT
FINANCIAL STATEMENT REPORT
 FINANCIAL STATEMENT REPORT FOR THE YEAR ENDED TABLE OF CONTENTS INDEPENDENT AUDITOR S REPORT... 1 MANAGEMENT S DISCUSSION AND ANALYSIS... 3 FINANCIAL STATEMENTS COLLEGE EXHIBITS A-1 STATEMENT OF NET POSITION...
(A component unit of the State of Ohio) Financial Report. With Supplemental Information
 Financial Report. With Supplemental Information") (A component unit of the State of Ohio) Financial Report With Supplemental Information June 30, 2017 Board of Trustees The University of Akron 302 Butchel Common Akron, Ohio 44325 We have reviewed the
(A component unit of the State of Ohio) Financial Report With Supplemental Information June 30, 2017 Board of Trustees The University of Akron 302 Butchel Common Akron, Ohio 44325 We have reviewed the
ILLINOIS STATE UNIVERSITY 1
 REPORT OF THE COMPTROLLER (In Accordance with the Single Audit Act And OMB Circular A-133) For Years Ended June 30, 2008 and 2007 TABLE OF CONTENTS Page Board of Trustees and Administration 2 Letter of
Washburn University of Topeka
 Accountants Report and Financial Statements (Including Reports Required Under OMB-133) June 30, 2005 and 2004 June 30, 2005 and 2004 Contents Independent Accountants Report on Financial Statements and
WESTERN KENTUCKY UNIVERSITY. REPORT ON AUDIT OF INSTITUTION OF HIGHER EDUCATION IN ACCORDANCE WITH OMB CIRCULAR A-133 June 30, 2010 and 2009
 REPORT ON AUDIT OF INSTITUTION OF HIGHER EDUCATION IN ACCORDANCE WITH OMB CIRCULAR A-133 REPORT ON AUDIT OF INSTITUTION OF HIGHER EDUCATION IN ACCORDANCE WITH OMB CIRCULAR A-133 CONTENTS REPORT OF INDEPENDENT
Financial Statements with Supplemental Schedules. Fiscal Year Ended June 30, 2013
 Financial Statements with Supplemental Schedules Fiscal Year Ended June 30, 2013 Financial Statements with Supplemental Schedules Fiscal Year Ended June 30, 2013 Prepared by: University of Alaska Statewide
Auditors' Opinion 1. Management s Discussion & Analysis Statement of Net Assets 13. Statement of Revenues, Expenses, and Change in Net Assets 14
 Financial Report 2001-2002 TABLE OF CONTENTS Auditors' Opinion 1 Management s Discussion & Analysis 4 11 Statement of Net Assets 13 Statement of Revenues, Expenses, and Change in Net Assets 14 Statement
UNIVERSITY OF ALASKA
 UNIVERSITY OF ALASKA (A Component Unit of the State of Alaska) Financial Statements (With Independent Auditors Report Thereon) University of Alaska (A Component Unit of the State of Alaska) Financial Statements
Washburn University of Topeka
 Accountants Report and Financial Statements (Including Reports Required Under OMB-133) June 30, 2008 and 2007 June 30, 2008 and 2007 Contents Independent Accountants Report on Financial Statements and
FINANCIAL STATEMENTS University of South Alabama Year ended September 30, 2002 with Report of Independent Auditors
 FINANCIAL STATEMENTS University of South Alabama Year ended September 30, 2002 with Report of Independent Auditors Financial Statements Year ended September 30, 2002 Contents Management s Discussion and
WILKES COMMUNITY COLLEGE
 STATE OF NORTH CAROLINA OFFICE OF THE STATE AUDITOR BETH A. WOOD, CPA WILKES COMMUNITY COLLEGE WILKESBORO, NORTH CAROLINA FINANCIAL STATEMENT AUDIT REPORT FOR THE YEAR ENDED JUNE 30, 2018 A COMPONENT UNIT
DURHAM TECHNICAL COMMUNITY COLLEGE
 STATE OF NORTH CAROLINA OFFICE OF THE STATE AUDITOR BETH A. WOOD, CPA DURHAM TECHNICAL COMMUNITY COLLEGE DURHAM, NORTH CAROLINA FINANCIAL STATEMENT AUDIT REPORT FOR THE YEAR ENDED JUNE 30, 2015 A COMPONENT
Financial Statements and Supplemental Data Together with Report of Independent Public Accountants
 Financial Statements and Supplemental Data Together with Report of Independent Public Accountants For the Years Ended June 30, 2016 and 2015 This page intentionally left blank. UNIVERSITY SYSTEM OF MARYLAND
NORTH CAROLINA AGRICULTURAL AND TECHNICAL STATE UNIVERSITY
 STATE OF NORTH f CAROLINA OFFICE OF THE STATE AUDITOR BETH A. WOOD, CPA NORTH CAROLINA AGRICULTURAL AND TECHNICAL STATE UNIVERSITY GREENSBORO, NORTH CAROLINA FINANCIAL STATEMENT AUDIT REPORT FOR THE YEAR
COLLEGE OF SOUTHERN NEVADA STATEMENTS OF NET POSITION Unaudited
 Financial Statements For the Years Ended June 30, 2017 and 2016 STATEMENTS OF NET POSITION Foundation 2017 2016 2017 2016 ASSETS Current Assets Cash and cash equivalents $ 7,156,000 $ 8,936,000 $ 53,000
Oklahoma State University
 Oklahoma State University June 30, 2010 OKLAHOMA STATE UNIVERSITY June 30, 2010 AUDITED FINANCIAL STATEMENTS Independent Auditors Report... 1 Management s Discussion and Analysis... 3 Statements of Net
Washburn University of Topeka
 Accountants Report and Financial Statements (Including Reports Required Under OMB-133) June 30, 2006 and 2005 June 30, 2006 and 2005 Contents Independent Accountants Report on Financial Statements and
Report of Independent Auditors and Financial Statements for
 Report of Independent Auditors and Financial Statements for June 30, 2013 and 2012 LEWIS-CLARK STATE COLLEGE TABLE OF CONTENTS Page REPORT OF INDEPENDENT AUDITORS 1-2 MANAGEMENT S DISCUSSION AND ANALYSIS
Financial Statements (Unaudited) June 30, 2015
 June 30, 2015") Financial Statements (Unaudited) June 30, 2015 STATEMENTS OF NET POSITION (in $1,000s) June 30, 2015 Component Units 2015 2015 ASSETS Current Assets Cash and cash equivalents $ 5,777 $ 44,501 Short-term
Financial Statements (Unaudited) June 30, 2015 STATEMENTS OF NET POSITION (in $1,000s) June 30, 2015 Component Units 2015 2015 ASSETS Current Assets Cash and cash equivalents $ 5,777 $ 44,501 Short-term
WESTERN KENTUCKY UNIVERSITY REPORT ON AUDIT OF INSTITUTION OF HIGHER EDUCATION IN ACCORDANCE WITH OMB CIRCULAR A-133 June 30, 2009 and 2008
 REPORT ON AUDIT OF INSTITUTION OF HIGHER EDUCATION IN ACCORDANCE WITH OMB CIRCULAR A-133 REPORT ON AUDIT OF INSTITUTION OF HIGHER EDUCATION IN ACCORDANCE WITH OMB CIRCULAR A-133 CONTENTS REPORT OF INDEPENDENT
SOUTHEAST MISSOURI STATE UNIVERSITY FINANCIAL STATEMENTS JUNE 30, 2016
 SOUTHEAST MISSOURI STATE UNIVERSITY FINANCIAL STATEMENTS JUNE 30, 2016 Contents Page Independent Auditors Report... 1-3 Management s Discussion And Analysis... 4-13 Financial Statements Statement Of Net
UNIVERSITY OF OKLAHOMA HEALTH SCIENCES CENTER. June 30, 2012
 UNIVERSITY OF OKLAHOMA HEALTH SCIENCES CENTER June 30, 2012 UNIVERSITY OF OKLAHOMA HEALTH SCIENCES CENTER June 30, 2012 and 2011 AUDITED FINANCIAL STATEMENTS Independent Auditors Report... 1 Management
SOUTHEASTERN OKLAHOMA STATE UNIVERSITY
 SOUTHEASTERN OKLAHOMA STATE UNIVERSITY A DEPARTMENT OF THE REGIONAL UNIVERSITY SYSTEM OF OKLAHOMA ANNUAL FINANCIAL STATEMENTS AND INDEPENDENT AUDITOR S REPORT AS OF AND FOR THE YEAR ENDED JUNE 30, 2018
Kent State University (a component unit of the State of Ohio)
") Kent State University (a component unit of the State of Ohio) Financial Report Including Supplementary Information June 30, 2018 Table of Contents June 30, 2018 and 2017 Page(s) Independent Auditor s Report...
Kent State University (a component unit of the State of Ohio) Financial Report Including Supplementary Information June 30, 2018 Table of Contents June 30, 2018 and 2017 Page(s) Independent Auditor s Report...
Kent State University (a component unit of the State of Ohio)
") Kent State University (a component unit of the State of Ohio) Financial Report Including Supplementary Information June 30, 2016 Table of Contents June 30, 2016 and 2015 Page(s) Management s Discussion
Kent State University (a component unit of the State of Ohio) Financial Report Including Supplementary Information June 30, 2016 Table of Contents June 30, 2016 and 2015 Page(s) Management s Discussion
University of Alaska (A Component Unit of the State of Alaska) Financial Statements June 30, 2010 and Table of Contents
 Financial Statements June 30, 2010 and Table of Contents") Financial Statements June 30, 2010 and 2009 University of Alaska (A Component Unit of the State of Alaska) Financial Statements June 30, 2010 and 2009 Table of Contents Page Management s Discussion and
Financial Statements June 30, 2010 and 2009 University of Alaska (A Component Unit of the State of Alaska) Financial Statements June 30, 2010 and 2009 Table of Contents Page Management s Discussion and
NORTH CAROLINA AGRICULTURAL AND TECHNICAL STATE UNIVERSITY
 STATE OF NORTH CAROLINA OFFICE OF THE STATE AUDITOR BETH A. WOOD, CPA NORTH CAROLINA AGRICULTURAL AND TECHNICAL STATE UNIVERSITY GREENSBORO, NORTH CAROLINA FINANCIAL STATEMENT AUDIT REPORT FOR THE YEAR
Audited Financial Statements
 Christopher Newport u n i v e r s i t y Christopher Newport University Audited Financial Statements For the year ended June 30, 2012 CHRISTOPHER NEWPORT UNIVERSITY Newport News, Virginia AUDITED FINANCIAL
Financial Statements and Supplemental Information and Data Together with Report of Independent Public Accountants
 Financial Statements and Supplemental Information and Data Together with Report of Independent Public Accountants For the Years Ended June 30, 2017 and 2016 This page intentionally left blank. UNIVERSITY
UNIVERSITY OF SOUTH CAROLINA Columbia and Regionals
 REPORT ON FINANCIAL STATEMENTS FOR THE YEAR ENDED JUNE 30, 2018 CONTENTS PAGE INDEPENDENT AUDITOR'S REPORT 1 MANAGEMENT'S DISCUSSION AND ANALYSIS 3 BASIC FINANCIAL STATEMENTS Statement of Net Position
Management s Discussion and Analysis - Unaudited Statement of Net Position 14. Schoolcraft College Foundation Statement of Net Assets 15
 ANNUAL FINANCIAL REPORT JUNE 30, 2018 Table of Contents Independent Auditors Report 1-2 Financial Statements Management s Discussion and Analysis - Unaudited 3-13 Statement of Net Position 14 Schoolcraft
JOHNSON COUNTY COMMUNITY COLLEGE FINANCIAL STATEMENTS JUNE 30, 2017
 JOHNSON COUNTY COMMUNITY COLLEGE FINANCIAL STATEMENTS JUNE 30, 2017 Contents Independent Auditor s Report 1 2 Management s Discussion and Analysis 3 13 Financial Statements Statements of net position 14
CALIFORNIA POLYTECHNIC STATE UNIVERSITY, SAN LUIS OBISPO. Financial Statements. June 30, 2009
 Financial Statements (With Independent Auditors Report Thereon) Table of Contents Page Independent Auditors Report 1 Management s Discussion and Analysis 3 Financial Statements: Statement of Net Assets
Audited Financial Statements and Other Financial Information. June 30, 2017
 Audited Financial Statements and Other Financial Information Audited Financial Statements and Other Financial Information Audited Financial Statements Management s Discussion and Analysis... 1-13 Report
SOUTHEASTERN OKLAHOMA STATE UNIVERSITY
 SOUTHEASTERN OKLAHOMA STATE UNIVERSITY A DEPARTMENT OF THE REGIONAL UNIVERSITY SYSTEM OF OKLAHOMA ANNUAL FINANCIAL STATEMENTS AND INDEPENDENT AUDITOR S REPORT AS OF AND FOR THE YEAR ENDED JUNE 30, 2017
Henderson State University
 Arkadelphia, Arkansas Basic Financial Statements and Other Reports LEGISLATIVE JOINT AUDITING COMMITTEE HENDERSON STATE UNIVERSITY TABLE OF CONTENTS JUNE 30, 2011 Independent Auditor's Report Report on
Connecticut State University System (The System Office, Central Connecticut State University, Eastern Connecticut State University, Southern
 Connecticut State University System (The System Office, Central Connecticut State University, Eastern Connecticut State University, Southern Connecticut State University, Western Connecticut State University,
Auburn University Report on Federal Awards in Accordance with OMB Circular A-133 For the Year Ended September 30, 2013 EIN:
 Auburn University Report on Federal Awards in Accordance with OMB Circular A-133 For the Year Ended September 30, 2013 EIN: 63-6000724 Auburn University Report on Federal Awards in Accordance with OMB
CALIFORNIA STATE UNIVERSITY, FRESNO. Financial Statements. June 30, (With Independent Auditors Report Thereon)
") Financial Statements (With Independent Auditors Report Thereon) Table of Contents Page Independent Auditors Report 1 Management s Discussion and Analysis 3 Financial Statements: Statement of Net Assets
Financial Statements (With Independent Auditors Report Thereon) Table of Contents Page Independent Auditors Report 1 Management s Discussion and Analysis 3 Financial Statements: Statement of Net Assets