Concentrated Disadvantage
|
|
|
- Gladys Chandler
- 5 years ago
- Views:
Transcription
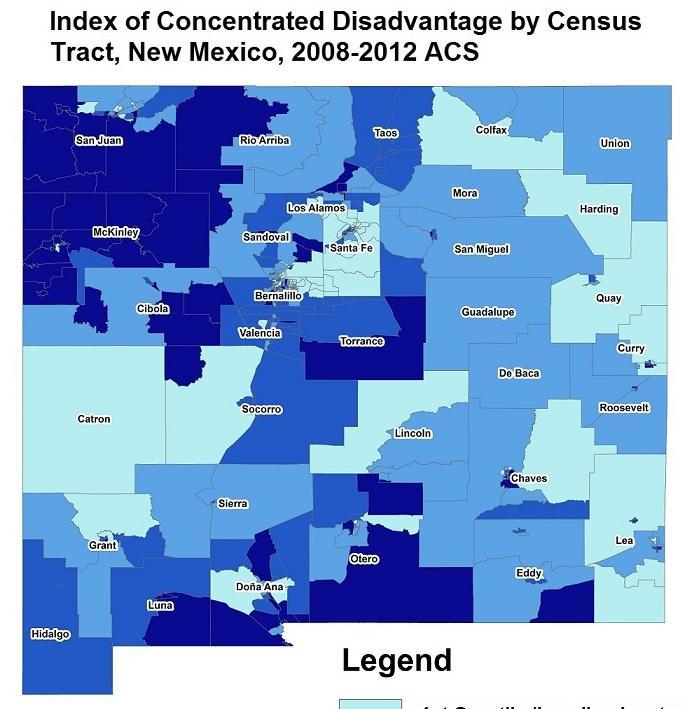
1 Brief Description: Proportion of households located in census tracts with a high level of concentrated disadvantage, calculated using five census variables Numerator: Number of households with children less than 18 years of age located in census tracts of high concentrated disadvantage Denominator: Total number of households with children less than 18 years of age Data Source: American Community Survey (ACS) 1 Notes on Calculation: Calculated from five Census variables 1) % of individuals below the poverty line 4) % unemployed 2) % of individuals on public assistance 5) % less than age 18 3) % female-headed households Percentages of each individual indicator are z-score transformed: subtract the mean of the distribution from the variable value and divide the difference by the standard deviation of the distribution Z = (score - mean)/standard deviation Value should be averaged into an overall index of concentrated disadvantage or deprivation 2 1
2 Notes on Calculation: Apply cutoff to determine which census tracts are considered to have high concentrated disadvantage, calculate number of HH in tract High : those census tracts whose averaged z-scores fall within the 75th percentile of values Comparison across states to identify states with higher and lower values: 75 th percentile of the averaged z-score for census tracts needs to be established at a national level Comparison across counties: percentile could be established at a state level 3 Notes on Calculation: Comparison Across Time We recommend: 1) the absolute value of the averaged z-score of the 75 th percentile for the first time period be held constant over time 2) the absolute values of the statistical parameters (means and standard deviations) used to calculate the z-scores for each of the components for the first time period also be held constant 4 2
3 Comments: Final indicator is the number of households with children (<18) living in a census tract above the 75 th percentile in that jurisdiction divided by the total number of households in the same jurisdiction 5 Keys to Success: Getting the right tables from American FactFinder: Census / ACS 1) % of individuals below the poverty line - S1702 Census Bureau uses ACS to collect poverty; for 2010 estimate, use 5-year ACS ending in ) % of individuals on public assistance - B09010 ACS table - for 2010 estimate, use 5-year ACS ending in ) % female-headed households DP-1 (Census) 4) % unemployed - S2301 5) % less than age 18 - SO101 Households with individuals <18 years DP-1 (Census) 6 3
4 Variables for each element: Census / ACS 1) HC02_MOE_VC01 for the % of individuals below the poverty line 2) HD01_VD02 for the % of individuals on public assistance 3) HS02_S157 for the % of female-headed households 4) HC04_EST_VC01 for the % unemployed 5) the total population under 5 yrs, HC01_EST_VC03; the total population aged 5 to 14 years, HC01_EST_VC23; and the total population aged 15 to 17 years, HC01_EST_VC24. Each of these are the percent of population in the specified age group. The sum should give you the percent less than 18 HD01_S152 for Households with individuals <18 years 7 Keys to Success: Getting the right tables from American FactFinder: American Community Survey 1) % of individuals below the poverty line - S1702 2) % of individuals on public assistance - B ) % female-headed households DP02 4) % unemployed - S2301 5) % less than age 18 - SO101 Households with individuals under 18 years DP02 8 4

 and then choose Download to get the final file with all census")
5 : Pulling tables from American FactFinder Select your state and then select All census tracts within state. Click: Add to your selections. Tip: do not select an individual county 9 This is what the table looks like for a single census tract. Select the table you want (check the box) and then choose Download to get the final file with all census tracts. Tip: clicking on the table name displays one tract at a time 10 5

6 11 6
It Don t Come Easy, Ringo Starr
 It Don t Come Easy, Ringo Starr Period Estimates not point in time, not easy for people to understand or explain Different residence rules not usual place of residence as with decennial; ACS is current
American Community Survey 5-Year Estimates
 DP03 SELECTED ECONOMIC CHARACTERISTICS 2013-2017 American Community Survey 5-Year Estimates Supporting documentation on code lists, subject definitions, data accuracy, and statistical testing can be found
Tell us what you think. Provide feedback to help make American Community Survey data more useful for you.
 DP03 SELECTED ECONOMIC CHARACTERISTICS 2016 American Community Survey 1-Year Estimates Supporting documentation on code lists, subject definitions, data accuracy, and statistical testing can be found on
American Community Survey 5-Year Estimates
 DP03 SELECTED ECONOMIC CHARACTERISTICS 2012-2016 American Community Survey 5-Year Estimates Supporting documentation on code lists, subject definitions, data accuracy, and statistical testing can be found
American Community Survey 5-Year Estimates
 DP03 SELECTED ECONOMIC CHARACTERISTICS 2012-2016 American Community Survey 5-Year Estimates Supporting documentation on code lists, subject definitions, data accuracy, and statistical testing can be found
American Community Survey 5-Year Estimates
 DP03 SELECTED ECONOMIC CHARACTERISTICS 2012-2016 American Community Survey 5-Year Estimates Supporting documentation on code lists, subject definitions, data accuracy, and statistical testing can be found
American Community Survey 5-Year Estimates
 DP03 SELECTED ECONOMIC CHARACTERISTICS 2012-2016 American Community Survey 5-Year Estimates Supporting documentation on code lists, subject definitions, data accuracy, and statistical testing can be found
American Community Survey 5-Year Estimates
 DP03 SELECTED ECONOMIC CHARACTERISTICS 2012-2016 American Community Survey 5-Year Estimates Supporting documentation on code lists, subject definitions, data accuracy, and statistical testing can be found
American Community Survey 5-Year Estimates
 DP03 SELECTED ECONOMIC CHARACTERISTICS 2012-2016 American Community Survey 5-Year Estimates Supporting documentation on code lists, subject definitions, data accuracy, and statistical testing can be found
American Community Survey 5-Year Estimates
 DP03 SELECTED ECONOMIC CHARACTERISTICS 2012-2016 American Community Survey 5-Year Estimates Supporting documentation on code lists, subject definitions, data accuracy, and statistical testing can be found
American Community Survey 5-Year Estimates
 DP03 SELECTED ECONOMIC CHARACTERISTICS 2012-2016 American Community Survey 5-Year Estimates Supporting documentation on code lists, subject definitions, data accuracy, and statistical testing can be found
American Community Survey 5-Year Estimates
 DP03 SELECTED ECONOMIC CHARACTERISTICS 2012-2016 American Community Survey 5-Year Estimates Supporting documentation on code lists, subject definitions, data accuracy, and statistical testing can be found
American Community Survey 5-Year Estimates
 DP03 SELECTED ECONOMIC CHARACTERISTICS 2012-2016 American Community Survey 5-Year Estimates Supporting documentation on code lists, subject definitions, data accuracy, and statistical testing can be found
American Community Survey 5-Year Estimates
 DP03 SELECTED ECONOMIC CHARACTERISTICS 2012-2016 American Community Survey 5-Year Estimates Supporting documentation on code lists, subject definitions, data accuracy, and statistical testing can be found
American Community Survey 5-Year Estimates
 DP03 SELECTED ECONOMIC CHARACTERISTICS 2012-2016 American Community Survey 5-Year Estimates Supporting documentation on code lists, subject definitions, data accuracy, and statistical testing can be found
American Community Survey 5-Year Estimates
 DP03 SELECTED ECONOMIC CHARACTERISTICS 2012-2016 American Community Survey 5-Year Estimates Supporting documentation on code lists, subject definitions, data accuracy, and statistical testing can be found
American Community Survey 5-Year Estimates
 DP03 SELECTED ECONOMIC CHARACTERISTICS 2012-2016 American Community Survey 5-Year Estimates Supporting documentation on code lists, subject definitions, data accuracy, and statistical testing can be found
American Community Survey 5-Year Estimates
 DP03 SELECTED ECONOMIC CHARACTERISTICS 2012-2016 American Community Survey 5-Year Estimates Supporting documentation on code lists, subject definitions, data accuracy, and statistical testing can be found
American Community Survey 5-Year Estimates
 DP03 SELECTED ECONOMIC CHARACTERISTICS 2012-2016 American Community Survey 5-Year Estimates Supporting documentation on code lists, subject definitions, data accuracy, and statistical testing can be found
American Community Survey 5-Year Estimates
 DP03 SELECTED ECONOMIC CHARACTERISTICS 2012-2016 American Community Survey 5-Year Estimates Supporting documentation on code lists, subject definitions, data accuracy, and statistical testing can be found
American Community Survey 5-Year Estimates
 DP03 SELECTED ECONOMIC CHARACTERISTICS 2012-2016 American Community Survey 5-Year Estimates Supporting documentation on code lists, subject definitions, data accuracy, and statistical testing can be found
American Community Survey 5-Year Estimates
 DP03 SELECTED ECONOMIC CHARACTERISTICS 2012-2016 American Community Survey 5-Year Estimates Supporting documentation on code lists, subject definitions, data accuracy, and statistical testing can be found
American Community Survey 5-Year Estimates
 DP03 SELECTED ECONOMIC CHARACTERISTICS 2012-2016 American Community Survey 5-Year Estimates Supporting documentation on code lists, subject definitions, data accuracy, and statistical testing can be found
American Community Survey 5-Year Estimates
 DP03 SELECTED ECONOMIC CHARACTERISTICS 2012-2016 American Community Survey 5-Year Estimates Supporting documentation on code lists, subject definitions, data accuracy, and statistical testing can be found
American Community Survey 5-Year Estimates
 DP03 SELECTED ECONOMIC CHARACTERISTICS 2012-2016 American Community Survey 5-Year Estimates Supporting documentation on code lists, subject definitions, data accuracy, and statistical testing can be found
American Community Survey 5-Year Estimates
 DP03 SELECTED ECONOMIC CHARACTERISTICS 2012-2016 American Community Survey 5-Year Estimates Supporting documentation on code lists, subject definitions, data accuracy, and statistical testing can be found
American Community Survey 5-Year Estimates
 DP03 SELECTED ECONOMIC CHARACTERISTICS 2012-2016 American Community Survey 5-Year Estimates Supporting documentation on code lists, subject definitions, data accuracy, and statistical testing can be found
American Community Survey 5-Year Estimates
 DP03 SELECTED ECONOMIC CHARACTERISTICS 2012-2016 American Community Survey 5-Year Estimates Supporting documentation on code lists, subject definitions, data accuracy, and statistical testing can be found
American Community Survey 5-Year Estimates
 DP03 SELECTED ECONOMIC CHARACTERISTICS 2012-2016 American Community Survey 5-Year Estimates Supporting documentation on code lists, subject definitions, data accuracy, and statistical testing can be found
SB 350 Study: Economic Model & Methodology
 California ISO Folsom, California SB 350 Study: Economic Model & Methodology Mapping BEAR Model Results to Disadvantaged Communities (Early Release Materials to Stakeholders) March 28, 2016 Berkeley Economic
Time for a Shared Recovery
 Time for a Shared Recovery Using the Census Data to Show the Harmful and Needless Needless Persistence of Poverty August 19, 2008 1 PART III continued 21 Getting the data on August 26: Go to www.census.gov
Five Connecticuts Report 2013 Preliminary Edition Methodology September 1, 2013 Edition
 PRELIMINARY HUMAN DEVELOPMENT INDEX FOR CONNECTICUT 1 September 2013 Kate Johnson INTRODUCTION This report provides a description of the methods used to create the Human Development Index for the 169 towns
HMDA Reporting Guide Revision 09.02
 HMDA Reporting Guide Revision 09.02 Table of Contents Resources... 3 Custom Reports... 3 HMDA LAR Loan Files Missing Data Report... 3 HMDA LAR Information... 4 HMDA RELIEF - QuestSoft... 4 Legend... 5
SELECTED ECONOMIC CHARACTERISTICS American Community Survey 5-Year Estimates
 DP03 SELECTED ECONOMIC CHARACTERISTICS 2008-2012 American Community Survey 5-Year Estimates Supporting documentation on code lists, subject definitions, data accuracy, and statistical testing can be found
Commission District 4 Census Data Aggregation
 Commission District 4 Census Data Aggregation 2011-2015 American Community Survey Data, U.S. Census Bureau Table 1 (page 2) Table 2 (page 2) Table 3 (page 3) Table 4 (page 4) Table 5 (page 4) Table 6 (page
Northwest Census Data Aggregation
 Northwest Census Data Aggregation 2011-2015 American Community Survey Data, U.S. Census Bureau Table 1 (page 2) Table 2 (page 2) Table 3 (page 3) Table 4 (page 4) Table 5 (page 4) Table 6 (page 5) Table
Riverview Census Data Aggregation
 Riverview Census Data Aggregation 2011-2015 American Community Survey Data, U.S. Census Bureau Table 1 (page 2) Table 2 (page 2) Table 3 (page 3) Table 4 (page 4) Table 5 (page 4) Table 6 (page 5) Table
Independence, MO Data Profile 2015
 , MO Data Profile 2015 5 year American Community Survey (ACS) Jackson County, Missouri Data sources: U.S. Census Bureau, American Community Survey (ACS), 2011 2015 (released December 8, 2016), compared
Zipe Code Census Data Aggregation
 Zipe Code 66101 Census Data Aggregation 2011-2015 American Community Survey Data, U.S. Census Bureau Table 1 (page 2) Table 2 (page 2) Table 3 (page 3) Table 4 (page 4) Table 5 (page 4) Table 6 (page 5)
Zipe Code Census Data Aggregation
 Zipe Code 66103 Census Data Aggregation 2011-2015 American Community Survey Data, U.S. Census Bureau Table 1 (page 2) Table 2 (page 2) Table 3 (page 3) Table 4 (page 4) Table 5 (page 4) Table 6 (page 5)
Appendix 1. Number of admissions for 14 conditions rich in avoidable admissions
 Appendix Appendix 1. Number of admissions for 14 conditions rich in avoidable admissions 2014-2016 Conditions ICD-10 Numbers (%) Non-specific chest pain R072-R074 55,333 (21) Chronic Obstructive Pulmonary
GETTING NUMBERS AND PERCENTAGES NEEDED FOR THE PET ESTIMATION TOOL
 GETTING NUMBERS AND PERCENTAGES NEEDED FOR THE PET ESTIMATION TOOL For the Pet Estimation Tool you will need to have the following bits of data: Total population of your target area (whether by zip code,
STAT Lab#5 Binomial Distribution & Midterm Review
 STAT 22000 Lab# Binomial Distribution & Midterm Review Binomial Distributions For X Bin(n, p), Assumptions: P (X = k) = n p k (1 p) n k k Only two possible outcomes The number of trials n must be fixed
MASS Sub-Indicators. Tenant Accounts Receivable. Represents the amount of tenant accounts receivable against tenant charges
 MASS Sub-Indicators Occupancy Tenant Accounts Receivable Accounts Payable N E W Emphasizes & measures project s success in keeping available units occupied Represents the amount of tenant accounts receivable
An Overview of the New Supplemental Poverty Measure
 An Overview of the New Supplemental Poverty Measure David Johnson U.S. Census Bureau Brookings Institution May 6, 2010 The Patronus and Poverty Measurement 2 What is Poverty? Adam Smith and Poverty The
Click to edit Master text styles
 For those dialing in: All phones are muted Second Submit questions level using the chat window at any time during Third the level webinar Troubleshooting: Call Readytalk s help line: (800) 843-9166 Ask
Income Inequality in Canada: Trends in the Census
 Income Inequality in Canada: Trends in the Census 1980-2005 Kevin Milligan Vancouver School of Economics University of British Columbia kevin.milligan@ubc.ca May, 2013 1 The focus of this paper: Analysis
Handout 5: Summarizing Numerical Data STAT 100 Spring 2016
 In this handout, we will consider methods that are appropriate for summarizing a single set of numerical measurements. Definition Numerical Data: A set of measurements that are recorded on a naturally
Subsidy-Eligible Maps
 SUBSIDY-ELIGIBLE MAPS NOW AVAILABLE Also known as GIS Maps The Subsidy-Eligible Geographic Information System (GIS) Maps are now updated for 2016! What s New Updated previous data model with June 2016
Source: Fall 2015 Biostats 540 Exam I. BIOSTATS 540 Fall 2016 Practice Test for Unit 1 Summarizing Data Page 1 of 6
 BIOSTATS 540 Fall 2016 Practice Test for Unit 1 Summarizing Data Page 1 of 6 Source: Fall 2015 Biostats 540 Exam I. 1. 1a. The U.S. Census Bureau reports the median family income in its summary of census
City Health Dashboard Technical Document Part 1
 City Health Dashboard Technical Document Part 1 Version 2: Updated June 4, 2018 Contents SECTION 1: Overview... 6 Document Mission... 6 Note on State-based Education Data... 6 Measure Selection Criteria...
Online Appendix Taylor, Ratcliffe & Perenzin
 Online Appendix Taylor, Ratcliffe & Perenzin This appendix provides details for the construction of two indices described in the paper: socioeconomic status, and residential stability, and how specific
Towards Standards in Mapping ACS Data. Joel A. Alvarez & Joseph J. Salvo NYC Department of City Planning Population Division
 Towards Standards in Mapping ACS Data March 8, 2018 Joel A. Alvarez & Joseph J. Salvo NYC Department of City Planning Population Division Dec. 30 th 2010 Important Note: The values for counties shown in
Figure 1 Nearly 1 million Virginians lack health insurance coverage. Total Nonelderly
 Figure 1 Nearly 1 million Virginians lack health insurance coverage Total Nonelderly 984,000 uninsured nonelderly Figure 2 Over forty percent of all uninsured Virginians live below the poverty level Notes:
Making the Case for Shared Prosperity: Using the New Poverty, Income, and Health Insurance Data
 Making the Case for Shared Prosperity: Using the New Poverty, Income, and Health Insurance Data September 6, 2012 With many thanks to the Annie E. Casey Foundation, George Gund Foundation, ELCA World Hunger
Life Science Industries Increase Indiana's Personal Income
 Life Science Industries Increase Indiana's Personal Income TIMOTHY F. SLAPER Director of Economic Analysis, Indiana Business Research Center, Indiana University Kelley School of Business A measure of the
Tyler Area Economic Overview
 Tyler Area Economic Overview Demographic Profile. 2 Unemployment Rate. 4 Wage Trends. 4 Cost of Living Index...... 5 Industry Clusters. 5 Occupation Snapshot. 6 Education Levels 7 Gross Domestic Product
Creating a Rolling Income Statement
 Creating a Rolling Income Statement This is a demonstration on how to create an Income Statement that will always return the current month s data as well as the prior 12 months data. The report will be
Small Area Health Insurance Estimates from the Census Bureau: 2008 and 2009
 October 2011 Small Area Health Insurance Estimates from the Census Bureau: 2008 and 2009 Introduction The U.S. Census Bureau s Small Area Health Insurance Estimates (SAHIE) program produces model based
The current study builds on previous research to estimate the regional gap in
 Summary 1 The current study builds on previous research to estimate the regional gap in state funding assistance between municipalities in South NJ compared to similar municipalities in Central and North
LAKE FOREST NEIGHBORHOOD PROFILE
 LAKE FOREST NEIGHBORHOOD PROFILE July 2017 Prepared in Partnership Between the Kentucky State Data Center at the University of Louisville and Metro United Way This data profile uses 2010 census tract boundaries
Unemployment Rate - Ottumwa, IA
 - Ottumwa, IA Report Area Ottumwa, IA Social & Economic Factors Economic and social insecurity often are associated with poor health. Poverty, unemployment, and lack of educational achievement affect access
Technical Documentation: Generating Unbanked and Underbanked Estimates for Local Geographies
 Technical Documentation: Generating Unbanked and Underbanked Estimates for Local Geographies Prepared by Haveman Economic Consulting 1 and CFED August 2011 Introduction For years, researchers, policymakers,
How the Census Bureau Measures Poverty With Selected Sources of Poverty Data
 How the Census Bureau Measures Poverty With Selected Sources of Poverty Data Alemayehu Bishaw Poverty Statistics Branch Social, Economic and Housing Statistics Division U. S. Census Bureau November 15-16,
Supporting Information for:
 Supporting Information for: Can Political Participation Prevent Crime? Results from a Field Experiment about Citizenship, Participation, and Criminality This appendix contains the following material: Supplemental
2014 HEALTH INSURANCE COVERAGE ESTIMATES
 2014 HEALTH INSURANCE COVERAGE ESTIMATES SHADAC Webinar Featuring U.S. Census Bureau Experts September 22, 2015, 2:00 PM EDT You will be connected to broadcast audio through your computer. You can also
WESTERN COASTAL ALASKA
 WESTERN COASTAL ALASKA County Community Data Profile Vantage Point 2015: 12 th District Community Indicators Project Federal Reserve Bank of San Francisco Project Contact: Gabriella Chiarenza gabriella.chiarenza@sf.frb.org
County Economic Status and Distressed Areas in the Appalachian Region
 County Economic Status and Distressed Areas in the Appalachian Region Kostas Skordas, Director Regional Planning & Research Division Appalachian Regional Commission Washington, DC Appalachian Regional
Unemployment. What are the different types of unemployment? How are unemployment rates determined? What is full employment?
 Unemployment What are the different types of unemployment? How are unemployment rates determined? What is full employment? Types of Unemployment Frictional Unemployment Occurs when people change jobs,
Enhancing Economic Security for the Latino Community
 Enhancing Economic Security for the Latino Community March 21, 2012 Presented at a Symposium Honoring the Center for Policy Research on Aging s 15 th Anniversary Aging in a Minority-Majority Nation: Interracial
2018:IIIQ Nevada Unemployment Rate Demographics Report*
 2018:IIIQ Nevada Unemployment Rate Demographics Report* Department of Employment, Training & Rehabilitation Research and Analysis Bureau Dr. Tiffany Tyler-Garner, Director Dennis Perea, Deputy Director
Health Insurance & Median Income in Connecticut: Summary of 2008 American Community Survey Census Data
 Health Insurance & Median in : Summary of American Community Survey Census Data Estimates for and the Nation September 22, 2009 Indicator All children under 18 uninsured (point in time estimate) 9.0% (310,597)
Economic Overview City of Tyler, TX. January 8, 2018
 Economic Overview City of Tyler, TX January 8, 2018 DEMOGRAPHIC PROFILE...3 EMPLOYMENT TRENDS...5 WAGE TRENDS...5 COST OF LIVING INDEX...6 INDUSTRY SNAPSHOT...7 OCCUPATION SNAPSHOT...9 INDUSTRY CLUSTERS...
After tax credits, many insurance plans in Garfield, Summit Counties are less expensive than those in Denver
 After tax credits, many insurance plans in Garfield, Summit Counties are less expensive than those in Denver ISSUE BRIEF Kyle Brown Senior Health Policy Analyst 303-573-5669 ext. 304 kbrown@cclponline.org
GERMANTOWN-PARISTOWN NEIGHBORHOOD PROFILE
 GERMANTOWN-PARISTOWN NEIGHBORHOOD PROFILE July 2017 Prepared in Partnership Between the Kentucky State Data Center at the University of Louisville and Metro United Way Louisville s traditional urban neighborhoods
REGIONAL REVIEW COMMITTEE GUIDEBOOK
 REGIONAL REVIEW COMMITTEE GUIDEBOOK 2015-2016 TEXAS COMMUNITY DEVELOPMENT BLOCK GRANT PROGRAM August 6, 2014 CAPCOG 2015-2016 RRC Guidebook Page 1 TABLE OF CONTENTS I. PART I Introduction.... page 1 II.
SOUTH LOUISVILLE NEIGHBORHOOD PROFILE
 SOUTH LOUISVILLE NEIGHBORHOOD PROFILE July 2017 Prepared in Partnership Between the Kentucky State Data Center at the University of Louisville and Metro United Way Louisville s traditional urban neighborhoods
EASTWOOD-LONG RUN NEIGHBORHOOD PROFILE
 EASTWOOD-LONG RUN NEIGHBORHOOD PROFILE July 2017 Prepared in Partnership Between the Kentucky State Data Center at the University of Louisville and Metro United Way This data profile uses 2010 census tract
Economic Overview York County, South Carolina. February 14, 2018
 Economic Overview York County, February 14, 2018 DEMOGRAPHIC PROFILE... 3 EMPLOYMENT TRENDS... 5 UNEMPLOYMENT RATE... 5 WAGE TRENDS... 6 COST OF LIVING INDEX... 6 INDUSTRY SNAPSHOT... 7 OCCUPATION SNAPSHOT...
SHELBY PARK NEIGHBORHOOD PROFILE
 SHELBY PARK NEIGHBORHOOD PROFILE July 2017 Prepared in Partnership Between the Kentucky State Data Center at the University of Louisville and Metro United Way Louisville s traditional urban neighborhoods
How to Scale a Test Score
 How to Scale a Test Score This demonstration will cover the task of scaling a test score, which is the act of adding points to, or subtracting points from, a completed, customized test within the McKesson
Montenegro. Country coverage and the methodology of the Statistical Annex of the 2015 HDR
 Human Development Report 2015 Work for human development Briefing note for countries on the 2015 Human Development Report Montenegro Introduction The 2015 Human Development Report (HDR) Work for Human
CHEROKEE-SENECA NEIGHBORHOOD PROFILE
 CHEROKEE-SENECA NEIGHBORHOOD PROFILE July 2017 Prepared in Partnership Between the Kentucky State Data Center at the University of Louisville and Metro United Way Louisville s traditional urban neighborhoods
Oman. Country coverage and the methodology of the Statistical Annex of the 2015 HDR
 Human Development Report 2015 Work for human development Briefing note for countries on the 2015 Human Development Report Oman Introduction The 2015 Human Development Report (HDR) Work for Human Development
ARIZONA BALANCE OF STATE
 ARIZONA BALANCE OF STATE County Community Data Profile Vantage Point 2015: 12 th District Community Indicators Project Federal Reserve Bank of San Francisco Project Contact: Gabriella Chiarenza gabriella.chiarenza@sf.frb.org
Sampling Distributions
 Section 8.1 119 Sampling Distributions Section 8.1 C H A P T E R 8 4Example 2 (pg. 378) Sampling Distribution of the Sample Mean The heights of 3-year-old girls are normally distributed with μ=38.72 and
Indices of Deprivation
 DEPARTMENT OF SOCIAL POLICY AND INTERVENTION Indices of Deprivation Mapping the spatial distribution of multiple deprivation at small area level and their uses for targeting area-based regeneration policies
Volume Author/Editor: John F. Kain and John M. Quigley. Volume URL:
 This PDF is a selection from an out-of-print volume from the National Bureau of Economic Research Volume Title: Housing Markets and Racial Discrimination: A Microeconomic Analysis Volume Author/Editor:
Katahdin Region Socioeconomic Indicators Katahdin Region
 Katahdin Region Socioeconomic Indicators Town of Medway Katahdin Region Socioeconomic Indicators Katahdin Region Report by Senator George J. Mitchell Center for Sustainability Solutions University of Maine
Briefing note for countries on the 2015 Human Development Report. Lesotho
 Human Development Report 2015 Work for human development Briefing note for countries on the 2015 Human Development Report Lesotho Introduction The 2015 Human Development Report (HDR) Work for Human Development
Excel Advanced Tips: Sort and Filter
 Excel Advanced Tips: Sort and Filter South Dakota The 5th Annual Demography Conference By Shuang Li Ph.D. Student, Teaching Assistant Department of Sociology and Rural Studies South Dakota State University
PORTLAND NEIGHBORHOOD PROFILE
 PORTLAND NEIGHBORHOOD PROFILE July 2017 Prepared in Partnership Between the Kentucky State Data Center at the University of Louisville and Metro United Way Louisville s traditional urban neighborhoods
Model Paper Statistics Objective. Paper Code Time Allowed: 20 minutes
 Model Paper Statistics Objective Intermediate Part I (11 th Class) Examination Session 2012-2013 and onward Total marks: 17 Paper Code Time Allowed: 20 minutes Note:- You have four choices for each objective
Who is internationally diversified? Evidence from the 401(k) plans of 296 firms*
 plans of 296 firms*") Online Appendix for Who is internationally diversified? Evidence from the 401(k) plans of 296 firms* Geert Bekaert a,b, Kenton Hoyem c, Wei-Yin Hu c, Enrichetta Ravina a, * a Columbia Business School,
Online Appendix for Who is internationally diversified? Evidence from the 401(k) plans of 296 firms* Geert Bekaert a,b, Kenton Hoyem c, Wei-Yin Hu c, Enrichetta Ravina a, * a Columbia Business School,
Employment Equity in Southern States: Detailed Methodology
 Employment Equity in Southern States: Detailed Methodology Prepared by PolicyLink and the USC Program for Environmental and Regional Equity November 2017 Unless otherwise noted, data and analyses presented
JSU Public Policy Student Symposium April 23,2014 Alan Branson Ph.D. Student Public Policy and Public Administration Program
 DETERMINANTS OF PAYDAY LENDING LOCATIONS IN MISSISSIPPI JSU Public Policy Student Symposium April 23,2014 Alan Branson Ph.D. Student Public Policy and Public Administration Program Background on Payday
ANNEX 1: Data Sources and Methodology
 ANNEX 1: Data Sources and Methodology A. Data Sources: The analysis in this report relies on data from three household surveys that were carried out in Serbia and Montenegro in 2003. 1. Serbia Living Standards
Normal Model (Part 1)
") Normal Model (Part 1) Formulas New Vocabulary The Standard Deviation as a Ruler The trick in comparing very different-looking values is to use standard deviations as our rulers. The standard deviation
Normal Model (Part 1) Formulas New Vocabulary The Standard Deviation as a Ruler The trick in comparing very different-looking values is to use standard deviations as our rulers. The standard deviation
Serbia. Country coverage and the methodology of the Statistical Annex of the 2015 HDR
 Human Development Report 2015 Work for human development Briefing note for countries on the 2015 Human Development Report Serbia Introduction The 2015 Human Development Report (HDR) Work for Human Development
An Introduction to the American Community Survey Health Insurance Coverage Estimates
 September 2009 An Introduction to the American Community Survey Health Insurance Coverage Estimates Introduction The American Community Survey (ACS) is a new source of data for health insurance coverage