Use and distribution of extractive sector revenues Roger Hosein
|
|
|
- Tamsin Burns
- 5 years ago
- Views:
Transcription
1 Use and distribution of extractive sector revenues Roger Hosein 07/04/2014 1
2 Table 4: Trinidad and Tobago s Macroeconomic indicators, Total reserves in months of imports (Import Cover) Gross Official Reserves ($US mn) CAB (% of GDP) GDP per capita (constant 2000 US$) , , , , , , , , , , , , , , , , , , , , , , , , , , , , , , , , , /04/2014 (provisional) , ,
3 GDP (constant LCU), TT$mn GDP (current LCU), TT$mn /04/2014 3
4 GDP per capita (constant LCU) GDP per capita (current LCU) /04/
5 GDP (constant 2005 US$) Total natural resources rents (% of GDP) /04/2014 5
6 Table 5: Real GDP Growth Rate of various sectors, Date Petroleum Non Petroleum Petrochemic als Other Petroleum Governmen t Agriculture Constructio n Manufacturi ng Distribution Finance, Insurance & Other Services n.d n.d /04/
7 Table 6: Real GDP growth rate of the T&T Economy (Quarter on Quarter %) GDP Growth Rate (2000=100) Mar Jun Sep Dec Mar Jun Sep Dec Mar Jun Sep Dec Mar Jun Sep Dec Mar Jun Sep Dec Mar Jun Sep Dec Mar Jun Sep Dec Mar Jun Sep /04/2014 Dec Mar
8 Table 7: Quarterly Real GDP growth of Petroleum and Non Petroleum Sector, Q Q Date Non Petroleum Petroleum Total Jun Sep Dec Mar Jun Sep Dec Mar Jun Sep Dec Mar Source: CBTT Database, /04/2014 8
9 Rank Score /04/2014 9
10 1.02 Intellectual property protection Public trust in politicians Irregular payments and bribes Favoritism in decisions of government officials Wastefulness of government spending Transparency of government policymaking Business costs of crime and violence Organized crime Reliability of police services Ethical behavior of firms Strength of auditing and reporting standards Efficacy of corporate boards Protection of minority shareholders interests Available airline seat km/week, millions* Inflation, annual % change* Business impact of HIV/AIDS HIV prevalence, % adult pop.* Infant mortality, deaths/1,000 live births* Life expectancy, years* Tertiary education enrollment, gross %* Effectiveness of anti monopoly policy No. days to start a business* Agricultural policy costs Trade tariffs, % duty* Burden of customs procedures Imports as a percentage of GDP* Degree of customer orientation /04/
11 7.01 Cooperation in labor employer relations Flexibility of wage determination Redundancy costs, weeks of salary* Pay and productivity Women in labor force, ratio to men* Ease of access to loans Venture capital availability Mobile broadband subscriptions/100 pop.* th pillar: Market size Domestic market size index, 1 7 (best)* Foreign market size index, 1 7 (best)* GDP (PPP$ billions)* State of cluster development Nature of competitive advantage Value chain breadth Willingness to delegate authority th pillar: Innovation Capacity for innovation Quality of scientific research institutions Company spending on R&D University industry collaboration in R&D Gov t procurement of advanced tech products /04/
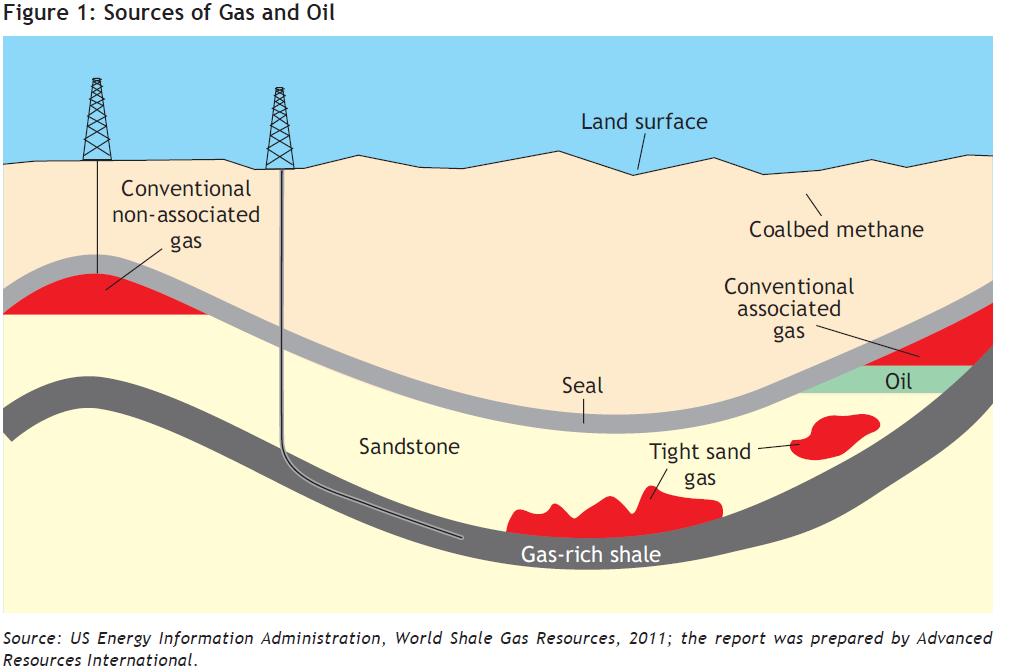
12 Shale gas Shale gas has become not only an energy exploration and production issue wherever it is or might be located, but also a macroeconomic issue for national economies, a microeconomic issue for energy intensive industry sectors, a global environmental issue for local communities, a public safety and health issue wherever there is exploration or production, and an energy independence and national security issue in countries that are dependent on oil imports and/or gas imports. 07/04/
13 Like labour and capital, natural resources are factors of production that serve as inputs in goods and services production. While there is a broad range of natural resources that could be discussed, the focus here will be on energy and, to a limited extent, on land and water, which are the natural resources typically included in aggregate production functions (for discussion of trade and a wider variety of natural resources, see the 2010 World Trade Report (WTO, 2010) and Ruta and Venables (2012). 07/04/
14 07/04/
15 1, Rapid growth in demand Demand for Gas (BCM) Total North America Total S. & Cent. America Total Europe & Eurasia Total Middle East Total Africa Total Asia Pacific
16 Rapid growth in demand India is building infrastructure for importing LNG Terminal Commissioning Capacity Dahej LNG Termina in 2004, 10 in 2009, 15 planned for 2016 Hazira LNG Terminal million tons per annum (mmtpa) is planned, currently at 2.5 mmtpa Dabhol LNG Terminal 2014 after the construction of the breakwater (the breakwater is equipment in the water to protect ships from big waves 10.0 million tons per annum (mmtpa) Kochi LNG Terminal Q 3, mmtpa Gangavaram LNG Terminal Planned for mmtpa Source: Petronet LNG LTD, May /04/ SD_ pdf
17 Rapid growth in demand India is building infrastructure for importing LNG India GDP (constant 2005, US$) , , , , , , , , /04/
18 Surge in production Another feature of world natural gas markets is shale gas. US shale gas deposits has been proven has risen from 23 TCF in 2007 to 60.6 TCF in 2011 to TCF in 2011, and 665 TCF by year US Shale gas (TCF) Source: US EIA database 07/04/

19 Surge in production 07/04/ Source: EIA database
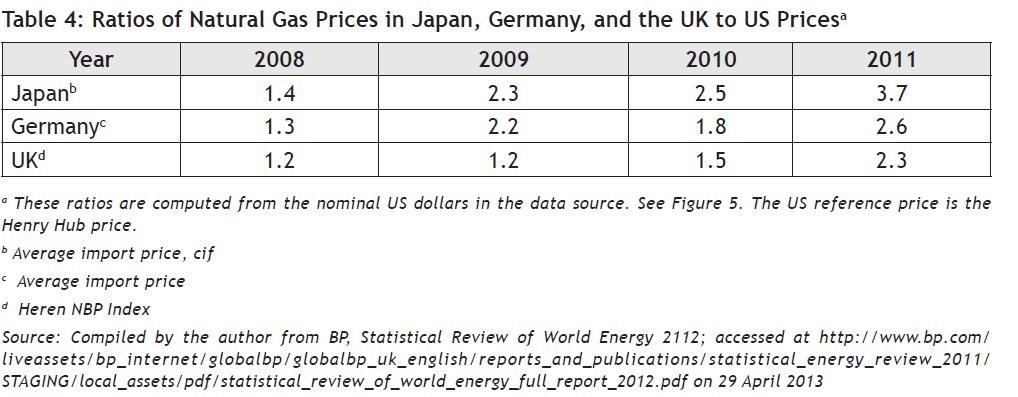
20 Surge in production Henry Hub prices Axis Title 6 5 HH /04/
21 07/04/
22 07/04/
23 Table 12: Improper use of subsidies and economic rents Transfers and Subsidies (TT$mn) Central Gov't Current Revenue Oil (TT$mns) Non Institutional Population (000's) Unemployme nt Rate (%) Real Economic growth Rate Unemploy ment (000's) , , , , , , , , , , , , , , , , , , , , , , , , p 11,428.5* 23
24 CEPEP Table 10: Budgetary allocations to CEPEP Fiscal Year Budget Allocation (Millions) May to September 2002 $ $ $ $ $ $ $ $ $ $ $ $468 Source: Social Sector Investment Programme Reports (Various Years) 24
25 minimum wage imputed minimum wage real minimum wage Index of Retail Prices All Items (Jan. 03=100) /04/
26 Year Total Employed Labor Force Distribution of Elementary Workers by Industrial Group Total EW Agriculture (excludes sugar) Manufacturing (excludes sugar and petroleum) Source: CSO, Continuous Sampling Survey of the Population (various years) 07/04/ CSP
27 Year Total Employme nt Figure 2: Employment Trends in selected segments of the Labor Market, Employment in Community social and personal employment (CSP) Elementary Occupations in CSP Women in elementary employment jobs in the CSP sector Number of workers in CSP working less than 33 hours CSP/TOTAL employment (%) Total Elementary Occupations Source: Continuous Sampling Survey of the Population, various years 07/04/
28 Date Persons with Jobs (000's) Labour Force (000's) Unemployment (000's) Unemployment Rate (%) Participation Ratio (%) Mar Jun Sep Dec Mar Jun Sep Dec Mar Jun Sep Dec Mar Jun Sep Dec Mar Jun Sep Dec Mar Jun Sep Dec Mar 2011 n.d. n.d. n.d. n.d. n.d. Jun Sep Dec Mar Jun Sep /04/
29 Date Employment in Agriculture (000's) Employment in Construction (incl.electricity & Water) (000's) Employment in Manufacturing (000's) Employment in All Other Sectors (000's) Employment in Petroleum & Gas (000's) Persons Employed Transport Storage & Comm. (000's) Mar Jun Sep Dec Mar Jun Sep Dec Mar Jun Sep Dec Mar Jun Sep Dec Mar Jun Sep Dec Mar Jun Sep Dec Mar 11 n.d. n.d. n.d. n.d. n.d. n.d. Jun Sep Dec Mar 12 07/04/ Jun
30 Calendar year Table 14: Fuel Subsidy claimed on types of Fuel Premium 95 RON Super 92 RON Subsidy Claimed (TT$mn) Regular 83 RON Auto Diesel Kerosene LPG TOTAL , , , , (5.69) , , , , , , , , , , YTD (July 2013) , , , Source: Ministry of Energy and Energy Affairs,
31 Table 15: Motor Vehicles on Register Hire and Goods Tractors and Motor Total Year Private Rented Omnibus Vehicles Trailers Cycles Industrial Registered Real GDP p
32 Introduction to the GATE Programme 2001: Dollar for Dollar programme 50% TLE Tuition Funding 2004: GATE Programme 50% Tuition Funding + Up to 100% Tuition Funding based on Means Test 2006: GATE Programme Modified 100% Universal Tuition Funding for persons wishing to pursue TLE 32
33 The GATE Programme One of the major goals created for the GATE programme was the attainment of a tertiary participation rate of 60% by By 2008, the tertiary participation rate within Trinidad and Tobago had increased to 40% (Trinidad and Tobago International Financial Centre). In addition to the increase in the tertiary participation rate, the introduction of the GATE Programme brought with it a mushrooming of private tertiary level institutions. 33
34 Table 2: Showing the Number of Participating TLIs in Trinidad and Tobago Year Number of GATE Approved Private Institutions Number of GATE Approved Public Institutions Report of the Standing Committee on the GATE Programme (2011) 34
35 Expenditure on and Beneficiaries of GATE Programme Table 3: Total Expenditure $TT (Millions) Fiscal Year Private Institutions Public Institutions Number of Students Receiving GATE Funding 2004/2005 $30 $72 27, /2006 $70 $110 38, /2007 $244 $229 57, /2008 $232 $270 53, /2009 $240 $335 52, /2010 $236 $349 53, /2011 $281 $344 45,040 Report of the Standing Committee on the GATE Programme (2011) 35
36 Income of Households Figure 3: Effect of Dollar for Dollar on the Income of Households Pursuing TLE Y r Y m Y p 50% Fees Subsidised Y 1 d Y 0 d 0 H r H m H p Financial Need 36
37 Income of Households Figure 4: Additional Funding Needed by Poorest Households for TLE Y r Y UF A Y 1 d 0 H r H m H p Financial Need 37
38 Figure 5: Effect of Oil Windfall GATE on Income of Households Pursuing TLE Income of Households Y r G Y r B Y m A Y G d Y p Y 1 d 0 H r H m H p Financial Need 38
39 Table 4: Comparison of Household Expenditure and Access to GATE by Income Group of Head and Household Income Group Income Group (TT$) Average Size of % Accessing GATE Percentage Distribution Average Monthly Household by Income Funding by Income of households by Savings per household Group of Head Group of Head Household Income Group by Household Income Group All Income Groups $ Less than 1, $ ,000-2, $ ,000-4, $ ,000-6, $ ,000-8, $ ,000-10, $ ,000-12, $ ,000-14, $ ,000-16, $ ,000-18, $ ,000-20, $ ,000-22, $ ,000-24, $ ,000 and Over $ Source: Trinidad and Tobago Household Budget Survey 2008/09 *7,090 Households Participated in this Survey 39
40 Table 5: Percentage Distribution of Household Member by Type of Government Social Program Accessed by Household Member, Income Area and Urban/Rural Classification Income Area Urban/Rural Classificaiton Type of Government Social Programmes Accessed by Household Member All Househo lds Low Middle High Urban Rural Old Age Pension Public Assistant Disability Grant TCCIP (Smart Card) Gate
41 Thank you 07/04/
How to Read the Competitiveness Profiles
 How to Read the Competitiveness Profiles The Competitiveness Profiles section of The Africa Competitiveness Report 2013 presents a two-page profile of the performance in the Global Competitiveness Index
Roger Hosein Trade and Economic Development Unit Achieving Sustainable Development in Regions with Extractive Industries June 14 th 2013 Paria Suites
 Roger Hosein Trade and Economic Development Unit Achieving Sustainable Development in Regions with Extractive Industries June 14 th 2013 Paria Suites 1 Brief outline of Dutch Disease and resource curse
The Russian Federation is ranked 46th in the GII 2018, moving down 1 position from the previous year.
 Russian Federation 46 th The Russian Federation is ranked 46th in the GII 2018, moving down 1 position from the previous year. The GII indicators are grouped into innovation inputs and outputs. The following
Georgia is ranked 59th in the GII 2018, moving up 9 positions from the previous year.
 Georgia 59 th Georgia is ranked 59th in the GII 2018, moving up 9 positions from the previous year. The GII indicators are grouped into innovation inputs and outputs. The following table reflects Georgia
Saudi Arabia is ranked 61st in the GII 2018, dropping 6 positions from last year.
 Saudi Arabia 61 st Saudi Arabia is ranked 61st in the GII 2018, dropping 6 positions from last year. The GII indicators are grouped into innovation inputs and outputs. The following table reflects Saudi
Slovenia is ranked 30th in the GII 2018, moving up 2 positions from the previous year.
 Slovenia 30 th Slovenia is ranked 30th in the GII 2018, moving up 2 positions from the previous year. The GII indicators are grouped into innovation inputs and outputs. The following table reflects Slovenia
Retrospect and Prospects. Secretary Ministry of Planning and Development Government of Pakistan
 1 st ADB-Asia Pacific Think Tank Forum Beijing, 30-31 October, 2013 Inclusive Growth in Asia: Pakistan s s Experience Retrospect and Prospects Secretary Ministry of Planning and Development Government
KENYA'S VISION 2030: AN AUDIT FROM AN INCOME AND GENDER INEQUALITIES PERSPECTIVE. SID Society for International Development
 KENYA'S VISION 2030: AN AUDIT FROM AN INCOME AND GENDER INEQUALITIES PERSPECTIVE SID Society for International Development I Contents Section 1 List of Abbreviations and Acronyms x Executive Summary xiv
MAURITANIA STATISTICAL SNAPSHOT
 MAURITANIA STATISTICAL SNAPSHOT 2016 ABOUT THE SNAPSHOT The Mauritania Statistical Snapshot presents the main development and economic data and key indicators under the following topics: demography, education,
ECONOMIC POLICIES, GROWTH AND STRUCTURAL CHANGE OF INDIA B. A. PRAKASH
 ECONOMIC POLICIES, GROWTH AND STRUCTURAL CHANGE OF INDIA B. A. PRAKASH Chairman, Fifth State Finance Commission December 6, 2017 Objectives Examine the economic policies prior and after liberalisation
Part 2. Country Profiles
 Part 2 Country Profiles User s Guide: How Country Profiles Work COUNTRY PROFILES: PAGE 1 KEY RANKS, SCORES AND INDICATORS The first section presents each country s overall human capital score and its
International Monetary Fund Washington, D.C.
 2004 International Monetary Fund May 2004 IMF Country Report No. 04/140 January 29, 2001 January 29, 2001 January 29, 2001 January 29, 2001 January 29, 2001 Republic of Belarus: Statistical Appendix This
Morocco is ranked 76th in the GII 2018, moving down 4 positions from the previous year.
 Morocco 76 th Morocco is ranked 76th in the GII 2018, moving down 4 positions from the previous year. The GII indicators are grouped into innovation inputs and outputs. The following table reflects Morocco
Beneficiary View. Cameroon - Total Net ODA as a Percentage of GNI 12. Cameroon - Total Net ODA Disbursements Per Capita 120
 US$ % of GNI Beneficiary View Cameroon - Official Development Assistance (OECD/DAC Data) Source: OECD/DAC Database by Calendar Year (as of 2/2/213) unless noted. Cameroon - Total Net ODA as a Percentage
Social protection consist of policies and programs designed to reduce poverty and vulnerability.
 Social Protection Index (SPI) is relatively a simple indicator that divides total expenditures on social protection by total number of intended beneficiaries of social protection programs. Social protection
IRAQ STATISTICAL SNAPSHOT
 IRAQ STATISTICAL SNAPSHOT 2016 ABOUT THE SNAPSHOT The Iraq Statistical Snapshot presents the main development and economic data and key indicators under the following topics: demography, education, macroeconomy
Subsidy & Economic Reform & Social protection. 30 October 2018
 Subsidy & Economic Reform & Social protection 30 October 2018 Non Inclusive Growth & Poor Targeting Fuel subsidies (6% of GDP): were not only higher than health and education public expenditures combined,
Dubai s Growth Drivers
 Dubai s Growth Drivers Presentation at the Dubai Economic Outlook 2012 Dr. Nasser Saidi, Chief Economist, DIFC 15 th February, 2012 Agenda 1. BACKGROUND 2. MACROECONOMIC & STRUCTURAL DRIVERS 3. BUILDING
Fiscal competitiveness issues in Romania
 Fiscal competitiveness issues in Romania Ionut Dumitru President of the Fiscal Council, Chief Economist Raiffeisen Bank* October 2014 World Bank Doing Business Report Ranking (out of 189 countries) Ease
A NEW APPROACH TO DIVERSIFICATION WE ARE OUR GREATEST RESOURCE. MINISTRY OF PLANNING AND THE ECONOMY Socio Economic Policy Planning Division 22/06/12
 WE ARE OUR GREATEST RESOURCE A NEW APPROACH TO DIVERSIFICATION MINISTRY OF PLANNING AND THE ECONOMY Socio Economic Policy Planning Division 22/06/12 CONTENTS: HISTORICAL OVERVIEW CURRENT SITUATIONAL ANALYSIS
Central Bank of Trinidad and Tobago P.O. Box 1250 Port-of-Spain Republic of Trinidad and Tobago
 Central Bank of Trinidad and Tobago P.O. Box 1250 Port-of-Spain Republic of Trinidad and Tobago www.central-bank.org.tt Copyright 2014 Central Bank of Trinidad and Tobago ISBN -978-976-8134-22-6 HANDBOOK
Myanmar. Key Indicators for Asia and the Pacific Item
 Key Indicators for Asia and the Pacific 2017 1 POPULATION a Total population million; as of 1 October 46.1 46.6 47.1 47.6 48.1 48.5 48.8 49.2 49.5 49.8 50.2 50.6 51.0 51.4 52.0 52.5 52.9 Population density
EGYPT STATISTICAL SNAPSHOT
 EGYPT STATISTICAL SNAPSHOT 2016 ABOUT THE SNAPSHOT The Egypt Statistical Snapshot presents the main development and economic data and key indicators under the following topics: demography, education, macroeconomy
LIBYA STATISTICAL SNAPSHOT
 LIBYA STATISTICAL SNAPSHOT 2016 ABOUT THE SNAPSHOT The Libya Statistical Snapshot presents the main development and economic data and key indicators under the following topics: demography, education, macroeconomy
2 The Future of Trade
 SNAPSHOT 2 The Future of Trade i THE FUTURE OF TRADE SNAPSHOT New research predicts sweeping advances in tech and finance will fuel global trade over next decade. The research, commissioned by DMCC, highlights
Ghanaian Labor Market. Key Trends and Major Policy Issues
 Ghanaian Labor Market Key Trends and Major Policy Issues Background Ghana then Gold Coast was under British Colonial domination since second half of C19th. Gained independence in 1957 (1 st in SSA) Was
Emerging Global Challenges and implications for Indonesia
 Emerging Global Challenges and implications for Indonesia Muhammad Chatib Basri Harvard Kennedy School and University of Indonesia Short term problems: macroeconomic stability 2 The macroeconomic impact
Technical Notes and Sources
 APPENDIX D Technical Notes and Sources The data in this Report represent the best available estimates from various national authorities, international agencies, and private sources at the time the Report
MOROCCO STATISTICAL SNAPSHOT
 MOROCCO STATISTICAL SNAPSHOT 2016 ABOUT THE SNAPSHOT The Morocco Statistical Snapshot presents the main development and economic data and key indicators under the following topics: demography, education,
SECTION - 13: DEVELOPMENT INDICATORS FOR CIRDAP AND SAARC COUNTRIES
 Development Indicators for CIRDAP And SAARC Countries 485 SECTION - 13: DEVELOPMENT INDICATORS FOR CIRDAP AND SAARC COUNTRIES The Centre for Integrated Rural Development for Asia and the Pacific (CIRDAP)
COUNTRY PROFILE. Cyprus
 COUNTRY PROFILE Cyprus WORLD COMPETITIVENESS RANKING 207 All data are available from the World Competitiveness Online. Visit our eshop COMPETITIVENESS TRENDS - OVERALL OVERALL PERFORMANCE (63 countries)
Demographic Changes and PNG s Labour Market Developments: Challenges and Prospects
 Demographic Changes and PNG s Labour Market Developments: Challenges and Prospects Manoj K. Pandey ANU Crawford School Development Policy Centre & UPNG SBPP Division of Economics 1 Introduction Demographic
COUNTRY PROFILE. Estonia
 COUNTRY PROFILE Estonia WORLD COMPETITIVENESS RANKING 2017 All data are available from the World Competitiveness Online. Visit our eshop COMPETITIVENESS TRENDS - OVERALL OVERALL PERFORMANCE (63 countries)
The Rule of Law as a Factor for Competitiveness
 The Rule of Law as a Factor for Competitiveness Lessons from the Global Competitiveness Index 2008-2009 Irene Mia Director, Senior Economist Global Competitiveness Network, World Economic Forum OECD Workshop
SECTION - 13: DEVELOPMENT INDICATORS FOR CIRDAP AND SAARC COUNTRIES
 Development Indicators for Cirdap and Saarc Countries 379 SECTION - 13: DEVELOPMENT INDICATORS FOR CIRDAP AND SAARC COUNTRIES The Centre for Integrated Rural Development for Asia and the Pacific (CIRDAP)
Monitoring SDG Indicator 12.c.1 on Fossil Fuel Subsidies Options Paper
 Monitoring SDG Indicator 12.c.1 on Fossil Fuel Subsidies Options Paper Peter Wooders, IISD/GSI Ronald Steenblik, OECD Contents 1. Overview fossil fuel subsidies and the SDGs 2. Unpacking Indicator 12.c.1
BASIC FACTS. Economic Performance Government Efficiency Business Efficiency Infrastructure. Institutional Framework Business Legislation
 Domestic Economy International Trade International Investment Employment Prices Public Finance Tax Policy Institutional Framework Business Legislation Societal Framework Productivity & Efficiency Labor
Montenegro. Country coverage and the methodology of the Statistical Annex of the 2015 HDR
 Human Development Report 2015 Work for human development Briefing note for countries on the 2015 Human Development Report Montenegro Introduction The 2015 Human Development Report (HDR) Work for Human
Measuring the Competitiveness of the Trinidad and Tobago economy: A Competitive Advantage Approach
 Measuring the Competitiveness of the Trinidad and Tobago economy: A Competitive Advantage Approach Presenter: Joseph Jason Cotton 45 th Annual Monetary Studies Conference, Kingston Jamaica, October 2-4
Social Protection Strategy of Vietnam, : 2020: New concept and approach. Hanoi, 14 October, 2010
 Social Protection Strategy of Vietnam, 2011-2020: 2020: New concept and approach Hanoi, 14 October, 2010 Ministry of Labour,, Invalids and Social Affairs A. Labour Market Indicators 1. Total population,
Briefing note for countries on the 2015 Human Development Report. Lesotho
 Human Development Report 2015 Work for human development Briefing note for countries on the 2015 Human Development Report Lesotho Introduction The 2015 Human Development Report (HDR) Work for Human Development
SDMX CONTENT-ORIENTED GUIDELINES LIST OF SUBJECT-MATTER DOMAINS
 SDMX CONTENT-ORIENTED GUIDELINES LIST OF SUBJECT-MATTER DOMAINS 2009 SDMX 2009 http://www.sdmx.org/ Page 2 of 10 SDMX list of statistical subject-matter domains 1 : Overview Domain 1: Demographic and social
SAUDI ARABIA STATISTICAL SNAPSHOT
 SAUDI ARABIA STATISTICAL SNAPSHOT 206 ABOUT THE SNAPSHOT The Saudi Arabia Statistical Snapshot presents the main development and economic data and key indicators under the following topics: demography,
The DemDiv Model: A New Tool for FP Advocacy. Liz Leahy Madsen AFP Partners Meeting May 22, 2014
 The DemDiv Model: A New Tool for FP Advocacy Liz Leahy Madsen AFP Partners Meeting May 22, 2014 Presentation outline Why make a model to project the demographic dividend? Overview of DemDiv model Kenya
Financial Stability Report 2016
 Financial Stability Report 2016 Financial Stability in Times of Economic Uncertainty June 13 th, 2017 PRESENTATION FLOW 1 Assessing Resilience in the Domestic Financial System 2 3 Promoting Financial Stability
The Long Term View. Patricia Scott Commissioner, Productivity Commission
 The Long Term View Patricia Scott Commissioner, Productivity Commission Melbourne Institute Economic and Social Outlook Conference 2 nd November 2012 Productivity Commission What is the Productivity Commission?
Measuring Unemployment Economic Growth and Productivity. unemployed. News
 Economic Growth and Productivity News Unemployment Redux Nations Have Experienced a Substantial Rise in Living Standards Over the Last 150 Years. Labor Productivity Accounts for a Great Deal of the Observed
India s Experiences and Lessons Learned with LPG Subsidy Reform. Presented by Shruti Sharma January 2016
 India s Experiences and Lessons Learned with LPG Subsidy Reform Presented by Shruti Sharma January 2016 LPG Consumption by Sector Usage of LPG in 2014-15 ('000 tonnes) Manufacturing Sector Transport 1%
Strategy for the Development of Samoa
 Strategy for the Development of Samoa 2012 2016 Importance of having databases in formulating and monitoring Plans. Economic Policy and Planning Division Ministry of Finance Strategy for the Development
Serbia. Country coverage and the methodology of the Statistical Annex of the 2015 HDR
 Human Development Report 2015 Work for human development Briefing note for countries on the 2015 Human Development Report Serbia Introduction The 2015 Human Development Report (HDR) Work for Human Development
9. Country profile: Central African Republic
 9. Country profile: Central African Republic 1. Development profile Despite its ample supply of natural resources including gold, diamonds, timber, uranium and fertile soil economic development in the
COUNTRY PROFILE. Luxembourg
 COUNTRY PROFILE Luxembourg Statistical tables Factor I: Economic Performance WORLD COMPETITIVENESS RANKING 0 All data are available from the World Competitiveness Online. Visit our eshop COMPETITIVENESS
What has happened to inequality and poverty in post-apartheid South Africa. Dr Max Price Vice Chancellor University of Cape Town
 What has happened to inequality and poverty in post-apartheid South Africa Dr Max Price Vice Chancellor University of Cape Town OUTLINE Examine trends post-apartheid (since 1994) Income inequality Overall,
Draft COMMISSION DECISION
 Draft COMMISSION DECISION of on the 2008 Annual Action Programme of Accompanying Measures for Sugar Protocol Countries in favour of Trinidad and Tobago to be financed under Article 21.060300 of the general
MALAYSIA. Developing a high-income economy summary of the Tenth Malaysia Plan. GDP growth rates (percentage changes) GDP per capita
 GDP per capita") MALAYSIA Medium-term economic outlook (forecast) percentage change) 5.3 9.1-4.4 Medium-term plan 211-15 Theme Basic data (in 21) Charting development towards a high-income nation GDP growth rates (percentage
MALAYSIA Medium-term economic outlook (forecast) percentage change) 5.3 9.1-4.4 Medium-term plan 211-15 Theme Basic data (in 21) Charting development towards a high-income nation GDP growth rates (percentage
FEMALE PARTICIPATION IN THE LABOUR MARKET AND GOVERNMENT POLICY IN KENYA: IMPLICATIONS FOR
 FEMALE PARTICIPATION IN THE LABOUR MARKET AND GOVERNMENT POLICY IN KENYA: IMPLICATIONS FOR POVERTY REDUCTION Rosemary Atieno Institute for Development Studies University of Nairobi, P.O. Box 30197, Nairobi
HEALTHCARE AND MEDICAL EDUCATION
 HEALTHCARE AND MEDICAL EDUCATION Contents Advantage Jharkhand Healthcare in India Health Indicators Healthcare in Jharkhand PPP-Success stories in Jharkhand Opportunity Landscape in Jharkhand Policy Interventions
Public Sector Reform Process in Lesotho: Benefits and Challenges
 Public Sector Reform Process in Lesotho: Benefits and Challenges The Government of Lesotho realised the need for, and has undertaken to improve public financial management. In order to carry out this enormous
Afghanistan: Transition to Transformation Update. January 29, 2014 JCMB Meeting. The World Bank
 Afghanistan: Transition to Transformation Update January 29, 2014 JCMB Meeting The World Bank 1 Outline Outline Progress and Challenges Key Messages from Tokyo and Transition Report Recent Economic and
Mobilizing Domestic Resources and Increasing Public Expenditure Efficiency for Infrastructure Development
 Mobilizing Domestic Resources and Increasing Public Expenditure Efficiency for Infrastructure Development AR Desapriya Deputy Secretary to the Treasury Sri Lanka UN ESCAP Meeting on Policy Dialogue on
hy does Malawi Wneed good statistics?
 hy does Malawi Wneed good statistics? Fisherman on Shire River Liwonde. Enumerators taking field measurements during the 2007 National Census of Agric ulture and Livestock. Photos: NSO Staff Background
OMAN STATISTICAL SNAPSHOT
 OMAN STATISTICAL SNAPSHOT 2016 ABOUT THE SNAPSHOT The Oman Statistical Snapshot presents the main development and economic data and key indicators under the following topics: demography, education, macroeconomy
Israel. Israel: regional, urban and rural development policies
 Key facts and issues Israel Israel is a unitary country with a population of 8.4 million. Its subnational governments are responsible for 13.4 of public expenditures, ranking Israel the 8 th least decentralised
Third Working Meeting of the Technical Advisory Group (TAG) on Population and Social Statistics
 on Population and Social Statistics") Third Working Meeting of the Technical Advisory Group (TAG) on Population and Social Statistics Framework of Inclusive Growth Indicators (FIGI) Kaushal Joshi Senior Statistician, Research Division, Economics
Third Working Meeting of the Technical Advisory Group (TAG) on Population and Social Statistics Framework of Inclusive Growth Indicators (FIGI) Kaushal Joshi Senior Statistician, Research Division, Economics
4 Scottish labour market
 4 Scottish labour market Andrew Ross, Fraser of Allander Institute This section provides an overview of key labour market data in Scotland and contrasts these with both UK performance and changes over
Annex tables Nyt kapitel
 Nyt kapitel Table B.1 Demand, income and production 2016 2017 2018 2016 2017 2018 2016 2017 2018 DKK bn. Volume, per cent Prices, per cent Private consumption 979 1,011 1,048 1.9 2.0 2.0 0.5 1.3 1.6 Public
2010 HSC Economics Sample Answers
 2010 HSC Economics Sample Answers This document contains sample answers, or, in the case of some questions, answers could include. These are developed by the examination committee for two purposes. The
The Northern Ireland labour market is characterised by relatively. population of working age are not active in the labour market at
 INTRODUCTION The Northern Ireland labour market is characterised by relatively high levels of economic inactivity. Around 28 per cent of the population of working age are not active in the labour market
Private consumption 1,007 1,041 1, Residential investment
 Table B.1 Demand, income and production 2017 2018 2019 2017 2018 2019 2017 2018 2019 Volume, per cent Prices, per cent Private consumption 1,007 1,041 1,081 1.5 2.3 2.2 1.3 1.0 1.6 Public consumption 1)
Executive summary. Universal social protection to achieve the Sustainable Development Goals
 Executive summary Universal social protection to achieve the Sustainable Development Goals 2017 19 Universal social protection to achieve the Sustainable Development Goals Executive summary Social protection,
SAUDI ARABIA STATISTICAL SNAPSHOT
 SAUDI ARABIA STATISTICAL SNAPSHOT 2016 ABOUT THE SNAPSHOT The Saudi Arabia Statistical Snapshot presents the main development and economic data and key indicators under the following topics: demography,
Two Decades after El Salvador s Peace Accords The Economic Outlook
 Analyst: Heather Berkman berkman@eurasiagroup.net Two Decades after El Salvador s Peace Accords The Economic Outlook Prepared for Woodrow Wilson Center 30 January 2012 Table of Contents El Salvador: 1992
Singapore. Key Indicators for Asia and the Pacific Item
 Key Indicators for Asia and the Pacific 2012 1 POPULATION Total population a million; as of 1 July 3.52 4.03 4.27 4.59 4.84 4.99 5.08 5.18 Population density persons per square kilometer 5443 5900 6112
Evaluating the Mchinji Social Cash Transfer Pilot
 Evaluating the Mchinji Social Cash Transfer Pilot Dr. Candace Miller Center for International Health and Development Boston University & Maxton Tsoka Centre for Social Research University of Malawi Benefits
TRAINING COURSE ON SOCIAL PROTECTION & FORMALIZATION TRINIDAD AND TOBAGO MARCH 15, 2017 INTRODUCTION
 TRAINING COURSE ON SOCIAL PROTECTION & FORMALIZATION TRINIDAD AND TOBAGO MARCH 15, 2017 INTRODUCTION INTRODUCTION Design of the NIS Assistance from the ILO in the 1960 s Social Security Minimum Standards
EN 1 EN. Annex. Sector Policy Support Programme: Sector budget support (centralised management) DAC-code Sector Trade related adjustments
 DAC-code Sector Trade related adjustments") Annex 1. Identification Title/Number Trinidad and Tobago Annual Action Programme 2010 on Accompanying Measures on Sugar; CRIS reference: DCI- SUCRE/2009/21900 Total cost EU contribution : EUR 16 551 000
Annex 1. Identification Title/Number Trinidad and Tobago Annual Action Programme 2010 on Accompanying Measures on Sugar; CRIS reference: DCI- SUCRE/2009/21900 Total cost EU contribution : EUR 16 551 000
4 Scottish labour market
 4 Scottish labour market Andrew Ross, Fraser of Allander Institute This section provides an overview of key labour market data in Scotland and contrasts these with both UK performance and changes over
OECD Economic Outlook. Randall S. Jones Head, Japan/Korea Desk November 2014
 OECD Economic Outlook Randall S. Jones Head, Japan/Korea Desk November 2014 The global economy is stuck in low gear World GDP growth Per cent, seasonally-adjusted annualised rate 8 6 4 2 0-2 -4-6 -8 Average
12/21/2015. What does Development Mean? Contemporary Human Geography. Human Development Index. Development. Development implies progress
 What does Development Mean? Development implies progress Progress in what? Do all cultures view development the same way? Do all cultures value the same kinds of development? Contemporary Human Geography
Viet Nam. Key Indicators for Asia and the Pacific Item
 1 POPULATION Total population million; as of 1 July 77.11 78.12 79.08 80.00 80.95 81.91 82.85 84.22 85.12 86.03 86.93 87.84 88.81 89.76 90.73 91.71 92.7* Population density persons per square kilometer
Direct Benefit Transfer Readiness Index NCAER, November2016
 Direct Benefit Transfer Readiness Index NCAER, November2016 DBT Readiness: Strategic Focus Fixed cost of subsidies Rs. 3.78 trillion or 4.4% GDP (Economics Survey 2014-15) Elimination or phasing out of
Fossil-fuel subsidy reform in Mexico. Green Growth & Sustainable Development Forum
 Fossil-fuel subsidy reform in Mexico Green Growth & Sustainable Development Forum November 2014 1 14 Retail Prices in Mexico do not accurately follow international prices (USA). Mexico and USA regular
Australia s productivity performance
 Australia s productivity performance Seminar Presentation to Australian Treasury Canberra, 22 nd September 2010 Saul Eslake Grattan Institute Australia s productivity growth has slowed over the last five
Explanatory note on the 2014 Human Development Report composite indices. Argentina. HDI values and rank changes in the 2014 Human Development Report
 Human Development Report 2014 Sustaining Human Progress: Reducing Vulnerabilities and Building Resilience Explanatory note on the 2014 Human Development Report composite indices Argentina HDI values and
Translating Economic Growth into Development through Good Governance
 Translating Economic Growth into Development through Good Governance Rosa-Mae Whittier Education & Research Officer Oilfields Workers Trade Union Conference on the Economy 2014 October 9-10, 2014 Economic
Ease of Doing Business Ministry of Economy and Sustainable Development of Georgia 2018
 Ministry of Economy and Sustainable Development of Georgia 2018 GEORGIA S RANKING 2018 Georgia s Ranking In 2012 2018 In 2018 - th place amongst 10 countries Overall distance to frontier (DTF) 82.04 score
Investigation of data relating to blind and partially sighted people in the Quarterly Labour Force Survey: October 2009 September 2012
 Investigation of data relating to blind and partially sighted people in the Quarterly Labour Force Survey: October 2009 September 2012 Authors: Rachel Hewett, VICTAR, University of Birmingham March 2013
Number of smokers and overall smoking prevalence (for age 15+), 2013
, 2013") Number of Adult Smokers 15+ (Mil) Adult (15+) smoking prevalence (%) Country profile: Socio economic context Population, 2015 161.0 million Source: Population Division of the Department of Economic Adult
Number of Adult Smokers 15+ (Mil) Adult (15+) smoking prevalence (%) Country profile: Socio economic context Population, 2015 161.0 million Source: Population Division of the Department of Economic Adult
Social security and retirement reform a progress report
 Social security and retirement reform a progress report Andrew R Donaldson, National Treasury 2008 Pension Lawyers Association Conference 17 March 2008 Interdepartmental task team: work agenda Social assistance
State of Palestine Ministry of Finance. Fiscal Developments & Macroeconomic Performance: Fourth Quarter and Full year 2013 Report
 State of Palestine Ministry of Finance Fiscal Developments & Macroeconomic Performance: Fourth Quarter and Full year 2013 Report Macro Macro Fiscal Fiscal Unit Unit Oct February,, 2013 2014 Section 1:
COMPETITIVENESS REPORT BRAZIL METHODOLOGY. Versão 2.0
 METHODOLOGY BRAZIL COMPETITIVENESS REPORT Versão 2.0 Brasília - Março/2012 Version 1.0 Brasília-DF April/2017 METHODOLOGY BRAZIL COMPETITIVENESS REPORT Versão 2.0 Brasília - Março/2012 METODOLOGIA Version
MEASURING WHAT MATTERS TO PEOPLE. Martine Durand OECD Chief Statistician and Director of Statistics
 MEASURING WHAT MATTERS TO PEOPLE Martine Durand OECD Chief Statistician and Director of Statistics Statistics Flanders Trustworthy numbers for a strong democracy Brussels, 13 December 2017 The OECD Better
Ireland s National Wage Agreement s & Macroeconomic Performance:
 Ireland s National Wage Agreement s & Macroeconomic Performance: 1988 2008 Anthony J. Leddin University of Limerick Anthony.leddin@ul.ie & Paul G. Egan University of St. Andrew s PGE4@St-Andrews.ac.uk
Viet Nam. Key Indicators for Asia and the Pacific Item
 Key Indicators for Asia and the Pacific 2018 1 POPULATION Total population as of 1 July (million) 77.11 78.12 79.08 80.00 80.95 81.91 82.85 84.22 85.12 86.03 86.93 87.84 88.81 89.76 90.73 91.71 92.69 93.67*
FACT FACT Public services High spending on subsidies and wages Government spending MENA spends 32% MENA accounts for 1 th 43%
 Opportunity for All Promoting Growth Jobs and Inclusiveness in the Arab World Marrakesh January 9-30, 08 # Opportunity4MENA MENA CITIZENS want better public services and to narrow the gap between rich
TERMS OF REFERENCE UNICEF Office for the Easter Caribbean Area
 TERMS OF REFERENCE UNICEF Office for the Easter Caribbean Area Position Budget Analysis for Investments in Children and Fiscal Space Analysis for Social Protection Floor in Saint Lucia Duration Start Date:
Development of OECD Competitiveness Indicators Platform
 Development of OECD Competitiveness Indicators Platform Eun-Pyo HONG Head, Labour Statistics and Competitiveness Indicators Unit Statistics Directorate/OECD OECD competitiveness indicators platform (OCIP)
KUWAIT STATISTICAL SNAPSHOT
 KUWAIT STATISTICAL SNAPSHOT 2016 ABOUT THE SNAPSHOT The Kuwait Statistical Snapshot presents the main development and economic data and key indicators under the following topics: demography, education,
STEADY GROWTH OVER THE DECADES BRINGS TURKEY TO THE THRESHOLD OF HIGH INCOME, WHILE THE PROSPERITY WAS SHARED AND THE SIZE OF MIDDLE CLASS DOUBLED.
 MESSAGE 1 STEADY GROWTH OVER THE DECADES BRINGS TURKEY TO THE THRESHOLD OF HIGH INCOME, WHILE THE PROSPERITY WAS SHARED AND THE SIZE OF MIDDLE CLASS DOUBLED. The average annual GDP growth rate was 4.5
Monetary Policy In Trinidad and Tobago: How it stacks up to other Central Banks
 Monetary Policy In Trinidad and Tobago: How it stacks up to other Central Banks Alvin Hilaire, Governor, Central Bank of Trinidad and Tobago Launch of Monetary Policy Report November 23, 2017 www.central-bank.org.tt;