1 Executive Summary 2 FY19 Budget 3 State Appropriations 4 Tuition & Educational Fees
|
|
|
- Dwayne Allen
- 5 years ago
- Views:
Transcription

1 Budget Book
2
3 Table of Contents 1 Executive Summary FY19 Budget Consolidated University Budget (All Funds) Budget Columns (All Funds) Summary of Revenue Sources State Appropriations Tuition (Net of Financial Aid) Room & Board Grants and Contracts Facilities & Administrative Cost Recovery Endowment Distributions Gift Contributions Investment Income Internal and External Sales Revenue Allocations Funding Transfers Summary of Expenditures Salaries, Wages, and Benefits Supplies and Services Professional Services Occupancy and Maintenance Capital Costs Cost of Goods Sold Internal Loans & Debt Service Depreciation Other Operating Expense Expense Allocations Transfers Transfers to (from) Operating Reserve Transfers to (from) Plant Fund Transfer to (from) Quasi Endowments Repair & Replacement Transfers Internal Bank Transfers Other Transfers Transfer Net Results to Fund Balance Total Transfer To (From) Reserve 22 3 State Appropriations State Support of Instruction (SSI) State Funded Line Item Appropriations State Capital Appropriation Tuition & Educational Fees Enrollment Trends Undergraduate Headcount and FTE Graduate Programs Doctor of Osteopathy (HCOM) Graduate Enrollments by College (Headcount by Term)... 30
4 4.2 Tuition Rates OHIO Guarantee Financial Aid Signature Awards Program The OHIO Match: Ohio University s Undergraduate Scholarship Matching Program University Initiatives Regional Higher Education Undergraduate Enrollments and Scholarship Leveraging Online Learning Investment Gifts Gift Commitments Foundation, Endowment & Investment Returns Long-Term Investment Pool Endowment Activity Endowment Investment Composition Endowment Distributions Endowment Spending Rates Endowment Distributions by Fiscal Year (in millions) NACUBO-Commonfund Study of Endowments Treasury and Debt Management Current Debt and Pro-forma Debt & Debt Service Internal Bank Internal Bank Model Century Bond Bank Model Internal Loans Internal Bank Loans Century Bond Loans Compensation Salary and Wages Total Compensation Initiatives Personnel Benefits Expense FY17 Benefits Expenses Benefits Advisory Council Update: Affordable Care Act Educational Benefits Mandated Benefits Retirement Contributions Capital Improvement Plan & Deferred Maintenance CIP Process Overview Foundation of Planning CIP Progress and Updates Draft FY19 Priorities Strategic Opportunity Reserve Funding Sources Areas of Investment Financial Projection Academic Planning Units Academic Budget Process... 99
5 11.2 Academic Narratives College of Arts & Sciences College of Business Scripps College of Communication The Patton College of Education (PCOE) Russ College of Engineering and Technology College of Fine Arts College of Health Sciences and Professions (CHSP) Honors Tutorial College (HTC) Office of Global Affairs and International Studies (OGAIS) University College Voinovich School of Leadership and Public Affairs Heritage College of Osteopathic Medicine (HCOM) Regional Higher Education Auxiliary Planning Units Intercollegiate Athletics (ICA) Culinary Services Housing & Residence Life Parking & Transportation Printing Central & Administrative Operations Administrative Targets Administrative Investments Administrative Unit Summaries Advancement Airport Athena Child Development Center (CDC) Finance & Administration International Student & Faculty Services (ISFS) Kennedy Museum Library Marching President s Office Provost s Office Research Student Affairs Wellworks WOUB Budget Unit Summaries Operating Activity Athens Colleges & Schools Regional Campuses Auxiliaries Central & Admin Operations Reserves & Subvention Non-Operating, Financial Statement Adjustments, & Component Unit Summaries Non-Operating Activity Financial Statement Adjustments & Component Units Future Year Planning Assumptions
6 16.1 Strategic Opportunity Reserve Administrative & Academic Targets RHE Financial Outlook Impact of FY19 Planning Assumptions FY19-FY22 Projected Use of Reserves FY19-FY22 Athens Tuition Forecast State Appropriations Compensation Benefits Internal Debt Service Fact Sheets Appendix Transition from Responsibility Center Management (RCM) Methodology Tuition Rates Budget Process Timeline Acronyms Glossary of Terms
7 1 Executive Summary At our June meeting, we will be presenting for Board approval the FY19 Ohio University Operating Budget. The resolution facilitating approval of the FY19 University budget will be presented at the June Resources Committee meeting. Our FY19 Operating Budget includes: Operating Revenues of $749.1M, and GAAP adjusted Revenues of $811.0M (GAAP adjustments incorporate non-operating activity (Capital, Endowment, Internal Bank, Century Bond Bank), financial statement adjustments, and component unit activity) Operating Expenses of $742.4M, and GAAP adjusted Expenses of $770.0 Transfers to Capital Projects of $22.6M, and Overall Capital Budget of $101.7M Planned Use of Reserves of $17.0M (as represented as a transfer from the working capital of the Internal Bank), inclusive of: o $4.8M from accumulated fund balances to support capital or strategic uses of reserves o $7.1M from our Athens Colleges and Schools to bridge multi-year cost reduction plans o $5.1M from our Strategic Opportunity Reserve to address our structural imbalance of revenues and expenses Investing in a period of constrained resources In his October 2017 investiture address, President Nellis laid-out a plan for advancing Ohio University and pursuing the vision of being the nation s best transformative learning community. We will bolster our tremendous legacy of serving our region, our state, the nation, and the world in new and dynamic ways. Clearly, now more than ever, we must commit to articulating our value proposition as Ohio s first and finest university, said Dr. Nellis. President Nellis shared the strategic pathways to redefine and advance Ohio University, including: Become a National Leader for Diversity and Inclusion Enhance the Overall Academic Quality of the University Build a University Engagement Ecosystem Become a Place where Dialogue and Rigorous, Civil Debate are Institutional Hallmarks In addition to the strategic pathways and priorities, Ohio University has established longterm investment goals for employee compensation and addressing deferred maintenance on our campuses. As we make multi-year plans to invest in both compensation and our physical infrastructure, it is with the understanding that we must continue to grow our available resources to support our expense growth. Strategic Direction Competitive Compensation Innovative Research Enhanced Pedagogy Engaged creative activity Constrained Resources Declining State Support Tuition Constraints Shifting Enrollment Demographics Deferred Maintenance Healthcare escalation
8 As Ohio University continues to move forward with its mission, our budget planning and actions taken must be understood in the financial context of constrained resources. FY19 will be the 4 th year of a 0% tuition cap for state universities of Ohio, and the 2 nd year of 0% state-wide appropriation growth to universities. As detailed later in the executive summary, our undergraduate enrollments are facing growing pressures from state of Ohio demographic changes, in-state competitions for students and the respective growth of student financial aid budgets to attract students. Our regional campuses have experienced their 8 th straight year of declining enrollments and credit hour production. Each of these pressures on our resources forces difficult trade-offs in how we invest and how we reallocate funding. Institutional approach to planning unit budgets As we were developing and analyzing impacts associated with the above pressures and our initial FY19 budget planning assumptions in the fall of 2017, the imbalance between revenues and expenses in our operating budget became clearer. The following principals were established to govern our actions toward balancing: Every area of the University will focus on identifying ways in which they can contribute to being a part of the solution. Solutions will not be across the board, but tailored to the academic or support unit s ability to contribute to revenue generation, increased efficiency, and/or reduction of operating expenses; Administrative & Central Support Units will continue their goal of reducing funding 7% over the 3-year period FY18-FY20 (see Step 2 of Exhibit 1.1 below); Auxiliary operations will continue to increase their support for undergraduate financial aid to maximize the net tuition allocated to the Athens colleges; and Academic unit strategies will focus on: promoting and preserving student success; program and revenue preservation, innovation, and growth; expense management; and efficiency. As academic units developed planning scenarios in the fall, Faculty Senate passed a resolution requesting University leadership to establish proportionality when establishing operating impact targets (revenue growth/ expense reduction) for academic units (as compared to administrative and support units). This recommendation became the basis for establishing the targeted reductions to be achieved by the Athens colleges. Step 1: Proportionality in Establishing Savings Targets Planning Units FY17 Base Savings Target ($) Savings Target (%) Administrative & Central Support Units $ 162,805,723 $ 8,483, % Academic Units - Athens Colleges $ 244,083,185 $ 12,761, % Subtotal $ 406,888,908 $ 21,245, % Step 2: Developing Multi-Year Approach, With Strategic Use of Reserves for Bridge Funding Cumulative Planning Unit - Operating Budget Budget Category FY18 FY19 FY20 FY21 FY22 Savings Administrative & Central Support Units $ 4.8 $ 1.5 $ 2.2 $ - $ - $ 8.5 Academic Units - Athens Colleges $ - $ 0.3 $ 2.0 $ 0.1 $ - $ 2.5 Academic Units - Athens Colleges $ 1.5 $ 3.3 $ 2.0 $ 1.6 $ 1.3 $ 9.7 Academic Units - Athens Colleges $ - $ 0.6 $ - $ - $ - $ 0.6 $ 21.2 Reserves Source FY18 FY19 FY20 FY21 FY22 Cumulative Impact on Reserves (UNR Net Assets) Academic Units - Athens Colleges $ 1.5 $ 7.1 $ 3.0 $ 1.3 $ - $ 12.9 Institutional Reserves* $ 5.8 $ 5.1 $ 5.3 $ 3.9 $ 3.9 $ 24.0 *Institutional Reserves allocations represent bridge funding for RHE through FY20, $1.3M for the Athens enrollment volatility, and $2.6M for the Athens structural deficit. This does not represent all projected reserve use $ 36.9
9 Role of Shared Governance President Nellis established the Breakfast for Progress program in Fall 2017 to bring together over 100 leaders across the University to listen, discuss, and challenge one another on important topics facing the University. Two Breakfast for Progress programs, in November and January, were dedicated to educating and discussing with university leaders Ohio University's financial model, current industry and institutional challenges, and the important role of all university leaders in planning for a sustainable financial future. These discussions brought robust dialogue and provided a deeper understanding of our financial picture for leaders across campus, and the presentations from these programs were shared with the entire University community. The discussion continued with the University community, the Student Senate, and Graduate Senate in a series of open budget forums in later February and early March. The presentations provided an overview of the sources of institutional revenues and expenses, the underlying factors that are creating flat or declining resources to support institutional activities, and the resulting pressure on institutional budgets. Budget Planning Council (BPC) played a key role throughout the planning process in establishing our planning assumptions, evaluating our enrollment plan, providing feedback on campus-wide communications, and playing a leadership role in carrying the message back to their student, faculty and staff constituents. Key leaders on BPC and Senate leadership also dedicated additional time and meetings with University leadership to gather information and provide their input. Enrollment Population forecasts in the State of Ohio indicate that the number of high school graduates will continue a downward trend. In 2017, there were approximately 123,000 high school students graduating in Ohio, a 9.5% decline from Over this same period of time, the number of graduating Ohio high school students attending a university had declined from 37,688 to 34,583, an 8.2% decline. Population projections for the next 10 years indicate the number of graduating high school students will decline an additional 12%. The demographic declines in the State of Ohio have created intense pressure amongst colleges and universities to compete for a shrinking pool of students. At Ohio University, record new freshmen enrollments were achieved for the fall classes of However, in Fall 2017, our new freshmen class was 4,045, a decline of 264 students (6.1%) from the previous year. To achieve a higher level of enrollment and support overall growth in institutional net revenue, an additional scholarship leveraging strategy was proposed in Fall of This plan would both increase and redirect scholarship funds for our Fall 2018 freshmen class to target specific populations of students. This plan was thoroughly vetted by the Deans and adopted into the BPC planning assumptions. These planning assumptions included: $2M increase to financial aid (renewable commitment) Respective increase in yield of 99 new freshmen (from 4,045 to 4,144) With the May 1 student deadline for confirming enrollment behind us, our enrollments indicate we will not achieve the planned 4,144 new freshmen. Preliminary analysis indicates that we will be down approximately 100 in-state students relative to Fall 2017 and up 30 out-of-state students, for a net result of 3,971 students. Accordingly, our FY19 Budget Book will include two enrollment figures for FY19: our FY19 Planning Assumption (4,144 headcount), and our FY19 Budget (3,971 headcount). The net tuition impact, after consideration for increased out-of-state tuitions and an estimated $500K savings in our financial aid budget, is estimated as a $1.3M decline from our FY19 Planning Assumption. We have budgeted to draw from the Strategic Opportunity Reserve to fund this FY19 net tuition loss.
10 Athens - Undergraduate Incoming Cohort (Fall) FY15 Actual FY16 Actual FY17 Actual FY18 Actual FY19 Planning Assumption FY19 Budget Resident 3,788 3,756 3,774 3,530 3,629 3,425 Non-resident Total New Freshmen 4,377 4,423 4,309 4,045 4,144 3,971 Resident Non-resident Total Transfers Total Incoming Cohort 4,922 4,986 4,854 4,506 4,605 4,432 Managing expenses while investing in programs, faculty and staff, and facilities We recognize that investments in our programs, faculty/staff, and facilities are important components of sustainable financial health. In an environment with flat, or declining, revenues from undergraduate enrollments and state support for instruction, this becomes particularly challenging but also underscores why investments in new programs are so critical. All of our academic units have strategies for investments in and growth of programs. Strategies are unique to each unit and are based upon the opportunities and programs of the specific disciplines. Colleges and departments have developed plans that are reviewed and approved by the Provost s Office so that they can measure and track progress and outcomes. Additionally, there are centrally-driven investment strategies, like the online learning infrastructure investments (detailed in Section 4.4.2), that are funded with the Strategic Opportunity Reserve (detailed in Section 10) and intended to position the university to remain relevant and competitive. The Ohio University BOT and Leadership have consistently identified competitive compensation as a priority. After three consecutive years of supplemental investment in our faculty (FY15-FY17) as part of a Board approved Faculty Compensation initiative, and additional investment in our staff following our Comp 2014 (FY15-FY17) initiative, our faculty/staff did not receive salary increases in the current fiscal year (FY18) as a cost containment measure. Although we still have not balanced our operating budget without the use of reserves, we believe we risk the ability to attract and retain talent and lose market position if we do not offer salary increases in FY19. Consequently, we have incorporated a modest salary pool increase of 1.5% (market moved 2.9%) into our FY19 operating budget and moved our staff pay structure respectively. The Faculty Compensation Committee, under the direction of the Provost, has been studying progress made from the past Faculty Compensation Initiative and will make recommendations regarding future goals in FY19. Human Resources will also be initiating Comp 2019, which is the five-year review of our staff compensation structure as approved by the Department of Education following Comp Incremental debt service continues to put pressures on our operating budget as we execute against the BOT approved Capital Improvement Plan (CIP). With facility deferred maintenance and utility infrastructure in excess of $495M and $100M respectively at June 30, 2018, the university must continue to invest. The approximately $26M of State Capital support per biennium helps but is not adequate to support the required investments to keep our facilities operational, safe, and compliant with accreditation standards. With growing pressures on use of reserves to support our operating budget, and emerging facility issues competing against prioritized investments, we continue to reevaluate the timing and order of our investments and the respective impacts to our cashflows, debt capacity, and reserve balances.
11 The FY19 Budget summarized in this document includes the use of an estimated ($17.0) million in reserves. A significant portion of these reserves were identified as Capital/OTO/Strategic Contributions to (Use of) Reserves, totaling a net use of ($4.8M), inclusive of: $2.5M contribution by Athens Colleges & Schools (including a $4.6M contribution by the College of Medicine in preparation for its upcoming capital projects); $0.1M of Regional contribution of restricted funds; ($6.5M) use for Auxiliary capital projects; $1.5M contribution by Central & Admin units, primarily resulting from the Foundation's goal for expendable gift revenue that has not been budgeted for use by the planning units; and ($2.3M) use for Strategic Opportunity Reserve (SOR) Investments. A net ($7.1M) use of reserves is providing a bridge to the Athens Colleges and Schools as they execute on strategies to increase revenues or reduce expenses. An additional ($5.1M) is being funded from the SOR to address our structural imbalance, inclusive of: ($1.2M) at our Regional Campuses and ($3.9M) to absorb the projected reduction in Fall 2018 enrollments compared to planning assumptions used to build the budget, as well as the remaining structural imbalance on the Athens Campus after the Administrative, Auxiliary, and Academic reduction efforts. The Administrative reduction strategies and the Academic multi-year revenue/expense targets were established with the goal of an approximate $20M positive impact to our bottom line. Although these actions will make considerable progress toward moving us to a sustainable balanced budget, unless our revenues begin to grow faster than our expenses, we will have to take additional actions in future years. During FY19, Enrollment Management, Instructional Innovation, and the Athens Colleges and Schools will analyze future enrollment plans and projections for future Athens freshman cohorts, transfers, e-learning, and new programs. Targets will also be updated and forecasted for the mix of in-state, out-of-state domestic, and international enrollments. The Regional Study Committee created by President Nellis is expected to have a report and recommendations regarding a future strategy and business plan for our Regional Campuses in Fall 2018, which will also help inform our future multi-year forecasting. With the data from these efforts, we will analyze the respective impacts on our future year budgets, have discussions with the leadership across the university, and establish targets or strategies for future years. The Future Year Outlook section of this book summarizes our future position, prior to incorporating any of the targets or strategies discussed above. FY20 will also be the first year of the next State of Ohio Operating Budget biennial legislation. Our planning assumptions currently include a 2% increase for tuition caps and state appropriation growth. Legislative restrictions beyond these levels will further pressure our operating model and our use of reserves. University Budget Model Recognizing that the implementation of RCM at Ohio University has had a series of unintended consequences and has not generated the intended transparency across our community, President Nellis created the Budget Model Committee in Fall 2017 and charged its members with developing recommendations for a new University budget model. The recommendations from the Budget Model Committee have been submitted to President Nellis and will form the basis of the development and management of the institution s multi-year budget planning strategy. RCM did bring significantly more financial intelligence to our operating units, and the goal of the committee is to build on that foundation while creating a resource allocation model that is focused on each unit s unique disciplines, revenue and cost drivers, and structures; considers non-financial drivers of success and productivity metrics; and rewards and incentivizes activities that support our Strategic Pathways and Priorities. The Committee will work over the next fiscal year to operationalize the recommendations into our Budgeting Process with the goal of utilizing a new model with our FY20 Budget Process.
12
13 2 FY19 Budget 2.1 Consolidated University Budget (All Funds) REVENUES (in millions) FY15 Actuals FY16 Actuals FY17 Actuals FY18 Budget FY18 Forecast FY19 Budget 1 State Appropriations $ $ $ $ $ $ State Appropriations - Capital Gross Undergraduate Tuition & Fees Undergraduate Financial Aid (51.3) (57.8) (60.1) (62.5) (58.9) (63.0) 5 Net Undergraduate Tuition & Fees Gross Graduate Tuition & Fees Graduate Financial Aid (29.9) (28.5) (29.0) (28.2) (27.8) (28.7) 8 Net Graduate Tuition & Fees Room & Board Grants & Contracts Facilities & Admin Cost Recovery Endowment Distributions Gift Contributions Investment Income (3.4) (18.8) Internal & External Sales Total Revenues Administrative Cost Distribution Subvention Distribution Total Revenues & Revenue Allocations $ $ $ $ $ $ Funding Transfers $ - $ - $ - $ - $ - $ - EXPENSES 21 Total Salaries, Wages, & Other Payroll Total Benefits Supplies & Services Professional Services Occupancy & Maintenance Capital Costs (14.1) (3.1) (1.9) Cost Of Goods Sold External Debt Service - Principal External Debt Service - Interest Internal Principal & Interest Depreciation Other Operating Expense Total Direct Expenses Administrative Cost Allocations Capital Cost Allocation Subvention Allocation Total Expenses & Expense Allocations $ $ $ $ $ $ Results of Operations $ 48.6 $ 15.6 $ 69.4 $ 53.3 $ 78.3 $ 40.9 INVESTMENT TRANSFERS 39 Transfer To (From) Operating Reserve Transfer To (From) Plant Fund Transfer To (From) Quasi Endowments Repair & Replacement Transfers Internal Bank Transfers Other Transfers Total Investment Transfers $ - $ - $ - $ - $ - $ - 46 Net Results $ 48.6 $ 15.6 $ 69.4 $ 53.3 $ 78.3 $ Transfer Net Results to Fund Balance Adjusted Net Results $ 48.6 $ 15.6 $ 69.4 $ 53.3 $ 78.3 $ Total Transfer To (From) Reserve
14 2.2 Budget Columns (All Funds) (in millions) Athens Colleges and Schools Regional Campuses Auxiliaries Central & Admin Operations Reserves & Subvention Operating Activity Subtotal Non- Operating Activity Financial Statement Adj & Component Units REVENUES 1 State Appropriations $ $ 22.4 $ - $ 0.2 $ 2.9 $ $ - $ - $ State Appropriations - Capital Gross Undergraduate Tuition & Fees Undergraduate Financial Aid (48.6) (5.2) (13.9) 6.4 (1.7) (63.0) - - (63.0) 5 Net Undergraduate Tuition & Fees (13.9) Gross Graduate Tuition & Fees Graduate Financial Aid (28.1) - - (0.5) - (28.7) - - (28.7) 8 Net Graduate Tuition & Fees Room & Board Grants & Contracts Facilities & Admin Cost Recovery Endowment Distributions (29.8) Gift Contributions Investment Income Internal & External Sales Total Revenues Administrative Cost Distribution (24.6) Subvention Distribution (62.3) Total Revenues & Revenue Allocations $ $ 69.9 $ $ 42.7 $ (50.1) $ $ 54.8 $ 7.1 $ Funding Transfers $ (6.4) $ (0.5) $ 3.3 $ (14.8) $ 18.4 $ - $ - $ - $ - GAAP Adj Totals EXPENSES 21 Total Salaries, Wages, & Other Payroll Total Benefits Supplies & Services Professional Services Occupancy & Maintenance Capital Costs (107.2) - 27 Cost Of Goods Sold External Debt Service - Principal (16.1) - 29 External Debt Service - Interest (1.5) Internal Principal & Interest (54.1) Depreciation Other Operating Expense (2.1) Total Direct Expenses (68.3) Administrative Cost Allocations (191.7) Capital Cost Allocation (13.6) Subvention Allocation (62.0) Total Expenses & Expense Allocations $ $ 70.3 $ $ 51.0 $ (62.0) $ $ 95.9 $ (68.3) $ Results of Operations $ (3.8) $ 0.1 $ 10.2 $ 6.5 $ (6.4) $ 6.6 $ (41.1) $ 75.4 $ 40.9 INVESTMENT TRANSFERS 39 Transfer To (From) Operating Reserve (10.8) - (0.1) 5.7 (7.4) (12.7) Transfer To (From) Plant Fund (22.6) Transfer To (From) Quasi Endowments (1.0) Repair & Replacement Transfers Internal Bank Transfers Other Transfers Total Investment Transfers $ (10.0) $ - $ 16.6 $ 10.7 $ (6.4) $ 10.9 $ (10.9) $ - $ - 46 Net Results $ 6.2 $ 0.1 $ (6.4) $ (4.2) $ - $ (4.3) $ (30.2) $ 75.4 $ Transfer Net Results to Fund Balance (6.4) (4.2) - (4.3) Adjusted Net Results $ - $ - $ - $ - $ - $ - $ (34.5) $ 75.4 $ Total Transfer To (From) Reserve (4.6) 0.1 (6.5) 1.5 (7.4) (17.0)
15 Explanation of Columns The approved University Budget is an all-funds presentation that presents both the Operating Activities that comprise the traditional financial budget, but also the Non-Operating Activities that reflect the consolidated financial results of the institution. Athens Colleges & Schools Academic Colleges. Academic Planning Unit details are presented in Section 11. These include: College of Arts and Sciences, College of Business, Scripps College of Communication, Patton College of Education, Russ College of Engineering and Technology, College of Fine Arts, College of Health Sciences and Professions, Honors Tutorial College, Office of Global Affairs and International Studies, University College, Voinovich School, and Heritage College of Osteopathic Medicine. Regional Campuses Regional Higher Education includes the Executive Dean of Regional Higher Education and the following regional campuses: Chillicothe, Eastern, Lancaster (includes Pickerington Center), Southern (includes Proctorville Center), and Zanesville. Financial summaries are presented as part of the Academic Planning Unit summaries in Section 11. Auxiliaries Auxiliaries represent revenue-generating units that are assessed allocated costs utilizing RCM methodology. Auxiliary Planning Unit summaries are presented in Section 12. These include: Intercollegiate Athletics, Culinary Services, Housing and Residence Life, Transportation and Parking, and Printing Services. Central & Administrative Operations Central & Administrative Operations includes Academic Support and Administrative Planning Units. Planning Unit summaries are presented in Section 13. These include, but are not limited to: President, Provost, International Student & Faculty Services, Graduate College, Library, Instructional Innovation, Advancement, Student Affairs, Research, Information Technology, Finance and Administration, Central Operations, and Utilities. Reserves & Subvention Resources retained through Subvention assessment, Strategic Opportunity Reserve, Institutional Reserves, Provost Reserves, and corresponding planned investments. Subvention is assessed as a 12.5% fee on the operating revenue of Academic Units, and redistributed to provide support to other Academic Units that cannot be fully supported by their own revenues or as a funding source for strategic initiatives. Further information regarding Subvention can be found in Section The Strategic Opportunity Reserve is detailed in Section 10. Financial summaries are presented in Section 14.5.
16 Operating Activity Subtotal An all-funds presentation that represents the Operating Activity that comprises the traditional financial budget of the University. Operating activity is a subtotal of Athens Colleges and Schools, Regional Campuses, Auxiliaries, Central & Administrative Operations, and Reserves & Subvention. Non-Operating Activity Subtotal Non-Operating Activity includes Endowment (distributions; investment returns; corpus gifts); Capital; Century Bond; and Internal Bank. Non-Operating financial summaries are presented in Section 15. Endowment (distributions; investment returns, corpus gifts) Additional detail in Section 6 Century Bond Additional detail in Section 7 Internal Bank Additional detail in Section 7 Capital Additional detail in Section 9 Financial Statement Adjustments & Component Units For internal reporting purposes, certain items are included in the Operating Budget; however, when actual income statement results are reported, adjustments must be made to present the financial results in compliance with GAAP. Financial Statement Adjustments represent compensation liability adjustments; the elimination of capitalized costs and principal payments; the inclusion of depreciation expense; and the elimination of duplicated Component Unit revenues and expenses. Component Units represent separate but affiliated entities and subsidiaries of Ohio University and the Ohio University Foundation that are consolidated within our external financial statements. Component Unit entities include: TechGrowth Ohio, the Ohio University Inn, Sugar Bush Foundation, and Russ LLCs. Further details on Component Units can be found in Section Financial details related to Financial Statement Adjustments and Component Units are presented in Section 15. GAAP Adjusted Totals GAAP Adjusted Totals reflect Operating Totals, Non-Operating Totals, Financial Statement Adjustments, and Component Units. The University underwent a Chart of Accounts (CoA) redesign and conversion in December of FY18. As such, all figures represented throughout the FY19 Budget Book are reflective of the redesigned CoA. Please note this restatement may result in comparability issues when comparing specific rows of the financials in the FY19 Budget Book with those from prior years, as the conversion resulted in realignment of certain revenues, expenses, and transfers. Unless otherwise noted, the following summaries present the Revenues and Expenses of the Operating Activity Subtotal in Section 2.2
17 2.3 Summary of Revenue Sources $900.0 $800.0 $700.0 $600.0 $500.0 $400.0 Summary of Revenue Sources (in millions) $785.3 $726.5 $746.6 $747.2 $749.1 $ % 9.9% 8.6% 9.9% 8.5% 10.5% 5.7% 6.2% 5.9% 5.9% 6.5% 4.7% 7.1% 6.4% 6.9% 6.0% 6.1% 7.5% 12.4% 12.8% 12.1% 12.4% 12.3% 12.2% 8.8% 9.6% 10.1% 11.7% 11.5% 12.8% $ % 33.0% 31.2% 32.3% 31.9% 31.5% $200.0 $ % 21.9% 21.0% 22.3% 22.4% 22.4% $- FY15 Actuals FY16 Actuals FY17 Actuals FY18 Budget FY18 Forecast FY19 Budget Internal and External Sales $76.5 $74.0 $101.7 $63.9 $74.0 $63.5 Private Support $33.9 $42.2 $48.6 $44.0 $44.5 $48.8 Grants / F&A $54.2 $52.8 $50.3 $51.3 $45.2 $45.6 Room & Board $90.0 $95.9 $95.4 $92.9 $92.3 $91.4 Net Graduate Tuition $64.2 $71.6 $79.2 $87.1 $86.3 $96.3 Net Undergraduate Tuition $246.6 $246.6 $245.1 $241.1 $238.8 $235.8 State Appropriations $161.1 $163.6 $165.1 $166.8 $168.0 $ State Appropriations State appropriations represent funding provided by the Legislature in the biennial Budget and Capital Bills. The Budget Bill incorporates State Support of Instruction (SSI) as well as line item appropriations. The Capital Bill includes approved capital projects, as represented in the biennial capital budget submitted to the state and reflected in the State Capital section of our Capital Improvement Plan (Section 9). The University recognizes state capital revenue once capital expenses are incurred. Our budget is a projection of fiscal year expenses to be funded by the approved State Capital Budget. The table below represents operating and non-operating activity. (in millions) FY15 Actuals FY16 Actuals FY17 Actuals FY18 Budget FY18 Forecast FY19 Budget State Support for Instruction $ $ $ $ $ $ Line Item Appropriations Total State Appropriations % of University Operating Revenues 22.2% 21.9% 21.0% 22.3% 22.4% 22.4% State Appropriations - Capital* Section 3 provides additional detail about state appropriations.
18 2.3.2 Tuition (Net of Financial Aid) Tuition and fees are inclusive of instructional, non-resident and general fees, technology, course, and program fees. Section 4 provides details about tuition. (in millions) FY15 Actuals FY16 Actuals FY17 Actuals FY18 Budget FY18 Forecast FY19 Budget Gross Undergraduate Tuition & Fees $ $ $ $ $ $ Undergraduate Financial Aid (51.3) (57.8) (60.1) (62.5) (58.9) (63.0) Net Undergraduate Tuition & Fees $ $ $ $ $ $ % of University Revenues 33.9% 33.0% 31.2% 32.3% 31.9% 31.5% Gross Graduate Tuition & Fees Graduate Financial Aid (29.9) (28.5) (29.0) (28.2) (27.8) (28.7) Net Graduate Tuition & Fees $ 64.2 $ 71.6 $ 79.2 $ 87.1 $ 86.3 $ 96.3 % of University Revenues 8.8% 9.6% 10.1% 11.7% 11.5% 12.8% (in millions) FY15 Actuals FY16 Actuals FY17 Actuals FY18 Budget FY18 Forecast FY19 Budget Athens Campus $ $ $ $ $ $ Regional Campuses ecampus Other Student Fees Total - Net Undergraduate Tuition & Fees $ $ $ $ $ $ Room & Board Residential Housing and Culinary Services project room and board revenues based on the number of students living in the dormitories and participating in meal plans. These enrollments are a function of the freshman class size and the number of returning sophomores that are subject to the two-year residential requirement (which requires students to reside on campus for two full years and carry an associated meal plan). (in millions) FY15 Actuals FY16 Actuals FY17 Actuals FY18 Budget FY18 Forecast FY19 Budget Room & Board $ 90.0 $ 95.9 $ 95.4 $ 92.9 $ 92.3 $ 91.4
19 2.3.4 Grants and Contracts (in millions) FY15 Actuals FY16 Actuals FY17 Actuals FY18 Budget FY18 Forecast FY19 Budget Grants & Contracts - Federal Gov't $ 20.3 $ 17.2 $ 21.2 $ 21.8 $ 19.3 $ 18.4 Grants & Contracts - Local Gov't Grants & Contracts - State Gov't Total Government Grants $ 28.9 $ 27.7 $ 31.6 $ 31.2 $ 29.9 $ 28.8 Grants & Contracts - Private/Foundation Total Grants & Contracts $ 47.5 $ 46.1 $ 43.2 $ 45.4 $ 39.2 $ 39.5 At the end of FY17, roughly $5.0M of private grant revenues experienced an external reporting reclassification from restricted services and memberships to unrestricted. Due to the timing of the reclassification relative to FY18 Budget finalization, these reclassified revenues are still reflected in the FY18 Budget for private grants; however, they are excluded from FY17 Actuals, FY18 Forecast, and FY19 Budget. The FY18 impact to specific colleges are as follows: College of Health Sciences & Processions $1.4M Russ College of Engineering & Technology $1.0M Heritage College of Osteopathic Medicine $1.8M College of Arts & Sciences $0.7M These revenues are now recorded in the Internal & External Sales section of our Income Statement, as opposed to Grants & Contracts. Grants and Contracts include the reimbursement of direct expenses incurred on sponsored projects and exclude the following: Grants for financial aid which are netted against tuition revenues (Section 2.3.2). State capital grants and state line item appropriations are included in state appropriations (Section 2.3.1) Facilities & Administrative Cost Recovery (in millions) FY15 Actuals FY16 Actuals FY17 Actuals FY18 Budget FY18 Forecast FY19 Budget Facilities & Administrative Cost Recovery $ 6.7 $ 6.8 $ 7.1 $ 6.0 $ 6.0 $ 6.1 Facilities & Administrative (F&A) Cost Recovery represents the dollars recovered from sponsored projects for F&A (indirect) costs associated with grants and contracts Endowment Distributions The endowment distribution represents the internal distribution of endowment income based upon shares held in the endowment portfolio. The annual endowment distribution is equal to the product of a 6% spending rate and the endowment's average market value for the trailing 36 months (ending December 31, 2017). Both true and quasiendowments are subject to this spending policy. The 6% spending rate is comprised of a 4% spending allocation to the designated fund purpose and a 2% administrative fee. The spending allocation supports various initiatives, as specified in the gift agreement. This includes, but is not limited to, scholarships and fellowships, chairs and professorships, research activities, and general support of academic units. The administrative fee provides general support for the operations of the Foundation. The FY19 Budget for endowment distributions is $29.8M. Section 6 provides additional detail about endowment distributions.
20 2.3.7 Gift Contributions Gifts include all non-endowed (expendable) and endowed gifts to the University. Expendable gifts include both operating and capital gifts. Gifts are recorded as revenue by these operating units in the year that the cash is received. The FY19 budget for expendable gifts is $10.0M, as established by the goal-setting of The Ohio University Foundation Board ( Foundation Board ). Expendable Gift budgets submitted by the Planning Units, which represent known or expected giving, total $8.3M. The difference between The Ohio University Foundation ( Foundation ) goal and the Planning Unit projections, $1.7M, is currently represented as a Gift revenue budget within Central & Administrative Operations (Central Accounting), with a corresponding offset in the Transfers to (from) Operations row. Actual attainment of Gift revenues will flow to the College or Planning Unit based on the designation of the gift. Section 5 provides additional detail about gifts Investment Income Investment Income represents the interest, dividends, and investment returns earned on the working capital and investment pools of the University. The FY19 Budget for investment income supporting the operating budget is $9.1M. These funds support the operations of the Foundation and the Strategic Opportunity Reserve. The Non-Operating budget for Investment Income is $47.8M, supporting the Endowment $33.1M, the Century Bond $11.3M, and the Internal Bank $3.4M. Section 6 provides additional detail about investment income Internal and External Sales Internal Sales represent sales between operating units of the University. External sales includes royalties, sales and services, and other sales. This includes non-student revenue generated from academic activities, clinical revenues, retail sales from auxiliary operations (e.g. parking, transportation, athletic ticket sales, and sponsorship agreements) Revenue Allocations Revenue allocations include both Administrative Cost Distribution and Subvention Distribution. Administrative Cost Distribution represents the funding provided to Administrative Units to support their operating costs. This pool of funding is collected via the Administrative Cost Allocation charged to responsibility centers based on various allocation factors. Subvention Distribution represents the reallocation of subvention funds to provide support to other academic units that cannot be fully supported by their own revenues. Subvention distribution also serves as a funding source for strategic initiatives. 2.4 Funding Transfers Funding transfers include within unit and across unit funding transfers and represent funding exchanges among units.
21 2.5 Summary of Expenditures $900.0 $800.0 $700.0 $600.0 $500.0 $400.0 Summary of Direct Expenses (in millions) 0.8% $ % 1.3% 1.2% 1.0% 0.6% 2.7% 6.9% 7.3% 1.2% 2.9% 2.7% 1.1% 5.4% 6.8% 3.0% 2.8% 5.4% 4.1% 5.8% 4.4% 3.2% 1.2% 5.9% 5.1% 3.8% 1.0% 0.7% 1.4% 5.3% 5.1% 5.6% 5.9% 1.9% 5.7% 10.3% 5.8% 10.1% 12.8% 11.6% 11.8% 12.8% 20.0% 16.5% 16.7% 16.2% 16.4% 15.0% $662.3 $769.2 $741.6 $718.0 $742.4 $300.0 $ % 49.4% 47.0% 49.9% 50.3% 50.1% $100.0 $- FY15 Actuals FY16 Actuals FY17 Actuals FY18 Budget FY18 Forecast FY19 Budget Other Operating Expenses $7.3 $4.5 $6.1 $9.8 $8.4 $7.7 Internal Principal & Interest $27.4 $38.0 $58.2 $51.1 $49.0 $54.1 Cost of Goods Sold $21.2 $20.9 $21.0 $21.5 $19.8 $20.3 Capital Costs $12.9 $10.0 $9.1 $8.6 $7.1 $5.5 Occupancy & Maintenance $39.1 $41.7 $41.2 $43.3 $27.4 $32.6 Professional Services $38.2 $39.7 $39.2 $39.3 $36.4 $41.7 Supplies & Services $84.5 $82.5 $78.9 $75.2 $92.3 $86.3 Benefits $99.0 $117.3 $154.0 $122.7 $116.1 $121.9 Salaries, Wages, & Other Compensation $332.7 $346.2 $361.5 $370.0 $361.5 $372.3
22 2.5.1 Salaries, Wages, and Benefits (in millions) FY15 Actuals FY16 Actuals FY17 Actuals FY18 Budget FY18 Forecast FY19 Budget Faculty Salaries $ $ $ $ $ $ Administrative Salaries Total Salaries $ $ $ $ $ $ Classified NBU Wages Union Wages Student Wages Graduate Student Wages Total Wages $ 87.7 $ 94.2 $ 96.4 $ 93.8 $ 93.1 $ 92.3 Other Compensation Total Salaries, Wages, & Other Compensation $ $ $ $ $ $ Total Benefits $ 99.0 $ $ $ $ $ Total Compensation $ $ $ $ $ $ For FY19, compensation is budgeted at $494.2M, which includes Salaries, Wages and Benefits. Salaries and Wages are budgeted at $372.3M, which is approximately a 3% increase over the FY18 Budget. Due to limitations with the pre-2018 account structure, FY15 actuals through FY18 budget reflect Classified NBU and Union overtime and other compensation as part of the Classified NBU wages category. Other Compensation in FY18 includes the Early Retirement Incentive Program (ERIP) offered on Regional Campuses. Benefits are budgeted at $121.9M which is a 5% increase from the FY18 forecast. University salaries, wages, and benefits are explained in more detail in Section Supplies and Services For FY19, supplies and services are budgeted at $86.3M. Supplies and Services include office supplies, travel & entertainment, licensing, and general supplies & services Professional Services Professional Services include consulting services, subcontracts, legal expenses, online learning service fees, and other professional service fees Occupancy and Maintenance Occupancy and Maintenance includes equipment repairs, maintenance fees, and utilities. Presentation of Utilities in the Budget Book: Our Athens Campus utility costs are presented in the Budget Book in 3 units: Culinary Services, Housing & Residence Life, and Central Operations - Utilities. Utility costs are allocated to Culinary Services and Housing & Residence Life based on actual and estimated usage, while the Central Operations - Utilities costs are allocated to all other planning units using net assignable square feet as the allocation metric. Athens Campus Utilities Athens Campus - FY19 Utility Budget (in millions) FY17 Actual FY18 Forecast FY19 Budget Electric $6.7 $7.5 $7.9 Natural Gas Water Total $12.6 $12.7 $13.7 $2.6, 19% $3.2, 23% $7.9, 58% Electric Natural Gas Water
23 Athens Utility Rate and Usage Assumptions for FY19 Budget Commodity Rate Assumptions Usage Assumptions Electric Fixed, with Capacity Adj.; 0% increase Flat usage assuming typical weather Natural Gas Mostly Fixed beginning Jan 2018 Flat usage assuming typical weather Water Fixed; 5.8% increase Flat usage assuming historical usage pattern Capital Costs Capitalized costs are included in the operating budget for internal reporting purposes. When actual income statement results are reported, capitalized costs are eliminated via accounting adjustments and depreciation expenses are included. For budgeting purposes, capitalized costs represent the purchases of equipment for research or operations. For FY19, capitalized costs are budgeted at $5.5M. Capital facilities costs (CIP) are included in the Capital Budget section (Section 9) and are represented in the Non- Operating section (Section 15) of the Budget Cost of Goods Sold Cost of goods sold refers to the carrying value of goods sold during a particular period Internal Loans & Debt Service Internal loans are charged to departments to reserve funds to pay for external debt service. The Century Bond and the Internal Bank receive the Internal Loan payments, and then pay the external debt service principal and interest obligations. For Financial Statement purposes, principal payments are eliminated. (in millions) Operating Results FY15 Actuals FY16 Actuals FY17 Actuals FY18 Budget FY18 Forecast FY19 Budget Internal Loan - Principal & Interest $ 27.4 $ 38.0 $ 58.2 $ 51.1 $ 49.0 $ 54.1 Consolidated Results External Debt Service - Interest $ 18.6 $ 24.3 $ 26.8 $ 28.4 $ 28.5 $ 28.0 (in millions) Operating Results Century Bond Internal Bank Financial Statement Adjustments Consolidated Results Internal Loan - Principal & Interest $ 54.1 $ (12.8) $ (41.3) $ - $ - External Debt Service - Principal (16.1) $ - External Debt Service - Interest (1.5) $ 28.0 Section 7 provides additional detail about Internal Loans and Debt Service Depreciation Depreciation expense is not included in the operating budget, but is shown in the Non-Operating Activity. When capitalized costs are eliminated via financial statement adjustments, depreciation expenses are then included. FY19 depreciation expenses are budgeted at $52.1M, inclusive of Component Units Other Operating Expense Other operating expense includes income tax, bad debt expense, and other miscellaneous expenses.
24 Expense Allocations Expense allocations include administrative cost, capital cost, and subvention allocations. Administrative cost allocation represents charges to responsibility centers that serves as the primary funding source to support administrative unit operating budgets. Allocations are made based on factors such as headcount and square footage. Capital cost allocations are charges to colleges to recover the cost of central internal debt service. Subvention allocation is a 12.5% fee charged to academic units on operating revenues, which is utilized to balance operating results across academic units and provide resources for strategic initiatives. 2.6 Transfers Transfers to (from) Operating Reserve Transfers represent the planned utilization of fund balance to support one-time only investments Transfers to (from) Plant Fund Transfers to (from) Plant Fund represent the transfer of funds from operations to be used for approved projects and renovations Transfer to (from) Quasi Endowments Represents the transfer from operations for quasi endowments Repair & Replacement Transfers Repair & replacement transfers are departments designated funds from current year operations to be set aside to fund future replacements/deferred maintenance Internal Bank Transfers Represents the transfer of funding from the Internal Bank for operating (non-capital) loans, or the receipt of bond proceeds to capitalize the Internal Bank Other Transfers Other Transfers represent any other transfer of funding across funding sources Transfer Net Results to Fund Balance Represents the transfer of our Operating Unit net results to fund balance/reserves Total Transfer To (From) Reserve Represents the sum of the rows Transfer To (From) Operating Reserve and Transfer Net Results to Fund Balance, to present the total impact on our Operating Unit reserve balances.
25 3 State Appropriations 3.1 State Support of Instruction (SSI) SSI is an annual, fixed-dollar appropriation from the State of Ohio that subsidizes the cost of education for Ohio residents. Since FY15, the public university SSI funding formula has been comprised of five components (Ohio University does not receive funding for one of the five: Medical Dental & Vet component). Ohio University s FY19 SSI allocation, by funding component, is projected to be comprised of: 31.6% - Course Completions 50.2% - Degree Completions 11.7% - Medical School (HCOM) 6.5% - Doctoral Funding The University s state support is increasingly dependent on course completions, degree completions, and medical school funding. HCOM s increase in medical school funding is the result of its increasing enrollments from the Dublin and Cleveland campuses. Understanding OU s course and degree completion funding requires a more detailed analysis of the formula. FY19 University SSI Formula 2% 6% 12% 30% Course Completions Degree Completions Doctoral Funding Medical - Dental & Vet 50% Medical Schools Course and Degree Completion Components SSI allocations are based on a formula calculation driven by course completions weighted by subject field costs and degrees earned with weighting factors based on the subject field of courses and degrees, and student demographics including academic performance (ACT), financial need, and various risk factors. Since the SSI is a fixed dollar allocation, Ohio University s shares of course and degree completion funding is directly tied to annual changes in its own enrollments and completions as well as how they compare within Ohio s public university sector. Since the SSI formula for course and degree completion funding includes a factor for cost, the three principal drivers of state support include: (1) base enrollments; (2) completions; and (3) cost. The following analysis compares Ohio University s shares of course and degree completion funding to these three factors. Course Completion Funding Ohio University s shares of SSI funding have been increasing, when compared to its enrollments, based on the institution s increasing share of course completions across the sector. While OU s average SSI earnings per completed FTE have seen a slight decline, the earnings per FTE are driven by subject model costs determined by OU s programmatic offerings. Each institution s program mix impacts cost.
26 Degree Completion Funding Ohio University s shares of SSI degree funding have been increasing since FY17, when benchmarked to its share of student enrollments. The recent increase in OU s shares of degree completion funding are positively impacted by above average SSI earnings per degree and its increasing share of degree completions, when compared to the sector average. Ohio University s Share of Enrollments, Course Completions, & Degree Completions 13.0% 12.0% 11.0% 10.0% SSI Drivers 9.0% Year Average Share of Enrollments Shares of SSI Course Completions Shares of SSI Degree Completions While Ohio s funding formula is based on completions, each institution s student enrollments are a key driver in the allocation of state support. Specifically, OU s SSI funding is dependent on how student enrollments and completions change annually, as well as how those changes compare within the public university sector. As illustrated below, the SSI allocation for Ohio University has been increasing each year. The increase in our share of SSI in FY14 and FY15 was driven by the growth of the RN-to-BSN program in the College of Health Sciences and Professions. The SSI budget for FY17 was originally projected to increase substantially but changes to the at-risk formula implemented in FY17 resulted in that expected increase being reduced by $5.2M. The FY19 Budget assumes a modest increase in our state share of SSI, with growth in Medical FTE as the primary driver. (in millions) FY15 Actuals FY16 Actuals FY17 Actuals FY18 Budget FY18 Forecast FY19 Budget SSI College Allocations $149.2 $151.8 $159.7 $156.8 $156.8 $159.8 Strategic Opportunity Reserve 2% Holdback Additional Surplus/Deficit (5.2) Subtotal (2.3) Total State Share of Instruction $154.1 $155.8 $157.4 $159.6 $160.9 $162.6 % of State Appropriations 11.0% 10.6% 10.3% 10.5% 10.6% 10.6% SSI Drivers Enrollments 31,984 32,095 32,050 31,098 31,098 30,505 3-Year Average Share of Enrollments 11.3% 11.5% 11.5% 11.5% 11.5% 11.4% Shares of SSI Course Completions 10.7% 10.7% 10.9% 11.1% 11.1% 11.1% Shares of SSI Degree Completions 12.4% 11.6% 10.7% 10.7% 10.7% 10.7% Annually, the University budget allocates only 98% of SSI and Tuition revenues. The 2% holdback is used as a buffer against in-year variability, and funds the Strategic Opportunity Reserve only when it is earned. Section 10 provides additional detail about the Strategic Opportunity Reserve.
27 Consultations with the Ohio Department of Higher Education and University leadership during Fall 2016 resulted in the addition of first generation status of a student to the risk factors used to weight the allocations for undergraduate degrees. This factor was added to the existing factors of academic risk, financial risk, age and race as defined in the table below starting in FY18. Academic Age ACT < 17 in English or Math. If no ACT, completed a developmental course in any year at any public college or university in Ohio. Over 22 years of age when starting college. Financial Smallest EFC (Expected Family Contribution) below $2,190 in any year. Minority First Generation African American, Hispanic, American Indian. Mother and Father s highest level of educational Attainment is self reported as High School or Middle/Junior High School on the FAFSA. Combinations of the five at-risk categories create 32 distinct student cohorts including a student with no risk factors to a student with all five. Graduation rates are calculated for each case to produce a weight that recognizes the additional costs that would occur to help those students attain their degree. The degree funding for students in each case is inflated using these weights. The assumed net impact of this change to the SSI for Ohio University was slightly positive (about 0.2%) but our enrollments of first generation students are fairly high so additional benefits are possible in the future if we continue on our current trends.
28 3.2 State Funded Line Item Appropriations In addition to SSI, a series of specific line-item appropriations are provided to colleges and universities. For the University, the programs listed below are supported by line-item appropriations as budgeted by each planning unit s FY19 budget. Planning Unit Program FY18 Projection FY19 Projection Variance Voinovich Appalachian New Economy Partnership $1.23 $1.23 0% Co-ops & Internships % College of Medicine AHEC Program Support % Family Practice % Geriatric Medicine % Primary Care Residencies % OU Clinical Training % Library Library Depositories % Internal Bank Capital Component % Subtotal $7.10 $ % Capital Component was a program offered by the State of Ohio in the late 1990 s through early 2000 s that offered Universities a state appropriation for a 15-year period in exchange for giving up capital appropriation funding. Ohio University took advantage of this program in the early 2000 s, and has used the Capital Component appropriation to support capital investments funded directly by the University. FY18 was the last year Ohio University received the Capital Component subsidy, in alignment with the commitment of the State of Ohio program and the pay-back model established with our Internal Bank. 3.3 State Capital Appropriation In accordance with the State of Ohio process led by the Office of Budget and Management, the University submitted a biennial capital request in the fall of The capital bill was passed in Senate Bill 266 by the Ohio legislature in late March, 2018, and included $26.9M of capital appropriations to Ohio University (inclusive of $200,000 of pass-through allocations for local partners and $26.7M supporting Ohio University projects). The State Capital Budget identifies capital improvement projects which have been approved for funding. Within the University financial structure, however, state capital revenue is recognized once expenditures have been made. As a result, any individual university fiscal year budget may include funding from multiple years of state capital funding. The FY19 Budget for projects to be funded, in whole or in part, by State Capital Appropriations is $23.4M and can be found in the Capital column of our Non-Operating results (Section 15).
29 4 Tuition & Educational Fees University tuition revenues include all revenues from academic degree programs, exclusive of SSI, associated with traditional programs, ecampus programs, and graduate and medical programs. 4.1 Enrollment Trends Undergraduate Headcount and FTE Athens Undergraduate headcounts are projected to decline in FY19 by 2.3%, from 17,926 (Fall 2017) to 17,500 (Fall 2018). Students arriving in the Fall 2018 will be the 4th cohort of the OHIO Guarantee on the Athens Campus, and our mix of non-guarantee students will continue to drop as students graduate. Athens - Cohort Duplicated Headcount (Fall; excluding ecampus) FY16 Actual FY17 Actual FY18 Actual FY19 Planning Assumption FY19 Budget Continuing Students 12,987 9,009 5,344 2,764 2,764 OHIO Guarantee ,978 4,304 3,986 3,195 3,195 OHIO Guarantee ,896 4,118 3,512 3,512 OHIO Guarantee ,478 3,597 3,597 OHIO Guarantee ,605 4,432 Total 17,965 18,209 17,926 17,673 17,500 The drop in our Athens Undergraduate headcounts is primarily attributed to smaller freshmen classes in FY18 and projected for FY19. Our total enrollments will continue to decline in future years as our record-high classes of FY15- FY17 graduate and are replaced by smaller classes. In Section 4.4.2, we further describe the enrollment planning process for FY19 and the difference between our FY19 Planning Assumption and the FY19 Budget. Athens - Undergraduate Incoming Cohort (Fall) FY15 Actual FY16 Actual FY17 Actual FY18 Actual FY19 Planning Assumption FY19 Budget Resident 3,788 3,756 3,774 3,530 3,629 3,425 Non-resident Total New Freshmen 4,377 4,423 4,309 4,045 4,144 3,971 Resident Non-resident Total Transfers Total Incoming Cohort 4,922 4,986 4,854 4,506 4,605 4,432 While our total number of non-resident students is projected to decline in FY19 for the 3 rd straight year, our % share of non-resident students is increasing from 13.3% to 13.6%. This increase in % share is driven by a projected increase in our New Freshmen non-resident enrollments, from 515 in FY18 to 546 in FY19. Athens - Undergraduate Resident/Non-Resident Headcount (Fall; excluding ecampus) FY15 Actual FY16 Actual FY17 Actual FY18 Actual FY19 Planning Assumption FY19 Budget Resident 14,921 15,157 15,627 15,527 15,329 15,125 Non-resident 2,739 2,808 2,582 2,398 2,344 2,375 Total 17,660 17,965 18,209 17,925 17,673 17,500
30 On the Athens Campus, changes in FTE are highly correlated with changes in student headcount. Since the majority of Athens Campus student are full time, and thus pay the full tuition rate, changes in headcount (and not FTE) drive the tuition forecast. Undergraduate FTE FY15 Actual FY16 Actual FY17 Actual FY18 Actual FY19 Planning Assumption FY19 Budget 17,552 18,007 18,188 17,885 17,641 17,469 2,895 2,941 3,060 2,926 2,954 2,954 Chillicothe 1,476 1,392 1,369 1,281 1,243 1,243 Eastern Lancaster 1,571 1,503 1,390 1,293 1,254 1,254 Southern 1,296 1,237 1,208 1,245 1,208 1,208 Zanesville 1,243 1,224 1,107 1, Total Regional Campuses 6,173 5,962 5,650 5,389 5,227 5,227 Total Undergraduate 26,620 26,910 26,898 26,200 25,823 25, From FY15 to FY18, Regional Campuses have experienced a 12.7% decrease in FTE, and are projected to decrease by an additional 3.0% from FY18 to FY19. Regionals campuses enrollments have been impacted by a strong economy (choosing to work instead of attend college/university, or attending part-time), growth in post-secondary enrollment resulting from the College Credit Plus program, and declining populations in the regions they serve. Please see Section for a summary of the RHE Study Committee, who will develop recommendations to address the declining enrollment and recommend a sustainable academic and resource model for the Regional Campuses. From FY15 to FY18, total ecampus FTE s have been relatively flat. For FY19, colleges are projecting an increase of 1.0%, as new programs are being launched to offset enrollment declines in our largest program, the RN- 2-BSN. Our percentage of non-resident ecampus students has increased from 24.1% in FY15 to 32.1% projected in FY19, as we have focused our student recruitment efforts on growing our non-resident markets. ecampus - Resident/Non-Resident Duplicated FTE (Fall; Athens and Regionals Undergraduate) FY15 Actual FY16 Actual FY17 Actual FY18 Actual FY19 Budget Resident 2,224 2,167 2,197 1,986 2,005 Non-resident Total 2,931 2,979 3,060 2,926 2,954
31 4.1.2 Graduate Programs From FY15 to FY18, the enrollments for the University s traditional graduate programs have decreased by 5.6%. These programs typically use a model where students receive stipends to assist with teaching and research and receive a waiver of their tuition. These programs are resource intensive, which creates some inherent constraints on growth. The current forecast reflects those constraints by assuming flat enrollments for FY19. From FY15 to FY18, the University s professional masters programs have experienced substantial growth from 2,298 students in FY15 to 2,719 students in FY18, an increase of 18.3% The current forecast for FY19 plans an 8.5% growth over FY18 for enrollments in these programs. For a listing of academic programs by college, reference the tables in Section Graduate Programs Duplicate Headcount FY15 Actual FY16 Actual FY17 Actual FY18 Actual FY19 Budget Traditional Graduate Programs 2,738 2,641 2,628 2,586 2,586 Professional Masters (Outreach) 2,298 2,383 2,558 2,719 2,950 Total 5,036 5,024 5,186 5,305 5, Doctor of Osteopathy (HCOM) While FY18 was the 4 th cohort of HCOM students attending the Dublin Campus, FY19 will be the 4 th cohort of HCOM students attending the Cleveland Campus. As both campuses have come online and grown to their full class size, HCOM has grown from 539 students in FY14 to a projected 968 students in FY19. HCOM Headcount FY15 Actual FY16 Actual FY17 Actual FY18 Actual FY19 Budget Athens Campus Dublin Campus Cleveland Campus Total
32 4.1.4 Graduate Enrollments by College (Headcount by Term) Arts & Sciences Actuals Projections Plan Description Type Fall 2014 Fall 2015 Fall 2016 Fall 2017 Fall 2018 Fall 2019 Fall 2020 Fall 2021 Biological Sciences Traditional Chemistry Traditional Clinical Psychology Traditional Economics Traditional English Traditional Experimental Psychology Traditional Financial Economics Traditional French Traditional Geography Traditional Geological Sciences Traditional History Traditional Indust/Organiz Psychology Traditional Linguistics Traditional Mathematics Traditional Molecular/Cellular Biol Traditional Philosophy Traditional Physics Traditional Plant Biology Traditional Political Science Traditional Social Sciences Traditional 1 Sociology Traditional Spanish Traditional Financial Economics (online) Traditional 1 Linguistics - TEFL Traditional Biological Sciences Professional/RDP 1 Economics Professional/RDP 1 English Professional/RDP 1 1 Experimental Psychology Professional/RDP 1 Financial Economics Professional/RDP Linguistics Professional/RDP Philosophy Professional/RDP 1 Political Science Professional/RDP 2 1 Social Sciences Professional/RDP 2 3 Spanish Professional/RDP 1 1 English \(online\) Online Political Science Online 1 1 Social Sciences Online Financial Economics (online) Online WGSS Online Geospatical Information Science Online Chemistry Online Law, Justice and Culture Online Law, Justice and Culture Traditional Linguistics - TEFl Online Total
33 Business Actuals Projections Plan Description Type Fall 2014 Fall 2015 Fall 2016 Fall 2017 Fall 2018 Fall 2019 Fall 2020 Fall 2021 General Business Grad Traditional Global MBA Traditional 7 MBA/Sports Admin Traditional Sports Administration Traditional Sportsad/MBA Traditional General Business Grad Professional/RDP 2 MBA - Finance Concentration Professional/RDP 1 Professional MBA Program Professional/RDP Sports Administration Professional/RDP PMBA - Business Analytics Concentration Professional/RDP 6 PMBA - Executive Management Concentration Professional/RDP 22 PMBA - Finance Concentration Professional/RDP 1 PMBA - Health Care Concentration Professional/RDP 2 Athletic Administration Online MBA - Finance Concentration Online MBA - General Concentration Online MBA - Healthcare Concentration Online MBA - Online All Concentrations Online PMBA - Business Analytics Concentration Online 1 Macc-Accountancy Online Total ,045 1,183 1,167 1,167
34 Communication Actuals Projections Plan Description Type Fall 2014 Fall 2015 Fall 2016 Fall 2017 Fall 2018 Fall 2019 Fall 2020 Fall 2021 Communication Tech & Policy Traditional 1 1 COMS-Health Communication Traditional COMS-Relating and Organizing Traditional COMS-Rhetoric/Public Culture Traditional Info and Telecom Systems Traditional Journalism Traditional Mass Comm-Media Arts & Studies Traditional Mass Communication-Journalism Traditional Media Arts & Studies Traditional Organizational Communication Traditional Photography Traditional Communication Media Arts Traditional COMS-Health Communication Professional/RDP 1 COMS-Relating and Organizing Professional/RDP 1 1 COMS-Rhetoric/Public Culture Professional/RDP 1 Info and Telecom Systems Professional/RDP 1 Journalism Professional/RDP 2 Organizational Communication Professional/RDP Info and Telecom Systems Online Organizational Communication Online Total
35 Education Actuals Projections Plan Description Type Fall 2014 Fall 2015 Fall 2016 Fall 2017 Fall 2018 Fall 2019 Fall 2020 Fall 2021 Acclaim Mathematics Education Traditional 1 Adolescent/Young Adult Educ Traditional 2 2 Apparel,Textiles & Merchandisi Traditional AYA Earth/Space Science Traditional 2 AYA Integrated Language Arts Traditional AYA Integrated Mathematics Traditional AYA Integrated Science Traditional AYA Integrated Social Studies Traditional AYA Life Science Traditional AYA Physical Science Traditional 1 Clin. Mental Health & Clin. Rehab Couns. Traditional Clinical Mental Health Counsel Traditional Clinical Rehabilitation Counseling Traditional 1 CMH/Rehab/School Counseling Traditional 1 CMH/Rehabilitation Counseling Traditional 1 1 Coaching Education Traditional College Student Personnel Traditional Computer Educ/Technology Traditional Counselor Education Traditional Critical Studies in Educ. Foundations Traditional Cultural Studies Traditional 4 1 Cultural Studies Traditional Curriculum & Instruction Traditional Curriculum & Instruction (movg to e-campus) Traditional Early Child Intervent Special Traditional Education Administration Traditional Family & Consumer Sciences Education Traditional 1 Higher Education Traditional Instructional Tech Traditional Math Education Traditional Mid Child Lic Lang Arts & Math Traditional Mid Child Lic Lang Arts & Sci Traditional 1 4 Mid Child Lic Lang Arts & SS Traditional Mid Child Lic Math & Science Traditional Mid Child Lic Math & SS Traditional 4 Mid Child Lic Sci & SS Traditional 2 2 Middle Child Education Traditional 1 Mild-Moderate Education Needs Traditional Moderate-Intensive Educ Needs Traditional Prof Instructional Design Certi Traditional Reading Education Traditional Reading Endorsement (mv to ecampus) Traditional Reading/Language Arts Traditional 2 Recreation Studies Traditional Rehabilitation Counseling Traditional 8 6 Rehabilitation/CMH Counseling Traditional Research/Evaluation Traditional Research/Evaluation Traditional School Counseling Traditional School/CMH Counseling Traditional Science Education Traditional Social Studies Education Traditional Superintendent Endorsement Traditional 4 Superintendent Licensure Traditional 4 Undecided Education Traditional 4 1 Counselor Education Professional/RDP Early Child Generalist Endorse Professional/RDP 1 Education Administration Professional/RDP Education Public Policy Leadership Certificate Program Professional/RDP (NEW Spring, 2019) Higher Education Professional/RDP Instructional Tech Professional/RDP Special Ed/Non Certification Professional/RDP 1 Teacher Leader Endorsement Professional/RDP Coaching Education Online Coaching Education - Soccer Online Coaching Education - Tennis Online Curriculum & Instruction (movg to e-campus) Online Education Administration Online Pre-Kindergarten Special Needs Online Reading Endorsement Online Total
36 Engineering Actuals Projections Plan Description Type Fall 2014 Fall 2015 Fall 2016 Fall 2017 Fall 2018 Fall 2019 Fall 2020 Fall 2021 Biomedical Engineering Traditional Chemical Engineering Traditional Civil Engineering Traditional Computer Science Traditional Electrical Engineering Traditional Electrical Engineering & CS Traditional Electrical Engineering (online) Traditional 1 Industrial & Systems Engineer Traditional Mechanical & Systems Engineer Traditional Mechanical Engineering Traditional Industrial & Systems Engineer Professional/RDP 1 Civil Engineering (online) Online Computer Science Online 1 Electrical Engineering (online) Online Engineering Management Online Total
37 Fine Arts Actuals Projections Plan Description Type Fall 2014 Fall 2015 Fall 2016 Fall 2017 Fall 2018 Fall 2019 Fall 2020 Fall 2021 Acting Traditional Art History Traditional Ceramics Traditional Directing Traditional Film Traditional Graphic Design Traditional Interdisciplinary Arts Traditional Music Composition Traditional Music Education Traditional Music History & Literature Traditional 1 1 Music Performance Traditional Music Theory Traditional Music Therapy Traditional Music: Performance/Conducting Traditional Music: Performance/Pedagogy Traditional Painting and Drawing Traditional Peformance Certificate Traditional Photography Traditional Playwriting Traditional Printmaking Traditional Production Design Traditional Production Technology Traditional Sculpture Traditional Theater Traditional Performance: Emphasis in Performance/Ped Traditional Music: Performance/Conducting Dublin Film Professional/RDP 1 1 Graphic Design Professional/RDP 4 Music Therapy Professional/RDP Music: Performance/Conducting Professional/RDP 1 Printmaking Professional/RDP 1 Arts Admin Online/Hybrid Dance/Movement Therapy Traditional Art Therapy Traditional Music Education Online Dance Studies Traditional Music Therapy Online/Hybrid 6 13 Total
38 Health Sciences Actuals Projections Plan Description Type Fall 2014 Fall 2015 Fall 2016 Fall 2017 Fall 2018 Fall 2019 Fall 2020 Fall 2021 Athletic Training Traditional Audiology Traditional Child and Family Studies Traditional Educr & Fam Nrse Prac Online Traditional 1 Exercise Physiology Clinical Traditional Family Nurse Practition Online Traditional Family Nurse Practitioner Traditional Family Studies Traditional 1 Food and Nutrition Sciences Traditional Health Administration Traditional 1 Hearing Science Traditional Nurse Administrator Traditional 1 1 Nurse Educator Traditional Nurse Educator Online Traditional 1 1 Physical Therapy Traditional Physiology of Exercise Traditional Public Health Traditional Social Work Traditional Speech Language Pathology Traditional Speech-Language Science Traditional Doctor of Nursing Practice (post baccala Traditional Doctor of Nursing Practice (post masters Traditional Athletic Training Dublin Food and Nutrition Sciences Dublin Physician Assistant Practice Dublin Athletic Training Professional/RDP Audiology Professional/RDP Child and Family Studies Professional/RDP Educator & Family Nurse Prac Professional/RDP 1 Educr & Fam Nrse Prac Online Professional/RDP 1 2 Family Nurse Practition Online Professional/RDP Family Nurse Practitioner Professional/RDP Food and Nutrition Sciences Professional/RDP Health Administration Professional/RDP 1 1 Nurse Educator Online Professional/RDP Physiology of Exercise Professional/RDP 2 Public Health Professional/RDP Social Work Professional/RDP 34 1 Speech Language Pathology Professional/RDP Speech-Language Science Professional/RDP 1 Admin & Fam Nurse Prac Online Online 1 1 Educr & Fam Nrse Prac Online Online Family Nurse Practition Online Online Family Nurse Practitioner Online Health Administration Online Nurse Administrator Online Online Nurse Educator & Admin Online Online 5 Nurse Educator Online Online Social Work (Online) Online Total 1,280 1,177 1,221 1,252 1,241 1,452 1,611 1,639
39 International Studies Actuals Projections Plan Description Type Fall 2014 Fall 2015 Fall 2016 Fall 2017 Fall 2018 Fall 2019 Fall 2020 Fall 2021 African Studies Traditional Asian Studies Traditional Communication & Development Traditional Development Studies Traditional Latin American Studies Traditional Southeast Asia Studies Traditional 2 Global Exchange Partnership Traditional African Studies Professional/RDP Asian Studies Professional/RDP 2 1 Communication & Development Professional/RDP Development Studies Professional/RDP Latin American Studies Professional/RDP Global Exchange Partnership Professional/RDP 3 Development Studies Online Total
40 Voinovich Actuals Projections Plan Description Type Fall 2014 Fall 2015 Fall 2016 Fall 2017 Fall 2018 Fall 2019 Fall 2020 Fall 2021 Environmental Studies Traditional Executive MPA Program Traditional Public Administration Traditional Environmental Studies Dublin 1 Executive MPA Program Dublin Public Administration Dublin 1 1 Executive MPA Program Professional/RDP 29 Public Administration Professional/RDP Public Administration (online) Online Total
41 4.2 Tuition Rates The FY19 column represents the tuition and fees, as approved by the Board of Trustees in January The tuition rate tables for FY19, by cohort, are included in Appendix Continuing Students (Non-Guarantee) FY13 FY14 FY15 FY16 FY17 FY18 FY19* Per Semester Tuition 3.5% 1.6% 1.5% 0.0% 0.0% 0.0% 0.0% $5,268 Non-Resident Surcharge 0.0% 0.0% 0.0% 0.0% 0.0% 0.0% 0.0% $4,482 Room 3.5% 3.5% 3.5% 3.5% 0.0% 0.0% 0.0% Board 1.5% 0.5% 1.0% 1.0% 0.0% 0.0% 0.0% OHIO Guarantee - Class of 2019 FY13 FY14 FY15 FY16 FY17 FY18 FY19* Per Semester Tuition 5.1% 0.0% 0.0% 0.0% $5,774 Non-Resident Surcharge 0.0% 0.0% 0.0% 0.0% $4,482 Room 5.3% 0.0% 0.0% 0.0% $3,185 Board 1.5% 0.0% 0.0% 0.0% $2,247 OHIO Guarantee - Class of 2020 FY13 FY14 FY15 FY16 FY17 FY18 FY19* Per Semester Tuition 1.7% 0.0% 0.0% $5,872 Non-Resident Surcharge 5.6% 0.0% 0.0% $4,732 Room 3.5% 0.0% 0.0% $3,296 Board 2.0% 0.0% 0.0% $2,292 OHIO Guarantee - Class of 2021 FY13 FY14 FY15 FY16 FY17 FY18 FY19* Per Semester Tuition 1.3% 0.0% $5,948 Non-Resident Surcharge 0.0% 0.0% $4,732 Room 3.5% 0.0% $3,411 Board 2.0% 0.0% $2,338 OHIO Guarantee - Class of 2022 FY13 FY14 FY15 FY16 FY17 FY18 FY19* Per Semester Tuition 1.3% $6,096 Non-Resident Surcharge 0.0% $4,732 Room 3.5% $3,530 Board 2.0% $2,385 Non-Guarantee Cap: Current Planning Assumption & Final State Fee Cap 4-year rate Guarantee: No fee increases in years 2-4 Guarantee Tuition Cap: Non-Guarantee Cap + 5-year average CPI *Current Planning Assumptions

42 4.2.1 OHIO Guarantee Starting in the Fall of 2015, the OHIO Guarantee set a new standard among Ohio s public institutions of higher education by taking the guesswork out of budgeting for college. The OHIO Guarantee is a precedent setting cohort-based, level-rate tuition, housing, dining, and fee model that assures students and their families a set of comprehensive rates for the pursuit of an undergraduate degree at Ohio University. Tuition, housing, dining, and fee rates established at enrollment remain unchanged for 12 consecutive semesters. Benefits of the OHIO Guarantee: Transparency and predictability in expected costs, helping students and families with budget planning. The OHIO Guarantee provides an incentive for students to remain enrolled and graduate within four years. Renewable merit scholarships better hold their value. Under the OHIO Guarantee, the cost of attending will remain steady for a student s four years at the University. The same percentage of those costs will be met by any renewable scholarship, assuming the student meets the criteria for scholarship renewal. By contrast, under a traditional tuition model of increasing annual costs, a smaller percentage of a student s educational costs would be met each year. The University can plan more effectively, allowing for better allocation of resources to serve students. Challenges of the OHIO Guarantee: Shifts fiscal risk to the University as all traditional undergraduate students over the past four years are now part of the Guarantee, making it more difficult for the institution to react to inflationary changes and pressures. Makes it difficult to address emerging course costs that may have unique expenses. All in tuition and fees may create optic problems for prospective student comparing tuition rates with competitive schools where additional and variable fee structures are not obvious.
43 RHE Guarantee: At the March 2018 Board of Trustees meeting, Trustees approved a resolution to extend our OHIO Guarantee program to our Regional Campuses beginning with the cohort of new students entering Fall The RHE Guarantee will not only fix the tuition rate for 4-years, it will also eliminate the multiple fee structures that existed by campus and by student level. The RHE Guarantee will apply to students pursuing associates degrees and bachelor s degrees, with a handful of associate degree programs excluded from the RHE Guarantee per ODHE guidelines because the programs have not demonstrated bachelor completion success. The following program completion audit was provided to ODHE during the program approval process. Associate Program as a Primary or Secondary Major At Any Point Graduated within 4 or more years Entered thru and Earned Degree by Fall 2017 Program Name Student Count % Students Earning an Associates % of Associate Degree Students Achieving a Bachelor's Degree % of Students Earning a Bachelor's Degree, no Associate Measure of Persistence - % Enrolled After Associate's Degree % of Associate Degree Students who complete a Bachelors or Enrolled Child Development (AAS) % 34.5% 17.7% 8.3% 42.9% Associate of Art % 66.0% 3.6% 4.1% 70.1% Associate of Art % 66.0% 6.7% 4.3% 70.2% Associate of Science % 61.1% 6.1% 4.0% 65.1% Associate of Individualized Study % 50.0% 0.0% 0.0% 50.0% Accounting Technology (AAB) % 40.4% 1.9% 10.6% 51.1% Business Management Technology (AAB) % 45.2% 4.4% 11.5% 56.7% Computer Science Technology (AAB) % 31.5% 4.3% 14.5% 46.0% Electronic Media (AAS) % 43.0% 5.3% 10.0% 53.0% Engineering Technology (AAS) % 0.0% 0.0% 0.0% 0.0% Environmental Engineering Technology (AAS) % 27.8% 0.0% 16.7% 44.4% Equine Studies (AAS) % 13.8% 1.6% 37.9% 51.7% Health Technology (AAS) % 12.5% 5.5% 0.0% 12.5% Human Services Technology (AAS) % 45.2% 2.1% 6.5% 51.7% Law Enforcement Technology (AAS) % 42.2% 0.8% 7.3% 49.5% Medical Assisting Technology % 22.2% 5.9% 6.7% 28.9% Nursing (AAS) 1, % 51.2% 3.4% 7.5% 58.7% Office Administration Technology (AAB) % 24.1% 4.7% 0.0% 24.1% Total 5, % 56.2% 4.1% 7.7% 63.9%
44 4.3 Financial Aid (in millions) FY15 Actuals FY16 Actuals FY17 Actuals FY18 Budget FY18 Forecast FY19 Budget Athens Campus Undergraduates Gross Tuition Revenue $227.6 $235.8 $238.0 $238.1 $234.7 $235.8 Financial Aid Sources Operating Funds - Scholarships Operating Funds - Student Athletes Grants Funds Foundation Funds Subtotal - Financial Aid Net Tuition Revenue Discount Rate 20.2% 21.9% 23.0% 24.0% 22.9% 24.6% Grant and Foundation Revenues Supporting Financial Aid Grant Revenue Foundation Revenue Net Tuition Plus Grant / Foundation Revenues $188.2 $191.1 $190.0 $188.6 $188.4 $184.8
45 4.3.1 Signature Awards Program The University has established the OHIO Signature Award Program, a set of scholarships and grants designed to optimally balance both support for financial need and recognition of the achievements and contributions of the Fall 2018 freshman class. Built to honor and assist our students in accordance with the University's twin missions of excellence and access, the new and expanded program includes generous merit-based scholarships, supportive needbased grants, and a set of awards unique to the University that blend both merit- and need-based criteria. The program is modified annually to meet the enrollment goals of the institution. All first-year students who are new to the Athens campus of the University in Fall 2018 are eligible for consideration to become an OHIO Signature Scholar. The application for admission serves as the application for merit-based scholarships. Fall 2018 first-year students who were admitted by June 1, 2018 will be considered automatically for all available OHIO Signature Awards. Eligibility is based on the following: Academic merit as demonstrated by strength of curriculum and cumulative high school grade point average, in addition to either the ACT composite or SAT math and critical reading scores from any test date (writing sub score not included for ACT or SAT). Credentials on file as of January 15, 2018, will be used for final award determinations. Financial need, as determined by the Free Application for Federal Student Aid (FAFSA) results received in the Office of Student Financial Aid and Scholarships by the first priority date of January 15, Contributions made to the academic, demographic, or geographic diversity of the University community. In FY19, the OHIO Signature Awards and additional central scholarship awards will include more than $40M in scholarships and grant aid for undergraduate students. See for details about the Signature Awards program The OHIO Match: Ohio University s Undergraduate Scholarship Matching Program The University is committed to making a significant investment to support the University s core mission of providing access and opportunity for students seeking a college education. To this end, $25M is being dedicated to strengthening the University s endowed scholarship program through The OHIO Match including the Undergraduate Scholarship Matching Program and the Targeted Scholarship Matching Program. In order to maximize the impact of this opportunity, the University will provide $.50 for every dollar committed to eligible scholarship endowments starting July 1, To be eligible for the OHIO Match, scholarship gifts must meet the following criteria: Designated for undergraduate students on the Athens Campus Based on merit, need or talent, as defined by the University Endowed, renewable scholarships Designated for University-wide or college-wide use, or designated for one of the existing targeted high-merit and/or special population scholarship programs Scholarship Matching Program details were determined by the University and are administered by the Foundation. The program is subject to termination at any time, and funds are available for matching gifts on a first-come/first-served basis.
46 During FY18, over 3,000 donors committed $1.3M to OHIO Match endowed scholarships. Since the inception of the program, $9.3M in outright gifts and pledges have been committed to the OHIO Match program, and 152 unique scholarships have been established. These gifts and pledges correspond to a University match commitment of $4.7M. The University match commitment is funded by the Strategic Opportunity Reserve, described in detail in Section 10. Through March 31, 2018, a total of $8.0M has been collected against the $9.3M gifts and pledges. The University has provided matching funds totaling $4.0M, and the total market value for these endowments including the University match and accumulated investment income is $13.9M. 4.4 University Initiatives Regional Higher Education In response to the declining enrollment trend for Regional Campuses and the shifting of enrollments to the College Credit Plus program, multiple strategies have been employed to adjust the budgets for regional campuses including the exploration of new revenue sources, implementation of cross campus scheduling and staffing efficiencies, and offering an Early Retirement Incentive Program. While these strategies will help to address the current challenges within the Regional Higher Education budget, President Nellis has convened an RHE Study Committee to review and evaluate the regional campus higher education model by benchmarking peers and analyzing internal trend cycles, and to recommend a sustainable academic and resource model for the regional campuses in the context of the whole of Ohio University, and the OHIO for Ohio strategy. This will include how to engage new markets for student recruitment pipelines; how to improve the interconnectedness and collaboration across the regional campuses and centers and between and among regional campuses, centers, and Athens; develop opportunities for faculty to work seamlessly across the regional campuses and centers and between and among regional campuses, centers, and Athens; and how to increase opportunities for students to complete coursework and engage in experiential learning opportunities. This will also include a review of the current organization and administration of the regional campuses, their program delivery and expansion initiatives, their financial projections, and their student and community services in order to make recommendations for sustainable regional campus operations that will enhance their ability to deliver high quality academic programming in high demand areas while maintaining their exemplary student centered focus and community support. The committee began its work in the spring semester to consider each of the areas mentioned above and will present its findings to the Executive Vice President and Provost and President by November 1, Undergraduate Enrollments and Scholarship Leveraging Population forecasts in the State of Ohio indicate that the # of high school graduates will continue a downward trend. In 2017, there were approximately 123,000 high school students graduating in Ohio, a 9.5% decline from Over this same period of time, the number of graduating Ohio high school students attending a university had declined from 37,688 to 34,583, an 8.2% decline. Population projections for the next 10 years indicate the number of graduating high school students will decline an additional 12%. The demographic declines in the State of Ohio has created intense pressure amongst Colleges and Universities to fight for a shrinking pool of students. At Ohio University, record new freshmen were achieved for the fall classes of However, in Fall 2017, our new freshmen class was 4,045, a decline of 264 students from the previous year.
47 To achieve a higher level of enrollment and support overall growth in institutional net revenue, the Scholarship Leveraging Strategy was proposed in Fall of This plan would both increase and redirect scholarship funds for our Fall 2018 freshmen class to target specific populations of students. This plan was thoroughly vetted by the Deans and adopted into the BPC planning assumptions. These planning assumptions included: $2M increase to financial aid (renewable commitment) 99 headcount increase in new freshmen (from 4,045 in Fall 2017 to 4,144 in Fall 2018) As the May 1 student deadline for confirming enrollment has now passed, our results indicate we will not achieve the planned 4,144 new freshmen. Our analysis shows that we will be down approximately 200 in-state students relative to Fall 2017 and up 30 out-of-state students, for a net result of 3,971 students. Accordingly, our FY19 Budget Book will include two enrollment figures for FY19: our FY19 Planning Assumption (4,144 headcount), and our FY19 Budget (3,971 headcount). Our budgeted net tuition will be down $1.3M from the planning assumption, and we will draw from the Strategic Opportunity Reserve for FY19 to manage this drop in revenue Online Learning Investment Ohio University remains at a critical point in the evolution of our online learning operations. The online learning initiative began with the establishment of the Online Learning Task force which includes University Leadership in the Provost s Office, Colleges, Budget Office, CIO and SVP for Strategic Enrollment Management. The goal of the task force is to help develop strategy and prioritize online learning initiatives across the University. Every dean and department head across the system is looking to generate more revenue through new or expanded online or blended programs at both the degree completion and graduate/professional level. We now have more than 20 new programs in the queue actively moving toward launch and another 20 program ideas in early stage conversations. The strategic investment to fill service gaps and expand critical central operations that was outlined last year is now in flight, and in order to remain competitive and meet the demand for growth carrying out this investment strategy remains essential. Scope and Focus of Investment The investment in online learning, as developed and recommended by the Online Learning Task Force, was initially $3.6M over the next two fiscal years. However, restructuring and other cost saving measures in the Office of Instructional Innovation has enabled us to reduce the needed investment by nearly $800,000. There is an additional strategic reserve of one time funds that is available to help academic units initiate new program development and launch in the absence of resources. Investments have been and are being made in the following areas: Infrastructure and expertise in Online Learning, faculty development and instructional design services The process for moving a program from idea to delivery is complex and involves engaging a variety of departments (e.g., alerting enrollment management, registrar, OIT, Instructional Innovation). Quality is increasingly critical to the viability of online programs in an increasingly competitive market: students expect personal interaction and proactive engagement is key to retention in online programs; amateur faculty production of learning environments in an outdated pedagogical model will not meet expectations; and an increasingly diverse and nontraditional student and environment require faculty to develop new skill and understanding to design effective courses and engage positively with students. A highly responsive and high quality student support operation and project management of the entire process, as well as instructional designers, faculty development specialists, and production service, will enable us to compete on these dimensions of quality. OIT to create new services and expand academic technology operations and support Just as we have facilities operations to build and maintain physical classrooms, we need experts to build and maintain virtual learning environments. Instructors are hard pressed to maintain the skills they need to engage with students in these environments, so a training and performance support service is also needed.
48 Expanded enrollment and marketing capacity and expertise Enrollment and marketing operations, as currently staffed, lack the capacity and some competencies to absorb the responsibility to recruit students to online programs. Under the online learning alignment proposal, this office will need to develop capacity and expertise to recruit students into online programs. This involves investment across the enrollment funnel, including partnership development, marketing and communication, recruitment and advising, articulation management, and attendant administrative support of the operations. Additional capacity has been created by securing four vendor partners through an RFP process who are assisting with various aspects of digital marketing and recruitment of online learners. Student support services Few student support services on campus have been designed for online students. An effort is underway to initiate a digital first philosophy in the delivery of these services, and to better understand appropriate differentiation and sustainability of student access to services depending on whether the student is on campus or online. Existing Online Degree Completion Programs Program Fall 2017 Enrollment New Online Programs Launching in FY19 % Overall Enrollment RN-2-BSN 5, % Customer Service % Applied Management % Integrated Healthcare Studies % Technical and Applied Studies % Technical Operations Management % Criminal Justice % College Program Launch Semester College of Arts & Sciences TESOL K - 12 Endorsement Summer 2018 Master in Chemistry Fall 2018 Master in Law, Justice, and Culture Fall 2018 Data Analysis Graduate Certificate Fall 2018 Gender, Sexualities, and Health Graduate Certificate Fall 2018 Geospatial Information Science: GIS and Cartography Graduate Certificate Fall 2018 College of Business Online Master of Accountancy Summer 2018 Professional Master of Accountancy Summer 2018 Master of Business Analytics Spring 2019 College of Fine Arts Master of Music Education Summer 2018 College of Health Sciences & Professions Master of Global Health Fall 2018 Healthcare Leadership Graduate Certificate Fall 2018 Master of Social Work (Advanced Standing) Spring 2019 Veteran's Health Graduate Certificate Spring 2019 Patton College of Education Blended Master in Early Childhood Education and Special Education Summer II 2018 Master of Education in Special Education (MM, MI, and ECIS) Summer II 2018 Bachelor's Completion in Human Services Fall 2018 Education Public Policy Leadership Graduate Certificate Spring 2019 Regional Higher Education - Southern Associate's in Equine Business Management Fall 2018
49 5 Gifts 5.1 Gift Commitments Each year, the University Foundation receives charitable contributions that are designated to support various colleges, campuses, academic programs, the supporting non-profit, student activities, scholarships, capital projects and other OHIO initiatives. While some gifts are endowed (permanently restricted), others are available for immediate use (expendable). Gift Type FY15 FY16 FY17 FY18* FY19* Expendable Unrestricted - current use $ 0.3 $ 0.3 $ 0.2 $ 1.2 $ 0.2 Restricted - current use Subtotal - Expendable Nonexpendable Restricted - endowed Subtotal - Nonexpendable Total $ 31.2 $ 30.8 $ 16.0 $ 20.0 $ 20.0 Based on an analysis of historic giving patterns, and considering current Advancement staffing levels, we are projecting to receive $20.0M in total gifts during FY19 (inclusive of Expendable and Nonexpendable gifts). Expendable gifts Expendable gifts are contributions for which the University can spend the corpus, or gift amount, to fund operations in accordance with the donor designation. These include unrestricted contributions ($0.2M), which may be used for any purpose that supports the University, as well as restricted contributions ($9.8M), which have been designated by the donor to support a specific purpose. Restricted expendable gifts may be designated for scholarships, faculty support, the construction or renovation of a particular facility, or the support of a particular college or program. Nonexpendable gifts Non-Expendable gifts are contributions for which the University may spend the corpus which must be endowed in perpetuity and invested in the long-term investment portfolio; but for which we may spend the distributions against the principal in accordance with the BOT approved spending policy (see Section 6). These contributions are included in the FY19 budget at $10.0M and shown as growth in our Endowment column (part of non-operating budget). The associated annual endowment distribution will be spent in accordance with the donor specifications, which may include unrestricted purposes, or specific support for activities such as faculty chairs and professorships, scholarships and fellowships, or support of specific colleges or programs.

50 Pledges and Bequests Receivable Unconditional promises to give are recorded as gift revenue and pledges receivable in the year that the commitment is made. Bequests are recorded as gift revenue and bequests receivable in the year that the Foundation learns that the donor has passed away and the gift is collectible. The following chart depicts the pledges and bequests receivable balance for FY15 to FY19. The decrease from FY16 to FY17 reflected an overall decline in new gift revenue and indicated that, following the end of the Promise Lives Campaign, the collection of existing pledge payments was significantly outpacing their replacement with new pledge commitments. *unaudited forecast
51 6 Foundation, Endowment & Investment Returns 6.1 Long-Term Investment Pool Pursuant to resolution , the University s Board of Trustees entrusted oversight of the long-term investment portfolio to the Investment Committee (IC) of the Foundation. The long-term investment portfolio is comprised of the University s and the Foundation s endowments and quasi-endowments, as well as a portion of the University s and the Foundation s working capital. The Foundation has engaged Hirtle, Callaghan & Co. (HC) to manage the long-term investment portfolio. HC reports to the IC. Beginning investment pool market value Cash transferred to (from) investment pool Interest and dividends net of management fee Realized gains (losses) Unrealized gains (losses) Ending investment pool market value * Unaudited FY15 FY16 FY17 $ $ $ (9.7) (4.1) (3.8) (75.6) (40.6) 67.8 $ $ $ $ $ FY18* Endowments Quasi-endowments Working capital Cash due (to) from pool Total investment pool $ $ Foundation % % % % % $ $ University (0.8) % 30.9% 53.8% -0.4% 100.0% $ $ Total % % % % % *Unaudited Endowment Activity Endowment includes those contributions which were endowed in perpetuity by the donor and which the University may spend only through annual distributions. Quasi-endowments are funds that the Foundation or the University have set aside to function like endowed funds. Beginning endowment market value New gifts to endowments Transfers to (from) quasi endowments Investment income net of fees Spending allocation Administrative fee Other additions (withdrawals) Ending endowment market value FY15 FY16 FY17 $ $ $ (5.9) (15.3) (15.7) (17.6) 59.8 (18.1) (7.3) (8.5) (8.7) (0.7) $ $ $ FY18* $ (18.8) (9.2) - $ FY19* $ (19.5) (9.5) - $ Projected utilizing March 2018 year to date return
52 6.1.2 Endowment Investment Composition Pooled endowments Pooled quasi-endowments Non-pooled endowments Non-pooled quasi-endowments Total endowments Foundation University Total $ % $ % $ % % % % % - 0.0% % % - 0.0% % $ % $ % $ % * Unaudited utilizing March 2018 year to date return 6.2 Endowment Distributions Endowment earnings are authorized for expenditure in accordance with the spending policy adopted by the Foundation. The spending policy and spending rate are reviewed annually and adjusted, as necessary, with the primary objective of balancing the need for current spending with the goal of supporting future expenditures into perpetuity. Currently, the annual endowment distribution is equal to the product of a 6% spending rate and the endowment's average market value for the trailing 36 months. Both true and quasi-endowments are subject to this spending policy. The 6% spending rate is comprised of a 4% spending allocation and a 2% administrative fee. The spending allocation supports various initiatives, as specified in the gift agreement. This includes, but is not limited to, scholarships and fellowships, chairs and professorships, research activities, and general support of academic units. The administrative fee provides general support for the institution's fundraising, alumni relations, and fund administration functions Endowment Spending Rates FY10 through FY12 FY13 through FY19 Spending Administrative Policy Allocation Fee Spending Rate 4.0% 4.0% 1.0% 2.0% 5.0% 6.0% These spending allocation and administrative fee rates apply to accounts whose market value exceeds the historic gift value. Occasionally, due to a downturn in the investment market, an account s market value may temporarily fall below its historic value. When this occurs, the endowed account is underwater. The spending rate for underwater endowments is 1%. Underwater endowments are not assessed an administrative fee.


53 6.2.2 Endowment Distributions by Fiscal Year (in millions) The following chart depicts endowment distributions over the past decade. Since FY09, the steady increase in endowment distributions has been driven by strong investment returns, the creation of new endowments, and the increase in the administrative fee from 1% to 2%. $30 $25 $20 $15 $10 $5 *unaudited $- FY10 FY11 FY12 FY13 FY14 FY15 FY16 FY17 FY18* FY19* Administrative Fee Spending Allocation Total % of Operating Revenues 1.4% 1.0% 1.9% 2.3% 2.8% 3.1% 3.5% 3.4% 3.7% 3.9%
54 FY19 Endowment Spending Allocation by Purpose and Planning Unit Planning Unit Academic/ Instruction Research Student Aid General Institution Total Arts and Sciences $ 647,932 $ 139,330 $ 575,863 $ 907 $ 1,364,032 Athletics ,818 81, ,143 Business 692,383 7, ,470 1, ,656 Campus Recreation - - 9, ,012 Central Accounting 385,230 10,445 26,853 21, ,074 Chillicothe 27,415-88,441 5, ,970 Communication 957, ,101-1,300,787 Diversity and Inclusion 1, , ,806 Eastern ,635 3,346 77,980 Education 134, ,292 3, ,503 Engineering 5,993, , ,138 1,501 6,525,699 Enrollment Management - - 1,343, ,842 1,468,443 Exec Dean Regional Campuses 5, ,000 Fine Arts 37,033 77, ,434 1, ,021 Graduate College - - 1,715-1,715 Grounds ,500 2,500 HCOM Athens 30, , ,685 1,093 1,007,775 HCOM Dublin - - 3,558-3,558 Health Sciences 39, ,431 6, ,944 Honors 1,253-1,105,738-1,106,991 Human Resources ,107 1,107 Information Technology Instructional Innovation - - 1,746-1,746 ISFS 4,702-5,233-9,935 Kennedy Museum 8, ,018 65,980 Lancaster ,675 7, ,703 Library 336,178-48, ,333 Marching 110 1,637-2,034-3,671 OGAIS 212,418-16, ,268 President 21, ,575 Provost 625, , ,479 Southern ,204 5,925 77,129 University College 2,348-18,630 4,027 25,006 Voinovich 61,023-3,902-64,925 VP of Advancement ,200 72, ,428 VP of Research - 1,588,807 57,230 3,301 1,649,338 VP of Student Affairs 14,678-24,688 68, ,430 WOUB 958-1,420 96,238 98,616 Zanesville ,106 3,397 40,204 Total $ 10,245,384 $ 2,537,815 $ 6,051,715 $ 628,560 $ 19,463, NACUBO-Commonfund Study of Endowments Annually, OHIO participates in the NACUBO-Commonfund Study of Endowments (NCSE), a survey that analyzes the endowment management practices and portfolio performance of more than eight hundred higher education institutions and their related foundations. The following charts provide information about the relative performance of OHIO s endowment assets. Final results for the year ending June 30, 2017 were made available in late January OHIO outperformed the NCSE average for the year ending June 30, For the three-, five-, and ten-year periods ending June 30, 2017, OHIO s portfolio lagged the NCSE average.


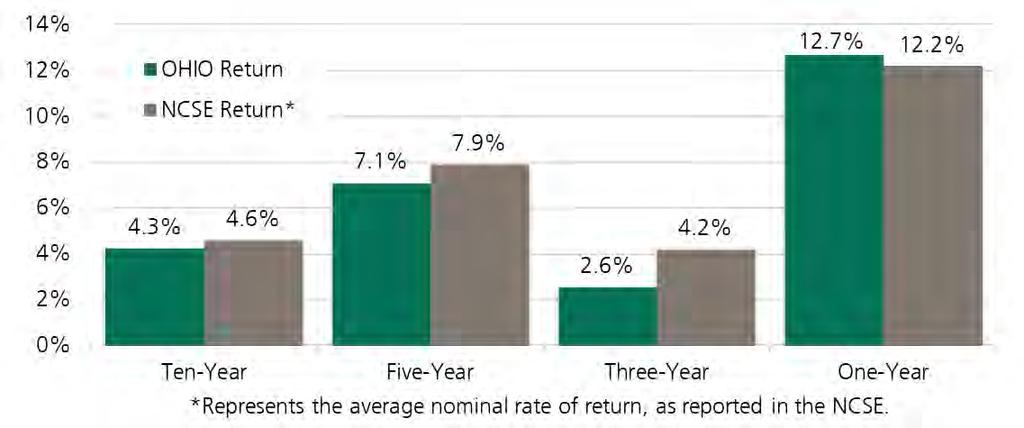
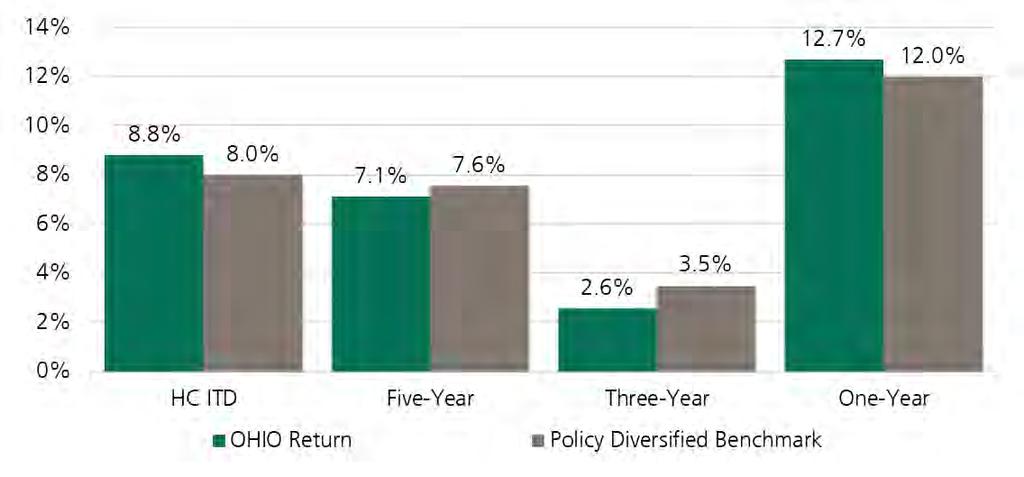
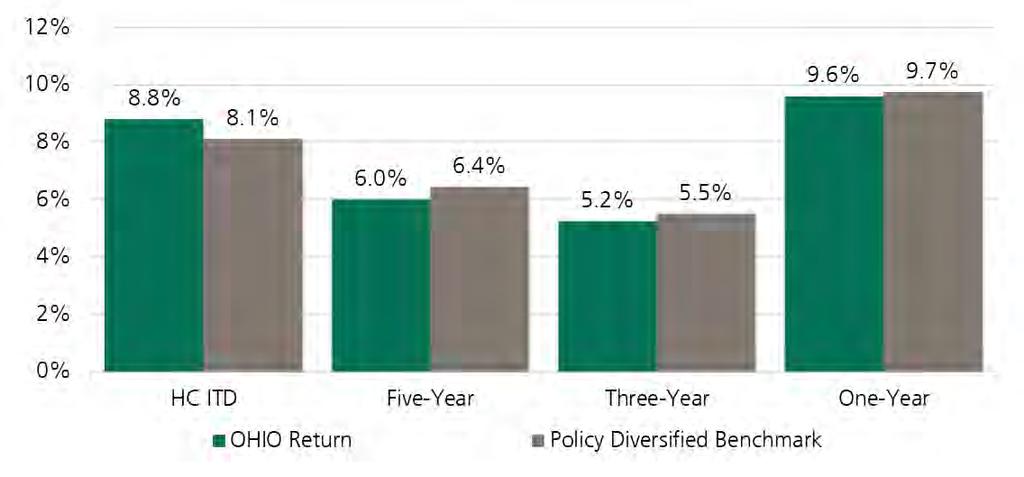
55 Performance vs. Policy Benchmark for Period ended March 31, 2018
56
57 7 Treasury and Debt Management 7.1 Current Debt and Pro-forma Debt & Debt Service The University strategically issues debt to finance our facility and infrastructure investments. As of June 30, 2018 the University and Ohio University Foundation will have $609.9M of outstanding debt. In April 2016, Housing for Ohio purchased the University s land beneath the Courtyard Apartments, which was financed with the Housing for Ohio Bonds. Housing for Ohio sold the Courtyard package on December 22, 2016, and the Housing for Ohio Bonds were defeased on February 1, The majority of our long term debt is issued in the form of tax-exempt bonds which are repayable over the term with annual principal and interest payments. On November 6, 2014, the University issued $250.0M taxable Century Bonds with annual interest payments and a principal bullet maturity in On March 1, 2017, the University issued $156.2M tax-exempt bonds to refund Series 2006A&B, advance refund Series 2008A, and $125.0M new money for capital projects. The Series 2017A bonds have bullet maturities beginning in fiscal year 2045 through fiscal year 2048 related to the new money and amortized maturities matching the original maturities for the refunded bonds. The following schedules detail our current outstanding debt and debt service as of June 30, 2018: OHIO UNIVERSITY DEBT PORTFOLIO AS OF JUNE 30, 2018 Series Tax Status Coupon Type Outstanding Par Next Call Date Final Maturity Use of Proceeds OHIO UNIVERSITY - GENERAL RECEIPTS DEBT Series 2009 Tax-Exempt Fixed Rate 6,280,000 Non-Callable 12/1/2019 Capital Projects Series 2012 Tax-Exempt Fixed Rate 52,785,000 6/1/ /1/2042 Capital Projects; Refunding (2003/2004) QAQDA - Series 2012A Tax-Exempt Fixed Rate 10,982,859 Non-Callable 12/1/2022 Capital Projects QAQDA - Series 2012B Taxable Fixed Rate 8,500,000 Non-Callable 12/1/2027 Capital Projects Series 2013 Tax-Exempt Fixed Rate 126,255,000 12/1/ /1/2043 Capital Projects; Refunding (2001/2004) Series 2014 Taxable Fixed Rate 250,000,000 Make Whole Call 12/1/2114 Capital Projects Series 2017A Tax-Exempt Fixed Rate 153,665,000 6/1/ /1/2047 Capital Projects; Refunding (2006AB/2008A) OHIO UNIVERSITY NOTES Ohio University Inn (Term Loan) Tax-Exempt Fixed Rate 1,120,400 N/A 6/15/2021 Capital Projects OHIO UNIVERSITY CAPITAL LEASE OBLIGATIONS Capital Leases Tax-Exempt Fixed Rate 322,924 N/A FY 2021 Capital Projects TOTAL 609,911, $, in Millions $250M Bullet Principal The University s debt portfolio is currently 100% fixed (interest rates are fixed at the point of issuance for defined periods versus variable which fluctuates against interest rate indices). The University s cost of borrowing is determined by both market factors and the University s bond rating. The University s ratings were affirmed in March 2018 by S&P (A+/stable) and in January 2017 by Moody s (Aa3/stable). These ratings are reassessed annually by S&P and at a minimum prior to each new issuance by Moody s. Interest
58 Bond ratings include analysis of quantitative factors (strength of balance sheet, debt service as a percent of operations, net revenue position, revenue diversification and dependencies, fundraising success) and qualitative factors (student applications, selectivity, retention, tenure and stability of leadership). In November 2015, Moody s updated its rating methodology which consolidates the US and non-us higher education methodologies into a single rating and includes a revised version of the Moody s scorecard. A major change in this revised methodology is a shift in how Moody s measures an institution s financial reserves. Adjustments were made to certain ratio calculations to ensure global comparability, including moving to cash-based wealth metrics from net asset-based measures. This means it effectively eliminates the impact of GASB 68 from the metric. In January 2016, S&P updated its rating methodology. The S&P framework is more complex than the Moody s scorecard but is intended to similarly provide further transparency into the rating approach. The framework is largely quantitative and looks at a university from two primary perspectives: Enterprise Profile and Financial Profile. S&P reviews a variety of quantitative measures within each of these categories and creates a weighted score for each of the two profiles; the combination of these two scores then maps to an overall rating score. The University was rated under the new methodologies beginning in January The following table and graph provide a summary of fiscal year 2006 to 2018 debt issuances and uses: Series Original Par ($, in Millions) FY Issued New Use of Proceeds Money 2008 A/B New Money ($9.9 million of Proceeds): To acquire, renovate and furnish the HDL Center. 64% Refunding ($5.6 million of Proceeds): Proceeds were used to refund Series 2008 Bond Anticipation Notes New Money ($27.9 million of Proceeds: To purchase and implement a new SIS and to upgrade existing information technology 100% network infrastructure. New Money ($50.6 million of Proceeds): To develop an extension campus in Columbus, OH, including the expansion of the Heritage College of Osetopathic Medicine, for renovations to multiple academic facilities, for infrastructure improvements including chilled water expansion, and for additional upgrades to existing IT network % Refunding ($32.3 million of Proceeds): Proceeds were used to refund portions of the 2003 and 2004 Bonds. The 2003 Bonds were orginally issued to refund 2003 Bond Anticipation Notes (BANs) and 1993 Bonds. The 2003 BANs were used to construct the University Center, Avonics Engineering Center, a lecture hall and the Pickerington Center. The 1993 Bonds were used to construct the Charles J. Ping Student Recreation Center and refund the 1972, 1977 and 1978 Bonds. The 2004 Bonds were issued to construct the University Center, purchase an aircraft, update two energy systems and construct the Lausche Heating Plant A/B New Money ($28.6 million of Proceeds): To finance the costs of air quality facilities in order to promote purposes of ORC, Chapter 100% New Money ($123.3 million of Proceeds): To develop an extension campus in Columbus, OH, including the expansion of the Heritage College of Osetopathic Medicine, for renovations to multiple academic buidings, for construction of a new Indoor Multi-Purpose Facility, and to complete the Housing Development Phase I % Refunding ($37.9 million of Proceeds): Proceeds were used to refund the 2001 Bonds and remaining 2004 Bonds. The 2001 Bonds were used to construct an Innovation Center, construct an HR and training center on West Union Street, acquire the Athena Theater, renovate Peden Stadium, purchase an aircraft, construct a new airport terminal, upgrade infrastructure and renovate or construct multiple academic and housing facilities. The 2004 Bonds were issued to construct the University Center, purchase an aircraft, update two energy systems and construct the Lausche Heating Plant New Money ($250 million of Proceeds): To pay a portion of the costs of new construction and upgrades of University's capital 100% facilities, including capital expenditures for deferred maintenance and energy infrastructure projects. 2017A % New Money ($125.8 million of Proceeds): To pay a portion of the costs of new construction and upgrades to academic buildings, student housing and student dining facilities, including, but not limited to, the McCracken Hall renovation and addition, Grover Center expansion, Alden Library renovation, Clippinger Renovation Phase I, Engineering Research/Consolidation and expansion, Facilities/RMS/Administrative relocation, HCOM Athens, Ellis Hall upgrades, Tanaka Hall, Luchs Hall, Sowle Hall, Carr Hall and Jefferson Hall, Jefferson Dining Hall, Shively Dining Hall, and Nelson Dining Hall. Refunding ($41.2 million of Proceeds): Proceeds were used to current refund remaining 2006A and 2006B Bonds and advance refund a portion of 2008A Bonds. The 2006A Bonds were used to advance refund Series 1999 Bonds. The 1999 Bonds were used to modernize the air conditioning system on the Athens Campus, make improvements to recreational facilities, expand a child care center, renovate and expand the Grover Center, support construction on regional campuses, contruct the West State Street Laboratory Facility and renovate The Ridges Conference Center. The 2006B Bonds were used to construct a new residence hall, develop a Student Information System (SIS), provide audio visual equipment for the University Center, update energy control systems and finance the design costs for a new College of Communications Building and Integrated Learning and Research Center. The 2008A Bonds were used to acquire, renovate and furnish the HDL Center and refund Series 2008 Bond Anticipation Notes. $, in MIllions Existing Debt FY09: $26.6MM Long-Term Debt Outstanding FY13 TOTAL: $173.8 MM July 2012: $28.6 MM May 2013: $145.2 MM FY12: $76.5 MM FY15: $250.0 MM FY17: $156.2 MM Through (1) All proceeds include cost of issuance and underwriter's discount.
59 The University s updated Comprehensive Master Plan, integrating current Academic unit strategic and financial planning as well as cash forecasting and liquidity analyses, was approved by the BOT in March In conjunction with the Deferred Maintenance/Century Bond Strategy approved by the BOT, this informed revisions and refinement to our 6-year CIP. In August 2016, the Board of Trustees (BOT) authorized the University to proceed with its FY17-FY22 Six Year Capital Improvement Plan (CIP) which included $325.0M of additional long-term debt to be issued over the six-year horizon (2017 to 2022). On March 1, 2017, the University issued $156.2M of tax-exempt bonds which included $125.0M of new money anticipated in the $325.0M of additional long-term debt to be issued. The FY19-FY24 Six Year CIP was presented to the BOT at the June 2017 meeting. Utilizing the expected cash flows and debt needs identified in the FY19-FY24 Six Year CIP and FY19 CIP Update, the University would anticipate issuing additional debt of $200.0M in FY20 through FY24 in the amounts below: OHIO UNIVERSITY CAPITAL IMPROVEMENT PLAN: DEBT ISSUANCE FY FY 2024 ($, in millions) Fiscal Year Total CIP Debt Issuance $ $ $ - $ 125 $ - $ $ 575 As we progress through FY19 and monitor liquidity and cash flow, we will determine when we will go to market but anticipate going to market in the spring of FY2020. Assuming debt is issued per this schedule, the University s total debt outstanding would peak at $750.1M in FY22. While the University s peak outstanding debt is higher than rating medians, it should be considered in the context of the size of its operations and financial reserves. Annual Pro forma Debt ($ in millions)

60 Debt service to operations, which measures annual debt service (the sum of the annual principal and interest expenses payable for existing outstanding debt) as compared with the university operating budget, is the metric used to measure the impact of an institution s debt burden on operating expenses. The lower the percentage, the greater the institution s financial strength. The following chart depicts the anticipated debt service to operations ratios with our current assumptions on additional borrowing through FY24. FY18 is calculated using projected actual results. Debt service to operations is projected to peak at 6.0% in FY20. This is above the Aa3 public-institution median of 4.2%, but well below the Aa3 max value of 12.6%. Debt Service to Operations
61 7.2 Internal Bank The Treasury Management Office began developing and implementing an Internal Bank structure in fiscal year 2015 utilizing the University s cash and investments per the graph below. Cash and Investments ($654.6M) Working Capital (Tier 1, 2 & 3 Investments) Strategic Investment Pool (included in working capital) Tier 4-Diversified Pool (operating reserve) & Student Investment Pool ($7.6M) Debt Contingency The Internal Bank was capitalized with the University s working capital component of its net assets (blue). This includes the collective reserves of all operating and auxiliary units. The Strategic Investment Pool/Reserve targets areas of investment that preserve the quality of the University; funded annually with the 2% SSI and tuition holdback and $4.5M working capital returns. The Diversified Pool/Operating Reserve is Board designated to preserve ongoing operations and programs for a set period of time in the event of unexpected cash flow shortages. The Student Investment Pool is managed by two undergraduate student organizations from the College of Business Applied Investment Management Programs. The Debt Contingency is a reserve to ensure an appropriate amount of working capital is available to fund bullet maturity debt. Quasi Endowment Pure Endowment Century Bond Century Debt Reserve The University s net assets related to its endowment are denoted in gray. The Quasi Endowment is University/Board designated and Pure Endowment is donor designated. The University s net assets related to the Century Bond bank are denoted in green. The Century Bond funds include the unallocated portion of original bond proceeds, investment earnings and internal loan pool. The Century Bond Debt Reserve was established with $7M set aside from working capital and is invested to fund the bullet payment of $250M in The Internal Bank structure currently has two distinct banks or funding models as follows: 1) Internal Bank model: funded with working capital reserves, operating surpluses, tax exempt bond proceeds, internal loan repayments, and investment earnings; 2) Century Bond Bank model: funded with Century Bond proceeds, investment earnings, and internal loan repayments. The Internal Bank funding model takes a more sophisticated approach to managing University resources and debt portfolio than the University has utilized in the past. First, it decouples the University s external and internal debt portfolios so that the interest rates paid by internal units are no longer dependent on market conditions at time of issuance. Instead, the University sets the interest rate based on the blended average cost of the institution s overall debt portfolio which makes the interest paid on debt equitable across the University. Additionally, the model creates predictability in capital costs and working capital returns for budgeting and forecasting. Ultimately funds may be recycled internally to reduce the amount of future debt needs.
62 7.2.1 Internal Bank Model The Internal Bank s primary use of funds will be for the University s Capital Improvement Plan (CIP) with the exception of deferred maintenance and energy infrastructure projects which will be funded primarily from the Century Bond bank. The Internal Bank model inflows consist of working capital reserves, operating surpluses, tax exempt bond proceeds, internal loan principal and interest repayments, and investment earnings. The outflows consist of external debt service payments, internal loans issued, use of reserves, and the University s Strategic Opportunity Reserve ( SOR ). The University s working capital cash and investment balances approximated $161.0M as of June 30, 2017 and are forecasted at a lower balance of $135.1M at June 30, 2018 (see top blue cylinder above). The lower balance is primarily due to capital project expenditures during FY18. In December 2014, Capital Cities was engaged to provide short-term investment advisory services for the working capital investments of both the University and Foundation. At the October 2015 Board of Trustees meeting, the updated Cash and Pooled Investments (Non-Endowment Funds) Investment Policy Statement ( IPS ) and new tiered investment structure were approved. The IPS governs the University s operating funds/working capital. Pursuant to a detailed review of the University s cash flow needs, risk tolerance, return objectives, and investment environment among other considerations, the new investment structure was developed and includes four liquidity tiers as follows: Tier 1: Assets provide for short-term (less than one year) cash flow needs. Tier 2: Assets serve as the Contingency Account (reserves to replenish Tier I if necessary) and to fund the University s Capital Improvement Plan. Tier 3: Assets are comprised of the residual balance of the Non-Endowment Funds after both Tier I and II cash targets have been met. Tier III (and IV if necessary) provides Tiers I & II with emergency liquidity while also seeking to maximize risk-adjusted returns. Tier 4: Assets are comprised of the diversified pool, which is a unitized portion of the University s Long- Term Endowment Investment Pool, and the Ohio University Student Investment Program funds. Management of the assets in this tier has been delegated by the University to The Ohio University Foundation.
63 The Internal Bank utilizes the Tier 1, 2 & 3 assets that are not reserved for other purposes. Tier 4 includes the longterm working capital funds that are set aside as an operating reserve. The graph below includes investment income on Tier 4 investments in the amount of $7.9M. The Internal Bank FY19 inflows and outflows are budgeted as follows: Internal Bank $135.1M Excludes Strategic Investment $20.2M is committed against existing internal loans on capital projects. This represents remaining project spend on issued loans not included in FY19 internal loans/funding. Internal Loan P&I $41.3M Internal Loans/Funding $90.0M ** $34.0M of projects will not be funded with Series 2017A Series 2017A Unspent Proceeds $60.6M State Cap Approp $0.0M Invest earnings $3.4M* Unexpended PY Bond Proceeds $6.5M Total Inflows $51.2M Internal Bank External debt service $31.6M Other*** $0.0M Transfers to Ops $17.0M Bond Funded CIP**** $6.5M Total Outflows $89.1M (excludes Series 2017A projects) Internal Bank $97.2M (includes commitments of $20.2M) *Investment income includes Tier 4 and is net of $7.5M for Strategic Investment. Total Tier 4 earnings is $7.9M. **Represents funding/internal loans issued which differ from CIP spend due to timing. Certain projects will be funded by Series 2017A bonds or future bonds. ***Other includes bond related fees, advisory services, net of tax rebate income. ****Represents bond funded CIP spend for projects not included in FY19 internal loans/funding. Series 2017A Unspent Proceeds $56.0M The Internal Bank funds capital projects in advance but will be reimbursed in part by future debt issuances. The graph above includes the June 30, 2018 forecasted unspent Series 2017A proceeds of $60.6M since certain projects included in the FY19 internal loans/funding of $90.0M will be reimbursed by the Series 2017A proceeds. The forecasted FY19 capital expenditures against the Series 2017A proceeds is $6.5M. The remaining Series 2017A bond proceeds will be spent on or before March 1, Of the $90.0M in FY19 internal loans/funding, only $34.0M will be funded from Internal Bank working capital. The remaining expenditures will be funded from Series 2017A proceeds.

64 7.2.2 Century Bond Bank Model The Century Bond Bank was created to fund energy infrastructure projects and deferred maintenance projects in order to reduce the deferred maintenance backlog and establish a framework to move to a funded depreciation model and continuously manage deferred maintenance needs over the next century. Proceeds of the bonds will be used to make a series of internal loans for the Energy Infrastructure Projects (approx. $79.0M) and deferred maintenance projects (approx. $160.0M in $10.0M annual tranches). As a note, the original project budget for Lausche was $90.0M but the revised EIP project budget is $79.0M. At the May 2016 Century Bond Advisory Committee meeting, the Committee discussed a proposal to repurpose the $11.0M excess to close the funding gap for Phase I of the Clippinger Strategy. The Committee supported the recommendation of this funding strategy and it was approved by the University Board of Trustees in June The Century Bond bank inflows consist of Century Bond proceeds, investment earnings, and repayment of internal loan principal and interest. The outflows consist of external debt service and internal loans issued. Of the $247.3M net proceeds (net of $2.2M discount and $0.5M issuance costs), the University invested $97.3M in highly liquid, safe investments. As of June 30, 2018 the remaining balance of this portion of the proceeds is projected at $40.6M and is currently invested in short-term bond funds. $150.0M of the proceeds is managed by the Foundation Investments Committee. Hirtle & Callaghan, the Foundation s Chief Investment Officer, has worked with the University to put together guidelines related to the long-term investment of the $150.0M. The June 30, 2018 projected market value of the long-term investments is $178.2M. In addition to the $247.3M net proceeds, the University set aside $7M from working capital to establish a debt reserve fund. The debt reserve fund is invested 50% in a conservative portfolio and 50% in the University s long-term portfolio so that it may be ultimately used to repay the total outstanding principal in one hundred years. Rebalancing between the portfolios will occur over time in order to protect the principal needed to repay the full principal amount and one year s interest at maturity. This was structured in conformance with the Guiding Principles approved by the BOT. The June 30, 2018 projected balance of the debt reserve fund is $7.5M. The Century Bond Bank FY19 inflows and outflows are budgeted as follows:
65 7.3 Internal Loans Internal loans may be approved for major equipment purchases, remodeling or new construction projects and other approved uses. The Treasury Office has developed internal loan guidelines that define appropriate loan usage, terms, interest rates, and structure. Internal loans are issued according to these guidelines and are administered by Treasury Management Internal Bank Loans The interest rate charged on internal loans is based on the blended cost of capital, including administrative and operating fees. The rate is variable over the life of the loan but will be predetermined and fixed on the first day of each calendar year (January) for the following fiscal year (July 1 to June 30). The remaining balances of the loans issued prior to the internal bank implementation were re-amortized using the blended variable rate, and the impact on principal and interest repayments in aggregate is minimal. However, the impact on certain departments is more significant in some cases so internal loans have been restructured on a case by case basis to date. Most of the Series 2013 bond loans were restructured. Since not all of the existing loans have been restructured, the loans are currently separated into three categories: 1) Working Capital Loans; 2) Bond Proceeds Loans; 3) Restructured and New Loans. Principal and interest payments on internal loans will be recorded at least quarterly and funded in the following manner: 1. Loans made directly to Planning Units. These include loans to Auxiliaries and units with direct external revenues and specific expansion programs (i.e., HCOM Dublin, HCOM Cleveland). Principal and interest payments on these loans are made from Planning Unit operating budgets as an operating expense. 2. Loans for execution against University CIP which do not fit into Category #1 above are paid by Central Budgeting through recovery of depreciation costs from the RCM units directly attributed to their facilities. Any shortfall is allocated across Planning Units via step down in the RCM model.
66 Ohio University Internal Loans Working Capital Loans Date of 7/1/2018 FY19 FY19 6/30/2019 Department Name Name of Account/Project Original Loan Loan Ends Loan Balance Principal Interest Loan Balance Engineering Student Training 7 Piper Warriors 1,134,000 01/12/ , ,834 8,470 98,345 Central Pool WOUB Tower Lease Revenue 572,984 06/30/ ,351 68,297 7,719 72,054 International Studies Tun Abdul Razak Maplewood Res 44,317 03/01/ ,863 5, ,856 Total 1,751, , ,139 17, ,254 Bond Proceeds Loans Date of 7/1/2018 FY19 FY19 6/30/2019 Department Department Name Name of Account/Project Original Loan Loan Ends Loan Balance Principal Interest Loan Balance Totals Airport Airport Terminal $ 740, $ 515,000 $ 50,000 $ 22,743 $ 465,000 $ 465,000 Arts and Sciences W State St Lab - A & S 372, ,876 29,907 10, , ,969 Athletics Track & Turf Fields 2,089, ,352, ,897 59,490 1,184,379 1,184,379 Campus Recreation Ping Rec Ctr 9,220, ,735,000 1,735,000 43,375 - Recreation Facility 1,547, ,001, ,368 44, , ,318 Central Pool Athena Theatre 1,645, ,145, ,000 50,594 1,035,000 Child Care Center - LL Inc. 1,740, ,126, ,914 49, ,982 Child Care Center - VPFA 154, ,169 12,437 4,407 87,732 King Air 350 1,880, , ,000 22, ,000 Network Infrastructure-Phase II 6,860, ,725, , ,319 3,040,000 Network Upgrade 6,185, ,980, ,000 74,875 1,015,000 Student Info Sys (SIS) 15,465, ,300,000 2,095, ,625 2,205,000 College of Communication Phase 2 10,830, ,065, , ,900 9,855,000 Schoonover Project 16,486, ,918, , ,913 14,570,325 Lindley Hall Upfit 2,255, ,095,000 45,000 98,025 2,050,000 Safety Projects 935, ,000 20,000 36, ,000 Six-Year CIP Planning Fund 24, , ,036 Tupper Hall Upfit 6,320, ,870, , ,525 5,745,000 WUSOC Legal Services Relocation 200, ,101 4,286 7, , South Court Street Relocations 3,586, ,241,188 76, ,220 3,164,474 Bromley Academic Relocations 1,715, ,550,237 36,692 67,066 1,513,545 Chilled Water Loop 8,665, ,609, , ,774 4,912,980 Chilled Water Project 5,605, ,075, , ,569 4,960,000 Confr Ctr the Ridges 2,644, ,711, ,498 75,294 1,499,010 Ohio Air Quality Develop Auth(2012A) 19,568, ,982,859 1,810, ,390 9,172,398 Ohio Air Quality Develop Auth(2012B) 8,500, ,500, ,500 8,500,000 Stores/Receiving Demo 255, ,278 20,521 7, ,757 Track & Turf Fields - VPF&A 96, ,605 7,773 2,754 54,832 HDL Ctr Purchase Non-Tax (2008A) 7,825, ,240, , ,673 6,925,000 Innov Ctr 1 (Finance) 1,179, ,407 80,019 34, ,387 Motor Pool Facility 330, ,240 20,000 10, ,240 W State St Lab - Jepson 521, ,361 41,886 14, ,475 W State St Lab - LL Income 2,418, ,565, ,360 68,867 1,371,060 WUSOC Southeast Wing Demolition 42, , ,661 37,484 85,427,533 College of Medicine Columbus Campus Project 11,149, ,095, , ,612 9,861,318 OUHCOM - Dublin (Columbus) 8,845, ,220, , ,650 8,050,000 17,911,318 Engineering Avionics Ctr 641, , ,395 3,035 - Engineering 98, ,605 18, Housing S. Grn Resi Hall (new) 19,460, ,930, , ,850 16,360,000 16,360,000 Lancaster Pickerington Center 2,240, ,375, ,000 66,550 1,170,000 1,170,000 Transportation & Parking Baker Univ Center-Parking Garage 1,255, ,029,385 52,480 47, , ,905 VP of Research Innov Ctr 1 (Research) 810, ,753 54,981 23, , ,773 VP of Student Affairs Baker University Center 36,904, ,250,615 1,542,520 1,396,730 28,708,095 28,708,095 Total 229,308, ,562,408 13,760,119 7,080, ,802, ,802,289 Following is a roll forward of existing, restructured, and new (based on active projects) loans from July 1, 2018 to June 30, 2019:
67 Restructured & New Internal Loans Date of 7/1/2018 FY19 FY19 6/30/2019 Department Department Name Name of Account/Project Original Loan Loan Ends Loan Balance Principal Interest Loan Balance Totals Central Pool Clippinger Phase I 18,000,000 FY20/FY Indoor Multi-Purpose Facility 5,480,000 7/1/2016 7/1/ ,180 - Indoor Multi-Purpose Facility 2,500,000 6/5/2013 6/1/2044 2,298,658 46, ,374 2,252,606 paid by Athletics Indoor Multi-Purpose Facility NA (120,000) (11,626) (108,374) (120,000) McCracken Hall Renovation 20,720,400 4/1/2015 1/1/ ,710, , ,740 19,341,095 Admin Reloc-Alden 86,520 8/21/2017 9/1/ ,524 1,388 4,038 84,136 Admin Reloc-Ridges13,14,18 Reno 13,125,072 7/1/2018 7/1/ ,125, , ,796 12,973,570 Admin Reloc-Ridges 20 Demo & parking 2,764,330 7/1/2018 7/1/2038 2,764,330 63,422 97,732 2,700,908 Space Reloc-Lindley 300,000 10/1/ /1/ ,000 4,561 7, ,439 Space Reloc-29 PP & Carriage 2,300,000 10/1/ /1/2038 2,300,000 34,971 54,419 2,265,029 Small House Strategy 1,500,000 FY IT-HRMS 10,000,000 12/1/ /1/ ,000, , ,163 9,604,139 IT-Network Infrastructure Replace 10,000,000 3/1/2019 3/1/ ,000, , ,750 9,803,238 IT-ComDoc 1,850,000 6/1/2018 6/1/2023 1,850, ,907 81,951 1,514, S. Court Street Purchase-Central 5,280,000 7/1/2017 7/1/2047 5,219,053 84, ,411 5,134,359 Ellis Hall Renovations 2,037,050 9/30/2017 9/30/2047 2,013,536 32,675 95,067 1,980,861 Central Classroom C-Suite Reno 519,540 5/1/2018 5/1/ ,540 8,044 24, ,496 Facility Site Improvements - HCOM 2,200,000 10/1/ /1/2048 2,200,000 16,830 52,151 2,183,171 HCOM Utilities Phase I - ROC 900,000 9/1/2018 9/1/ ,000 10,389 31, ,611 Russ Research Opport Ctr-design 2,400,000 9/1/2018 9/1/2048 2,400,000 27,703 85,174 2,372,297 Alden Library Renovations 1,040,000 7/1/2017 7/1/2047 1,027,995 16,682 48,536 1,011,313 74,797,362 Airport Support King Air 350 1,295,000 1/1/2016 1/1/2028 1,104,583 91,345 50,857 1,013,238 1,013,238 Athletics Indoor Multi-Purpose Facility 5,480,000 7/1/2016 7/1/2020 3,288,000 1,096,000-2,192,000 Indoor Multi-Purpose Facility NA 120,000 11, , ,000 Peden Stadium Scoreboard 549,803 2/1/2017 2/1/ , ,749 21, ,055 Convocation Center Videoboard 1,250,195 5/1/2018 5/1/2023 1,250, ,000 55,381 1,023,196 Sook Academic Center 3,492,253 7/1/2017 7/1/2022 3,019, , ,839 2,362,549 6,042,800 Business CSC Renovation 3,185,000 4/1/2015 1/1/ , ,764 10, College of Medicine OUHCOM - Cleveland 16,400,000 7/1/2017 7/1/ ,027,375 1,372, ,600 13,655,269 OUHCOM - Athens 60,000,000 3/1/2019 3/1/ ,000, , ,500 59,771,861 OUHCOM - Athens 3,997,939 7/1/2017 construction phase 3,997, ,427 3,997,939 77,425,069 Education McCracken Hall Renovation 10,000,000 7/1/2016 6/1/ , Engineering Multiphase Tech Corrosion Center 1,600,000 6/1/2015 4/1/2025 1,196, ,697 54,231 1,048,842 ARC FY15 Operating Deficit 2,200,000 7/1/2015 6/30/2025 1,967, ,000-1,834,000 ARC Integrated Learning Research 3,502,257 7/2/2015 6/30/2041 3,273,494 83, ,491 3,189,884 6,072,726 OU Foundation Space Relocations-Konneker 1,500,000 7/1/2018 7/1/2028 1,500,000 89,599 52,382 1,410,401 1,410,401 Housing Housing Development Phase I 100,000,000 4/1/2004 4/1/ ,543,307 1,894,150 4,457,707 92,649,157 Housing Development Phase II 60,000,000 FY20-FY S. Court Street Purchase 2,720,000 7/1/2017 7/1/2047 2,688,603 43, ,939 2,644,973 4 University Terrace Purchase 2,000,000 9/1/2017 9/1/2047 1,976,914 32,081 93,338 1,944,833 Jefferson Hall Renovation 25,800,000 4/1/2016 4/1/ ,981, ,006 1,178,893 24,542, ,781,756 Real Estate Office Dublin -IEC 900,000 9/1/2015 4/1/ ,969 19,533 14, , ,435 Total 408,875, ,764,211 8,932,423 11,266, ,831, ,831,788 GRAND TOTAL 639,935, ,683,011 22,867,680 18,363, ,815,331 41,231,004 total P&I
68 7.3.2 Century Bond Loans Century Bond loans will be issued to Central Budget, with principal and interest recovered through the funded depreciation model as described above. The interest rate charged on the internal loans from the Century Bond program is 5.6%, which equates to the fixed rate on the Century Bonds. An internal loan investment pool will be used for internal loan principal and interest payments in order to separate this activity from the original proceeds and provide for recycling of the bond funds to reduce the amount of future debt and fund the ongoing deferred maintenance program. Following is a roll forward of Century Bond loans from July 1, 2018 to June 30, 2019: Ohio University Century Bond Loans Interest 7/1/2018 FY19 FY19 6/30/2019 Department Name Name of Account/Project Original Loan Rate Date of Loan Ends Loan Balance Additions Principal Interest Loan Balance Internal Loans: Central Finance Deferred Maintenance-FY15 $ 10,000, % 12/01/14 6/1/24 $ 6,645,551 $ - $ 960,719 $ 358,245 $ 5,684,832 Central Finance EIP-1st Installment 30,000, % 12/01/14 6/1/44 28,249, ,443 1,572,217 27,747,719 Central Finance Deferred Maintenance-FY16 10,000, % 12/01/15 6/1/25 7,554, , ,779 6,645,551 Central Finance EIP-2nd Installment 30,000, % 12/01/15 6/1/45 28,723, ,545 1,599,115 28,249,162 Central Finance Deferred Maintenance-FY17 10,000, % 12/01/16 6/1/26 8,415, , ,548 7,554,736 Central Finance EIP-3rd Installment 19,000, % 12/01/16 6/1/46 18,476, ,423 1,028,894 18,191,681 Central Finance EIP-Clippinger Phase I 11,000, % 12/01/16 6/1/46 10,696, , ,676 10,532,026 Central Finance Deferred Maintenance-FY18 10,000, % 12/01/17 6/1/27 9,229, , ,702 8,415,152 Central Finance Deferred Maintenance-FY19 10,000, % 12/01/18 6/1/28-10,000, , ,380 9,229,415 Total $ 140,000, ,990,520 10,000,000 5,740,246 7,075, ,250,274 Total P&I 12,815,802
69 8 Compensation 8.1 Salary and Wages Total Compensation Initiatives Creating effective total compensation plans has been identified as a strategic priority essential to retaining the University s extraordinary faculty and staff. FY 2019 Merit Pool Proposal The FY19 salary raise pool for Ohio University is 1.5% for continuing benefits eligible positions. Control totals were established by taking a data snapshot February 15, 2018 which were provided to Planning Units. Compensation will monitor annual increases against the control total number provided to Planning Units. Biennial Equity Review 2017 In accordance with the August 29, 2011, Resolution Agreement the University signed with the U.S. Department of Education, Office of Civil Rights (OCR), the University engaged Mercer to conduct a biennial equity review of our compensation practices. The OCR Resolution Agreement required a biennial review of administrative and nonbargaining unit classified employees compensation to confirm that compensation had been determined on a nondiscriminatory basis as defined by Title IX of the Education Amendments Act of 1972 and to promptly remedy any risks identified. The objective of the review was to enable Ohio University to manage pay differences of administrative and classified non-bargaining employees through a process that is accurate, proactive, and defensible and to build the foundation for a sustainable process for ongoing pay equity management. The project allows Ohio University to address compliance requirements, minimize potential exposure, efficiently identify and rectify potential pay equity situations, and to effectively respond to potential allegations of pay inequity. Our compensation philosophy includes a due diligence process that includes a regular look at differences in pay across the University leveraging a rigorous statistical approach to ensure that compensation is determined on a nondiscriminatory basis. This past spring, Compensation concluded its biennial equity review in accordance with the Department of Education s resolution agreement. As part of our commitment to fair, competitive, and equitable pay, in June of 2017 the university invested $443,715 across 62 administrative and classified non-bargaining unit employees. Pay equity will continue to be reviewed, and adjusted as warranted, on a biennial basis with the assistance of a third party expert. Biennial Equity Review 2018 In the coming months, Compensation will issue an RFP for the next biennial review. The analysis is expected to be completed in early 2019 and utilize the same structure and philosophy as the initial biennial equity review. Complete Market Study 2019 In the effort to maintain competitive compensation structure and levels based on comparisons to appropriate external labor markets and approved by the Board of Trustees in 2014, Compensation will issue an RFP within the coming months to engage a partner to conduct a complete market study by mid to late Our existing benchmarks will be reviewed, new benchmarks may be identified, and current market rates against our pay grades will be analyzed. Assigned pay grades for particular jobs on campus may be adjusted during this time, but it is not anticipated that pay increases will be warranted unless an individual is below the minimum of a new pay grade. We continue to be challenged by compression and inversion with our existing workforce as we adjust our pay structure to market, but it is critical to be able to recruit talented, qualified employees. We hope to be able to reintroduce a staff equity pool in the future to help address inversion and compression.
70 Faculty Compensation Task Force A task force was established by the past Executive Vice President Pam Benoit and in spring 2013 and was charged with developing recommendations to establish and achieve the goal of maintaining competitive faculty compensation. The charge to the committee was to develop a three-year plan to maximize our investment in faculty compensation to attract and retain talented faculty. The committee recommendations included the following: Establish a goal to move the average salary for tenure-track faculty to the rank of third among the four-year public universities in Ohio Invest a proportional percentage in compensation for regional tenure-track faculty Invest a proportional percentage in Group II faculty (non-tenure track) This three-year plan was completed in FY17 with overall investments of: $3M for tenure-track faculty on the Athens Campus $1.2M for tenure-track faculty on the Regional Campuses $1.6M for full-time non-tenure-track faculty on the Athens Campus $2M for full-time non-tenure-track faculty on the Regional Campuses For FY18, with the arrival of President Nellis, a new task force was created to assess the previous plan and develop a new plan to ensure that faculty compensation supports the university strategic goal of recruiting and retaining exceptional faculty including the following tasks: Review the results of the recently completed faculty compensation plan Create an updated plan that considers all aspects of the previous plan: o Review and potentially update the peer set approach used for establishing the goals of the plan o Review and potentially update the actual goal relative to the peer set o Review and potentially update the methodology used to project salary inflation and determine any investments needed o Review and potentially update the implementation of the plan including the timeframe and how the plan addresses not only Athens tenure-track faculty but also non-tenure-track faculty and regional campus tenure-track and non-tenure-track faculty This committee will make recommendations at the beginning of the FY19 budget year for potential consideration when the FY20 budget is built.
71 Fair Labor Standards Act Regulatory Changes On May 18 th 2016, the Department of Labor (DOL) released its final regulations to increase the standard salary level to qualify for exemption from the FLSA overtime requirements from $455 a week ($23,660/year) to $913 a week ($47,476/year). The regulation also had an automatic threshold increase every three years to maintain the level at the 40th percentile of the lowest wage census region. The standard duties test remained unchanged. These regulations were to become effective on December 1, On November 22, 2016, Judge Amos L. Mazzant II, of the United States District Court for the Eastern District of Texas, Sherman Division, in the matter titled State of Nevada, et al. v. United States Department of Labor, et al., Case No. 4:16-CV-00731, granted an injunction that blocked the implementation of the Department of Labor s new FLSA rule amendments. Based on this judicial order, along with analyzing the financial impact of each implementation option, Ohio University joined many other public and private institutions and agencies in suspending implementation or taking any action based on the new FLSA amendments. A new proposed rule is currently being considered, with reports of a suggested salary threshold between the low and upper $30,000s. This new rule may also include some sort of automatic update and regional pay differentials. The anticipated implementation date is expected to be announced October If we were to assume the new threshold is increased to $35,000, approximately 32 employees would no longer be exempt, unless we increase their salaries at a cost of $95,900 total. In comparison, under the former proposal of an annual $47,476 salary threshold, 407 employees would no longer be exempt, unless their salaries were increased by $2,426,803. Source: Department of Labor & SHRM
72 8.1.2 Personnel The following tables illustrate the University s employment trends by job category for FY14 through FY18. It is important to note that the headcounts represent a snapshot of filled positions as of Nov 1 of each year (census date used for IPEDS reporting), including both full-time and part-time employees, but excluding temporary and intermittent staff, as well as Group III faculty. The census is taken on November 1 each year to provide a consistent frame of reference. Consequently, the census does not exactly represent staffing level fluctuations throughout the year. The headcounts are inclusive of all funding sources, including operating funds, grant funds, and foundation funds. All employee headcount figures presented throughout the Budget Book reflect census headcounts. The following provides definitions of job categories referenced within the Employee Headcount Section: Employee Type Job Category Definition Benefit Eligibility Faculty Group I Tenured or tenure track faculty Full health and welfare benefits package Faculty Group II Non-tenure track instructional faculty Full health and welfare benefits package Faculty Group III Non-tenure track temporary faculty with semester appointments Faculty Group IV Visiting professors or other full-time special and courtesy appointments Faculty Early Retired Group I faculty who have elected the Early Retirement Program Administrator Administrator Employees in support of administrative, instructional, student support services, research, etc.; in colleges, auxiliaries, and central operations; that are neither classified civil service (as defined by the Ohio Revised Code) nor faculty. Classified AFSCME Classified civil service employees covered under the collective bargaining agreement with the American Federation of State, County & Municipal Employees Union Local Classified FOP Classified civil service employees covered under the collective bargaining agreement with the Fraternal Order of Police Classified Non-Bargaining Unit Hourly employees, as defined by Ohio Civil Service Law (excluding AFSCME and FOP) Legally required benefits Full health and welfare benefits package Legally required benefits and life insurance Full health and welfare benefits package for employees with an FTE of.75 or greater. Full health and welfare benefits package for employees with an FTE of.75 or greater. Full health and welfare benefits package Full health and welfare benefits package for employees with an FTE of.75 or greater.
73 FY14 FY15 FY16 FY17 FY18 Administrators¹ 1,393 1,493 1,672 1,679 1,663 Classified AFSCME Classified FOP Classified Non Bargaining Subtotal: Classified 1,111 1,144 1,227 1,241 1,178 Early Retired Faculty Group I Faculty Group II Faculty Group IV Faculty Subtotal: Faculty 1,389 1,416 1,423 1,467 1,460 Total Job Category Headcount 3,893 4,053 4,322 4,387 4,301 % Increase 4.1% 6.6% 1.5% -2.0% 1,800 1,700 1,600 1,500 1,400 1,300 1,200 Administrators Classified Faculty 1,100 1, FY14 FY15 FY16 FY17 FY18
74 Salary Summary The following salary summary table provides comparative salary information by employee categories for FY11 - FY18, as well as the forecasted salaries for FY18 and budgeted salaries for FY19. Represented in $ Millions 2011 Actuals 2012 Actuals 2013 Actuals 2014 Actuals 2015 Actuals 2016 Actuals 2017 Actuals 2018 Budget 2018 Forecast Raise Pool Impact 2019 Budget % C hange Faculty Salaries $113.1 $114.6 $124.6 $124.7 $133.6 $136.4 $143.7 $144.6 $142.8 $2.1 $ % Administrative Salaries % Classified NBU Wages % Union Wages % Graduate Student Wages % Student Wages % Other Compensation* % Grand Total $281.5 $285.1 $304.7 $311.9 $333.0 $346.5 $361.7 $370.0 $361.8 $4.7 $ % *Other Compensation includes: Employee cash awards, allowances, including auto, broadband, uniform, and housing; increase in FY18 forecast driven by Early Retirement Incentive Program (ERIP) offered on Regional Campuses. Note: All prior years recasted under CoA mapping; variation from previous version due primarily to Other Compensation (Employer Provided Lodging and Relocation Expenses) that used to map to non-salaries rollups; based on limitatiions with the pre-2018 account structure, FY2011 Acutals through FY2018 Budget reflects Classified NBU and Union Overtime and Other Compensation as part of the Classified NBU Wages category. The $129.9M reported for 2018/2019 for Administrators includes part-time administrative staff positions converted from Group III in Salary for these positions were not included in previous years data. Group III Faculty salaries are not included in Faculty salary data. The following salary summary table provides comparative salary information by Planning Unit for FY11 through FY18, forecasted salaries for FY18 and budgeted salaries for FY19. Salaries and Wages by Planning Unit Raise 2019 Actual Actual Actual Actual Actual Actual Actual Budget Forecast Pool Budget College of Arts and Sciences $48.8 $49.1 $52.1 $50.7 $52.7 $52.3 $54.8 $55.4 $54.4 $0.7 $54.7 College of Business Scripps College of Communication Patton College of Education Russ College of Engineering College of Fine Arts College of Health Sciences and Professions University College International Studies Honor's College Voinovich School of Leadership and Public Affairs Heritage College of Osteopathic Medicine Regional Campuses Intercollegiate Athletics Vice President for University Advancement Culinary Services Housing & Residence Life Library Office of Information Technology Office of the President Provost - Institutional Services* Vice President for Student Affairs Vice President for Research Vice President for Finance and Administration Other Grand Total $281.5 $285.1 $304.7 $311.9 $333.0 $346.5 $361.7 $370.0 $361.8 $4.7 $372.3 * Instructional Innovation e-learning flip occurred in FY17 and resulted in $1.7M of Faculty Salaries being moved to academic units.
75 8.2 Benefits Expense FY17 Benefits Expenses The University provides a comprehensive benefits program to faculty and staff as part of their total compensation package. Benefits for 2017 were roughly $113.2M and are grouped in the following categories: Retirement: the University contributions to OPERS, STRS, and the Alternative Retirement Plan for faculty, staff, and students. Health and welfare: health, vision, dental, life and disability insurances, etc. for faculty and staff. Mandated: legally required benefits including workers compensation, Medicare, unemployment, and occupational health. Educational Benefits: For faculty, staff, retirees, and their dependents. PTO Retirement Pay Out: sick pay out (mandated by State law) and vacation pay out at retirement. Miscellaneous: Child care center support, parental leave, AFSCME contract related costs, and relocation expenses. Retirement contributions and health and welfare benefits consistently account for roughly 84% of overall benefits costs. Educational benefits and mandated benefits represent approximately 13% of costs with the remaining benefits all under 3%. Benefits Expense by Fiscal Year (Millions) $120.0 $100.0 $80.0 $88.6 $88.9 $93.5 $98.0 $101.0 $107.9 $113.3 $60.0 $40.0 $20.0 $- FY11 FY12 FY13 FY14 FY15 FY16 FY17 Miscellaneous $0.7 $0.8 $1.1 $1.5 $1.2 $1.4 $1.3 PTO Retirement Pay Out $1.4 $2.7 $2.1 $1.4 $1.9 $1.9 $1.9 Educational Benefits $6.5 $6.6 $6.7 $7.4 $7.9 $8.3 $8.5 Mandated $5.6 $6.0 $6.7 $6.4 $5.9 $5.8 $6.2 Retirement $34.8 $35.0 $36.8 $38.1 $41.2 $43.0 $44.9 Health and Welfare $39.6 $37.8 $40.1 $43.2 $42.9 $47.5 $50.5
76 Health and Welfare Benefits include health, vision, dental, life, and disability insurance and related expenses. Total health and welfare benefits costs increased by 7.6% in FY17. The main cost driver was an increase in prescription drug plan costs (13%) verses medical claims (4%). The university is self-insured for medical and dental insurance and contracts with Anthem Blue Cross and Blue Shield and Express Scripts for Third Party Administration (TPA) services. The major factors that drive health care costs for the university are employee count and family size, increases in utilization (especially variation in claims in excess of $50,000), and price for care (medical CPI). Represented in Millions FY12 FY13 FY14 FY15 FY16 FY17 FY18 Projection Health/Dental Claims Fees and Other Insurance Employee Premiums (7.8) (7.8) (7.9) (9.7) (10.9) (11.7) (13.0) Total University Cost % Growth -4.5% 6.2% 7.7% -0.7% 10.7% 7.6% 8.4% Legend: Health/Dental Claims: Claims reported for health and dental plans Fees and Other Insurance: Insurance company administrative fees, life insurance, disability insurance, employee assistance program, HMO (Eastern Campus), wellness programs. Employee Contributions: Employee premiums for medical plans, dental plans, COBRA, and life insurance plans Benefits Advisory Council Update: The Benefits Advisory Council continues work on its charge of analyzing and making recommendations related to University benefit plan designs in conformance with the guiding principles and strategies set by the Total Compensation Committee under the direction of the President. The table below represents FY18 membership in BAC: Name Representative Body Term Period of Appointment Colleen Bendl Co-Chair- Human Resources Role Based Ongoing Susan Williams Co-Chair Faculty Senate Committee Chair - Finance and Facilities Role Based Ongoing (Vacant) Past Co-Chair of Faculty Senate (only filled during transition year) Role Based 1 Year Vickie McFadden Administrative Senate 3 Years Through FY2018 Jennifer Romero Classified Senate 3 Years Through FY2020 Joe McLaughlin Faculty Senate (Chair) Role Based (Vacant) Past Co-Chair of Faculty Senate (only filled during transition year) Role Based 1 Year David Juedes Chair/Director 3 Years Through FY2020 Tia Barrett CFAO 3 Years Through FY2020 Bill Willan VP Regional Higher Education Role Based Ongoing Jason Pina VP Student Affairs Role Based Ongoing John Day Associate Provost Role Based Ongoing Chad Mitchell Chief of Staff VPFA Role Based Ongoing (Vacant) Dean Role Based 3 Years Jennifer Kirksey President s Council Role Based (non voting) Ongoing Greg Fialko HR Benefits Role Based (non voting) Ongoing Jane Balbo HCOM Clinical Faculty; Healthcare Benefits Advisor Role Based (non voting) Ongoing
77 Since 2015 the committee has recommended a series of plan design and premium changes that have resulted in cost avoidance as outlined in the next two charts. Plan Design and Premium Changes Implemented (FY16-FY18) and Recommended (FY19-FY21) FY15 FY16 FY17 FY18 FY19 FY20 FY21 Options Plan Change Plan Change Plan Change Plan Change Plan Change Plan Change Deductible $200/$400 $400/$800 $450/$900 $700/$1400 Co-Insurance Maximum $1000/$2000 $1500/$3000 $1750/$3500 $2000/$4000 $3000/$6000 $3250/$6500 Co-Insurance % 90% 85% 80% Office Visit Copays $20 $25 Rx Retail Copays $10/$20/$30 $20/$30/$40 Rx Mail Copays $15/$30/$45 $25/$35/$55 Employee Premium % (single - single+1 - family) 15%-15%-15% 15%-16%-17% 15%-17%-19% 15%-17.5%-20% 17%-19%-21% Other -Rx Util. Mgmt -Use of Reserves -Dependent Audit FY20 and FY21 recommendations are preliminary and subject to change. Impact of Plan Design and Premium Changes Implemented (FY16-FY18) and Recommended (FY19-FY21) Affordable Care Act The University continues to comply with Affordable Care Act regulations regarding minimum essential coverage, minimum value/cost, and employee eligibility. ACA Measurement Periods Ending March 31, 2018 In FY18, the University tracked 9,444 variable hour employees with 6 qualifying for health care by averaging greater than 30 hours per week during the measurement period as detailed below. Category Employees Tracked Employees Deemed Full Time* 6 Administrator 297 # offered coverage and remained in a part-time status** 0 Classified 35 # Not re-employed 5 Faculty 979 Student 8,114 Total 9, Educational Benefits The University provides educational benefits to faculty, staff, retirees, and their dependents as follows: Full Time Faculty and Staff: 100% of the instructional fee and 100% of non-residency fee, if applicable. Part Time Benefits Eligible Faculty and Staff: Employees with FTE of 0.67 or greater: 100% of the instructional fee and 100% of non-residency fee, if applicable. Employees with FTE less than 0.67: FTE % of instructional fee and non-residency fee, if applicable. Full Time AFSCME union employees receive 100% of the instructional fee and non-residency fee, if applicable. Part-Time AFSCME union employees receive 50% of the instructional fee and non-residency fee, if applicable.
78 8.2.5 Mandated Benefits Workers Compensation is funded via a charge to Planning Units based on gross wages as follows: Operating: $ Dining: $ Medicare is funded via a charge of $ per gross wages to Planning Units. Unemployment is billed to the University by the State of Ohio with charges based on each individual claim. As of January 1, 2013 the University is self-insured for worker s compensation. Although the intent was to reduce costs through more effective claims management and reduction of administrative fees to the state, we are still required to pay administrative fees on trailing claims/liabilities from pre-2013, under the current Ohio Revised Code Retirement Contributions Retirement plan options and employee and employer contributions are mandated by State of Ohio Law. Prior to 1998 all Faculty and Staff were automatically enrolled in either the State Teachers Retirement System (STRS) or Ohio Public Employee Retirement System (OPERS). The Ohio General Assembly established the Alternative Retirement Plan (ARP) in The ARP allowed any new full-time faculty and staff member, as well as any existing full time faculty and staff member with less than 5 years service in 1998, to opt out of the OPERS and STRS pension plans and participate in a defined contribution plan with third party vendors such as TIAA-CREF and Voya. The law creating the ARP also established a mitigating rate to recognize the impact of allowing a portion of eligible university employees required to participate in OPERS and STRS to voluntarily select an ARP. It is designed to offset the negative impact resulting from the exclusion of this population from OPERS and STRS membership. The mitigating rate is funded from the employer contributions for each employee participating in an ARP. This rate is assessed from the employer contribution for each employee participating in an alternative retirement plan, with such funds being directed to OPERS and STRS instead of the employee s ARP account.
79 Retirement Contributions for the OPERS plan and Staff ARP Plan are as follows: STRS and Faculty ARP Plans: Alternative Retirement Plan STRS Defined Benefit Plan STRS Defined Contribution Plan STRS Combined Plan Employee Contribution 14.00% 14.00% 14.00% 14.00% University 9.53% 14.00% 9.53% 14.00% Contribution Total Contribution to Employee Plan 23.53% 28.00% 23.53% 28.00% University Mitigating Rate Contribution to STRS 4.47% 0.00% 4.47% 0.00% OPERS and Staff ARP Plans: Alternative Retirement Plan OPERS Defined Benefit Plan OPERS Defined Contribution OPERS Combined Plan Employee Contribution 10.00% 10.00% 10.00% 10.00% University Contribution 11.56% 14.00% 12.00%* 12.00%* Total Contribution to Employee Plan 21.56% 24.00% 22.00% 22.00% University Mitigating Rate Contribution to STRS 2.44% 0.00% 2.00%** 2.00%** *For the OPERS Defined Contribution Plan, a portion of the university contribution is credited to a Retiree Medical Account as specified in the plan document and OPERS rules. **The mitigating rate for the OPERS Defined Contribution Plan and OPERS Combined Plan is scheduled to increase to 2.44% in 2019
80

81 9 Capital Improvement Plan & Deferred Maintenance 9.1 CIP Process Overview The University s Capital Improvement Plan is a multi-year planning tool used to illustrate the University s project priorities. Each year Ohio University engages in a collaborative process to review and prioritize the capital needs across the institution. Every year the university updates the annual capital improvement plan. Every other year the university submits a six year capital improvement plan which includes a review of annual and biennium needs in preparation for priorities for State Capital Appropriation Submission. Every year, the plans review available fund sources collectively, reviewing capacity and affordability within the context of the entire University budget. Updating the CIP is a collaborative process, which begins in the fall where meetings with leadership from every unit across the campus are held to review the past, current, and anticipated future capital needs. The feedback from these discussions includes the unit s prioritization for future needs which are analyzed, filtered, and reviewed for capacity, affordability, and project timing by the Capital Planning Team. Upon a unit s submission of their capital priorities, a number of steps are taken for a project to be included in the updated annual or six year CIP. These include deferred maintenance prioritization, programmatic impact, funding affordability, debt capacity, and swing space availability. A series of meetings throughout the year include vetting and feedback from each unit as well as with groups such as Facilities Planning and Advisory Council (FPAC) and Academic Leadership (Deans). The Capital Funding and Priorities Committee (CFPC) reviews the CIP throughout the process and approves prior to submission to the Board of Trustees for final approval.
82 9.2 Foundation of Planning Ohio University utilizes comprehensive planning and analysis to provide data informed decision making to support capital project prioritization and validation. These efforts provide the foundation for project inclusion in our Capital Improvement Plans. FY19-FY24 Six Year Capital Improvement Plan: Completed and approved June 2017 The Six Year Capital Improvement Plan is a multi-year planning tool used to illustrate the University s project priorities. The six year plan update process includes collaboration and analysis of funding affordability and project achievability. Campus Comprehensive Master Plan 2016: Completed and approved March 2016 The Comprehensive Master Plan provides a long-term vision with a look at near term needs to provide guidance for the execution of OHIO s CIP and related capital investments. It ensures that the construction and placement of buildings, utilities, transportation, and other infrastructure components support the University s mission and academic plans. These projects often involve a multi-year implementation process that is reliant upon swing space, funding feasibility, relocations, and synergies with other capital projects. Utility Master Plan and Investments: Completed and approved June 2017 While the Comprehensive Master Plan guides the visible environment, the Utility Master Plan provides the framework for the unseen systems that are key in making the system work. The Utility Master Plan effort provides the basis for the investment and prioritization of energy, and related building, system investments on the campus. In June 2014, the BOT approved an Energy Infrastructure Project (EIP) initiative, which consisted of a series of projects with an estimated total cost of $79.0M. This initiative includes the development of a utility master plan, intended to provide the Ohio University (OU) campus in Athens, Ohio with a long range vision for efficient and reliable utility generation and delivery, as well as effective energy conservation measures. The master plan outlines a strategy to provide the capacity to serve needs identified in the master plan as well as to provide service to buildings not currently on central plant. Building Condition Assessments: Database completed December 2016, continuous updating In December of 2015 Ohio University took a deeper dive into building condition understanding. OHIO contracted with a third party company to conduct facility condition assessment surveys for facilities on the Athens and Regional campuses to identify levels of deferred maintenance with intent of informing deferred maintenance priorities and tracking the impact of funding decisions on the deferred maintenance backlog. Facility condition assessment surveys are periodic inspections of buildings (property, plant, and equipment) to determine condition and estimated cost to correct any deficiencies. The third party assessments were completed during the spring of 2016 and the results inform prioritization of the University's capital improvement plan; enable the University to track the overall deferred maintenance backlog; and analyze the impact funding decisions are having on the age profile and condition of campus buildings. To keep the data current, Ohio University utilizes an in-house team, directed by the Chief Facility Officer involving the teams within Facilities Management and Architectural Design and Construction, to assess 20% of the facility inventory on an annual basis to ensure that deferred maintenance data is current. Debt and Resource Planning Debt is a limited resource available to the University to finance facility and infrastructure projects. The University has been leveraging external debt to fund capital improvements and currently has an estimated $50.0-$100.0M debt capacity at its current Aa3 rating level or $150.0-$200.0M at a lower A1 rating level. Affordability is evaluated annually to determine the amount of debt that can be used to fund capital projects. The University s Treasury Management office actively manages liquidity, the Internal Bank, Century Bond program, debt compliance and reporting, annual analysis and market timing. See Section 7 for details regarding Treasury and Debt Management.
83 Centralizing Project Information: Completed and in place (April 2018) The University designed and built a Capital Improvement Plan Database to help manage our capital planning and decision making over time. This database allows for significantly improved reporting and analysis and links our planning processes to our capital project execution. The implementation of the database enabled our teams to spend far less time with manual creation of information and more time on analysis. 9.3 CIP Progress and Updates The most recent University capital plans are the six-year (FY19-FY24) and annual plan (FY18) which were submitted and approved by the Board of Trustees in June of These included a comprehensive look at the projects the University would like to move forward with, should funding be affordable. Additionally, the FY19-FY24 Six Year CIP included Ohio University s FY19-FY20 State Capital Appropriation priorities. Upon receipt of State Guidelines, the university refined priorities and submitted through the State process for allocations. Ohio University received $26.7M. The Governor signed the bill in 2018 and we anticipate to begin drawing against these allocations this summer for the approved projects. The State of Ohio funds capital projects and renewals on a biennial basis (opposite year of state operating budget) and requests submissions from both Institutional and Non-Institutional agencies each Fall of odd years. The University has made significant investment in projects to address deferred maintenance, both planned and unplanned. The Century Bond funding, now in its fifth year, as well as past State Appropriations have enabled reductions in the university s deferred maintenance backlog. Several investments were also made in major capital projects, providing programmatic impact, and in utility projects prioritized from the Comprehensive and Utility Master Plans. This section provides an update on our progress against the FY19-24 CIP and the embedded FY19-20 State Capital Budget and Century Bond Program. This section details projects in-line to be executed in FY19 under that plan, and changes being considered as we evaluate new information and priorities. At this time we are not presenting a new FY19 Capital Plan; but rather, executing against the existing plan and presenting current dialogue about changes. The annual plan for the University provides a near term look at projects anticipated to move forward over the next year. Included within the approved FY19-FY24 CIP was a snapshot of proposed projects for FY19. Over the past year, Ohio University has been reviewing and adjusting priorities. This process includes Reviewing FY18 annual projects to determined which have already moved forward and which are scheduled to begin in FY19 Reviewing the remaining FY19 projected projects to determine if these projects are still the highest priority for the university Reviewing newly identified project priorities Reviewing university financial projections and cashflows to determine affordability and capacity to execute against the CIP
84 Ohio University annually updates the capital improvement plan to ensure various factors and changes are considered. Examples include: Operating budget forecasts: reviewing changes to unit budget projections that may affect affordability of capital projects Presidential Pathways and Priorities: Impact of prioritization of programs and investments that enable movement on key university strategies Cooperative opportunities with City/County: impact of opportunities to work a with our community partners to leverage funding and advance project with mutual benefits or dependencies In depth studies: impacts of additional information from focused studies that provide a deeper understanding of project needs and strategies Deferred Maintenance/Failures and Facilities Assessments which may inform shifts in priorities Complex relationships and dependencies between projects that may impact project schedules and budgets Projects in Progress: newly identified information identified as projects are executed that impact schedules, budget, and scope Construction Climate: impacts of current economy on budget forecasts and access to work force Preventative Maintenance Strategy: shifting focus to begin focusing some investment on preventive maintenance to reduce acceleration of deferred maintenance and more effectivly manage long-term costs FY19 Annual Update With consideration for the above factors, we have spent the past year analyzing and updating our FY19 capital plan. Many of the projects included as FY19 Projects in the FY19-FY24 Six Year CIP approved last June (2017) continue to be prioritized for execution. Many of these projects were focused on: Key infrastructure investments: utility tunnel rehabilitation, campus steam repairs MEP (Mechanical, Electrical, & Plumbing) Building envelope such as roofs and window replacement With additional more focused studies providing new or updated information, we are now in the process of analyzing new projects against those previously prioritized and considering these in the context of the resources and cashflows available to support both our operating and capital plans. Examples of new studies or newly identified program needs that have emerged as additional priorities include: College of Fine Arts (COFA) Facility which studied the primary COFA facilities and identified key investments needed to support accreditation, modernization (upgrading of existing facilities with systems or requirements that were not necessarily failing but which are inadequate to service the functions within the space) and create implementable project scope strategies Weekly in-depth facility assessments of our individual buildings throughout campus that identify additional deferred maintenance priority needs such as masonry failure issues Academic and Student Support needs which continually evolve to meet changing pedagogy and university needs Changing Athens campus enrollment assumptions which impact analysis of number of beds needed to support residential students With over $497 million of facility deferred maintenance and $101 million of utility system deferred maintenance (assessed in the Utility Master Plan), the needs of our physical plant significantly exceed our capacity to invest - from not only a financial perspective, but also the availability of swing space and impact to campus operations.
85 As we work with University Leadership and the campus community to prioritize and time our investments, collectively we are evaluating: Program Priorities: investments required to support department accreditations, development of new programs, and to the meet the pedagogical expectations of our students Deferred Maintenance Prioritization: what buildings and buildings systems deficiencies pose the greatest risk for failure (or are currently failing) or are identified as potential life, safety, or environmental risks Cash Flows: the universities capacity to support the cashflows associated with capital project expenditures as well as our operating budget needs while preserving prudent reserve levels as identified by the Board of Trustees Utility & Infrastructure: investments required in existing energy distribution systems for improved reliability and efficiency while complying with policies regarding sustainability and stewardship. Additionally, investments in campus hardscape such as pedestrian and vehicular pathways and other infrastructure elements need to be considered. 9.4 Draft FY19 Priorities Because we are still involved in university discussions regarding elements discussed in section 1.3, we are not yet able to present a comprehensive final FY19 Capital Plan. Below we are summarizing a significant portion of the plan and where we currently have things reviewed and prioritized. Projects that have been approved are currently in progress that will continue to be executed in FY19: Academic/Programmatic Auxiliaries 29 Park Place & Carriage House Renovation Adams Hall Waterproofing Academic Relocations - Konneker Alumni Center Bob Wren Stadium Artificial Turf Academic Relocations - Lindley Bryan Hall Bathroom Upgrades Administrative Relocations - Lasher Convocation Center Scoreboard Business Annex 2nd Floor Renovation East Green Building Based Domestic Hot Water Systems C-Suite Renovation Gam Bathroom Upgrades Chemistry Building (Clippinger Renovation Phase I) James Hall Masonry Repairs Ellis Hall Infrastructure Renewal Jefferson Hall Dining & Residence Renovations Facility Site Improvements - HCOM Phase I Mill Street Round Park Reclaim Grover Center E303 Conference Room Renovation Obstruction Removal Grover Center W115 Renovation Parking Master Plan Improvements Grover Center W313 Cabinet Update Pickering Bathroom Upgrades Grover Center W320 Faculty Office Conversion RD Apartment Renovation - Crawford HCOM Phase 1: Academic and Clinical Research Rehabilitate Taxiway A HCOM Phase I Utilities Residence Hall Fire Panel Replacements Innovation Center Rooms 211 & 215 South Pole Repurpose Ridges Building 13/14/18 Renovation Tiffin Hall Bathroom Upgrades Ridges Parking Lot, Site Improvements & Building 20 Demo Tiffin/Perkins Roof Rehabilitation Russ Research Opportunity Center Washington Water / Bathroom Upgrades Stocker Room 264 Improvements The Perry and Sandy Sook Academic Center Walter Hall Classroom Improvements WOUB & WOUC Capital Projects
86 Building Systems & Infrastructure OIT Aquatic Center Roof Repair Fiber Cable Installation Botanical Research Greenhouse Upgrades Campus Fire Alarm Reporting Upgrades Regional Higher Education Capital Project Studies Chillicothe Campus Academic Success Center Phase I Chubb Hall East Entry Stair Replacement Chillicothe Campus Bennett Hall Cooling Tower Structural Repair Clippinger 301 Electric Outlet Chillicothe Campus Bennett Hall Electrical Upgrade - Phase I Computer Service Center Roof Repair Eastern Campus Campus Site Improvements Copeland Hall Roof Replacement Eastern Campus Shannon Hall Electrical System Repairs Cutler Hall Electrical Systems Upgrade Eastern Campus Shannon Hall Parking Lot Repairs Exterior Masonry Repairs FY19-FY24 Eastern Campus Shannon Hall Site Infrastructure Repairs Fire Panel Replacement Phase I Lancaster Campus Brasee Hall Carpet 2 & 4 Glidden Hall Compressor Replacement Lancaster Campus Brasee Hall Exterior Repairs Glidden Hall Concrete Work Lancaster Campus Brasee Hall HVAC Improvements Glidden Room 400Recital HVAC Lancaster Campus Brasee Hall Interior Renovations Innovation Center Roof Lancaster Campus Brasee Hall Roof Replacement and Repairs Kantner Masonry Repairs Lancaster Campus Brasee Hall Structural Engineering Evaluation Lausche Plant Compressed Air Replacement 2018 Lancaster Campus Herrold HVAC Improvements Lot 20 Retaining Wall Southern Campus Energy Efficiency Improvements Phase II Old Heating Plant Parapet Wall Repairs Southern Campus Hanging Rock CDC Sanitary Sewer Ping Center Settlement Remediation Southern Campus Horse Park Outdoor Arena Porter Hall Masonry Stabilization and Repairs Southern Campus Ironton Memorial Walk Richland Sidewalks Southern Campus Proctorville Center Flag Pole and Plaza Ridges Building 20 Storage Tank Removal Southern Campus Site Lighting Upgrades Ridges Building 32 Roof Replacement Southern Campus Walking Path / Hiking Trails Ridges Building 33 New Circuit Zanesville Campus Herrold Hall 2nd Floor Nursing Lab Renovation Ridges Building 7 Exterior Wall Stabilization Zanesville Campus Littick Hall Gym Floor Repair 2018 RTEC Roof Replacement Zanesville Campus Roadway & Parking Improvements Phase II RTV Drinking Fountain Replacements Zanesville Campus South Entrance Steps Replacements Southeastern Library Envelope Improvements Tree Trimming US33 Student Affairs Walter Hall Air Handler Replace Heat Coils Shively Dining Hall Improvements Utility System Upgrades Chilled Water Plant #3 Chilled Water Utility Distribution Campus Electric Load Balance Campus Steam System Repairs 2018 Lausche Switchyard Storm Sewer Temporary Campus Boilers West Green Chiller 3 Conversion West Green Chilled Water Pump System Repairs Steam Permanent Boiler Project University Initiatives ADA Prioritized Restroom Improvements ADA Transition Plan Treudley Secondary Egress Total Project Budgets: $337.2M
87 Projects that were included and approved in the FY18 capital plan for which the start date was delayed and that are now on course to be executed in FY19: Academic/Programmatic Alden Library Future Phase Study Auxiliary Offices Relocation/Renovation Classroom Sandbox College of Business Programmatic Study Auxiliaries Maintenance Hangar Improvements South Green, Convocation Center and Baker Garages Lighting Updates Zero Hangar Improvements Building Systems & Infrastructure Stocker Building Envelope Regional Higher Education Lancaster Campus Fire Alarm Systems Replacement Southern Campus Accessibility Improvements Zanesville Campus Roadway & Parking Improvements Phase I Utility System Upgrades Electric - Fault Locators and Distribution Re-Fusing Steam - Balance of Plant and Controls - Lausche (Phase 1) Steam - Miscellaneous Energy Conservation Projects Total Project Budgets: $7.2M Projects that were included and approved in the FY19 capital plan within our FY19-FY24 CIP that we still anticipate moving forward with in FY19 (projects in excess of $500k will be brought forward for Board approvals): Auxiliaries University Initiatives Athens Campus Parking Lot 127 and 128 Maintenance 2018 Athens Wayfinding Design & Program Bromley Infrastructure Improvements Parking Lot Maintenance Building Systems & Infrastructure Utility System Upgrades Morton Hall Chiller Seigfred Chilled Water Connection Ridges Building 33 Roof, Walls and Windows Campus Steam System Repairs 2019 Stocker Hall HVAC Phase 1 Utility Tunnel Rehabilitation OIT Business Application Services Customer Services Information Infrastructure Information Security Instructional and Research Technologies Regional Higher Education Chillicothe Campus Bennett Hall Exterior Repairs / Improvements Eastern Campus Health Education Center Roof Replacement Lancaster Campus Energy Efficiency Improvements Phase I Southern Campus Energy Efficiency Improvements Phase III Southern Campus Security & Accessibility Improvements Zanesville Campus Herrold Hall Infrastructure and Interior Improvements Student Affairs Central Food Facilities Improvements Maintenance/Large Equipment Purchases 2019 Total Project Budgets: $72.9M
88 Several FY19 projects in the FY19-FY24 Six Year CIP were assessed and either cancelled, postponed to a future fiscal year, or on hold until project strategy, funding, and scope are further refined: Cancelled Academic / Programmatic Academic Relocations - Hudson Auxiliaries Cafe Bibliotech & Alden Cafe Improvements Dining Hall Facility Maintenance Enforcement Equipment Upgrades Minor Renovation Projects Parking Meter Upgrades Residence Hall Carpet Replacement 2019 Sargent & James Roof Rehabilitation Total Project Budgets: $2.7M Postponed Auxiliaries Rehabilitate Aprons A, B and F Sargent Hall Renovations Building Systems & Infrastructure Glidden Hall HVAC Total Project Budgets: $7.6M On Hold Academic / Programmatic College of Business Expansion Regional Higher Education Dublin Project Planning Study Auxiliaries Housing Development Phase II Scott Quad Window Replacement Total Project Budgets: $137.7M A few FY19 projects in the Six Year CIP were reviewed as needing additional scope, and subsequently additional funding. Funding was able to be set aside through project priority changes and executed project residuals. Academic / Programmatic Athena Theatre Backstage Renovation Building Systems & Infrastructure Chubb Hall and Sing Tao Roof Replacement Lindley Hall Roof Total Project Budgets: $1.9M (Included increase amounts that equate to $1.1M)
89 A few FY19 projects in the Six Year CIP were reviewed as needing to be implemented sooner rather than later. To accomplish this, campus units re-prioritized these projects and pushed other projects into future years. Auxiliaries Convocation Center Restroom Renovations Perkins Hall Renovations Building Systems & Infrastructure Konneker Research Windows & HVAC Child Development Center HVAC Controls Regional Higher Education Chillicothe Campus Bennett Hall Elevator Replacement Eastern Campus Health Education Center Chiller Replacement Southern Campus Parking Lot and Site Improvements Southern Campus Student Resource Commons Phase I Total Project Budgets: $10.9M Several emerging projects we anticipate moving forward with funding was able to be set aside through project priority changes and executed project residuals. Academic / Programmatic Seigfred Hall Renovations Phase II (Portion) Ridges Building 37 Improvements Jennings House Envelope Repair and Exterior Paint Building Systems & Infrastructure Alden Air Handler Athens Campus Street Repair 2018 Bicentennial Park Crosswalk Convocation Center Concrete Copeland Windows In House Masonry Richland Pull Off for Buses Ridges Priority Road Repair Scripps Window Painting Hudson Exterior Painting Campus Electronic Door Accesses Athens Campus Road Restoration - Mill & Overlay OHIO 2018 Paving Project Regional Higher Education Eastern Campus Shannon Hall Lab 20 and 30 HVAC Lancaster Campus Art Gallery Improvements Lancaster Campus Infrastructure Improvements - Site Paving/Sidewalks Lancaster Campus Pickerington Center Roof Replacement and Repairs Southern Campus Interior Lighting Zanesville Campus Littick Hall HVAC Improvements Total Project Budgets: $22.9M University leadership will continue conversations around additional emerging priorities, evaluating needs within the context of the Six Year CIP and the update process for FY21-FY26.
90 Exhibit A: FY19 Century Bond Cashflows Century Bond Allotment Academic/Programmatic Building Systems & Infrastructure University Initiatives Utility System Upgrades Total CB15 59,905 1,570,171 1,630,076 Capital Project Studies 24,928 24,928 Convocation Center Concrete 600, ,000 Lindley Hall Roof 635, ,000 Ridges Building 7 Exterior Wall Stabilization 150, ,000 The Perry and Sandy Sook Academic Center 59,905 59,905 Ridges District Cooling Tower Replacement 160, ,243 CB16 1,647,028 1,647,028 Capital Project Studies 56,872 56,872 Fire Panel Replacement Phase I 60,970 60,970 Glidden Room 400Recital HVAC In House Masonry 250, ,000 Innovation Center Roof 731, ,234 Konneker Research Windows & HVAC 458, ,000 Scripps Window Painting 89,000 89,000 CB17 1,290, ,566 31,302 2,095,816 ADA Transition Plan 28,014 28,014 Alden Air Handler 89,000 89,000 Athens Campus Road Restoration - Mill & Overlay 21,991 21,991 Chubb Hall East Entry Stair Replacement 180, ,216 Computer Service Center Roof Repair 34,355 34,355 Copeland Hall Roof Replacement 22,791 22,791 Ellis Hall Infrastructure Renewal 330, ,947 Glidden Hall Concrete Work 105, ,000 Hudson Exterior Painting 60,000 60,000 Kantner Masonry Repairs 55,919 55,919 OHIO 2018 Paving Project 50,000 50,000 Porter Hall Masonry Stabilization and Repairs 11,684 11,684 RTEC Roof Replacement 6,635 6,635 RTV Drinking Fountain Replacements 97,438 97,438 Seigfred Hall Renovations Phase II 960, ,000 Tree Trimming US33 38,537 38,537 ADA Prioritized Restroom Improvements 3,288 3,288 CB18 4,291,442 2,588,997 6,880,439 Administrative Relocations - Lasher 50,000 50,000 Administrative Relocations - Ridges Building 37 Improvements 1,000,000 1,000,000 Annual Emergency Projects Fund , ,834 Chemistry Building (Clippinger Renovation Strategy Phase I) 191, ,442 Copeland Windows 100, ,000 Glidden Hall Compressor Replacement 155, ,468 Jennings House Envelope Repair and Exterior Paint 250, ,000 Lot 20 Retaining Wall 56,068 56,068 Old Heating Plant Parapet Wall Repairs 9,627 9,627 Ping Center Settlement Remediation 681, ,000 Ridges Building 33 Roof, Walls and Windows 500, ,000 Ridges Building 7 Exterior Wall Stabilization 130, ,000 Ridges Priority Road Repair 195, ,150 Seigfred Hall Renovations Phase II 2,800,000 2,800,000 Stocker Building Envelope 574, ,850 CB19 700,000 1,265,485 54,773 2,020,258 ADA ,000 25,000 ADA Transition Plan 29,773 29,773 Annual Emergency Projects Fund , ,000 Chubb Hall and Sing Tao Roof Replacement 13,000 13,000 Morton Hall Chiller 150, ,000 Seigfred Hall Renovations Phase II 700, ,000 Utility Tunnel Rehabilitation 287, ,485 CBCL 5,548,151 5,548,151 Chemistry Building (Clippinger Renovation Strategy Phase I) 5,548,151 5,548,151 EIP1 1,495,316 13, ,217 2,442,768 EIP - Campus Electric Load Balance 289, ,052 EIP - Lausche Switchyard Storm Sewer 471, ,343 EIP - Temporary Campus Boilers 17,157 17,157 EIP - West Green Chilled Water Pump System Repairs 70,611 70,611 Electric - Fault Locators and Distribution Re-Fusing 86,054 86,054 HCOM Phase I Utilities 1,495,316 1,495,316 Lausche Plant Compressed Air Replacement ,235 13,235 EIP2 2,057,273 2,057,273 Chilled Water - Seigfred Chilled Water Connection 703, ,459 Chilled Water Plant #3 540, ,026 Chilled Water Utility Distribution 289, ,836 EIP - Campus Steam System Repairs , ,255 EIP - West Green Chilled Water Plant Chiller 3 Conversion 386, ,697 EIP3 2,282,333 2,282,333 Chilled Water Plant #3 138, ,459 Chilled Water Utility Distribution 1,393,874 1,393,874 EIP - Campus Steam System Repairs , ,000 Total 13,385,761 7,858,482 86,075 5,273,823 26,604,142
91 Exhibit B: Past & Planned Century Bond Expenditures Expenditures by Fiscal Year Century Bond Allotment Actuals Forecasted Total CB15 2,832,126 2,453,005 2,146, ,451 1,630,076 9,999,962 Backflow Preventer Inspection & Repairs 148, ,955 Baker University Center Lighting Upgrades 238, ,253 Bird Arena Deferred Maintenance Repairs 81,967 20, ,831 Bird Arena Ice Rink Pumping 114, ,698 Capital Project Studies 58,390 24,928 83,318 College Green Window Replacement (Cutler/Wilson) 18, ,309 73, ,451 College of Communications Renovation Phase II 307, , ,000 Computer Service Center AHU 1 & 2 Replacements 16, ,200 5, ,653 Convocation Center Concrete 600, ,000 Cutler Hall Exterior Improvements 3, ,819 East / South Green Infrastructure (Housing Ph 1) 437, ,934 Ellis Hall Water Remediation 81, , ,576 Facility Assessments 756, , ,282 Glidden Room 400Recital HVAC 28,745 3,958 17,298 50,001 Lasher Hall Roof Replacement 78,554 67, ,483 Lausche Chilled Water Pumping Diagnostics 40,006 73,494 36,980 24, ,000 Lindley Hall Final Billings / Additional Work 645, , ,515-1,189,757 Lindley Hall Roof 635, ,000 North McKinley Drive Extension 177, , ,000 Peden Chiller Replacement 10,029 10,029 Ping Center Drinking Fountain Replacement 81,627 81,627 Ridges Building 7 Exterior Wall Stabilization 150, ,000 Ridges District Cooling Tower Replacement 43, , ,294 RIDGES KONNEKER WATERPROOFING 28,293 28,293 Scott Quad/Botanical Research Generator 261, ,040 33, ,000 Stocker Center Sprinkler Replacement 1,708, , ,610 19,400 2,163,746 The Perry and Sandy Sook Academic Center 40,057 59,905 99,962 CB16 1,931,345 3,394,981 3,021,008 1,647,028 9,994,362 Alden Chilled Water Planning 9,000 7,000 16,000 Alden Library Roof Replacement 188, ,642 Aquatic Center Upgrades 12,951 12,951 Athena Theater Backstage Renovation 9,000 9,000 Baker University Center Lighting Upgrades 9,619 4,695-14,314 Bentley Hall Roof Replacement 57,822 8,035 65,857 BINGHAM HOUSE ROOF ,345 25,000 Botanical Research Building Roof Replacement 29,062 13,576 42,638 Campus Fire Alarm Reporting Upgrades 35,000 35,000 Campus Fire Alarm Upgrades 215,461 2,142 9, ,173 Capital Project Studies 56,872 56,872 Clippinger Roof Replacement 118,100 1,167,466 25,538 1,311,104 College of Communications Renovation Phase II 910, ,981 1,065,000 Computer Service Center AHU 1 & 2 Replacements 76,492 7,239 83,731 Computer Service Center Roof / Gutter Repairs 38,155 38,155 Convo Center East Ramp Seal Coat 6,816 49,622 56,438 Cutler 008 Renovation 71,969 71,969 Cutler Hall Exterior Improvements ,577 2, ,808 Fire Panel Replacement Phase I 104, ,021 60, ,000 Glidden Room 400Recital HVAC 71, , ,000 In House Masonry 250, ,000 Innovation Center Roof 168, , ,000 Konneker Research Windows & HVAC 458, ,000 Lausche Electric Yard Sinkhole 173, ,762 38, ,298 Life Sciences Lighting Control 4,050 6,050 10,100 Morton ADA Door/Frame Replacement 182, , ,208 Morton Hall Classroom Improvements 8,344 8,344 Morton Hall Roof Replacement 48, ,852 63, ,040 Old Heating Plant Roof 1, ,772 29, ,000 Ping Center Settlement Remediation - 409, ,000 Richland Avenue Safety Lighting 60, , ,047 Ridges Building 30 Roof Repair 34,400 34,400 Ridges Building 32 Roof Replacement 100, ,000 Ridges Konneker Waterproofing 52,190 52,190 Ridges Storm Water 20,763 20,763 Scott Quad Window Replacement 25,000 25,000 Scripps Window Painting 89,000 89,000 Seigfred Hall Renovations Phase I 127,688 39,374 1,361,938 1,529,000 South Green Drive Culvert Repair 12,260 21,883 34,143 Southeastern Library Warehouse HVAC/Humidty Upgrades 54,008 1,169 55,177
92 Expenditures by Fiscal Year Century Bond Allotment Actuals Forecasted Total CB17 1,745,249 3,378,938 2,095,815 7,220,002 ADA Interior Signage Upgrades 2,473 2,473 ADA Prioritized Door Upgrades - 100, ,000 ADA Prioritized Restroom Improvements - 96,712 3, ,000 ADA Transition Plan 28,014 28,014 Alden Air Handler 89,000 89,000 Aquatic Center Sundeck Roof Replacement 14, , ,000 Athens Campus Road Restoration - Mill & Overlay 21,991 21,991 Chilled Water Pump Maintenance 39,835 52,578 92,413 Chilled Water Refridgerant Monitoring System 9,671 1,072 10,743 Chubb Hall East Entry Stair Replacement 24, , ,000 Computer Service Center Roof Repair 25,645 34,355 60,000 Copeland Hall Roof Replacement 52, ,779 22, ,000 Cutler Retaining Wall Repairs 23, , ,064 Eco House Roof & Woodwork 1,486 28,177 29,663 Ellis Hall Infrastructure Renewal 682, , ,947 1,310,000 Glidden Hall Concrete Work 105, ,000 Hudson Exterior Painting 60,000 60,000 Hudson Health Roof, Cupola and Dormers 4, , ,402 Kantner Masonry Repairs 55,919 55,919 Life Sciences Temporary Steam 105,633 6, ,653 Lindley Hall Roof 12,515 37,485 50,000 OHIO 2018 Paving Project 50,000 50,000 Peden Chiller Replacement 14, , ,690 Peden Stadium Masonry Stabilization and Repairs 181, , ,590 Peden Stadium Seating 16,208 3,305 19,513 Ping Center Settlement Remediation 90, , ,000 Porter Hall Masonry Stabilization and Repairs 112,278 11,038 11, ,000 RTEC Roof Replacement - 43,365 6,635 50,000 RTV Drinking Fountain Replacements 2,462 97,438 99,900 Seigfred Hall Masonry Repairs 13, , ,953 Seigfred Hall Renovations Phase II 231, , ,000 2,020,000 Seigfred Transformer Repair 66,473-66,473 South Green Cooling Tower Repair 72,097 7,903 80,000 Tree Trimming US33 1,463 38,537 40,000 Wilson Hall Exterior Improvements 77 65,471 65,548 CB18 872,311 6,880,439 7,752,750 Administrative Relocations - Lasher 50,000 50,000 Administrative Relocations - Ridges Building 37 Improvements 1,000,000 1,000,000 Annual Emergency Projects Fund , ,834 Chemistry Building (Clippinger Renovation Strategy Phase I) 10, , ,751 Copeland Windows 100, ,000 Glidden Hall Compressor Replacement 19, , ,000 Jennings House Envelope Repair and Exterior Paint 250, ,000 Kantner Hall Structural Masonry 23,430 23,430 Lot 20 Retaining Wall 68,932 56, ,000 Old Heating Plant Parapet Wall Repairs 49,173 9,627 58,800 Ping Center Settlement Remediation 680, ,000 1,361,935 Ridges Building 33 Roof, Walls and Windows 500, ,000 Ridges Building 7 Exterior Wall Stabilization 20, , ,000 Ridges Priority Road Repair 195, ,150 Seigfred Hall Renovations Phase II 2,800,000 2,800,000 Stocker Building Envelope 574, ,850 CB19 2,020,258 2,020,258 ADA ,000 25,000 ADA Transition Plan 29,773 29,773 Annual Emergency Projects Fund , ,000 Chubb Hall and Sing Tao Roof Replacement 13,000 13,000 Morton Hall Chiller 150, ,000 Seigfred Hall Renovations Phase II 700, ,000 Utility Tunnel Rehabilitation 287, ,485 CBCL 128, ,904 5,548,151 5,938,244 Chemistry Building (Clippinger Renovation Strategy Phase I) 128, ,904 5,548,151 5,938,244
93 Expenditures by Fiscal Year Century Bond Allotment Actuals Forecasted Total EIP1 7,295,354 9,390,777 4,563,581 4,550,663 2,442,768 28,243,143 Boiler Permit Consultant 23, ,673 57,946 85, ,000 Campus Electric Load Balance - 10, , ,000 Campus Steam Repairs 288 1,060, ,195 1,439,743 Chiller 2 Replacement 2,169, ,111 30,082 2,368,130 Chiller Refurbishments 10, ,100 COE / COFA Heating District 1,450,909 63,630 1,514,539 Electric - Fault Locators and Distribution Re-Fusing 10,083 86,054 96,137 Fuel Farm Replacement 1,141,889 66,588 51,522 1,259,999 Gas Line Upgrades 3,072,198 75,615 7,317 3,155,130 HCOM Phase I Utilities 569,628 1,495,316 2,064,944 Heating Plant Replacement 417, ,231 Lausche Plant Compressed Air Replacement ,765 13, ,000 Lausche Switchyard Storm Sewer - 128, , ,000 OU Direct Costs 12,202 32, ,832 Ping Steam Replacement 295, ,129 1,198,139 Steam - Permanent Boiler Project 528,384 2,946,069 2,245,787 5,720,240 Steam - UMP/CIP/CMP Coordination 51,120 51,120 Steam Distribution System Repairs 547, , ,846 1,548,710 Temporary Campus Boilers 91,914 2,899, , ,644 17,157 3,899,999 Utility Master Plan 652, ,548 31,433 78,711 1,100,000 Walter Fieldhouse Solar Panel Study 3,150 3,150 West Green Chilled Water Pump System Repairs 9,579 75, ,842 70,611 1,000,000 EIP2 2,110,520 6,482,978 10,624,886 2,057,273 21,275,657 Athens Campus Utility Metering 125, , , ,001 Campus Steam System Repairs , ,223 1,332,611 Campus Steam System Repairs ,362, ,255 1,500,000 Chilled Water - Seigfred Chilled Water Connection 59, , ,554 Chilled Water Plant #3 39, , , ,743 Chilled Water Utility Distribution 436, , ,992 Chubb Hall Chiller Replacement 692,132 37, ,545 College Green Upgrades (Campus Gate) 450, ,000 Copeland Hall Chiller Replacement 625,160 67, ,958 Ellis Hall Chiller Replacement 632,411 85, ,207 FY 2017 Technical Consultation 133,440 65, ,228 Lausche Center PL NRG Metering 16,429 7,191 23,620 Lausche Perimeter Fence 98,500 98,500 Lausche Security Cameras 12,241 51,723 63,964 Ping Center Chilled Water Connection 18, , ,417 1,050,000 Steam - Permanent Boiler Project 4,354,539 6,925,221-11,279,760 West Green Chilled Water Plant Chiller 3 Conversion 10, , ,974 EIP3 2,400 2,282,333 2,284,733 Campus Steam System Repairs , ,000 Chilled Water Plant #3 138, ,459 Chilled Water Utility Distribution 2,400 1,393,874 1,396,274 Total 10,127,480 15,885,647 18,461,282 23,650,561 26,604,141 94,729,111
94
95 10 Strategic Opportunity Reserve With an eye toward growth and sustainability for future goals, the University introduced the Strategic Opportunity Reserve in FY12. The Strategic Opportunity Reserve targets areas of investment that will help preserve the quality of the institution, while maintaining a strong financial position. This approach is achievable through the use of unallocated resources and focuses on positioning the University for future success during a period in which the sustainability of the Higher Education Business Model is being questioned Funding Sources Resources to support this Strategic Opportunity Reserve come largely from unallocated University resources. The University budgets to allocate only 98% of SSI and Tuition revenues. The 2% remaining is used as a buffer against inyear variability, and funds the Strategic Opportunity Reserve only when it is earned. Investment Returns on working capital are not budgeted, but rather used to fund the Strategic Opportunity Reserve and capitalize the Internal Bank only after they are earned (both realized and unrealized gains). This reduces institutional sensitivity and risk associated in economic downturns or investment portfolio losses, similar to events in In FY19, University Leadership recommends using $3.0M in one-time-only investment earnings to help support the Academic planning units as they incrementally realign their budgets consistent, an initiative that began in FY18. The estimated balance in the Strategic Opportunity Reserve at June 30, 2018 is $24.6M Areas of Investment The funding reserved for the Strategic Opportunity Reserve has been targeted to fund initiatives focused in six areas: Infrastructure Capital investments will be made to support deferred maintenance, OIT systems, and to facilitate transformational projects within our Capital plan. Community and Economic Development Investments will focus on partnerships within our region that aid in academic experience, career opportunities, and quality of life. Specific areas of need include community-based healthcare; K-12 educational opportunities; affordable housing options; economic development; community-based arts and culture. Student Success and Programs Investments will focus on the following areas: implementing a plan of residential programs and services committed to helping student fulfill their academic promise; fostering academic success and degree completion; and developing an outstanding student community experience. Academic and Research Programs Investments are targeted towards the initiation of new academic programs within colleges that are economically viable and can create net resources to support college priorities. This represents investment capital for colleges to pursue new opportunities, and is an important incentive for colleges within RCM. The Innovation Strategy will provide proposal-driven investments for the full spectrum of the University s activities including teaching and learning, research and scholarship, creative activity, and the operational functions of the University. It also aims to incentivize and leverage interdisciplinary and multi-college collaboration. The first Innovation Strategy awards were announced in January 2016, with five teams of Ohio University faculty and staff receiving planning grants up to $20,000 each. The first major awards were then announced in February 2016 when the Innovation Strategy program awarded $4M to four faculty and staff teams for new research and teaching initiatives focused on the shale industry, osteoporosis diagnosis, immersive media and instructional innovation.
96 Strategic Pathways & Presidential Priorities During his first year as President of Ohio University, Dr. Nellis in collaboration with diverse voices of those who represent OHIO developed strategic pathways to enhance Ohio University s standing as a leading-edge public research university. The strategic pathways, detailed below, will be supported initially with Strategic Opportunity Reserve established for Presidential Priorities: Become a National Leader for Diversity & Inclusion Enhance the Overall Academic Quality of the University Build a University Engagement Ecosystem Become a Place Where Dialogue and Rigorous, Civil Debate are Institutional Hallmarks Noteworthy investments funded within the six primary areas of focus include: Presidential Priorities & Strategic Pathways Forecast Projection Projection Projection Investment FY18 FY19 FY20 FY21 Diversity & Inclusion $0.6 $0.6 $0.6 Honors Program University Engagement Global Engagement Efforts Graduate Student Stipends Minute Lecture Series 0.0 Strategic Communications 0.1 Upward Bound 0.1 Title IX Investment Unallocated Presidential Priorities & Strategic Pathways $0.2 $5.5 $5.5 $5.5 With the arrival of President Nellis, we set aside $1.5M per year as one time annual support to insure we had budgeted for some level of financial support for his transition into Ohio University. With the Investiture of President Nellis and announcement of the Presidential Pathways and Priorities, we added $4M/ year one time support to provide initial investments and create a glide path to the Operating Budget being able to absorb/adjust to support these investments. As specific investments have been identified, we have moved the funding from unallocated into lines for those priorities/pathways. Since all of the investments to-date impact Base Budget increases with (with the exception of the Title IX office), in future years we will have to transition them into the base operating budget of the campus and out of SOR. For example, the total strategic pathway commitment for Diversity & Inclusion was $750K. For FY19, we incorporated the maximum amount into our base budget by utilizing an unallocated $200K of Allocated Cost base increases, with the remaining $550K to be supported by SOR. Endowed Scholarships This area of investment will ensure the University can make substantive, long-term investments in student scholarships. The scholarships include both need-based and merit-based Student Financial Aid that will help address student affordability concerns and the University s ability to recruit top quality students. The goal is to increase the endowment by $125M through incentivizing fundraising with a University match. If the $125M goal is met, the
97 annual distribution will support Student Financial Aid. Matching funding from the Strategic Opportunity Reserve will occur concurrent with receipt of respective donor raised funds. In the financial projection below (Section 10.3), Endowed Scholarships are grouped with Student Success and Programs. Section provides additional detail about the OHIO Match endowed scholarship program. Engineering Start-Up Investments in the Russ College of Engineering will provide start-up costs for new research faculty who were recently recruited to Ohio University. Strategic Opportunity Reserve funding will provide the required one-time investments in the research equipment and start-up packages that resulted from the large number of retirements within the Engineering College in RHE Business Model Investments in the Regional Higher Education Budget Model will provide funding that allows Ohio University to reimagine the role of Regional Campuses given dynamic changes in student enrollments and the state s emphasis on increasing post-secondary enrollments, known as College Credit Plus. Athens Campus Structural Imbalance The $2.6M represents that portion of the FY19 operating imbalance that has not yet been solved for. Financial Systems Enhancements System and process initiatives to enable new functionality and improve HR, payroll, accounting, and financial reporting across the university. TechGrowth OHIO Match commitment supporting Ohio Third Frontier program; building a regional platform for business generation and job creation; aligning resources to accelerate commercialization. OHIO for Ohio Envisioning our campuses as platforms that expedite finding solutions to real world problems and developing new approaches to delivery of education programs while providing outlets to OHIO's creativity in support of our public role and mission. MRC Support While the Muskingum Recreation Center ( MRC ) is not currently a component unit consolidated within the Audited Financial Statements of Ohio University, the location of the MRC on the Ohio University-Zanesville campus and the financial structure between Ohio University and the MRC create an essential relationship between the two entities. As the University evaluates the opportunity to leverage the facility for strategic initiatives, we have included a placeholder within the SOR to fund potential investments. Signature Program Expansion of renewable financial aid program with the goals of maximizing net student revenue and achieving institutional enrollment objectives; total cost increase of $12M after 4 cohorts of student in program; cost allocation to colleges being phased-in through use of institutional reserves
98 Innovation Strategy Provides seed funding and incentives for multi-disciplinary projects with the goals of increasing external funding opportunities, attracting and retaining our faculty, and providing opportunities for the development of interdisciplinary program development elearning Investment Positioning OHIO to capitalize on programmatic and revenue growth opportunities, reduce vendor dependencies, and enhance the learning experience of students in existing programs; cost allocation to colleges being phased-in through use of institutional reserves Tantrum Theatre Multi-year commitment to grow theatre program and establish platform for a sustainable business model. OU Press Multi-year institutional support to subsidize operating costs MAC Conference Multi-year institutional commitment to support faculty involvement with MAC conference Athens Campus Structural Imbalance Funding source for structural imbalance after reduction efforts by Administrative, Academic & Auxiliary units; funding source will be identified in future planning efforts International Student Recruitment Incremental investment in the International student recruitment efforts to create and sustain a positive enrollment trend at Ohio University. Expected growth in international enrollments should fund this investment beyond FY20. Advancement Strategy Previous versions of the SOR included funding placeholders for investments to support a ramp-up in our fundraising efforts. We have removed the funding pending review of the Advancement strategy with new leadership and continued analysis of the timing and level of investment required.
99 10.3 Financial Projection Actual Forecast Projection Projection Projection FY17 FY18 FY19 FY20 FY21 Beginning Balance $36.2 $32.3 $24.6 $17.5 $9.5 Funding Investment Income OTO Investment Income 3.0 SSI (2.3) Tuition FY19 Enrollment Adjustment (1.3) (1.3) (1.3) Fund Balance Total - Funding $6.9 $12.3 $14.0 $11.2 $11.2 Actual Forecast Projection Projection Projection Investment Reserve Allocations FY17 FY18 FY19 FY20 FY21 Infrastructure Financial Systems Enhancements Parental Leave Replacement Funding IT Small Projects Bicentennial Park 0.1 Bridge for Admin Reductions 0.5 Infrastructure Subtotal $3.2 $1.7 $1.8 $2.1 $2.1 Community and Ec. Development TechGrowth Ohio - Approved TechGrowth Ohio - Proposed OHIO for Ohio Foundation for Appalachia Ohio MRC Support Community & Ec. Develop Subtotal $2.1 $2.5 $2.7 $5.1 $2.4 Student Success Programs Endowed Scholarships Signature Program Bridge Bobcat Student Orientation Unallocated Student Success Subtotal $2.7 $3.9 $4.0 $1.0 $1.0 Academic and Research Programs Innovation Strategy OBOR Research Portal 0.1 elearning Investment Tantrum Theater* RHE Investment RHE Investment - ERIP 1.4 Engineering Start-up OU Press MAC Faculty Conference Funding for Budget Volatility 3.8 Athens Campus Structural Imbalance International Student Recruitment Academic & Research Subtotal $2.7 $11.8 $7.0 $5.4 $3.2 Presidential Priorities & Strategic Pathways $0.0 $0.2 $5.5 $5.5 $5.5 Total - Reserve Allocations $10.7 $20.1 $21.1 $19.1 $14.2 Ending Balance $32.3 $24.6 $17.5 $9.5 $6.5 * An additional $0.6M of institutional support is budgeted in College of Fine Arts as an additional use of reserves.
100
101 11 Academic Planning Units 11.1 Academic Budget Process Each year, the budget process begins with an October submission of budget projections from all units based on preliminary central planning assumptions to obtain an estimate of the balance between projected revenues and expenses under that hypothetical scenario. With the typically conservative revenue estimates and inclusion of all potential expenses, this scenario produces a large gap that leads to refinement of assumptions and projections to close that gap through the rest of the budget process. In order to ensure that academic strategy was driving financial decisions, an additional series of meetings were held with the Deans of each college in January to consider factors including but not limited to the academic strate gy, mission, and priorities of the colleges and university, enrollment and staffing trends, and the potential for additional revenue, as well as gap-closing proposals and their potential impacts. In parallel with this process across the Academic units, A dministrative units continued with the second year of implementing cuts and reallocations to reduce actual spending by 7 percent over three years while striving to continue to provide academic support services for students, faculty, staff, information tech nology and compliance needs. Central assumptions were refined in January and units updated their projections for a February financial review with each college. February submissions resulted in an overall gap of $15.8M in the proposed FY19 budgets. Given t hat administrative units were already in the second year of a three -year reduction plan and colleges had made some reductions in FY18 as well, the concept of proportionality of reductions between academic and administrative units was proposed by faculty senate and adopted as part of the process to determine where contributions to closing the $15.8M gap would occur. In the 7% reduction plan for administrative units, some units (OIT and Diversity &Inclusion) were excluded. When those units are included, the planned reductions across all administrative units was equivalent to a 5.2% reduction. This 5.2% target was then used as a target for the contribution academic units would make towards the $15.8M gap. Since academic units had already reduced FY18 budgets by $3M in parallel with administrative units during the first year (FY18) of their reduction plan and had closed the revenue to expense gap by an additional $1.3M from the fall to spring submissions, this $4.3M contribution was counted towards the 5.2% ta rget for academic units leaving an additional $8.4M remaining to achieve the proportional 5.2% contribution target for academic units. This $8.4M target was distributed across the colleges based on the information obtained in the January meetings as well as trends in enrollments, staffing and budgets. Targets varied among colleges in recognition of growth in some areas and reduced enrollments in others. Colleges were allowed to achieve this target with a combination of projected revenue increases, reduct ions to planned spending and shifting expenses to other non -operating funding sources. Targets for colleges ranged from 0 to 5 percent, but within colleges will also be distributed in ways that are strategic in advancing the colleges and university s priorities. The first table below summaries the targeted changes to both administrative and academic operating budgets across all four years (FY18 to FY21). Changes to academic budgets are further broken down into the three types of changes described above. Note that the expense reduction line total includes the $1.5M in FY18 and an additional $1.5 that is funded by carry forward in FY19 but becomes a reduction in FY20 so this line includes an additional $3M that is not part of the $8.4M target discussed above.
102 In addition, colleges were allowed to use a bridging strategy to phase changes in across three years in order to minimize the impact on staff and faculty and program quality and are using attrition, reserves, and carry -forward in strategic ways to achieve their target. The goal of these budget planning efforts is to move the university in strategic directions while closing the University s budget gap and providing the institution with a strong, stable, and sustainable financial future. The second table below shows the planned use of carry forward used in colleges and centrally to phase these changes in over the three years. Note that colleges are projected to use $10.6M beyond the $1.5M use previously built into the FY18 budget. Also, if opportunities for new revenue or expense attrition occur faster than planned over the three years, the use of reserves will be lower. Step 1: Proportionality in Establishing Savings Targets Planning Units FY17 Base Savings Target ($) Savings Target (%) Administrative & Central Support Units $ 162,805,723 $ 8,483, % Academic Units - Athens Colleges $ 244,083,185 $ 12,761, % Subtotal $ 406,888,908 $ 21,245, % Step 2: Developing Multi-Year Approach, With Strategic Use of Reserves for Bridge Funding Cumulative Planning Unit - Operating Budget Budget Category FY18 FY19 FY20 FY21 FY22 Savings Administrative & Central Support Units $ 4.8 $ 1.5 $ 2.2 $ - $ - $ 8.5 Academic Units - Athens Colleges $ - $ 0.3 $ 2.0 $ 0.1 $ - $ 2.5 Academic Units - Athens Colleges $ 1.5 $ 3.3 $ 2.0 $ 1.6 $ 1.3 $ 9.7 Academic Units - Athens Colleges $ - $ 0.6 $ - $ - $ - $ 0.6 $ 21.2 Reserves Source FY18 FY19 FY20 FY21 FY22 Cumulative Impact on Reserves (UNR Net Assets) Academic Units - Athens Colleges $ 1.5 $ 7.1 $ 3.0 $ 1.3 $ - $ 12.9 Institutional Reserves* $ 5.8 $ 5.1 $ 5.3 $ 3.9 $ 3.9 $ 24.0 *Institutional Reserves allocations represent bridge funding for RHE through FY20, $1.3M for the Athens enrollment volatility, and $2.6M for the Athens structural deficit. This does not represent all projected reserve use $ 36.9
103 11.2 Academic Narratives As a means of presenting consistent information about the academic Planning Units, the unit heads were asked to respond to some questions as they relate to strategic resource allocation within the colleges and schools. The Planning Units prepared information that highlights things that the colleges do to maximize their resources in addition to simply investing in new things. 1. What strategic resource challenges and opportunities are the college facing in the next fiscal year? 2. What key program/activities/initiatives are you developing or investing in as part of your revenue strategy? 3. What are the key trends/drivers associated with changes in your direct expenditure budget?
104 College of Arts & Sciences FY19 Budgeted Revenues FY19 Budgeted Expenses & Allocations 1,702,021, 1% 40,504, 0% 955,276, 1% 365,142, 0% 4,291,002, 5% 6,790,749, 5% 7,037,690, 9% 35,888,181, 28% State Appropriations Salaries, Wages, & Other Payroll Benefits Tuition, net $128,772,409 Grants & Contracts/F&A $82,309,445 Operating Expenses Private Support 15,860,359, 19% Capital Costs Debt Service Internal & External Sales Capital Cost Allocation 83,436,181, 65% 54,714,749, 67% 350 Five Year Faculty/Staff Headcount Trends FY14 FY15 FY16 FY17 FY18 Administrator Classified Non Bargaining Early Retired Faculty Group I Faculty Group II Faculty Group IV Faculty Year Student Enrollment by Classification 5-Year Athens Undergraduate Credit Hour Production 4,500 4,000 3,500 4,099 4,076 4,068 3,992 4, , , , , , , ,706 3, ,000 2,500 2, ,000 1, ,000 1, ,000 10,246 10,918 11,320 10,650 11, ** ** ** Athens Undergrad Athens Graduate Graduate Outreach **Unit Projections Athens Undergraduate Undergraduate elearning **Unit Projections
105 Arts & Sciences FY15 Actuals FY16 Actuals FY17 Actuals FY18 Budget FY18 Forecast FY19 Budget REVENUES 1 State Appropriations $ 26,266,569 $ 29,037,684 $ 36,578,682 $ 36,007,913 $ 36,007,913 $ 35,888,181 2 State Appropriations - Capital Gross Undergraduate Tuition & Fees 95,162,233 94,004, ,841,826 99,494,865 98,824,180 95,485,880 4 Undergraduate Financial Aid (17,475,736) (17,312,624) (19,253,193) (18,029,748) (17,581,477) (18,017,470) 5 Net Undergraduate Tuition & Fees 77,686,497 76,691,382 81,588,633 81,465,117 81,242,703 77,468,411 6 Gross Graduate Tuition & Fees 13,417,899 13,119,411 12,940,526 13,181,955 13,367,957 14,537,673 7 Graduate Financial Aid (9,096,708) (8,315,705) (8,359,098) (8,567,607) (8,380,262) (8,569,902) 8 Net Graduate Tuition & Fees 4,321,191 4,803,706 4,581,428 4,614,348 4,987,695 5,967,771 9 Room & Board Grants & Contracts 7,115,799 5,348,160 4,940,953 5,924,752 5,321,464 5,249, Facilities & Admin Cost Recovery 1,632,196 1,325,104 1,637,729 1,556,236 1,556,236 1,540, Endowment Distributions 1,039,292 1,113,457 1,133,494 1,249,504 1,249,504 1,364, Gift Contributions 356, ,617 6,248, , , , Investment Income Internal & External Sales 585, ,749 1,177,159 85, , , Total Revenues 119,003, ,173, ,886, ,244, ,607, ,772, Administrative Cost Distribution Subvention Distribution 13,545,024 13,466,932 (1,720,982) (3,430,556) (3,430,556) (3,426,837) 19 Total Revenues & Revenue Allocations $ 132,548,554 $ 132,640,791 $ 136,165,853 $ 127,813,744 $ 128,176,516 $ 125,345, Funding Transfers $ (1,122,247) $ (660,439) $ (1,049,662) $ (733,423) $ (805,467) $ (99,873) EXPENSES 21 Total Salaries, Wages, & Other Payroll 52,660,297 52,324,558 54,754,863 55,424,817 54,379,319 54,714, Total Benefits 14,980,729 15,076,021 15,346,681 15,985,144 15,568,756 15,860, Supplies & Services 5,293,089 4,837,095 5,710,953 4,858,432 5,727,156 5,006, Professional Services 1,395,056 1,303,601 1,642, ,198 1,671,098 1,834, Occupancy & Maintenance 381, , , ,747 91,905 95, Capital Costs 1,822, , , , , , Cost Of Goods Sold External Debt Service - Principal External Debt Service - Interest Internal Principal & Interest 40,597 40,551 40,625 40,522 40,522 40, Depreciation Other Operating Expense 76,702 10,200 63, ,526 89, , Total Direct Expenses 76,650,304 74,534,644 78,705,760 78,973,392 77,966,826 78,018, Administrative Cost Allocations 39,926,460 40,001,220 33,370,386 32,954,092 32,954,092 33,665, Capital Cost Allocation - 2,943,817 3,583,224 3,864,212 3,864,212 4,291, Subvention Allocation 11,755,123 12,472,722 15,828,143 15,525,426 15,474,639 15,149, Total Expenses & Expense Allocations $ 128,331,887 $ 129,952,403 $ 131,487,513 $ 131,317,122 $ 130,259,769 $ 131,124, Results of Operations $ 5,338,914 $ 3,348,828 $ 5,728,002 $ (2,769,956) $ (1,277,786) $ (5,679,239) INVESTMENT TRANSFERS 39 Transfer To (From) Operating Reserve (2,769,958) (3,176,823) (5,679,240) 40 Transfer To (From) Plant Fund 499,181 1,048, , Transfer To (From) Quasi Endowments 675,000 25,000 6,050, Repair & Replacement Transfers Internal Bank Transfers Other Transfers (46,506) 36,193 75, Total Investment Transfers $ 1,127,676 $ 1,109,819 $ 6,728,746 $ (2,769,958) $ (3,176,823) $ (5,679,240) 46 Net Results $ 4,211,239 $ 2,239,008 $ (1,000,744) $ 2 $ 1,899,037 $ - 47 Transfer Net Results to Fund Balance 4,211,239 2,239,008 (1,000,744) 2 1,899, Adjusted Net Results $ - $ - $ - $ - $ - $ Total Transfer To (From) Reserve 4,211,239 2,239,008 (1,000,744) (2,769,956) (1,277,786) (5,679,240)
106 COLLEGE OF ARTS & SCIENCES STRATEGIC RESOURCE OPPORTUNITIES AND CHALLENGES The College of Arts and Sciences is embarking on a multi-year reorganization of resources intended to support our core mission: Advancing globally recognized research and exceptional education in baccalaureate, masters, and doctoral programs spanning the social sciences, natural sciences, and the humanities. Currently, broad dynamics tied to the University s investments in buildings, employee compensation, and student affordability mean that the College s expenditures are outpacing increases in net revenue. In the face of these challenges, the College is continuing to enhance traditional undergraduate recruitment and retention while building a new generation of online graduate and undergraduate programming to enhance accessibility to a broader array of students. With these efforts, we both advance our educational access mission while developing new sources of enrollment to strengthen our revenues. INVESTMENT IN PROGRAMS, ACTIVITIES AND FACILITIES These examples from among more than a dozen innovative online educational program investments will be launching in the Summer and Fall of 2018: The Genders, Sexualities and Health certificate program educates medical practitioners on patient needs related to gender and sexual identity. The master s degree in Law, Justice & Culture provides advanced studies centering on law and the institutions of justice from an empirically oriented liberal arts perspective. The bachelor s degree completion program in Psychology creates an opportunity for online students with the associate s degree to complete all of the requirements of the BA. The TEFL/TESOL certificate program credentials students seeking careers in English Language Instruction. The Master of Science in Chemistry opens the opportunity for graduate study to those working in the educational or industrial setting. The GIS & Cartography certificate program trains students in the use of advanced mapping technologies. The Data Analysis certificate program brings non-specialists into proficiency with the logic and techniques of data science. These programs join recently developed and currently expanding offerings such as the Master of Financial Economics, the Master of Arts in English, and the Master of Social Sciences to represent a college-wide investment involving dozens of faculty and staff working with the invaluable support of our partners in the Office of Instructional Innovation, the Graduate College, University Admissions, and Enrollment Management. The nearly completed renovation of Ellis Hall and the soon-to-launch Chemistry Building and Clippinger laboratory projects are exciting, crucial, and costly undertakings for the college. They are joined by a series of smaller reservefunded initiatives to shore up research facilities, improve teaching space, and enhance student lab safety. KEY TRENDS & DRIVERS Along with the aforementioned efforts to enhance revenue, the College s financial management strategy involves using savings from a pending multi-year tranche of senior faculty retirements to achieve a limited and strategically sound reorganization and reduction of our workforce. With these changes, the research and educational missions of the college can be advanced while the overall budget is positioned to face the challenges of the coming years.
107
108 College of Business 228,323, 0% FY19 Budgeted Revenues 1,758,148, 3% 1,341,700, 2% FY19 Budgeted Expenses & Allocations 487,519, 1% 619,327, 2% 14,378,524, 22% State Appropriations 11,544,859, 29% Tuition, net $65,031,552 Grants & Contracts/F&A $39,376,558 21,090,092, 54% Private Support Internal & External Sales Salaries, Wages, & Other Payroll Benefits Operating Expenses Debt Service Capital Cost Allocation 47,324,857, 73% 5,634,761, 14% 70 Five Year Faculty/Staff Headcount Trends FY14 FY15 FY16 FY17 FY18 Administrator Classified Non Bargaining Early Retired Faculty Group I Faculty Group II Faculty Group IV Faculty ,500 4,000 3,500 5-Year Student Enrollment by Classification 4,099 4,076 4,068 3,992 4,006 90,000 80,000 70,000 5-Year Athens Undergraduate Credit Hour Production 85,283 85,283 85,283 76,783 70,491 3,000 60,000 2,500 50,000 2,000 40,000 1,500 30,000 1, , ** 10,000-4,353 3,738 2,823 2,333 2, ** ** Athens Undergrad Athens Graduate Graduate Outreach Athens Undergraduate Undergraduate elearning **Unit Projections **Unit Projections
109 Business FY15 Actuals FY16 Actuals FY17 Actuals FY18 Budget FY18 Forecast FY19 Budget REVENUES 1 State Appropriations $ 8,549,232 $ 10,137,696 $ 11,333,757 $ 12,744,848 $ 12,744,848 $ 14,378,524 2 State Appropriations - Capital Gross Undergraduate Tuition & Fees 26,958,592 28,477,338 31,434,781 33,128,164 33,349,525 36,395,281 4 Undergraduate Financial Aid (4,986,673) (5,233,629) (6,043,746) (5,764,696) (5,835,734) (6,696,473) 5 Net Undergraduate Tuition & Fees 21,971,919 23,243,709 25,391,035 27,363,468 27,513,791 29,698,808 6 Gross Graduate Tuition & Fees 8,986,829 10,292,088 16,880,139 16,769,415 16,021,367 18,887,789 7 Graduate Financial Aid (1,037,770) (967,228) (921,310) (803,321) (1,201,740) (1,261,740) 8 Net Graduate Tuition & Fees 7,949,059 9,324,860 15,958,828 15,966,094 14,819,627 17,626,049 9 Room & Board Grants & Contracts 55,563 9,001 32,354 73, , , Facilities & Admin Cost Recovery 3, Endowment Distributions 812, , , , , , Gift Contributions 1,223,076 1,724,315 1,601, , , , Investment Income Internal & External Sales 1,412,734 1,002,247 1,749,478 1,511,700 1,315,625 1,341, Total Revenues 41,977,610 46,319,946 56,977,201 59,514,935 58,362,887 65,031, Administrative Cost Distribution Subvention Distribution 1,864,902 1,150,173 1,679,294 1,777,912 1,777,912 (2,664,327) 19 Total Revenues & Revenue Allocations $ 43,842,512 $ 47,470,119 $ 58,656,495 $ 61,292,847 $ 60,140,799 $ 62,367, Funding Transfers $ (109,688) $ (303,103) $ (208,233) $ (518,686) $ (266,180) $ (2,233,175) EXPENSES 21 Total Salaries, Wages, & Other Payroll 16,605,382 17,644,446 20,425,394 20,841,899 20,094,812 21,090, Total Benefits 4,197,855 4,493,631 5,177,079 5,536,772 5,468,616 5,634, Supplies & Services 3,327,178 3,235,338 4,041,943 3,934,770 3,675,057 4,153, Professional Services 483, ,067 6,220,606 5,857,717 5,909,300 7,003, Occupancy & Maintenance 173,410 97, , ,035 95,805 96, Capital Costs 287,515 10, Cost Of Goods Sold - 1, External Debt Service - Principal External Debt Service - Interest Internal Principal & Interest - 719,392 2,374, , , , Depreciation Other Operating Expense 79,136 15,396 13, , , , Total Direct Expenses 25,154,301 26,736,762 38,448,712 37,503,195 36,244,283 38,757, Administrative Cost Allocations 12,667,644 13,478,292 16,057,735 17,064,426 17,064,426 18,140, Capital Cost Allocation - 368, , , , , Subvention Allocation 4,060,831 4,655,884 6,627,348 6,895,883 6,710,816 7,523, Total Expenses & Expense Allocations $ 41,882,776 $ 45,239,650 $ 61,556,713 $ 62,048,395 $ 60,442,443 $ 65,040, Results of Operations $ 2,069,424 $ 2,533,572 $ (2,691,984) $ (236,862) $ (35,464) $ (440,110) INVESTMENT TRANSFERS 39 Transfer To (From) Operating Reserve (1,129,664) (1,380,722) (827,848) 40 Transfer To (From) Plant Fund 79,345 2,180,227 (141,757) - 500, Transfer To (From) Quasi Endowments 39, Repair & Replacement Transfers Internal Bank Transfers Other Transfers Total Investment Transfers $ 118,626 $ 2,180,227 $ (141,757) $ (1,129,664) $ (880,722) $ (827,848) 46 Net Results $ 1,950,797 $ 353,345 $ (2,550,227) $ 892,802 $ 845,258 $ 387, Transfer Net Results to Fund Balance 1,950, ,345 (2,550,227) 892, , , Adjusted Net Results $ - $ - $ - $ - $ - $ Total Transfer To (From) Reserve 1,950, ,345 (2,550,227) (236,862) (535,464) (440,110)
110 COLLEGE OF BUSINESS STRATEGIC RESOURCE OPPORTUNITIES AND CHALLENGES Strategic opportunities for the College of Business are being explored both on the Athens Campus and in Outreach programs and include the following: Previous growth in in the number of Athens Undergraduate students has fueled an increase in revenue and the need for more teaching capacity in the College. Maintaining this level of enrollment may become more challenging in the future and will potentially affect resources available to the College. Currently, undergraduate enrollment is anticipated to hold at approximately 2600 students. Anticipated growth in Graduate programs will produce a new increase in revenue but will also require more teaching capacity for the college. Growth in faculty and staff in response to graduate enrolment growth continues to put additional pressure on faculty resources and on space. Plans for additional office and student space on the second floor of the annex to partially address this issue are under way. INVESTMENT IN PROGRAMS, ACTIVITIES AND FACILITIES The College s strategy has been to expand its existing graduate programs as well as develop new offerings: A Masters of Accountancy degree has been approved and has begun enrolling students. The masters will be delivered in three formats, 4+1 for current residential undergraduate students, fully online and as a hybrid with monthly meetings on the Dublin campus. A bridge program for non-accountants to prepare to enroll in the Masters of Accountancy has also been developed. A Masters of Business Analytics has been approved and will be enrolling students in the academic year. A competency-based bachelor completion program, in collaboration with Columbus State in Dublin, has been developed in response to the needs of employers is being developed this summer with an anticipated start date after approvals in Fall 19. A Masters of Management that can be offered along with stackable certificates is being developed this summer with an anticipated start date after approvals in Fall 19. The Professional MBA program will be offering concentrations in response to market demands and is showing signs of moderate growth. KEY TRENDS & DRIVERS The primary driver in the budget is personnel, with investments related to increased faculty numbers to cover increases in enrollment and the staffing and space to support the new programs.
111
112 Scripps College of Communication FY19 Budgeted Revenues FY19 Budgeted Expenses & Allocations 605,000, 2% 1,937,327, 7% 1,595,944, 8% 8,155,609, 28% 2,094,760, 11% State Appropriations Tuition, net $28,718,618 $19,526,298 Grants & Contracts/F&A 3,508,824, 18% Private Support 12,326,770, 63% Salaries, Wages, & Other Payroll Benefits Operating Expenses Capital Cost Allocation 18,020,682, 63% Five Year Faculty/Staff Headcount Trends FY14 FY15 FY16 FY17 FY18 Administrator Classified Non Bargaining Early Retired Faculty Group I Faculty Group II Faculty Group IV Faculty Total Job Category Headcount Year Student Enrollment by Classification 5-Year Athens Undergraduate Credit Hour Production 2,500 2,000 2,093 2,159 2,191 2,132 2,150 60,000 50,000 48,676 49,004 50,254 51,237 52,741 1,500 40,000 30,000 1,000 20, ** 10, ,077 1,448 1,317 1, ** ** Athens Undergrad Athens Graduate Graduate Outreach **Unit Projections Athens Undergraduate Undergraduate elearning **Unit Projections
113 Communication FY15 Actuals FY16 Actuals FY17 Actuals FY18 Budget FY18 Forecast FY19 Budget REVENUES 1 State Appropriations $ 10,300,056 $ 10,062,288 $ 8,096,419 $ 7,945,475 $ 7,945,475 $ 8,155,609 2 State Appropriations - Capital Gross Undergraduate Tuition & Fees 19,215,028 19,170,751 21,542,629 21,127,967 21,127,247 21,280,255 4 Undergraduate Financial Aid (3,770,269) (3,645,842) (4,277,367) (3,880,740) (3,880,740) (4,123,569) 5 Net Undergraduate Tuition & Fees 15,444,759 15,524,909 17,265,262 17,247,227 17,246,507 17,156,687 6 Gross Graduate Tuition & Fees 3,041,820 2,641,442 2,609,876 2,575,120 2,661,216 2,755,484 7 Graduate Financial Aid (1,927,548) (1,710,230) (1,810,894) (1,819,489) (1,819,489) (1,891,489) 8 Net Graduate Tuition & Fees 1,114, , , , , ,995 9 Room & Board Grants & Contracts 738, , , , , , Facilities & Admin Cost Recovery 120,579 57,100 53,835 55,000 55,000 55, Endowment Distributions 989,261 1,108,790 1,149,024 1,232,329 1,232,329 1,300, Gift Contributions 760, , ,508 1,618,000 1,618, , Investment Income Internal & External Sales 116, , , Total Revenues 29,585,131 29,267,241 28,517,324 29,403,662 29,489,038 28,718, Administrative Cost Distribution Subvention Distribution 4,291,257 4,635,103 6,594,989 6,756,328 6,756,328 6,969, Total Revenues & Revenue Allocations $ 33,876,388 $ 33,902,344 $ 35,112,313 $ 36,159,990 $ 36,245,366 $ 35,688, Funding Transfers $ (463,738) $ (498,730) $ (485,238) $ (543,523) $ (589,145) $ (353,326) EXPENSES 21 Total Salaries, Wages, & Other Payroll 11,616,582 11,679,690 12,298,070 12,372,715 12,260,740 12,326, Total Benefits 3,238,194 3,317,170 3,370,914 3,484,069 3,446,379 3,508, Supplies & Services 1,841,331 1,977,269 2,053,249 1,702,183 1,545,533 1,407, Professional Services 308, , ,449 61, , , Occupancy & Maintenance 48,028 56, ,045 65,750 59,650 58, Capital Costs 2,259, ,564 55, Cost Of Goods Sold 1, External Debt Service - Principal External Debt Service - Interest Internal Principal & Interest 1,487, Depreciation Other Operating Expense 51,601 (6,404) 8, , , , Total Direct Expenses 20,852,857 17,258,793 18,494,241 18,067,283 17,923,618 17,930, Administrative Cost Allocations 11,456,304 11,886,912 12,791,114 12,795,664 12,795,664 13,162, Capital Cost Allocation - 1,274,290 1,168,568 1,578,248 1,578,248 1,595, Subvention Allocation 2,998,371 2,999,842 3,287,917 3,257,907 3,257,907 3,290, Total Expenses & Expense Allocations $ 35,307,532 $ 33,419,837 $ 35,741,840 $ 35,699,102 $ 35,555,437 $ 35,979, Results of Operations $ (967,407) $ 981,237 $ (144,289) $ 1,004,411 $ 1,279,074 $ 61,601 INVESTMENT TRANSFERS 39 Transfer To (From) Operating Reserve (348,449) (149,579) (357,003) 40 Transfer To (From) Plant Fund 2,905,259 (83,172) (500,000) 1,000,000 1,000, Transfer To (From) Quasi Endowments Repair & Replacement Transfers Internal Bank Transfers Other Transfers (81) 7,671 3, Total Investment Transfers $ 2,905,178 $ (75,501) $ (496,742) $ 651,551 $ 850,421 $ (357,003) 46 Net Results $ (3,872,584) $ 1,056,738 $ 352,453 $ 352,860 $ 428,653 $ 418, Transfer Net Results to Fund Balance (3,872,584) 1,056, , , , , Adjusted Net Results $ - $ - $ - $ - $ - $ Total Transfer To (From) Reserve (3,872,584) 1,056, ,453 4, ,074 61,601
114 SCRIPPS COLLEGE OF COMMUNICATION STRATEGIC RESOURCE OPPORTUNITIES AND CHALLENGES Our total college enrollment continues to stay fairly constant. Slight dips in freshman enrollments have been offset by slightly increased retention and transfer rates. Our Online Bachelor s Degree was named first for the 2018 most Affordable Online Colleges for Public Relations Degrees. This is the third year in a row that we have received similar awards. There continues to be capacity in that program. Budget reductions continue to challenge us to provide quality education with fewer resources. INVESTMENT IN PROGRAMS, ACTIVITIES AND FACILITIES Some investments in FY19 include: Immersive media initiative The immersive media initiative originally was funded by the Strategic Innovation Fund granted through the Office of Research. Since this initial investment, the faculty have developed new curriculum which has become very popular. The college is continuing to invest in this program through a three-year continuing commitment to fund student employees, lab manager, equipment and a Group II position. Future plans include expanding funding streams to grants and local industries. The IMI program has already received outside funding and we look for that to grow. Scripps has entered into a cooperative program with HCOM to provide support in faculty time, graduate assistants, and travel funding to the international program in Ecuador. Faculty will be working with Ecuador universities and communities to provide housing to reduce the spread of Chagas, a tropical parasite. Graduate certificates Beginning Fall 2018, at least two graduate certificates will be submitted to the university for curricular review. We anticipate two more before the end of the academic year. These certificates will ultimately become stackable allowing for a full online master s degree. The college has created an Ohio Communication Fellow program where we are investing in PreK-12 th grade educators focusing on communication and communication innovation. These fellows will spend time at OU, work with faculty mentors and receive a modest classroom stipend for materials and/or equipment. The goal of this program is three-fold: that OU will continue to have a presence in high schools throughout OHIO, that the field of communication in Ohio will be strengthened, and lastly, that students benefiting from these programs will think of Scripps College as they are making college decisions. KEY TRENDS & DRIVERS The college significantly reduced expenses through personnel and direct costs both in FY18 and again in FY19. This magnitude of cuts cannot be handled without affecting instruction. We are repurposing retirements for cuts when possible and using minimal bridge money to accomplish these cuts. This is due to multiple factors including leveraging our foundation dollars to the maximum, holding positions and/or delaying rehires where possible, making difficult decisions on areas not to rehire, etc. As high school demographics slide, the college is moving quickly to diversify into more online. In addition, in FY19 we will begin exploring if we can expand college scholarships to enhance on-campus enrollment.
115
116 Patton College of Education FY19 Budgeted Revenues FY19 Budgeted Expenses & Allocations 525,000, 1% 529,503, 2% 475,000, 2% 863,884, 4% 1,914,120, 10% 10,525,276, 33% State Appropriations Tuition, net $31,957,903 $19,811,402 Grants & Contracts/F&A 3,733,266, 19% Private Support 12,825,132, 65% 20,378,124, 64% Salaries, Wages, & Other Payroll Benefits Operating Expenses Debt Service Capital Cost Allocation Five Year Faculty/Staff Headcount Trends FY14 FY15 FY16 FY17 FY18 Administrator Classified Non Bargaining Early Retired Faculty Group I Faculty Group II Faculty Group IV Faculty ,600 1,400 1,404 5-Year Student Enrollment by Classification 1,449 1,513 1,492 1,500 40,000 35,000 5-Year Athens Undergraduate Credit Hour Production 36,121 36,271 36,650 36,314 36,564 1,200 30,000 1,000 25, , , ,000 5,000 4,050 4,084 3,128 1,914 1, ** ** ** Athens Undergrad Athens Graduate Graduate Outreach **Unit Projections Athens Undergraduate Undergraduate elearning **Unit Projections
117 Education FY15 Actuals FY16 Actuals FY17 Actuals FY18 Budget FY18 Forecast FY19 Budget REVENUES 1 State Appropriations $ 11,743,574 $ 12,990,684 $ 10,722,454 $ 10,527,432 $ 10,527,432 $ 10,525,276 2 State Appropriations - Capital Gross Undergraduate Tuition & Fees 15,715,895 15,065,165 16,708,236 16,724,196 15,945,368 15,783,613 4 Undergraduate Financial Aid (2,845,536) (2,699,927) (3,094,349) (2,819,862) (2,795,246) (2,990,281) 5 Net Undergraduate Tuition & Fees 12,870,359 12,365,238 13,613,887 13,904,334 13,150,122 12,793,332 6 Gross Graduate Tuition & Fees 9,735,997 9,365,288 10,095,900 9,775,724 10,095,781 10,706,190 7 Graduate Financial Aid (3,260,503) (3,006,413) (3,418,739) (3,160,089) (3,101,704) (3,121,398) 8 Net Graduate Tuition & Fees 6,475,495 6,358,874 6,677,161 6,615,635 6,994,077 7,584,792 9 Room & Board Grants & Contracts 1,221,057 1,180, ,980 1,120, , , Facilities & Admin Cost Recovery 119,598 76,372 51,986 70,000 23, Endowment Distributions 320, , , , , , Gift Contributions 103, , , , , , Investment Income Internal & External Sales 26,038 50, , Total Revenues 32,880,124 33,518,020 33,181,398 32,755,494 31,737,866 31,957, Administrative Cost Distribution Subvention Distribution (239,913) (190,685) (509,510) 407, ,490 2,289, Total Revenues & Revenue Allocations $ 32,640,211 $ 33,327,335 $ 32,671,888 $ 33,162,611 $ 32,228,356 $ 34,247, Funding Transfers $ (88,710) $ (177,947) $ 73,378 $ (121,202) $ (275,873) $ (414,490) EXPENSES 21 Total Salaries, Wages, & Other Payroll 11,212,785 11,445,924 12,266,779 12,677,023 12,422,629 12,825, Total Benefits 3,185,738 3,303,455 3,423,479 3,800,833 3,631,393 3,733, Supplies & Services 1,365,770 1,537,191 1,383, , , , Professional Services 443, ,213 1,133,179 78,445 1,213,445 1,143, Occupancy & Maintenance 42,695 45,657 27,632 4, Capital Costs - 19, Cost Of Goods Sold External Debt Service - Principal External Debt Service - Interest Internal Principal & Interest , , , , Depreciation Other Operating Expense 55,542 11,552 11, , Total Direct Expenses 16,306,034 16,852,891 18,721,031 17,979,398 18,593,080 18,947, Administrative Cost Allocations 11,030,004 11,300,304 10,420,854 10,788,286 10,788,286 11,451, Capital Cost Allocation - 153, , , , , Subvention Allocation 3,334,876 3,461,235 3,928,472 3,855,227 3,683,706 3,869, Total Expenses & Expense Allocations $ 30,670,914 $ 31,768,174 $ 33,960,942 $ 33,517,098 $ 33,959,259 $ 35,132, Results of Operations $ 2,058,007 $ 1,737,108 $ (1,362,432) $ (233,285) $ (1,455,030) $ (470,412) INVESTMENT TRANSFERS 39 Transfer To (From) Operating Reserve (475,000) (475,000) 40 Transfer To (From) Plant Fund 1,877,600 5,108 (291) Transfer To (From) Quasi Endowments Repair & Replacement Transfers Internal Bank Transfers Other Transfers (88) (1,333) 4 (673,247) Total Investment Transfers $ 1,877,512 $ 3,775 $ (287) $ (673,247) $ (475,000) $ (475,000) 46 Net Results $ 180,495 $ 1,733,334 $ (1,362,145) $ 439,962 $ (980,030) $ 4, Transfer Net Results to Fund Balance 180,495 1,733,334 (1,362,145) 439,962 (980,030) 4, Adjusted Net Results $ - $ - $ - $ - $ - $ Total Transfer To (From) Reserve 180,495 1,733,334 (1,362,145) 439,962 (1,455,030) (470,412)
118 THE PATTON COLLEGE OF EDUCATION STRATEGIC RESOURCE OPPORTUNITIES AND CHALLENGES Opportunities The Patton College of Education continues to look for ways to offer programs that will be beneficial through the PCOE nationally recognized Clinical Model of Educator Preparation. The College also offers new endorsement courses, bachelor completion opportunities and graduate programs in the human services and education professions to the surrounding region. The quality of our academic programs continues to be strong and a key priority. Undergraduate enrollment and retention has increased in FY17. The following represents new program opportunities in The Patton College: In the Department of Teacher Education, a Dual Masters in Early Childhood and Special Education program combining aspects from Early Childhood and Special Education has been developed for approval through ODE. The mission of the program is to utilize the most current adult learning principles to increase the quantity and quality of ECE/ECIS teachers, and to improve services and outcomes for children ages birth to age 8 and their families. The program is projected to begin July The Department of Counseling and Higher Education is in the final stages of developing the Human Services Bachelor Completion Program. This proposed program is an online bachelor completion program with the degree to be conferred as the Bachelor of Applied Human and Consumer Sciences. This bachelor completion program is designed for students who have already completed an associate s degree or for students who have completed a minimum of 60 semester hours. The program is projected to begin fall, The Departments of Recreation and Sport Pedagogy, Human and Consumer Sciences, the College of Business s Sport Administration program, and the United States Tennis Association (USTA), collaborate to offer the Tennis Professional Management master s degree program as an interdisciplinary partnership. This 30 semester hour program is online with one campus based residency. Revenue is expected to be divided with a minimum of 80% for The Patton College and 20% to the College of Business. Based on necessary approvals, the earliest start date for this program is expected to be spring, The Education Public Policy and Leadership certificate is a 12-hour interdisciplinary certificate between The Patton College of Education and the Voinovich College s Public Policy program. The program is online with a one-credit residency component. This certificate is designed for in-service teachers, administrators, policy makers, legislative aids, school board members, education professional associations, etc. who want to expand their ability to both understand and inform policy as it relates to the field of education. This program is anticipated to take one year to complete and it is anticipated to run on a calendar year schedule (Jan-Dec). This certificate is anticipated to start January The Patton College of Education is seeking to increase graduate enrollments by moving our Curriculum and Instruction, Reading Education, and Special Education programs to E-campus. While Curriculum and Instruction and Reading Education were already offered online, they were listed as Athens-online programs rather than E- campus. By moving these two programs and adding Special Education to E-campus, prospective students searching for graduate education opportunities at Ohio University will see these programs listed as online options. Further, by having these programs online, practicing teachers from anywhere in the State can complete their graduate program without having to come to the Ohio University Athens campus thus increasing the reach we have in the State. Challenges Undergraduate retention has decreased slightly for FY18. The College continues to examine ways to increase retention while maintaining rigor. An ongoing challenge is a reduced number of high school graduates available to attend institutes of higher education based on data from the Western Interstate Commission for Higher Education (WICHE). Strategic investments in retention and recruitment will remain a strategic priority and is expected to yield positive results (PCOE Student Support Initiative). Graduate enrollments remained stable for FY18. The Patton College is working to market new programs and offer graduate programs in areas that have the most potential for meeting community needs.
119 With that as a background, specific challenges are as follows: Expediting new program approvals via UCC, The Office of the Provost and ODHE Ensuring the right mix of faculty (Group I, II, III, and IV) to deliver revenue generating strategic academic program opportunities to external audiences. Contracts and grants awarded have declined over the last three years. Much of this is due to retiring of senior grant productive faculty and hiring of new tenure seeking faculty. Funding is expected to increase as newly tenured faculty begin to submit research proposals to secure grant funding. The competition for offering on-line programing has increased. To this end, there is greater need to build and maintain external networks of support to assist with cohort recruitment (community colleges, professional organizations, etc.). INVESTMENT IN PROGRAMS, ACTIVITIES AND FACILITIES In FY19, the college will invest $60,000 in start-up funding for new programs for a desired start date of FY20 and FY21. The Patton College supports faculty development to many professional conferences. In addition, the college is making investments to increase our rankings in US News and World Report (USNWR) by investing in faculty who publish in the top of the top tier journals in their respective fields. Investments are also made for students (undergraduate and graduate) to travel to present research papers, individually or with faculty mentors. This assists with recruitment of graduate students and raises the academic profile of OHIO. There is also support for public school faculty working with the Center for Partnerships to attend conferences in Washington D.C. to meet with legislature making decisions regarding public education. Such work continues to ensure PCOE remains a leader in the field with our PCOE clinical preparation of education professionals. The Patton College Clinical Model of Educator Preparation is nationally recognized and has received numerous awards. Most recently, the college received the National Association for Professional Development Schools (NAPDS) PDS Exemplary Achievement Award, for our joint work with Federal Hocking Local Schools through the -Ohio University CARE PDS Partnership. The Clinical Model provides more experiences for the students in their fieldwork. This gives our students more hands on research and work at internship sites that will assist them in dealing with real issues that they will face after graduation. The goal is to assist The Patton college students to be confident researchers and practitioners as they approach the next phase of their lives and become ethical and reflective leadereducators and human service professionals, lifelong learners, serving society responsibly as change agents and meeting diverse human and social needs. The Patton College opened its doors to the completely renovated McCracken Hall on January It is a beautiful facility, now up to the standards of learning in the 21 st century. Faculty, staff and students are truly enjoying their new space, its beauty and collaborative learning opportunities. The classroom technology and many project rooms are producing a learning experience unequaled throughout the campus. KEY TRENDS & DRIVERS Several trends are converging to create unprecedented pressures on higher education. There has been a decrease in the birth rate between the years of This will be reflected by a reduced number of high school graduates, reducing the pool of potential incoming freshmen More competition for on-line learning opportunities Continued challenge of messaging the return on investment for Higher Education Uncertainty in Federal Immigration Policies The importance of recognizing the need to be responsive to diverse voices on campus and retaining a commitment to multicultural diversity For The Patton College to remain a vital asset in the local, national, and global educational system, it must position itself to capitalize on media-rich learning environments capable of reaching traditional and non-traditional learners with a wide variety of learning styles and expectations.

120 Russ College of Engineering and Technology FY19 Budgeted Revenues FY19 Budgeted Expenses & Allocations 15,000, 0% 1,580,506, 4% 848,000, 2% 1,182,000, 3% 7,536,700, 18% 8,595,653, 20% State Appropriations 7,172,252, 17% Tuition, net $42,256,046 Grants & Contracts/F&A $42,209,817 Private Support 11,115,480, 26% 25,550,896, 60% Internal & External Sales 5,876,164, 14% 14,993,213, 36% Salaries, Wages, & Other Payroll Benefits Operating Expenses Capital Costs Debt Service Capital Cost Allocation Five Year Faculty/Staff Headcount Trends FY14 FY15 FY16 FY17 FY18 Administrator Classified Non Bargaining Early Retired Faculty Group I Faculty Group II Faculty Group IV Faculty Year Student Enrollment by Classification 5-Year Athens Undergraduate Credit Hour Production 2,000 1,800 1,600 1,400 1,200 1,705 1,785 1,814 1,867 1,850 40,000 35,000 30,000 25,000 30,711 32,221 34,494 35,366 35,080 1,000 20, ** 15,000 10,000 5, ** ** Athens Undergrad Athens Graduate Graduate Outreach **Unit Projections Athens Undergraduate Undergraduate elearning **Unit Projections
121 Engineering FY15 Actuals FY16 Actuals FY17 Actuals FY18 Budget FY18 Forecast FY19 Budget REVENUES 1 State Appropriations $ 8,956,349 $ 9,742,032 $ 7,579,321 $ 8,033,853 $ 8,033,853 $ 8,595,653 2 State Appropriations - Capital Gross Undergraduate Tuition & Fees 20,283,997 22,855,665 15,698,332 15,528,796 15,682,678 16,511,347 4 Undergraduate Financial Aid (4,883,801) (5,456,387) (4,120,237) (4,210,498) (4,220,395) (4,528,134) 5 Net Undergraduate Tuition & Fees 15,400,195 17,399,279 11,578,095 11,318,298 11,462,283 11,983,213 6 Gross Graduate Tuition & Fees 5,192,325 5,676,738 7,511,445 7,150,000 6,800,000 6,800,000 7 Graduate Financial Aid (3,611,911) (3,975,390) (3,908,128) (3,805,000) (3,814,000) (3,790,000) 8 Net Graduate Tuition & Fees 1,580,414 1,701,348 3,603,317 3,345,000 2,986,000 3,010,000 9 Room & Board Grants & Contracts 9,673,038 10,093,948 9,339,685 7,300,000 9,300,000 9,300, Facilities & Admin Cost Recovery 3,155,090 2,566,662 2,683,503 1,815,480 1,815,480 1,815, Endowment Distributions 5,904,822 6,576,088 6,714,373 6,746,171 6,623,410 7,386, Gift Contributions 1,404, , , , , , Investment Income 47,314 37,662 47, Internal & External Sales 949, ,343 1,968, , ,750 15, Total Revenues 47,070,425 49,007,684 44,035,520 39,083,802 40,889,776 42,256, Administrative Cost Distribution Subvention Distribution 5,396,900 6,258,998 16,782,247 15,660,685 15,660,685 17,616, Total Revenues & Revenue Allocations $ 52,467,325 $ 55,266,682 $ 60,817,767 $ 54,744,487 $ 56,295,861 $ 59,872, Funding Transfers $ (237,810) $ (815,227) $ (1,241,118) $ (993,709) $ (2,248,299) $ (900,000) EXPENSES 21 Total Salaries, Wages, & Other Payroll 23,163,444 24,373,425 25,686,378 22,389,287 24,788,481 25,550, Total Benefits 5,707,370 6,020,434 6,277,964 6,041,189 5,854,846 5,876, Supplies & Services 4,138,535 4,021,302 3,736,405 3,294,852 4,238,241 4,175, Professional Services 1,094,882 1,600,083 3,029,248 2,044,500 2,152,026 2,152, Occupancy & Maintenance 1,219,951 1,099,752 1,451,862 1,001, , , Capital Costs 1,546,337 1,097,035 1,257, , ,000 1,182, Cost Of Goods Sold External Debt Service - Principal External Debt Service - Interest Internal Principal & Interest 387, , , , , , Depreciation Other Operating Expense 996, , , , Total Direct Expenses 38,254,506 39,293,486 43,081,386 37,040,228 39,661,594 40,629, Administrative Cost Allocations 13,494,132 13,605,360 14,557,146 14,739,047 14,739,047 15,489, Capital Cost Allocation - 1,533,272 1,293,240 1,457,266 1,457,266 1,580, Subvention Allocation 3,160,884 3,814,430 3,143,767 3,143,404 3,120,577 3,260, Total Expenses & Expense Allocations $ 54,909,522 $ 58,246,548 $ 62,075,538 $ 56,379,945 $ 58,978,484 $ 60,959, Results of Operations $ (2,204,388) $ (2,164,639) $ (16,653) $ (641,749) $ (434,324) $ (186,904) INVESTMENT TRANSFERS 39 Transfer To (From) Operating Reserve Transfer To (From) Plant Fund 245, ,339 (42,725) Transfer To (From) Quasi Endowments 349,287 (247,840) (314,613) Repair & Replacement Transfers Internal Bank Transfers - (2,200,000) Other Transfers 742 5,195 1,934 (1) Total Investment Transfers $ 595,980 $ (2,330,305) $ (355,404) $ (1) $ - $ - 46 Net Results $ (2,800,368) $ 165,666 $ 338,751 $ (641,748) $ (434,324) $ (186,904) 47 Transfer Net Results to Fund Balance (2,800,368) 165, ,751 (641,748) (434,324) (186,904) 48 Adjusted Net Results $ - $ - $ - $ - $ - $ Total Transfer To (From) Reserve (2,800,368) 165, ,751 (641,748) (434,324) (186,904)
122 RUSS COLLEGE OF ENGINEERING AND TECHNOLOGY STRATEGIC RESOURCE OPPORTUNITIES AND CHALLENGES The Russ College of Engineering and Technology has several opportunities to expand academic offerings for students and further refine its existing research: Research facility expansion Continued demand for engineering programs leading to enrollment growth, higher ACT scores, higher retention rates, and lower average time to graduate On-line programmatic opportunities for enrollment growth New stackable and stand-alone certificates Offerings at Beavercreek facility Maturation of faculty hired in time frame potentially leading to increased research funding While these opportunities offer promising growth for The College, it is also important to consider the challenges facing us as well: Time sensitivity of research building requirements due to already existing faculty dissatisfaction Significant funds allocated for new research faculty start-up packages Stocker Center (Facility) o Limited undergraduate teaching lab space for expanding programs that require significant space allocations (ETM undergraduate lab space growth) o Space for research is both limited and constrained for safety o Office and general space shortfalls related to continued enrollment growth o Stocker Center is in need of phased renovations in a continually occupied space Declining financial operating resources in a time of continued enrollment growth Management bandwidth due to Beavercreek transitions INVESTMENT IN PROGRAMS, ACTIVITIES AND FACILITIES Planning continues for a 120,000 sq. ft. research facility to address research space needs which will also help ease the undergraduate space needs in Stocker. The College is also increasing course offerings at Beavercreek facility, as well as creating new stackable and standalone certificates for students. KEY TRENDS & DRIVERS Costs associated with proposed new research facility Although the University has shared in the cost of the funds allocated for new research faculty start-up packages, the amount remaining to be funded by the College remains challenging Two new faculty hires due to programmatic enrollment growth
123
124 College of Fine Arts FY19 Budgeted Revenues 451,076, 2% 630,021, 3% 69,127, 0% FY19 Budgeted Expenses & Allocations 1,146,320, 6% 2,777,004, 14% 7,368,214, 34% State Appropriations Tuition, net $21,734,618 Grants & Contracts/F&A $20,085,329 Private Support 4,037,419, 20% 12,124,586, 60% Internal & External Sales 13,216,180, 61% Salaries, Wages, & Other Payroll Benefits Operating Expenses Capital Cost Allocation Five Year Faculty/Staff Headcount Trends FY14 FY15 FY16 FY17 FY18 Administrator Classified Non Bargaining Early Retired Faculty Group I Faculty Group II Faculty Group IV Faculty Year Student Enrollment by Classification ,000 40,000 5-Year Athens Undergraduate Credit Hour Production 38,501 38,979 37,898 36,494 37, , ** 30,000 25,000 20,000 15,000 10,000 5,000-4,729 5,884 6,575 5,234 5, ** ** Athens Undergrad Athens Graduate Graduate Outreach **Unit Projections Athens Undergraduate Undergraduate elearning **Unit Projections
125 Fine Arts FY15 Actuals FY16 Actuals FY17 Actuals FY18 Budget FY18 Forecast FY19 Budget REVENUES 1 State Appropriations $ 5,640,144 $ 6,277,776 $ 7,251,954 $ 7,101,575 $ 7,101,575 $ 7,368,214 2 State Appropriations - Capital Gross Undergraduate Tuition & Fees 17,305,243 17,315,734 16,584,032 15,816,956 15,760,131 15,514,566 4 Undergraduate Financial Aid (3,147,359) (3,264,039) (3,192,956) (3,090,686) (3,189,831) (3,299,820) 5 Net Undergraduate Tuition & Fees 14,157,885 14,051,695 13,391,076 12,726,270 12,570,300 12,214,746 6 Gross Graduate Tuition & Fees 3,827,980 3,792,903 3,554,137 3,626,615 3,632,771 3,770,951 7 Graduate Financial Aid (2,929,667) (2,947,087) (3,021,901) (2,941,641) (2,804,000) (2,769,517) 8 Net Graduate Tuition & Fees 898, , , , ,771 1,001,434 9 Room & Board Grants & Contracts 5,654 5,887 64,204 85,025 67,887 69, Facilities & Admin Cost Recovery Endowment Distributions 300, , , , , , Gift Contributions 86, , , , , , Investment Income Internal & External Sales 659, , , , , , Total Revenues 21,747,807 21,988,794 22,162,131 21,706,647 21,615,555 21,734, Administrative Cost Distribution Subvention Distribution 6,178,151 6,867,049 8,170,047 7,836,374 7,836,374 8,469, Total Revenues & Revenue Allocations $ 27,925,958 $ 28,855,844 $ 30,332,178 $ 29,543,021 $ 29,451,929 $ 30,204, Funding Transfers $ (489,064) $ (630,079) $ (1,211,896) $ (1,210,279) $ (1,197,279) $ (1,265,000) EXPENSES 21 Total Salaries, Wages, & Other Payroll 11,136,036 11,407,148 12,113,045 12,524,812 11,938,474 12,124, Total Benefits 3,251,021 3,365,910 3,462,576 3,841,627 4,011,981 4,037, Supplies & Services 1,408,527 1,561,490 1,749,701 1,739,108 1,731,874 1,813, Professional Services 349, , , , , , Occupancy & Maintenance 202, , , , , , Capital Costs 108,226 65,107 28, , , Cost Of Goods Sold External Debt Service - Principal External Debt Service - Interest Internal Principal & Interest Depreciation Other Operating Expense 46,012 20,644 9,408 14,433 21,333 21, Total Direct Expenses 16,501,755 17,076,766 18,429,985 18,962,094 18,954,604 18,939, Administrative Cost Allocations 9,628,764 9,243,396 8,927,184 8,850,439 8,850,439 9,243, Capital Cost Allocation - 783,894 1,243,585 1,027,973 1,027,973 1,146, Subvention Allocation 2,209,392 2,314,290 2,671,460 2,567,428 2,566,532 2,581, Total Expenses & Expense Allocations $ 28,339,911 $ 29,418,346 $ 31,272,213 $ 31,407,934 $ 31,399,548 $ 31,911, Results of Operations $ 75,111 $ 67,576 $ 271,862 $ (654,633) $ (750,340) $ (441,628) INVESTMENT TRANSFERS 39 Transfer To (From) Operating Reserve (440,717) (693,842) (541,254) 40 Transfer To (From) Plant Fund 45,159 (11,988) 165,639-30, Transfer To (From) Quasi Endowments Repair & Replacement Transfers Internal Bank Transfers Other Transfers Total Investment Transfers $ 45,697 $ (11,988) $ 165,639 $ (440,717) $ (663,842) $ (541,254) 46 Net Results $ 29,413 $ 79,565 $ 106,223 $ (213,916) $ (86,498) $ 99, Transfer Net Results to Fund Balance 29,413 79, ,223 (213,916) (86,498) 99, Adjusted Net Results $ - $ - $ - $ - $ - $ Total Transfer To (From) Reserve 29,413 79, ,223 (654,633) (780,340) (441,628)
126 COLLEGE OF FINE ARTS STRATEGIC RESOURCE OPPORTUNITIES AND CHALLENGES The arts have transformative power on society and on individual lives. Ohio University offers the most transformative learning community in the nation, by making the arts accessible, diverse, and challenging. By involving students directly in positive community transformation through the power of the arts, they themselves become transformed. In addition to presenting over 300 arts events that are free of charge each year, the College is offering an increased number of educational outreach programs to high school students and other community members in both Athens and Dublin. This represents an opportunity to engage a new population in high quality arts programming, as well as strengthen a pipeline for recruiting. The College is challenged by deferred maintenance costs. The College is also experiencing a space shortage: the University Master Plan Space Study found an 89,000 ASF space deficit for Fine Arts, primarily in assembly and exhibit space. The first phase of the renovation of Seigfred Hall addressed some deferred maintenance in 2017/18, but significant need remains across the College of Fine Arts. The College undertook a facilities master-plan study in 2018, which will help lead the College forward in this critical area. Although the College is seeing the results of purposeful and focused recruitment efforts and strategic scholarship funding, the College is continually challenged by the statewide trend in declining enrollment and increasing competition for arts majors. INVESTMENT IN PROGRAMS, ACTIVITIES AND FACILITIES 1) Focus on Community Transformation and the Power of the Arts. We have many new initiatives for the arts at OHIO! Highlights include: Ohio Valley Center for the Arts o Brand new center with a focus on community transformation through the Arts in the Appalachian Region o Creating a coalition of community and university partnerships (including Medicine, Voinovich, Rural Action, ARTS/West, Honey for the Heart, Stuart s Opera House, etc ) o Enhanced summer programming (day camps for local community and residential camps for more intensive experiences). o Three arms: Wellness/Health Creative Arts Therapy outreach programs (Music, Dance/Movement, Art) smart design for hospitals, successful longevity, and wellness facilities Sustainable and healthy environment Education Education outreach programs (Theater, Music, Dance, Art) Commitment to anti-addiction programming Commitment to enhancing the existing arts programs in our region s schools Arts Community Engagement Building connections to our community and our community s needs through performances, productions, exhibits, and a focus on public art Entrepreneurial and sustainable practice focus Three proposed undergrad degrees to engage our community; each with required service learning/community projects or Internships o BFA in Film; BFA in Musical Theater; Interdisciplinary BFA (COFA wide)
127 Eight proposed master s degrees/master s degree tracks/and certificates (including two with low residency requirements) o Art/Theater Education, Museum Studies, Arts Administration, Dance/Movement Therapy, Art Therapy, Community Dance; and online/low residency Music Education and Music Therapy Each division of the College of Fine Arts is creating new certificates & minors that are meant to help attract prospective students by adding value to their degrees and increasing the chance of fulfilling post-graduation employment New undergrad core curriculum in Art + Design that includes service learning, community, and internships projects 2) Enhancement of our relationship with Tantrum Theater and Dublin The College launched the Tantrum Theater, a new professional theater that provides critical professional training for our students and alumni and donor engagement opportunities, in the summer of 2016 in Dublin, OH. Tantrum was developed in collaboration with Dublin Arts Council and the City of Dublin Enhanced connection with community and public schools Building on Tantrum to connect to health/wellness and the arts in the Dublin community 3) Enhancing COFA facilities so the quality of the facilities matches the quality of a CoFA education HGA Architectural Group to complete a comprehensive study and master plan by May 2018 Have completed phase 1 project in Seigfred; also new rigging for Theater, and a renovation of a back room in the Athena Cinema for Theater needs 4) Enhancing COFA s brand and recruiting efforts through a significant overhaul of the College website. KEY TRENDS & DRIVERS The primary driver of direct expenditures was the launching of the Tantrum Theater; otherwise direct expenditures for the College of Fine Arts remain stable.
128 College of Health Sciences & Professions FY19 Budgeted Revenues FY19 Budgeted Expenses & Allocations 334,236, 1% 932,471, 1% 3,536,796, 4% 968,145, 2% 30,012,515, 34% State Appropriations 10,401,374, 27% Tuition, net $87,696,850 Grants & Contracts/F&A $38,953,893 Private Support 20,657,294, 53% Internal & External Sales 52,880,833, 60% 6,927,080, 18% Salaries, Wages, & Other Payroll Benefits Operating Expenses Capital Cost Allocation Five Year Faculty/Staff Headcount Trends FY14 FY15 FY16 FY17 FY18 Administrator Classified Non Bargaining Early Retired Faculty Group I Faculty Group II Faculty Group IV Faculty ,000 2,500 2,000 1,500 1, Year Student Enrollment by Classification 2,581 2,641 2,711 2,728 2, ** 5-Year Athens Undergraduate Credit Hour Production 100,000 86,247 87,865 88,495 90,000 83,093 80,612 80,000 70,000 60,000 50,843 51,727 52,361 52,788 47,224 50,000 40,000 30,000 20,000 10, ** ** Athens Undergrad Athens Graduate Graduate Outreach **Unit Projections Athens Undergraduate Undergraduate elearning **Unit Projections
129 Health Sciences FY15 Actuals FY16 Actuals FY17 Actuals FY18 Budget FY18 Forecast FY19 Budget REVENUES 1 State Appropriations $ 43,200,014 $ 38,923,176 $ 31,692,889 $ 29,409,978 $ 29,409,978 $ 30,012,515 2 State Appropriations - Capital Gross Undergraduate Tuition & Fees 36,013,541 36,781,550 43,559,421 43,967,782 42,666,460 42,372,002 4 Undergraduate Financial Aid (5,401,373) (5,605,920) (4,894,684) (4,451,563) (4,308,504) (4,448,754) 5 Net Undergraduate Tuition & Fees 30,612,169 31,175,630 38,664,737 39,516,219 38,357,956 37,923,248 6 Gross Graduate Tuition & Fees 8,276,431 9,284,833 15,791,567 15,697,018 16,153,875 16,556,221 7 Graduate Financial Aid (2,388,080) (2,226,366) (2,186,957) (2,298,877) (1,592,228) (1,598,636) 8 Net Graduate Tuition & Fees 5,888,352 7,058,467 13,604,610 13,398,141 14,561,647 14,957,585 9 Room & Board Grants & Contracts 6,055,619 5,951,025 3,651,946 4,703,445 2,029, , Facilities & Admin Cost Recovery 215, , ,913 32, ,874 62, Endowment Distributions 115, , , , , , Gift Contributions 103, , , , , , Investment Income Internal & External Sales 2,435,416 2,566,874 4,781,327 2,751,870 3,028,387 3,536, Total Revenues 88,626,201 86,123,578 92,906,739 90,164,425 87,877,818 87,696, Administrative Cost Distribution Subvention Distribution (19,750,854) (20,753,169) (8,375,346) (8,426,126) (8,280,617) (7,905,492) 19 Total Revenues & Revenue Allocations $ 68,875,347 $ 65,370,409 $ 84,531,393 $ 81,738,299 $ 79,597,201 $ 79,791, Funding Transfers $ (493,315) $ (195,864) $ 13,455 $ (189,238) $ 53,776 $ 99,404 EXPENSES 21 Total Salaries, Wages, & Other Payroll 17,260,165 18,366,516 19,743,247 20,670,058 21,117,617 20,657, Total Benefits 5,070,881 5,626,570 5,986,765 6,538,357 6,698,753 6,927, Supplies & Services 2,260,259 2,457,340 2,422,218 2,008,070 2,225,811 2,581, Professional Services 2,367,291 2,531,410 8,468,634 8,016,079 6,700,055 6,150, Occupancy & Maintenance 359,885 1,018,603 1,224,029 1,187,223 1,236,413 1,206, Capital Costs 194, , , Cost Of Goods Sold 313, , , , , , External Debt Service - Principal External Debt Service - Interest Internal Principal & Interest ,435, Depreciation Other Operating Expense 249, , , , , , Total Direct Expenses 28,076,622 30,631,669 49,119,820 38,882,751 38,350,634 37,985, Administrative Cost Allocations 23,729,268 25,044,984 30,879,099 30,775,337 30,775,337 31,642, Capital Cost Allocation - 547, , , , , Subvention Allocation 7,963,067 7,808,948 10,255,180 10,354,582 10,319,824 10,359, Total Expenses & Expense Allocations $ 59,768,957 $ 64,032,610 $ 91,195,647 $ 80,986,823 $ 80,419,948 $ 80,955, Results of Operations $ 9,599,705 $ 1,533,663 $ (6,677,709) $ 940,713 $ (876,523) $ (1,263,568) INVESTMENT TRANSFERS 39 Transfer To (From) Operating Reserve (1,525,591) (1,400,954) 40 Transfer To (From) Plant Fund 3,327,885 12,132,737 (10,309,543) - 403, Transfer To (From) Quasi Endowments Repair & Replacement Transfers Internal Bank Transfers Other Transfers (396) 15,579 47, Total Investment Transfers $ 3,327,489 $ 12,148,317 $ (10,262,205) $ - $ (1,121,603) $ (1,400,954) 46 Net Results $ 6,272,216 $ (10,614,654) $ 3,584,496 $ 940,713 $ 245,080 $ 137, Transfer Net Results to Fund Balance 6,272,216 (10,614,654) 3,584, , , , Adjusted Net Results $ - $ - $ - $ - $ - $ Total Transfer To (From) Reserve 6,272,216 (10,614,654) 3,584, ,713 (1,280,511) (1,263,568)
130 COLLEGE OF HEALTH SCIENCES AND PROFESSIONS STRATEGIC RESOURCE OPPORTUNITIES AND CHALLENGES One significant set of challenges relates to the need for the College of Health Sciences and Professions to continue to generate financial resources to support other units at the University. The College continues to stand as the largest at the University in terms of student headcount and the most efficiently operated in terms of the amount spent on operations for every dollar of revenue generated. A lean operational model makes it particularly challenging to dedicate resources to new initiatives and to identify strategies to reduce costs in response to increased financial pressures. When considering just on-campus students, the student to faculty ratio in CHSP is over 50:1, with some academic programs in the College maintaining ratios of over 100:1. Such large ratios make it difficult to dedicate resources to new opportunities. A second set of challenges is associated with recent enrollment trends and pressures. Due to the dynamic nature of the health sector of the economy, demand has shifted for programs offered by the College. This is compounded by a rapidly evolving market in the online sector with many strong institutions entering the market. Despite success in attracting students to many programs, the College recognizes the current enrollment levels in a number of areas will eventually subside, which will require considerable planning and investment in new strategies to offset anticipated future enrollment declines. The College has begun planning to address the unique educational needs of professionals in the disciplines taught by the College. The College must invest in the following areas: education delivered in more distributed ways at new sites and through new pedagogies, educational activities that are not based on traditional academic-credited courses, and activities targeted to individuals across the entire course of their careers rather than just at the front-end. Related to the above, there is vast, untapped enrollment potential in populations the College has not traditionally served. The College s previous investments in online education position it to move successfully into both international and new domestic markets especially beyond the traditional boundaries of its programming. For example, delivery of curriculum in languages other than English, tying course content to noncredit CEU offerings, and building programs around competency-based models all stand as examples of ideas that might transform the enrollment footprint of the College. The College has made great strides in developing focused attention on population health issues in the region and the State through the new Ohio Alliance for Innovation in Population Health. Driving this effort is a goal of positioning Ohio University as a primary resource in the eyes of State of Ohio leadership in addressing population health issues of critical importance. There is considerable potential to bring State investments to the University to support research and education on issues such as opiate abuse, chronic disease management, and maternal-infant health. Finally, there is great opportunity in expanded community engagement in terms of both research activities and new teaching opportunities. A community-engaged approach to research and teaching that addresses critical population health issues holds the potential to position the College as a key resource for government officials and local communities that wish to address those issues. Such an approach holds the potential to become a defining feature of the College s research footprint and its ability to generate grant and contract support for research activities. INVESTMENT IN PROGRAMS, ACTIVITIES AND FACILITIES The College has invested heavily in new program development, regularly submitting more new program and course proposals for curriculum review than any other unit at the University. Curriculum transformation remains one of the College s key investment strategies in order to keep curriculum current and develop new programs to replace those experiencing diminishing enrollment demand. A number of new programs are currently in some phase of exploration or development.
131 These include: New master s degree built on a stackable certificate model New master s degree in global health New master s degree and revised certificate in gerontology Revised certificate in clinical informatics New certificate in health policy New athletic training licensure program New Child Life Specialist licensure program New certificate in patient advocacy New certificate in veterans health The College also continues to explore opportunities for aging and wellness programming in Dublin in collaboration with the City of Dublin and numerous other entities in the central Ohio region. The focus of this effort is on positioning the Dublin campus as a location defined by innovative teaching and research on aging and the City of Dublin as a community that is highly supportive of aging in place among its residents. This project is currently in the earliest phase of exploration. KEY TRENDS & DRIVERS Rapidly evolving models of healthcare delivery and requisite approach to training future healthcare professionals. The College is required to constantly update its curricula. Further, with 11 different accrediting organizations and numerous licensing boards associated with programs in the College, there is an ongoing need to remain responsive to evolving accrediting and licensure standards in its various disciplines. The introduction of more competitors and varying models of program delivery in the online and distributed education environment. This is further complicated by evolving requirements of state departments of accreditation and professional licensing boards regarding delivery of online instruction and on-site clinical experiences in other states. Pressures to find adequate clinical rotations and placements to support large enrollments in many programs. This is tied to increased pressure for clinical rotations from other institutions and other programs within the institution. As a result, the College has been forced to scale back admission into a number of clinical programs by as much as 40%. Increasing demands of partner healthcare systems for clinical placements also creates increased financial pressure on the College. With over 3,500 clinical placements a year, demand for payment for clinical placements represents a substantial financial issue. University budget pressures tied to variations in state funding and enrollment patterns. This environment creates financial issues in terms of retaining resources to invest in new strategic initiatives. Opportunities (not yet fully known) that exist for the College and its programs at Dublin and across the OU footprint. The College of Health Sciences and Professions can be a major part of the University s commitment to expand its engagement across its region.
132 Honors Tutorial College FY19 Budgeted Revenues FY19 Budgeted Expenses & Allocations 46,493, 2% 9,045, 1% 1,211,992, 48% $27,869 (1,239,991), -48% State Appropriations Tuition, net Grants & Contracts/F&A Private Support 652,600, 41% $1,587, ,473, 42% Salaries, Wages, & Other Payroll Benefits Operating Expenses Capital Cost Allocation 9,375, 0% 254,525, 16% Five Year Faculty/Staff Headcount Trends FY14 FY15 FY16 FY17 FY18 Administrator Classified Non Bargaining Early Retired Faculty Group II Faculty Year Athens Undergraduate Credit Hour Production ** ** Athens Undergraduate **Unit Projections
133 Honors FY15 Actuals FY16 Actuals FY17 Actuals FY18 Budget FY18 Forecast FY19 Budget REVENUES 1 State Appropriations $ 21,768 $ 23,112 $ 43,028 $ 47,224 $ 47,224 $ 46,493 2 State Appropriations - Capital Gross Undergraduate Tuition & Fees 43, , , , , ,656 4 Undergraduate Financial Aid (617,951) (728,202) (1,019,127) (1,210,581) (1,213,551) (1,404,647) 5 Net Undergraduate Tuition & Fees (574,437) (513,728) (863,855) (1,038,106) (1,041,076) (1,239,991) 6 Gross Graduate Tuition & Fees Graduate Financial Aid Net Graduate Tuition & Fees Room & Board Grants & Contracts - - 7,095-9,375 9, Facilities & Admin Cost Recovery Endowment Distributions 876,886 1,029,744 1,077,878 1,194, ,548 1,186, Gift Contributions 29,687 59,752 81,144 30,000 25,000 25, Investment Income Internal & External Sales 1, Total Revenues 354, , , ,271 18,071 27, Administrative Cost Distribution Subvention Distribution 1,155,106 1,539,813 1,430,963 1,366,742 1,298,480 1,370, Total Revenues & Revenue Allocations $ 1,510,011 $ 2,138,693 $ 1,776,608 $ 1,600,013 $ 1,316,551 $ 1,398, Funding Transfers $ (21,706) $ (44,494) $ (113,604) $ (60,670) $ (41,375) $ (486,375) EXPENSES 21 Total Salaries, Wages, & Other Payroll 778, , , , , , Total Benefits 250, , , , , , Supplies & Services 338, , , , , , Professional Services 15,500 8,962 18,511-12, , Occupancy & Maintenance 5,298 9,439 5,094 16,730 16,300 18, Capital Costs Cost Of Goods Sold External Debt Service - Principal External Debt Service - Interest Internal Principal & Interest Depreciation Other Operating Expense 3,568 2, Total Direct Expenses 1,391,362 1,459,095 1,324,940 1,534,992 1,445,021 1,578, Administrative Cost Allocations 106, , , , , , Capital Cost Allocation - 9,179 9,265 9,005 9,005 9, Subvention Allocation 5,306 22,488 16,198 23,706 23,706 22, Total Expenses & Expense Allocations $ 1,503,276 $ 1,599,290 $ 1,554,630 $ 1,750,885 $ 1,660,914 $ 1,792, Results of Operations $ 28,440 $ 583,897 $ 335,583 $ (90,202) $ (302,988) $ 92,854 INVESTMENT TRANSFERS 39 Transfer To (From) Operating Reserve (94,022) (94,022) - 40 Transfer To (From) Plant Fund 56,042 (15,091) Transfer To (From) Quasi Endowments Repair & Replacement Transfers Internal Bank Transfers Other Transfers Total Investment Transfers $ 56,042 $ (15,091) $ - $ (94,022) $ (94,022) $ - 46 Net Results $ (27,601) $ 598,988 $ 335,583 $ 3,820 $ (208,966) $ 92, Transfer Net Results to Fund Balance (27,601) 598, ,583 3,820 (208,966) 92, Adjusted Net Results $ - $ - $ - $ - $ - $ Total Transfer To (From) Reserve (27,601) 598, ,583 (90,202) (302,988) 92,854
134 HONORS TUTORIAL COLLEGE STRATEGIC RESOURCE OPPORTUNITIES AND CHALLENGES The college s financial goals are to deliver high-quality academic and enrichment programs as efficiently as possible and to steward endowments responsibly. The Manasseh Cutler Scholars Program (CSP) joined the Honors Tutorial College in FY16. The pilot of the OHIO Honors Program (OHP) will launch in FY19. INVESTMENT IN PROGRAMS, ACTIVITIES AND FACILITIES Trisolini House, home of the Manasseh Cutler Scholars Program (CSP), has significant deferred maintenance needs. University Planning has identified CSP as one of the programs that will be housed in the proposed Center for Academic Engagement in the renovated 29 Park Place complex. By FY20, the CSP will serve 65 scholars enrolled in degree programs across campus. A steering committee of administrative leaders and faculty members from all colleges is working to enhance and refine the curricular components of the proposed OHIO Honors Program (OHP) that will serve 4 to 5% of Athens campus undergraduates in all majors and boost institutional recruitment and retention efforts. In fall 2018, OHP will welcome a pilot class of approximately 100 first-year students from select majors. An Associate Director for OHP will join the unit in May KEY TRENDS & DRIVERS HTC offers 38 programs of study in partnership with the College of Arts & Sciences, College of Fine Arts, College of Health Sciences & Professions, Scripps College of Communication, and the Russ College of Engineering. The College s share of tuition and state appropriations flows directly to the colleges that house the faculty who teach and advise our students, except for the credit hour revenue generated by HTC courses. It is anticipated that a similar model will be used for the expanded OHIO Honors Program. For the third year in a row, the yield rate for admitted HTC first-year students is above 70%. The FY19 incoming class is anticipated to include 75 high-achieving students from across the state and nation. HTC students receive Signature Premier Scholarships, which are valued at the cost of full in-state tuition. Cutler Scholars receive generous endowed scholarships of varying amounts and $3,000 annually for enrichment activities. The Office of Nationally Competitive Awards (ONCA) helps graduate and undergraduate students apply for internationally competitive scholarships, fellowships, and summer enrichment activities. The planning unit will fill three existing positions the dean of the college, the director of the Office of Nationally Competitive Awards, and the HTC group II faculty member in FY19.
135
136 Office of Global Affairs & International Studies FY19 Budgeted Revenues FY19 Budgeted Expenses & Allocations 13,800, 0% 234,320, 4% 903,565, 17% 5,000, 0% 5,970, 0% 112,170, 2% 2,133,194, 33% State Appropriations Tuition, net $5,478,711 $6,443,823 Grants & Contracts/F&A Private Support 3,595,799, 56% 591,690, 9% 4,327,026, 79% Salaries, Wages, & Other Payroll Benefits Operating Expenses Capital Costs Debt Service Capital Cost Allocation Five Year Faculty/Staff Headcount Trends FY14 FY15 FY16 FY17 FY18 Administrator Classified Non Bargaining Group I Faculty Group IV Faculty Year Student Enrollment by Classification 5-Year Athens Undergraduate Credit Hour Production ,800 1,750 1, ** 1,700 1,650 1,600 1,550 1,500 1,450 1,400 1,350 1,586 1,586 1,547 1, ** ** Athens Undergrad Athens Graduate Graduate Outreach Athens Undergraduate **Unit Projections **Unit Projections
137 OGAIS FY15 Actuals FY16 Actuals FY17 Actuals FY18 Budget FY18 Forecast FY19 Budget REVENUES 1 State Appropriations $ 671,172 $ 685,440 $ 783,331 $ 874,668 $ 874,668 $ 903,565 2 State Appropriations - Capital Gross Undergraduate Tuition & Fees 3,420,681 4,779,223 4,790,851 4,831,583 5,225,633 4,916,730 4 Undergraduate Financial Aid (429,606) (695,420) (776,325) (304,571) (770,806) (719,069) 5 Net Undergraduate Tuition & Fees 2,991,075 4,083,803 4,014,526 4,527,012 4,454,828 4,197,662 6 Gross Graduate Tuition & Fees 2,008,733 1,642,262 1,447,034 1,743,600 1,598,519 1,598,519 7 Graduate Financial Aid (1,818,062) (1,336,483) (1,329,929) (1,464,753) (1,469,155) (1,469,155) 8 Net Graduate Tuition & Fees 190, , , , , ,364 9 Room & Board Grants & Contracts 582, , , ,325 13, Facilities & Admin Cost Recovery 11,925 2,133 17, Endowment Distributions 212, , , , , , Gift Contributions 27,595 (2,323) Investment Income Internal & External Sales 156, , , ,026 1,086, Total Revenues 4,843,908 6,009,133 6,221,161 6,411,873 6,905,311 5,478, Administrative Cost Distribution Subvention Distribution 2,589,472 2,769,565 2,360,455 2,211,460 2,211,460 2,706, Total Revenues & Revenue Allocations $ 7,433,380 $ 8,778,699 $ 8,581,616 $ 8,623,333 $ 9,116,771 $ 8,185, Funding Transfers $ (188,396) $ 130,694 $ 133,445 $ 65,000 $ 130,200 $ 65,640 EXPENSES 21 Total Salaries, Wages, & Other Payroll 2,386,244 2,378,122 2,582,917 2,257,641 2,174,603 2,133, Total Benefits 575, , , , , , Supplies & Services 2,296,334 3,401,344 3,080,532 3,711,223 3,435,892 3,483, Professional Services 378, , , , ,929 55, Occupancy & Maintenance 41,223 69,441 74,251 13,200 14,646 16, Capital Costs - 3,000-10,000-5, Cost Of Goods Sold External Debt Service - Principal External Debt Service - Interest Internal Principal & Interest 5,879 5,879 5,879 5,970 5,970 5, Depreciation Other Operating Expense 7,268 12,725 13,571 48,063 33,123 41, Total Direct Expenses 5,691,400 6,962,052 6,811,987 6,844,196 6,411,825 6,331, Administrative Cost Allocations 1,250,460 1,226,532 1,156,858 1,051,418 1,051,418 1,044, Capital Cost Allocation - 163, , , , , Subvention Allocation 471, , , , , , Total Expenses & Expense Allocations $ 7,413,686 $ 8,864,558 $ 8,590,949 $ 8,470,639 $ 8,004,642 $ 7,884, Results of Operations $ 208,089 $ (216,553) $ (142,778) $ 87,694 $ 981,929 $ 234,945 INVESTMENT TRANSFERS 39 Transfer To (From) Operating Reserve Transfer To (From) Plant Fund 12, Transfer To (From) Quasi Endowments Repair & Replacement Transfers Internal Bank Transfers Other Transfers (1,160) (7,671) (3,258) Total Investment Transfers $ 11,821 $ (7,067) $ (3,258) $ - $ - $ - 46 Net Results $ 196,268 $ (209,487) $ (139,520) $ 87,694 $ 981,929 $ 234, Transfer Net Results to Fund Balance 196,268 (209,487) (139,520) 87, , , Adjusted Net Results $ - $ - $ - $ - $ - $ Total Transfer To (From) Reserve 196,268 (209,487) (139,520) 87, , ,945
138 OFFICE OF GLOBAL AFFAIRS AND INTERNATIONAL STUDIES STRATEGIC RESOURCE OPPORTUNITIES AND CHALLENGES The Office of Global Affairs and International Studies (OGAIS) overall is experiencing no major changes in resources The Center for International Studies (CIS) student enrollments remain consistent and tuition revenues are expected to remain flat. INVESTMENT IN PROGRAMS, ACTIVITIES AND FACILITIES CIS is developing series of new educational offerings including but not limited to 4+1 degree programs, continuing education through GLC for high school students and/or lifelong learners, and online courses. CIS hired a world languages lecturer/coordinator with a goal to increase world languages (formerly less commonly taught languages) enrollment at the university. Investing more time and resources in enrollment and retention strategies is also a critical focus. The Office of Global Opportunities (OGO) is exploring software/cloud solutions that could support travel tracking of students. This would help support risk mitigation and management efforts, provide better and quicker support for travelers and could seamlessly connect with OHIO s existing risk management tools (e.g. study abroad health insurance and International SOS membership). The Office of Global Affairs (OGA) continues to implement the global communication and networking strategy to mainstream globalization across the university. OGA will also continue to develop performance metrics and a database to support measurement of outcomes and to strengthen relationship management across the university and increase strategic partnership activities. International Student and Faculty Services (ISFS) is utilizing funds requested through FY17 carryforward process to upgrade Walter International Education Center s meeting room hardware. Replacement of aging projectors with television screens and updates to computer systems is required to support student immigration support system implementation. KEY TRENDS & DRIVERS CIS aims to increase quality of programs and revenue streams through a reorganization of human resources and investment of modest resources to focus on student needs and faculty support. OGO continues to strategize around new allocation model and how the funds will be used to best support mission activities. Deadlines for new proposal submissions have been modified to better align it to the budget timeline to facilitate accurate estimate of credit hours to be used in the coming fiscal year. Program coordinators are managing larger portfolios in addition to other responsibilities such as risk management and oversight of student advising. ISFS has finalized a reorganization and firmed up the permanent positions. The Director of International Services and Operations is charged to forge a stronger relationship with internal and external constituents and support international student success through mainstreaming of programs and capacity building across the university. The Associate Director will lead the immigration support for international students and scholars. A final recommendation has been provided to the EVPP that OPIE report directly to the Dean of College of Arts and Sciences or relocate to OGAIS in the interest of best supporting international recruitment and retention.
139
140 University College FY19 Budgeted Revenues 100,005, 1% 109,000, 2% 315,000, 4% FY19 Budgeted Expenses & Allocations 109,359, 2% 797,097, 13% 1,912,082, 28% State Appropriations Tuition, net $6,892,113 Grants & Contracts/F&A 1,232,825, 20% $6,156,553 Private Support Internal & External Sales 4,017,272, 65% Salaries, Wages, & Other Payroll Benefits Operating Expenses Capital Cost Allocation 4,456,026, 65% Five Year Faculty/Staff Headcount Trends FY14 FY15 FY16 FY17 FY18 Administrator Classified Non Bargaining Group II Faculty Year Student Enrollment by Classification 5-Year Athens Undergraduate Credit Hour Production 3,000 2,500 2,000 2,537 2,341 2,277 2,026 2,000 10,000 9,000 8,000 7,000 6,000 7,749 8,704 8,564 8,550 8,550 1,500 5,000 1,000 4,000 3, ** 2,000 1, ** ** Athens Undergrad Athens Undergraduate Undergraduate elearning **Unit Projections **Unit Projections
141 University College FY15 Actuals FY16 Actuals FY17 Actuals FY18 Budget FY18 Forecast FY19 Budget REVENUES 1 State Appropriations $ 3,666,444 $ 2,989,140 $ 1,956,593 $ 1,989,706 $ 1,989,706 $ 1,912,082 2 State Appropriations - Capital Gross Undergraduate Tuition & Fees 4,953,501 5,543,921 7,062,211 7,259,628 7,259,628 6,764,421 4 Undergraduate Financial Aid (2,026,372) (2,188,378) (2,449,247) (2,319,833) (2,337,387) (2,300,207) 5 Net Undergraduate Tuition & Fees 2,927,129 3,355,543 4,612,964 4,939,795 4,922,241 4,464,214 6 Gross Graduate Tuition & Fees Graduate Financial Aid - (24,602) (18,376) - (8,188) (8,188) 8 Net Graduate Tuition & Fees - (24,602) (18,376) - (8,188) (8,188) 9 Room & Board Grants & Contracts 294, , , , , , Facilities & Admin Cost Recovery 21,273 16,135 16, Endowment Distributions 12,548 16,039 17,446 22,482 22,482 25, Gift Contributions 121,383 60,791 53,483 75,000 75,000 75, Investment Income Internal & External Sales 129, , , , , , Total Revenues 7,172,521 6,794,884 7,069,457 7,450,983 7,425,241 6,892, Administrative Cost Distribution Subvention Distribution 5,457,556 7,292,886 11,045,942 10,568,487 10,568,487 9,763, Total Revenues & Revenue Allocations $ 12,630,077 $ 14,087,771 $ 18,115,399 $ 18,019,470 $ 17,993,728 $ 16,655, Funding Transfers $ (1,530,939) $ (881,554) $ (352,325) $ (626,704) $ (215,811) $ (253,325) EXPENSES 21 Total Salaries, Wages, & Other Payroll 3,880,465 4,077,062 4,326,804 4,017,395 4,025,395 4,017, Total Benefits 1,163,260 1,265,819 1,303,224 1,431,417 1,431,418 1,232, Supplies & Services 645, , , , , , Professional Services 157, , , , , , Occupancy & Maintenance 54,712 49,094 47,827 48,536 68,668 33, Capital Costs 5, Cost Of Goods Sold - 1, External Debt Service - Principal External Debt Service - Interest Internal Principal & Interest Depreciation Other Operating Expense 7,629 (529) 1,216 17,500 17, Total Direct Expenses 5,914,717 6,769,308 6,860,563 6,921,957 6,538,326 6,047, Administrative Cost Allocations 7,001,028 7,419,024 11,038,545 10,741,692 10,741,692 9,951, Capital Cost Allocation - 65,819 79, , , , Subvention Allocation 915, , , , , , Total Expenses & Expense Allocations $ 13,831,637 $ 15,013,890 $ 18,719,007 $ 18,646,173 $ 18,262,542 $ 16,909, Results of Operations $ 329,380 $ (44,566) $ (251,283) $ 1 $ (53,003) $ - INVESTMENT TRANSFERS 39 Transfer To (From) Operating Reserve Transfer To (From) Plant Fund 3, ,000 (27,472) Transfer To (From) Quasi Endowments Repair & Replacement Transfers Internal Bank Transfers Other Transfers Total Investment Transfers $ 3,521 $ 241,000 $ (27,472) $ - $ - $ - 46 Net Results $ 325,859 $ (285,566) $ (223,811) $ 1 $ (53,003) $ - 47 Transfer Net Results to Fund Balance 325,859 (285,566) (223,811) 1 (53,003) - 48 Adjusted Net Results $ - $ - $ - $ - $ - $ Total Transfer To (From) Reserve 325,859 (285,566) (223,811) 1 (53,003) -
142 UNIVERSITY COLLEGE STRATEGIC RESOURCE OPPORTUNITIES AND CHALLENGES University College serves to fulfill unique needs within the institution through degree programs, facilitating access, fostering student engagement and success, and improving student retention. The programs, services, and initiatives of the College support students and academic departments across all colleges and campuses. The collaborative nature of the College s work has allowed us to strategically impact student success as well as utilize resources efficiently. INVESTMENT IN PROGRAMS, ACTIVITIES AND FACILITIES Innovative programs, activities, and partnerships that strategically impact individual students as well as institutional measures continue to be the priority for investments from the College. In partnership with other units the College has continued to invest in the implementation and improved utilization of the My Ohio Success Network (MOSN) to identify at risk students and deliver appropriate intervention. The College has continued to support faculty and professional advisors in using the system and has continued to partner with academic departments across campus to strategically expand the use of MOSN to meet departmental and student needs. The College continues to foster internal collaboration between units including cross-training graduate assistants to support multiple programs or services (such as academic skills coaching, tutoring, supplemental instruction), leveraging student contacts with Student Accessibility Services to fulfill College Achievement Program grant requirements, or combined training for student leaders in various programs (Learning Communities, tutoring, supplemental instruction). Deliberate partnership with Institutional Research to understand the impacts of academic advising for undecided students will assist the college in refining our advising process for undeclared majors and allow for partnerships with other colleges which better assists students in transitioning from undeclared to declared. KEY TRENDS & DRIVERS The College continues to be keenly focused on enrollment plans and goals to assure programs are right sized each year since many of the colleges services or programs are impacted by the overall numbers of students at the institution or entering the University each year. The College also identifies and incorporates emerging literature and best practices about how to impact retention, success, and graduation of specific populations to strategically support the institutional outcomes as well as address unique needs of student populations. The leadership of the College continues to engage in conversations about organizational efficiency and effectiveness to identify areas for more intentional collaboration, sharing of resources, or resource reallocation to increase our ability to achieve effective outcomes.
143
144 Voinovich School of Leadership & Public Affairs FY19 Budgeted Revenues FY19 Budgeted Expenses & Allocations 287,295, 2% 17,996, 0% 2,015,095, 16% 203,366, 1% State Appropriations Tuition, net $13,147,876 Grants & Contracts/F&A 7,300,529, 43% $16,915,458 3,047,202, 23% Private Support 7,780,288, 59% Internal & External Sales 7,245,085, 43% Salaries, Wages, & Other Payroll Benefits Operating Expenses Capital Cost Allocation 2,166,478, 13% 80 Five Year Faculty/Staff Headcount Trends FY14 FY15 FY16 FY17 FY18 Administrator Group I Faculty Group II Faculty Group IV Faculty Year Student Enrollment by Classification 5-Year Athens Undergraduate Credit Hour Production ** ** ** Athens Undergrad Athens Graduate Graduate Outreach Athens Undergraduate **Unit Projections **Unit Projections
145 Voinovich FY15 Actuals FY16 Actuals FY17 Actuals FY18 Budget FY18 Forecast FY19 Budget REVENUES 1 State Appropriations $ 986,577 $ 1,764,132 $ 2,138,252 $ 2,249,991 $ 1,952,991 $ 2,015,095 2 State Appropriations - Capital Gross Undergraduate Tuition & Fees 82, , , , , ,135 4 Undergraduate Financial Aid (17,372) (52,136) (20,096) (19,752) (19,752) (21,564) 5 Net Undergraduate Tuition & Fees 65,230 81,152 88,504 93,609 93,609 95,571 6 Gross Graduate Tuition & Fees 849, ,842 1,317,168 2,275,896 2,106,787 3,357,019 7 Graduate Financial Aid (391,562) (435,521) (480,308) (391,875) (384,244) (405,388) 8 Net Graduate Tuition & Fees 458, , ,860 1,884,021 1,722,543 2,951,631 9 Room & Board Grants & Contracts 4,224,505 4,528,206 4,335,395 5,796,085 6,676,390 6,896, Facilities & Admin Cost Recovery 609, , , , , , Endowment Distributions 16,385 17,065 17,560 19,432 19,432 64, Gift Contributions 123, ,453 65,782 41, , , Investment Income Internal & External Sales 326, , , ,191 37,996 17, Total Revenues 6,811,203 8,111,531 8,395,447 11,033,803 11,631,833 13,147, Administrative Cost Distribution Subvention Distribution 4,735,556 5,064,258 4,114,584 3,609,775 3,664,584 3,845, Total Revenues & Revenue Allocations $ 11,546,759 $ 13,175,788 $ 12,510,031 $ 14,643,578 $ 15,296,417 $ 16,993, Funding Transfers $ (1,307,238) $ (2,300,087) $ (1,801,954) $ (2,129,258) $ (1,857,677) $ (892,828) EXPENSES 21 Total Salaries, Wages, & Other Payroll 5,150,612 5,895,155 6,823,935 7,373,571 7,291,168 7,245, Total Benefits 1,554,817 1,808,428 2,025,041 2,225,072 2,187,898 2,166, Supplies & Services 714, , , , , , Professional Services 3,118,033 2,763,156 2,220,449 4,485,227 4,972,583 6,437, Occupancy & Maintenance 66,540 53,918 59,142 75,620 72,563 67, Capital Costs 14,945-16, Cost Of Goods Sold External Debt Service - Principal External Debt Service - Interest Internal Principal & Interest Depreciation Other Operating Expense 4, , Total Direct Expenses 10,623,719 11,317,318 12,047,703 15,017,135 15,425,668 16,712, Administrative Cost Allocations 1,909,668 1,621,140 1,328,441 1,304,529 1,304,529 1,536, Capital Cost Allocation - 215, , , , , Subvention Allocation 134, , , , , , Total Expenses & Expense Allocations $ 12,668,197 $ 13,320,904 $ 13,856,491 $ 16,946,556 $ 17,354,869 $ 19,033, Results of Operations $ 185,800 $ 2,154,971 $ 455,495 $ (173,719) $ (200,775) $ (1,147,556) INVESTMENT TRANSFERS 39 Transfer To (From) Operating Reserve (181,528) 13,252 (1,187,028) 40 Transfer To (From) Plant Fund (2,602) 6,130 83, Transfer To (From) Quasi Endowments Repair & Replacement Transfers Internal Bank Transfers Other Transfers - 7,499 (16,365) Total Investment Transfers $ (2,602) $ 13,629 $ 67,208 $ (181,528) $ 13,252 $ (1,187,028) 46 Net Results $ 188,401 $ 2,141,342 $ 388,287 $ 7,809 $ (214,027) $ 39, Transfer Net Results to Fund Balance 188,401 2,141, ,287 7,809 (214,027) 39, Adjusted Net Results $ - $ - $ - $ - $ - $ Total Transfer To (From) Reserve 188,401 2,141, ,287 (173,719) (200,775) (1,147,556)
146 VOINOVICH SCHOOL The Voinovich School of Leadership and Public Affairs is a catalyst for regional, state and national collective impact in a broad range of public and social engagement policy areas such as health and wellness, education, the environment, entrepreneurship, and economic development. Senator George V. Voinovich encouraged us to empower people and galvanize their energy and resources to help solve our problems, meet our challenges, and seize our opportunities. Over the last 10 years, the Voinovich School s efforts to achieve this vision have attracted national attention. The School has been ranked as the 39 th most Innovative Public Service School in the nation and elevated to the top 100 U.S. News and World Report Best Public Affairs Grad Schools climbing 20 places to 77 th nationally in 2017 alone. These are all the more impressive given that the School is just ten years old. No other public affairs school in the United States combines an educational mission with business technology commercialization, public sector capacity building and environmental impact.. As a result of this and other exciting work, the Voinovich School is recognized as a leader in areas as diverse as rural economic development, watershed remediation, and communitybased opiate addiction prevention. As described by Michael Smith, Dean of the School of Government at UNC Chapel Hill: June, 2017 Partnerships with nonprofit organizations, government and the private sector create public value by leveraging the expertise of 15 tenure-track faculty, 72 professional staff, 16 practitioners who serve as adjunct faculty, and more than a dozen Executives in Residence. Home to the Master of Public Administration and the Master of Science in Environmental Studies degree programs, the Voinovich School engages nearly 200 students in a combination of hands-on learning opportunities and networking to bring ideas to life. Students are integral partners with faculty and professional staff in conducting applied research and consulting. The School is ranked fourth in attracting external research and sponsored program dollars at Ohio University. These dollars, along with Ohio University s investment, support the Voinovich School s continued leadership in fulfilling President Nellis commitment to create an engagement ecosystem that serves as a positive catalyst of economic and quality of life change in Appalachia. STRATEGIC RESOURCE OPPORTUNITIES AND CHALLENGES The Voinovich School s strategy focuses on (1) public-private partnerships that address critical issues facing communities here in Ohio, the nation, and abroad (2) platform networks for success across the private, social and public sectors; and (3) drawing multidisciplinary resources from across campuses to support these partnerships and networks. Following this approach, the School has been able to provide resources and expertise to some of the State s most distressed communities, assisting them to build the local leadership and capacity necessary to identify and implement innovative solutions. Many of these innovations and partnership have been replicated at the State, regional, or national level. INVESTMENT IN PROGRAMS, ACTIVITIES AND FACILITIES The Voinovich School combines evidence-based intensive services, resource investment, innovation, and leadership development across the School s core areas. Professional and executive education: The School successfully launched and exceeded enrollment targets for a relocated Executive MPA program, now at the Dublin Integrated Extension Campus (DIEC), and a national online professional MPA in partnership with Pearson. We significantly increased Athens campus student research
147 engagement and mentoring in public service, environmental and entrepreneurial innovation. Additionally, we have started the Voinovich Academy for Excellence in Public Service in partnership with the City of Dublin, Ohio Department of Transportation, Ohio EPA, Ohio Conference of Community Development, and Franklin County Department of Job and Family Services. The Academy is currently providing state agencies with trainings ranging from strategic communications to performance measurement. In 2018, we will launch a new Smart Government leadership curriculum as well as leadership training with the Mayor s Partnership for Progress, a consortium of elected officials from 15 southern Ohio counties. Entrepreneurship and economic development: The School broke the $2 billion mark for economic and entrepreneurial impact as determined by aggregate state metrics for TechGROWTH Ohio (TGO), and the expansion of the School s award-winning 12 County Small Business Development Center and 58 County Procurement Technical Assistance Center. The School secured major new or renewed program awards with the U.S. Department of Energy (Piketon), U.S. Economic Development Administration, Jobs Ohio (Appalachian Partnership for Economic Growth), U.S. Small Business Administration (POWER) and U.S. Department of Labor. Global Cooling, a TGO client company based in The Plains, is the premier company in the Ohio Innovation Fund. Public and social innovation: The School provides national leadership in the field of substance abuse prevention through work with the Ohio Department of Mental Health and Addiction Services and 142 community-based organizations in 57 Ohio counties. Other health-related projects focus on AIDS, smoking cessation, integrated behavioral health services, and, in partnership with OHIO s HCOM, improvement of diabetes care in Southeastern Ohio. In collaboration with Battelle for Kids, the School is also working on an Appalachian New Economy Partnership funded innovation/venture development framework related to educational outcomes. Related work includes the previously mentioned Academy and numerous evaluations of local and statewide K-12 initiatives. In 2017, the School established the Social Enterprise Ecosystem (SEE), an innovative repurposing of traditional venture development tools to support organizations that combine social or environmental impact with profit generation. Environmental and energy: The School passed the 150-mile mark for restoring streams affected by acid mine drainage, and received major program awards from the U.S. Department of Energy, Ohio Environmental Protection Agency, Ohio Department of Natural Resources and the Sugar Bush Foundation. Project work in surface water, groundwater, wetlands, waste reduction, energy, sensor technology, wildlife habitat, and environmental mapping/analysis has expanded. In 2016, 20 projects were initiated totaling $1.9 million across the energy and environment program group. In 2016, cumulative support from both the Sugar Bush and AEP Foundations each topped $1 million. KEY TRENDS & DRIVERS The Voinovich School has an integrated financial strategy that links all revenues into an investment model focused on maximizing innovation, impact, and engagement. This approach aligns resources to School priorities, addresses financial challenges, and ties investment to measurable outcomes. Investment sources include 1) Ohio University base investments; 2) multi-year investments such as the expansion of the Appalachian New Economy Partnership, a launch of a Rural Revitalization Partnership, and the OHIO investment request; and 3) one-time only investments such as the OHIO Innovation Strategy to leverage external funding. Three key areas of growth driving changes to the School s income and expenditure budgets are the expansion and diversification of grants and contracts, the shift of the Executive MPA program to the Dublin Campus, and the expansion of the Online MPA program. In conclusion, the Voinovich School has a strong record of leveraging limited dollars to generate an impressive return on investment for Ohio University and the State. The School and its impact model are succeeding in generating external funding as well as real-world student learning opportunities, economic growth and opportunity, social impact, leadership and engagement.
148 Heritage College of Osteopathic Medicine FY19 Budgeted Revenues FY19 Budgeted Expenses & Allocations 1,851,429, 2% 2,898,393, 4% 710,694, 1% 4,373,652, 7% 245,900, 0% 9,701,173, 12% 22,386,376, 29% State Appropriations 14,067,992, 22% Tuition, net $78,870,793 Grants & Contracts/F&A $65,421,894 Private Support Internal & External Sales 11,270,798, 17% 42,033,422, 53% 34,752,858, 53% Salaries, Wages, & Other Payroll Benefits Operating Expenses Capital Costs Debt Service Capital Cost Allocation Five Year Faculty/Staff Headcount Trends 0 FY14 FY15 FY16 FY17 FY18 Administrator Classified Non Bargaining Early Retired Faculty Group I Faculty Group II Faculty Group IV Faculty Year Student Enrollment by Campus ** Athens Dublin Cleveland **Unit Projections
149 College of Medicine FY15 Actuals FY16 Actuals FY17 Actuals FY18 Budget FY18 Forecast FY19 Budget REVENUES 1 State Appropriations $ 16,012,460 $ 17,596,563 $ 19,318,846 $ 20,515,447 $ 20,740,867 $ 22,386,376 2 State Appropriations - Capital Gross Undergraduate Tuition & Fees 86, , , , , ,000 4 Undergraduate Financial Aid (49,675) (72,793) (45,512) (50,948) (45,780) (44,600) 5 Net Undergraduate Tuition & Fees 36,707 38,107 83,451 55,052 73,221 70,400 6 Gross Graduate Tuition & Fees 24,457,436 29,741,658 35,413,629 41,504,727 41,604,777 45,175,736 7 Graduate Financial Aid (2,460,050) (2,681,076) (3,087,117) (2,730,078) (3,086,478) (3,212,714) 8 Net Graduate Tuition & Fees 21,997,386 27,060,582 32,326,511 38,774,649 38,518,299 41,963,022 9 Room & Board Grants & Contracts 11,974,435 11,013,305 9,305,110 10,579,360 7,310,504 9,155, Facilities & Admin Cost Recovery 673, , , , , , Endowment Distributions 229, , , , ,313 1,011, Gift Contributions 2,347,484 1,329, ,362 1,085, , , Investment Income Internal & External Sales 2,093,942 1,605,445 3,621,427 1,187,274 3,272,082 2,898, Total Revenues 55,366,209 59,614,715 66,547,292 73,493,087 72,014,678 78,870, Administrative Cost Distribution Subvention Distribution 6,325,667 6,581,283 5,799,988 8,020,216 8,020,216 8,356, Total Revenues & Revenue Allocations $ 61,691,876 $ 66,195,998 $ 72,347,280 $ 81,513,303 $ 80,034,894 $ 87,227, Funding Transfers $ (409,322) $ (589,644) $ (1,298,693) $ (1,113,640) $ (1,486,054) $ 343,450 EXPENSES 21 Total Salaries, Wages, & Other Payroll 26,506,227 29,231,675 30,934,366 33,931,393 30,940,634 34,752, Total Benefits 8,650,247 9,536,920 9,798,508 11,248,503 8,487,788 11,270, Supplies & Services 6,351,312 6,011,422 6,258,802 6,760,367 7,191,316 6,824, Professional Services 2,468,130 3,286,229 3,551,708 4,188,488 3,547,265 3,280, Occupancy & Maintenance 1,124,248 1,148,315 1,817,880 1,268,588 1,116,109 2,096, Capital Costs 1,229,518 1,032, ,655 1,177, , , Cost Of Goods Sold 285, External Debt Service - Principal External Debt Service - Interest Internal Principal & Interest 140,339-1,223,637 3,291,019 3,480,921 4,373, Depreciation Other Operating Expense 1,646, ,970 1,098,850 2,183,983 3,958,253 1,866, Total Direct Expenses 48,401,701 51,146,892 55,539,406 64,050,195 59,550,512 64,711, Administrative Cost Allocations 7,451,202 7,267,392 8,182,181 8,001,646 8,001,646 8,524, Capital Cost Allocation , , , , Subvention Allocation 3,987,069 4,905,322 6,143,489 7,000,137 7,004,452 7,475, Total Expenses & Expense Allocations $ 59,839,972 $ 63,319,606 $ 70,531,423 $ 79,761,158 $ 77,056,144 $ 81,421, Results of Operations $ 2,261,225 $ 3,466,036 $ 3,114,550 $ 2,865,785 $ 4,464,804 $ 5,462,206 INVESTMENT TRANSFERS 39 Transfer To (From) Operating Reserve (1,032,116) (1,899,784) (289,172) 40 Transfer To (From) Plant Fund 399,803 1,626,055 5,911,791 4,141,156 2,566, , Transfer To (From) Quasi Endowments 5,000, ,000 2,500, Repair & Replacement Transfers Internal Bank Transfers Other Transfers 14,244 (29,369) (68,290) Total Investment Transfers $ 5,414,047 $ 1,721,685 $ 8,343,501 $ 3,109,040 $ 667,040 $ 508, Net Results $ (3,152,822) $ 1,744,351 $ (5,228,951) $ (243,255) $ 3,797,764 $ 4,953, Transfer Net Results to Fund Balance (3,152,822) 1,744,351 (5,228,951) (243,255) 3,797,764 4,953, Adjusted Net Results $ - $ - $ - $ - $ - $ Total Transfer To (From) Reserve (3,152,822) 1,744,351 (5,228,951) (1,275,371) 1,897,980 4,664,112
150 HERITAGE COLLEGE OF OSTEOPATHIC MEDICINE (HCOM) The Heritage College Budget Process Since our beginning, more than 40 years ago, The Ohio University Heritage College of Osteopathic Medicine has been guided by its founding idea: To train excellent osteopathic physicians who serve Ohio s communities of greatest need, especially in primary care fields. With the 2011 transformational gift of $105 million from the Osteopathic Heritage Foundation (OHF), we embarked on a period of growth and renewal. Our initiatives have been built upon our strengths and the beliefs we have championed since our founding. They deliver on our promise of advancing our mission to meet the challenges of successfully preparing the next generation of physician leaders. Our multi-year strategic planning process brings the college community together, and focuses our growth and renewal efforts. The strategy plan that emerges from this process provides a road map as we develop and operationalize new academic and clinical campuses, advance our research and community care programs, and strengthen the curriculum and our undergraduate and graduate medical education programs. This process allows us to strategically allocate our time and talent and integrates our financial planning and investment decisions. STRATEGIC RESOURCE OPPORTUNITIES AND CHALLENGES The College s FY19 multi-year budget planning process aligns our funding priorities with the College strategic plan, and includes the following highlighted resource opportunities and challenges: Newly established Heritage College Budget Planning Subcommittee provides shared communication, collaboration, and recommendations toward accomplishing the student affordability goals Hiring decisions based upon the multi-year strategic staffing plan Strengthening academic departments, including the establishment of market-based salary structures Senior Leadership alignment and succession planning Executing funding strategies to ensure success of the Osteopathic Heritage Foundation Grant Finalized funding solution for Student Health, covering all University Athens-based students College operational sustainability with enrollment growth of 82% from FY14 to FY20 Conservative assumptions regarding challenging State funding forecasts o Risk of reduced funding for State Subsidies, especially Clinical Teaching Competitive tuition pricing o Tuition modeling to predict future tuition prices and revenues o Minimize level of medical student debt INVESTMENT IN PROGRAMS, ACTIVITIES AND FACILITIES New physician practice plan, Ohio Health Physician Group Heritage College providing faculty benefits of stable practice, enhanced compensation, professional continuing medical education funding Sustaining college-wide capital planning for building depreciation, facility and equipment renewal and debt service Investing additional funds toward common research infrastructure to provide services and support for researchers o Research endowment growth from $1.48 million to $17 million by FY19 Partnering with other colleges on integrating and expanding academic programming Progressing with the discovery phase for a regional-based Diabetes Collaborative Modernizing and right-sizing Heritage campus facilities o New Athens educational facilities, phase one budgeted at $65M o Component of University Campus Master plan o Rebalancing of student enrollment across Athens, Dublin and Cleveland campuses
151 Assisting University with funding of the University Utility Master plan Launching Philanthropic Campaigns o Cleveland Diversity Scholarship (shared with Cleveland Clinic) o Additional $1.5 million to continue a second year of our successful $1M Match Scholarship Campaign o Student scholarship endowment principal growth from $4 million to $18 million by FY20 provides for increased tuition discounting Evolution of Clinical Education Training system o Establishment of new relationships and enhanced current relationships leading to: More than 75 new sites for clinical education Development of new high-quality rotations in Central Ohio for 50 students (~1200 new third-and fourth-year rotations) Creation of new Office of Clinical Education Transformation to the new medical education curriculum, Pathways to Health and Wellness Curriculum, anticipated launch in Fall 2018 Investing in technological advancements in alignment with curriculum and multiple campuses KEY TRENDS & DRIVERS Anticipating additional State Share of Instruction revenue due to increased medical student enrollments Conservative assumptions regarding challenging State funding forecasts Competitive tuition pricing to minimize medical student debt and ensure desired enrollment targets Growth in scholarship endowment principal to more than $18 million by FY20 will increase student scholarship offerings Growth in research endowment principal to more than $14M by FY19 will provide for additional research investments Dublin and Cleveland campuses revenues will level off as they fully load each campus enrollment to 200 students per campus o Dublin graduating their inaugural class in Spring 2018 o Cleveland admitting their fourth class in Fall 2018 Investments in personnel o Faculty teaching and research investments in Health Sciences, Primary Care, Diabetes Institute and Ohio Musculoskeletal and Neurological Institute o Enhancements of faculty compensation plan to ensure competitive recruitment and retention Investing in facility and equipment renewal, building depreciation and debt service Clinical education transformation and its use of reserve Debt service considerations for modernizing and right-sizing Heritage facilities Cleveland campus begins lease payments of South Pointe Hospital facility
152 Regional Higher Education FY19 Budgeted Revenues FY19 Budgeted Expenses & Allocations 1,851,429, 2% 2,898,393, 4% 177,653, 0% 271,550, 1% 6,110,997, 13% 9,701,173, 12% 22,386,376, 29% State Appropriations Tuition, net 10,377,048, 21% $55,366,308 Grants & Contracts/F&A $48,125,043 Private Support Internal & External Sales 31,187,795, 65% Salaries, Wages, & Other Payroll Benefits Operating Expenses Capital Costs Debt Service 42,033,422, 53% 140 Five Year Faculty/Staff Headcount Trends FY14 FY15 FY16 FY17 FY18 Administrator Classified AFSCME Classified Non Bargaining Early Retired Faculty Group I Faculty Group II Faculty Group IV Faculty Year Credit Hour Production by Campus 48,981 45,076 43,466 41,600 39,441 50,666 46,800 43,658 39,793 40,349 41,915 40,616 39,673 40,011 38,522 38,254 39,284 37,571 33,941 32,185 19,630 19,335 18,920 17,999 17,070 Chillicothe Eastern Lancaster Southern Zanesville ** ** **Unit Projections
153 Regional Campuses FY15 Actuals FY16 Actuals FY17 Actuals FY18 Budget FY18 Forecast FY19 Budget REVENUES 1 State Appropriations $ 17,941,203 $ 18,208,020 $ 27,668,083 $ 24,329,278 $ 24,329,278 $ 22,432,188 2 State Appropriations - Capital Gross Undergraduate Tuition & Fees 39,170,538 37,206,029 36,665,112 35,447,142 35,630,829 35,181,213 4 Undergraduate Financial Aid (5,415,854) (5,992,486) (5,529,080) (5,403,579) (5,178,448) (5,164,509) 5 Net Undergraduate Tuition & Fees 33,754,683 31,213,544 31,136,032 30,043,563 30,452,381 30,016,704 6 Gross Graduate Tuition & Fees 472, , , , , ,105 7 Graduate Financial Aid (100,714) (60,496) (63,280) (70,000) (25,375) (25,375) 8 Net Graduate Tuition & Fees 372, , , , , ,730 9 Room & Board Grants & Contracts 1,090,487 1,720,088 1,961,217 2,077,859 1,428,700 1,428, Facilities & Admin Cost Recovery 1,326 1,134 15, Endowment Distributions 444, , , , , , Gift Contributions 344, , , , , , Investment Income Internal & External Sales 1,115, ,133 1,223, , , , Total Revenues 55,064,904 52,910,927 63,067,576 58,505,969 57,665,161 55,366, Administrative Cost Distribution Subvention Distribution 17,567,171 19,853,589 14,986,931 14,511,835 14,511,835 14,511, Total Revenues & Revenue Allocations $ 72,632,075 $ 72,764,516 $ 78,054,507 $ 73,017,804 $ 72,176,996 $ 69,878, Funding Transfers $ 676,191 $ 677,696 $ 494,937 $ (682,076) $ (1,258,892) $ (485,057) EXPENSES 21 Total Salaries, Wages, & Other Payroll 35,137,597 33,900,245 33,290,820 32,917,786 33,368,227 31,187, Total Benefits 11,022,581 11,000,473 10,686,261 10,971,430 10,732,235 10,377, Supplies & Services 4,994,841 3,802,123 3,641,817 3,375,691 3,231,862 3,084, Professional Services 964, , , , , , Occupancy & Maintenance 2,821,108 2,669,970 2,372,936 2,568,951 2,355,607 2,054, Capital Costs 759, , ,368 42, , , Cost Of Goods Sold 8,287 3,916 2,746 2,000 6,236 5, External Debt Service - Principal External Debt Service - Interest Internal Principal & Interest 263, , , , , , Depreciation Other Operating Expense 340, ,041 1,027, , , , Total Direct Expenses 56,313,049 53,128,913 52,791,827 50,995,023 51,112,130 48,125, Administrative Cost Allocations 13,407,924 14,821,392 16,497,347 15,400,222 15,400,222 15,435, Capital Cost Allocation Subvention Allocation 6,414,261 6,527,064 7,324,942 6,789,625 6,999,104 6,697, Total Expenses & Expense Allocations $ 76,135,234 $ 74,477,369 $ 76,614,116 $ 73,184,870 $ 73,511,456 $ 70,258, Results of Operations $ (4,179,350) $ (2,390,549) $ 945,454 $ 515,010 $ (75,568) $ 104,770 INVESTMENT TRANSFERS 39 Transfer To (From) Operating Reserve Transfer To (From) Plant Fund (353,570) (94,777) (2,119,224) Transfer To (From) Quasi Endowments 15, Repair & Replacement Transfers Internal Bank Transfers Other Transfers , Total Investment Transfers $ (338,570) $ (93,831) $ (2,114,132) $ - $ - $ - 46 Net Results $ (3,840,780) $ (2,296,718) $ 3,059,586 $ 515,010 $ (75,568) $ 104, Transfer Net Results to Fund Balance (3,840,780) (2,296,718) 3,059, ,010 (75,568) 104, Adjusted Net Results $ - $ - $ - $ - $ - $ Total Transfer To (From) Reserve (3,840,780) (2,296,718) 3,059, ,010 (75,568) 104,770
154 REGIONAL HIGHER EDUCATION STRATEGIC RESOURCE OPPORTUNITIES AND CHALLENGES Regional Higher Education provides access to quality OHIO education in the communities surrounding the five campuses and two centers. Opportunities include expanding academic programs and providing enrichment for the communities through workforce development, continuing education units (CEU s) and certificate programs. Partnerships with Athens colleges provide opportunities to expand programs. Challenges continue with enrollment shifts as high school graduation rates decline and the economy improves as well as the future impact of College Credit Plus. RHE Study Committee will provide an opportunity to recommend a sustainable academics and resource model for the regional campuses that aligns with the entire University and its OHIO for Ohio Strategy. INVESTMENT IN PROGRAMS, ACTIVITIES AND FACILITIES Investing in baccalaureate programs such as Allied Health, Applied Management, Human Biology, Nursing, Sports and Lifestyle Studies, and Social Work. Investing in marketing of online programs such as Applied Management, Technical and Applied Studies, Real Estate and Equine Studies. Partnering with area businesses such as hospitals to expand cohorts for programs such as Applied Management and Technical and Applied Studies. Partnering with University College to expand the print based program. Creating partnerships with colleges to extend academic programs to the regional campuses. Focusing on advising and providing resources to increase retention and completion rates. Investing in software to develop, enhance and target communication for recruitment efforts. Examining the business model for the regional campuses. Examining the potential for energy savings performance contracts to leverage utilities Exploring potential monetization of regional campus assets. KEY TRENDS & DRIVERS Regional Higher Education continues to focus its efforts to identify efficiencies in operations while examining its business model. These efforts include examining course scheduling practices including eliminating duplication and expanding the use of distance education.
155 12 Auxiliary Planning Units The following section contains dashboard metrics and income statements for Auxiliary Planning Units. Auxiliaries exist to support the academic mission and vision of OHIO by providing services to all campus customers and guests. Auxiliaries are revenue-generating units that are assessed allocated costs using the RCM methodology. Auxiliaries include: Intercollegiate Athletics, Culinary Services, Housing & Residence Life, Parking and Transportation, and Printing.

156 12.1 Intercollegiate Athletics FY19 Budgeted Revenues FY19 Budgeted Expenses & Allocations 1,422,691, 7% 2,701,576, 13% 2,926,964, 28% 7,675,507, 36% -, 0% Private Support $10,534,477 $21,057,251 Internal & External Sales 6,749,876, 32% Salaries, Wages, & Other Payroll Benefits Operating Expenses Capital Costs Debt Service Capital Cost Allocation 7,607,513, 72% 2,507,601, 12% Summary of Athletics' Revenue Private Support FY18 Forecast FY19 Budget Endowment Distributions 133, ,078 Gifts 2,286,321 2,757,886 Subtotal: Private Support 2,419,749 2,926,964 Internal and External Sales FY18 Forecast FY19 Budget Advertising 1,080,000 1,105,000 Concessions 205, ,000 Game Guarantees 690, ,000 Gate Receipts 1,008,957 1,211,803 Licensing/Royalties 375, ,000 MAC Distributions 1,755,550 1,667,550 NCAA Distributions 1,299,950 1,362,710 Pouring Rights 205, ,000 Sports Camp 405, ,000 Other 159, ,450 Subtotal: Internal & External Sales 7,183,957 7,607,513 Five Year Faculty/Staff Headcount Trends FY14 FY15 FY16 FY17 FY18 Administrator Classified Non Bargaining
157 Athletics FY15 Actuals FY16 Actuals FY17 Actuals FY18 Budget FY18 Forecast FY19 Budget REVENUES 1 State Appropriations $ - $ - $ - $ - $ - $ - 2 State Appropriations - Capital Gross Undergraduate Tuition & Fees 33, Undergraduate Financial Aid (7,461,278) (8,677,589) (8,292,786) (8,434,880) (8,101,294) (8,361,397) 5 Net Undergraduate Tuition & Fees (7,427,971) (8,677,589) (8,292,786) (8,434,880) (8,101,294) (8,361,397) 6 Gross Graduate Tuition & Fees Graduate Financial Aid (9,889) (6,130) (6,372) Net Graduate Tuition & Fees (9,889) (6,130) (6,372) Room & Board Grants & Contracts 55,182 60,196 12,648 58, Facilities & Admin Cost Recovery Endowment Distributions 156, , , , , , Gift Contributions 3,048,380 3,331,622 2,084,886 2,440,678 2,286,321 2,757, Investment Income Internal & External Sales 6,604,908 8,058,471 9,764,123 6,827,000 7,308,957 7,607, Total Revenues 2,427,196 2,929,654 3,722,799 1,057,906 1,627,412 2,173, Administrative Cost Distribution 15,918,085 17,326,133 21,467,690 21,989,828 21,689,919 23,806, Subvention Distribution Total Revenues & Revenue Allocations $ 18,345,281 $ 20,255,786 $ 25,190,488 $ 23,047,734 $ 23,317,331 $ 25,979, Funding Transfers $ (406,904) $ (432,044) $ (107,781) $ (12,676) $ (12,676) $ (12,676) EXPENSES 21 Total Salaries, Wages, & Other Payroll 6,822,392 7,172,199 7,606,025 7,408,166 7,541,885 7,675, Total Benefits 2,027,030 2,084,767 2,181,628 2,440,409 2,432,396 2,507, Supplies & Services 4,610,013 5,399,818 5,856,330 3,983,568 4,000,026 4,273, Professional Services 420, , , , , , Occupancy & Maintenance 1,046,725 1,001,023 1,802,421 1,114, , , Capital Costs 1,034,635 2,528, ,574 45, Cost Of Goods Sold - - 1, External Debt Service - Principal External Debt Service - Interest Internal Principal & Interest 227, ,652 1,424,462 2,671,733 2,625,351 2,701, Depreciation Other Operating Expense 1,832,751 1,765,802 1,255, ,268 1,509,176 1,141, Total Direct Expenses 18,021,820 20,822,385 21,466,962 19,186,836 19,273,011 19,634, Administrative Cost Allocations (889,204) (885,192) 2,939,447 2,983,560 2,983,560 4,806, Capital Cost Allocation ,834 1,578,228 1,578,228 1,422, Subvention Allocation Total Expenses & Expense Allocations $ 17,132,616 $ 19,937,193 $ 25,243,243 $ 23,748,624 $ 23,834,799 $ 25,864, Results of Operations $ 1,619,570 $ 750,636 $ 55,026 $ (688,214) $ (504,792) $ 127,984 INVESTMENT TRANSFERS 39 Transfer To (From) Operating Reserve (528,077) (129,119) 40 Transfer To (From) Plant Fund 104,303 36,775 (264,680) 2,632, , , Transfer To (From) Quasi Endowments Repair & Replacement Transfers Internal Bank Transfers Other Transfers Total Investment Transfers $ 104,303 $ 36,775 $ (264,680) $ 2,632,447 $ 146,923 $ 120, Net Results $ 1,515,267 $ 713,861 $ 319,706 $ (3,320,661) $ (651,715) $ 7, Transfer Net Results to Fund Balance 1,515, , ,706 (3,320,661) (651,715) 7, Adjusted Net Results $ - $ - $ - $ - $ - $ Total Transfer To (From) Reserve 1,515, , ,706 (3,320,661) (1,179,792) (122,016)
158 12.2 Culinary Services FY19 Budgeted Revenues FY19 Budgeted Expenses 307,980, 1% 6,351,734, 14% $45,639,442 Room & Board Internal & External Sales 15,635,985, 43% $37,743,436 14,350,245, 39% Salaries, Wages, & Other Payroll Benefits Operating Expenses Debt Service 39,287,708, 86% 6,049,226, 17% Five Year Faculty/Staff Headcount Trends FY14 FY15 FY16 FY17 FY18 Administrator Classified AFSCME Classified Non Bargaining
159 Culinary Services FY15 Actuals FY16 Actuals FY17 Actuals FY18 Budget FY18 Forecast FY19 Budget REVENUES 1 State Appropriations $ - $ - $ - $ - $ - $ - 2 State Appropriations - Capital Gross Undergraduate Tuition & Fees (452) Undergraduate Financial Aid (11,946) (1,000,240) (1,333,333) (3,166,667) (3,166,667) (3,500,000) 5 Net Undergraduate Tuition & Fees (12,398) (1,000,240) (1,333,333) (3,166,667) (3,166,667) (3,500,000) 6 Gross Graduate Tuition & Fees Graduate Financial Aid Net Graduate Tuition & Fees Room & Board 40,039,162 41,822,991 41,214,916 39,844,024 39,708,927 39,287, Grants & Contracts Facilities & Admin Cost Recovery Endowment Distributions Gift Contributions Investment Income Internal & External Sales 7,233,993 7,462,733 7,233,245 7,628,663 6,627,482 6,351, Total Revenues 47,260,840 48,285,484 47,114,828 44,306,020 43,169,742 42,139, Administrative Cost Distribution Subvention Distribution Total Revenues & Revenue Allocations $ 47,260,840 $ 48,285,484 $ 47,114,828 $ 44,306,020 $ 43,169,742 $ 42,139, Funding Transfers $ 142,278 $ 223,097 $ 101,631 $ 251,564 $ 251,564 $ 345,775 EXPENSES 21 Total Salaries, Wages, & Other Payroll 12,140,420 13,652,503 14,247,769 14,629,974 14,522,499 14,350, Total Benefits 3,983,874 4,734,240 4,821,143 6,034,269 5,083,395 6,049, Supplies & Services 2,258,362 2,911,194 2,506,351 2,868,299 2,194,724 2,249, Professional Services 413, , , ,710 96,210 72, Occupancy & Maintenance 1,041,937 1,009,280 1,161,348 1,147,545 1,300,782 1,115, Capital Costs 382, , ,191 1,500,000 1,250,000 1,400, Cost Of Goods Sold 12,826,553 12,768,722 12,634,303 13,082,112 12,601,132 12,141, External Debt Service - Principal External Debt Service - Interest Internal Principal & Interest - 103, , , , , Depreciation Other Operating Expense 155,828 51,126 48,145 51, ,999 57, Total Direct Expenses 33,202,644 35,881,337 36,080,603 39,724,289 37,552,721 37,743, Administrative Cost Allocations 2,358,048 2,443,104 2,806,165 2,856,823 2,856,823 3,004, Capital Cost Allocation Subvention Allocation Total Expenses & Expense Allocations $ 35,560,692 $ 38,324,441 $ 38,886,768 $ 42,581,112 $ 40,409,544 $ 40,747, Results of Operations $ 11,557,869 $ 9,737,946 $ 8,126,430 $ 1,473,344 $ 2,508,634 $ 1,045,831 INVESTMENT TRANSFERS 39 Transfer To (From) Operating Reserve Transfer To (From) Plant Fund 11,776,793 11,600, ,032 2,698, ,850 4,045, Transfer To (From) Quasi Endowments Repair & Replacement Transfers Internal Bank Transfers Other Transfers Total Investment Transfers $ 11,776,793 $ 11,600,476 $ 756,032 $ 2,698,712 $ 760,850 $ 4,045, Net Results $ (218,924) $ (1,862,530) $ 7,370,398 $ (1,225,368) $ 1,747,784 $ (2,999,317) 47 Transfer Net Results to Fund Balance (218,924) (1,862,530) 7,370,398 (1,225,368) 1,747,784 (2,999,317) 48 Adjusted Net Results $ - $ - $ - $ - $ - $ Total Transfer To (From) Reserve (218,924) (1,862,530) 7,370,398 (1,225,368) 1,747,784 (2,999,317)
160 12.3 Housing & Residence Life 1,804,660, 3% FY19 Budgeted Revenues FY19 Budgeted Expenses 6,247,122, 24% Room & Board Internal & External Sales 10,857,548, 41% $53,925,214 $26,619,030 1,457,888, 5% Salaries, Wages, & Other Payroll Benefits Operating Expenses Debt Service 52,120,554, 97% 8,035,472, 30% Five Year Faculty/Staff Headcount Trends FY14 FY15 FY16 FY17 FY18 Administrator Classified AFSCME Classified Non Bargaining
161 Housing & Residence Life FY15 Actuals FY16 Actuals FY17 Actuals FY18 Budget FY18 Forecast FY19 Budget REVENUES 1 State Appropriations $ - $ - $ - $ - $ - $ - 2 State Appropriations - Capital Gross Undergraduate Tuition & Fees 1, Undergraduate Financial Aid (22,067) (508,034) (689,619) (862,333) (885,965) (2,030,000) 5 Net Undergraduate Tuition & Fees (20,999) (508,034) (689,619) (862,333) (885,965) (2,030,000) 6 Gross Graduate Tuition & Fees Graduate Financial Aid (21,058) (14,122) (3,130) (29,564) (1,929) (24,564) 8 Net Graduate Tuition & Fees (21,058) (14,122) (3,130) (29,564) (1,929) (24,564) 9 Room & Board 49,939,404 54,034,180 54,178,013 53,041,463 52,580,760 52,120, Grants & Contracts 1, Facilities & Admin Cost Recovery Endowment Distributions Gift Contributions 4,175 6,725 3, Investment Income Internal & External Sales 1,598,115 2,028,109 1,762,790 1,769,160 1,831,148 1,804, Total Revenues 51,500,918 55,546,858 55,252,055 53,918,726 53,524,014 51,870, Administrative Cost Distribution 150, , , Subvention Distribution Total Revenues & Revenue Allocations $ 51,650,918 $ 55,696,858 $ 55,402,055 $ 53,918,726 $ 53,524,014 $ 51,870, Funding Transfers $ 476,635 $ 1,336,408 $ 959,251 $ 2,050,823 $ 2,293,120 $ 2,699,594 EXPENSES 21 Total Salaries, Wages, & Other Payroll 4,560,802 5,753,051 5,919,910 6,580,920 6,300,565 6,247, Total Benefits 1,088,123 1,185,209 1,184,277 1,494,006 1,447,149 1,457, Supplies & Services 1,415,398 2,666, ,520 1,373,175 1,567,946 1,792, Professional Services 1,286,201 1,336,309 32,730 35,000 50,000 39, Occupancy & Maintenance 4,403,906 4,022,241 4,107,576 5,946,167 4,052,725 5,325, Capital Costs 33,990 (1,531,789) - 21, ,717 21, Cost Of Goods Sold , External Debt Service - Principal External Debt Service - Interest Internal Principal & Interest 3,888,894 8,317,813 10,828,331 10,736,001 10,736,001 10,857, Depreciation Other Operating Expense 4,015,342 3,984, , , , , Total Direct Expenses 20,693,135 25,734,003 23,172,965 27,072,019 24,613,542 26,619, Administrative Cost Allocations 7,058,064 7,753,080 13,748,206 13,631,619 13,331,619 13,948, Capital Cost Allocation Subvention Allocation Total Expenses & Expense Allocations $ 27,751,199 $ 33,487,083 $ 36,921,170 $ 40,703,638 $ 37,945,161 $ 40,567, Results of Operations $ 23,423,084 $ 20,873,366 $ 17,521,634 $ 11,164,265 $ 13,285,733 $ 8,603,853 INVESTMENT TRANSFERS 39 Transfer To (From) Operating Reserve Transfer To (From) Plant Fund (443,263) 112,637 (94,590) - 14,418,152 12,273, Transfer To (From) Quasi Endowments Repair & Replacement Transfers Internal Bank Transfers Other Transfers Total Investment Transfers $ (443,263) $ 112,637 $ (94,590) $ - $ 14,418,152 $ 12,273, Net Results $ 23,866,347 $ 20,760,729 $ 17,616,224 $ 11,164,265 $ (1,132,419) $ (3,669,713) 47 Transfer Net Results to Fund Balance 23,866,347 20,760,729 17,616,224 11,164,265 (1,132,419) (3,669,713) 48 Adjusted Net Results $ - $ - $ - $ - $ - $ Total Transfer To (From) Reserve 23,866,347 20,760,729 17,616,224 11,164,265 (1,132,419) (3,669,713)
162 12.4 Parking & Transportation FY19 Budgeted Revenues FY19 Budgeted Expenses 100,000, 2% 1,477,839, 34% $5,444,629 Internal & External Sales $4,417,442 2,295,954, 52% Salaries, Wages, & Other Payroll Benefits Operating Expenses Debt Service 5,444,629, 100% 538,649, 12% Five Year Faculty/Staff Headcount Trends FY14 FY15 FY16 FY17 FY18 Administrator Classified AFSCME Classified Non Bargaining
163 Parking & Transportation FY15 Actuals FY16 Actuals FY17 Actuals FY18 Budget FY18 Forecast FY19 Budget REVENUES 1 State Appropriations $ - $ - $ - $ - $ - $ - 2 State Appropriations - Capital Gross Undergraduate Tuition & Fees - - (288) Undergraduate Financial Aid - (74) Net Undergraduate Tuition & Fees - (74) (288) Gross Graduate Tuition & Fees Graduate Financial Aid Net Graduate Tuition & Fees Room & Board Grants & Contracts Facilities & Admin Cost Recovery Endowment Distributions Gift Contributions Investment Income Internal & External Sales 5,275,692 5,140,843 5,710,457 4,898,364 5,244,168 5,444, Total Revenues 5,275,692 5,140,769 5,710,170 4,898,364 5,244,168 5,444, Administrative Cost Distribution Subvention Distribution Total Revenues & Revenue Allocations $ 5,275,692 $ 5,140,769 $ 5,710,170 $ 4,898,364 $ 5,244,168 $ 5,444, Funding Transfers $ (6,571) $ 20,937 $ 30,288 $ 122,000 $ 117,795 $ 299,381 EXPENSES 21 Total Salaries, Wages, & Other Payroll 1,302,643 1,441,168 1,550,952 1,500,504 1,461,240 1,477, Total Benefits 396, , , , , , Supplies & Services 659, , , ,071 2,021,951 1,289, Professional Services 91, , ,532 1, ,030 8, Occupancy & Maintenance 905, , , ,848 60, , Capital Costs 290,217 45, ,214-10,000 5, Cost Of Goods Sold 624, , , , , , External Debt Service - Principal External Debt Service - Interest Internal Principal & Interest 598, , , , , , Depreciation Other Operating Expense 30,296 38,975 72,978 9,796 9, Total Direct Expenses 4,899,728 4,369,954 4,796,238 4,083,696 5,116,127 4,417, Administrative Cost Allocations 271, , , , , , Capital Cost Allocation Subvention Allocation Total Expenses & Expense Allocations $ 5,171,276 $ 4,618,762 $ 5,006,866 $ 4,303,036 $ 5,335,467 $ 4,646, Results of Operations $ 110,987 $ 501,070 $ 673,016 $ 473,328 $ (209,094) $ 498,707 INVESTMENT TRANSFERS 39 Transfer To (From) Operating Reserve Transfer To (From) Plant Fund 174, ,921 (1,157,229) 150, , , Transfer To (From) Quasi Endowments Repair & Replacement Transfers , Internal Bank Transfers 21,456 77, , , , Other Transfers (225,000) Total Investment Transfers $ 196,316 $ 606,470 $ (1,054,473) $ 150,000 $ 254,000 $ 254, Net Results $ (85,329) $ (105,400) $ 1,727,489 $ 323,328 $ (463,094) $ 244, Transfer Net Results to Fund Balance (85,329) (105,400) 1,727, ,328 (463,094) 244, Adjusted Net Results $ - $ - $ - $ - $ - $ Total Transfer To (From) Reserve (85,329) (105,400) 1,727, ,328 (463,094) 244,707
164 12.5 Printing FY19 Budgeted Revenues FY19 Budgeted Expenses 722,303, 27% $3,139,932 Internal & External Sales $2,863,971 1,615,775, 61% 325,893, 12% Salaries, Wages, & Other Payroll Benefits Operating Expenses 3,139,932, 100% Five Year Faculty/Staff Headcount Trends FY14 FY15 FY16 FY17 FY18 Administrator Classified AFSCME Classified Non Bargaining
165 Printing FY15 Actuals FY16 Actuals FY17 Actuals FY18 Budget FY18 Forecast FY19 Budget REVENUES 1 State Appropriations $ - $ - $ - $ - $ - $ - 2 State Appropriations - Capital Gross Undergraduate Tuition & Fees Undergraduate Financial Aid Net Undergraduate Tuition & Fees Gross Graduate Tuition & Fees Graduate Financial Aid Net Graduate Tuition & Fees Room & Board Grants & Contracts - - 8, Facilities & Admin Cost Recovery Endowment Distributions Gift Contributions Investment Income Internal & External Sales 3,336,685 3,084,042 3,146,027 2,987,118 2,987,118 3,139, Total Revenues 3,336,685 3,084,042 3,154,468 2,987,118 2,987,118 3,139, Administrative Cost Distribution Subvention Distribution Total Revenues & Revenue Allocations $ 3,336,685 $ 3,084,042 $ 3,154,468 $ 2,987,118 $ 2,987,118 $ 3,139, Funding Transfers $ (31,122) $ (22,680) $ (8,601) $ (2,608) $ (2,608) $ - EXPENSES 21 Total Salaries, Wages, & Other Payroll 686, , , , , , Total Benefits 293, , , , , , Supplies & Services 1,519, , ,693 97,630 94,530 88, Professional Services 193-4, Occupancy & Maintenance 373, , , , , , Capital Costs 49,744 70,675 28, , Cost Of Goods Sold 190,687 1,344,693 1,220,049 1,200,000 1,200,000 1,200, External Debt Service - Principal External Debt Service - Interest Internal Principal & Interest Depreciation Other Operating Expense (9) , Total Direct Expenses 3,113,303 2,894,263 2,719,856 2,673,548 2,668,902 2,863, Administrative Cost Allocations 213, , , , , , Capital Cost Allocation Subvention Allocation Total Expenses & Expense Allocations $ 3,327,287 $ 3,095,383 $ 2,949,362 $ 2,913,982 $ 2,909,336 $ 3,111, Results of Operations $ 40,520 $ 11,340 $ 213,707 $ 75,744 $ 80,390 $ 28,226 INVESTMENT TRANSFERS 39 Transfer To (From) Operating Reserve Transfer To (From) Plant Fund Transfer To (From) Quasi Endowments Repair & Replacement Transfers Internal Bank Transfers Other Transfers Total Investment Transfers $ - $ - $ - $ - $ - $ - 46 Net Results $ 40,520 $ 11,340 $ 213,707 $ 75,744 $ 80,390 $ 28, Transfer Net Results to Fund Balance 40,520 11, ,707 75,744 80,390 28, Adjusted Net Results $ - $ - $ - $ - $ - $ Total Transfer To (From) Reserve 40,520 11, ,707 75,744 80,390 28,226
166
167 13 Central & Administrative Operations 13.1 Administrative Targets As the Administrative Planning Units continue to work towards achieving their targeted 7% budget reductions established last year, planning units identified an additional $1.6M in budget savings effective in FY19. This budget reduction is being undertaken in conjunction with Academic Unit s identification of future year budget savings to address the gap in revenues and expenses. The following table provides an overview of Administrative Units 7% base target reductions as established last year, expense reductions made in FY18 and FY19, and anticipated FY20 reductions. In addition to the base targets noted below, VP of Advancement absorbed a one-time-only reduction of $1.2M in FY18. FY20 Reductions Planning Unit 7% Target Base (Balance of target less FY18 Reductions: FY19 Reductions: Budget Reductions: FY18 & FY19 reductions): Graduate College $ 108,325 $ 77,543 $ - $ 30,782 VP of Research $ 234,442 $ 167,458 $ 66,984 $ - Provost $ 310,887 $ 264,306 $ 46,581 $ - Enrollment Management $ 725,060 $ 260,122 $ 141,000 $ 323,938 Subtotal - Provost Academic Support $ 1,378,714 $ 769,429 $ 254,565 $ 354,720 ISFS $ 35,203 $ 25,145 $ 10,058 $ - Library $ 806,224 $ 391,354 $ 83,870 $ 331,000 Instructional Innovation $ 180,000 $ 180,000 $ - $ - Subtotal - Provost Academic $ 1,021,427 $ 596,499 $ 93,928 $ 331,000 OIT $ - $ - $ - $ - Airport $ 40,057 $ - $ - $ 40,057 VP Finance & Administration $ 3,739,802 $ 2,000,000 $ 911,163 $ 828,639 Subtotal - VPFA $ 3,779,859 $ 2,000,000 $ 911,163 $ 868,696 Diversity & Inclusion* Exempt Exempt Exempt Exempt President $ 445,821 $ 220,207 $ 70,312 $ 155,302 Campus Recreation $ 224,913 $ 160,652 $ 29,534 $ 34,727 VP of Student Affairs $ 575,270 $ 410,931 $ 82,143 $ 82,196 Subtotal - VPSA $ 800,183 $ 571,583 $ 111,677 $ 116,923 VP of Advancement $ 183,221 $ - $ 183,221 $ - WOUB $ 159,771 $ 114,122 $ 22,824 $ 22,825 Athletics $ 677,249 $ 483,750 $ - $ 193,499 Child Development Center $ 18,000 $ 18,000 $ - $ - Kennedy Museum $ 19,142 $ 19,142 $ - $ - Total Admin Units $ 8,483,387 $ 4,792,732 $ 1,647,690 $ 2,042,965 * An additional $0.55M of investment in Diversity & Inclusion is being funded by the Strategic Opportunity Reserve as a Presidential Priority until it can be absorbed in the Operating budget. Please see Section 10.2 for additional details.
168 13.2 Administrative Investments In recognition that investments are still required in times of budget reductions, University Leadership reserved $0.5M in FY19 investment funding earmarked for mandatory compliance requests from Administrative Units. A summary of the committed Administrative investment requests is provided below. Base/OTO Budget Unit Investment Requests FY 2019 Base Diversity & Inclusion Diversity & Inclusion $206,100 Base OUPD Equipment Costs 43,900 Base President Initiative Staff Support 100,000 Base TBD HIPAA Compliance Officer 150,000 Base Total 500,000 OTO Child Development Center 72 preschool Wooden Chairs 5,759 OTO Child Development Center Add electrical outlet to building 400 OTO Child Development Center Playground Shed repairs 18,620 OTO Total 24,779 Total Committed $524,779
169 13.3 Administrative Unit Summaries The following section contains dashboard metrics and income statements for Central & Administrative planning units. As most administrative and academic support units are not revenue-generating, only their expenses and headcounts are presented in this section. For a complete list of Central & Administrative Operations planning units, please refer to Section 14.
170 Advancement FY19 Budgeted Expenses Five Year Faculty/Staff Headcount Trends ,555,928, 37% $12,637,524 5,926,153, 47% 2,013,463, 16% Salaries, Wages, & Other Payroll Benefits Operating Expenses FY14 FY15 FY16 FY17 FY18 Administrator Classified Non Bargaining Summary of Advancement's Revenue Revenue Description FY18 Forecast FY19 Budget 2% Endowment Administrative Fee 7,658,561 7,849,841 Endowment Distributions 171, ,427 Unrestricted Private Gifts* 1,330, ,300 Returns from Foundation Working Capital 2,367,744 1,438,000 Bobcat Store Sales, Alumni Event Registrations, Other 940, ,377 Control Total Support Provided From University** 1,522,382 2,577,358 *Received unexpected, one-time receipt of a $1.1M cash gift in FY18 Total Revenues 13,990,830 12,830,303 **In FY18 Advancement took a one-time-only reduction of $1.2M control total funding
171 Advancement FY15 Actuals FY16 Actuals FY17 Actuals FY18 Budget FY18 Forecast FY19 Budget REVENUES 1 State Appropriations $ - $ - $ - $ - $ - $ - 2 State Appropriations - Capital Gross Undergraduate Tuition & Fees Undergraduate Financial Aid (43,982) (39,559) (100,225) - (35,000) (35,000) 5 Net Undergraduate Tuition & Fees (43,982) (39,559) (100,225) - (35,000) (35,000) 6 Gross Graduate Tuition & Fees Graduate Financial Aid Net Graduate Tuition & Fees Room & Board Grants & Contracts ,500 1, Facilities & Admin Cost Recovery Endowment Distributions 6,570,906 7,310,325 7,422,532 7,660,145 7,830,155 8,025, Gift Contributions 309, , , ,250 1,330, , Investment Income (229,485) (752,109) 2,528,358 1,580,587 2,367,744 1,438, Internal & External Sales 1,332,346 2,364,767 3,208, , , , Total Revenues 7,939,711 9,491,876 13,230,649 9,909,411 12,434,948 10,219, Administrative Cost Distribution 2,437,403 2,498,678 2,617,443 1,522,382 1,522,382 2,577, Subvention Distribution Total Revenues & Revenue Allocations $ 10,377,114 $ 11,990,553 $ 15,848,093 $ 11,431,793 $ 13,957,330 $ 12,796, Funding Transfers $ (86,913) $ 296,070 $ 352,524 $ (2,318,711) $ 372,500 $ 282,000 EXPENSES 21 Total Salaries, Wages, & Other Payroll 4,956,909 5,298,633 5,148,106 5,845,396 5,145,498 5,926, Total Benefits 1,595,559 1,772,995 1,681,805 2,125,162 1,783,999 2,013, Supplies & Services 2,997,955 3,588,141 3,333,616 3,720,211 3,768,113 3,231, Professional Services 1,068,260 1,309,824 1,180, , , , Occupancy & Maintenance 276,994 1,220, , , , , Capital Costs 6, ,153 (122,555) Cost Of Goods Sold 139, , , , , , External Debt Service - Principal External Debt Service - Interest Internal Principal & Interest , Depreciation , Other Operating Expense 23,919 25,018 10, ,502 11,372 11, Total Direct Expenses 11,065,418 13,768,386 11,722,229 13,747,520 12,129,782 12,637, Administrative Cost Allocations Capital Cost Allocation Subvention Allocation Total Expenses & Expense Allocations $ 11,065,418 $ 13,768,386 $ 11,722,229 $ 13,747,520 $ 12,129,782 $ 12,637, Results of Operations $ (601,392) $ (2,073,903) $ 3,773,340 $ 2,984 $ 1,455,048 $ (122,721) INVESTMENT TRANSFERS 39 Transfer To (From) Operating Reserve (141,980) 40 Transfer To (From) Plant Fund , Transfer To (From) Quasi Endowments Repair & Replacement Transfers Internal Bank Transfers Other Transfers Total Investment Transfers $ - $ - $ - $ - $ 62,000 $ (141,980) 46 Net Results $ (601,392) $ (2,073,903) $ 3,773,340 $ 2,984 $ 1,393,048 $ 19, Transfer Net Results to Fund Balance (601,392) (2,073,903) 3,773,340 2,984 1,393,048 19, Adjusted Net Results $ - $ - $ - $ - $ - $ Total Transfer To (From) Reserve (601,392) (2,073,903) 3,773,340 2,984 1,393,048 (122,721) Ratio: Total Direct Expenses - Share of University Total Row % 1.8% 1.5% 1.8% 1.6% 1.6%
172 Airport FY19 Budgeted Expenses Five Year Faculty/Staff Headcount Trends ,945, 10% 7 6 $2,154, ,128, 38% Salaries, Wages, & Other Payroll Benefits Operating Expenses Debt Service ,495, 38% 1 299,991, 14% 0 FY14 FY15 FY16 FY17 FY18 Administrator Classified AFSCME
173 Airport FY15 Actuals FY16 Actuals FY17 Actuals FY18 Budget FY18 Forecast FY19 Budget REVENUES 1 State Appropriations $ - $ - $ - $ - $ - $ - 2 State Appropriations - Capital Gross Undergraduate Tuition & Fees Undergraduate Financial Aid Net Undergraduate Tuition & Fees Gross Graduate Tuition & Fees Graduate Financial Aid Net Graduate Tuition & Fees Room & Board Grants & Contracts 1,829 2,867 2,012,299 2,697, Facilities & Admin Cost Recovery Endowment Distributions Gift Contributions Investment Income Internal & External Sales 1,564,870 1,294,190 1,294,441 1,420,895 1,420,895 1,423, Total Revenues 1,566,699 1,297,057 3,306,790 4,117,995 1,420,895 1,423, Administrative Cost Distribution 757, , , , , , Subvention Distribution Total Revenues & Revenue Allocations $ 2,324,065 $ 2,091,670 $ 4,122,424 $ 4,941,648 $ 2,244,548 $ 2,265, Funding Transfers $ (80,795) $ (126,577) $ 18,913 $ (240,402) $ 21,498 $ 21,498 EXPENSES 21 Total Salaries, Wages, & Other Payroll 760, , , , , , Total Benefits 277, , , , , , Supplies & Services 292, , , , , , Professional Services 69,711 65,242 12,704 16,050 16,050 16, Occupancy & Maintenance 322, , , , , , Capital Costs 93,710 1,393,600 43,801 2,959, Cost Of Goods Sold 519, , , , , , External Debt Service - Principal External Debt Service - Interest Internal Principal & Interest 103, , , , , , Depreciation Other Operating Expense 20,259 19,125 18,390 17,000 46, , Total Direct Expenses 2,460,020 3,555,527 2,156,488 5,158,867 2,087,471 2,154, Administrative Cost Allocations Capital Cost Allocation Subvention Allocation Total Expenses & Expense Allocations $ 2,460,020 $ 3,555,527 $ 2,156,488 $ 5,158,867 $ 2,087,471 $ 2,154, Results of Operations $ (55,160) $ (1,337,280) $ 1,947,023 $ 23,183 $ 135,579 $ 88,966 INVESTMENT TRANSFERS 39 Transfer To (From) Operating Reserve Transfer To (From) Plant Fund 6, ,999, Transfer To (From) Quasi Endowments Repair & Replacement Transfers Internal Bank Transfers - (1,295,000) Other Transfers Total Investment Transfers $ 6,264 $ (1,294,957) $ 1,999,858 $ - $ - $ - 46 Net Results $ (61,424) $ (42,323) $ (52,836) $ 23,183 $ 135,579 $ 88, Transfer Net Results to Fund Balance (61,424) (42,323) (52,836) 23, ,579 88, Adjusted Net Results $ - $ - $ - $ - $ - $ Total Transfer To (From) Reserve (61,424) (42,323) (52,836) 23, ,579 88,966 Ratio: Row 33 Total Direct Expenses - Share of University Total 0.4% 0.5% 0.3% 0.7% 0.3% 0.3%
174 Athena FY19 Budgeted Expenses Five Year Faculty/Staff Headcount Trends ,862, 25% 2 70,239, 17% $427, ,334, 58% Salaries, Wages, & Other Payroll Benefits Operating Expenses FY14 FY15 FY16 FY17 FY18 Administrator Classified Non Bargaining
175 Athena FY15 Actuals FY16 Actuals FY17 Actuals FY18 Budget FY18 Forecast FY19 Budget REVENUES 1 State Appropriations $ - $ - $ - $ - $ - $ - 2 State Appropriations - Capital Gross Undergraduate Tuition & Fees Undergraduate Financial Aid Net Undergraduate Tuition & Fees Gross Graduate Tuition & Fees Graduate Financial Aid Net Graduate Tuition & Fees Room & Board Grants & Contracts 3,899 12,101 71,922 71,000 71,000 72, Facilities & Admin Cost Recovery Endowment Distributions Gift Contributions 5,975 5,000 5,000 5,000 5,000 5, Investment Income Internal & External Sales 189, , , , , , Total Revenues 199, , , , , , Administrative Cost Distribution 170,896 86,981 89,625 91,490 91,490 94, Subvention Distribution Total Revenues & Revenue Allocations $ 370,110 $ 294,431 $ 344,478 $ 367,376 $ 352,490 $ 367, Funding Transfers $ (26,888) $ (54,660) $ (50,057) $ (53,347) $ (55,347) $ (59,962) EXPENSES 21 Total Salaries, Wages, & Other Payroll 181, , , , , , Total Benefits 35,682 52,727 60,214 68,526 68,526 70, Supplies & Services 52,950 52,021 43,921 34,550 31,000 38, Professional Services 6,720 8,360 10,190 8,600 9,000 10, Occupancy & Maintenance 57,851 70,479 59,293 40,000 49,000 46, Capital Costs Cost Of Goods Sold 8,039 7,040 8,160 9,000 8,000 10, External Debt Service - Principal External Debt Service - Interest Internal Principal & Interest Depreciation Other Operating Expense ,000 3, Total Direct Expenses 343, , , , , , Administrative Cost Allocations Capital Cost Allocation Subvention Allocation Total Expenses & Expense Allocations $ 343,605 $ 427,873 $ 425,197 $ 415,723 $ 415,931 $ 427, Results of Operations $ 53,393 $ (78,782) $ (30,662) $ 5,000 $ (8,094) $ 443 INVESTMENT TRANSFERS 39 Transfer To (From) Operating Reserve Transfer To (From) Plant Fund Transfer To (From) Quasi Endowments Repair & Replacement Transfers Internal Bank Transfers Other Transfers Total Investment Transfers $ - $ - $ - $ - $ - $ - 46 Net Results $ 53,393 $ (78,782) $ (30,662) $ 5,000 $ (8,094) $ Transfer Net Results to Fund Balance 53,393 (78,782) (30,662) 5,000 (8,094) Adjusted Net Results $ - $ - $ - $ - $ - $ Total Transfer To (From) Reserve 53,393 (78,782) (30,662) 5,000 (8,094) 443 Ratio: Total Direct Expenses - Share of University Total Row % 0.1% 0.1% 0.1% 0.1% 0.1%

176 Child Development Center (CDC) FY19 Budgeted Expenses Five Year Faculty/Staff Headcount Trends ,967, 10% ,230, 28% $1,208, ,653, 62% Salaries, Wages, & Other Payroll Benefits Operating Expenses FY14 FY15 FY16 FY17 FY18 Administrator Classified Non Bargaining Group II Faculty
177 Child Development Center FY15 Actuals FY16 Actuals FY17 Actuals FY18 Budget FY18 Forecast FY19 Budget REVENUES 1 State Appropriations $ - $ - $ - $ - $ - $ - 2 State Appropriations - Capital Gross Undergraduate Tuition & Fees Undergraduate Financial Aid Net Undergraduate Tuition & Fees Gross Graduate Tuition & Fees Graduate Financial Aid - (16,376) (48,638) (16,376) Net Graduate Tuition & Fees - (16,376) (48,638) (16,376) Room & Board Grants & Contracts - - 3, Facilities & Admin Cost Recovery Endowment Distributions Gift Contributions - 2,282 1,881 3, Investment Income Internal & External Sales 732, , , , , , Total Revenues 732, , , , , , Administrative Cost Distribution 291, , , , , , Subvention Distribution 66, Total Revenues & Revenue Allocations $ 1,090,485 $ 1,067,532 $ 1,063,506 $ 1,109,903 $ 1,128,692 $ 1,179, Funding Transfers $ (28,154) $ (27,054) $ (225,447) $ (31,229) $ (29,832) $ (29,832) EXPENSES 21 Total Salaries, Wages, & Other Payroll 743, , , , , , Total Benefits 296, , , , , , Supplies & Services 112,017 95,060 37,657 66,492 83, , Professional Services 4, , Occupancy & Maintenance 4,287 7,369 20,521 6, Capital Costs Cost Of Goods Sold 2,943 3,485 2, External Debt Service - Principal External Debt Service - Interest Internal Principal & Interest Depreciation Other Operating Expense , Total Direct Expenses 1,164,323 1,289,653 1,145,069 1,154,508 1,158,525 1,208, Administrative Cost Allocations Capital Cost Allocation Subvention Allocation Total Expenses & Expense Allocations $ 1,164,323 $ 1,289,653 $ 1,145,069 $ 1,154,508 $ 1,158,525 $ 1,208, Results of Operations $ (45,684) $ (195,067) $ 143,884 $ (13,376) $ (1) $ - INVESTMENT TRANSFERS 39 Transfer To (From) Operating Reserve Transfer To (From) Plant Fund - 11, Transfer To (From) Quasi Endowments Repair & Replacement Transfers Internal Bank Transfers Other Transfers Total Investment Transfers $ - $ 11,340 $ - $ - $ - $ - 46 Net Results $ (45,684) $ (206,407) $ 143,884 $ (13,376) $ (1) $ - 47 Transfer Net Results to Fund Balance (45,684) (206,407) 143,884 (13,376) (1) - 48 Adjusted Net Results $ - $ - $ - $ - $ - $ Total Transfer To (From) Reserve (45,684) (206,407) 143,884 (13,376) (1) - Ratio: Total Direct Expenses - Share of University Total Row % 0.2% 0.1% 0.2% 0.2% 0.2%
178 Finance & Administration Custodial FY19 Budgeted Expenses Five Year Faculty/Staff Headcount Trends 250 1,058,382, 6% ,906,604, 31% $16,070,370 10,011,884, 63% Salaries, Wages, & Other Payroll Benefits Operating Expenses FY14 FY15 FY16 FY17 FY18 Administrator Classified AFSCME Design & Construction FY19 Budgeted Expenses Five Year Faculty/Staff Headcount Trends ,553, 15% ,790, 22% $2,778,140 1,757,797, 63% Salaries, Wages, & Other Payroll Benefits Operating Expenses FY14 FY15 FY16 FY17 FY18 Administrator Classified Non Bargaining Environmental Health & Safety FY19 Budgeted Expenses Five Year Faculty/Staff Headcount Trends ,632, 17% ,036, 24% $1,169, ,473, 59% Salaries, Wages, & Other Payroll Benefits Operating Expenses FY14 FY15 FY16 FY17 FY18 Administrator Classified AFSCME Classified Non Bargaining

179 Facilities Management & Safety FY19 Budgeted Expenses Five Year Faculty/Staff Headcount Trends 18 1,811,487, 45% 1,624,934, 41% $4,014, ,287, 14% Salaries, Wages, & Other Payroll Benefits Operating Expenses FY14 FY15 FY16 FY17 FY18 Administrator Classified AFSCME Classified Non Bargaining Finance & Budget FY19 Budgeted Expenses Five Year Faculty/Staff Headcount Trends ,541, 12% ,767,830, 24% $7,348,974 4,605,103, 64% Salaries, Wages, & Other Payroll Benefits Operating Expenses FY14 FY15 FY16 FY17 FY18 Administrator Classified Non Bargaining Grounds FY19 Budgeted Expenses Five Year Faculty/Staff Headcount Trends ,710, 21% ,859, 23% $3,251,306 1,810,737, 56% Salaries, Wages, & Other Payroll Benefits Operating Expenses FY14 FY15 FY16 FY17 FY18 Administrator Classified AFSCME Classified Non Bargaining

180 Heating Plant FY19 Budgeted Expenses 328,989, 18% 383,076, 22% $1,767,800 1,055,735, 60% Salaries, Wages, & Other Payroll Benefits Operating Expenses Human Resources FY19 Budgeted Expenses Five Year Faculty/Staff Headcount Trends ,726, 10% ,384, 24% $3,828,517 2,526,407, 66% Salaries, Wages, & Other Payroll Benefits Operating Expenses FY14 FY15 FY16 FY17 FY18 Administrator Classified Non Bargaining Logistics FY19 Budgeted Expenses Five Year Faculty/Staff Headcount Trends ,867, 36% 6 $2,120,175 1,048,851, 49% Salaries, Wages, & Other Payroll Benefits Operating Expenses ,457, 15% 0 FY14 FY15 FY16 FY17 FY18 Administrator Classified AFSCME Classified Non Bargaining
181 Maintenance FY19 Budgeted Expenses 2,806,205, 26% Salaries, Wages, & Other Payroll $10,938,993 Benefits 5,795,706, 53% Operating Expenses 2,337,082, 21% Five Year Faculty/Staff Headcount Trends FY14 FY15 FY16 FY17 FY18 Administrator Classified AFSCME Classified Non Bargaining OUPD FY19 Budgeted Expenses Five Year Faculty/Staff Headcount Trends ,180, 10% 20 1,106,717, 26% $4,374,283 2,785,386, 64% Salaries, Wages, & Other Payroll Benefits Operating Expenses FY14 FY15 FY16 FY17 FY18 Administrator Classified AFSCME Classified FOP Classified Non Bargaining Real Estate FY19 Budgeted Expenses Five Year Faculty/Staff Headcount Trends 3 178,408, 20% 2 69,010, 8% 2 651,060, 72% $1,368,628 Salaries, Wages, & Other Payroll Benefits Operating Expenses FY14 FY15 FY16 FY17 FY18 Administrator
182 VPFA Office FY19 Budgeted Expenses Five Year Faculty/Staff Headcount Trends ,435, 2% 827,150, 26% $3,141,513 2,244,928, 72% Salaries, Wages, & Other Payroll Benefits Operating Expenses FY14 FY15 FY16 FY17 FY18 Administrator Classified Non Bargaining Departments included within VPFA Office: The Office of the CFO; Training and Communication; VPFA Business Service Center (from FTEs in other units); OHIO Ready Staff; University Planning & Space Management.
183 Finance & Administration FY15 Actuals FY16 Actuals FY17 Actuals FY18 Budget FY18 Forecast FY19 Budget REVENUES 1 State Appropriations $ - $ - $ - $ - $ - $ - 2 State Appropriations - Capital Gross Undergraduate Tuition & Fees 54,780 68, , , , ,212 4 Undergraduate Financial Aid (11,244) (4,330) (2,521) Net Undergraduate Tuition & Fees 43,535 64, , , , ,212 6 Gross Graduate Tuition & Fees Graduate Financial Aid - - (18) Net Graduate Tuition & Fees - - (18) Room & Board Grants & Contracts 141,333 63,852 73, Facilities & Admin Cost Recovery 17,910 1, Endowment Distributions 4,135 4,537 4, Gift Contributions 24,274 8,991 5, Investment Income - (13,590) Internal & External Sales 9,402,456 8,721,407 9,680,320 9,659,707 9,103,769 9,206, Total Revenues 9,633,643 8,850,726 9,873,427 9,775,707 9,219,769 9,315, Administrative Cost Distribution 70,029,372 72,308,502 77,389,971 78,205,934 78,601,032 79,358, Subvention Distribution Total Revenues & Revenue Allocations $ 79,663,015 $ 81,159,227 $ 87,263,398 $ 87,981,641 $ 87,820,801 $ 88,674, Funding Transfers $ (2,163,593) $ (3,066,669) $ (2,563,066) $ (1,211,077) $ (2,168,453) $ (1,772,046) EXPENSES 21 Total Salaries, Wages, & Other Payroll 44,736,827 46,406,206 47,551,742 49,624,001 46,480,187 50,149, Total Benefits 16,392,003 17,400,061 17,605,569 19,217,796 18,271,316 19,869, Supplies & Services 8,185,363 8,635,703 8,472,156 10,958,896 14,975,357 12,438, Professional Services 2,616,098 2,125,811 1,640,662 1,523,288 1,617, , Occupancy & Maintenance 6,616,268 7,834,593 6,864,707 7,212,602 2,098,375 4,320, Capital Costs 978, , , , , , Cost Of Goods Sold 693, , , , , , External Debt Service - Principal External Debt Service - Interest Internal Principal & Interest Depreciation Other Operating Expense 478, ,705 (180,597) 50,986 63,586 60, Total Direct Expenses 80,697,742 84,184,543 82,879,768 89,717,657 84,673,163 89,357, Administrative Cost Allocations Capital Cost Allocation Subvention Allocation Total Expenses & Expense Allocations $ 80,697,742 $ 84,184,543 $ 82,879,768 $ 89,717,657 $ 84,673,163 $ 89,357, Results of Operations $ 1,128,867 $ 41,353 $ 6,946,696 $ (524,939) $ 5,316,091 $ 1,089,064 INVESTMENT TRANSFERS 39 Transfer To (From) Operating Reserve , Transfer To (From) Plant Fund (293,522) 291,553 (4,028,284) - 5,273,388 5,500, Transfer To (From) Quasi Endowments Repair & Replacement Transfers ,495 3,495 3, Internal Bank Transfers Other Transfers 30,000 (255) (804) - (2,000) (2,000) 45 Total Investment Transfers $ (263,522) $ 291,298 $ (4,029,089) $ 46,870 $ 5,274,883 $ 5,501, Net Results $ 1,392,389 $ (249,944) $ 10,975,785 $ (571,808) $ 41,208 $ (4,412,436) 47 Transfer Net Results to Fund Balance 1,392,389 (249,944) 10,975,785 (571,808) 41,208 (4,412,436) 48 Adjusted Net Results $ - $ - $ - $ - $ - $ Total Transfer To (From) Reserve 1,392,389 (249,944) 10,975,785 (528,433) 41,208 (4,412,436) Ratio: Total Direct Expenses - Share of University Total Row % 11.3% 10.3% 11.7% 11.3% 11.6%
184 International Student & Faculty Services (ISFS) FY19 Budgeted Expenses Five Year Faculty/Staff Headcount Trends ,011, 13% ,283, 23% $565,130 Salaries, Wages, & Other Payroll Benefits Operating Expenses ,836, 64% 1 0 FY14 FY15 FY16 FY17 FY18 Administrator Classified Non Bargaining
185 ISFS FY15 Actuals FY16 Actuals FY17 Actuals FY18 Budget FY18 Forecast FY19 Budget REVENUES 1 State Appropriations $ - $ - $ - $ - $ - $ - 2 State Appropriations - Capital Gross Undergraduate Tuition & Fees 50,365 40,390 30,905 52,500 45,290 45,000 4 Undergraduate Financial Aid Net Undergraduate Tuition & Fees 50,365 40,390 30,905 52,500 45,290 45,000 6 Gross Graduate Tuition & Fees Graduate Financial Aid (1,960) - (550) Net Graduate Tuition & Fees (1,960) - (550) Room & Board Grants & Contracts - - 2,621-2,500 2, Facilities & Admin Cost Recovery Endowment Distributions 4,704 4,901 10,514 10, Gift Contributions Investment Income Internal & External Sales Total Revenues 53,109 45,561 43,490 62,696 47,790 47, Administrative Cost Distribution 499, , , , , , Subvention Distribution Total Revenues & Revenue Allocations $ 552,621 $ 541,896 $ 547,121 $ 554,497 $ 564,305 $ 560, Funding Transfers $ (6,360) $ (5,739) $ (56,634) $ - $ (4,500) $ (4,500) EXPENSES 21 Total Salaries, Wages, & Other Payroll 297, , , , , , Total Benefits 108, , , , , , Supplies & Services 56,314 44,470 39,534 65,500 71,150 71, Professional Services 15,227 19,241 47,583-47, Occupancy & Maintenance 9,757 4,771 2,048 3,500 3, Capital Costs Cost Of Goods Sold External Debt Service - Principal External Debt Service - Interest Internal Principal & Interest Depreciation Other Operating Expense ,010 3,000 2,000 2, Total Direct Expenses 487, , , , , , Administrative Cost Allocations Capital Cost Allocation Subvention Allocation Total Expenses & Expense Allocations $ 487,194 $ 512,923 $ 561,582 $ 544,301 $ 549,947 $ 565, Results of Operations $ 71,787 $ 34,711 $ 42,173 $ 10,196 $ 18,858 $ - INVESTMENT TRANSFERS 39 Transfer To (From) Operating Reserve Transfer To (From) Plant Fund 700 (127) Transfer To (From) Quasi Endowments Repair & Replacement Transfers Internal Bank Transfers Other Transfers Total Investment Transfers $ 700 $ (127) $ - $ - $ - $ - 46 Net Results $ 71,087 $ 34,838 $ 42,173 $ 10,196 $ 18,858 $ - 47 Transfer Net Results to Fund Balance 71,087 34,838 42,173 10,196 18, Adjusted Net Results $ - $ - $ - $ - $ - $ Total Transfer To (From) Reserve 71,087 34,838 42,173 10,196 18,858 - Ratio: Total Direct Expenses - Share of University Total Row % 0.1% 0.1% 0.1% 0.1% 0.1%
186 Kennedy Museum FY19 Budgeted Expenses Five Year Faculty/Staff Headcount Trends ,818, 16% ,286, 18% $597,740 Salaries, Wages, & Other Payroll Benefits Operating Expenses ,636, 66% 1 0 FY14 FY15 FY16 FY17 FY18 Administrator Classified Non Bargaining
187 Kennedy Museum FY15 Actuals FY16 Actuals FY17 Actuals FY18 Budget FY18 Forecast FY19 Budget REVENUES 1 State Appropriations $ - $ - $ - $ - $ - $ - 2 State Appropriations - Capital Gross Undergraduate Tuition & Fees Undergraduate Financial Aid Net Undergraduate Tuition & Fees Gross Graduate Tuition & Fees Graduate Financial Aid Net Graduate Tuition & Fees Room & Board Grants & Contracts 18,417 19,389 54,809 78,961 55,250 55, Facilities & Admin Cost Recovery Endowment Distributions 63,758 65,702 66,710 64,562 64,562 63, Gift Contributions 41, ,807 37,589 20,000 40,000 40, Investment Income Internal & External Sales 26,219 7, Total Revenues 150, , , , , , Administrative Cost Distribution 351, , , , , , Subvention Distribution Total Revenues & Revenue Allocations $ 501,874 $ 931,377 $ 542,305 $ 529,715 $ 526,354 $ 531, Funding Transfers $ (35,855) $ (38,361) $ (29,137) $ (26,010) $ (29,396) $ (29,396) EXPENSES 21 Total Salaries, Wages, & Other Payroll 408, , , , , , Total Benefits 113, , ,135 84, , , Supplies & Services 62,219 99,833 89,827 73, ,700 57, Professional Services 1, ,960-13,558 11, Occupancy & Maintenance 16,597 9,647 39,933 15,000 17,000 12, Capital Costs - - 5, Cost Of Goods Sold 16,121 3, External Debt Service - Principal External Debt Service - Interest Internal Principal & Interest Depreciation Other Operating Expense ,010 10,000 10, Total Direct Expenses 618, , , , , , Administrative Cost Allocations Capital Cost Allocation Subvention Allocation Total Expenses & Expense Allocations $ 618,458 $ 610,703 $ 637,526 $ 581,471 $ 804,942 $ 597, Results of Operations $ (80,728) $ 359,036 $ (66,085) $ (25,746) $ (249,192) $ (36,609) INVESTMENT TRANSFERS 39 Transfer To (From) Operating Reserve (215,000) - 40 Transfer To (From) Plant Fund Transfer To (From) Quasi Endowments Repair & Replacement Transfers Internal Bank Transfers Other Transfers Total Investment Transfers $ - $ - $ - $ - $ (215,000) $ - 46 Net Results $ (80,728) $ 359,036 $ (66,085) $ (25,746) $ (34,192) $ (36,609) 47 Transfer Net Results to Fund Balance (80,728) 359,036 (66,085) (25,746) (34,192) (36,609) 48 Adjusted Net Results $ - $ - $ - $ - $ - $ Total Transfer To (From) Reserve (80,728) 359,036 (66,085) (25,746) (249,192) (36,609) Ratio: Total Direct Expenses - Share of University Total Row % 0.1% 0.1% 0.1% 0.1% 0.1%
188 Library FY19 Budgeted Expenses Five Year Faculty/Staff Headcount Trends 45 $12,432,216 5,039,120, 43% 1,758,977, 15% 4,916,857, 42% Salaries, Wages, & Other Payroll Benefits Operating Expenses FY14 FY15 FY16 FY17 FY18 Administrator Classified AFSCME Classified Non Bargaining
189 Library FY15 Actuals FY16 Actuals FY17 Actuals FY18 Budget FY18 Forecast FY19 Budget REVENUES 1 State Appropriations $ 169,861 $ 169,861 $ 169,861 $ 152,875 $ 164,765 $ 164,765 2 State Appropriations - Capital Gross Undergraduate Tuition & Fees Undergraduate Financial Aid (2,300) (3,500) (3,800) Net Undergraduate Tuition & Fees (2,300) (3,500) (3,800) Gross Graduate Tuition & Fees Graduate Financial Aid (27,310) (9,672) (800) Net Graduate Tuition & Fees (27,310) (9,672) (800) Room & Board Grants & Contracts 7,597 (8,288) 139, , , , Facilities & Admin Cost Recovery Endowment Distributions 359, , , , , , Gift Contributions 101, ,897 70,174 78,000 71,000 87, Investment Income Internal & External Sales 257, , , , , , Total Revenues 867, , , , , , Administrative Cost Distribution 11,020,361 11,400,639 11,517,479 11,176,102 11,176,102 11,195, Subvention Distribution 384, , , , , , Total Revenues & Revenue Allocations $ 12,271,738 $ 12,550,076 $ 12,778,338 $ 12,480,341 $ 12,535,701 $ 12,519, Funding Transfers $ (72,606) $ (105,969) $ (73,747) $ (85,000) $ (122,055) $ (83,086) EXPENSES 21 Total Salaries, Wages, & Other Payroll 4,386,038 4,654,950 4,598,262 4,962,626 4,737,004 4,916, Total Benefits 1,493,341 1,607,731 1,585,772 1,766,611 1,654,501 1,758, Supplies & Services 5,036,884 5,333,300 5,468,666 4,716,452 4,936,010 4,819, Professional Services 84, ,602 51,616 28,709 85,083 72, Occupancy & Maintenance 105,648 99, , , , , Capital Costs 1,238, , , , , , Cost Of Goods Sold External Debt Service - Principal External Debt Service - Interest Internal Principal & Interest Depreciation Other Operating Expense 13,686 (1,821) 20,392 7, Total Direct Expenses 12,358,784 12,698,155 12,799,654 12,515,094 12,297,129 12,432, Administrative Cost Allocations Capital Cost Allocation Subvention Allocation Total Expenses & Expense Allocations $ 12,358,784 $ 12,698,155 $ 12,799,654 $ 12,515,094 $ 12,297,129 $ 12,432, Results of Operations $ (14,440) $ (42,110) $ 52,431 $ 50,247 $ 360,627 $ 170,856 INVESTMENT TRANSFERS 39 Transfer To (From) Operating Reserve Transfer To (From) Plant Fund 493, , , , ,000 50, Transfer To (From) Quasi Endowments Repair & Replacement Transfers Internal Bank Transfers Other Transfers Total Investment Transfers $ 493,773 $ 230,331 $ 242,250 $ 175,000 $ 150,000 $ 50, Net Results $ (508,213) $ (272,441) $ (189,819) $ (124,753) $ 210,627 $ 120, Transfer Net Results to Fund Balance (508,213) (272,441) (189,819) (124,753) 210, , Adjusted Net Results $ - $ - $ - $ - $ - $ Total Transfer To (From) Reserve (508,213) (272,441) (189,819) (124,753) 210, ,856 Ratio: Total Direct Expenses - Share of University Total Row % 1.7% 1.6% 1.6% 1.6% 1.6%
190 Marching 110 FY19 Budgeted Expenses Five Year Faculty/Staff Headcount Trends 2 52,345, 22% $235,101 21,256, 9% Salaries, Wages, & Other Payroll Benefits Operating Expenses 1 161,500, 69% 0 FY14 FY15 FY16 FY17 FY18 Administrator
191 Marching 110 FY15 Actuals FY16 Actuals FY17 Actuals FY18 Budget FY18 Forecast FY19 Budget REVENUES 1 State Appropriations $ - $ - $ - $ - $ - $ - 2 State Appropriations - Capital Gross Undergraduate Tuition & Fees 591 4,082 3,870 3,500 6,500 4,500 4 Undergraduate Financial Aid (1,911) (5,250) (3,750) - (5,000) (5,000) 5 Net Undergraduate Tuition & Fees (1,320) (1,168) 120 3,500 1,500 (500) 6 Gross Graduate Tuition & Fees Graduate Financial Aid Net Graduate Tuition & Fees Room & Board Grants & Contracts Facilities & Admin Cost Recovery Endowment Distributions 3,585 3,777 3,861-3,758 3, Gift Contributions 11,187 9,584 11,909 10,000 12,000 10, Investment Income Internal & External Sales 70,103 25,679 19,348 23,000 58,000 23, Total Revenues 83,556 37,871 35,238 36,500 75,258 36, Administrative Cost Distribution 187, , , , , , Subvention Distribution Total Revenues & Revenue Allocations $ 271,321 $ 227,283 $ 225,517 $ 227,402 $ 266,160 $ 228, Funding Transfers $ (19,981) $ (120,006) $ (179,384) $ (5,500) $ (116,000) $ - EXPENSES 21 Total Salaries, Wages, & Other Payroll 48,275 52,700 56,568 46,818 56,568 52, Total Benefits 19,449 20,620 20,589 21,845 21,565 21, Supplies & Services 179, , , , , , Professional Services 5, ,150 6,000 5,000 4, Occupancy & Maintenance 23,890 25,600 15,663 15,000 14,000 10, Capital Costs Cost Of Goods Sold External Debt Service - Principal External Debt Service - Interest Internal Principal & Interest Depreciation Other Operating Expense 1, Total Direct Expenses 277, , , , , , Administrative Cost Allocations Capital Cost Allocation Subvention Allocation Total Expenses & Expense Allocations $ 277,877 $ 317,366 $ 447,826 $ 270,172 $ 383,014 $ 235, Results of Operations $ 13,425 $ 29,924 $ (42,925) $ (37,270) $ (854) $ (6,846) INVESTMENT TRANSFERS 39 Transfer To (From) Operating Reserve Transfer To (From) Plant Fund Transfer To (From) Quasi Endowments Repair & Replacement Transfers Internal Bank Transfers Other Transfers Total Investment Transfers $ - $ - $ - $ - $ - $ - 46 Net Results $ 13,425 $ 29,924 $ (42,925) $ (37,270) $ (854) $ (6,846) 47 Transfer Net Results to Fund Balance 13,425 29,924 (42,925) (37,270) (854) (6,846) 48 Adjusted Net Results $ - $ - $ - $ - $ - $ Total Transfer To (From) Reserve 13,425 29,924 (42,925) (37,270) (854) (6,846) Ratio: Row 33 Total Direct Expenses - Share of University Total 0.0% 0.0% 0.1% 0.0% 0.1% 0.0%
192 President s Office Diversity & Inclusion FY19 Budgeted Expenses Five Year Faculty/Staff Headcount Trends ,680, 22% ,170, 20% $2,364,570 1,372,540, 58% Salaries, Wages, & Other Payroll Benefits Operating Expenses FY14 FY15 FY16 FY17 FY18 Administrator Classified Non Bargaining Marketing & Communication FY19 Budgeted Expenses Five Year Faculty/Staff Headcount Trends ,061, 8% ,714, 24% $2,144,030 Salaries, Wages, & Other Payroll Benefits Operating Expenses ,449,255, 68% 0 FY14 FY15 FY16 FY17 FY18 Administrator Classified Non Bargaining President FY19 Budgeted Expenses Five Year Faculty/Staff Headcount Trends ,138, 14% ,249, 20% $4,793,528 3,148,141, 66% Salaries, Wages, & Other Payroll Benefits Operating Expenses FY14 FY15 FY16 FY17 FY18 Administrator Classified Non Bargaining Departments included within President: The Office of the President; Board of Trustees; Legal Affairs; Legislative Liaison; Internal Audit
193 President FY15 Actuals FY16 Actuals FY17 Actuals FY18 Budget FY18 Forecast FY19 Budget REVENUES 1 State Appropriations $ - $ - $ - $ - $ - $ - 2 State Appropriations - Capital Gross Undergraduate Tuition & Fees Undergraduate Financial Aid (114,620) (134,342) (182,577) (7,178) (140,787) (140,787) 5 Net Undergraduate Tuition & Fees (114,620) (134,342) (182,577) (7,178) (140,787) (140,787) 6 Gross Graduate Tuition & Fees ,506 7 Graduate Financial Aid (77,198) (28,408) (4,116) Net Graduate Tuition & Fees (77,198) (28,408) (4,116) ,506 9 Room & Board Grants & Contracts 202, , ,957 9,435 39,993 11, Facilities & Admin Cost Recovery - 5,614 3, Endowment Distributions 188, , ,284 79, , , Gift Contributions 48,092 81,970 24,450 3,000 13,782 13, Investment Income Internal & External Sales 94, , ,227 75,000 83,000 83, Total Revenues 342, , , , , , Administrative Cost Distribution 7,373,067 7,400,594 8,285,418 8,031,257 8,126,566 8,696, Subvention Distribution Total Revenues & Revenue Allocations $ 7,715,302 $ 7,786,186 $ 8,580,406 $ 8,190,556 $ 8,421,898 $ 8,944, Funding Transfers $ (707,999) $ (1,146,457) $ (792,124) $ (608,123) $ (451,907) $ (357,745) EXPENSES 21 Total Salaries, Wages, & Other Payroll 5,136,696 5,593,650 6,209,094 5,927,787 5,735,383 5,969, Total Benefits 1,597,596 1,730,385 1,804,489 1,874,997 1,737,285 1,937, Supplies & Services 772, , , , ,078 1,068, Professional Services 526, , , , , , Occupancy & Maintenance 85, , ,687 77,559 49,384 49, Capital Costs - 25, ,180 4, Cost Of Goods Sold External Debt Service - Principal External Debt Service - Interest Internal Principal & Interest Depreciation Other Operating Expense 11,919 7,763 8,573 72, Total Direct Expenses 8,130,298 8,791,483 9,359,330 8,798,679 8,873,805 9,302, Administrative Cost Allocations Capital Cost Allocation Subvention Allocation Total Expenses & Expense Allocations $ 8,130,298 $ 8,791,483 $ 9,359,330 $ 8,798,679 $ 8,873,805 $ 9,302, Results of Operations $ 293,003 $ 141,159 $ 13,200 $ - $ - $ - INVESTMENT TRANSFERS 39 Transfer To (From) Operating Reserve Transfer To (From) Plant Fund 30,776 51,266 (5,728) Transfer To (From) Quasi Endowments Repair & Replacement Transfers Internal Bank Transfers Other Transfers Total Investment Transfers $ 30,776 $ 51,266 $ (5,728) $ - $ - $ - 46 Net Results $ 262,227 $ 89,893 $ 18,927 $ - $ - $ - 47 Transfer Net Results to Fund Balance 262,227 89,893 18, Adjusted Net Results $ - $ - $ - $ - $ - $ Total Transfer To (From) Reserve 262,227 89,893 18, Ratio: Row 33 Total Direct Expenses - Share of University Total 1.2% 1.2% 1.2% 1.2% 1.2% 1.2%
194 Provost s Office Center for Campus and Community Engagement (CCCE) FY19 Budgeted Expenses 57,716, 20% 58,857, 21% $282, ,650, 59% Salaries, Wages, & Other Payroll Benefits Operating Expenses Enrollment Management FY19 Budgeted Expenses Five Year Faculty/Staff Headcount Trends ,970,893, 32% 40 $12,612,206 6,085,285, 48% Salaries, Wages, & Other Payroll Benefits Operating Expenses ,533,028, 20% 0 FY14 FY15 FY16 FY17 FY18 Administrator Classified Non Bargaining Instructional Innovation FY19 Budgeted Expenses Five Year Faculty/Staff Headcount Trends ,209, 12% ,021,123, 22% $4,540,936 2,986,604, 66% Salaries, Wages, & Other Payroll Benefits Operating Expenses FY14 FY15 FY16 FY17 FY18 Administrator Classified Non Bargaining Group II Faculty
195 Provost FY19 Budgeted Expenses 33,818, 1% Five Year Faculty/Staff Headcount Trends ,678,036, 36% 3,528,378, 48% $7,355,998 1,115,766, 15% Salaries, Wages, & Other Payroll Benefits Operating Expenses Debt Service FY14 FY15 FY16 FY17 FY18 Administrator Classified Non Bargaining Departments included within Provost: The Office of the Provost; Faculty Senate; Office of Equity and Civil Rights Compliance; Institutional Research; OU Press; Ombudsperson; Cutler Business Services
196
197 Provost FY15 Actuals FY16 Actuals FY17 Actuals FY18 Budget FY18 Forecast FY19 Budget REVENUES 1 State Appropriations $ - $ - $ - $ - $ - $ - 2 State Appropriations - Capital Gross Undergraduate Tuition & Fees 12,634,413 13,127, , , , ,331 4 Undergraduate Financial Aid (1,190,552) (1,224,735) (1,215,009) (1,792,997) (1,640,081) (1,721,292) 5 Net Undergraduate Tuition & Fees 11,443,861 11,903,115 (738,124) (1,236,469) (1,120,750) (1,201,961) 6 Gross Graduate Tuition & Fees 12,486,984 13,137,605 2, Graduate Financial Aid (2,000) (12,440) (20,120) Net Graduate Tuition & Fees 12,484,984 13,125,166 (18,036) Room & Board Grants & Contracts 318,630 92,461 65, , , , Facilities & Admin Cost Recovery 61, , Endowment Distributions 1,889,618 1,972,000 2,107,243 2,594,690 2,374,387 2,397, Gift Contributions 99,770 1,207, , , , , Investment Income Internal & External Sales 903,872 3,942,711 2,610,958 2,580,245 2,716,704 2,723, Total Revenues 27,202,337 32,243,002 5,009,181 4,272,094 4,284,343 4,232, Administrative Cost Distribution 12,956,560 14,199,471 19,107,275 19,566,418 19,566,418 19,673, Subvention Distribution - (137,156) Total Revenues & Revenue Allocations $ 40,158,897 $ 46,305,317 $ 24,116,456 $ 23,838,512 $ 23,850,761 $ 23,906, Funding Transfers $ 962,581 $ (231,467) $ (1,090,151) $ (973,055) $ (731,425) $ (884,761) EXPENSES 21 Total Salaries, Wages, & Other Payroll 11,969,041 12,858,750 11,476,751 12,660,722 11,676,784 12,765, Total Benefits 3,802,751 4,382,758 3,976,333 4,654,949 4,241,754 4,728, Supplies & Services 4,405,218 4,870,229 4,736,215 3,731,991 6,739,213 5,453, Professional Services 13,167,246 13,980, ,149 1,164,418 1,517,437 1,435, Occupancy & Maintenance 490,320 1,682,035 1,601,011 1,477,836 85,680 85, Capital Costs ,000 23, Cost Of Goods Sold 188, , , , , , External Debt Service - Principal External Debt Service - Interest Internal Principal & Interest - 1,084, ,754 33,818 33,818 33, Depreciation Other Operating Expense 8,177 4,520 4, , Total Direct Expenses 34,031,570 39,075,500 22,866,345 24,814,253 24,582,186 24,791, Administrative Cost Allocations 1,140,897 1,008, Capital Cost Allocation - 77, Subvention Allocation 3,501,577 3,460,725 - (2,686) Total Expenses & Expense Allocations $ 38,674,044 $ 43,621,782 $ 22,866,345 $ 24,811,567 $ 24,582,186 $ 24,791, Results of Operations $ 522,272 $ 2,915,003 $ 2,340,262 $ - $ - $ - INVESTMENT TRANSFERS 39 Transfer To (From) Operating Reserve Transfer To (From) Plant Fund 39, , , Transfer To (From) Quasi Endowments - 1,036,276 1, Repair & Replacement Transfers Internal Bank Transfers Other Transfers 1, Total Investment Transfers $ 40,346 $ 1,249,726 $ 120,716 $ - $ - $ - 46 Net Results $ 481,926 $ 1,665,277 $ 2,219,546 $ - $ - $ - 47 Transfer Net Results to Fund Balance 481,926 1,665,277 2,219, Adjusted Net Results $ - $ - $ - $ - $ - $ Total Transfer To (From) Reserve 481,926 1,665,277 2,219, Ratio: Row 33 Total Direct Expenses - Share of University Total 4.9% 5.2% 2.8% 3.2% 3.3% 3.2% Ratio: Row 33 (14,370,761) (14,927,731) 19,660,809 24,147,769 22,866,345 24,814,253 24,582,186 24,791,363 Adjusted Direct Expenses - Share of University Total 2.8% 3.2% 2.8% 3.2% 3.3% 3.2%
198 Research Graduate College FY19 Budgeted Expenses Five Year Faculty/Staff Headcount Trends 12 63,162, 4% 361,627, 24% $1,531,131 1,101,342, 72% Salaries, Wages, & Other Payroll Benefits Operating Expenses FY14 FY15 FY16 FY17 FY18 Administrator Classified Non Bargaining VP of Research FY19 Budgeted Expenses 78,000, 1% 2,488,098, 29% Salaries, Wages, & Other Payroll $8,617,514 Benefits Operating Expenses Debt Service 4,511,494, 52% 1,523,922, 18% Five Year Faculty/Staff Headcount Trends FY14 FY15 FY16 FY17 FY18 Administrator Classified AFSCME Classified Non Bargaining
199 Research FY15 Actuals FY16 Actuals FY17 Actuals FY18 Budget FY18 Forecast FY19 Budget REVENUES 1 State Appropriations $ 27,107 $ - $ - $ - $ - $ - 2 State Appropriations - Capital Gross Undergraduate Tuition & Fees 240, , , , , ,407 4 Undergraduate Financial Aid (12,623) (14,532) (18,190) - - (10,000) 5 Net Undergraduate Tuition & Fees 227, , , , , ,407 6 Gross Graduate Tuition & Fees 77, , , , , ,727 7 Graduate Financial Aid (690,576) (755,396) (281,856) (127,165) (127,165) (524,883) 8 Net Graduate Tuition & Fees (613,068) (528,248) (29,655) 99,935 99,935 (294,156) 9 Room & Board Grants & Contracts 773,191 1,164,709 2,151, , ,138 1,971, Facilities & Admin Cost Recovery 83,288 1,277,317 1,345,305 1,050,000 1,050,000 1,050, Endowment Distributions 1,147,792 1,636,410 1,707,617 1,678,864 1,678,864 1,657, Gift Contributions 41,109 33,846 82, Investment Income Internal & External Sales 11,091,424 7,304,464 5,751, , , , Total Revenues 12,778,490 11,114,687 11,246,023 4,668,448 4,701,726 5,462, Administrative Cost Distribution 6,340,277 5,491,655 5,132,344 5,160,761 5,182,678 5,665, Subvention Distribution 58,000 59,872 61,450 61,518 61,518 61, Total Revenues & Revenue Allocations $ 19,176,767 $ 16,666,214 $ 16,439,817 $ 9,890,727 $ 9,945,922 $ 11,190, Funding Transfers $ 718,103 $ 1,196,222 $ 1,195,039 $ 1,468,506 $ 1,468,094 $ 1,223,206 EXPENSES 21 Total Salaries, Wages, & Other Payroll 4,557,289 4,938,975 5,769,542 5,199,921 5,242,146 5,612, Total Benefits 1,447,604 1,588,270 1,804,415 1,771,373 1,771,373 1,885, Supplies & Services 11,150,709 5,447,275 3,039,678 1,157,389 1,302,290 1,380, Professional Services 1,647,571 1,561,030 2,146, , , , Occupancy & Maintenance 141, , , ,227 3,450 13, Capital Costs 5, ,285 80,625 11,000 11,000 21, Cost Of Goods Sold External Debt Service - Principal External Debt Service - Interest Internal Principal & Interest 77,065 77,594 78,397 78,000 78,000 78, Depreciation Other Operating Expense 647,454 (143,909) 6, , , , Total Direct Expenses 19,674,299 14,016,641 13,125,136 9,511,808 9,557,037 10,148, Administrative Cost Allocations Capital Cost Allocation Subvention Allocation Total Expenses & Expense Allocations $ 19,674,299 $ 14,016,641 $ 13,125,136 $ 9,511,808 $ 9,557,037 $ 10,148, Results of Operations $ (1,215,635) $ 1,453,351 $ 2,119,642 $ (1,089,587) $ (1,079,209) $ (181,661) INVESTMENT TRANSFERS 39 Transfer To (From) Operating Reserve (108,407) (108,407) - 40 Transfer To (From) Plant Fund (2,980) 266, , Transfer To (From) Quasi Endowments Repair & Replacement Transfers Internal Bank Transfers Other Transfers 32,004 (34,455) (44,583) (1,042,000) (1,042,000) (180,000) 45 Total Investment Transfers $ 29,023 $ 231,882 $ 64,162 $ (1,150,407) $ (1,150,407) $ (180,000) 46 Net Results $ (1,244,658) $ 1,221,469 $ 2,055,480 $ 60,820 $ 71,198 $ (1,661) 47 Transfer Net Results to Fund Balance (1,244,658) 1,221,469 2,055,480 60,820 71,198 (1,661) 48 Adjusted Net Results $ - $ - $ - $ - $ - $ Total Transfer To (From) Reserve (1,244,658) 1,221,469 2,055,480 (47,587) (37,209) (1,661) Ratio: Row 33 Total Direct Expenses - Share of University Total 2.8% 1.9% 1.6% 1.2% 1.3% 1.3% Ratio: Row 33 (10,095,264) (4,277,697) (1,585,668) (52,500) (52,500) (52,500) 9,579,035 9,738,944 11,539,468 9,459,308 9,504,537 10,096,145 Adjusted Direct Expenses - Share of University Total 1.4% 1.3% 1.4% 1.2% 1.3% 1.3%
200 Student Affairs Bobcat Depot FY19 Budgeted Expenses 250,883, 5% 70,944, 1% Five Year Faculty/Staff Headcount Trends $5,003,366 Salaries, Wages, & Other Payroll Benefits Operating Expenses ,681,539, 94% 0 FY14 FY15 FY16 FY17 FY18 Administrator Campus Recreation FY19 Budgeted Expenses Five Year Faculty/Staff Headcount Trends ,946,810, 31% 2,418,941, 38% Salaries, Wages, & Other Payroll 10 8 $6,293,497 Benefits Operating Expenses Debt Service ,506,503, 24% 421,242, 7% 0 FY14 FY15 FY16 FY17 FY18 Administrator Classified Non Bargaining VP of Student Affairs FY19 Budgeted Expenses Five Year Faculty/Staff Headcount Trends ,937,000, 22% 50 Salaries, Wages, & Other Payroll 40 2,223,970, 16% $13,595,303 6,358,822, 47% Benefits Operating Expenses Debt Service ,070,311, 15% 0 FY14 FY15 FY16 FY17 FY18 Administrator Classified Non Bargaining Departments included within VP Student Affairs: The Office of the VP for Student Affairs; Campus Involvement Center; Student Health Services; Event Services; Dean of Students; Community Standards and Student Responsibility; Career and Leadership Development Center; Counseling and Psychological Services; The Post
201 Student Affairs FY15 Actuals FY16 Actuals FY17 Actuals FY18 Budget FY18 Forecast FY19 Budget REVENUES 1 State Appropriations $ - $ - $ - $ - $ - $ - 2 State Appropriations - Capital Gross Undergraduate Tuition & Fees 1,107, , , , , ,926 4 Undergraduate Financial Aid (71,873) (63,802) (100,317) (30,000) (30,000) (30,000) 5 Net Undergraduate Tuition & Fees 1,036, , , , , ,926 6 Gross Graduate Tuition & Fees Graduate Financial Aid - - (9,440) Net Graduate Tuition & Fees (9,350) Room & Board Grants & Contracts 8,441 14, , Facilities & Admin Cost Recovery Endowment Distributions 57,907 71, , Gift Contributions 108, ,401 77,488 95,200 95, Investment Income Internal & External Sales 9,004,638 8,817,783 8,827,222 8,224,054 8,234,054 7,819, Total Revenues 10,215,517 9,813,070 9,769,785 8,489,054 8,499,054 8,620, Administrative Cost Distribution 14,592,716 15,198,274 15,798,280 15,807,393 15,807,393 15,840, Subvention Distribution Total Revenues & Revenue Allocations $ 24,808,233 $ 25,011,344 $ 25,568,065 $ 24,296,447 $ 24,306,447 $ 24,460, Funding Transfers $ (9,803) $ (124,592) $ 76,139 $ (880,890) $ (668,996) $ (778,549) EXPENSES 21 Total Salaries, Wages, & Other Payroll 7,680,541 7,700,868 8,364,607 8,805,818 8,566,756 9,304, Total Benefits 2,038,522 2,091,607 2,250,159 2,658,098 2,563,193 2,612, Supplies & Services 2,041,033 2,049,593 2,434,067 1,600,136 1,741,582 1,689, Professional Services 1,982,109 1,992,567 1,878,027 1,694,186 1,754,779 1,724, Occupancy & Maintenance 689, , , , , , Capital Costs 170,345 23, , ,202 5, Cost Of Goods Sold 5,373,513 4,924,086 5,053,500 4,771,810 4,771,810 4,504, External Debt Service - Principal External Debt Service - Interest Internal Principal & Interest 4,885,322 4,890,256 4,888,440 4,887,510 4,887,510 4,883, Depreciation Other Operating Expense 94,174 38,305 60,863 92, ,570 44, Total Direct Expenses 24,954,766 24,546,025 26,207,321 25,098,937 24,862,399 25,217, Administrative Cost Allocations , Capital Cost Allocation Subvention Allocation - - (3,813) Total Expenses & Expense Allocations $ 24,954,766 $ 24,546,025 $ 26,203,508 $ 25,098,937 $ 24,924,399 $ 25,217, Results of Operations $ (136,729) $ 589,911 $ (711,582) $ 78,400 $ 51,044 $ 21,818 INVESTMENT TRANSFERS 39 Transfer To (From) Operating Reserve (10,000) 40 Transfer To (From) Plant Fund (54,962) 17,689 23,047-41, Transfer To (From) Quasi Endowments Repair & Replacement Transfers , Internal Bank Transfers Other Transfers Total Investment Transfers $ (54,962) $ 17,689 $ 23,047 $ - $ 51,044 $ (10,000) 46 Net Results $ (81,767) $ 572,222 $ (734,629) $ 78,400 $ - $ 31, Transfer Net Results to Fund Balance (81,767) 572,222 (734,629) 78,400-31, Adjusted Net Results $ - $ - $ - $ - $ - $ Total Transfer To (From) Reserve (81,767) 572,222 (734,629) 78,400-21,818 Ratio: Row 33 Total Direct Expenses - Share of University Total 3.6% 3.3% 3.3% 3.3% 3.3% 3.3%
202 Wellworks FY19 Budgeted Expenses Five Year Faculty/Staff Headcount Trends ,947, 11% ,122, 18% $766,874 Salaries, Wages, & Other Payroll Benefits Operating Expenses ,805, 71% 1 0 FY14 FY15 FY16 FY17 FY18 Administrator Classified Non Bargaining
203 Wellworks FY15 Actuals FY16 Actuals FY17 Actuals FY18 Budget FY18 Forecast FY19 Budget REVENUES 1 State Appropriations $ - $ - $ - $ - $ - $ - 2 State Appropriations - Capital Gross Undergraduate Tuition & Fees Undergraduate Financial Aid Net Undergraduate Tuition & Fees Gross Graduate Tuition & Fees Graduate Financial Aid Net Graduate Tuition & Fees Room & Board Grants & Contracts 186, ,823 4, ,284 2,603 2, Facilities & Admin Cost Recovery Endowment Distributions Gift Contributions - 1, Investment Income Internal & External Sales 409, , , , , , Total Revenues 595,430 1,088, , , , , Administrative Cost Distribution 241, , , , , , Subvention Distribution Total Revenues & Revenue Allocations $ 837,406 $ 1,349,557 $ 955,336 $ 856,281 $ 566,554 $ 592, Funding Transfers $ (14,559) $ (8,999) $ (7,857) $ (186,305) $ (174,024) $ (174,215) EXPENSES 21 Total Salaries, Wages, & Other Payroll 655, , , , , , Total Benefits 176, , , , , , Supplies & Services 60,986 60,974 53,871 49,548 62,066 56, Professional Services 66, ,126 (215) Occupancy & Maintenance 5,460 7,180 5,739 9,150 8,274 16, Capital Costs ,920-27, Cost Of Goods Sold External Debt Service - Principal External Debt Service - Interest Internal Principal & Interest Depreciation Other Operating Expense ,022 10,250 13, Total Direct Expenses 965,480 1,225, ,788 1,029, , , Administrative Cost Allocations Capital Cost Allocation Subvention Allocation Total Expenses & Expense Allocations $ 965,480 $ 1,225,614 $ 926,788 $ 1,029,546 $ 740,578 $ 766, Results of Operations $ (113,515) $ 132,942 $ 36,404 $ 13,040 $ - $ - INVESTMENT TRANSFERS 39 Transfer To (From) Operating Reserve Transfer To (From) Plant Fund Transfer To (From) Quasi Endowments Repair & Replacement Transfers , Internal Bank Transfers Other Transfers Total Investment Transfers $ - $ - $ - $ 13,059 $ - $ - 46 Net Results $ (113,515) $ 132,942 $ 36,404 $ (19) $ - $ - 47 Transfer Net Results to Fund Balance (113,515) 132,942 36,404 (19) Adjusted Net Results $ - $ - $ - $ - $ - $ Total Transfer To (From) Reserve (113,515) 132,942 36,404 (19) - - Ratio: Total Direct Expenses - Share of University Total Row % 0.2% 0.1% 0.1% 0.1% 0.1%
204 WOUB FY19 Budgeted Expenses Five Year Faculty/Staff Headcount Trends ,250,784, 42% $5,744,412 2,262,119, 43% Salaries, Wages, & Other Payroll Benefits Operating Expenses ,271, 15% 0 FY14 FY15 FY16 FY17 FY18 Administrator Classified Non Bargaining
205 WOUB FY15 Actuals FY16 Actuals FY17 Actuals FY18 Budget FY18 Forecast FY19 Budget REVENUES 1 State Appropriations $ - $ - $ - $ - $ - $ - 2 State Appropriations - Capital Gross Undergraduate Tuition & Fees Undergraduate Financial Aid (5,000) (3,375) (1,750) (1,176) (1,075) (1,075) 5 Net Undergraduate Tuition & Fees (5,000) (3,375) (1,750) (1,176) (1,075) (1,075) 6 Gross Graduate Tuition & Fees Graduate Financial Aid Net Graduate Tuition & Fees Room & Board Grants & Contracts 1,856,429 1,926,358 2,059,538 2,116,175 2,155,582 2,133, Facilities & Admin Cost Recovery Endowment Distributions 1,907 1,964 2,094 2,159 2,085 98, Gift Contributions 586, , , , , , Investment Income Internal & External Sales 373, ,628 18,773, , , , Total Revenues 2,813,828 2,954,062 21,477,688 3,068,236 3,107,522 3,152, Administrative Cost Distribution 2,119,872 2,250,689 2,331,579 2,240,141 2,240,141 2,267, Subvention Distribution 46, Total Revenues & Revenue Allocations $ 4,979,700 $ 5,204,750 $ 23,809,266 $ 5,308,377 $ 5,347,663 $ 5,420, Funding Transfers $ (419,355) $ (409,272) $ (84,527) $ (31,000) $ (19,000) $ (19,000) EXPENSES 21 Total Salaries, Wages, & Other Payroll 2,358,843 2,482,993 2,382,421 2,291,094 2,280,387 2,262, Total Benefits 804, , , , , , Supplies & Services 1,693,896 1,786,788 1,796,568 1,802,928 2,016,475 2,027, Professional Services 255, , , , , , Occupancy & Maintenance 204, , , , ,569 80, Capital Costs 123,897 28,567 23, , , , Cost Of Goods Sold External Debt Service - Principal External Debt Service - Interest Internal Principal & Interest 49,132 49,132 49, , , Depreciation Other Operating Expense 13,509 12, ,803 19,145 27, Total Direct Expenses 5,504,280 5,586,218 5,419,906 6,116,368 5,971,253 5,744, Administrative Cost Allocations Capital Cost Allocation Subvention Allocation Total Expenses & Expense Allocations $ 5,504,280 $ 5,586,218 $ 5,419,906 $ 6,116,368 $ 5,971,253 $ 5,744, Results of Operations $ (105,225) $ 27,804 $ 18,473,886 $ (776,991) $ (604,590) $ (305,000) INVESTMENT TRANSFERS 39 Transfer To (From) Operating Reserve (18,412,349) (18,412,349) (305,000) 40 Transfer To (From) Plant Fund 4, ,500,000 2,959, Transfer To (From) Quasi Endowments ,135,358 14,100, Repair & Replacement Transfers Internal Bank Transfers Other Transfers Total Investment Transfers $ 4,780 $ - $ - $ (776,991) $ (1,352,949) $ (305,000) 46 Net Results $ (110,005) $ 27,804 $ 18,473,886 $ - $ 748,359 $ - 47 Transfer Net Results to Fund Balance (110,005) 27,804 18,473, , Adjusted Net Results $ - $ - $ - $ - $ - $ Total Transfer To (From) Reserve (110,005) 27,804 18,473,886 (18,412,349) (17,663,990) (305,000) Ratio: Total Direct Expenses - Share of University Total Row % 0.7% 0.7% 0.8% 0.8% 0.7%
206
207 14 Budget Unit Summaries Operating Activity Across the following pages, each of these summary columns are presented with Planning Unit detail. Athens Colleges & Schools Arts & Sciences Business Communication Education Engineering Fine Arts Health Sciences Honors Tutorial College (Honors) Global Affairs and International Studies (OGAIS) University College Voinovich Heritage College of Osteopathic Medicine (HCOM) HCOM Athens HCOM Cleveland HCOM Dublin Regional Campuses Chillicothe Campus Eastern Campus Executive Dean Lancaster Campus Southern Campus Zanesville Campus Auxiliaries Athletics Culinary Services Housing & Residence Life Parking & Transportation Printing Central & Admin Operations Advancement Athena 1 Benefits Employee Fee Waivers Healthcare Expense Workers Compensation Expense Central Operations Campus Care Central Accounting Central Financial Aid Debt Service Healthcare Collection Indirect Cost Collection Institutional Projects & Initiatives Program Support Staff Governance Utilities Workers Compensation Collection Child Development Center 2 Information Technology International Student & Faculty Services (ISFS) 3 Kennedy Museum 1 Library Marching President Diversity & Inclusion Marketing President Provost Center for Campus and Community Engagement (CCCE) Instructional Innovation Enrollment Management Provost Research Graduate College VP of Research Student Affairs Bobcat Depot Campus Recreation Career Fee VP of Student Affairs Finance and Administration Airport Custodial Design & Construction Environmental Health & Safety Facilities Management & Safety Finance Grounds Heating Plant Human Resources Logistics Maintenance Ohio University Police Department (OUPD) Real Estate VPFA Office WellWorks 4 WOUB 5 Capital Improvement Transfer Adjustments Reserves & Subvention Strategic Opportunity Reserve Institutional Reserve & Subvention Provost Reserve Academic Support Units Affiliated with Colleges 1. Fine Arts 2. Education 3. OGAIS 4. Health Sciences 5. Communication
208 14.1 Athens Colleges and Schools Athens Colleges and Schools Regional Campuses Auxiliaries Central & Admin Operations Reserves & Subvention Operating Activity Subtotal Non- Operating Activity Financial Statement Adj & Component Units REVENUES 1 State Appropriations $ $ 22.4 $ - $ 0.2 $ 2.9 $ $ - $ - $ State Appropriations - Capital Gross Undergraduate Tuition & Fees Undergraduate Financial Aid (48.6) (5.2) (13.9) 6.4 (1.7) (63.0) - - (63.0) 5 Net Undergraduate Tuition & Fees (13.9) Gross Graduate Tuition & Fees Graduate Financial Aid (28.1) - - (0.5) - (28.7) - - (28.7) 8 Net Graduate Tuition & Fees Room & Board Grants & Contracts Facilities & Admin Cost Recovery Endowment Distributions (29.8) Gift Contributions Investment Income Internal & External Sales Total Revenues Administrative Cost Distribution (24.6) Subvention Distribution (62.3) Total Revenues & Revenue Allocations (50.1) Funding Transfers (6.4) (0.5) 3.3 (14.8) EXPENSES 21 Total Salaries, Wages, & Other Payroll Total Benefits Supplies & Services Professional Services Occupancy & Maintenance Capital Costs (107.2) - 27 Cost Of Goods Sold External Debt Service - Principal (16.1) - 29 External Debt Service - Interest (1.5) Internal Principal & Interest (54.1) Depreciation Other Operating Expense (2.1) Total Direct Expenses (68.3) Administrative Cost Allocations (191.7) Capital Cost Allocation (13.6) Subvention Allocation (62.0) Total Expenses & Expense Allocations (62.0) (68.3) Results of Operations (3.8) (6.4) 6.6 (41.1) INVESTMENT TRANSFERS 39 Transfer To (From) Operating Reserve (10.8) - (0.1) 5.7 (7.4) (12.7) Transfer To (From) Plant Fund (22.6) Transfer To (From) Quasi Endowments (1.0) Repair & Replacement Transfers Internal Bank Transfers Other Transfers Total Investment Transfers (10.0) (6.4) 10.9 (10.9) Net Results (6.4) (4.2) - (4.3) (30.2) Transfer Net Results to Fund Balance (6.4) (4.2) - (4.3) Adjusted Net Results (34.5) GAAP Adj Totals Total Transfer To (From) Reserve (4.6) 0.1 (6.5) 1.5 (7.4) (17.0)
209 Arts & Sciences Business Communication Education Engineering Fine Arts REVENUES 1 State Appropriations $ 35,888,181 $ 14,378,524 $ 8,155,609 $ 10,525,276 $ 8,595,653 $ 7,368,214 2 State Appropriations - Capital Gross Undergraduate Tuition & Fees 95,485,880 36,395,281 21,280,255 15,783,613 16,511,347 15,514,566 4 Undergraduate Financial Aid (18,017,470) (6,696,473) (4,123,569) (2,990,281) (4,528,134) (3,299,820) 5 Net Undergraduate Tuition & Fees 77,468,411 29,698,808 17,156,687 12,793,332 11,983,213 12,214,746 6 Gross Graduate Tuition & Fees 14,537,673 18,887,789 2,755,484 10,706,190 6,800,000 3,770,951 7 Graduate Financial Aid (8,569,902) (1,261,740) (1,891,489) (3,121,398) (3,790,000) (2,769,517) 8 Net Graduate Tuition & Fees 5,967,771 17,626, ,995 7,584,792 3,010,000 1,001,434 9 Room & Board Grants & Contracts 5,249, , , ,000 9,300,000 69, Facilities & Admin Cost Recovery 1,540,979-55,000-1,815, Endowment Distributions 1,364, ,656 1,300, ,503 7,386, , Gift Contributions 337, , , , , , Investment Income Internal & External Sales 955,276 1,341, , , Total Revenues 128,772,409 65,031,552 28,718,618 31,957,903 42,256,046 21,734, Administrative Cost Distribution Subvention Distribution (3,426,837) (2,664,327) 6,969,507 2,289,660 17,616,354 8,469, Total Revenues & Revenue Allocations $ 125,345,572 $ 62,367,225 $ 35,688,125 $ 34,247,563 $ 59,872,400 $ 30,204, Funding Transfers $ (99,873) $ (2,233,175) $ (353,326) $ (414,490) $ (900,000) $ (1,265,000) EXPENSES 21 Total Salaries, Wages, & Other Payroll 54,714,749 21,090,092 12,326,770 12,825,132 25,550,896 12,124, Total Benefits 15,860,359 5,634,761 3,508,824 3,733,266 5,876,164 4,037, Supplies & Services 5,006,937 4,153,203 1,407, ,613 4,175,226 1,813, Professional Services 1,834,756 7,003, ,800 1,143,507 2,152, , Occupancy & Maintenance 95,214 96,205 58, , , Capital Costs 365, ,182, Cost Of Goods Sold External Debt Service - Principal External Debt Service - Interest Internal Principal & Interest 40, , , , Depreciation Other Operating Expense 100, , , , Total Direct Expenses 78,018,443 38,757,231 17,930,354 18,947,518 40,629,311 18,939, Administrative Cost Allocations 33,665,676 18,140,728 13,162,558 11,451,162 15,489,251 9,243, Capital Cost Allocation 4,291, ,327 1,595, ,884 1,580,506 1,146, Subvention Allocation 15,149,563 7,523,224 3,290,994 3,869,901 3,260,236 2,581, Total Expenses & Expense Allocations $ 131,124,684 $ 65,040,510 $ 35,979,850 $ 35,132,465 $ 60,959,305 $ 31,911, Results of Operations $ (5,679,239) $ (440,110) $ 61,601 $ (470,412) $ (186,904) $ (441,628) INVESTMENT TRANSFERS 39 Transfer To (From) Operating Reserve (5,679,240) (827,848) (357,003) (475,000) - (541,254) 40 Transfer To (From) Plant Fund Transfer To (From) Quasi Endowments Repair & Replacement Transfers Internal Bank Transfers Other Transfers Total Investment Transfers $ (5,679,240) $ (827,848) $ (357,003) $ (475,000) $ - $ (541,254) 46 Net Results $ - $ 387,738 $ 418,603 $ 4,588 $ (186,904) $ 99, Transfer Net Results to Fund Balance - 387, ,603 4,588 (186,904) 99, Adjusted Net Results $ - $ - $ - $ - $ - $ Total Transfer To (From) Reserve (5,679,240) (440,110) 61,601 (470,412) (186,904) (441,628)
210 Health Sciences Honors OGAIS University College Voinovich Subtotal: Athens Colleges REVENUES 1 State Appropriations $ 30,012,515 $ 46,493 $ 903,565 $ 1,912,082 $ 2,015,095 $ 119,801,206 2 State Appropriations - Capital Gross Undergraduate Tuition & Fees 42,372, ,656 4,916,730 6,764, , ,305,887 4 Undergraduate Financial Aid (4,448,754) (1,404,647) (719,069) (2,300,207) (21,564) (48,549,986) 5 Net Undergraduate Tuition & Fees 37,923,248 (1,239,991) 4,197,662 4,464,214 95, ,755,901 6 Gross Graduate Tuition & Fees 16,556,221-1,598,519-3,357,019 78,969,846 7 Graduate Financial Aid (1,598,636) - (1,469,155) (8,188) (405,388) (24,885,413) 8 Net Graduate Tuition & Fees 14,957, ,364 (8,188) 2,951,631 54,084,433 9 Room & Board Grants & Contracts 870,066 9,375 13, ,000 6,896,663 24,027, Facilities & Admin Cost Recovery 62, ,625 4,357, Endowment Distributions 160,944 1,186, ,320 25,005 64,925 13,381, Gift Contributions 173,292 25,000-75, ,370 2,879, Investment Income Internal & External Sales 3,536, ,000 17,996 6,426, Total Revenues 87,696,850 27,869 5,478,711 6,892,113 13,147, ,714, Administrative Cost Distribution Subvention Distribution (7,905,492) 1,370,873 2,706,708 9,763,797 3,845,504 39,035, Total Revenues & Revenue Allocations $ 79,791,358 $ 1,398,743 $ 8,185,419 $ 16,655,911 $ 16,993,380 $ 470,750, Funding Transfers $ 99,404 $ (486,375) $ 65,640 $ (253,325) $ (892,828) $ (6,733,348) EXPENSES 21 Total Salaries, Wages, & Other Payroll 20,657, ,473 2,133,194 4,017,272 7,245, ,356, Total Benefits 6,927, , ,690 1,232,825 2,166,478 49,823, Supplies & Services 2,581, ,370 3,483, , ,417 25,277, Professional Services 6,150, ,000 55, ,500 6,437,549 26,130, Occupancy & Maintenance 1,206,062 18,230 16,400 33,020 67,563 2,562, Capital Costs - - 5, ,552, Cost Of Goods Sold 194, , External Debt Service - Principal External Debt Service - Interest Internal Principal & Interest - - 5, ,856, Depreciation Other Operating Expense 267,872-41, ,122, Total Direct Expenses 37,985,748 1,578,598 6,331,653 6,047,194 16,712, ,877, Administrative Cost Allocations 31,642, ,016 1,044,864 9,951,896 1,536, ,510, Capital Cost Allocation 968,145 9, , , ,366 11,499, Subvention Allocation 10,359,587 22, , , ,193 47,837, Total Expenses & Expense Allocations $ 80,955,522 $ 1,792,263 $ 7,884,834 $ 16,909,236 $ 19,033,764 $ 486,723, Results of Operations $ (1,263,568) $ 92,854 $ 234,945 $ - $ (1,147,556) $ (9,240,018) INVESTMENT TRANSFERS 39 Transfer To (From) Operating Reserve (1,400,954) (1,187,028) (10,468,327) 40 Transfer To (From) Plant Fund Transfer To (From) Quasi Endowments Repair & Replacement Transfers Internal Bank Transfers Other Transfers Total Investment Transfers $ (1,400,954) $ - $ - $ - $ (1,187,028) $ (10,468,327) 46 Net Results $ 137,386 $ 92,854 $ 234,945 $ - $ 39,472 $ 1,228, Transfer Net Results to Fund Balance 137,386 92, ,945-39,472 1,228, Adjusted Net Results $ - $ - $ - $ - $ - $ Total Transfer To (From) Reserve (1,263,568) 92, ,945 - (1,147,556) (9,240,019)
211 HCOM Athens HCOM Cleveland HCOM Dublin Subtotal: College of Medicine Total: Athens Colleges & Schools REVENUES 1 State Appropriations $ 22,386,376 $ - $ - $ 22,386,376 $ 142,187,582 2 State Appropriations - Capital Gross Undergraduate Tuition & Fees 64,186 24,070 26, , ,420,887 4 Undergraduate Financial Aid (44,600) - - (44,600) (48,594,586) 5 Net Undergraduate Tuition & Fees 19,586 24,070 26,744 70, ,826,301 6 Gross Graduate Tuition & Fees 25,996,198 9,508,144 9,671,394 45,175, ,145,582 7 Graduate Financial Aid (2,302,194) (381,438) (529,082) (3,212,714) (28,098,127) 8 Net Graduate Tuition & Fees 23,694,004 9,126,706 9,142,312 41,963,022 96,047,455 9 Room & Board Grants & Contracts 7,774,594 30,000 1,351,279 9,155,873 33,182, Facilities & Admin Cost Recovery 545, ,300 4,902, Endowment Distributions 1,007,776-3,558 1,011,334 14,393, Gift Contributions 300, ,000 10, ,000 3,719, Investment Income Internal & External Sales 2,038,259 11, ,734 2,898,393 9,325, Total Revenues 57,765,990 9,722,176 11,382,627 78,870, ,585, Administrative Cost Distribution Subvention Distribution 6,141,871 1,121,358 1,093,273 8,356,502 47,392, Total Revenues & Revenue Allocations $ 63,907,861 $ 10,843,534 $ 12,475,900 $ 87,227,295 $ 557,977, Funding Transfers $ (4,653,183) $ 2,214,170 $ 2,782,463 $ 343,450 $ (6,389,898) EXPENSES 21 Total Salaries, Wages, & Other Payroll 29,798,632 2,410,392 2,543,834 34,752, ,109, Total Benefits 9,639, , ,067 11,270,798 61,094, Supplies & Services 5,664, , ,662 6,824,109 32,101, Professional Services 2,416, , ,017 3,280,657 29,411, Occupancy & Maintenance 339,060 1,005, ,320 2,096,497 4,659, Capital Costs 220,900 20,000 5, ,900 1,798, Cost Of Goods Sold , External Debt Service - Principal External Debt Service - Interest Internal Principal & Interest 1,083,066 2,061,707 1,228,879 4,373,652 6,230, Depreciation Other Operating Expense 1,819,228 37,890 9,611 1,866,729 2,989, Total Direct Expenses 50,980,933 7,295,877 6,434,390 64,711, ,588, Administrative Cost Allocations 7,417, , ,662 8,524, ,034, Capital Cost Allocation 710, ,694 12,209, Subvention Allocation 5,260,973 1,121,358 1,093,273 7,475,603 55,312, Total Expenses & Expense Allocations $ 64,370,183 $ 8,903,132 $ 8,148,325 $ 81,421,639 $ 568,145, Results of Operations $ 4,190,862 $ (273,768) $ 1,545,112 $ 5,462,206 $ (3,777,812) INVESTMENT TRANSFERS 39 Transfer To (From) Operating Reserve (243,621) (335,366) 289,815 (289,172) (10,757,499) 40 Transfer To (From) Plant Fund , , , Transfer To (From) Quasi Endowments Repair & Replacement Transfers Internal Bank Transfers Other Transfers Total Investment Transfers $ (243,621) $ (335,366) $ 1,087,909 $ 508,922 $ (9,959,405) 46 Net Results $ 4,434,483 $ 61,598 $ 457,203 $ 4,953,284 $ 6,181, Transfer Net Results to Fund Balance 4,434,483 61, ,203 4,953,284 6,181, Adjusted Net Results $ - $ - $ - $ - $ Total Transfer To (From) Reserve 4,190,862 (273,768) 747,018 4,664,112 (4,575,907)
212 14.2 Regional Campuses Athens Colleges and Schools Regional Campuses Auxiliaries Central & Admin Operations Reserves & Subvention Operating Activity Subtotal Non- Operating Activity Financial Statement Adj & Component Units REVENUES 1 State Appropriations $ $ 22.4 $ - $ 0.2 $ 2.9 $ $ - $ - $ State Appropriations - Capital Gross Undergraduate Tuition & Fees Undergraduate Financial Aid (48.6) (5.2) (13.9) 6.4 (1.7) (63.0) - - (63.0) 5 Net Undergraduate Tuition & Fees (13.9) Gross Graduate Tuition & Fees Graduate Financial Aid (28.1) - - (0.5) - (28.7) - - (28.7) 8 Net Graduate Tuition & Fees Room & Board Grants & Contracts Facilities & Admin Cost Recovery Endowment Distributions (29.8) Gift Contributions Investment Income Internal & External Sales Total Revenues Administrative Cost Distribution (24.6) Subvention Distribution (62.3) Total Revenues & Revenue Allocations $ $ 69.9 $ $ 42.7 $ (50.1) $ $ 54.8 $ 7.1 $ Funding Transfers $ (6.4) $ (0.5) $ 3.3 $ (14.8) $ 18.4 $ - $ - $ - $ - EXPENSES 21 Total Salaries, Wages, & Other Payroll Total Benefits Supplies & Services Professional Services Occupancy & Maintenance Capital Costs (107.2) - 27 Cost Of Goods Sold External Debt Service - Principal (16.1) - 29 External Debt Service - Interest (1.5) Internal Principal & Interest (54.1) Depreciation Other Operating Expense (2.1) Total Direct Expenses (68.3) Administrative Cost Allocations (191.7) Capital Cost Allocation (13.6) Subvention Allocation (62.0) Total Expenses & Expense Allocations $ $ 70.3 $ $ 51.0 $ (62.0) $ $ 95.9 $ (68.3) $ Results of Operations $ (3.8) $ 0.1 $ 10.2 $ 6.5 $ (6.4) $ 6.6 $ (41.1) $ 75.4 $ 40.9 INVESTMENT TRANSFERS Transfer To (From) Operating Reserve (10.8) - (0.1) 5.7 (7.4) (12.7) Transfer To (From) Plant Fund (22.6) Transfer To (From) Quasi Endowments (1.0) Repair & Replacement Transfers Internal Bank Transfers Other Transfers Total Investment Transfers $ (10.0) $ - $ 16.6 $ 10.7 $ (6.4) $ 10.9 $ (10.9) $ - $ - 46 Net Results $ 6.2 $ 0.1 $ (6.4) $ (4.2) $ - $ (4.3) $ (30.2) $ 75.4 $ Transfer Net Results to Fund Balance (6.4) (4.2) - (4.3) Adjusted Net Results $ - $ - $ - $ - $ - $ - $ (34.5) $ 75.4 $ 40.9 GAAP Adj Totals Total Transfer To (From) Reserve (4.6) 0.1 (6.5) 1.5 (7.4) (17.0)
213 Chillicothe Eastern Executive Dean Lancaster Southern Zanesville Total: Regional Campuses REVENUES 1 State Appropriations $ 5,399,838 $ 2,086,164 $ - $ 5,071,046 $ 4,261,934 $ 5,613,206 $ 22,432,188 2 State Appropriations - Capital Gross Undergraduate Tuition & Fees 7,957,489 3,368,813 1,107,852 8,389,962 7,757,790 6,599,307 35,181,213 4 Undergraduate Financial Aid (771,500) (612,000) (875,000) (1,214,163) (1,021,846) (670,000) (5,164,509) 5 Net Undergraduate Tuition & Fees 7,185,989 2,756, ,852 7,175,799 6,735,944 5,929,307 30,016,704 6 Gross Graduate Tuition & Fees 50, ,700 20,125 3, ,105 7 Graduate Financial Aid (25,000) - - (500) (25,375) 8 Net Graduate Tuition & Fees 25, ,200 20,250 3, ,730 9 Room & Board Grants & Contracts 234, , , , ,000 1,428, Facilities & Admin Cost Recovery Endowment Distributions 120,970 77,980 5, ,703 77,129 40, , Gift Contributions 20,000 35,000-20, ,000 30, , Investment Income Internal & External Sales 106,000 60,000 25, , ,000 46, , Total Revenues 13,092,098 5,292, ,852 13,070,747 11,734,957 11,912,697 55,366, Administrative Cost Distribution Subvention Distribution 3,044,933 1,251,088 1,758,625 3,277,318 2,699,501 2,480,370 14,511, Total Revenues & Revenue Allocations $ 16,137,031 $ 6,544,046 $ 2,021,477 $ 16,348,065 $ 14,434,458 $ 14,393,067 $ 69,878, Funding Transfers $ - $ - $ (485,057) $ - $ - $ - $ (485,057) EXPENSES 21 Total Salaries, Wages, & Other Payroll 7,722,389 3,238, ,202 6,551,599 6,326,949 6,457,739 31,187, Total Benefits 2,516,617 1,021, ,499 2,273,895 2,142,600 2,208,121 10,377, Supplies & Services 712, , , , , ,213 3,084, Professional Services 153,954 52,750 8, , ,400 70, , Occupancy & Maintenance 464, ,866 1, , , ,000 2,054, Capital Costs 30,000 7,000 1,000 27, ,000 12, , Cost Of Goods Sold 250 5, , External Debt Service - Principal External Debt Service - Interest Internal Principal & Interest , , Depreciation Other Operating Expense 1,250 7, ,000 52,300 80, , Total Direct Expenses 11,601,398 4,878,349 1,370,388 10,266,311 10,343,024 9,665,573 48,125, Administrative Cost Allocations 3,667,642 1,616,328 32,259 3,631,305 3,492,979 2,995,039 15,435, Capital Cost Allocation Subvention Allocation 1,610, ,603 (1,247) 1,590,471 1,409,759 1,453,447 6,697, Total Expenses & Expense Allocations $ 16,879,841 $ 7,129,280 $ 1,401,401 $ 15,488,087 $ 15,245,762 $ 14,114,059 $ 70,258, Results of Operations $ (742,811) $ (585,234) $ 1,105,134 $ 859,978 $ (811,304) $ 279,007 $ 104,770 INVESTMENT TRANSFERS 39 Transfer To (From) Operating Reserve Transfer To (From) Plant Fund Transfer To (From) Quasi Endowments Repair & Replacement Transfers Internal Bank Transfers Other Transfers Total Investment Transfers $ - $ - $ - $ - $ - $ - $ - 46 Net Results $ (742,811) $ (585,234) $ 1,105,134 $ 859,978 $ (811,304) $ 279,007 $ 104, Transfer Net Results to Fund Balance (742,811) (585,234) 1,105, ,978 (811,304) 279, , Adjusted Net Results $ - $ - $ - $ - $ - $ - $ Total Transfer To (From) Reserve (742,811) (585,234) 1,105, ,978 (811,304) 279, ,770
214 14.3 Auxiliaries Athens Colleges and Schools Regional Campuses Auxiliaries Central & Admin Operations Reserves & Subvention Operating Activity Subtotal Non- Operating Activity Financial Statement Adj & Component Units REVENUES 1 State Appropriations $ $ 22.4 $ - $ 0.2 $ 2.9 $ $ - $ - $ State Appropriations - Capital Gross Undergraduate Tuition & Fees Undergraduate Financial Aid (48.6) (5.2) (13.9) 6.4 (1.7) (63.0) - - (63.0) 5 Net Undergraduate Tuition & Fees (13.9) Gross Graduate Tuition & Fees Graduate Financial Aid (28.1) - - (0.5) - (28.7) - - (28.7) 8 Net Graduate Tuition & Fees Room & Board Grants & Contracts Facilities & Admin Cost Recovery Endowment Distributions (29.8) Gift Contributions Investment Income Internal & External Sales Total Revenues Administrative Cost Distribution (24.6) Subvention Distribution (62.3) Total Revenues & Revenue Allocations $ $ 69.9 $ $ 42.7 $ (50.1) $ $ 54.8 $ 7.1 $ Funding Transfers $ (6.4) $ (0.5) $ 3.3 $ (14.8) $ 18.4 $ - $ - $ - $ - EXPENSES 21 Total Salaries, Wages, & Other Payroll Total Benefits Supplies & Services Professional Services Occupancy & Maintenance Capital Costs (107.2) - 27 Cost Of Goods Sold External Debt Service - Principal (16.1) - 29 External Debt Service - Interest (1.5) Internal Principal & Interest (54.1) Depreciation Other Operating Expense (2.1) Total Direct Expenses (68.3) Administrative Cost Allocations (191.7) Capital Cost Allocation (13.6) Subvention Allocation (62.0) Total Expenses & Expense Allocations $ $ 70.3 $ $ 51.0 $ (62.0) $ $ 95.9 $ (68.3) $ Results of Operations $ (3.8) $ 0.1 $ 10.2 $ 6.5 $ (6.4) $ 6.6 $ (41.1) $ 75.4 $ 40.9 INVESTMENT TRANSFERS Transfer To (From) Operating Reserve (10.8) - (0.1) 5.7 (7.4) (12.7) Transfer To (From) Plant Fund (22.6) Transfer To (From) Quasi Endowments (1.0) Repair & Replacement Transfers Internal Bank Transfers Other Transfers Total Investment Transfers $ (10.0) $ - $ 16.6 $ 10.7 $ (6.4) $ 10.9 $ (10.9) $ - $ - 46 Net Results $ 6.2 $ 0.1 $ (6.4) $ (4.2) $ - $ (4.3) $ (30.2) $ 75.4 $ Transfer Net Results to Fund Balance (6.4) (4.2) - (4.3) Adjusted Net Results $ - $ - $ - $ - $ - $ - $ (34.5) $ 75.4 $ 40.9 GAAP Adj Totals Total Transfer To (From) Reserve (4.6) 0.1 (6.5) 1.5 (7.4) (17.0)
215 Athletics Culinary Services Housing & Residence Life Parking & Transportation Printing Total: Auxiliaries REVENUES 1 State Appropriations $ - $ - $ - $ - $ - $ - 2 State Appropriations - Capital Gross Undergraduate Tuition & Fees Undergraduate Financial Aid (8,361,397) (3,500,000) (2,030,000) - - (13,891,397) 5 Net Undergraduate Tuition & Fees (8,361,397) (3,500,000) (2,030,000) - - (13,891,397) 6 Gross Graduate Tuition & Fees Graduate Financial Aid - - (24,564) - - (24,564) 8 Net Graduate Tuition & Fees - - (24,564) - - (24,564) 9 Room & Board - 39,287,708 52,120, ,408, Grants & Contracts Facilities & Admin Cost Recovery Endowment Distributions 169, , Gift Contributions 2,757, ,757, Investment Income Internal & External Sales 7,607,513 6,351,734 1,804,660 5,444,629 3,139,932 24,348, Total Revenues 2,173,080 42,139,442 51,870,650 5,444,629 3,139, ,767, Administrative Cost Distribution 23,806, ,806, Subvention Distribution Total Revenues & Revenue Allocations $ 25,979,507 $ 42,139,442 $ 51,870,650 $ 5,444,629 $ 3,139,932 $ 128,574, Funding Transfers $ (12,676) $ 345,775 $ 2,699,594 $ 299,381 $ - $ 3,332,074 EXPENSES 21 Total Salaries, Wages, & Other Payroll 7,675,507 14,350,245 6,247,122 1,477, ,303 30,473, Total Benefits 2,507,601 6,049,226 1,457, , ,893 10,879, Supplies & Services 4,273,181 2,249,474 1,792,925 1,289,284 88,275 9,693, Professional Services 634,247 72,300 39,000 8, , Occupancy & Maintenance 700,745 1,115,948 5,325, , ,500 8,072, Capital Costs - 1,400,000 21,000 5, ,000 1,626, Cost Of Goods Sold - 12,141, ,000 1,200,000 13,841, External Debt Service - Principal External Debt Service - Interest Internal Principal & Interest 2,701, ,980 10,857, ,000-13,967, Depreciation Other Operating Expense 1,141,703 57, , ,076, Total Direct Expenses 19,634,560 37,743,436 26,619,030 4,521,442 2,863,971 91,382, Administrative Cost Allocations 4,806,948 3,004,400 13,948, , ,735 22,236, Capital Cost Allocation 1,422, ,422, Subvention Allocation Total Expenses & Expense Allocations $ 25,864,199 $ 40,747,836 $ 40,567,203 $ 4,750,541 $ 3,111,706 $ 115,041, Results of Operations $ 127,984 $ 1,045,831 $ 8,603,853 $ 394,707 $ 28,226 $ 10,200,601 INVESTMENT TRANSFERS 39 Transfer To (From) Operating Reserve (129,119) (129,119) 40 Transfer To (From) Plant Fund 250,000 4,045,148 12,273, ,000-16,718, Transfer To (From) Quasi Endowments Repair & Replacement Transfers Internal Bank Transfers Other Transfers Total Investment Transfers $ 120,881 $ 4,045,148 $ 12,273,566 $ 150,000 $ - $ 16,589, Net Results $ 7,103 $ (2,999,317) $ (3,669,713) $ 244,707 $ 28,226 $ (6,388,994) 47 Transfer Net Results to Fund Balance 7,103 (2,999,317) (3,669,713) 244,707 28,226 (6,388,994) 48 Adjusted Net Results $ - $ - $ - $ - $ - $ Total Transfer To (From) Reserve (122,016) (2,999,317) (3,669,713) 244,707 28,226 (6,518,113)
216 14.4 Central & Administrative Operations Athens Colleges and Schools Regional Campuses Auxiliaries Central & Admin Operations Reserves & Subvention Operating Activity Subtotal Non- Operating Activity Financial Statement Adj & Component Units REVENUES 1 State Appropriations $ $ 22.4 $ - $ 0.2 $ 2.9 $ $ - $ - $ State Appropriations - Capital Gross Undergraduate Tuition & Fees Undergraduate Financial Aid (48.6) (5.2) (13.9) 6.4 (1.7) (63.0) - - (63.0) 5 Net Undergraduate Tuition & Fees (13.9) Gross Graduate Tuition & Fees Graduate Financial Aid (28.1) - - (0.5) - (28.7) - - (28.7) 8 Net Graduate Tuition & Fees Room & Board Grants & Contracts Facilities & Admin Cost Recovery Endowment Distributions (29.8) Gift Contributions Investment Income Internal & External Sales Total Revenues Administrative Cost Distribution (24.6) Subvention Distribution (62.3) Total Revenues & Revenue Allocations $ $ 69.9 $ $ 42.7 $ (50.1) $ $ 54.8 $ 7.1 $ Funding Transfers $ (6.4) $ (0.5) $ 3.3 $ (14.8) $ 18.4 $ - $ - $ - $ - EXPENSES 21 Total Salaries, Wages, & Other Payroll Total Benefits Supplies & Services Professional Services Occupancy & Maintenance Capital Costs (107.2) - 27 Cost Of Goods Sold External Debt Service - Principal (16.1) - 29 External Debt Service - Interest (1.5) Internal Principal & Interest (54.1) Depreciation Other Operating Expense (2.1) Total Direct Expenses (68.3) Administrative Cost Allocations (191.7) Capital Cost Allocation (13.6) Subvention Allocation (62.0) Total Expenses & Expense Allocations $ $ 70.3 $ $ 51.0 $ (62.0) $ $ 95.9 $ (68.3) $ Results of Operations $ (3.8) $ 0.1 $ 10.2 $ 6.5 $ (6.4) $ 6.6 $ (41.1) $ 75.4 $ 40.9 INVESTMENT TRANSFERS Transfer To (From) Operating Reserve (10.8) - (0.1) 5.7 (7.4) (12.7) Transfer To (From) Plant Fund (22.6) Transfer To (From) Quasi Endowments (1.0) Repair & Replacement Transfers Internal Bank Transfers Other Transfers Total Investment Transfers $ (10.0) $ - $ 16.6 $ 10.7 $ (6.4) $ 10.9 $ (10.9) $ - $ - 46 Net Results $ 6.2 $ 0.1 $ (6.4) $ (4.2) $ - $ (4.3) $ (30.2) $ 75.4 $ Transfer Net Results to Fund Balance (6.4) (4.2) - (4.3) Adjusted Net Results $ - $ - $ - $ - $ - $ - $ (34.5) $ 75.4 $ 40.9 GAAP Adj Totals Total Transfer To (From) Reserve (4.6) 0.1 (6.5) 1.5 (7.4) (17.0)
217 Advancement Athena Employee Fee Waivers Healthcare Expense Workers Compensation Expense Subtotal: Benefits REVENUES 1 State Appropriations $ - $ - $ - $ - $ - $ - 2 State Appropriations - Capital Gross Undergraduate Tuition & Fees Undergraduate Financial Aid (35,000) Net Undergraduate Tuition & Fees (35,000) Gross Graduate Tuition & Fees Graduate Financial Aid Net Graduate Tuition & Fees Room & Board Grants & Contracts 1,500 72, Facilities & Admin Cost Recovery Endowment Distributions 8,025, Gift Contributions 333,300 5, Investment Income 1,438, Internal & External Sales 456, ,683-2,800,000-2,800, Total Revenues 10,219, ,103-2,800,000-2,800, Administrative Cost Distribution 2,577,358 94,813 8,657, ,657, Subvention Distribution Total Revenues & Revenue Allocations $ 12,796,803 $ 367,916 $ 8,657,495 $ 2,800,000 $ - $ 11,457, Funding Transfers $ 282,000 $ (59,962) $ - $ - $ - $ - EXPENSES 21 Total Salaries, Wages, & Other Payroll 5,926, , , , , Total Benefits 2,013,463 70,239 8,657,495 56,411,400 1,532,484 66,601, Supplies & Services 3,231,443 38, ,000 5, , Professional Services 870,974 10, , , , Occupancy & Maintenance 230,299 46, Capital Costs Cost Of Goods Sold 211,535 10, External Debt Service - Principal External Debt Service - Interest Internal Principal & Interest 141, Depreciation Other Operating Expense 11,676 3, Total Direct Expenses 12,637, ,435 8,657,495 57,129,400 1,755,018 67,541, Administrative Cost Allocations Capital Cost Allocation Subvention Allocation Total Expenses & Expense Allocations $ 12,637,524 $ 427,435 $ 8,657,495 $ 57,129,400 $ 1,755,018 $ 67,541, Results of Operations $ (122,721) $ 443 $ - $ (54,329,400) $ (1,755,018) $ (56,084,418) INVESTMENT TRANSFERS 39 Transfer To (From) Operating Reserve (141,980) Transfer To (From) Plant Fund Transfer To (From) Quasi Endowments Repair & Replacement Transfers Internal Bank Transfers Other Transfers Total Investment Transfers $ (141,980) $ - $ - $ - $ - $ - 46 Net Results $ 19,259 $ 443 $ - $ (54,329,400) $ (1,755,018) $ (56,084,418) 47 Transfer Net Results to Fund Balance 19, Adjusted Net Results $ - $ - $ - $ (54,329,400) $ (1,755,018) $ (56,084,418) Total Transfer To (From) Reserve (122,721)
218 Campus Care Central Accounting Central Financial Aid Debt Service Healthcare Collection Indirect Cost Collection REVENUES 1 State Appropriations $ - $ - $ - $ - $ - $ - 2 State Appropriations - Capital Gross Undergraduate Tuition & Fees ,596,253 4 Undergraduate Financial Aid - - (39,790,609) ,134,167 5 Net Undergraduate Tuition & Fees - - (39,790,609) ,730,420 6 Gross Graduate Tuition & Fees ,843 7 Graduate Financial Aid Net Graduate Tuition & Fees ,843 9 Room & Board Grants & Contracts , Facilities & Admin Cost Recovery Endowment Distributions ,800, Gift Contributions - 1,744, , Investment Income , Internal & External Sales - 1,517, , , Total Revenues - 3,262,495 (39,137,080) ,423, Administrative Cost Distribution 460,000 4,876,869 40,132,323 31,371,371 - (269,443,050) 18 Subvention Distribution Total Revenues & Revenue Allocations $ 460,000 $ 8,139,364 $ 995,243 $ 31,371,371 $ - $ (215,019,896) 20 Funding Transfers $ - $ 65,000 $ 995,243 $ - $ - $ (1,341,298) EXPENSES 21 Total Salaries, Wages, & Other Payroll Total Benefits - 1,614, (57,356,074) (5,751,525) 23 Supplies & Services - 1,508, Professional Services - 729, (1,427,229) 25 Occupancy & Maintenance - 1,192, Capital Costs Cost Of Goods Sold External Debt Service - Principal External Debt Service - Interest Internal Principal & Interest ,278, Depreciation Other Operating Expense 460,000 1,285, Total Direct Expenses 460,000 6,329,663-28,278,148 (57,356,074) (7,178,754) 34 Administrative Cost Allocations (191,706,070) 35 Capital Cost Allocation (13,632,453) 36 Subvention Allocation Total Expenses & Expense Allocations $ 460,000 $ 6,329,663 $ - $ 28,278,148 $ (57,356,074) $ (212,517,277) 38 Results of Operations $ - $ 1,744,701 $ - $ 3,093,223 $ 57,356,074 $ (1,161,321) INVESTMENT TRANSFERS 39 Transfer To (From) Operating Reserve - 1,744,701-1,243,223 3,026,674 (1,161,321) 40 Transfer To (From) Plant Fund ,850, Transfer To (From) Quasi Endowments Repair & Replacement Transfers Internal Bank Transfers Other Transfers Total Investment Transfers $ - $ 1,744,701 $ - $ 3,093,223 $ 3,026,674 $ (1,161,321) 46 Net Results $ - $ - $ - $ - $ 54,329,400 $ - 47 Transfer Net Results to Fund Balance Adjusted Net Results $ - $ - $ - $ - $ 54,329,400 $ Total Transfer To (From) Reserve - 1,744,701-1,243,223 3,026,674 (1,161,321)
219 Institutional Projects & Initiatives Program Support Staff Governance Utilities Workers Compensation Collection Subtotal: Central Operations REVENUES 1 State Appropriations $ - $ - $ - $ - $ - $ - 2 State Appropriations - Capital Gross Undergraduate Tuition & Fees ,596,253 4 Undergraduate Financial Aid ,343,558 5 Net Undergraduate Tuition & Fees ,939,811 6 Gross Graduate Tuition & Fees ,843 7 Graduate Financial Aid Net Graduate Tuition & Fees ,843 9 Room & Board Grants & Contracts , Facilities & Admin Cost Recovery Endowment Distributions ,800, Gift Contributions ,944, Investment Income , Internal & External Sales ,000-2,121, Total Revenues ,000-18,638, Administrative Cost Distribution - 319, ,552 10,946,000 - (181,194,209) 18 Subvention Distribution Total Revenues & Revenue Allocations $ - $ 319,726 $ 142,552 $ 11,036,000 $ - $ (162,555,640) 20 Funding Transfers $ (1,125,000) $ (114,000) $ - $ 81,000 $ - $ (1,439,055) EXPENSES 21 Total Salaries, Wages, & Other Payroll 43,464 32,825 89, , Total Benefits 20,413 15,114 27,753 - (3,022,456) (64,452,275) 23 Supplies & Services 80, ,286 21, ,940, Professional Services 981,123 35, , Occupancy & Maintenance - 20,000-10,955,000-12,167, Capital Costs Cost Of Goods Sold External Debt Service - Principal External Debt Service - Interest Internal Principal & Interest ,278, Depreciation Other Operating Expense , ,749, Total Direct Expenses 1,125, , ,552 10,955,000 (3,022,456) (19,833,196) 34 Administrative Cost Allocations (191,706,070) 35 Capital Cost Allocation (13,632,453) 36 Subvention Allocation Total Expenses & Expense Allocations $ 1,125,000 $ 433,726 $ 142,552 $ 10,955,000 $ (3,022,456) $ (225,171,719) 38 Results of Operations $ - $ - $ - $ - $ 3,022,456 $ 64,055,132 INVESTMENT TRANSFERS 39 Transfer To (From) Operating Reserve ,267,430 6,120, Transfer To (From) Plant Fund ,850, Transfer To (From) Quasi Endowments Repair & Replacement Transfers Internal Bank Transfers Other Transfers Total Investment Transfers $ - $ - $ - $ - $ 1,267,430 $ 7,970, Net Results $ - $ - $ - $ - $ 1,755,018 $ 56,084, Transfer Net Results to Fund Balance Adjusted Net Results $ - $ - $ - $ - $ 1,755,018 $ 56,084, Total Transfer To (From) Reserve ,267,430 6,120,707
220 Child Development Center Information Technology ISFS Kennedy Museum Library REVENUES 1 State Appropriations $ - $ - $ - $ - $ 164,765 2 State Appropriations - Capital Gross Undergraduate Tuition & Fees - 109,212 45, Undergraduate Financial Aid Net Undergraduate Tuition & Fees - 109,212 45, Gross Graduate Tuition & Fees Graduate Financial Aid Net Graduate Tuition & Fees Room & Board Grants & Contracts - - 2,500 55, , Facilities & Admin Cost Recovery Endowment Distributions , , Gift Contributions ,000 87, Investment Income Internal & External Sales 797, , , Total Revenues 797, ,696 47, , , Administrative Cost Distribution 381,623 26,748, , ,380 11,195, Subvention Distribution , Total Revenues & Revenue Allocations $ 1,179,018 $ 27,633,538 $ 560,630 $ 531,735 $ 12,519, Funding Transfers $ (29,832) $ (636,829) $ (4,500) $ (29,396) $ (83,086) EXPENSES 21 Total Salaries, Wages, & Other Payroll 745,653 14,013, , ,636 4,916, Total Benefits 344,230 5,012, , ,286 1,758, Supplies & Services 111,421 5,079,275 71,521 57,968 4,819, Professional Services 7,546 43,167-11,850 72, Occupancy & Maintenance - 2,886, , , Capital Costs , Cost Of Goods Sold - 150, External Debt Service - Principal External Debt Service - Interest Internal Principal & Interest Depreciation Other Operating Expense - - 2,000 10, Total Direct Expenses 1,208,850 27,184, , ,740 12,432, Administrative Cost Allocations Capital Cost Allocation Subvention Allocation Total Expenses & Expense Allocations $ 1,208,850 $ 27,184,803 $ 565,130 $ 597,740 $ 12,432, Results of Operations $ - $ 1,085,565 $ - $ (36,609) $ 170,856 INVESTMENT TRANSFERS 39 Transfer To (From) Operating Reserve Transfer To (From) Plant Fund - 5,500, , Transfer To (From) Quasi Endowments Repair & Replacement Transfers Internal Bank Transfers Other Transfers - (2,000) Total Investment Transfers $ - $ 5,498,000 $ - $ - $ 50, Net Results $ - $ (4,412,435) $ - $ (36,609) $ 120, Transfer Net Results to Fund Balance - (4,412,435) - (36,609) 120, Adjusted Net Results $ - $ - $ - $ - $ Total Transfer To (From) Reserve - (4,412,435) - (36,609) 120,856
221 Marching 110 Diversity & Inclusion Marketing President Subtotal: President REVENUES 1 State Appropriations $ - $ - $ - $ - $ - 2 State Appropriations - Capital Gross Undergraduate Tuition & Fees 4, Undergraduate Financial Aid (5,000) (135,787) - (5,000) (140,787) 5 Net Undergraduate Tuition & Fees (500) (135,787) - (5,000) (140,787) 6 Gross Graduate Tuition & Fees - 28, ,506 7 Graduate Financial Aid Net Graduate Tuition & Fees - 28, ,506 9 Room & Board Grants & Contracts , , Facilities & Admin Cost Recovery Endowment Distributions 3, ,263-21, , Gift Contributions 10,000 10,782 3,000-13, Investment Income Internal & External Sales 23,000-83,000-83, Total Revenues 36, ,764 96,552 17, , Administrative Cost Distribution 192,044 2,203,628 2,014,182 4,478,747 8,696, Subvention Distribution Total Revenues & Revenue Allocations $ 228,255 $ 2,337,392 $ 2,110,734 $ 4,496,257 $ 8,944, Funding Transfers $ - $ (27,178) $ (33,296) $ (297,271) $ (357,745) EXPENSES 21 Total Salaries, Wages, & Other Payroll 52,345 1,372,540 1,449,255 3,148,141 5,969, Total Benefits 21, , , ,249 1,937, Supplies & Services 147, ,048 99, ,048 1,068, Professional Services 4,500 8,111 72, , , Occupancy & Maintenance 10,000 8,521 2,550 38,313 49, Capital Costs - 4, , Cost Of Goods Sold External Debt Service - Principal External Debt Service - Interest Internal Principal & Interest Depreciation Other Operating Expense Total Direct Expenses 235,101 2,364,570 2,144,030 4,793,528 9,302, Administrative Cost Allocations Capital Cost Allocation Subvention Allocation Total Expenses & Expense Allocations $ 235,101 $ 2,364,570 $ 2,144,030 $ 4,793,528 $ 9,302, Results of Operations $ (6,846) $ - $ - $ - $ - INVESTMENT TRANSFERS 39 Transfer To (From) Operating Reserve Transfer To (From) Plant Fund Transfer To (From) Quasi Endowments Repair & Replacement Transfers Internal Bank Transfers Other Transfers Total Investment Transfers $ - $ - $ - $ - $ - 46 Net Results $ (6,846) $ - $ - $ - $ - 47 Transfer Net Results to Fund Balance (6,846) Adjusted Net Results $ - $ - $ - $ - $ Total Transfer To (From) Reserve (6,846)
222 CCCE Instructional Innovation Enrollment Management Provost Subtotal: Provost REVENUES 1 State Appropriations $ - $ - $ - $ - $ - 2 State Appropriations - Capital Gross Undergraduate Tuition & Fees , ,331 4 Undergraduate Financial Aid - - (1,721,292) - (1,721,292) 5 Net Undergraduate Tuition & Fees - - (1,201,961) - (1,201,961) 6 Gross Graduate Tuition & Fees Graduate Financial Aid Net Graduate Tuition & Fees Room & Board Grants & Contracts ,241 15, , Facilities & Admin Cost Recovery Endowment Distributions - 1,746 1,716, ,479 2,397, Gift Contributions ,168 60, , Investment Income Internal & External Sales - - (75,208) 2,798,382 2,723, Total Revenues - 1, ,572 3,553,414 4,232, Administrative Cost Distribution - 4,304,707 11,191,265 4,177,898 19,673, Subvention Distribution Total Revenues & Revenue Allocations $ - $ 4,306,453 $ 11,868,837 $ 7,731,312 $ 23,906, Funding Transfers $ (282,223) $ (234,483) $ (743,369) $ 375,314 $ (884,761) EXPENSES 21 Total Salaries, Wages, & Other Payroll 165,650 2,986,604 6,085,285 3,528,378 12,765, Total Benefits 58,857 1,021,123 2,533,028 1,115,766 4,728, Supplies & Services 57, ,113 3,084,946 1,854,130 5,453, Professional Services - 76, , ,856 1,435, Occupancy & Maintenance ,130 17,550 85, Capital Costs ,000-23, Cost Of Goods Sold , , External Debt Service - Principal External Debt Service - Interest Internal Principal & Interest ,818 33, Depreciation Other Operating Expense Total Direct Expenses 282,223 4,540,936 12,612,206 7,355,998 24,791, Administrative Cost Allocations Capital Cost Allocation Subvention Allocation Total Expenses & Expense Allocations $ 282,223 $ 4,540,936 $ 12,612,206 $ 7,355,998 $ 24,791, Results of Operations $ - $ - $ - $ - $ - INVESTMENT TRANSFERS 39 Transfer To (From) Operating Reserve Transfer To (From) Plant Fund Transfer To (From) Quasi Endowments Repair & Replacement Transfers Internal Bank Transfers Other Transfers Total Investment Transfers $ - $ - $ - $ - $ - 46 Net Results $ - $ - $ - $ - $ - 47 Transfer Net Results to Fund Balance Adjusted Net Results $ - $ - $ - $ - $ Total Transfer To (From) Reserve
223 Graduate College VP Of Research Subtotal: Research REVENUES 1 State Appropriations $ - $ - $ - 2 State Appropriations - Capital Gross Undergraduate Tuition & Fees 248, ,407 4 Undergraduate Financial Aid - (10,000) (10,000) 5 Net Undergraduate Tuition & Fees 248,407 (10,000) 238,407 6 Gross Graduate Tuition & Fees 230, ,727 7 Graduate Financial Aid (514,883) (10,000) (524,883) 8 Net Graduate Tuition & Fees (284,156) (10,000) (294,156) 9 Room & Board Grants & Contracts 750 1,971,000 1,971, Facilities & Admin Cost Recovery - 1,050,000 1,050, Endowment Distributions - 1,657,878 1,657, Gift Contributions Investment Income Internal & External Sales - 839, , Total Revenues (34,999) 5,497,932 5,462, Administrative Cost Distribution 1,641,585 4,024,154 5,665, Subvention Distribution 61,518-61, Total Revenues & Revenue Allocations $ 1,668,104 $ 9,522,086 $ 11,190, Funding Transfers $ 136,973 $ 1,086,233 $ 1,223,206 EXPENSES 21 Total Salaries, Wages, & Other Payroll 1,101,342 4,511,494 5,612, Total Benefits 361,627 1,523,922 1,885, Supplies & Services 62,282 1,318,587 1,380, Professional Services , , Occupancy & Maintenance ,925 13, Capital Costs 5,000 16,000 21, Cost Of Goods Sold External Debt Service - Principal External Debt Service - Interest Internal Principal & Interest - 78,000 78, Depreciation Other Operating Expense - 416, , Total Direct Expenses 1,531,131 8,617,514 10,148, Administrative Cost Allocations Capital Cost Allocation Subvention Allocation Total Expenses & Expense Allocations $ 1,531,131 $ 8,617,514 $ 10,148, Results of Operations $ - $ (181,661) $ (181,661) INVESTMENT TRANSFERS 39 Transfer To (From) Operating Reserve Transfer To (From) Plant Fund Transfer To (From) Quasi Endowments Repair & Replacement Transfers Internal Bank Transfers Other Transfers - (180,000) (180,000) 45 Total Investment Transfers $ - $ (180,000) $ (180,000) 46 Net Results $ - $ (1,661) $ (1,661) 47 Transfer Net Results to Fund Balance - (1,661) (1,661) 48 Adjusted Net Results $ - $ - $ Total Transfer To (From) Reserve - (1,661) (1,661)
224 Bobcat Depot Campus Recreation Career Fee VP Of Student Affairs Subtotal: Student Affairs REVENUES 1 State Appropriations $ - $ - $ - $ - $ - 2 State Appropriations - Capital Gross Undergraduate Tuition & Fees - 6, , , ,926 4 Undergraduate Financial Aid (30,000) (30,000) 5 Net Undergraduate Tuition & Fees - 6, , , ,926 6 Gross Graduate Tuition & Fees Graduate Financial Aid Net Graduate Tuition & Fees Room & Board Grants & Contracts Facilities & Admin Cost Recovery Endowment Distributions Gift Contributions Investment Income Internal & External Sales 5,083,525 1,280,118-1,456,050 7,819, Total Revenues 5,083,525 1,286, ,526 1,606,050 8,620, Administrative Cost Distribution - 5,004,595-10,835,659 15,840, Subvention Distribution Total Revenues & Revenue Allocations $ 5,083,525 $ 6,291,201 $ 644,526 $ 12,441,709 $ 24,460, Funding Transfers $ 48,341 $ 7,704 $ 319,000 $ (1,153,594) $ (778,549) EXPENSES 21 Total Salaries, Wages, & Other Payroll 250,883 2,418, ,470 6,358,822 9,304, Total Benefits 70, ,242 50,056 2,070,311 2,612, Supplies & Services 119, ,697-1,145,790 1,689, Professional Services 126, , ,444 1,724, Occupancy & Maintenance 1,500 37, , , Capital Costs ,200 5, Cost Of Goods Sold 4,433,979 66,336-4,500 4,504, External Debt Service - Principal External Debt Service - Interest Internal Principal & Interest - 1,946,810-2,937,000 4,883, Depreciation Other Operating Expense - 19,800-24,516 44, Total Direct Expenses 5,003,366 6,293, ,526 13,595,303 25,217, Administrative Cost Allocations Capital Cost Allocation Subvention Allocation Total Expenses & Expense Allocations $ 5,003,366 $ 6,293,497 $ 325,526 $ 13,595,303 $ 25,217, Results of Operations $ 31,818 $ (10,000) $ - $ - $ 21,818 INVESTMENT TRANSFERS 39 Transfer To (From) Operating Reserve - (10,000) - - (10,000) 40 Transfer To (From) Plant Fund Transfer To (From) Quasi Endowments Repair & Replacement Transfers Internal Bank Transfers Other Transfers Total Investment Transfers $ - $ (10,000) $ - $ - $ (10,000) 46 Net Results $ 31,818 $ - $ - $ - $ 31, Transfer Net Results to Fund Balance 31, , Adjusted Net Results $ - $ - $ - $ - $ Total Transfer To (From) Reserve 31,818 (10,000) ,818
225 Airport Custodial Design & Construction Environmental Health & Safety Facilities Management & Safety REVENUES 1 State Appropriations $ - $ - $ - $ - $ - 2 State Appropriations - Capital Gross Undergraduate Tuition & Fees Undergraduate Financial Aid Net Undergraduate Tuition & Fees Gross Graduate Tuition & Fees Graduate Financial Aid Net Graduate Tuition & Fees Room & Board Grants & Contracts Facilities & Admin Cost Recovery Endowment Distributions Gift Contributions Investment Income Internal & External Sales 1,423, ,448 3,700, , Total Revenues 1,423, ,448 3,700, , Administrative Cost Distribution 841,303 15,546,922-1,139,534 3,823, Subvention Distribution Total Revenues & Revenue Allocations $ 2,265,023 $ 16,070,370 $ 3,700,000 $ 1,139,534 $ 4,014, Funding Transfers $ 21,498 $ - $ 921,860 $ (29,607) $ - EXPENSES 21 Total Salaries, Wages, & Other Payroll 815,128 10,011,884 1,757, ,473 1,624, Total Benefits 299,991 4,906, , , , Supplies & Services 135,510 1,053, , , , Professional Services 16,050-70,000 15,000 77, Occupancy & Maintenance 183,815 5,346 22,000 3, , Capital Costs - 93, Cost Of Goods Sold 388, External Debt Service - Principal External Debt Service - Interest Internal Principal & Interest 214, Depreciation Other Operating Expense 100,650-33,484-5, Total Direct Expenses 2,154,559 16,070,370 2,778,140 1,169,141 4,014, Administrative Cost Allocations Capital Cost Allocation Subvention Allocation Total Expenses & Expense Allocations $ 2,154,559 $ 16,070,370 $ 2,778,140 $ 1,169,141 $ 4,014, Results of Operations $ 88,966 $ - $ - $ - $ - INVESTMENT TRANSFERS 39 Transfer To (From) Operating Reserve Transfer To (From) Plant Fund Transfer To (From) Quasi Endowments Repair & Replacement Transfers Internal Bank Transfers Other Transfers Total Investment Transfers $ - $ - $ - $ - $ - 46 Net Results $ 88,966 $ - $ - $ - $ - 47 Transfer Net Results to Fund Balance 88, Adjusted Net Results $ - $ - $ - $ - $ Total Transfer To (From) Reserve 88,
226 Finance Grounds Heating Plant Human Resources Logistics REVENUES 1 State Appropriations $ - $ - $ - $ - $ - 2 State Appropriations - Capital Gross Undergraduate Tuition & Fees Undergraduate Financial Aid Net Undergraduate Tuition & Fees Gross Graduate Tuition & Fees Graduate Financial Aid Net Graduate Tuition & Fees Room & Board Grants & Contracts Facilities & Admin Cost Recovery Endowment Distributions Gift Contributions Investment Income Internal & External Sales (5,000) 54,500-25,000 1,099, Total Revenues (5,000) 54,500-25,000 1,099, Administrative Cost Distribution 6,290,044 3,096,806 1,887,800 3,803, , Subvention Distribution Total Revenues & Revenue Allocations $ 6,285,044 $ 3,151,306 $ 1,887,800 $ 3,828,517 $ 1,800, Funding Transfers $ (1,063,930) $ (100,000) $ 120,000 $ - $ (319,625) EXPENSES 21 Total Salaries, Wages, & Other Payroll 4,605,103 1,810,737 1,055,735 2,526,407 1,048, Total Benefits 1,767, , , , , Supplies & Services 551, , , , , Professional Services 304, , , Occupancy & Maintenance 9, ,528 2,000 3,000 27, Capital Costs 107, , Cost Of Goods Sold , External Debt Service - Principal External Debt Service - Interest Internal Principal & Interest Depreciation Other Operating Expense 2, , Total Direct Expenses 7,348,974 3,251,306 1,767,800 3,828,517 2,120, Administrative Cost Allocations Capital Cost Allocation Subvention Allocation Total Expenses & Expense Allocations $ 7,348,974 $ 3,251,306 $ 1,767,800 $ 3,828,517 $ 2,120, Results of Operations $ - $ - $ - $ - $ - INVESTMENT TRANSFERS 39 Transfer To (From) Operating Reserve Transfer To (From) Plant Fund Transfer To (From) Quasi Endowments Repair & Replacement Transfers Internal Bank Transfers Other Transfers Total Investment Transfers $ - $ - $ - $ - $ - 46 Net Results $ - $ - $ - $ - $ - 47 Transfer Net Results to Fund Balance Adjusted Net Results $ - $ - $ - $ - $ Total Transfer To (From) Reserve
227 Maintenance OUPD Real Estate VPFA Office Subtotal: Finance & Administration REVENUES 1 State Appropriations $ - $ - $ - $ - $ - 2 State Appropriations - Capital Gross Undergraduate Tuition & Fees Undergraduate Financial Aid Net Undergraduate Tuition & Fees Gross Graduate Tuition & Fees Graduate Financial Aid Net Graduate Tuition & Fees Room & Board Grants & Contracts Facilities & Admin Cost Recovery Endowment Distributions Gift Contributions Investment Income Internal & External Sales 1,460,686-1,224, ,973 8,430, Total Revenues 1,460,686-1,224, ,973 8,430, Administrative Cost Distribution 9,291,634 4,374,283 83,628 2,571,298 52,610, Subvention Distribution Total Revenues & Revenue Allocations $ 10,752,320 $ 4,374,283 $ 1,308,128 $ 2,728,271 $ 61,040, Funding Transfers $ (186,673) $ - $ (64,000) $ (413,242) $ (1,135,217) EXPENSES 21 Total Salaries, Wages, & Other Payroll 5,795,706 2,785, ,408 2,244,928 36,136, Total Benefits 2,337,082 1,106,717 69, ,150 14,857, Supplies & Services 2,604, , ,192 67,335 7,359, Professional Services 1, ,911 54, , Occupancy & Maintenance 33,681 62, ,450 2,100 1,433, Capital Costs - 36, , , Cost Of Goods Sold 165, , External Debt Service - Principal External Debt Service - Interest Internal Principal & Interest Depreciation Other Operating Expense 1, , Total Direct Expenses 10,938,993 4,374,283 1,368,628 3,141,513 62,172, Administrative Cost Allocations Capital Cost Allocation Subvention Allocation Total Expenses & Expense Allocations $ 10,938,993 $ 4,374,283 $ 1,368,628 $ 3,141,513 $ 62,172, Results of Operations $ - $ - $ 3,500 $ - $ 3,500 INVESTMENT TRANSFERS 39 Transfer To (From) Operating Reserve Transfer To (From) Plant Fund Transfer To (From) Quasi Endowments Repair & Replacement Transfers Internal Bank Transfers Other Transfers Total Investment Transfers $ - $ - $ - $ - $ - 46 Net Results $ - $ - $ 3,500 $ - $ 3, Transfer Net Results to Fund Balance - - 3,500-3, Adjusted Net Results $ - $ - $ - $ - $ Total Transfer To (From) Reserve - - 3,500-3,500
228 Wellworks WOUB Capital Improvement Transfer Adjustments Total: Central & Admin Operations REVENUES 1 State Appropriations $ - $ - $ - $ - $ 164,765 2 State Appropriations - Capital Gross Undergraduate Tuition & Fees ,353,629 4 Undergraduate Financial Aid - (1,075) - - 6,400,404 5 Net Undergraduate Tuition & Fees - (1,075) ,754,033 6 Gross Graduate Tuition & Fees ,164 7 Graduate Financial Aid (524,883) 8 Net Graduate Tuition & Fees ,281 9 Room & Board Grants & Contracts 2,655 2,133, ,842, Facilities & Admin Cost Recovery ,000 1,232, Endowment Distributions - 98, ,695, Gift Contributions - 650, ,296, Investment Income ,563, Internal & External Sales 290, , ,178, Total Revenues 293,575 3,152, ,000 66,843, Administrative Cost Distribution 299,084 2,267, (24,566,660) 18 Subvention Distribution , Total Revenues & Revenue Allocations $ 592,659 $ 5,420,412 $ - $ 182,000 $ 42,722, Funding Transfers $ (174,215) $ (19,000) $ - $ (10,718,856) $ (14,824,299) EXPENSES 21 Total Salaries, Wages, & Other Payroll 541,805 2,262,119-2,009, ,506, Total Benefits 138, , ,929 39,559, Supplies & Services 56,740 2,027,124 2,327,809 4,019,571 41,451, Professional Services - 116,548-4,019,571 10,754, Occupancy & Maintenance 16,857 80, ,811, Capital Costs - 411, ,894, Cost Of Goods Sold ,294, External Debt Service - Principal External Debt Service - Interest Internal Principal & Interest ,630, Depreciation Other Operating Expense 13,350 27, ,438, Total Direct Expenses 766,874 5,744,412 2,327,809 10,718, ,342, Administrative Cost Allocations (191,706,070) 35 Capital Cost Allocation (13,632,453) 36 Subvention Allocation Total Expenses & Expense Allocations $ 766,874 $ 5,744,412 $ 2,327,809 $ 10,718,856 $ 51,003, Results of Operations $ - $ (305,000) $ (2,327,809) $ 182,000 $ 6,543,216 INVESTMENT TRANSFERS 39 Transfer To (From) Operating Reserve - (305,000) - - 5,663, Transfer To (From) Plant Fund - - (2,327,809) - 5,072, Transfer To (From) Quasi Endowments Repair & Replacement Transfers Internal Bank Transfers Other Transfers , Total Investment Transfers $ - $ (305,000) $ (2,327,809) $ 182,000 $ 10,735, Net Results $ - $ - $ - $ - $ (4,192,709) 47 Transfer Net Results to Fund Balance (4,192,709) 48 Adjusted Net Results $ - $ - $ - $ - $ Total Transfer To (From) Reserve - (305,000) - - 1,471,017
229
230 14.5 Reserves & Subvention Athens Colleges and Schools Regional Campuses Auxiliaries Central & Admin Operations Reserves & Subvention Operating Activity Subtotal Non- Operating Activity Financial Statement Adj & Component Units REVENUES 1 State Appropriations $ $ 22.4 $ - $ 0.2 $ 2.9 $ $ - $ - $ State Appropriations - Capital Gross Undergraduate Tuition & Fees Undergraduate Financial Aid (48.6) (5.2) (13.9) 6.4 (1.7) (63.0) - - (63.0) 5 Net Undergraduate Tuition & Fees (13.9) Gross Graduate Tuition & Fees Graduate Financial Aid (28.1) - - (0.5) - (28.7) - - (28.7) 8 Net Graduate Tuition & Fees Room & Board Grants & Contracts Facilities & Admin Cost Recovery Endowment Distributions (29.8) Gift Contributions Investment Income Internal & External Sales Total Revenues Administrative Cost Distribution (24.6) Subvention Distribution (62.3) Total Revenues & Revenue Allocations $ $ 69.9 $ $ 42.7 $ (50.1) $ $ 54.8 $ 7.1 $ Funding Transfers $ (6.4) $ (0.5) $ 3.3 $ (14.8) $ 18.4 $ - $ - $ - $ - EXPENSES 21 Total Salaries, Wages, & Other Payroll Total Benefits Supplies & Services Professional Services Occupancy & Maintenance Capital Costs (107.2) - 27 Cost Of Goods Sold External Debt Service - Principal (16.1) - 29 External Debt Service - Interest (1.5) Internal Principal & Interest (54.1) Depreciation Other Operating Expense (2.1) Total Direct Expenses (68.3) Administrative Cost Allocations (191.7) Capital Cost Allocation (13.6) Subvention Allocation (62.0) Total Expenses & Expense Allocations $ $ 70.3 $ $ 51.0 $ (62.0) $ $ 95.9 $ (68.3) $ Results of Operations $ (3.8) $ 0.1 $ 10.2 $ 6.5 $ (6.4) $ 6.6 $ (41.1) $ 75.4 $ 40.9 INVESTMENT TRANSFERS Transfer To (From) Operating Reserve (10.8) - (0.1) 5.7 (7.4) (12.7) Transfer To (From) Plant Fund (22.6) Transfer To (From) Quasi Endowments (1.0) Repair & Replacement Transfers Internal Bank Transfers Other Transfers Total Investment Transfers $ (10.0) $ - $ 16.6 $ 10.7 $ (6.4) $ 10.9 $ (10.9) $ - $ - 46 Net Results $ 6.2 $ 0.1 $ (6.4) $ (4.2) $ - $ (4.3) $ (30.2) $ 75.4 $ Transfer Net Results to Fund Balance (6.4) (4.2) - (4.3) Adjusted Net Results $ - $ - $ - $ - $ - $ - $ (34.5) $ 75.4 $ 40.9 GAAP Adj Totals Total Transfer To (From) Reserve (4.6) 0.1 (6.5) 1.5 (7.4) (17.0)
231 Strategic Opportunity Reserve Institutional Reserve & Subvention Provost Reserve Total: Reserves & Subvention REVENUES 1 State Appropriations $ 2,876,641 $ - $ - $ 2,876,641 2 State Appropriations - Capital Gross Undergraduate Tuition & Fees 2,846, ,846,464 4 Undergraduate Financial Aid (1,726,677) - - (1,726,677) 5 Net Undergraduate Tuition & Fees 1,119, ,119,787 6 Gross Graduate Tuition & Fees Graduate Financial Aid Net Graduate Tuition & Fees Room & Board Grants & Contracts Facilities & Admin Cost Recovery Endowment Distributions Gift Contributions Investment Income 7,500, ,500, Internal & External Sales Total Revenues 11,496, ,496, Administrative Cost Distribution - 760, , Subvention Distribution - (64,628,071) 2,278,699 (62,349,372) 19 Total Revenues & Revenue Allocations $ 11,496,428 $ (63,867,838) $ 2,278,699 $ (50,092,711) 20 Funding Transfers $ 17,945,673 $ (1,857,191) $ 2,278,699 $ 18,367,181 EXPENSES 21 Total Salaries, Wages, & Other Payroll Total Benefits Supplies & Services Professional Services Occupancy & Maintenance Capital Costs Cost Of Goods Sold External Debt Service - Principal External Debt Service - Interest Internal Principal & Interest Depreciation Other Operating Expense Total Direct Expenses Administrative Cost Allocations Capital Cost Allocation Subvention Allocation - (62,010,647) - (62,010,647) 37 Total Expenses & Expense Allocations $ - $ (62,010,647) $ - $ (62,010,647) 38 Results of Operations $ (6,449,245) $ - $ - $ (6,449,245) INVESTMENT TRANSFERS 39 Transfer To (From) Operating Reserve (7,449,245) - - (7,449,245) 40 Transfer To (From) Plant Fund Transfer To (From) Quasi Endowments 1,000, ,000, Repair & Replacement Transfers Internal Bank Transfers Other Transfers Total Investment Transfers $ (6,449,245) $ - $ - $ (6,449,245) 46 Net Results $ - $ - $ - $ - 47 Transfer Net Results to Fund Balance Adjusted Net Results $ - $ - $ - $ Total Transfer To (From) Reserve (7,449,245) - - (7,449,245)
232
233 15 Non-Operating, Financial Statement Adjustments, & Component Unit Summaries 15.1 Non-Operating Activity Athens Colleges and Schools Regional Campuses Auxiliaries Central & Admin Operations Reserves & Subvention Operating Activity Subtotal Non- Operating Activity Financial Statement Adj & Component Units REVENUES 1 State Appropriations $ $ 22.4 $ - $ 0.2 $ 2.9 $ $ - $ - $ State Appropriations - Capital Gross Undergraduate Tuition & Fees Undergraduate Financial Aid (48.6) (5.2) (13.9) 6.4 (1.7) (63.0) - - (63.0) 5 Net Undergraduate Tuition & Fees (13.9) Gross Graduate Tuition & Fees Graduate Financial Aid (28.1) - - (0.5) - (28.7) - - (28.7) 8 Net Graduate Tuition & Fees Room & Board Grants & Contracts Facilities & Admin Cost Recovery Endowment Distributions (29.8) Gift Contributions Investment Income Internal & External Sales Total Revenues Administrative Cost Distribution (24.6) Subvention Distribution (62.3) Total Revenues & Revenue Allocations $ $ 69.9 $ $ 42.7 $ (50.1) $ $ 54.8 $ 7.1 $ Funding Transfers $ (6.4) $ (0.5) $ 3.3 $ (14.8) $ 18.4 $ - $ - $ - $ - EXPENSES 21 Total Salaries, Wages, & Other Payroll Total Benefits Supplies & Services Professional Services Occupancy & Maintenance Capital Costs (107.2) - 27 Cost Of Goods Sold External Debt Service - Principal (16.1) - 29 External Debt Service - Interest (1.5) Internal Principal & Interest (54.1) Depreciation Other Operating Expense (2.1) Total Direct Expenses (68.3) Administrative Cost Allocations (191.7) Capital Cost Allocation (13.6) Subvention Allocation (62.0) Total Expenses & Expense Allocations $ $ 70.3 $ $ 51.0 $ (62.0) $ $ 95.9 $ (68.3) $ Results of Operations $ (3.8) $ 0.1 $ 10.2 $ 6.5 $ (6.4) $ 6.6 $ (41.1) $ 75.4 $ 40.9 INVESTMENT TRANSFERS 39 Transfer To (From) Operating Reserve (10.8) - (0.1) 5.7 (7.4) (12.7) Transfer To (From) Plant Fund (22.6) Transfer To (From) Quasi Endowments (1.0) Repair & Replacement Transfers Internal Bank Transfers Other Transfers Total Investment Transfers $ (10.0) $ - $ 16.6 $ 10.7 $ (6.4) $ 10.9 $ (10.9) $ - $ - $ - $ - $ - $ - $ - $ - $ - $ - $ - 46 Net Results $ 6.2 $ 0.1 $ (6.4) $ (4.2) $ - $ (4.3) $ (30.2) $ 75.4 $ Transfer Net Results to Fund Balance (6.4) (4.2) - (4.3) Adjusted Net Results $ - $ - $ - $ - $ - $ - $ (34.5) $ 75.4 $ 40.9 GAAP Adj Totals Total Transfer To (From) Reserve (4.6) 0.1 (6.5) 1.5 (7.4) (17.0)
234 Endowment Century Bond Internal Bank Capital Total: Non- Operating Activity REVENUES 1 State Appropriations $ - $ - $ - $ - $ - 2 State Appropriations - Capital ,390,092 23,390,092 3 Gross Undergraduate Tuition & Fees Undergraduate Financial Aid Net Undergraduate Tuition & Fees Gross Graduate Tuition & Fees Graduate Financial Aid Net Graduate Tuition & Fees Room & Board Grants & Contracts ,159,731 3,159, Facilities & Admin Cost Recovery Endowment Distributions (29,781,249) (29,781,249) 13 Gift Contributions 10,000, ,000, Investment Income 33,111,955 11,300,000 3,400,000-47,811, Internal & External Sales , , Total Revenues 13,331,186 11,300,000 3,650,000 26,549,823 54,831, Administrative Cost Distribution Subvention Distribution Total Revenues & Revenue Allocations $ 13,331,186 $ 11,300,000 $ 3,650,000 $ 26,549,823 $ 54,831, Funding Transfers $ - $ - $ - $ - $ - EXPENSES 21 Total Salaries, Wages, & Other Payroll Total Benefits Supplies & Services ,500,000 2,500, Professional Services Occupancy & Maintenance Capital Costs ,716, ,716, Cost Of Goods Sold External Debt Service - Principal ,100,000-16,100, External Debt Service - Interest - 14,000,000 15,500,000-29,500, Internal Principal & Interest - (12,800,000) (41,300,000) - (54,100,000) 31 Depreciation Other Operating Expense , , Total Direct Expenses - 1,200,000 (9,475,000) 104,216,894 95,941, Administrative Cost Allocations Capital Cost Allocation Subvention Allocation Total Expenses & Expense Allocations $ - $ 1,200,000 $ (9,475,000) $ 104,216,894 $ 95,941, Results of Operations $ 13,331,186 $ 10,100,000 $ 13,125,000 $ (77,667,071) $ (41,110,885) INVESTMENT TRANSFERS 39 Transfer To (From) Operating Reserve ,672,132-12,672, Transfer To (From) Plant Fund - 10,000,000 90,000,000 (122,588,999) (22,588,999) 41 Transfer To (From) Quasi Endowments (1,000,000) (1,000,000) 42 Repair & Replacement Transfers Internal Bank Transfers Other Transfers Total Investment Transfers $ (1,000,000) $ 10,000,000 $ 102,672,132 $ (122,588,999) $ (10,916,867) 46 Net Results $ 14,331,186 $ 100,000 $ (89,547,132) $ 44,921,928 $ (30,194,018) 47 Transfer Net Results to Fund Balance - - 4,295,341-4,295, Adjusted Net Results $ 14,331,186 $ 100,000 $ (93,842,473) $ 44,921,928 $ (34,489,359) Total Transfer To (From) Reserve ,967,477-16,967,477
235 15.2 Financial Statement Adjustments & Component Units Athens Colleges and Schools Regional Campuses Auxiliaries Central & Admin Operations Reserves & Subvention Operating Activity Subtotal Non- Operating Activity Financial Statement Adj & Component Units REVENUES 1 State Appropriations $ $ 22.4 $ - $ 0.2 $ 2.9 $ $ - $ - $ State Appropriations - Capital Gross Undergraduate Tuition & Fees Undergraduate Financial Aid (48.6) (5.2) (13.9) 6.4 (1.7) (63.0) - - (63.0) 5 Net Undergraduate Tuition & Fees (13.9) Gross Graduate Tuition & Fees Graduate Financial Aid (28.1) - - (0.5) - (28.7) - - (28.7) 8 Net Graduate Tuition & Fees Room & Board Grants & Contracts Facilities & Admin Cost Recovery Endowment Distributions (29.8) Gift Contributions Investment Income Internal & External Sales Total Revenues Administrative Cost Distribution (24.6) Subvention Distribution (62.3) Total Revenues & Revenue Allocations $ $ 69.9 $ $ 42.7 $ (50.1) $ $ 54.8 $ 7.1 $ Funding Transfers $ (6.4) $ (0.5) $ 3.3 $ (14.8) $ 18.4 $ - $ - $ - $ - EXPENSES 21 Total Salaries, Wages, & Other Payroll Total Benefits Supplies & Services Professional Services Occupancy & Maintenance Capital Costs (107.2) - 27 Cost Of Goods Sold External Debt Service - Principal (16.1) - 29 External Debt Service - Interest (1.5) Internal Principal & Interest (54.1) Depreciation Other Operating Expense (2.1) Total Direct Expenses (68.3) Administrative Cost Allocations (191.7) Capital Cost Allocation (13.6) Subvention Allocation (62.0) Total Expenses & Expense Allocations $ $ 70.3 $ $ 51.0 $ (62.0) $ $ 95.9 $ (68.3) $ Results of Operations $ (3.8) $ 0.1 $ 10.2 $ 6.5 $ (6.4) $ 6.6 $ (41.1) $ 75.4 $ 40.9 INVESTMENT TRANSFERS 39 Transfer To (From) Operating Reserve (10.8) - (0.1) 5.7 (7.4) (12.7) Transfer To (From) Plant Fund (22.6) Transfer To (From) Quasi Endowments (1.0) Repair & Replacement Transfers Internal Bank Transfers Other Transfers Total Investment Transfers $ (10.0) $ - $ 16.6 $ 10.7 $ (6.4) $ 10.9 $ (10.9) $ - $ - 46 Net Results $ 6.2 $ 0.1 $ (6.4) $ (4.2) $ - $ (4.3) $ (30.2) $ 75.4 $ Transfer Net Results to Fund Balance (6.4) (4.2) - (4.3) Adjusted Net Results $ - $ - $ - $ - $ - $ - $ (34.5) $ 75.4 $ 40.9 GAAP Adj Totals Total Transfer To (From) Reserve (4.6) 0.1 (6.5) 1.5 (7.4) (17.0)
236 Component Units, also known as affiliated entities, are one or more corporations or other appropriate business entities that are operated as entities separate from Ohio University or the Ohio University Foundation, to pursue purposes consistent with the overall mission of the University and the Foundation. These organizations are incorporated into the All Funds presentation of the University budget in Section 2 and presented in Section 18. Ohio University components include: Tech GROWTH Ohio Fund was established in August of 2008, is a not-for-profit organization incorporated in the state of Ohio for the exclusive purpose of charitable, educational, and scientific endeavors in areas involving the advancement of technology, increasing technology-based and/or other entrepreneurial commercialization ventures throughout Southeast Ohio that offer economic development prospects for the region. While the MRC is not currently a component unit consolidated within the Audited Financial Statements of Ohio University ( AFS ), the location of the MRC on the Ohio University-Zanesville campus and the financial structure between Ohio University and the MRC create an essential relationship between the two entities. The financial structure between Ohio University and the MRC includes a $750K non-recourse loan, a $1.5M loan guarantee, and a guarantee of new market tax credits ( NMTC ) up to $5.29M. The loan and NMTC guarantees are listed in the Notes to Financial Statement section of our AFS. As the University evaluates the opportunity to leverage the facility for strategic initiatives, we have included a placeholder within the SOR to fund potential investments. Ohio University Foundation components include: Inn-Ohio of Athens, Inc. owns and operates a 139-room hotel and restaurant facility in Athens, Ohio known as the Ohio University Inn. The Sugar Bush Foundation was formed in August 2005, as an Ohio not-for-profit corporation and is a supporting organization as defined in Code Section 509(a)(3). The sole purpose of the organization is to commit all charitable contributions to the Ohio University Foundation. Russ LLCs consist of three limited liability companies that were created in 2009 to receive property distributions from the Dolores H. Russ Trust for the benefit of the Russ College of Engineering. Collectively referred to as the Russ LLCs, the three limited liability companies are Fritz J. and Dolores H. Russ Holdings LLC, Russ North Valley Road LLC, and the Russ Research Center LLC. A fourth LLC, known as Russ Center North, LLC, was created during FY16 for the purpose of purchasing and holding property adjacent to the Russ Research Center.
237 Component Units Financial Statement Adjustments Total: Financial Statement Adj & Component Units REVENUES 1 State Appropriations $ - $ - $ - 2 State Appropriations - Capital Gross Undergraduate Tuition & Fees Undergraduate Financial Aid Net Undergraduate Tuition & Fees Gross Graduate Tuition & Fees Graduate Financial Aid Net Graduate Tuition & Fees Room & Board Grants & Contracts Facilities & Admin Cost Recovery Endowment Distributions Gift Contributions Investment Income 340, , Internal & External Sales 9,517,640 (2,728,070) 6,789, Total Revenues 9,858,010 (2,728,070) 7,129, Administrative Cost Distribution Subvention Distribution Total Revenues & Revenue Allocations $ 9,858,010 $ (2,728,070) $ 7,129, Funding Transfers $ - $ - $ - EXPENSES 21 Total Salaries, Wages, & Other Payroll Total Benefits Supplies & Services 6,192,970 (591,570) 5,601, Professional Services 38,800-38, Occupancy & Maintenance 890, , Capital Costs - (107,212,619) (107,212,619) 27 Cost Of Goods Sold External Debt Service - Principal - (16,100,000) (16,100,000) 29 External Debt Service - Interest - (1,500,000) (1,500,000) 30 Internal Principal & Interest Depreciation - 52,126,935 52,126, Other Operating Expense - (2,136,500) (2,136,500) 33 Total Direct Expenses 7,122,429 (75,413,754) (68,291,325) 34 Administrative Cost Allocations Capital Cost Allocation Subvention Allocation Total Expenses & Expense Allocations $ 7,122,429 $ (75,413,754) $ (68,291,325) 38 Results of Operations $ 2,735,581 $ 72,685,684 $ 75,421,265 INVESTMENT TRANSFERS 39 Transfer To (From) Operating Reserve Transfer To (From) Plant Fund Transfer To (From) Quasi Endowments Repair & Replacement Transfers Internal Bank Transfers Other Transfers Total Investment Transfers $ - $ - $ - 46 Net Results $ 2,735,581 $ 72,685,684 $ 75,421, Transfer Net Results to Fund Balance Adjusted Net Results $ 2,735,581 $ 72,685,684 $ 75,421, Total Transfer To (From) Reserve - - -
238
239 16 Future Year Planning Assumptions The summaries presented in the Financial Outlook section consolidate existing sections of the Budget Book and future year financial projections to present a multi-year outlook. Multi-year estimates for the following are presented: Strategic Opportunity Reserve includes commitments that have tentatively been made to fund initiatives through future years Administrative and Academic Targets summarizing the current multi-year targets for revenue growth and expense reductions included in our planning assumptions RHE Financial Outlook as is projections for our Regional campus system (our RHE system does not include the extension campuses in Dublin and Cleveland whose activities are embedded in the respective programs/colleges). These estimates do not yet include any projections regarding future goals of the Regional taskforce President Nellis has charged with developing recommendations Impact of current Planning Assumptions for FY19 and future periods which includes: FY19-FY22 Athens Tuition Forecast; State Appropriations; Compensation; Benefits; and Internal Debt Service FY19-FY22 Use of Reserves projected use of reserves with the assumptions and strategies implemented todate Incremental impacts of FY19 Athens enrollments into future years if planning assumptions for Athens freshman are reduced for future years Summary projections of State Appropriations, Compensation, Benefits, and Internal Debt Service
240 16.1 Strategic Opportunity Reserve Actual Forecast Projection Projection Projection FY17 FY18 FY19 FY20 FY21 Beginning Balance $36.2 $32.3 $24.6 $17.5 $9.5 Funding Investment Income OTO Investment Income 3.0 SSI (2.3) Tuition FY19 Enrollment Adjustment (1.3) (1.3) (1.3) Fund Balance Total - Funding $6.9 $12.3 $14.0 $11.2 $11.2 Actual Forecast Projection Projection Projection Investment Reserve Allocations FY17 FY18 FY19 FY20 FY21 Infrastructure Financial Systems Enhancements Parental Leave Replacement Funding IT Small Projects Bicentennial Park 0.1 Bridge for Admin Reductions 0.5 Infrastructure Subtotal $3.2 $1.7 $1.8 $2.1 $2.1 Community and Ec. Development TechGrowth Ohio - Approved TechGrowth Ohio - Proposed OHIO for Ohio Foundation for Appalachia Ohio MRC Support Community & Ec. Develop Subtotal $2.1 $2.5 $2.7 $5.1 $2.4 Student Success Programs Endowed Scholarships Signature Program Bridge Bobcat Student Orientation Unallocated Student Success Subtotal $2.7 $3.9 $4.0 $1.0 $1.0 Academic and Research Programs Innovation Strategy OBOR Research Portal 0.1 elearning Investment Tantrum Theater* RHE Investment RHE Investment - ERIP 1.4 Engineering Start-up OU Press MAC Faculty Conference Funding for Budget Volatility 3.8 Athens Campus Structural Imbalance International Student Recruitment Academic & Research Subtotal $2.7 $11.8 $7.0 $5.4 $3.2 Presidential Priorities & Strategic Pathways $0.0 $0.2 $5.5 $5.5 $5.5 Total - Reserve Allocations $10.7 $20.1 $21.1 $19.1 $14.2 Ending Balance $32.3 $24.6 $17.5 $9.5 $6.5 * An additional $0.6M of institutional support is budgeted in College of Fine Arts as an additional use of reserves.
241 16.2 Administrative & Academic Targets Step 1: Proportionality in Establishing Savings Targets Planning Units FY17 Base Savings Target ($) Savings Target (%) Administrative & Central Support Units $ 162,805,723 $ 8,483, % Academic Units - Athens Colleges $ 244,083,185 $ 12,761, % Subtotal $ 406,888,908 $ 21,245, % Step 2: Developing Multi-Year Approach, With Strategic Use of Reserves for Bridge Funding Cumulative Planning Unit - Operating Budget Budget Category FY18 FY19 FY20 FY21 FY22 Savings Administrative & Central Support Units $ 4.8 $ 1.5 $ 2.2 $ - $ - $ 8.5 Academic Units - Athens Colleges $ - $ 0.3 $ 2.0 $ 0.1 $ - $ 2.5 Academic Units - Athens Colleges $ 1.5 $ 3.3 $ 2.0 $ 1.6 $ 1.3 $ 9.7 Academic Units - Athens Colleges $ - $ 0.6 $ - $ - $ - $ 0.6 $ 21.2 Reserves Source FY18 FY19 FY20 FY21 FY22 Cumulative Impact on Reserves (UNR Net Assets) Academic Units - Athens Colleges $ 1.5 $ 7.1 $ 3.0 $ 1.3 $ - $ 12.9 Institutional Reserves* $ 5.8 $ 5.1 $ 5.3 $ 3.9 $ 3.9 $ 24.0 *Institutional Reserves allocations represent bridge funding for RHE through FY20, $1.3M for the Athens enrollment volatility, and $2.6M for the Athens structural deficit. This does not represent all projected reserve use $ RHE Financial Outlook FY18 FY19 FY20 FY21 FY22 Revenues Expenses, Allocations & Transfers Excess Revenues and Expenses Plus: Transfers from Reserves Less: Transfers to Capital Projects - Net Results RHE Reserve Balance Subvention Distribution presented in Expenses, Allocations, & Transfers section 2 SOR funding committed through FY21 to support ERIP costs and projected deficits
242 16.4 Impact of FY19 Planning Assumptions Topic Item FY18 - Planning Assumption FY19 - Planning Assumption FY20-FY22 Planning Assumption Guarantee Student Rates 1 Cap Calculation: (Budget Bill (0%) + 5-year CPI (1.3%)) Cap Calculation: (Budget Bill (0%) + 5-year CPI (1.3%)) Cap Calculation: (Budget Bill (2%) + 5-year CPI (1.3%)) FY Annual Change 2 Tuition Increase: 1.3% Tuition Increase: 1.3% Tuition Increase: 3.3% $2.2M 3 Room Increase: 3.5% Room Increase: 3.5% Room Increase: 3.5% $1.6M 4 Board Increase: 2.0% Board Increase: 2.0% Board Increase: 2.0% $.6M 9 Freshman Enrollment Total : 4,109 Freshman Enrollment Total : 3,971 Freshman Enrollment Total : FY20-22 = 4,144; UG Enrollment 10 Transfers Enrollment Total: 545 Transfers Enrollment Total: 461 Transfers Enrollment Total: 461 Central Student Financial Aid 11 Retention Rate: 3-year avg. Retention Rate: 3-year avg. Retention Rate: 3-year avg. 12 Graduation Rate: 3-year avg. Graduation Rate: 3-year avg. Graduation Rate: 3-year avg. 13 SOR Funding for Enrollment Volatility: $3.8M SOR Funding for Enrollment Volatility: $1.3M SOR Funding for Enrollment Volatility: $1.3M 14 Student Financial Aid: $0.8M Student Financial Aid: $0.9 M + $1.6 M for Strategic Student Financial Aid: FY20 = $0.8M Leveraging Model FY21-22 correlates to Tuition, Room & Board 15 ICA: Correlates to Tuition, Room & Board ICA: Correlates to Tuition, Room & Board ICA: Correlates to Tuition, Room & Board 17 Auxiliary Support: $2M ($4M total) Auxiliary Support: $.5M ($4.5M total) Auxiliary Support: FY20 = $.5M FY21-22 correlates to Tuition, Room & Board -$1.0M Endowment Distributions 19 Projection based on 36 months avg as of 12/31/16 per FY2018 Endowment Distributions Report distributed by Candice Casto Feb 2017 Market value growth per Foundation investment return forecast Market value growth per Foundation investment return forecast $1.5M SSI Healthcare 20 State Appropriation Growth: 0% State Appropriation Growth: 0% State Appropriation Growth: 2% $2.9M 21 OHIO Share: 10.3% (constant to FY17) OHIO Share: 10.6% OHIO Share: 10.6% 24 Cost Growth: 6% Cost Growth: 7% Cost Growth: 7% 25 University Contribution Growth: 5% University Contribution Growth: 2.5% ($1.25M) University Contribution Growth: 5% -$2.8M 26 Raise Pool: 0% Raise Pool: 1.5% Raise Pool: 2% W/Benefits -$7.5M Raise Pool Allocated Costs Capital Cost Model 27 Faculty Compensation Plan (FCI): 0% Faculty Compensation Plan (FCI): 0% Faculty Compensation Plan (FCI): 1% -$1.7M 28 Staff Compensation Initiative (SCI): 0% Biennial Equity Review Completed May 2017 Staff Compensation Initiative (SCI): 0% Staff Compensation Initiative (SCI): 1% (Even Years); 0% (Odd Years) 29 Compliance: $0M Compliance: $500K Compliance: $2M -$2.0M 31 Capital Model: $0.5M Capital Model: $63K Capital Model: $63K $.1M 32 Utilities: $0.3M Utilities: $0.6M Utilities: $0.6M -$0.6M 33 Plant Operation & Maintenance: $.2M Plant Operation & Maintenance: $0.2M Plant Operation & Maintenance: $0.2M -$0.2M 36 Deferred Maintenance: $1.3M Deferred Maintenance: $1.3M Deferred Maintenance: $1.3M 37 Capital Plan Debt: $0.9M Capital Plan Debt: -$0.8M Capital Plan Debt: $0.15M 38 Net Change in Central Debt Service: $2.2M Net Change in Central Debt Service: $0.5M Net Change in Central Debt Service: $1.45M -$1.45M -$1.4M
243 16.5 FY19-FY22 Projected Use of Reserves The FY20-FY22 projected use of reserves below were developed using the Athens UG enrollments forecasted during our planning period (4,144). The table following details the net tuition impact of the reduction of 170 FTE s for FY19, and illustrates the potential compounding if we reduce our enrollment budget targets for future years. These impacts are also discussed in Section The potential compounded net tuition reductions are not included in the reserve forecasts below: Net Transfer/(Draw) on Reserves FY19 FY20 FY21 FY22 Total Athens Colleges & Schools (4.6) (15.3) (18.7) (21.8) RHE (4.0) (5.2) Aux (6.5) (8.0) (43.7) 2.0 Central & Admin SOR (7.4) (8.3) (3.3) (3.1) Total (17.0) (31.4) (69.7) (28.1) (146.2) Breakout: Capital/One-time/Strategic Contributions to (Use of) Reserves Athens Colleges & Schools 2.5 (3.2) (2.4) (2.7) RHE Aux (6.5) (8.0) (43.7) 2.0 Central & Admin SOR (2.3) (3.0) Subtotal (4.8) (14.0) (45.5) 0.1 (64.2) Bridge Funding Use of Reserves Athens Colleges & Schools (7.1) (3.0) (1.3) Subtotal (7.1) (3.0) (1.3) - (11.4) Structural Challenge Athens Colleges & Schools 0.0 (9.1) (15.0) (19.1) RHE (1.2) (1.4) (4.0) (5.2) SOR (3.9) (3.9) (3.9) (3.9) Subtotal (5.1) (14.4) (22.9) (28.2) (70.6) Total (17.0) (31.4) (69.7) (28.1) (146.2) Funded by committed/identified reserves Funding may not be identified Represents impact on reserves with no additional action; represents growing structural imbalance between revenue and expense assumptions Commitment from SOR supporting RHE glide-path to balanced budget Remaining FY19 funding imbalance - to be solved in future years
244 16.6 FY19-FY22 Athens Tuition Forecast This following summarizes the financial impact of potential enrollment reductions in FY19-FY22 that were not included in the FY19-FY22 Outlook presented in Section The FY19 Planning Assumption and FY19 Budget for our Athens UG enrollments are explained in further detail in Section 4. Previous versions of this chart presented the subset of our Student Financial Aid (SFA) controlled by our central financial office; this version presents all UG Financial Aid (e.g. Student-athletes, foundation awards by colleges) and mirrors the Discount Rate calculation in Section 4.3. FY19 FY20 FY21 FY22 New Freshmen & Transfers - FY19 Planning Assumption New Freshmen Resident 3,629 3,629 3,629 3,629 New Freshmen Non-Resident Subtotal - New Freshmen 4,144 4,144 4,144 4,144 Transfers Grand Total - New Freshmen & Transfers 4,605 4,605 4,605 4,605 New Freshmen & Transfers - FY19 Budget New Freshmen Resident 3,425 3,425 3,425 3,425 New Freshmen Non-Resident Subtotal - New Freshmen 3,971 3,971 3,971 3,971 Transfers Grand Total - New Freshmen & Transfers 4,432 4,432 4,432 4,432 Variance - Resident Students Variance - Non-Resident Students Variance - New Freshmen & Transfers FY19 FY20 FY21 FY22 Total Students - FY19 Planning Assumption Total Students Resident 15,329 15,199 15,092 15,083 Total Stuents Non-Resident 2,344 2,245 2,196 2,187 Subtotal - Total Students 17,673 17,444 17,288 17,270 Total Students - FY19 Budget Total Students Resident 15,125 14,831 14,573 14,425 Total Students Non-Resident 2,375 2,301 2,276 2,287 Subtotal - Total Students 17,500 17,132 16,849 16,712 Variance - Resident Students Variance - Non-Resident Students Variance - Total Students FY19 FY20 FY21 FY22 Tuition Caps - FY19 Planning Assumption 0% 2.0% 2.0% 2.0% Growth from Tuition Caps $ - $ 8.3 $ 11.2 $ 15.2 Gross Tuition - FY19 Planning Assumption $ $ $ $ Gross Tuition - FY19 Budget $ $ $ $ Variance - Gross Tuition $ (1.8) $ (3.3) $ (4.8) $ (6.2) SFA - FY19 Planning Assumption $ (58.4) $ (60.9) $ (61.6) $ (63.0) SFA - FY19 Budget $ (57.9) $ (60.4) $ (61.1) $ (62.5) Variance - SFA $ 0.5 $ 0.5 $ 0.5 $ 0.5 Net Tuition - FY19 Planning Assumption $ $ $ $ Net Tuition - FY19 Budget $ $ $ $ Variance - Net Tuition $ (1.3) $ (2.8) $ (4.3) $ (5.7) Discount Rate - FY19 Planning Assumption 24.6% 25.5% 25.4% 25.3% Discount Rate - FY19 Budget 24.6% 25.6% 25.7% 25.7%
245 This following chart provides trended information for Athens Undergraduate Tuition, Financial Aid, and Enrollments. This graph expands upon the information in Section 4.3 to provide future-year impacts. FY20-22 assumes an incoming freshman class of 4,144, consistent with enrollment figures used in Colleges future year financial forecasts. Gross Tuition Millions Net Tuition (Gross Tuition less Financial Aid) $275.0 $250.0 $225.0 $200.0 $175.0 $150.0 $125.0 $100.0 $75.0 $50.0 $25.0 $- Athens UG Gross & Net Tuition $45.9 $51.7 $54.6 $53.8 $58.4 $57.9 $57.9 $58.9 $60.0 $181.7 $184.0 $183.4 $180.9 $179.2 $177.9 $179.8 $182.2 $187.5 FY15 FY16 FY17 FY18 Proj FY19 Planning Assumption FY19 Budget FY20 Proj FY21 Proj FY22 Proj Guarantee Tuition Rate Growth* 5.1% 1.7% 1.3% 1.3% 1.3% 3.3% 3.3% 3.3% Non-Guarantee Tuition Rate Growth* 1.5% 0.0% 0.0% 0.0% 0.0% 0.0% 2.0% 2.0% 2.0% Discount Rate 20.2% 21.9% 23.0% 22.9% 24.6% 24.6% 24.4% 24.4% 24.2% Total Headcount (Fall) 17,660 17,965 18,197 17,936 17,673 17,500 17,310 17,167 17,158 New Freshmen (Fall) 4,377 4,423 4,309 4,045 4,144 3,971 4,144 4,144 4,144 Gross Tuition $227.6 $235.8 $238.0 $234.7 $237.6 $235.8 $237.7 $241.1 $247.5 Financial Aid $45.9 $51.7 $54.6 $53.8 $58.4 $57.9 $57.9 $58.9 $60.0 Net Tuition $181.7 $184.0 $183.4 $180.9 $179.2 $177.9 $179.8 $182.2 $ State Appropriations For planning purposes we have assumed that SSI will grow at 2%, that Ohio University will maintain its share of the state allocation (dependent primarily upon degree and course completions as compared to same at other Ohio Publics), and that there are no formula changes that impact our share. State Share of Instruction $185.0 $175.0 $165.0 Millions $155.0 $145.0 $135.0 $125.0 FY18 FY19 FY20 FY21 FY22 State Share of Instruction $160.9 $162.6 $167.0 $170.2 $173.4 State Appropriations Growth 0.0% 0.0% 2.0% 2.0% 2.0% SSI Growth Assumption Impact (excl. Med 2) $- $- $2.9 $2.9 $3.0 Med 2 Earnings Share Impact $1.7 $1.6 $1.4 $0.4 $0.2 Ohio % Share 10.6% 10.6% 10.6% 10.6% 10.6% Athens Main + Doctoral FTE 26,610 26,087 25,707 25,333 24,964 Regional FTE 6,168 5,738 5,575 5,416 5,262 Medical FTE
246 16.8 Compensation Projections detailed below incorporate our planning assumptions for raises, Faculty Comp Initiative, and Staff Comp Initiative. Additionally the total projected salaries include any projected staffing reductions and all other staffing changes. $450.0 Compensation $400.0 Millions $350.0 $300.0 $250.0 FY18 FY19 FY20 FY21 FY22 Salary & Wages - Unit Forecast $361.8 $372.3 $378.9 $386.5 $394.6 Raise Pool Assumption 0.0% 1.5% 2.0% 2.0% 2.0% Raise Pool Impact $- $4.7 $6.4 $6.6 $6.7 Faculty Comp Assumption 0.0% 0.0% 1.0% 1.0% 1.0% Faculty Comp Impact $- $- $1.4 $1.5 $1.5 Staff Comp Assumption 0.0% 0.0% 1.0% 0.0% 1.0% Staff Comp Impact $- $- $1.2 $- $ Benefits $140.0 Benefits $130.0 Millions $120.0 $110.0 $100.0 FY18 FY19 FY20 FY21 FY22 Total Benefits $116.2 $121.9 $124.4 $128.8 $133.5 Variable Benefit Impact of Comp. Assumptions $0.8 $1.5 $1.3 $1.5 Healthcare Assumption 2.5% 5.0% 5.0% 5.0% Healthcare Impact $1.4 $2.8 $2.9 $3.1
247 16.10 Internal Debt Service The Internal Debt Service projections below are aligned with our FY19-FY24 CIP and the associated planned debt issuances of $125M in FY19 and $75M in FY21. Internal Debt Service $80.0 $60.0 $51.3 $54.1 $60.9 $64.6 $64.7 Millions $40.0 $20.0 $- FY18 FY19 FY20 FY21 FY22 Direct Loan Debt Service $24.3 $25.8 $30.1 $30.0 $28.8 Central Loan Debt Service $27.1 $28.3 $30.8 $34.5 $35.9 Internal Loan Issuance - Direct $61.5 $70.0 $- $- Internal Loan Issuance - Central $18.0 $- $45.7 $- Central Loan Capital Plan Debt Service Increment $1.1 $(0.1) $2.4 $0.0 Central Deferred Maintenance Debt Service Increment $1.3 $1.3 $1.3 $1.3 Direct Loan Capital Plan Debt Service Increment $3.8 $2.1 $(0.1) $(1.2)
248
249 17 Fact Sheets Ohio University Financial Fact Sheet Operating Revenue $800.0 $700.0 $600.0 (millions) $500.0 $400.0 $300.0 $200.0 $100.0 $0.0 FY09 FY10 FY11 FY12 FY13 FY14 FY15 FY16 FY17 FY18 Forecast Endowment Distributions Facilities & Admin Costs Recovery Gifts Grants & Contracts Investment Income Other External Sales Room & Board State Appropriations Tuition & Fees (net of financial aid) SSI Funding Tuition & SSI Trends per Student FTE $1,600.0 $1, % $16,000 $14,000 QTR to Semester Conversion 35,000 34,000 State Share of Instruction (millions) $1,200.0 $1,000.0 $800.0 $600.0 $ % 11.0% 10.0% 9.0% OU Share of SSI $12,000 $10,000 $8,000 $6,000 33,000 32,000 31,000 30,000 29,000 Full Time Equivalents (FTEs) $200.0 $4,000 28,000 $0.0 FY09 FY10 FY11 FY12 FY13 FY14 FY15 FY16 FY17 FY18 Forecast 8.0% $2,000 27,000 Ohio University $146.4 $145.3 $148.0 $131.7 $136.4 $146.4 $154.1 $155.8 $157.4 $160.9 Statewide Total $1,526.8 $1,555.3 $1,558.8 $1,335.5 $1,347.6 $1,378.4 $1,399.1 $1,464.6 $1,523.2 $1,523.2 % Share - Ohio University 9.6% 9.3% 9.5% 9.9% 10.1% 10.6% 11.0% 10.6% 10.3% 10.6% $0 FY09 FY10 FY11 FY12 FY13 FY14 FY15 FY16 FY17 FY18 Forecast State Support per FTE Net Tuition per FTE FTEs 26,000 Athens UG Tuition Revenue & Discount Rate $ % $50.0 OU Contribution to Employee Healthcare $14,000 Tuition and Financial Aid (millions) $200.0 $150.0 $100.0 $50.0 $60.0 $45.9 $51.7 $54.6 $53.8 $57.9 $57.9 $58.9 $181.7 $184.0 $183.4 $180.9 $177.9 $179.8 $182.2 $ % 25.0% 20.0% 15.0% Discount Rate Healthcare Expenses (millions) $40.0 $30.0 $20.0 $13,000 $12,000 $11,000 $10,000 Healthcare Cost per Employee $10.0 $9,000 $- 10.0% Net Tuition Financial Aid Discount Rate $0.0 FY09 FY10 FY11 FY12 FY13 FY14 FY15 FY16 FY17 FY18 Forecast Healthcare Expense Healthcare Cost per Employee $8,000
250 Ohio University Financial Fact Sheet Capital Expenditures & Depreciation Expense $200.0 $250M $250M Century Bond Program $55.0 $50.0 CAPITAL EXPENDITURES (MILLIONS) $150.0 $100.0 $50.0 $0.0 FY18 FY09 FY10 FY11 FY12 FY13 FY14 FY15 FY16 FY17 Forecast Capital Expenditures $58.8 $32.8 $30.4 $42.5 $73.8 $100.2 $176.5 $101.4 $96.9 $100.2 Depreciation Expense* $33.1 $34.5 $34.2 $34.8 $35.2 $36.4 $37.9 $43.0 $48.9 $51.0 * Excludes Component Units (TechGROWTH OHIO; UMA {FY17}; and OUF Subsidiaries) Debt Introduced $45.0 $40.0 $35.0 $30.0 DEPRECIATION EXPENSE (MILLIONS) Outstanding Debt and Debt Service $700.0 $100.0 Outstanding Debt (millions) $600.0 $500.0 $400.0 $300.0 $200.0 $100.0 $80.0 $60.0 $40.0 $20.0 Annual Debt Service (millions) $0.0 FY09 FY10 FY11 FY12 FY13 FY14 FY15 FY16 FY17 FY18 Forecast Long Term Debt $207.0 $208.5 $200.1 $228.9 $353.4 $337.6 $319.7 $301.8 $376.4 $359.9 Century Bond $0.0 $0.0 $0.0 $0.0 $0.0 $0.0 $250.0 $250.0 $250.0 $250.0 Debt Service $27.2 $23.7 $21.0 $21.1 $21.2 $29.2 $38.4 $44.5 $44.9 $46.5 $0.0 $300.0 Operating (Working Capital) - Net Assets $250.0 $200.0 (millions) $150.0 $100.0 $50.0 $0.0 FY14 FY15 FY16 FY17 FY18 Forecast Investment Returns $13.7 $11.7 $10.3 $20.5 $29.8 Strategic Opportunity Reserve $38.9 $33.6 $36.2 $32.3 $23.7 Auxiliary $49.2 $57.5 $67.1 $80.2 $80.8 Operating $147.1 $148.5 $143.4 $142.2 $143.7


251 Ohio University Financial Fact Sheet Foundation Support of University Funding $ % (millions) $25.0 $20.0 $15.0 $10.0 $5.0 $0.0 FY08 FY09 FY10 FY11 FY12 FY13 FY14 FY15 FY16 FY17 4.0% 3.0% 2.0% 1.0% Support as a % of University Budget Academic Support Instruction and Departmental Research Student Aid Institutional Support Intercollegiate Athletics Public Service, Research, and Student Services Endowment Market Value Endowment Distributions Investment Performance Senate Bill 6 Composite Score 12.0% 10.0% 9.6% 9.7% OU Rank Score (Tied) 8.0% 6.0% 6.0% 6.4% 8.1% 8.0% 7.8% 5.2% 5.5% % % % Five-Year Three-Year One-Year OHIO Return Policy Diversified Benchmark HEPI + 6% Spend Benchmark 0.0 FY09 FY10 FY11 FY12 FY13 FY14 FY15* FY16* FY17* FY18 Forecast*^ * Excludes impact of GASB 68 ^ Unaudited Ohio University State Average
252 Ohio University Compensation & Workforce Fact Sheet Compensation Expense Salaries & Wages $400.0 (millions) $350.0 $300.0 $250.0 $200.0 $ % 5% 5% 5% 7% 7% 7% 7% 6% 6% 6% 6% 11% 10% 10% 10% 31% 31% 31% 31% 5% 6% 7% 5% 5% 9% 9% 31% 33% 5% 5% 6% 6% 6% 5% 10% 10% 32% 32% 5% 5% 5% 6% 6% 6% 6% 10% 8% 32% 33% $100.0 $50.0 $- 39% 40% 40% 40% 41% 40% 40% 39% 40% 40% FY09 FY10 FY11 FY12 FY13 FY14 FY15 FY16 FY17 FY18 Forecast* Faculty Salaries Administrative Salaries Classified NBU Wages Union Wages Graduate Student Wages Student Wages Other Compensation* Personnel Share of Expense $800.0 $700.0 (millions) $600.0 $500.0 $400.0 $ % 33% 34% 35% 16% 16% 17% 15% 36% 37% 15% 16% 37% 15% 37% 15% 36% 36% 15% 15% $200.0 $ % 51% 49% 49% 49% 47% 48% 48% 49% 48% $- FY09 FY10 FY11 FY12 FY13 FY14 FY15* FY16* FY17* FY18 Forecast* General Expenses $169.5 $180.3 $195.2 $203.5 $227.8 $246.2 $258.7 $265.3 $268.0 $274.2 Benefits $87.4 $87.9 $94.4 $89.2 $95.3 $108.1 $105.2 $110.6 $113.8 $116.1 Salaries & Wages $282.9 $279.0 $281.5 $285.1 $304.7 $311.9 $333.0 $346.5 $361.7 $361.6 $140.0 Benefits Expense $120.0 (millions) $100.0 $80.0 $60.0 7% 8% 7% 7% 7% 41% 40% 40% 42% 41% 7% 41% 8% 41% 8% 8% 8% 40% 40% 40% $40.0 $ % 46% 46% 44% 45% 45% 45% 48% 47% 47% $- FY09 FY10 FY11 FY12 FY13 FY14 FY15 FY16 FY17 FY18 Forecast Workers Comp $2.2 $2.4 $2.1 $2.3 $2.9 $2.2 $1.8 $1.0 $1.7 $1.7 Medicare $2.9 $2.9 $3.0 $3.1 $3.4 $3.8 $3.9 $4.1 $4.3 $4.3 Educational Benefits $6.1 $6.6 $6.5 $6.6 $6.7 $7.2 $7.9 $8.3 $8.5 $8.7 Retirement $35.1 $34.7 $35.0 $37.0 $37.0 $39.5 $41.6 $43.3 $45.1 $46.2 Health Insurance $38.6 $39.6 $40.2 $39.3 $40.8 $43.9 $45.9 $52.4 $53.3 $54.4
253 Ohio University Compensation & Workforce Fact Sheet Compensation Expense Salaries & Wages OHIO FY18 IUC 2017 Mercer College and Universities (2016) Mercer National All Industry (2016) OU AFSCME Union Office Visit Copay $25 $20 $25 $25 $25 Deductible $500 / $1,000 $340 / $700 $500 / $1,000 $1,500 / $3,000 $500 / $1,000 Out of Pocket Max $2,500 / $5,000 $3,304 / $6,607 $2,750 / $6,000 $4,000 / $7,500 $2,250 / $4,500 Co-Insurance % 80% / 20% 85% / 15% 80% / 20% 80% / 20% 87% / 13% Rx Retail Copay Generic $20 $10 $11 $11 $20 Brand Formulary $30 $29 $33 $36 $30 Rx Mail Copay Generic $25 $22 $22 $25 $25 Brand Formulary $40 $58 $69 $79 $40 120,000 Group 1 Faculty Salary Trend Group 1 Salary by Rank and Year 100,000 80,000 60,000 40,000 Professor Associate Professor Assistant Professor 20, % Group 1 Faculty Retention Rate Trend 94.0% 93.9% 94.1% 92.6% 92.4% 93.1% 92.0% 91.6% 91.7% 91.4% 91.4% 90.0%
254 Ohio University Compensation & Workforce Fact Sheet Staff Headcount Trends FY13 - FY18 Staff Headcounts 1,600 1,400 1,200 1, FY13 FY14 FY15 FY16 FY17 FY18 Administrative 1,250 1,292 1,352 1,436 1,435 1,401 Athens Colleges Auxiliaries College of Medicine Regional Campuses Faculty Headcount Trends FY13 - FY18 1,200 Faculty Headcounts 1, FY13 FY14 FY15 FY16 FY17 FY18 Administrative Athens Colleges 1,013 1,053 1,065 1,070 1,093 1,088 College of Medicine Regionals


255 Ohio University Compensation & Workforce Fact Sheet Compa Ratio and Average Annualized Salary Progression After three rounds of equity increases across the University, the average compa ratio among employees has increased from 0.93 to Average salaries increased in 22 out of the 29 job families, for an average increase of 2.28%. Compa Ratio Relation to Industry Average Relation to Mid Point of Pay Grade 1.00 Pay is comparable to the industry average Pay is at the pay grade mid point 0.75 Pay is 25% below the industry average Pay is below the pay grade mid point 1.15 Pay is 15% above the industry average Pay is above the pay grade mid point
256 Ohio University Compensation & Workforce Fact Sheet Average Compa Ratio/Average Salary Progression Job Family Before any equity adjustments Average of compa ratio 6/29/15 Average of Annualized Salary 6/29/15 After third round of equity adjustments Average of compa ratio 7/1/2017 Average of Annualized Salary 7/1/2017 +/- average compa ratio Difference since /- average annualized salary +/- percentage change Academic & Program Management 0.93 $63, $75, $12, % Academic Services 0.98 $51, $57, $6, % Administrative Management 0.93 $69, $74, $4, % Administrative Services 0.93 $37, $38, $1, % Athletics 0.88 $48, $46, $2, % Auxiliaries 0.90 $56, $56, $ % Aviation *0.88 *$58, $54, $4, % Communications & Marketing 0.92 $54, $59, $4, % Development & Inst. Advancement 0.97 $70, $72, $1, % Education 0.90 $50, $47, $3, % Engineering, Architecture & 0.91 $74, $76, $1, % Enrollment Services 0.94 $54, $53, $1, % Environmental Safety & Police 0.93 $41, $41, $0 0.00% Services Event Management 0.88 $50, $50, $ % Facilities & Operations 0.93 $54, $60, $5, % Finance & Business 0.97 $54, $57, $2, % Fine & Performing Arts 0.95 $45, $50, $5, % Health Services 0.91 $60, $67, $6, % Human Resources 0.90 $55, $57, $1, % Information Technology 0.93 $65, $70, $4, % Instructional Technology 0.94 $58, $65, $7, % Legal & Compliance 0.92 $66, $73, $6, % Library Services/Museum 0.98 $52, $55, $2, % Media Production 0.95 $50, $50, $ % Records Management 0.92 $38, $40, $1, % Research & Labs 0.97 $51, $57, $6, % Research Administration 0.91 $67, $81, $14, % Risk Management 0.91 $57, $61, $4, % Student Affairs 0.94 $50, $47, $3, % Grand Total 0.93 $55, $56, $1, % Source: Oracle Business Intelligence on the above noted dates


257 Ohio University Campus Space Fact Sheet Ohio University Statewide Locations WILLIAMS FULTON LUCAS OTTAWA LAKE GEAUGA ASHTABULA DEFIANCE HENRY WOOD SANDUSKY ERIE LORAIN CUYAHOGA Cleveland TRUMBULL PAULDING PUTNAM HANCOCK SENECA HURON MEDINA SUM- PORTAGE MAHONING VAN WERT ALLEN CRAW- WYAN- RICH- ASH- WAYNE STARK COLUMBI- Beavercreek BUTLER WARREN HAMILTON GREENE LOGAN CLARK CLINTON BROWN HARDIN HIGHLAND UNION FAYETTE ADAMS MARION Chillicothe FRANKLIN PICKAWAY ROSS PIKE SCIOTO DELE- MOR- Dublin FAIRFIELD JACKSON KNOX LICKING Pickerington Center HOCKING VINTON Lancaster GALLIA MUSKINGUM ATHENS COSHOCTON MEIGS HOLMES MORGAN TUSCARAWAS GUERNSEY Zanesville Athens NOBLE WASHINGTON CARROLL HARRISON BELMONT Athens Campus Regional Campus MADI- MERCER AUGLAIZE SHELBY DARKE MIAMI MONTGOM- PREBLE CHAM- PER- JEFFER- Eastern Campus Southern LAWRENCE Proctorville Other University Pres-
 Athens Campus Net Assignable Square Footage (NASF) Note: Gross square feet includes all space")
258 Ohio University Campus Space Fact Sheet Ohio University Campus Data Location Acreage Buildings S AS Athens Campus Beavercreek Campus Chillicothe Campus Cleveland Campus Dublin Campus Eastern Campus Lancaster Campus Southern Campus Zanesville Campus otals n a Ohio University Gross Square Footage (GSF) Athens Campus Net Assignable Square Footage (NASF) Note: Gross square feet includes all space within the footprint of each building s floor. Net assignable square feet excludes non-assignable areas such as corridors, mechanical rooms, restrooms, and the thickness of interior and exterior walls.


259 Ohio University Campus Space Fact Sheet Ohio University Campus Data Ohio University FY19 FY24 Six Year Capital Improvement Summary The Six Year Capital Plan is a reflection of University priorities in supporting our academic and research mission. Investments are prioritized to dedicate as many resources as affordable toward functional facilities to provide a transformative learning experience for our students and support world-class research, creative activity, and teaching by our faculty.

260 Ohio University Campus Space Fact Sheet Ohio University Campus Data This chart below illustrates the funding resources the University has had since FY2012 as well as future projections as they correlate with the embedded FY2019-FY2024 Six Year Capital Plan. The impact of having more resources for capital investments, such as the Century Bond & access to debt issuances beginning in FY2015, has enabled the institution to reduce the deferred maintenance backlog and reach the target range of $50/GSF in the FY19-FY24 time period. Deferred Maintenance Backlog Without CIP Investments $87 $93 $99 $105 $111 $117 $123 $85 $74 $62 $53 $51 Deferred Maintenance Backlog With CIP Investments


261 Ohio University Campus Space Fact Sheet Ohio University Athens Campus 2017 Renovation Age Building Age Balance A 50% balance between buildings that are 25 years and younger and buildings 26 years and older, including investment to maintain this average, assists with managing the balance between life cycle needs and annual investment in newer facilitie s.
262 Ohio University Enrollment Fact Sheet Total Enrollment Total Enrollment by Race 50,000 Total Enrollment by Race 110% 40,000 35,199 38,618 30,840 42,078 43,242 33,483 34,365 42,661 35,266 43,663 44,106 43,752 43,649 36,185 36,493 36,872 36,867 36, % 90% 80% 5% 5% 5% 5% 5% 5% 5% 5% 4% 4% 8% 8% 10% 10% 11% 11% 11% 12% 13% 13% 30,000 28,522 27,441 29,013 30,754 30,974 29,532 29,959 30,341 30,681 30,855 30,340 70% 60% 87% 87% 86% 85% 84% 84% 83% 83% 83% 83% 20, % month Unduplicated Headcount Fall Unduplicated Headcount FTE Caucasian Minorities International Total Headcount by Campus Undergraduate FTE 40,000 20,000 35,000 30,000 25,000 15,000 17,795 18,089 18,145 18,168 16,587 17,137 17,517 17,969 18,188 17,885 20,000 15,000 10,000 10,000 5,000 5,000 6,142 7,118 7,458 7,115 6,515 6,259 6,174 5,961 5,650 5, Fall 2009 Fall 2010 Fall 2011 Fall 2012 Fall 2013 Fall 2014 Fall 2015 Fall 2016 Fall 2017 Fall Athens 20,537 21,182 21,324 21,848 21,724 22,657 23,306 23,701 22,110 21,890 Regional 7,824 9,100 9,562 9,050 8,840 8,618 8,537 8,574 8,393 8,141 elearning 832 1,465 3,784 4,353 5,678 6,129 5,911 5,978 8,242 8,209 Unduplicated Fall 28,522 30,840 33,483 34,365 35,266 36,185 36,493 36,872 36, *IN 2016, 2,117 GRADUATE ONLINE STUDENTS ARE IN ELEARNING, PRIORYEARS INCLUDED THEM IN ATHENS. *IN 2016, 167 REGIONAL ONLINE STUDENTS ARE IN ELEARNING, PRIOR YEARS INCLUDED THEM IN REGIONAL ,192 3,093 2,931 2,979 3,060 1,920 2,259 2, Fall FTE Athens elearning Regional Graduate and Professional Headcount Total Enrollment by Residency 3,000 2,500 2,000 1,500 1, ,640 2,684 2,666 2,762 2,826 2,718 2,750 2,738 2,606 2,648 2,639 2,502 2,384 2,298 1,993 1,448 1, ,000 35,000 30,000 25,000 20,000 15,000 10,000 5, ,505 1,625 1,766 1,891 1, ,445 3,938 4,647 5,095 5,388 5,699 5,828 5,961 1,447 1,456 2,892 2,671 28,533 28,802 28,853 29,199 29,252 29,424 29,536 28,891 26,501 24, Grad Regular Grad Online/Outreach Medical Resident Non-Resident International
263 Ohio University Enrollment Fact Sheet Athens First-Year Freshmen Admission Statistics First Year Enrollments Freshmen, Transfers & Residency 50,000 45,000 4,045 90% 80% 5,000 4,500 40,000 35,000 3,888 4,244 4,379 4,423 4,309 19,398 70% 60% 4,000 3,500 3,000 30,000 25,000 20,000 15,000 10,000 5, ,149 15,548 15,625 4,072 3,985 3,976 3,883 15,437 13,571 10,931 11,591 11,372 11,437 26,243 20,765 20,934 20,996 20,623 17,466 14,046 14,204 13,366 13, Applied Admitted Enrolled Acceptance Rate Yield Rate 50% 40% 30% 20% 10% 0% 2,500 2,000 1,500 1, Transfer (Res + Non-Res) FR International FR Non-Resident FR Resident 3,429 3,624 3,540 3,393 3,289 3,628 3,783 3,751 3,772 3,528 Freshman Class Quality Athens First Generation & Ohio Appalachian Athens Undergraduate ACT Composite High School GPA % 35% 38% 32% 33% 31% 31% First Generation Both Ohio Appalachian % of Total Class Retention Rates Athens Graduation Rates Athens 85% 80% 75% 70% 65% 78% 71% 68% 80% 74% 70% 82% 81% 75% 75% 72% 70% 80% 73% 69% 79% 79% 72% 71% 68% 65% 80% 79% 73% 73% 70% 70% 81% 75% 80% 80% 70% 60% 50% 40% 30% 20% 10% 70% 69% 65% 65% 64% 67% 67% 67% 64% 63% 51% 48% 46% 44% 44% 48% 49% 48% 46% 44% 45% 39% 60% % First Year Second Year Third Year Four Year Five Year Six Year
264 Ohio University Top 50 Ranked Programs Fact Sheet College of Arts and Sciences Undergraduate Forensic Chemistry program # 1 in Toxicology (# 3 overall) On Forensic Science Assessment Test Clinical Psychology PhD program One of the top 4.3% of all clinical doctoral programs with 100% match of students to APA-accredited internships over past 5 years Philosophy graduate program in top 16 PhD Program in Creative Writing # 3 in nation (Poets & Writers Magazine) Industrial/Organizational Program # 1 in research productivity per faculty member (# 24 if unadjusted) Global Affairs and Int l Studies African Studies Program in top 20 (U.S. Dept. of Education) Voinovich School # 39 (Best Value School s Top 50 Most Innovative Public Service Schools) Voinovich School and College of Business Center for Entrepreneurship # 1 Emerging Entrepreneurship Program College of Business Undergraduate Public Business School # 15 Undergraduate Sports Business program # 2 (worldwide) (SportsBusiness International) Master s of Athletic Administration # 8 ranked Most Affordable Online Master s in Athletic Administration Sport Business Graduate Programs (MBA/MSA dual degree, PMSA online) # 1 (worldwide) Online MBA Program # 15 best in the Nation (Poets & Quants - poetsandquants.com) College of Fine Arts Ceramics graduate program Printmaking graduate program Master s in Music Therapy # 3 # 10 # 15 (U.S. News and World Report) (U.S. News and World Report) (Top 25 Master s Degrees in Music Therapy 2016) College of Fine Arts # 1 ranked Marching Band in the Country # 33 ranked School of Art + Design Marching 110 (U.S. News and World Report) (collegesports-fans.com) School of Theater # 32 Overall # 13 for Directing # 14 for Playwriting # 22 for Acting & Performing # 33 for Design & Production College of Health Sciences and Professions Communication Sciences and Disorders undergraduate Program in top 24 Speech Language Pathology Master s Program # 46 out of 249 (2016 U.S. News and World Report) Doctor of Clinical Audiology (AUD) # 37 out of 74 programs (2016 U.S. News and World Report) Doctor of Physical Therapy (CPT) # 46 of 233 programs (2016 U.S. News and World Report)
265 Ohio University Top 50 Ranked Programs Fact Sheet Heritage College of Osteopathic Medicine in top 20 for the percentage of graduates in both Primary Care and Family Medicine (Med School Mapper) Honors Tutorial College in top 20 Public University Honors Programs (a Review of Fifty Public Honors Programs) Patton College of Education Master s in Curriculum and Instruction (online) # 9 out of 25 (The Best Schools - Online Master s in Coaching # 3 in the 15 Best Online Master s in Coaching Education (Sports Management Degree Hub) Online Master s in Soccer Coaching (online) # 18 (2018 Best Online Programs - U.S. News and World Reports) Online Master s in Reading # 7 in the 25 Best Online Master s in Reading Education Russ College of Engineering #36 in U.S. News & World Report Best online Graduate Engineering Programs #25 on National Science Foundation Research and Development spending in Chemical Engineering Organizational Communication doctoral program # 9 (National Communication Association) E.W. Scripps School of Journalism in top 8 Internationally (only one in North America) Health Communication doctoral program # 10 (National Communication Association) Intercultural-International Communication # 12 (National Communication Association) Scripps College of Communication Rhetorical Communication doctoral program Critical-Cultural Communication doctoral program # 18 # 20 (National Communication Association) (National Communication Association) Interpersonal/Small-Group Communication doctoral program School of Communication Studies # 20 in top 20 for research (National Communication Association) (Communication Institute for Online Scholarship) School of Visual Communication Critical-Cultural Communication in top 5 # 23 (Magazine for Emerging Photographers and Photo Educators) (National Communication Association) Communication and Technology # 26 (National Communication Association) Games and Animation major # 32 (2017 Animation Career Review) Mass Communication # 28 (National Communication Association) Online Applied Communication Bachelor s Degree # 1 Most Affordable Online Colleges for Public Relations Degrees (OnlineU)
266
267 18 Appendix 18.1 Transition from Responsibility Center Management (RCM) Methodology FY19 represents the last year Ohio University plans to utilize the Responsibility Center Management methodology initially adopted in FY14. When implemented, RCM budgeting was established at the University under the following principles: Ensure the sustained strength of the University by aligning resources with University priorities to support academic excellence Support strong academic governance that promotes collaboration across units and builds on the strengths of the University Present a holistic view of the University Budget that provides a clear connection between performance and incentives Empower unit-level decision making authority to promote academic excellence and institutional efficiency that is balanced by responsibility and accountability Create a simple and transparent budget process driven by the goals of financial predictability and stability Recognizing that Ohio University s RCM model was neither simple nor transparent, President Nellis created the Budget Model Committee in Fall 2017 and charged its members with developing recommendations for a new University budget model. The recommendations from the Budget Model Committee have been submitted to President Nellis and will form the basis of the development and management of the institution s multi-year budget planning strategy. The Committee s budget model recommendations are currently being finalized for implementation in the FY20 budget process. Under the current proposal, the following elements of the RCM budget model will be eliminated: Subvention Academic College pool of resources that was utilized by the Provost to support strategic investments and balance colleges financial needs. Indirect Cost Methodology The basis by which administrative support unit costs are allocated to Responsibility Centers designed for RCM. While the current FY19 Ohio University budget utilizes these RCM allocations, the future year budgets will eliminate the need for Subvention and the use of the Indirect Cost Methodology. This will result in a lack of comparability between future year budgets and the FY14-FY19 budgets that utilized the RCM methodology.
268 18.2 Tuition Rates Credit Hours FY 2019 Tuition Schedule - OHIO Guarantee Students Athens Campus Undergraduate Tuition (Per Semester) Instructional Fee General Fee Ohio Resident Total Non-Resident Fee Out-of-State Resident Total Career & Experiential Learning Fee , , , , , ,710 1,398 3, , ,280 1,864 4, , ,850 2,330 5, , ,420 2,796 6, , ,990 3,262 7, , ,560 3,728 8, , ,130 4,194 9, , ,700 4,660 10, , ,700 4,660 10, * 5, ,024 4,732 10, **Beyond 20 Hours: Resident Fee is $282/hr. and Non-Resident Fee is $536/hr. FY 2018 Tuition Schedule - OHIO Guarantee Students Athens Campus Undergraduate Tuition (Per Semester) Credit Hours Instructional Fee General Fee Ohio Resident Total Non-Resident Fee Out-of-State Resident Total , , , , , ,689 1,398 3, , ,252 1,864 4, , ,815 2,330 5, , ,378 2,796 6, , ,941 3,262 7, , ,504 3,728 8, , ,067 4,194 9, , ,630 4,660 10, , ,630 4,660 10, * 5, ,948 4,732 10,680 *Beyond 20 Hours: Resident Fee is $279/hr and Non-Resident Fee is $533/hr
269 FY 2017 Tuition Schedule - OHIO Guarantee Students Athens Campus Undergraduate Tuition (Per Semester) Credit Hours Instructional Fee General Fee Ohio Resident Total Non-Resident Fee Out-of-State Resident Total , , , , ,668 1,398 3, , ,224 1,864 4, , ,780 2,330 5, , ,336 2,796 6, , ,892 3,262 7, , ,448 3,728 8, , ,004 4,194 9, , ,560 4,660 10, , ,560 4,660 10, * 5, ,872 4,732 10,604 *Beyond 20 Hours: Resident Fee is $276/hr and Non-Resident Fee is $530/hr Credit Hours FY 2016 Tuition Schedule - OHIO Guarantee Students Athens Campus Undergraduate Tuition (Per Semester) Instructional Fee General Fee Ohio Resident Total Non-Resident Fee Out-of-State Resident Total , , , ,641 1,326 2, , ,188 1,768 3, , ,735 2,210 4, , ,282 2,652 5, , ,829 3,094 6, , ,376 3,536 7, , ,923 3,978 8, , ,470 4,420 9, , ,470 4,420 9, * 5, ,774 4,482 10,256 *Beyond 20 Hours: Resident Fee is $271/hr and Non-Resident Fee is $502/hr
270 FY 2019 Tuition Schedule - Non-Guarantee Students Athens Campus Undergraduate Tuition (Per Semester) Credit Hours Instructional Fee General Fee Ohio Resident Total Non-Resident Fee Out-of-State Resident Total , , ,497 1,326 2, , ,996 1,768 3, , ,495 2,210 4, , ,994 2,652 5, , ,493 3,094 6, , ,992 3,536 7, , ,491 3,978 8, , ,990 4,420 9, , ,990 4,420 9, * 4, ,268 4,482 9,750 *Beyond 20 Hours: Resident Fee is $247/hr and Non-Resident Fee is $478/hr
271 Credit Hours FY 2019 Tuition Schedule - Regional Guarantee Students Regional Campus Undergraduate Tuition (Per Semester) Instructional Fee General Fee Ohio Resident Total Non-Resident Fee Out-of-State Resident Total Career & Experiential Learning Fee , , , , , , , , , , , , ,928 1,088 3, , ,169 1,224 3, , ,410 1,360 3, , ,537 1,496 4, * 2, ,673 1,496 4, **Beyond 20 Hours: Resident Fee is $135/hr. and Non-Resident Fee is $194/hr. FY 2019 Tuition Schedules - Regional Non-Guarantee Students Regional Campus Undergraduate Tuition (Per Semester) Regional Campus Undergraduate Tuition** Chillicothe, Lancaster, Zanesville Campuses Lower Division (60 Semester Hours or Less) Per Semester Regional Campus Undergraduate Tuition Eastern and Southern Campuses Lower Division (60 Semester Hours or Less) Per Semester Credit Hours Instructional Fee General Fee Ohio Resident Total Non-Resident Fee Out-of-State Resident Total Credit Hours Instructional Fee General Fee Ohio Resident Total Non-Resident Fee Out-of-State Resident Total , , , , , , , , , , ,362 1,134 2, , , , , ,589 1,323 2, , , , , ,816 1,512 3, , , , , ,043 1,701 3, , , , , ,270 1,890 4, , , , , ,270 2,079 4, , , , * 2, ,497 2,268 4, * 2, , ,326 *Beyond 20 Hours: Resident Fee is $122/hr and Non-Resident Fee is $181/hr *Beyond 20 Hours: Resident Fee is $122/hr and Non-Resident Fee is $181/hr **Zanesville Campus students are charged an $8 Security Fee Regional Campus Undergraduate Tuition** Chillicothe, Lancaster, Zanesville Campuses Upper Division (More than 60 Semester Hours) Per Semester Regional Campus Undergraduate Tuition Eastern and Southern Campuses Upper Division (More than 60 Semester Hours) Per Semester Credit Hours Instructional Fee General Fee Ohio Resident Total Non-Resident Fee Out-of-State Resident Total Credit Hours Instructional Fee General Fee Ohio Resident Total Non-Resident Fee Out-of-State Resident Total , , , , , , , , , , ,356 1,134 2, , , , , ,582 1,323 2, , , , , ,808 1,512 3, , , , , ,034 1,701 3, , , , , ,260 1,890 4, , , , , ,483 2,079 4, , , , * 2, ,518 2,268 4, * 2, , ,441 *Beyond 20 Hours: Resident Fee is $122/hr and Non-Resident Fee is $181/hr *Beyond 20 Hours: Resident Fee is $122/hr and Non-Resident Fee is $181/hr **Zanesville Campus students are charged an $8 Security Fee
272 Regional Campus Graduate Tuition** All Regional Campuses Per Semester Credit Hours Instructional Fee General Fee Ohio Resident Total Non-Resident Fee Out-of-State Resident Total , , , , , , , , , , , , , , , , , , , , , * 4, , ,292 *Beyond 18 Hours: Resident Fee is $334/hr and Non-Resident Fee is $628/hr **Zanesville Campus students are charged an $8 Security Fee
273 Credit Hours Instructional Fee Athens Campus Graduate Tuition Per Semester General Fee Ohio Resident Total Non-Resident Fee Out-of-State Resident Total , , , , , ,749 1,488 3, , ,332 1,984 4, , ,915 2,480 5, , ,498 2,976 6, , ,081 3,472 7, , ,664 3,968 8, * 4, ,722 3,996 8,718 *Beyond 18 Hours: Resident Fee is $334/hr and Non-Resident Fee is $628/hr Credit Hours Instructional Fee Medical Student Tuition Per Semester General Fee Ohio Resident Total Non-Resident Fee Out-of-State Resident Total , , , , , , , ,716 1,116 3, , ,395 1,395 4, , ,074 1,674 5, , ,753 1,953 6, , ,432 2,232 7,664 9 and above 17, ,367 7,554 25,921 Academic Program Instructional Fee General Fee elearning Per Credit Hour Program Fee Special Svcs/Materials Fee Ohio Resident Total Non-Resident Fee Out-of-State Resident Total ecampus Undergraduate Programs* BSTOM Program ETM Courses Correctional Education *Includes Online RN-to-BSN Program, Online Bachelor Completion Program, Correspondence, Independent Study, Course Credit by Exam
274 Instructional General Program Special Svcs/ Ohio Non-Resident Out-of-State Program Fee Fee Fee Materials Fee Resident Total Fee Resident Total Off-Campus Graduate Programs - Standard Rate**** College of Arts and Sciences Masters of Financial Economics - Athens* ,179 Masters of Financial Economics - Online Masters of Financial Economics - Pickerington Master of Social Science Master of Arts in English College of Business Academic Professional MBA* MBA Online , ,047 Full-time MBA* ,252 Professional Masters of Sport Administration Master of Sports Administration* ,179 Dual MBA/Master of Sports Administration* ,179 Masters in Athletic Administration Professional Masters of Accountancy , ,096 Online Masters of Accountancy , ,194 Full-time Masters of Accountancy ,179 Online Masters of Analytics , ,194 Professional Masters of Management Online Masters of Management , ,042 College of Business Graduate Certificates College of Health Science & Professions Masters of Science in Nursing Online (ED/Admin Track) Masters of Science in Nursing Online (FNP Track) Masters of Science in Nursing Hybrid (ED/Admin Track)* ,093 Masters of Science in Nursing Hybrid (FNP Track)* ,146 Masters in Health Administration Masters of Physician Assistant Practice Doctor of Physical Therapy* ,131 Dietetics Internship Masters Program* ,094 Masters of Arts Speech- Language Pathology ,116 Doctor of Clinical Audiology ,116 Doctor of Nursing Practice BSN to DNP ,169 Doctor of Nursing Practice MSN to DNP ,209 Masters of Global Health (MGH) Blended ,179 Online Masters of Global Health (OMGH) Patton College of Education Early Child Generalist Endorsement Certificate (4th/5th) Masters in Coaching Education Masters in Coaching Education - Soccer Reading Endorsement Master of Counselor Education Masters in Special Education Higher Education PhD Masters in Higher Education Instructional Design Certificate Masters in Educational Administration Teacher Leadership Endorsement Graduate Workshop Online Education Public Policy Leadership Certificate Russ College of Engineering Masters in Engineering Management Masters in Electrical Engineering Masters in Civil Engineering Scripps College of Communications Masters of Information and Telecommunication Systems Master of Communication Studies Voinovich School of Leadership and Public Affairs Master of Public Administration Master of Public Administration - Online *Athens Graduate comprehensive rate applies for 9-18 credit hours. Off-Campus Graduate Programs Per Credit Hour Master of Financial Economics - Athens reflects reduced Program Fee of $100, as proposed to the Board of Trustees in June 2018.
275 Technology Fee Schedule (Per Semester) Credit Hours Student Info System/Network Fee* College of Arts & Sciences College of Business UNDERGRADUATE STUDENTS Scripps College of Communication Patton College of Education Russ College of Engineering and Technology College of Fine Arts College of Health Sciences & Professions Credit Hours Student Info System/Network Fee* College of Arts & Sciences College of Business Scripps College of Communication GRADUATE STUDENTS Patton College of Education Russ College of Engineering and Technology College of Fine Arts College of Health Sciences & Professions Voinivich School Heritage College of Osteopathic Medicine Regional campus students are not charged college technology fees for regional campus classes *All students are charged for the Student Info System/Network Fee
276 Athens Campus Residence & Dining Hall Rate Schedule Room Rates (Per Semester) Non-Guarantee OHIO Guarantee OHIO Guarantee OHIO Guarantee OHIO Guarantee Students Cohort Cohort Cohort Cohort Single 3,844 3,911 4,048 4,190 4,337 Renovated Single & Suite Single 4,095 4,167 4,313 4,464 4,620 Standard Double 3,131 3,185 3,296 3,411 3,530 Renovated Double 3,336 3,394 3,513 3,636 3,763 Multi-Occupancy 2,921 2,972 3,076 3,184 3,295 Renovated Multi-Occupancy 3,112 3,166 3,277 3,392 3,511 Suite Double & Triples 3,550 3,612 3,738 3,869 4,004 Residential Meal Plans (Per Semester) Non-Guarantee OHIO Guarantee OHIO Guarantee OHIO Guarantee OHIO Guarantee Students Cohort Cohort Cohort Cohort Meal Plan* 1,809 1,818 1,854 1,891 1, Meal Plan 2,094 2,104 2,146 2,189 2, Meal Plan 2,236 2,247 2,292 2,338 2, Meal Plan - Flex 2,768 2,782 2,838 2,895 2, Meal Plan - Flex 3,088 3,103 3,165 3,228 3,293 Off-Campus Meal Plans (Per Semester) Non-Guarantee OHIO Guarantee OHIO Guarantee OHIO Guarantee OHIO Guarantee Students Cohort Cohort Cohort Cohort Block Block Block Block 45 Plus Destination Dining

277 18.3 Budget Process Timeline
Budget Book
 Budget Book 2017-2018 Table of Contents 1 Executive Summary... 5 2 FY18 Budget... 15 Consolidated University Budget (All Funds)... 15 Budget Columns (All Funds)... 16 Summary of Revenue Sources... 19
Budget Planning Council Meeting Agenda August 30, :00am 1:00 pm Baker Center ~ Multicultural Center Room 219
 Budget Planning Council Meeting Agenda August 30, 2018 11:00am 1:00 pm Baker Center ~ Multicultural Center Room 219 Meeting Objectives Provide members with an overview of the: o Role of BPC in the Ohio
UW-Platteville Pioneer Budget Model
 UW-Platteville Pioneer Budget Model This document is intended to provide a comprehensive overview of the UW-Platteville s budget model. Specifically, this document will cover the following topics: Model
Presented to the Board of Trustees
 Presented to the Board of Trustees 0 July 5, 2016 CSPP Budget Decision-Making Principles & Process The budget planning and development will be guided by the following Board of Trustees approved resource
Financial Reporting. University Senate January 22, 2016
 Financial Reporting University Senate January 22, 2016 J. Michael Gower Executive Vice President for Finance & Administration and University Treasurer Financial Statements vs. University Budget The annual
A New Academic Business Model for UMass Dartmouth
 Resourcing the Mission A New Academic Business Model for UMass Dartmouth Budgetary Planning Council 2016 Public Higher Ed in the 21 st C The situation The social compact has been compromised Resulting
FY2018 Operating Budget
 FY2018 Operating Budget SUMMARY OF PROPOSAL The Board of Trustees is charged with reviewing and approving the university s annual operating budget. The budget supports the educational, research, and outreach
Cleveland State University (a component unit of the State of Ohio) Financial Report with Supplemental Information June 30, 2018
 Financial Report with Supplemental Information June 30, 2018") Cleveland State University (a component unit of the State of Ohio) Financial Report with Supplemental Information June 30, 2018 Contents Independent Auditor s Report 1-3 Management s Discussion and Analysis
Cleveland State University (a component unit of the State of Ohio) Financial Report with Supplemental Information June 30, 2018 Contents Independent Auditor s Report 1-3 Management s Discussion and Analysis
BGSU FY 2018 Proposed Budgets
 Office of Finance & Administration June 2017 BGSU FY 2018 Proposed Budgets BGSU FY 2018 Proposed Budgets Educational & General Budgets (Bowling Green & Firelands Campus) General & Related Auxiliary Budgets
APPENDIX FACULTY OF ARTS AND SCIENCES MANAGERIAL FINANCIAL REPORT FISCAL YEAR 2015 HARVARD UNIVERSITY
 APPENDIX FACULTY OF ARTS AND SCIENCES MANAGERIAL FINANCIAL REPORT FISCAL YEAR 2015 HARVARD UNIVERSITY (in millions) Faculty of Arts and Sciences Consolidated Statement of Activity Fiscal Year Ending June
Dean s RCM Workshops January 2015
 Dean s RCM Workshops January 2015 Agenda General overview of RCM Overview of the model and college budget composition Education s view of RCM Engineering s view of RCM Group Activity: Scenarios 2 General
Cleveland State University (a component unit of the State of Ohio) Financial Report Including Supplemental Information June 30, 2017
 Financial Report Including Supplemental Information June 30, 2017") Cleveland State University (a component unit of the State of Ohio) Financial Report Including Supplemental Information June 30, 2017 Contents Report of Independent Auditors 1-3 Management s Discussion
Cleveland State University (a component unit of the State of Ohio) Financial Report Including Supplemental Information June 30, 2017 Contents Report of Independent Auditors 1-3 Management s Discussion
2/22/2019. Understanding the University Budget Kelley Westhoff Executive Director for Budget, Planning, & Analysis. Agenda
 Understanding the University Budget Kelley Westhoff Executive Director for Budget, Planning, & Analysis March 6, 2019 Agenda $ The Washington State Budget & Higher Education Sector $ Budget Models $ The
EASTERN WASHINGTON UNIVERSITY BUDGET PRIMER
 EASTERN WASHINGTON UNIVERSITY BUDGET PRIMER STATE BIENNIAL BUDGET CYCLE OFM issues budget instructions EVEN YEARS JUN EWU BIENNIAL BUDGET CYCLE ONGOING Agency Strategic Planning Agencies submit budget
Budget Planning Council Meeting Agenda September 20, :00am 1:00 pm Baker Center ~ Room 230
 Budget Planning Council Meeting Agenda September 20, 2018 11:00am 1:00 pm Baker Center ~ Room 230 Meeting Objectives Provide members with an overview of the following: o FY20 Budget Timeline o OHIO Budget
Table of Contents...1. Letter to the President...3. Financial Highlights Balance Sheet...8, 9. Statement of Changes in Fund Balances...
 ANNUAL FINANCIAL REPORT 1 T ABLE OF CONTENTS Table of Contents...1 Letter to the President...3 Financial Highlights...4-7 Balance Sheet...8, 9 Statement of Changes in Fund Balances...10 Statement of Current
APPENDIX FACULTY OF ARTS AND SCIENCES MANAGERIAL FINANCIAL REPORT FISCAL YEAR 2013 HARVARD UNIVERSITY
 APPENDIX FACULTY OF ARTS AND SCIENCES MANAGERIAL FINANCIAL REPORT FISCAL YEAR 2013 HARVARD UNIVERSITY (in millions) Faculty of Arts and Sciences Consolidated Statement of Activity Fiscal Year Ending June
University of Houston Student Leadership Forum Budget and Legislative Processes
 University of Houston Student Leadership Forum Budget and Legislative Processes June 13, 2012 Overview of the Planning and Budget Process 2 Multiple Cycles January 2012 February 2012 March 2012 April 2012
PROPOSED FY 2017 EDUCATIONAL & GENERAL BUDGETS
 PROPOSED FY 2017 EDUCATIONAL & GENERAL BUDGETS Proposed to Board of Trustees Prepared by the Office of Finance and Administration June 23, 2016 TABLE OF CONTENTS Page No. Bowling Green Campus Income &
Joseph Trubacz Senior Vice President for Finance and Administration
 TO: FROM: Board of Trustees Joseph Trubacz Senior Vice President for Finance and Administration DATE: May 21, 2011 SUBJECT: FY 2013 Budget I. BACKGROUND INFORMATION Fiscal Year 2013 Operating Budget Summary
PROPOSED FY 2018 EDUCATIONAL & GENERAL BUDGETS
 PROPOSED FY 2018 EDUCATIONAL & GENERAL BUDGETS Proposed to Board of Trustees Prepared by the Office of Finance and Administration June 2017 TABLE OF CONTENTS Page No. Bowling Green Campus Income & Expenditure
BGSU FY P ropose ed Bu dgets
 Office of Finance & Administration June 2013 BGSU FY 20 014 P ropose ed Bu dgets BGSU FY 2014 Proposed Budgets Educational & General Budgets (Bowling Green & Firelands Campus) General Fee & Related Auxiliary
Frequently Asked Questions (FAQs) about NKU s New Budget Model
 about NKU s New Budget Model") Frequently Asked Questions (FAQs) about NKU s New Budget Model Philosophy and guiding principles Why did NKU need a new budget model? Internal and external factors pointed to the need for a more flexible,
Frequently Asked Questions (FAQs) about NKU s New Budget Model Philosophy and guiding principles Why did NKU need a new budget model? Internal and external factors pointed to the need for a more flexible,
Budget Document FY
 Budget Document FY 2017 2018 THE UNIVERSITY of TENNESSEE Chattanooga Knoxville Space Institute Martin Health Science Center Institute of Agriculture Agricultural Experiment Station Extension College of
DRAFT August 2, Overview of OSU New Education and General (or Shared Responsibility) Budget Model Academic Colleges Focus
 Budget Model Academic Colleges Focus") Overview of OSU New Education and General (or Shared Responsibility) Budget Model Academic Colleges Focus OSU-Corvallis is implementing a new budget model with the FY18 E&G budget. The model was used to
Overview of OSU New Education and General (or Shared Responsibility) Budget Model Academic Colleges Focus OSU-Corvallis is implementing a new budget model with the FY18 E&G budget. The model was used to
New Campus Budget Model
 New Campus Budget Model Moving to an All Funds Model May 25, 2016 Presented By: Nancy Warter-Perez Chair of the Academic Senate Peter McAllister Dean, College of Arts and Letters Lisa Chavez Vice President
Multi-Year Financial Analysis FY2015 FY2019. November 2013
 Multi-Year Financial Analysis FY2015 FY2019 November 2013 University of Maine System Multi Year Financial Analysis Fiscal Years 2015 to 2019 Table of Contents I. Introduction... 2 II. Developing the Multi
Proposed Budget Document FY
 Proposed Budget Document FY 2018-19 THE UNIVERSITY of TENNESSEE Chattanooga Knoxville Space Institute Martin Health Science Center Institute of Agriculture Agricultural Experiment Station Tennessee Extension
In fiscal year (FY) , the general fund base budgets by department were as follows:
 , the general fund base budgets by department were as follows:") 1.6 Fiscal Resources. The school shall have financial resources adequate to fulfill its stated mission and goals, and its instructional, research and service objectives. a. Description of the budgetary
1.6 Fiscal Resources. The school shall have financial resources adequate to fulfill its stated mission and goals, and its instructional, research and service objectives. a. Description of the budgetary
For Yale Faculty, Staff, and Students only
 For Yale Faculty, Staff, and Students only Budget Book Fiscal Year 2017 Cover photo: Brandon Boyer YC 15 Analyst, Office of Financial Planning & Analysis, Yale University FY17 Operating and Capital Budget
OVERVIEW OF FINANCIAL ACTIVITIES UNIVERSITY AT BUFFALO THE STATE UNIVERSITY OF NEW YORK Financial Overview 0
 2012-2013 OVERVIEW OF FINANCIAL ACTIVITIES UNIVERSITY AT BUFFALO THE STATE UNIVERSITY OF NEW YORK 2013 Financial Overview 0 Introduction... 2 Overview... 3 Core Operating Activities Financial Highlights...
I. Background. Budget Advisory Council
 Office of the Vice President for Finance & Business Operations 330.941.1331 Fax 330.941.1380 University Budget Process Updated 1/17/18 I. Background Youngstown State University s annual operating budget
Resource Allocation, Management, and Planning Steering Committee #7
 Resource Allocation, Management, and Planning Steering #7 August 28, 2018 1 Agenda Huron is pleased to partner with WKU on this resource allocation, management, and planning ( RAMP ) initiative. Our goals
Office of Finance & Administration. June BGS SU FY Pr ropo osed Budgets. Educational & General Budgets (Bowling Green & Firelands Campus)
") Office of Finance & Administration June 2012 BGS SU FY 20 13 Pr ropo osed Budgets BGSU FY 2013 Proposed Budgets Educational & General Budgets (Bowling Green & Firelands Campus) General Fee & Related Auxiliary
Office of Finance & Administration June 2012 BGS SU FY 20 13 Pr ropo osed Budgets BGSU FY 2013 Proposed Budgets Educational & General Budgets (Bowling Green & Firelands Campus) General Fee & Related Auxiliary
UNTHSC. Annual Budget Development Process Fiscal Year 2019 Guidelines & Instructions - Spring 2018
 UNTHSC Annual Budget Development Process Fiscal Year 2019 Guidelines & Instructions - Spring 2018 INTRODUCTION: The budgeting process at the University of North Texas Health Science Center (UNTHSC) assigns
What is Responsibility Centered Management?
 Jim Florian Associate Vice President, Institutional Analysis Office of the Provost What is Responsibility Centered Management? Budget model that links budgets to activity Allocates revenues based on activity
How Much Does It Cost?
 How Much Does It Cost? Eileen G. McLoughlin, Assistant Vice President of Finance and Budgeting, Rensselaer Polytechnic Institute Charles Tegen, Associate Vice President for Finance and Comptroller, Clemson
Financial Management Guidelines and Procedures
 The financial position and future of the Colorado School of Mines is dependent on several variables including enrollment, research growth, changes in industry demand, and competing institutions at the
Review Fiscal Year 2018 Operating Budget Planning UM. The Board s touchpoints in this process are detailed below:
 Review Fiscal Year 2018 Operating Budget Planning UM A budget update discussing FY17 budget execution including withholds and FY18 budget development was presented to the Board as an information item at
USF System Annual Strategic Budget Planning Process
 USF System Annual Strategic Budget Planning Process University budget strategy, planning and development should be led by the Provost to assure that the budget reflects USF s strategic priorities The President
MISSISSIPPI DELTA COMMUNITY COLLEGE Management s Discussion and Analysis
 Overview of the Financial Statements The College=s financial report consists of two sections - Management=s Discussion and Analysis, which is required supplementary information (this section), and the
ALL FUNDS OPERATING BUDGET FY2016. Institutional Budget Document Page 1
 ALL FUNDS OPERATING BUDGET FY2016 Institutional Budget Document Page 1 Table of Contents Introduction... 3 Budget Highlights... 4 General Fund Changes... 4 Tuition & Fees Rate Increase %... 4 Enrollments...
Approval of Fiscal Year 2019 Operating Budget UM
 Approval of Fiscal Year 2019 Operating Budget UM The Board will review the Fiscal Year 2019 University of Missouri System budget for approval at the meeting. The FY 19 all funds revenue budget is $3.2
Cleveland State University (a component unit of the State of Ohio) Financial Report Including Supplemental Information June 30, 2015
 Financial Report Including Supplemental Information June 30, 2015") Cleveland State University (a component unit of the State of Ohio) Financial Report Including Supplemental Information June 30, 2015 Contents Report of Independent Auditors 1-3 Management s Discussion
Cleveland State University (a component unit of the State of Ohio) Financial Report Including Supplemental Information June 30, 2015 Contents Report of Independent Auditors 1-3 Management s Discussion
Presentation to the UH Faculty Senate. University of Houston FY 2016 Budget For current information see
 Presentation to the UH Faculty Senate University of Houston FY 2016 Budget For current information see http://www.uh.edu/af/budget/index.htm 1 Contents Background and Process Slides 3-12 Budget Topic:
Five-year Financial Plan Orientation
 Five-year Financial Plan Orientation Agenda Budget Overview Five-year Financial Plan Initiative Budget Overview Financing the Future The Financial Challenge Ahead Operating budget history Projects for
FY2015 UNIFIED OPERATING BUDGET & STUDENT CHARGES May 2014 REVISED MW114(855) 5/19/14
 5/19/14") FY2015 UNIFIED OPERATING BUDGET & STUDENT CHARGES May 2014 REVISED MW114(855) 5/19/14 Table of Contents Budget Overview... 3 Appropriation... 4 Maine Economic Improvement Fund Student Charges 6 Enrollment
FY2015 UNIFIED OPERATING BUDGET & STUDENT CHARGES May 2014 REVISED MW114(855) 5/19/14 Table of Contents Budget Overview... 3 Appropriation... 4 Maine Economic Improvement Fund Student Charges 6 Enrollment
LEHIGH University. Financial Planning Report With Budget
 LEHIGH University Financial Planning Report With 2012-2013 Budget L E H I G H U N I V E R S I T Y 2 0 1 2-1 3 B U D G E T ------------------------- T A B L E O F C O N T E N T S PAGE I. COMMENTARY 1-9
FINANCIAL SYSTEM ENHANCEMENTS ACCOUNTING WITH THE NEW COA
 FINANCIAL SYSTEM ENHANCEMENTS ACCOUNTING WITH THE NEW COA 1 AGENDA Foundation & Endowment Accounting Accounting for Revenue Revenue and Expense Allocations Student Orgs Funding & Accounting How to charge
Following the Money Trail From Austin to College Station
 Following the Money Trail From Austin to College Station Understanding Higher Education Finance and the Role of the Texas Legislature Deborah Wright Assistant Vice President, Budget and Planning Contents
This budget is the first to incorporate our university community s shared goals as expressed in our new strategic plan, Building on Excellence.
 Office of the President San Diego State University 5500 Campanile Drive San Diego, CA 92182 8000 Tel: 619 594 5201 Fax: 619 594 8894 September 30, 2014 Members of the university community: San Diego State
CSUF CALIFORNIA STATE UNIVERSITY, FULLERTON
 CSUF CALIFORNIA STATE UNIVERSITY, FULLERTON Budget Report Fiscal Year 2014-2015 Table of Contents I. Foreword II. University Resources a. Fiscal Year Budget 1 b. Highlights: 2014-15 Operating Fund Budget
The Stanford University Budget Plan
 i The Stanford University Budget Plan 2000/01 Submitted for Action to the Board of Trustees June 8-9, 2000 This publication can also be found on the World Wide Web at: http://www.stanford.edu/dept/pres-provost/budget/plans/plan01.html
DEANS, VICE CHANCELLORS, UNIVERSITY LIBRARIAN, ATHLETIC DIRECTOR AND CHIEF INFORMATION OFFICER
 DEANS, VICE CHANCELLORS, UNIVERSITY LIBRARIAN, ATHLETIC DIRECTOR AND CHIEF INFORMATION OFFICER Re: Dear Colleagues, The budget planning process for 2019-20 marks a point of inflection for our financial
CENTRAL STATE UNIVERSITY Wilberforce, Ohio. FINANCIAL STATEMENTS June 30, 2017 and 2016
 Wilberforce, Ohio FINANCIAL STATEMENTS Wilberforce, Ohio FINANCIAL STATEMENTS CONTENTS INDEPENDENT AUDITOR S REPORT... 1 MANAGEMENT S DISCUSSION AND ANALYSIS (UNAUDITED)... 3 FINANCIAL STATEMENTS STATEMENTS
UH-Clear Lake Budget
 FY2016 Total Budget $ Millions Operating Budget $ 131.5 Capital Facilities 23.1 Total $ 154.6 Operating Budget Source of Funds Other Operating, $2.0M 2% Tuition & Fees $71.1M 54% Contracts & Grants *,
SAN JOSE STATE UNIVERSITY. Financial Statements. June 30, (With Independent Auditors Report Thereon)
") Financial Statements (With Independent Auditors Report Thereon) Table of Contents Page Independent Auditors Report 1 Management s Discussion and Analysis 3 Financial Statements: Statement of Net Assets
Financial Statements (With Independent Auditors Report Thereon) Table of Contents Page Independent Auditors Report 1 Management s Discussion and Analysis 3 Financial Statements: Statement of Net Assets
Five-Year Financial Plan (FY2019 FY 2023) 02/23/18
 02/23/18") Five-Year Financial Plan (FY2019 FY 2023) 02/23/18 Renewing Our Vow to the Commonwealth Six years ago, we committed to a bold vision for UK- rebuild our campus, grow funds, support faculty and staff, and
Five-Year Financial Plan (FY2019 FY 2023) 02/23/18 Renewing Our Vow to the Commonwealth Six years ago, we committed to a bold vision for UK- rebuild our campus, grow funds, support faculty and staff, and
FINANCIAL SYSTEM ENHANCEMENTS CHART OF ACCOUNTS FUNDAMENTALS
 FINANCIAL SYSTEM ENHANCEMENTS CHART OF ACCOUNTS FUNDAMENTALS Please select the interactive polling option you would like to use. From your laptop: Navigate to PollEv.com/chartofaccou508 From your cell:
RCM Review. Responsibility Centered Management Review September Budget Planning & Resource Analysis
 RCM Review Responsibility Centered Management Review September 2011 Budget Planning & Resource Analysis What is RCM and RCB? RCM is Responsibility Centered Management RCB is Responsibility Centered Budgeting
General Budget Terminology
 Presentation FY 2018-19 Operating Title Budget Subtitle June 22, 2018 2 General Budget Terminology Current Funds Budget The current funds budget includes those economic resources of the institution which
FY 2018 Budget Overview
 Page 11 of 48 Budget Overview With our Charter as the guiding principle, Arizona State University continues to thrive and make progress toward the challenging goals set by the Arizona Board of Regents.
ALL FUNDS OPERATING BUDGET FY2017. Institutional Budget Document Page 1
 ALL FUNDS OPERATING BUDGET FY2017 Institutional Budget Document Page 1 Table of Contents Introduction... 3 Budget Highlights... 4 General Fund Changes... 4 Tuition & Fees Rate Increase %... 4 Enrollments...
An Overview: Responsibility Center Management (RCM) Treasurer s Town Hall January 15, 2015
 Treasurer s Town Hall January 15, 2015") An Overview: Responsibility Center Management (RCM) Treasurer s Town Hall January 15, 2015 Common University Budget Models EVERY TUB ON ITS OWN BOTTOM INCREMENTAL FORMULA-BASED RESPONSIBILITY CENTER MANAGEMENT
An Overview: Responsibility Center Management (RCM) Treasurer s Town Hall January 15, 2015 Common University Budget Models EVERY TUB ON ITS OWN BOTTOM INCREMENTAL FORMULA-BASED RESPONSIBILITY CENTER MANAGEMENT
Erica Bowers, Ed.D. Chair, Planning, Resource, and Budget Committee (PRBC)
") MEMORANDUM Date: May 5, 2016 To: From: Mildred García, Ed.D. University President Erica Bowers, Ed.D. Chair, Planning, Resource, and Budget Committee (PRBC) Subject: PRBC Recommendations for FY 2016-17
MEMORANDUM Date: May 5, 2016 To: From: Mildred García, Ed.D. University President Erica Bowers, Ed.D. Chair, Planning, Resource, and Budget Committee (PRBC) Subject: PRBC Recommendations for FY 2016-17
UNIVERSITY of MISSOURI SYSTEM
 The UNIVERSITY of MISSOURI SYSTEM! Kansas City! Columbia! St. Louis! Rolla Fiscal Year 2002 Operating Budget UNIVERSITY OF MISSOURI SYSTEM OPERATING BUDGET Fiscal Year 2001-2002! Kansas City! Columbia!
Highlights financial report. June 30 June (in thousands)
") Highlights FINANCIAL (in thousands) June 30 June 30 2000 1999 Total revenues $1,680,943 $1,367,175 Total cash gifts and equipment gifts $220,642 $211,215 Capital expenditures $118,799 $94,896 Total assets
Highlights FINANCIAL (in thousands) June 30 June 30 2000 1999 Total revenues $1,680,943 $1,367,175 Total cash gifts and equipment gifts $220,642 $211,215 Capital expenditures $118,799 $94,896 Total assets
Office of the Provost University of Illinois at Urbana-Champaign. 3 February 2016
 Office of the Provost University of Illinois at Urbana-Champaign BUDGET REPORT GUIDANCE FOR FY17: CTE, DRES, I 3, KAM, KCPA, SPURLOCK, UNIVERSITY LIBRARY, LAW LIBRARY 3 February 2016 The campus finds itself
Budget Model Assessment
 Budget Model Assessment An Update on the Activities of the Joint Task Force on Resource Allocation Co-chairs: Elizabeth Chilton and Tim Anderson January 30 th, 2014 JTFRA Charge The Joint Task Force on
University Cabinet Outline of Budget Reduction Decisions February 22, 2018
 Priorities in Budget Planning Student success Equity and diversity Fiscal stability and good stewardship of resources Shared responsibility and accountability Values (These are summarized from the Values
June 18, 2018 Lansing Community College Fiscal Year 2019 Proposed Budget Narrative. Introduction
 June 18, 2018 Lansing Community College Fiscal Year 2019 Proposed Narrative Introduction The FY2019 process started in December 2017 when the Financial Services division invited all college employees to
Technical Notes for the Shared Responsibility Budget Model, ver for Oregon State University, Corvallis Campus Education and General Budget
 Technical Notes for the Shared Responsibility Budget Model, ver. 19.8 for Oregon State University, Corvallis Campus Education and General Budget August 8, 2018 Overview The goals of this shared responsibility
Attachment 1 ASSUMPTIONS FOR A MULTI-YEAR BUDGET MODEL
 ASSUMPTIONS FOR A MULTI-YEAR BUDGET MODEL UC projects that by 2015-16 it will face a shortfall of $2.5 billion in funding needed to support its core operations, barring any actions to reduce costs or raise
The Art and Science of Multi-Year Planning
 The Art and Science of Multi-Year Planning Bethany Pugh Managing Director PFM Financial Advisors LLC www.pfm.com Kevin Kuhar Senior Solutions Consultant PFM Solutions LLC www.whitebrichsoftware.com 1/31
Planning and Budgeting for. Assistant Vice President, Budget and Planning
 Planning and Budgeting for 2012-2013 2013 Deborah Wright Assistant Vice President, Budget and Planning Contents State of Texas Budgeting Higher Education Funding in Texas Texas A&M University Budget Budget
Fiscal Year 2019 Annual Operating Budget Executive Summary
 EXECUTIVE SUMMARY Fiscal Year 2019 Annual Operating Budget Executive Summary The University of Illinois System s consolidated Fiscal Year 2019 (FY19) budget recommendation is the culmination of a two year
BGSU FY 2019 Proposed Budgets BGSU FY 2019 Proposed Budgets
 Office of Finance & Administration June 2018 BGSU FY 2019 Proposed Budgets BGSU FY 2019 Proposed Budgets Educational & General Budgets (Bowling Green & Firelands Campus) General Fee & Related Auxiliary
Financial Operating. & Capital Plan Reviews FY Budget Forum. February 14, FY 2014 Budget Forum - February
 Financial Operating & Capital Plan Reviews FY 2014 Budget Forum February 14, 2013 FY 2014 Budget Forum - February 2013 0 University Budget Council (UBC) Bob Warren, Chair VP Administration & Finance Dennis
Table of Contents. Executive Summary... Overview...
 Table of Contents Executive Summary... Overview... iii 1 Delegation of Authority to the Administration... Summary Revenue and Expense by Program... Summary Revenue and Expense by Account... Operating Resources
Message from the Chief Financial Officer
 Financial Report For the Year Ended June 30, 2003 Message from the Chief Financial Officer Founded in 1881, the University of Connecticut serves as the state s flagship for higher education, meeting the
Recommended Budget Assumptions and Projections for FY
 . Recommended Budget Assumptions and Projections for FY 2014-2015 The recommended operating budget projections and related assumptions for FY 2014-2015 were developed with input and recommendations from
Financial Report to the Board of Trustees
 Financial Report to the Board of Trustees February 28, 2012 FY11 Closeout and FY12 Six Month Update University of Connecticut Health Center FY11 Closeout 2 University of Connecticut Health Center FY 2011
The UNIVERSITY of MISSOURI SYSTEM. Fiscal Year Operating Budget
 The UNIVERSITY of MISSOURI SYSTEM Fiscal Year 2013 Operating Budget UNIVERSITY OF MISSOURI SYSTEM OPERATING BUDGET FISCAL YEAR 2013 Office of Planning and Budget 118 University Hall Columbia, Missouri
Table of Contents. Executive Summary... Overview...
 Table of Contents Executive Summary... Overview... iii 1 Delegation of Authority to the Administration... Summary Revenue and Expense by Program... Summary Revenue and Expense by Account... Operating Resources
EXECUTIVE SUMMARY. Performance Fund* 4,414,100 Total $74,448,900
 EXECUTIVE SUMMARY House Bill 200, the Executive Branch Budget, was passed by the 2018 Regular Session of the Kentucky General Assembly and provides a state expenditure plan for the 2018-20 biennium. The
Budget Model Refinement Discussion. October 2018
 Budget Model Refinement Discussion October 2018 1 Agenda 1. Budget Model Refinement Schedule 2. Opportunities for Refinement Significant Financial Challenges/Issues Overall Policy Issues Budget Model Formula
Campus Budget Reform September 2018 O F F I C E O F T H E P R O V O S T
 Campus Budget Reform September 2018 O F F I C E O F T H E P R O V O S T Outline Fall: Update on Campus Budget Reform Campus budget overview Budget reform Spring: Planning your Department s Budget Budget
2014 Planning & Budgeting Forum
 2014 Planning & Budgeting Forum The Accounting of RCM September 23, 2014 Denver, CO Conference Session Speakers Name Title Contact Details Andrew L. Laws Managing Director (session facilitator) Huron Consulting
UNIVERSITY OF CALIFORNIA, BERKELEY. Annual Financial Report
 UNIVERSITY OF CALIFORNIA, BERKELEY Annual Financial Report 2008-09 TABLE OF CONTENTS Management's Discussion and Analysis 1 Financial Statements: Statements of Net Assets at June 30, 2009 and 2008 11 Statements
UTSA FY 2018 Budget 101 Presentation Foundational
 UTSA FY 2018 Budget 101 Presentation Foundational Kathryn Funk-Baxter, Vice President for www.utsa.edu/businessaffairs UTSA Budget Process Current budgeting process overview Overview of Revenue (sources)
CALIFORNIA POLYTECHNIC STATE UNIVERSITY, SAN LUIS OBISPO. Financial Statements. June 30, (With Independent Auditors Report Thereon)
") Financial Statements (With Independent Auditors Report Thereon) Table of Contents Page Independent Auditors Report 1 Management s Discussion and Analysis 3 Financial Statements: Statement of Net Assets
Financial Statements (With Independent Auditors Report Thereon) Table of Contents Page Independent Auditors Report 1 Management s Discussion and Analysis 3 Financial Statements: Statement of Net Assets
Budget Reform Update. Paul Ellinger, Associate Chancellor & Vice Provost Budget and Resource Planning
 Budget Reform Update Paul Ellinger, Associate Chancellor & Vice Provost Budget and Resource Planning February 2018 Outline Brief budget model overview Communication plan Principles Major components Timeline
CALIFORNIA STATE UNIVERSITY, EAST BAY. Financial Statements. June 30, (With Independent Auditors Report Thereon)
") Financial Statements (With Independent Auditors Report Thereon) Table of Contents Page Independent Auditors Report 1 Management s Discussion and Analysis 3 Financial Statements: Statement of Net Assets
Financial Statements (With Independent Auditors Report Thereon) Table of Contents Page Independent Auditors Report 1 Management s Discussion and Analysis 3 Financial Statements: Statement of Net Assets
Planning and Budget Process
 Planning and Budget Process The University s planning framework, The Highest Order of Excellence II, is the framework for strategic planning at all levels of the institution. Oversight for the strategic
Budgeting for Small Schools
 Budgeting for Small Schools College Business Management Institute July 2017 Presented by Lisa Marie McCauley, Ed.D, CPA Senior Vice President for Finance Middle States Commission on Higher Education Chief
Special Budget Approval Meeting
 Board of Regents Special Budget Approval Meeting June 22, 2018 8:30 a.m. (CDT) Jody Richards Hall Cornelius A. Martin Regents Room WESTERN KENTUCKY UNIVERSITY Board of Regents ~ Special Budget Approval
FY 2016 BUDGET RUTGERS NEWARK
 RUTGERS SCHOOLS Office of Budget and Resource Studies January 29, 2016 Office of Budget and Resource Studies 33 Knightsbridge Road Piscataway, NJ 08854 budget.rutgers.edu p. 848-932-7472 f. 732-445-3579
Connecticut State University System (The System Office, Central Connecticut State University, Eastern Connecticut State University, Southern
 Connecticut State University System (The System Office, Central Connecticut State University, Eastern Connecticut State University, Southern Connecticut State University, Western Connecticut State University,
Table of Contents. Executive Summary... Overview...
 Table of Contents Executive Summary... Overview... iii 1 Delegation of Authority to the Administration... Summary Revenue and Expense by Program... Summary Revenue and Expense by Account... Operating Resources
Operating Budget FY 2009 Budget (in $M)
") Operating Budget REVENUES Tuition and Fees 671.8 Financial Aid (230.4) Grants and Contracts - (Direct and Indirect) 387.4 Endowment Distribution 272.5 Other Investment Income 48.1 Gifts and Restricted
Operating Budget REVENUES Tuition and Fees 671.8 Financial Aid (230.4) Grants and Contracts - (Direct and Indirect) 387.4 Endowment Distribution 272.5 Other Investment Income 48.1 Gifts and Restricted