Can Subjective Well-Being Predict Unemployment Length?
|
|
|
- Stewart Bryan
- 5 years ago
- Views:
Transcription

1 Public Disclosure Authorized Public Disclosure Authorized Public Disclosure Authorized Public Disclosure Authorized Policy Research Working Paper 5293 Can Subjective Well-Being Predict Unemployment Length? The World Bank Development Economics Vice Presidency Operations & Strategy Unit May 2010 Dimitris Mavridis WPS5293
2 Policy Research Working Paper 5293 Abstract This paper uses 16 waves of panel data from the British Household Panel Survey to evaluate the role of subjective well-being in determining labor market transitions. It confirms a previous finding in the literature: individuals report a fall in their happiness when they lose a job, but they report a smaller fall when they are surrounded by unemployed peers, an effect called the social norm. The main results of interest are that job search effort and unemployment duration are affected by the utility differential between having a job and being unemployed. Since this differential is also affected by the social norm, it implies that when unemployment increases, the unemployed are happier and they reduce their search effort. These results indicate that unemployment hysteresis has labor supply causes. This paper a product of the Operations & Strategy Unit, Development Economics Vice Presidency is part of a larger effort in the department to study the determinants of unemployment and labor market transitions. Policy Research Working Papers are also posted on the Web at The author may be contacted at dmavridis@worldbank.org. The Policy Research Working Paper Series disseminates the findings of work in progress to encourage the exchange of ideas about development issues. An objective of the series is to get the findings out quickly, even if the presentations are less than fully polished. The papers carry the names of the authors and should be cited accordingly. The findings, interpretations, and conclusions expressed in this paper are entirely those of the authors. They do not necessarily represent the views of the International Bank for Reconstruction and Development/World Bank and its affiliated organizations, or those of the Executive Directors of the World Bank or the governments they represent. Produced by the Research Support Team
3 Can Subjective Well-Being Predict Unemployment Duration? Dimitris Mavridis This version :May 1, 2010 Junior Professional Associate at DEC-OS, The World Bank. mavridis.dimitris@gmail.com This paper is a revised and condensed version of my master s thesis at the Paris School of Economics. I would like to thank Andrew Clark for invaluable supervision and comments. 1
4 Contents 1 Introduction 3 2 Literature Review Subjective Well-Being and Labor Market Status The Social Norm Effect of Unemployment Unemployment Duration and Subjective Well-Being Data Description 7 4 Determinants of Subjective Well-Being Labor Market Status, Age, Income, Civic Status, Education and Health The Social Norm Effect of Unemployment Theory : a binary choice model with externalities Empirical evidence : pooled data regressions Empirical evidence : results with panel data specification A note on the use of Pooled data vs Fixed Effect Pooled Data Fixed Effects Regressions : individual fixed-effects Unemployment Duration Determinants of duration Unemployment duration and well-being: how to find the causality direction? The role of social norms in duration Social norms and duration : empirical evidence from the duration model Is search intensity related to change in GHQ? Conclusion on unemployment duration Conclusion 30 7 References 31 8 Appendix Is the GHQ-12 a good measure of Well-Being? Duration model Cox Proportional Hazard Regression Results and tables
5 1 Introduction This paper aims at showing that labor supply decisions are often made taking into account other s labor supply, due to the existence of strong comparison effects. It also goes one step further in showing that job search effort is affected by comparisons with others. The dataset used is the BHPS (British Household Panel Survey). It is a representative sample of the British population, from which labor market status and a composite measure of self-reported well-being (to proxy for utility) are used. Three distinctive results are presented. First, it is shown that upon losing their job, individuals report a fall in their well-being. This fall is reduced when there are more unemployed in one s comparison group (household and region), referred to as the Social Norm Effect, as in Clark (2003). This effect persists in panel data estimations were the unobserved individual heterogeneity is controlled for. The second finding is that unemployment duration is affected by this social norm effect. The more an individual reports feeling hurt when losing his job -(the happiness difference)- the shortest will be his duration in unemployment. The happiness difference is a good predictor of the duration of unemployment, even after controlling for demographic characteristics also affecting duration. The third result shows that job search effort is itself dependent on the happiness difference. An individual searches with more intensity when he reports a large happiness drop when entering unemployment. The implications of these results are twofold. First, they shed light on our understanding of job search effort. The results suggest that search effort is positively dependent on V e V u, the difference in well-being an individual reports between being employed and jobless. As the payoff from being employed rises (falls), the unemployed will search more (less). Second, they provide a labor-supply explanation of unemployment hysteresis. Due to comparison effects, when an individual loses his job, he feels less bad if there are more unemployed around him. His utility is hence affected by other s employment status. This will reduce his search effort and increase his unemployment duration, affecting then the search behavior of others. In the case of an exogenous macroeconomic shock that reduces labor demand, our findings suggest that labor supply will also shift to the left, increasing unemployment and causing hysteresis. The remaining of the paper is organized as follows. Section II provides a review of the literature on subjective well-being (SWB henceforth) and labor market status. Section III describes the 16 waves of the BHPS. Section IV shows the first results of importance. It first presents the determinants of SWB, and then the social norm effect. Both pooled and panel data specifications are explained. Section V introduces the determinants of unemployment duration and search effort. Section VI concludes. 3
6 2 Literature Review This section reviews the literature on subjective well-being (SWB) and labor market status. It summarizes two main findings, both relevant for the present thesis. The first finding is that individuals happiness is affected by their employment status. Those who lose their job feel significantly worse than when employed, far worse than their income loss would predict 1. The second finding is that aggregate unemployment is also affecting individuals. There is a so called Social Norm effect of unemployment, through which unemployed feel less hurt the higher the unemployment is in their reference group. Unemployment also affects those who are employed, although contradictory effects are found in the literature 2. Based on these findings, this section presents the possibility that the social norm effect from unemployment might affect the search behaviour and the duration of unemployment. It then asks what policy questions arise. 2.1 Subjective Well-Being and Labor Market Status A large stream of research has been interested in the relationship between subjective wellbeing and labor market status. The social psychology literature precedes economics in this field. The idea conveyed in most of the works is that there are many non-pecuniary benefits from working. Unemployment deprives the former workers from latent functions such as social interactions, purposefulness, a time structure and a certain construction of identity (Jahoda, 1982). Hence, unemployed are worse off not just because of the loss of their wage income 3. Earlier empirical work by Jackson, Stafford and Warr (1983) shows that well-being rises with the transition from unemployment to paid work. Although the sample used is not representative of the population, it is useful at highlighting the effect of transitions on happiness. Darity and Goldsmith (1996) provide an extensive summary of the social psychology literature on unemployment. Empirical work from economists testing this view has been conducted since the early 1990s, when data on SWB became available through national household surveys including a section on well-being. Clark and Oswald (1994) use the first wave of the BHPS to find that unemployed are, on a raw average, half as happy as the employed. This result is corroborated by the studies of Korpi (1997), who uses Swedish data, Winkelmann and Winkelmann (1998), who use the German GSOEP, Woittiez and Theeuves (1998) who have Dutch data, and Frey and Stutzer (2000) who use a Swiss household survey. Data on other countries have also been available through the World Values Surveys (WVS) and through 1 Clark (1998) finds that the income loss from losing a job explains only a quarter of the drop in well-being 2 Di Tella et al, (2001) find that unemployment negatively affects SWB (in developed countries), whereas Eggers et al (2006) find a positive effect using Russian data. 3 Proponents of this idea highlight the negative psychological impact of being unemployed. Summaries of the literature can be found in Fryer and Payne (1986), Warr et al (1988), Feather (1990), Burchell (1992), Murphy and Athanasou (1999). Argyle (1989) is a reference book in social psychology with an extensive chapter on the GHQ measure and another one on unemployment 4
7 other European studies such as the ones used by Blanchflower (1996) and Di Tella (2001). What all these studies have in common is the result of lower levels of well-being for the unemployed. A reverse causality issue can arise if one is limited to cross section data, as it might be easier for happy people to find a job. If inherently happy people are also more productive, better at work or simply more desirable to employers, then it is happiness that positively influences the chances of finding a job, and not the reverse. One way to isolate the causal impact is to use panel data and observe what happens to individuals happiness as they change status. This identification strategy is followed in this paper, and the panel data evidence on labor market transitions proves that the causality goes from labor status to happiness rather than the other way around. 2.2 The Social Norm Effect of Unemployment Individuals are affected by their employment status, but also by others employment. Di Tella et al (2001) are among the first to test the impact of aggregate unemployment on individual s well-being. They find that people have a preference for lower levels of aggregate unemployment. Their results, to be interpreted in a context of a trade-off between inflation and unemployment (a Phillips curve), show that individuals are also hurt by inflation although its effects are much lower. The finding is consistent with the literature on happiness in the sense that it provides evidence of strong comparison effects. The classical analysis of Akerlof (1980) has been instrumental in the way economists think about social norms, their sustainability and their effect on individual s behavior. In his model, a social norm precluding transactions at the market-clearing wage can cause unemployment and still be sustainable if deviation from the norm is costlier, in terms of reputation, than the monetary benefit from adhering to it. The higher the proportion of followers of the norm, the more sustainable it is - as it becomes more costly to deviate. Following this theoretical conclusion, the question that arose was whether or not employment can be considered as a social norm. Supposing it can be, then it can be tested whether unemployment hurts more if one s reference group has little of it - that is if the norm is not followed. Clark (2003) provides strong evidence supporting this hypothesis. He finds that unemployment at regional, partner and household level positively, strongly affects well-being when the respondent is unemployed, the effect being higher for men. Backing this hypothesis one finds results from Russian data (Eggers et al, 2006) and from South Africa (Powdthavee, 2006). Stutzer and Lalive (2004) also test Akerlof s theory. They instrument for the unobserved social norms by using a referendum on unemployment benefits to extract the voting patterns across localities in Switzerland, to proxy for social norms. To correct for the po- 5
8 tential reversed causation (regional unemployment causes the norm) they use a stratified approach, which is the variation in the proxy accounts for variation within regions. Their results suggest that, indeed, in cantons voting to reduce benefits (strong work ethic), the unemployed were more likely to find a job than in cantons voting for a rise in benefits (weaker work ethic). For those not having the same native language as the canton, the effect was lower. These results emphasize the view that unemployment can be interpreted as a social norm. Given that unemployment reduces happiness, but that an increase in unemployment in the reference group attenuates this negative impact, the question has been raised to know whether the duration of unemployment is affected by the level of it in the individual s reference group, broadly defined. This will be the main focus of this paper. 2.3 Unemployment Duration and Subjective Well-Being To know how SWB is related to unemployment duration, many papers ask if duration affects SWB; because it is relevant to know whether or not individuals adapt to unemployment. Clark (2006) finds that there is no (or little) evidence of habituation. After the initial drop in well-being when losing a job, individuals do not become happier with time unless they change status. There is however another channel through which well-being and duration might be related. Looking for a job entails a costly effort, needing investment in readings ads, writing applications, mobilizing one s network, etc. If the utility differences between states (employed and unemployed) is small, it might not be worth suffering the search cost for an outcome that is uncertain. This paper shows that in high unemployment regions, SWB falls less when individuals lose their job. Hence, the incentive to return to work is reduced, since the utility difference is smaller. This might affect search behavior, and unemployment duration might be longer, affecting in turn the behaviour of others in a self-reinforcing fashion. This mechanism is very similar to the one described in Akerlof (1980). If the norm is employment, and it is not much followed, there are less bad reputation effects from not following it. It suggest that shocks matter because they affect the labor supply behaviour. If this story holds, then there is a continuum of equilibria - as one s status affects other s search behaviour. The present thesis attempts to find whether or not the job search behaviour (and unemployment duration) is affected by the social norm effect. Future research should aim at modeling labor supply and job search including externalities - to capture the effect mentioned above. 6
9 3 Data Description The data set used in this paper is the British Household Panel Survey (BHPS). The data is collected on households and individuals aged 16 or older, once a year between the months of September and May. It covers a representative sample of the British population during 16 years ( ), providing information on almost households over the period. For waves 1 to 8 there are around individual observations by year, whereas for waves 9-16 there are on average yearly individual observations 4. This means that the panel is unbalanced: during the sixteen years of the survey, some households and individual leave while others enter the sample. We keep in the sample individuals aged between 21 and 65 years who are active in the labour force - either working or actively looking for a job. Given that we keep only working age population, the mean age in the sample changes to around 40 years old, as opposed to 45 for the whole survey. Table A.1 in the appendix provides a summary of statistics for the variables in the survey. The measure of well-being used is derived from the General Health Questionnaire (GHQ). It has been designed by Goldberg (1972), and is widely used by psychiatrists to assess a person s well-being. The 12 questions asked are provided in the appendix. As presented by Argyle (1989, 2002) the GHQ is one of the most reliable indicators of psychological distress. I use an inverted Caseness score 5. The distribution of this variable is given in table A.2, in the appendix. It is observable that the distribution is highly skewed to the top, with most of the respondents scoring 12, the highest possible grade. Only a quarter (26 %) scores less than 10. Looking at the distribution of GHQ by employment status, one can note the following two facts. First, the mean of GHQ is significantly lower for unemployed persons, if one compares them to the employed or self-employed population (9,1 for the unemployed vs. 10,4 for the employed and 10,1 for the whole population sample.). Second, the distribution of GHQ has a larger variance in the unemployed group, where 26% of the respondents declare a low well-being (defined as a score inferior to 8), against 13% and 12% for the employed and self-employed. These distributional characteristics are clearly presented in Table 1 and Figure 1, below. 4 In 1999, 1500 households were added from both Scotland and Wales. In 2001, another 2000 households were added from Northern Ireland. More information can be found on the BHPS at 5 There are 12 questions, and the score ranges from 0 to 12. Individuals start with a score of 12, and for each question in which they are fairly or highly stressed, they lose a point. Psychiatrists use the GHQ : individuals with low levels of Caseness are eligible for their treatment (Argyle, 2002). 7
10 Employed Unemployed normal GHQ12 Density GHQ12 Figure 1 distribution by employment status Figure 1 GHQ distribution by employment status GHQ distribution by employment status Employed Unemployed Density GHQ Density normal GHQ12 8
11 4 Determinants of Subjective Well-Being Subjective well-being is obviously not only related to employment status. A multivariate approach is necessary. Income, health, age, education, and civic status are all likely to directly affect an individual s well-being. As the GHQ caseness score is an ordinal measure (it is not a continuous variable), a linear probability model is not the best tool to estimate its determinants 6. An ordered probit regression is used to complement the results of the OLS regression, and the results from both methods will be discussed below. The results on the main determinants of SWB are in regression table 2, which shows the ordered probit estimation. Table A.3 in the appendix shows the results from the OLS regressions. Three specifications are presented for both cases, in which the explained variable is subjective well-being. The three OLS equations estimated are shown below. S i stands for labor market status; Y i for income; Educ i for educational achievement, the reference category being no diploma. Health i stands for the health status, the reference being excellent health. The reference dummy for civic status is never married and X i stands for the control of all previous variables. W it = β 0 + β 1 S it + ɛ i t (1) W it = β 0 +β 1 S it +β 2 Y it +β 3 Male it +β 4 Age it +β 5 Age 2 it+β 6 Civic it +β 7 Health it +β 8 Educ it +ɛ i (2) W itj = β 0 + β 1 S it + β 2 X it + β 3 Y ear j + β 4 Region k + ɛ i (3) In the first specification, labor market status is the only regressor, for which the reference category is Employed. The coefficients indicate that the self-employed are slightly but significantly happier than the employed, when other life variables are not controlled for. The unemployed are the least happy. In the OLS regression, they have around 1.2 points less of well-being than the employed. The coefficients of the ordered probit indicate that Unemployed are 40% less likely to have a score of 12 than the employed, when controlling for other factors. In the second specification controls are added for the list of individual characteristics mentioned above. In the third specification, children dummies, year and region fixed effects are included. The results in all three specifications are in line with those found in Clark (2003) using the first seven waves of the BHPS. 6 because the distribution of the disturbance term is not normal anymore - standard errors and t-stats are thus invalid. An ordered probit increases the fit and provides reliable z-stats, instead of the t-stats. 9
12 10
13 4.1 Labor Market Status, Age, Income, Civic Status, Education and Health In all specifications, the coefficient for males is positive and significant (0.5 points higher than females). This indicates that men self-report higher levels of well-being than women. This is also visible in the raw mean, where men are 0.5 points happier than women. The effect of age is U-shaped, confirming the results found in the literature 7, bottoming in the late thirties. Consistent with most of the literature findings, the effect of marriage is slightly positive, while being separated, divorced or widowed is on average associated with a lower well-being. This should not be seen as a causal effect, as it could also be possible that being inherently happy favors one s marriage prospects. To isolate the causal effect of marriage or divorce we need to look at transitions between civic states. 8 This is done in Clark and Lucas (2006). Using the GSOEP, they find that marriage increases happiness but that a habituation effect exists. The prospect of marriage (cohabitation) raises wellbeing 3 years before marriage, but this increase in happiness does not last longer than 3 years after the marriage date 9. The channels through which marriage causes the rise in well-being are explained in Argyle (2002). An intimate relationship enhances self-esteem and it can attenuate stress from other life activities like one s job. The effect of income on SWB is particularly interesting. As found in Easterlin (1974, 2001), income is a poor estimator of happiness. The results found in the literature suggest that relative income matters more than income itself, and income growth is important but not its level (above a certain threshold). These results highlight the role of comparisons, to others and to oneself in the past. The coefficients we find are negative and insignificant, confirming this story. However, when one goes from specification 2 to specification 3, the coefficient remains negative and becomes slightly significant. This suggests that a higher income might be associated with other variables that we are not controlling for (such as hours of work) that are negatively correlated with SWB. In the appendix a specification controlling for relative income is presented. Being in the top quarter of the wage distribution has no significant impact on well being. The effect of education is also interesting. The higher the achievement the lower the SWB. The current explanation is that a higher diploma leads also to higher income expectation, which reduces satisfaction for a given level of income. (see Argyle, 2002, and Frey and Stutzer, 2001, on expectations). 7 See Clark and Oswald(1994), Blanchflower and Oswald (2007), Frey and Stutzer (2002), Winkelmann and Winkelmann (1998) 8 Which gender benefits more from marriage has been subject to intense debate. Bernard (1972) proposed that men benefit much more from marriage than women. Glenn (1975) shows the opposite. More recent findings using subjective well-being data confirm Bernard (Fowers, 2004), while others show that marriage increases happiness equally between genders. 9 Stutzer and Frey (2006), using the same data, find exactly the same results 11
14 Table 3, above, reports the results for the effect of labor market transitions on SWB. We observe that upon losing their job, those who were employed report on average a drop of 1,08 in their SWB, and 0,91 if they were self-employed. This is a significant fall, given how the distribution is skewed to the right. The transitions from unemployment to employment or self-employment are associated with large increases in well-being (correspondingly 1,41 and 1,20 points). People do feel better when they find a job. There is however an asymmetry in this process. On average, individuals report a larger gain in well-being when returning to work than the loss they report when losing it. This asymmetry is an interesting behavioral fact also found in Clark (2003). No references have been found in the literature pointing towards this asymmetry. 10 In the appendix, we provide the same transitional matrix decomposed by gender. The pattern by gender is the same, but males report higher drops and peaks than females. Transitions from unemployment to employment provide males with a 1.6 jump in SWB, compared to a 1.15 for females. When they lose their job, males report a drop of 1.15 points compared to a 10 Possible explanations could be that upon finding a job people are overconfident, so they report a high jump in well-being. It could also be that when losing a job, people are confident they will find another one quickly, so they don t worry too much. In any case, the asymmetry means that jobs are less valued when they are lost than when they are filled. In job search theory, the present value of unemployment or of a position is independent of whether the position is filled. Perhaps jobs created are more valuable than jobs destroyed - hinting at the possibility of a Schumpeterian creative destruction process. 12
15 1 point drop for females. The transition from self-employment to employment gives much greater rewards to females (0.4 points more) than to males (0.1), which could be interpreted as a more risk-loving behavior of men. 4.2 The Social Norm Effect of Unemployment The literature on happiness highlights the important role of comparisons in individuals well-being. It is income relative to others that matters or to oneself in the past. A slightly different comparison mechanism is at play when it comes to labor market status, but comparisons are still present. The previous section shows that the transition from employment to unemployment is causing a drop in SWB. Furthermore, there is no habituation effect : the unemployed feel on average significantly worse than those in employment, even after controlling for other factors 11. Aware of this pattern, a relevant question arises. How does other s employment affects one s well-being? Are those losing a job also comparing themselves to others in unemployment? If yes, in what ways? Finally, do these comparisons affect their job search behavior? Theory : a binary choice model with externalities As in Akerlof s (1980) social norm model, we can add others behavior and beliefs in the utility function. Whereas previous well-being estimations were only accounting for personal unemployment (U e ) and were of the form W i = W (U e, X), we are now interested in a utility function including a norm, beliefs and reputation effects, such that W i = W (G, R, A, d c, ɛ) Agent s utility W i is dependent on their private consumption G, their reputation R, their belief in the norm d c, obedience to the norm A(1,0), and personal tastes ɛ. Let us suppose that reputation depends itself on the proportion of believers µ and one s own actions A, such that R = R(µ, A). If everyone believes in the norm (µ = 1) and agent i does not follow it (A=0), he suffers from reputation effects. As less people believe in the norm, the reputation effect from not following it is reduced and this in turn pushes more people not to obede. As Akerlof explains, if there are no reputation effects, the only possible equilibria are derived from the traditional utility function with tastes ɛ and consumption G. However, if deviation from the norm is costly in terms of reputation, we may have a stable equilibrium in which the norm is self-sustained and agents follow it. It is a simple example of a binary choice model with externalities, in which two equilibria are sustainable. 11 Clark (2006) finds that unhappiness does not decrease with unemployment length using the GSOEP and the ECHP, but has mixed results using the BHPS 13
16 Figure 2 diff and Urate.pdf gap and Regional Unemployment Rate Well-being Well-being gap and Regional Unemployment Rate GHQ difference between employed and unemployed Regional Unemployment Rate GHQ difference between employed and unemployed Regional Unemployment Rate diff_ghq Fitted values Well-being gap and Regional Unemployment Rate diff_ghq Fitted values In this case the norm is employment. The adherence to the norm, µ is the employment rate. This follows Akerlof s model in the sense that if all other adhere to the norm, there is a bad reputation effect from not following it. As the number of unemployed rises, the stigma from being unemployed falls. Clark (2003) considers a linear form for reputation : R = ( Ue i (1 Ue i ). We follow his steps here, and the main equation is : W i = W i [ Ue i (1 Ue ), 1 Ue, X] This allows for the following effects. Being unemployed hurts (through the first term), a rise in the unemployment rate hurts (through the second term), but it improves well-being if one is unemployed (again first term) Empirical evidence : pooled data regressions Figures 2 shows a simple plot of regional/yearly unemployment rates and the average wellbeing difference between employed and unemployed. The correlation is quite visible at eye-level. In regions/years where unemployment is high, people report being less hurt when they lose a job. Appendix A shows the regression results : a 1% increase in unemployment corresponds to a 0.08 points drop in the loss of happiness. A first empirical glimpse of this relationship was found in Clark and Oswald (1994), though they used only the first wave 14
17 of the BHPS. They were unable to reject the shift-share hypothesis 12. Clark (2003) uses the first seven waves of the BHPS to confirm this early prediction. He finds that in regions with high unemployment, SWB falls less when losing a job. The same result is found in this paper, extending the sample to 16 waves of the BHPS. This finding suggests that unemployment hurts - but it hurts less the more there is of it around. It suggest that labor market status is one important comparison affecting well-being. The question often posed is who do people compare to? Who are the relevant others? Is it the whole population or the people on the neighborhood? Is those of same sex, age, income and educational achievement? Data on relevant others from the survey can be used to test if employment in the reference group is also affecting well-being when losing a job. The OLS estimations to test the hypothesis are the following. W it = β 0 + β 1 U it + β 2 X it + β 3 R k U + β 4 (U it R k U) + ɛ i (4) W it = β 0 + β 1 U it + β 5 X it + β 6 U + β 7 (U it U ) + ɛ i (5) W it = β 0 + β 1 U it + β 8 X it + β 9 U + β 1 0(U it U ) + ɛ i (6) Where W it stands for well-being of individual i at period t. X i stands here for all other determinants, year, region and children fixed fixed effects. U it = 1 when the respondent is unemployed. R k U stands for the regional unemployment rate; and U = 1 when the relevant other is unemployed. The interaction terms are expected to be positive. Following Moulton (1980) the estimation uses clustered standard errors for the regional unemployment rates. This is because the regional unemployment rate is the same for all individuals within the region. If the clustering is ignored, the repetition of the same value in one variable is biasing downwards the standard errors. The results of the regressions on pooled data are very straightforward. Table 4, below, shows the ordered probit results. Table A.5, in the appendix shows the OLS results. In the simple specification, one can see that the regional unemployment rate has no effect on well-being. However, when one adds an interaction term between own unemployment and regional unemployment rate, the coefficient is positive and significant. This reflects the finding of the previous graph: unemployment hurts, but it hurts less the more there is of it around at the regional level. The effect of spouse unemployment is also straightforward. Having an unemployed spouse significantly lowers one s well-being. The effect is 35 times higher than the regional unemployment interaction. But the interaction term between own unemployment and the 12 The shift-share hypothesis would hold if a rise in unemployment pushes the happier of the working force into unemployment. 15
18 Table 4 : Ordered Probit with Pooled Data spouse s unemployment is positive and significant : if one loses its job, having an unemployed spouse is better than an employed one. The magnitude of the effect is also very high (above a quarter point). It tells us that individuals are hurt when losing their job, but they are hurt less if the reference group (here the spouse) is also unemployed. They also tell us that the spouse is a much closer reference group than the regional unemployment rate. The results of the broad specification show no difference in the coefficients, suggesting little multicollinearity between the two interaction terms Empirical evidence : results with panel data specification The results of the regressions using individual fixed effects are somehow less forward. Controlling for each individual s unobserved heterogeneity leads to losing as many degrees of freedom as individuals. As a result, the significance of some coefficients is lost. The regression table 5, below, (and tables A.6 and A.7 in the appendix) present the results on the regressions controlling for individual fixed effects. The results from the specifications 13 to 15 show that unemployment hurts men twice as more than women. The interaction term between own and regional unemployment is significant only for men, suggesting that women do not suffer from regional comparisons. The magnitude of the effect for men (0.04) is the same as in the previous specification using pooled data (Table A.5). Specifications 16 to 18 show that women suffer six times more than men from having an unemployed partner, both effects being significant, and quite high for women. The interaction term 16
19 Table 5 : OLS Regression with Individual Fixed Effects between spouse and own unemployment is positive and very strong for men, but small and insignificant for women. In other words, spouse s unemployment hurts more women than men, but men compare more to their spouses. 4.3 A note on the use of Pooled data vs Fixed Effect Pooled Data The standard specification for an OLS estimation of well-being using panel data is the following : Y it = β 1 + k β j X jit + j=2 s γ p Z pi + δt + ɛ it Where Y it is the dependent variable (here the GHQ-12) for individual i in time t. X j are the observed explanatory variables (employment, age, gender, civic status, etc.). Z pi are the unobserved variables affecting subjective well-being, and they are the ones responsible for the unobserved heterogeneity and for creating the noise. ɛ it is the disturbance term and t is added to control for a change in the intercept over time. Assuming that Z pi, the unobserved explanatory variables, do not change over time, the equation above can be rewritten as : Y it = β 1 + p=1 k β j X jit + α i + δt + ɛ it j=2 17
20 where α i = s p=1 γ pz pi ; and α i stands for the unobserved effect of all Z on Y i. It measures the individuals specific unobserved fixed effect. This unobserved, individual-specific fixed effect can be dropped if it is not significant. This could be done if all relevant characteristics affecting GHQ are captured by the controls X. If this is the case, then the α ij term can be dropped and the data set can be used as a pooled data set, in which all observations from the different years are used in the same sample. The present paper presents the pooled data results before presenting the next step, the panel data results Fixed Effects Regressions : individual fixed-effects Well-being levels reported by one person can be thought of being subjectively different that those reported by another person. If one cannot compare a well-being of 10 between two individuals, then we might want to control for individual fixed effects, as we are interested in understanding how changes in explanatory variables relate to changes in well-being. To do so, we must subtract the mean values of all variables (of individual i) to each observation. The mean variables are found by the equation below : Ȳ i = β 1 + k j=2 β j Xji + α i + δ t + ɛ i Where Ȳi accounts for the mean happiness of individual i during the years surveyed. When subtracting the individual s mean observation to their yearly observation, we obtain an equation in which the unobserved individual fixed effect α i disappears, as also does the intercept β 1. The regression controlling for individual fixed effects is shown below : Y it Ȳi = k j=2 β j (X jit X ji ) + δ(t t) + ɛ it ɛ i This within-group regression measures how the variation in observable explanatory variables affects the variation in happiness. Three main problems arise when using individual fixed effects. First, the intercept and any explanatory variable reporting no change during the time of the survey is dropped. Since we are measuring how change in variables explain change in happiness, then gender, educational achievement and civic status will not be taken into account unless they change : their value will be zero. Second, the variation of explanatory variables within-individuals is much smaller than the variation across them. The model will have large disturbance terms and low precision in the estimates. Third, and most important, using individual fixed effect means we are controlling for every single individual. This leads to the loss of 18
21 many degrees of freedom (as many as individuals). It significantly reduces the precision of the coefficients. 19
22 5 Unemployment Duration The BHPS contains a detailed module on each employment/unemployment episode from every individual in the sample. Merging this data with the previous yearly household survey makes it possible to run a duration model of unemployment spells in order to find the main determinants of its duration. The sample is right-censored: information is not available on spells finishing after wave 16. Some random censoring also occurs as individuals are randomly lost during the 16 waves. Over the 16 years of the sample, we have data on 5700 unemployment spells 13. The average duration of a spell is 23 months, but there is a great heterogeneity as half of the spells end before the 12 th month and 70% of them before the 24 th month. The distribution is distinctly skewed to the right, artificially pushing the mean to 23 months. Table 5.1 summarizes some descriptive statistics on the spells. Figure 5.2 shows the survival function of spells, decomposed by gender. 5.1 Determinants of duration The differences between genders is very clear: women spend on average less time in unemployment. Selection issues are very likely to be the cause of this difference. Participation rates are higher for men than for women 14, so it is possible that working women differ significantly from their non-working peers, whereas this is less the case for men. Differences across regions are also evident. Unemployment duration is much higher in Scotland, Northern Ireland and Wales than in London and in the South. Age is a major determinant as younger individuals have shorter spells than older ones, in both genders. Finally, individuals with a higher educational achievement have on average shorter spells (15.4 months) than the low achievers (32.1 months). Figures 5.1 and 5.2 provide visual evidence of two clear discontinuities in the rate of return to work. The first discontinuity is found in the months 10 and 11, in which the rate of return to work is significantly higher than in the immediate preceding or following months. The main suspect for causing this discontinuity is the reduction in benefits occurring on the 12 th month. The same story applies for months 22 and 23, as the benefits are also reduced on the 24 th month. For some individuals, monetary incentives seem to play a significant role in the rate of return to work, as the anticipation of a drop in benefits pushed them to return to a paid job. These results are in line with the literature on job search behavior. The theoretical model of Mortensen (1977) predicts a rise in the hazard 13 Spells longer than 12 years are (arbitrarily) taken out of the sample. They are outliers irrelevant to the present analysis and bias the results 14 Women s participation rates have increased from 70% to almost 75% between 1991 and 2006 (the years covered in this survey). Men participation rates are above 85% 20
23 ratio as one gets closer to the benefits exhaustion time. Meyer (1990) finds evidence of large spikes in the hazard in the prior weeks before exhaustion, a result that is also shared by a large amount of literature 15. To summarize: age, gender, region and educational achievement all seem to be correlated with unemployment duration; while monetary incentives also play a significant role as the deadline of benefit exhaustion approaches. In the next subsection it will be asked how unemployment duration and well-being are related. As duration spent in unemployment and well-being can influence each-other, it is difficult to isolate the impact of one on the other. Individuals might suffer when they lose their job, but perhaps they also get used to be unemployed. Hence, we could observe that time spent on unemployment has a positive effect on well-being. A reverse mechanism could also exist. The well-being difference between the two states can play as an incentive to return to work. As the gap of well-being increases between being jobless and employed, the incentive to find a job increases, thus reducing duration. Understanding which of these stories is true (both can be) is important for both policy and research reasons, as it will be explained below Unemployment duration and well-being: how to find the causality direction? Unemployment duration might affect well-being through a habituation effect. In their review of unemployment-related psychology findings, Darity and Goldsmith(1996) describe three phases of emotional response after a job loss. A first shock phase where optimism still predominates, followed by a phase of pessimism and helplessness, and finally a phase of fatalism feelings with habituation. If individuals adapt to being jobless, we should observe a higher well-being in long-term unemployed than in those who recently lost their job. Controlling for individual effects we should observe, among the unemployed, a rise in well-being with time spent in unemployment. However, upon comparing well-being across different categories of unemployed one cannot rule out a sample selection issue - arising in pooled regressions. 16 That is why pooled regressions yield different estimates than panel data regressions. Using panel data (individual fixed effects) is the proper way to estimate the impact of duration on well-being. Clark (2006) does this exercise using three European panel data sets. For the pooled data, he uses an interaction term between duration and unemployment. He finds that panel data 15 Moffit (1985), Meyer (1990), Vodopivec (1995), Dormont et al (2001) all find, using data from different countries, that the exit rate from unemployment to employment rises sharply as the end of the entitlement period approaches. See Card, Chetty and Weber (2007) for a review of findings. 16 Through a shift-share mechanism. Those who stay unemployed longer are different : those suffering the most might have left to inactivity or back to work. Those suffering less from unemployment stay jobless. A selection bias arises in cross-section 21
24 Table 5.1 Table 1: Unemployment Spells - Descriptive Statistics by Demographics Variable Men (Std.Dev) Women (Std.Dev) All(Std.Dev) Average (31.9) (23.7) (29.6) 6 months or less % months or less % months or less % Region Inner London (26.1) (21.8) (25) Rest SE (27.6) (15.7) (23.7) South West (27.7) (12.8) (24.0) Scotland (37.6) (26.7) (34.3) Wales (32.5) (32.7) (32.6) N.Ireland (33.6) (32.6) (33.2) Age Age (37.1) (25.8) (34.2) Age (27.3) (22.3) 19.9-(25.8) Educational Achievement Low (36.6) (28.3) (34.6) Medium (24.7) (22.5) 19.5-(23.9) High (24.6) (13.7) 15.4-(21.7) 22
25 Figure 5.2 Hazard -Survival function - unemployment by gender no CI.pdf There is a clear discontinuity in months 10 and 11 (before the first red line) ; and in month 23 (before the second red line) Survival function - Unemployment Spells BHPS - Waves Months spent in unemployment Female sex = Male Data is right censored - all spells end at wave 16. BHPS - Waves 1-16 Survival function - Unemployment Spells Months spent in unemployment sex = Female sex = Male There is a clear discontinuity in months 10 and 11 (before the first red line) ; and in month 23 (before the second red line). Data is right censored - all spells end at wave 16. does not support the hypothesis of habituation, when using the GSOEP and the ECHP 17, but the results are not significant using the BHPS. The same exercise is executed here. Using pooled data, the interaction term between unemployment and its duration, it is found that unemployment duration has a positive and significant effect on well-being, when one does not control for the other life variables. However, if one controls for life variables, then duration has no effect on well-being. This hints that duration is associated with the life variables mentioned above, but not directly with well-being. The transition matrix shown before provides evidence that staying in unemployment has no different effect on well-being than staying in employment. As pooled data is not rigourous, panel data specifications are used. Introducing individual fixed effects makes it possible to regress the change in well-being to the change in duration. A fixed effect logit is used to estimate this effect of duration on well-being, for the unemployed. The results show that the coefficient of duration is not significant. Hence, it can be said that the effect of unemployment on well-being is independent from its duration. These results are shown in the appendix. Table A.8 shows the pooled results, and Table A.9 the fixed effects results. 17 GSOEP is the German Socio-Economic Panel ; ECHP is the European Community Household Panel 23
26 in GHQ reported upon the transition from to There are 1438 observations. The Mean is equal to -1 and the std.err equals.10 Figure 5.4 Data from 20 BHPS 30 Waves Percent Difference in GHQ in Transitions from Employment to Unemployment Figure 5.4 Difference in GHQ in Transitions from Employment to Unemployment Data from BHPS Waves Percent Difference in GHQ reported upon the transition from Employment to Unemployment There are 1438 observations. The Mean is equal to -1 and the std.err equals The role of social norms in duration This section tests whether the length of the unemployment spell is affected by the change in well-being reported when losing one s job. A variable is created that calculates the reported change in happiness when the individual is made redundant. This variable is named Difference in happiness. It stands for V e V u, which in the job search theory literature is the utility difference between being employed (V e ), and unemployed, (V u ). Even though information on 5700 unemployment spells are available, there are only 1400 observations for the reported changes in well-being. This is due to the fact that data for SWB is yearly, whereas the unemployment spells are coded monthly. The distribution of this variable is presented in figure 5.4. The figure 5.4 has to be read as follows : 10% of the individuals report a drop of -1 in well-being, when losing their job. 31% report feeling no change in their well-being. As it is observable, a significant proportion of the individuals record feeling happier when losing a job (almost 18%). The majority, however, reports feeling worse off (42%). The average change in well-being is equal to 1, on a scale going from 12 to 12. This is a considerable drop, given that SWB is highly skewed to the top.. To estimate the determinants of duration, two regression model are performed. The first is a standard OLS regression, and the second a proportional hazard model. The results from these models are shown in table 5.2. As shown before, there are large differences in duration, by gender, age, regions and educational achievement; so these are used as controls. The regional jobless rate is also likely to affect time spent looking for work: if more people compete to get jobs, average search duration should increase. As shown in the em- 24
27 pirical literature, unemployment benefits should also increase duration, because they have an effect on the reservation wage. We also add a dummy for unemployed spouse. Finally, we test two different measures of well-being. First, we add the coefficient difference in happiness. Second, we create a dummy when the initial drop in well-being is larger than 1, and we call it bigloss. The results are presented in table 5.2, and all the details about the modeling of duration and the significance of the coefficients are explained on the section 8.2 of the appendix. The results from the OLS regression (columns 1 to 4) are in line with those from the duration model (columns 5 to 5). Women, the young and the highly educated spend less time in unemployment. When more people are jobless in one s region, duration increases. Benefits also push individuals to keep looking for a job longer (their reservation wage is higher). Column 4 shows that the coefficient difference in happiness is positive and significant at the 1% level. Since the change in well-being is negative, it suggests that the more an individual says it suffers from losing a job, the quicker he returns to work. Column 3 confirms this intuition: those who suffered a big loss in well-being when losing their job are spending less time in unemployment. The results suggest that a one point increase in happiness (when losing a job) is associated with a 0.3 months increase in unemployment duration, even after controlling for other factors. Finally, having an unemployed spouse increases one s unemployment duration, possibly due to the comparison effect presented earlier. The proportional hazard model confirms the OLS results. Those who suffered a big loss have a higher hazard rate, while the diff-hap coefficient is negative : the less one is hurt by unemployment, the lower the hazard rate out of unemployment. 25

28 Table
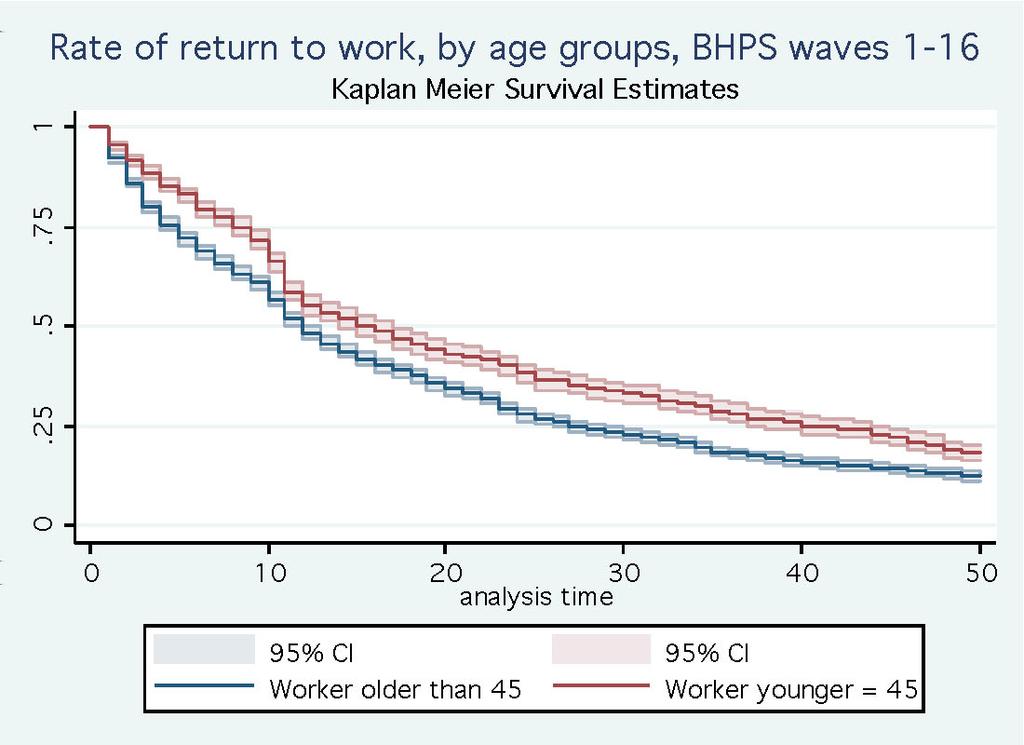
29 Figure 5.5 : Survival functions for the High loss group and Low loss group survival estimates Kaplan-Meier Kaplan-Meier survival estimates analysis time Low High GHQ drop upon entering unemployment Kaplan-Meier survival estimates analysis time Low GHQ drop upon entering unemployment High GHQ drop upon entering unemployment Social norms and duration : empirical evidence from the duration model Another piece of evidence suggesting that those who suffer more from the job loss return to work quicker is provided in the Figure 5.5, below, where a Kaplan-Meier survival function is estimated. The sample of unemployment spells is split in 2 different sub-samples. Those for whom the loss is high (drop of 2 or more in well-being) are grouped together in the high-loss sample. Those for whom the loss is low (no change or increase in well-being) are grouped in the low-loss group. Then, a Kaplan-Meier survival function is estimated for each sub-sample. The results are shown in the graph 5.5 below. The graph shows 2 lines. The blue line (above) estimates the rate of return to work for those who suffered less from the job loss. The red line (below) estimates the rate for those for suffered more. For the least happy, the rate of return to work is higher (red line) than for those who suffer less (blue line). The difference in both survival functions is significant at the 80% level from the 5th month onwards. Hence, this figure provides some visual evidence that the rate of return to work is lower for individuals who report being less hurt from unemployment 18. In the next 18 This result also confirms the prediction of Clark (2006) that sample selection bias arises if one uses pooled data OLS regressions to estimate the impact of unemployment duration on well-being. It seems that those feeling worse leave unemployment sooner than the others 27
30 subsection, it is shown that the channel through which their return rate is lower could be their search effort. 5.3 Is search intensity related to change in GHQ? The BHPS has a section designed in a similar way to the LFS (Labor Force Survey), intended to measure unemployment by the ILO standards. In this section, unemployed persons are being asked if they have been searching for a job in the last week, and/or in the last month, their response being limited to Yes/No. Their answer can provide some information on the search intensity of the group as a whole. Using the previous sample of GHQ differences, two groups are created. The first group consists of those who report a large utility loss (higher than 1 point of SWB) when they lose their job. The second group consists of those who report either no utility change or are happier being unemployed. Search intensity varies slightly between the two groups. It is observed that 62% of the group suffering from being unemployed searched for work last week, whereas this drops to 55% for the other group. These results suggest that the unemployed modify their search behavior according to how much they report being hurt by the job loss 19. A means test confirms that the two means are different, at the 95% confidence level, the results of the test are in table A.11 of the appendix. We provide in the appendix a probit of search last week, in which we use the same controls as for duration. Unfortunately, our variables of SWB do not seem to be significant, exept for bigloss, whose effect is positive and significant, but only at the 10% level. Further data could confirm our prediction, and show that those suffering a bigloss are indeed searching more frequently. Table A.10 presents the results of the search probit. Table 2: Search intensity : Have you looked for any kind of paid job in the last week? - population mean by groups Variable Mean Std. Err. N.Obs High GHQ drop No GHQ drop An reverse causality issue can arise : maybe search is causing unhappiness. As soon as search stops, happiness increases (true when they find a job or when they search less). If this holds, then all the results/conclusions in the present thesis are wrong. The reason why this does not hold is because we are using the initial drop in happiness. 28
31 5.4 Conclusion on unemployment duration The length of time an individual spends being unemployed depends on numerous factors and affects an equally large number of outcomes. Gender and age can be thought of exogenous but one cannot distinguish between supply or demand factors through which they affect the rate of return to work. Is it that the women and the young are better at looking for jobs, more motivated (supply side), or is it that demand for them is higher? The interrelation between SWB and search intensity provides -at last - a pure labor supply story. Upon losing their job, people self-report a drop in their subjective well-being. This drop depends on how many other around are unemployed, and it also affects their search behaviour. When those around are jobless, being unemployed hurts less and job search effort is less intensive. Hence, the rate of return to work is also lower. These results suggest that the job search intensity and the rate of return to work are both dependent on the difference of well being between being employed and unemployed. In standard models of job search, the intensity of search is also derived from the utility differences from the two states. However, in those models, utility is only determined by the differences in the flow of income. The results presented here suggest that comparison effects play a significant role in the rate of return to work. 29
32 6 Conclusion Previous literature (Clark, 2003) found that the higher the unemployment rate among an individuals reference group, the less that individual reported being hurt by unemployment, which was called the social norm effect. In this paper, we provide more evidence of the social norm effect. We show that albeit the comparison effect is strong, it differs by gender. Women suffer more than men when their spouse is made redundant. But men compare more, both to their spouses and to their regional peers. When men they lose their job, they suffer, but they suffer less if their spouse is also unemployed. This paper goes one step further. It provides evidence that the duration of unemployment is affected by this social norm. It is suggested here that job search behaviour is also dependent on the social norm, on the individual s perception of how socially stigmatising is unemployment. The lesson to be drawn by these findings is that one s employment decisions have a strong externality on other s labor supply and job search effort, through comparison effects. Upon losing a job, if a relevant other is also jobless then both individuals search with less intensity. In the opposite scenario, if all relevant others are employed, search intensity increases for the unemployed. It suggest that participation to the labor market should be seen as a binary model with externalities. One s decision affects the others. As in Neumark and Postlewaite (1998) this mechanism helps in explaining the rise in women s participation rates in the 20th century, and complements the standard model of labor supply. It also explains why in high unemployment regions the jobless rate might remain higher than in low regions, or why it may take longer to fall. Explanations of unemployment hysteresis have been so far centred around labor demand. The present findings suggest unemployment hysteresis might also come from the labor supply behaviour. If others are unemployed, I will search less and extend my unemployment duration, in turn affecting other s return to work. Many policy implications arise. One concerns the responses to exogenous macroeconomic shocks. Following a labor demand shock, as unemployment rises, the labor supply might also fall (shift to the left) through a comparison effect. It suggest that a policy response should correct for this externality in times of high unemployment. Future empirical research should examine in more detail the link between search intensity and the social norm effect. Future theoretical research should asses what policy responses arise now that we know how one s participation affects the others. 30
33 7 References G.A. Akerlof. A theory of social custom, of which unemployment may be one consequence. The Quarterly Journal of Economics, 94(4): , June M. Argyle. The Psychology of Happiness. Routledge, 2 nd edition, D.Blanchflower and A.Oswald. Well-being over Time in Britain and the Usa. Warwick Economic Research Papers, (No 616), October Iza Discus- D.Blanchflower and A.Oswald. Is well-being u-shaped over the life cycle? sion Paper, (3075), September David Card & Raj Chetty & Andrea Weber, The Spike at Benefit Exhaustion: Leaving the Unemployment System or Starting a New Job?, NBER Working Papers 12893, National Bureau of Economic Research, Inc. A. Clark. Unemployment as a social norm: Psychological evidence from panel data. Journal of Labor Economics, 21(2): , A. Clark. A note on unhappiness and unemployment. Working Paper - Paris School of Economics, (23), A. Clark and R. Lucas. Do people really adapt to marriage? The Journal of Happiness Studies, 7(4): , November A. Clark and A.Oswald. Unhappiness and unemployment. The Economic Journal, 104(424): , May A. Clark and A.Oswald. Comparison-concave utility and following behaviour in social and economic settings. Journal of Public Economics, 70: , W.Darity and A.Goldsmith. Social psychology, unemployment and macroeconomics. The Journal of Economic Perspectives, 10(1): , Winter R. Di Tella, R. McCulloch and Andrew Oswald. Preferences over inflation and unemployment:evidence from surveys of Happiness. American Economic Review, Vol. 91, No. 1 (March 2001), pp B. Dormont & D. Fougre & A. Prieto, L effet de l allocation unique dégressive sur la reprise d emploi, ; THEMA Working Papers , THEMA (Théorie Economique, 31
34 Modlisation et Applications), Université de Cergy-Pontoise. R. Easterlin. Income and happiness : Towards a unied theory? The Economic Journal, 111(473): , July A.Eggers, C.Gaddy, and C.Graham. Well-being and unemployment in russia in the 1990s: Can societys suffering be individuals solace? The Journal of Socio-Economics, 35: , N. Feather. The Psychological Impact of Unemployment, Springer-Veriag, New York, (1990) B. Frey and A. Stutzer. Happiness and Economics. Princeton University Press, P. Jackson and P. B. Warr, Unemployment and psychological ill health: The moderating variables of duration and age. Psychological Medicine, 14, (1984). M. Jahoda. Work, employment and unemployment: vniues, theories and approaches in social research. American Psychologist, 36, (1981). T. Korpi. Is utility related to employment status? Employment, unemployment, labor market policies and subjective well-being among Swedish youth, Labour Economics, Elsevier, vol. 4(2), pages , June Moffitt, Robert, Unemployment insurance and the distribution of unemployment spells, Journal of Econometrics, Elsevier, vol. 28(1), pages , April. Dale T. Mortensen, Unemployment insurance and job search decisions, Industrial and Labor Relations Review, ILR Review, ILR School, Cornell University, vol. 30(4), pages , July. G. Murphy & J. Athanasou. The effect of unemployment on mental health. Journal of Occupational and Organizational Psychology, 72, 83 99; (1999) D.Neumark and A.Postlewaite. Relative income concerns and the rise in married womens employment. Journal of Public Economics, 70: , A.Oswald & Rafael DiTella & Robert J.MacCulloch. Preferences over inflation and unemployment: Evidence from surveys of happiness. The American Economic Review, 91(1): , March
35 A.Stutzer and R.Lalive. The role of social work norms in job searching and subjective well-being. Journal of the European Economic Association, 2(4): , Milan, Vodopivec, Unemployment insurance and duration of unemployment : evidence from Slovenia s transition, Policy Research Working Paper Series 1552, The World Bank. Winkelmann and Winkelmann. Why are the unemployed so unhappy? 65(257):1-15, February Economica, 33
36 8 Appendix 8.1 Is the GHQ-12 a good measure of Well-Being? As presented by Argyle, the 12-item version of the GHQ is a good test for the following reasons. First, it has internal coherence. The 12 item correlate with each other : the Cronbach alpha is high. Second, the scores are stable over time but sensible to changes when the individual reports going through current hassles. Third, the score is correlated to reports by others who know the subject, and also to daily reports of moods, to cognitive measures and to reports from qualitative interviews. Fourth, the immediate mood bias is not likely to affect GHQ because the questionnaire asks questions related to the past weeks. Positivity bias is present in all types of surveys. Everyone is overconfident - except chronic depressives. Fifth, scales are comparable across individuals. The 12 questions used to build the GHQ-12 are as follow : 1. Have you recently been able to concentrate on whatever you are doing? 2. Have you recently lost much sleep over worry? 3. Have you recently felt constantly under strain? 4. Have you recently felt you could not overcome your difficulties? 5. Have you recently been feeling unhappy or depressed? 6. Have you recently been losing confidence in yourself? 7. Have you recently been thinking of yourself as a worthless person? 8. Have you recently been able to enjoy your normal day-to-day activities? 9. Have you recently been able to face up to problems? 10. Have you recently been feeling reasonably happy, all things considered? 11. Have you recently felt capable of making decisions about things? 12. Have you recently felt that you were playing a useful part in things? For question 1, the responses are : Better than usual (1) ; Same as usual (2) ; Less than usual (3) ; Much less than usual (4) For questions, 2 to 7, the responses are : Not at all (1) No more than usual (2) ; Rather more than usual (3) ; Much more than usual (4). For questions 8 to 12, the responses are : More so than usual (1) About same as usual (2) Less so than usual (3) Much less than usual (4) 34
37 8.2 Duration model This appendix provides some explanations for the duration model of unemployment. Each unemployment spell T is calculated in months. In terms of duration modeling, the length of each episode is the survival time in unemployment. We call the time of transition out of unemployment t, that is the failure time (it is the moment at which the event fails). The cumulative distribution of T is F (t), and the density function is the derivative of the df (t) dt. cumulative function with respect to time : f(t) = The distribution of this variable T is given in the table 10.xx. For simplicity reasons, I truncate the distribution at T = 100, as we are not interested in outliers. The distribution of this variable T is given by the equation : F (t) = P (T t) This distribution F (t) measures the probability of survival up to the time t. T should be seen as a continuous variable. As such, it is the first derivative of the distribution function. The survival function S(t) denotes the probability that the spell T continues after t or longer. For example, taking the whole sample of spells, the probability of surviving 13 months in the unemployment state is of.5 or 50%. S(t) = P (T > t) = 1 F (t) Another example for the survival function : the probability of surviving 5 months in unemployment is 75% It is equal to the spells that are left, or to 1 minus proportion of spells that ended before time t. Duration models are not always needed. We can always regress duration on other control variables, or estimate the conditional probability of an event with a binomial regression. Duration modeling is needed when we need to go beyond. If we are interested in knowing the probability of being unemployed for another month given that we were unemployed 10 months, then we need survival analysis, as this information does not come in a plain regression. Also, if we need to know the conditional probability that an ongoing spell will end, controlling for other variables, then we need survival analysis. The Hazard function or the failure rate λ(t) measures the death rate given survival until time t. Example : the failure rate between the months 12 and 23 is 50%. It means : conditional on making it to the 12th month, there is a 50% chance that the spell will end before the 24th month. It is measured as follows: λ(t) = lim δ 0 P (t T t + δ T t) δ The cumulative hazard function is something very similar. It measures the probability of surviving over a time span [t, t+d] and it is found by integrating the hazard function over that time span. 35
38 Λ(t) = t 0 λ(x)d(x) When integrating the cumulative hazard at a given point, we obtain the survival function: S(t) = e t 0 λ(x)d(x) Cox Proportional Hazard Above we explain the basics of duration models, but we are now interested in understanding the duration conditional on other variables. The Cox proportional hazard allows to condition duration. Stata provides a command (stcox) to run a cox proportional hazard. It estimates following proportional hazard : λ i (t) = e x iβ.λ 0 (t) Where x i stands for the value of variables affecting duration, and β is their coefficient. λ i (t) is the hazard rate of individual i, and λ 0 stands for the baseline hazard. In the regression result from section 6, the proportional hazard ratio β associated with the happiness difference is equal to 0, 97. It means that the effect of a one point increase in happiness when losing a job is associated with a 2.3 months increase in unemployment duration. 36
39 8.3 Regression Results and tables Table 3: Table A.1 : Summary statistics of the survey Variable Mean Std. Dev. N Waves 1 to 16 Number of Households In the whole survey In restricted sample Number of Observations - individuals per years In the whole survey 199,322. In restricted sample 151,567. male age Married Separated Divorced Widowed Never Married Health Excellent Health Good Health Poor Educational Achievement : Other Educational Achievement : High Educational Achievement : Medium Employment Status, in % of the sample self employed in paid employ unemployed retired family care ft student long term sick/disabled on maternity leave govt trng scheme something else As explained in section section 3 (Data Description), I provide here some basic statistics of the survey, in table A.1. It can be seen that there are almost households in the 16 waves, but the restriction of the sample to the working age population reduces it to Married, Separated, Widowed, Divorced and Never Married are dummies. An individual 37
40 has to be one (and only one) of these categories. Health is also a dummy, as Educational achievement. It can be seen, on the employment status table, the number of self-employed, employed and unemployed individuals. Table 4: Table A.2 : Distribution of GHQ-12 Variable Frequency Pct Cumulative Pct. GHQ12 0 2, , , , , , , , , , , , , Table A.2 : OLS regression GHQ-12 on its primary determinants. Table A.2 provides the distribution of the GHQ-12 variable that measures well-being. 38
41 Table A.3: OLS regression of the determinants of GHQ-12 39
42 Table A.4 : OLS regression, effect of the regional unemployment rate on the GHQ difference between employed and unemployed. Table 5: Table A.4 : Regression of Regional unemployment rate on Difference in GHQ in region Variable Coefficient (Std. Err.) urate (2.452) Intercept (0.166) N 302 R F (1,300)
43 The transition matrix above shows how subjevtive well-being changes after a transition between labor states; for both men and women. 41
44 Table A.5 : OLS regression, GHQ-12 on determinants 42
45 Table A.6 : OLS regressions with Individual fixed effects Table A.6 : Specifications 1-6 from the fixed effect OLS regressions on interactions. 43
46 Table A.7 : OLS regressions with Individual fixed effects Table A.7 : Specifications 7-12 from the fixed effect OLS regressions on interactions. 44
47 Table 6: Table A.8 : Test of the Habituation Hypothesis : regression of unemployment duration on happiness - Pooled data Variable All Men Women Unemployment Duration t-stat (7.71) (6.55) (2.47) Constant Observations Table 7: Table A.8 : Test of the Habituation Hypothesis : regression of unemployment duration on happiness - Panel Data. In Variable All Men Women Unemployment Duration t-stat (-1.66) (-1.44) (-0.96) Constant Observations Table A.8 : OLS regression of unemployment duration and interaction on GHQ12, POOLED The effect of duration on happiness is positive, significant for men, but very small. Including employment status and demographic controls (age, education, civc status and health) affects neither the significance nor the coefficients. Table A.9 : OLS regression of unemployment duration and interaction on GHQ12, controlling for individual fixed effects: When controlling for individual fixed effects, the significance is gone. 45
48 Table A.9.5: Probit of Search intensity on controls and difference in happiness. 46
49 Table A.10: Duration OLS regression on difference of happiness. 47
50 Table A.11: Means Test :. ttest episode duration, by(bigloss) 48

51 survival Kaplan-Meier estimates Kaplan-Meier survival estimates analysis time 80% CI rose GHQ fell <=2 points analysis time graph with CI.pdf 80% CI GHQ rose 80% CI GHQ fell <=2 points Figure 1: error : Red line is GHQ fell 2 points 49

52 50
Can Subjective Well-Being Predict Unemployment Duration?
 Can Subjective Well-Being Predict Unemployment Duration? Dimitris Mavridis This version :February 21, 2012 Abstract This paper uses 16 waves of panel data from the British Household Panel Survey to evaluate
Unemployment and Happiness
 Unemployment and Happiness Fumio Ohtake Osaka University Are unemployed people unhappier than employed people? To answer this question, this paper presents an extensive review of previous overseas studies
How exogenous is exogenous income? A longitudinal study of lottery winners in the UK
 How exogenous is exogenous income? A longitudinal study of lottery winners in the UK Dita Eckardt London School of Economics Nattavudh Powdthavee CEP, London School of Economics and MIASER, University
Happy Voters. Exploring the Intersections between Economics and Psychology. Federica Liberini 1, Eugenio Proto 2 Michela Redoano 2.
 Exploring the Intersections between Economics and Psychology Federica Liberini 1, Eugenio Proto 2 Michela Redoano 2 1 ETH Zurich, 2 Warwick University and IZA 3 Warwick University 29 January 2015 Overview
The Effects of Reducing the Entitlement Period to Unemployment Insurance
 The Effects of Reducing the Entitlement Period to Unemployment Insurance Benefits Nynke de Groot Bas van der Klaauw July 14, 2014 Abstract This paper exploits a substantial reform of the Dutch UI law to
Inter-ethnic Marriage and Partner Satisfaction
 DISCUSSION PAPER SERIES IZA DP No. 5308 Inter-ethnic Marriage and Partner Satisfaction Mathias Sinning Shane Worner November 2010 Forschungsinstitut zur Zukunft der Arbeit Institute for the Study of Labor
Does Growth make us Happier? A New Look at the Easterlin Paradox
 Does Growth make us Happier? A New Look at the Easterlin Paradox Felix FitzRoy School of Economics and Finance University of St Andrews St Andrews, KY16 8QX, UK Michael Nolan* Centre for Economic Policy
The Relative Income Hypothesis: A comparison of methods.
 The Relative Income Hypothesis: A comparison of methods. Sarah Brown, Daniel Gray and Jennifer Roberts ISSN 1749-8368 SERPS no. 2015006 March 2015 The Relative Income Hypothesis: A comparison of methods.
The Social Costs of Unemployment: Accounting for Unemployment Duration
 Thünen-Series of Applied Economic Theory Thünen-Reihe Angewandter Volkswirtschaftstheorie Working Paper No. 60 The Social Costs of Unemployment: Accounting for Unemployment Duration Carsten Ochsen Heinz
The Impact of Employment Transitions on Subjective Well- eing
 WORKING PAPER The Impact of Employment Transitions on Subjective Well-eing Evidence from the Great Recession and ts Aftermath Michael Hurd, Susann Rohwedder, Caroline Tassot RAND Labor & Population WR-1127
Understanding the subjective consequences of early job insecurity in Europe
 Understanding the subjective consequences of early job insecurity in Europe Dominik Buttler Piotr Michoń Poznan University of Economics and Business Sara Ayllón Gatnau University of Girona Carolina Zuccotti
The Effects of Reducing the Entitlement Period to Unemployment Insurance
 The Effects of Reducing the Entitlement Period to Unemployment Insurance Benefits Nynke de Groot Bas van der Klaauw February 6, 2019 Abstract This paper uses a difference-in-differences approach exploiting
The Effects of Increasing the Early Retirement Age on Social Security Claims and Job Exits
 The Effects of Increasing the Early Retirement Age on Social Security Claims and Job Exits Day Manoli UCLA Andrea Weber University of Mannheim February 29, 2012 Abstract This paper presents empirical evidence
Effects of working part-time and full-time on physical and mental health in old age in Europe
 Effects of working part-time and full-time on physical and mental health in old age in Europe Tunga Kantarcı Ingo Kolodziej Tilburg University and Netspar RWI - Leibniz Institute for Economic Research
CHAPTER 13. Duration of Spell (in months) Exit Rate
 Exit Rate") CHAPTER 13 13-1. Suppose there are 25,000 unemployed persons in the economy. You are given the following data about the length of unemployment spells: Duration of Spell (in months) Exit Rate 1 0.60 2 0.20
CHAPTER 13 13-1. Suppose there are 25,000 unemployed persons in the economy. You are given the following data about the length of unemployment spells: Duration of Spell (in months) Exit Rate 1 0.60 2 0.20
Explaining the Easterlin paradox
 Explaining the Easterlin paradox Easterlin s proposed explanations: Income comparison and relative utility Adaptation Both imply thresholds in the individual utility function Benchmarks: self-regarding/
Job Loss, Retirement and the Mental Health of Older Americans
 Job Loss, Retirement and the Mental Health of Older Americans Bidisha Mandal Brian Roe The Ohio State University Outline!! Motivation!! Literature!! Data!! Model!! Results!! Conclusion!! Future Research
Jamie Wagner Ph.D. Student University of Nebraska Lincoln
 An Empirical Analysis Linking a Person s Financial Risk Tolerance and Financial Literacy to Financial Behaviors Jamie Wagner Ph.D. Student University of Nebraska Lincoln Abstract Financial risk aversion
Evaluating Search Periods for Welfare Applicants: Evidence from a Social Experiment
 Evaluating Search Periods for Welfare Applicants: Evidence from a Social Experiment Jonneke Bolhaar, Nadine Ketel, Bas van der Klaauw ===== FIRST DRAFT, PRELIMINARY ===== Abstract We investigate the implications
JALAL EL OUARDIGHI & FRANCIS MUNIER FACULTÉ DES SCIENCES ECONOMIQUES ET DE GESTION UNIVERSITÉ DE STRASBOURG
 JALAL EL OUARDIGHI & FRANCIS MUNIER FACULTÉ DES SCIENCES ECONOMIQUES ET DE GESTION UNIVERSITÉ DE STRASBOURG SCHEDULE Salient facts : Happiness Unemployment Inflation How does unemployment affect happiness?
Saving for Retirement: Household Bargaining and Household Net Worth
 Saving for Retirement: Household Bargaining and Household Net Worth Shelly J. Lundberg University of Washington and Jennifer Ward-Batts University of Michigan Prepared for presentation at the Second Annual
Labor Economics Field Exam Spring 2014
 Labor Economics Field Exam Spring 2014 Instructions You have 4 hours to complete this exam. This is a closed book examination. No written materials are allowed. You can use a calculator. THE EXAM IS COMPOSED
Did the Social Assistance Take-up Rate Change After EI Reform for Job Separators?
 Did the Social Assistance Take-up Rate Change After EI for Job Separators? HRDC November 2001 Executive Summary Changes under EI reform, including changes to eligibility and length of entitlement, raise
Predicting the Probability of Being a Smoker: A Probit Analysis
 Predicting the Probability of Being a Smoker: A Probit Analysis Department of Economics Florida State University Tallahassee, FL 32306-2180 Abstract This paper explains the probability of being a smoker,
How Does Education Affect Mental Well-Being and Job Satisfaction?
 A summary of a paper presented to a National Institute of Economic and Social Research conference, at the University of Birmingham, on Thursday June 6 How Does Education Affect Mental Well-Being and Job
Appendix A. Additional Results
 Appendix A Additional Results for Intergenerational Transfers and the Prospects for Increasing Wealth Inequality Stephen L. Morgan Cornell University John C. Scott Cornell University Descriptive Results
a. Explain why the coefficients change in the observed direction when switching from OLS to Tobit estimation.
 1. Using data from IRS Form 5500 filings by U.S. pension plans, I estimated a model of contributions to pension plans as ln(1 + c i ) = α 0 + U i α 1 + PD i α 2 + e i Where the subscript i indicates the
Firing Costs, Employment and Misallocation
 Firing Costs, Employment and Misallocation Evidence from Randomly Assigned Judges Omar Bamieh University of Vienna November 13th 2018 1 / 27 Why should we care about firing costs? Firing costs make it
Labor Participation and Gender Inequality in Indonesia. Preliminary Draft DO NOT QUOTE
 Labor Participation and Gender Inequality in Indonesia Preliminary Draft DO NOT QUOTE I. Introduction Income disparities between males and females have been identified as one major issue in the process
HYPERTENSION AND LIFE SATISFACTION: A COMMENT AND REPLICATION OF BLANCHFLOWER AND OSWALD (2007)
") HYPERTENSION AND LIFE SATISFACTION: A COMMENT AND REPLICATION OF BLANCHFLOWER AND OSWALD (2007) Stefania Mojon-Azzi Alfonso Sousa-Poza December 2007 Discussion Paper no. 2007-44 Department of Economics
HYPERTENSION AND LIFE SATISFACTION: A COMMENT AND REPLICATION OF BLANCHFLOWER AND OSWALD (2007) Stefania Mojon-Azzi Alfonso Sousa-Poza December 2007 Discussion Paper no. 2007-44 Department of Economics
How Changes in Unemployment Benefit Duration Affect the Inflow into Unemployment
 DISCUSSION PAPER SERIES IZA DP No. 4691 How Changes in Unemployment Benefit Duration Affect the Inflow into Unemployment Jan C. van Ours Sander Tuit January 2010 Forschungsinstitut zur Zukunft der Arbeit
In Debt and Approaching Retirement: Claim Social Security or Work Longer?
 AEA Papers and Proceedings 2018, 108: 401 406 https://doi.org/10.1257/pandp.20181116 In Debt and Approaching Retirement: Claim Social Security or Work Longer? By Barbara A. Butrica and Nadia S. Karamcheva*
Review questions for Multinomial Logit/Probit, Tobit, Heckit, Quantile Regressions
 1. I estimated a multinomial logit model of employment behavior using data from the 2006 Current Population Survey. The three possible outcomes for a person are employed (outcome=1), unemployed (outcome=2)
An Empirical Note on the Relationship between Unemployment and Risk- Aversion
 An Empirical Note on the Relationship between Unemployment and Risk- Aversion Luis Diaz-Serrano and Donal O Neill National University of Ireland Maynooth, Department of Economics Abstract In this paper
Comparison Income Effect on Subjective Well-Being
 Comparison Income Effect on Subjective Well-Being Abstract We follow the comparison income effect study on subjective well-being in Ferrer-i- Carbonell (2005), and test the robustness of those results
Poverty and Witch Killing
 Poverty and Witch Killing Review of Economic Studies 2005 Edward Miguel October 24, 2013 Introduction General observation: Poverty and violence go hand in hand. Strong negative relationship between economic
World of Labor. Cons. Pros. University of Zurich, Switzerland, and IZA, Germany
 Rainer Winkelmann University of Zurich, Switzerland, and IZA, Germany Unemployment and happiness Successful policies for helping the unemployed need to confront the adverse effects of unemployment on feelings
Ministry of Health, Labour and Welfare Statistics and Information Department
 Special Report on the Longitudinal Survey of Newborns in the 21st Century and the Longitudinal Survey of Adults in the 21st Century: Ten-Year Follow-up, 2001 2011 Ministry of Health, Labour and Welfare
Discussion of "The Value of Trading Relationships in Turbulent Times"
 Discussion of "The Value of Trading Relationships in Turbulent Times" by Di Maggio, Kermani & Song Bank of England LSE, Third Economic Networks and Finance Conference 11 December 2015 Mandatory disclosure
Mandated Labour Protections & Government Safety Nets: Economic outcomes and worker security
 Mandated Labour Protections & Government Safety Nets: Economic outcomes and worker security Debra Hevenstone Policy Studies Institute July 8, 2009 Debra Hevenstone (Policy Studies Institute) Labour Protections
Labor Market Effects of the Early Retirement Age
 Labor Market Effects of the Early Retirement Age Day Manoli UT Austin & NBER Andrea Weber University of Mannheim & IZA September 30, 2012 Abstract This paper presents empirical evidence on the effects
Conditional inference trees in dynamic microsimulation - modelling transition probabilities in the SMILE model
 4th General Conference of the International Microsimulation Association Canberra, Wednesday 11th to Friday 13th December 2013 Conditional inference trees in dynamic microsimulation - modelling transition
Not so voluntary retirement decisions? Evidence from a pension reform
 Finnish Centre for Pensions Working Papers 9 Not so voluntary retirement decisions? Evidence from a pension reform Tuulia Hakola, Finnish Centre for Pensions Roope Uusitalo, Labour Institute for Economic
New Evidence on the Demand for Advice within Retirement Plans
 Research Dialogue Issue no. 139 December 2017 New Evidence on the Demand for Advice within Retirement Plans Abstract Jonathan Reuter, Boston College and NBER, TIAA Institute Fellow David P. Richardson
COMMUNITY ADVANTAGE PANEL SURVEY: DATA COLLECTION UPDATE AND ANALYSIS OF PANEL ATTRITION
 COMMUNITY ADVANTAGE PANEL SURVEY: DATA COLLECTION UPDATE AND ANALYSIS OF PANEL ATTRITION Technical Report: February 2013 By Sarah Riley Qing Feng Mark Lindblad Roberto Quercia Center for Community Capital
Benefit Duration, Unemployment Duration and Job Match Quality: A Regression-Discontinuity Approach
 DISCUSSION PAPER SERIES IZA DP No. 4670 Benefit Duration, Unemployment Duration and Job Match Quality: A Regression-Discontinuity Approach Marco Caliendo Konstantinos Tatsiramos Arne Uhlendorff December
Labor Force Participation Elasticities of Women and Secondary Earners within Married Couples. Rob McClelland* Shannon Mok* Kevin Pierce** May 22, 2014
 Labor Force Participation Elasticities of Women and Secondary Earners within Married Couples Rob McClelland* Shannon Mok* Kevin Pierce** May 22, 2014 *Congressional Budget Office **Internal Revenue Service
Retirement and Unexpected Health Shocks
 Retirement and Unexpected Health Shocks BÉNÉDICTE APOUEY (PSE, FRANCE) CAHIT GUVEN (DEAKIN UNIVERSITY, AUSTRALIA) CLAUDIA SENIK (PSE, FRANCE) Motivation Workers plan to retire as soon as they are entitled
To What Extent is Household Spending Reduced as a Result of Unemployment?
 To What Extent is Household Spending Reduced as a Result of Unemployment? Final Report Employment Insurance Evaluation Evaluation and Data Development Human Resources Development Canada April 2003 SP-ML-017-04-03E
JOB SATISFACTION AND FAMILY HAPPINESS: THE PART-TIME WORK PUZZLE*
 The Economic Journal, 118 (February), F77 F99.. Published by Blackwell Publishing, 9600 Garsington Road, Oxford OX4 2DQ, UK and 350 Main Street, Malden, MA 02148, USA. JOB SATISFACTION AND FAMILY HAPPINESS:
Using the British Household Panel Survey to explore changes in housing tenure in England
 Using the British Household Panel Survey to explore changes in housing tenure in England Tom Sefton Contents Data...1 Results...2 Tables...6 CASE/117 February 2007 Centre for Analysis of Exclusion London
MULTIVARIATE FRACTIONAL RESPONSE MODELS IN A PANEL SETTING WITH AN APPLICATION TO PORTFOLIO ALLOCATION. Michael Anthony Carlton A DISSERTATION
 MULTIVARIATE FRACTIONAL RESPONSE MODELS IN A PANEL SETTING WITH AN APPLICATION TO PORTFOLIO ALLOCATION By Michael Anthony Carlton A DISSERTATION Submitted to Michigan State University in partial fulfillment
Double-edged sword: Heterogeneity within the South African informal sector
 Double-edged sword: Heterogeneity within the South African informal sector Nwabisa Makaluza Department of Economics, University of Stellenbosch, Stellenbosch, South Africa nwabisa.mak@gmail.com Paper prepared
HOUSEHOLDS INDEBTEDNESS: A MICROECONOMIC ANALYSIS BASED ON THE RESULTS OF THE HOUSEHOLDS FINANCIAL AND CONSUMPTION SURVEY*
 HOUSEHOLDS INDEBTEDNESS: A MICROECONOMIC ANALYSIS BASED ON THE RESULTS OF THE HOUSEHOLDS FINANCIAL AND CONSUMPTION SURVEY* Sónia Costa** Luísa Farinha** 133 Abstract The analysis of the Portuguese households
The Effect of a Longer Working Horizon on Individual and Family Labour Supply
 The Effect of a Longer Working Horizon on Individual and Family Labour Supply Francesca Carta Marta De Philippis Bank of Italy December 1, 2017 Paris, ASME BdF Labour Market Conference Motivation: delaying
THE SOCIAL COST OF UNEMPLOYMENT (A SOCIAL WELFARE APPROACH)
") THE SOCIAL COST OF UNEMPLOYMENT (A SOCIAL WELFARE APPROACH) Lucía Gorjón Sara de la Rica Antonio Villar Ispra, 2018 1 INDICATORS What we measure affects what we think 2 INTRODUCTION 3 BEYOND UNEMPLOYMENT
THE SOCIAL COST OF UNEMPLOYMENT (A SOCIAL WELFARE APPROACH) Lucía Gorjón Sara de la Rica Antonio Villar Ispra, 2018 1 INDICATORS What we measure affects what we think 2 INTRODUCTION 3 BEYOND UNEMPLOYMENT
Self-Reported Satisfaction and the Economic Crisis of : Or How People in the UK and Germany Perceive a Severe Cyclical Downturn
 Soc Indic Res DOI 10.1007/s11205-014-0854-9 Self-Reported Satisfaction and the Economic Crisis of 2007 2010: Or How People in the and Perceive a Severe Cyclical Downturn Antje Mertens Miriam Beblo Accepted:
Pension Wealth and Household Saving in Europe: Evidence from SHARELIFE
 Pension Wealth and Household Saving in Europe: Evidence from SHARELIFE Rob Alessie, Viola Angelini and Peter van Santen University of Groningen and Netspar PHF Conference 2012 12 July 2012 Motivation The
Inequality at Work: The Effect of Peer Salaries on Job Satisfaction
 Inequality at Work: The Effect of Peer Salaries on Job Satisfaction David Card, UC Berkeley Alex Mas, Princeton Enrico Moretti, UC Berkeley Emmanuel Saez, UC Berkeley April 2011 1 MOTIVATION Possibility
Adaptation, Anticipation and Social Interactions in Happiness: An Integrated Error-Correction Approach. Maarten Vendrik Maastricht University IZA
 Adaptation, Anticipation and Social Interactions in Happiness: An Integrated Error-Correction Approach Maarten Vendrik Maastricht University IZA Research area Dynamics of happiness of individual people
Nikica Mojsoska Blazevski Marjan Petreski Marjan Bojadziev
 Youth survival on the labour market: Comparative evidence from three Western Balkan economies in The Economic and Labour Relations Review (forthcoming issue) Nikica Mojsoska Blazevski (nikica@uacs.edu.mk)
Time use, emotional well-being and unemployment: Evidence from longitudinal data
 Time use, emotional well-being and unemployment: Evidence from longitudinal data Alan B. Krueger CEA, Woodrow Wilson School and Economics Dept., Princeton University Andreas Mueller Columbia University
What You Don t Know Can t Help You: Knowledge and Retirement Decision Making
 VERY PRELIMINARY PLEASE DO NOT QUOTE COMMENTS WELCOME What You Don t Know Can t Help You: Knowledge and Retirement Decision Making February 2003 Sewin Chan Wagner Graduate School of Public Service New
Happiness and House Prices in Canada:
 2016, Vol.5(2), pp. 57 86. ISSN 2304 1366 http://www.ijmess.com Happiness and House Prices in Canada: 2009-2013 Hussaun A. Syed Wilfrid Laurier University, Canada The purpose of this study was to understand
Unhappiness and Job Finding
 D I S C U S S I O N P A P E R S E R I E S IZA DP No. 6320 Unhappiness and Job Finding Anne C. Gielen Jan C. van Ours January 2012 Forschungsinstitut zur Zukunft der Arbeit Institute for the Study of Labor
LABOR SUPPLY RESPONSES TO TAXES AND TRANSFERS: PART I (BASIC APPROACHES) Henrik Jacobsen Kleven London School of Economics
 Henrik Jacobsen Kleven London School of Economics") LABOR SUPPLY RESPONSES TO TAXES AND TRANSFERS: PART I (BASIC APPROACHES) Henrik Jacobsen Kleven London School of Economics Lecture Notes for MSc Public Finance (EC426): Lent 2013 AGENDA Efficiency cost
LABOR SUPPLY RESPONSES TO TAXES AND TRANSFERS: PART I (BASIC APPROACHES) Henrik Jacobsen Kleven London School of Economics Lecture Notes for MSc Public Finance (EC426): Lent 2013 AGENDA Efficiency cost
The Impact of a $15 Minimum Wage on Hunger in America
 The Impact of a $15 Minimum Wage on Hunger in America Appendix A: Theoretical Model SEPTEMBER 1, 2016 WILLIAM M. RODGERS III Since I only observe the outcome of whether the household nutritional level
Unemployed Versus Not in the Labor Force: Is There a Difference?
 Unemployed Versus Not in the Labor Force: Is There a Difference? Bruce H. Dunson Metrica, Inc. Brice M. Stone Metrica, Inc. This paper uses economic measures of behavior to examine the validity of the
Are Early Stage Investors Biased Against Women?
 Are Early Stage Investors Biased Against Women? Ewens & Townsend University of North Carolina at Chapel Hill & NBER NBER Entrepreneurship Working Group Meeting, December 2017 Discussion: Are Early Stage
Session III Differences in Differences (Dif- and Panel Data
 Session III Differences in Differences (Dif- in-dif) and Panel Data Christel Vermeersch March 2007 Human Development Network Middle East and North Africa Region Spanish Impact Evaluation Fund Structure
THE PERSISTENCE OF UNEMPLOYMENT AMONG AUSTRALIAN MALES
 THE PERSISTENCE OF UNEMPLOYMENT AMONG AUSTRALIAN MALES Abstract The persistence of unemployment for Australian men is investigated using the Household Income and Labour Dynamics Australia panel data for
The impact of the work resumption program of the disability insurance scheme in the Netherlands
 The impact of the work resumption program of the disability insurance scheme in the Netherlands Tunga Kantarci and Jan-Maarten van Sonsbeek DP 04/2018-025 The impact of the work resumption program of the
Thierry Kangoye and Zuzana Brixiová 1. March 2013
 GENDER GAP IN THE LABOR MARKET IN SWAZILAND Thierry Kangoye and Zuzana Brixiová 1 March 2013 This paper documents the main gender disparities in the Swazi labor market and suggests mitigating policies.
Absolute Income, Relative Income and Happiness: Comparison by Ethnic Groups
 Absolute Income, Relative Income and Happiness: Comparison by Ethnic Groups Richard Greenberg Advisor: Richard Ball April 27, 2017 Abstract Countries worldwide strive for economic growth that leads to
Kim Manturuk American Sociological Association Social Psychological Approaches to the Study of Mental Health
 Linking Social Disorganization, Urban Homeownership, and Mental Health Kim Manturuk American Sociological Association Social Psychological Approaches to the Study of Mental Health 1 Preview of Findings
Lessons from research on unemployment policies
 Econ 4715 Lecture 5 Lessons from research on unemployment policies Simen Markussen Insurance vs. incentives Policy makers face difficult trade-offs when designing unemployment insurance Insurance vs. incentives
The impact of monitoring and sanctioning on unemployment exit and job-finding rates
 Duncan McVicar Queen s University Belfast, UK The impact of monitoring and sanctioning on unemployment exit and Job search monitoring and benefit sanctions generally reduce unemployment duration and boost
NBER WORKING PAPER SERIES NEW MEASURES OF THE COSTS OF UNEMPLOYMENT: EVIDENCE FROM THE SUBJECTIVE WELL-BEING OF 2.3 MILLION AMERICANS
 NBER WORKING PAPER SERIES NEW MEASURES OF THE COSTS OF UNEMPLOYMENT: EVIDENCE FROM THE SUBJECTIVE WELL-BEING OF 2.3 MILLION AMERICANS John F. Helliwell Haifang Huang Working Paper 16829 http://www.nber.org/papers/w16829
COMMUNITY ADVANTAGE PANEL SURVEY: DATA COLLECTION UPDATE AND ANALYSIS OF PANEL ATTRITION
 COMMUNITY ADVANTAGE PANEL SURVEY: DATA COLLECTION UPDATE AND ANALYSIS OF PANEL ATTRITION Technical Report: February 2012 By Sarah Riley HongYu Ru Mark Lindblad Roberto Quercia Center for Community Capital
Analysing the IS-MP-PC Model
 University College Dublin, Advanced Macroeconomics Notes, 2015 (Karl Whelan) Page 1 Analysing the IS-MP-PC Model In the previous set of notes, we introduced the IS-MP-PC model. We will move on now to examining
Marzieh Abolhassani Subjective Well-Being Around Retirement
 Marzieh Abolhassani Subjective Well-Being Around Retirement MSc Thesis 2012-020 Master Thesis Subjective Well-being Around Retirement March 2012 Marzieh Abolhassani Supervisor: Prof. dr. R.J.M. Alessie
2. Employment, retirement and pensions
 2. Employment, retirement and pensions Rowena Crawford Institute for Fiscal Studies Gemma Tetlow Institute for Fiscal Studies The analysis in this chapter shows that: Employment between the ages of 55
Public-private sector pay differential in UK: A recent update
 Public-private sector pay differential in UK: A recent update by D H Blackaby P D Murphy N C O Leary A V Staneva No. 2013-01 Department of Economics Discussion Paper Series Public-private sector pay differential
Joint Retirement Decision of Couples in Europe
 Joint Retirement Decision of Couples in Europe The Effect of Partial and Full Retirement Decision of Husbands and Wives on Their Partners Partial and Full Retirement Decision Gülin Öylü MSc Thesis 07/2017-006
Statistical Evidence and Inference
 Statistical Evidence and Inference Basic Methods of Analysis Understanding the methods used by economists requires some basic terminology regarding the distribution of random variables. The mean of a distribution
THE GREAT RECESSION: UNEMPLOYMENT INSURANCE AND STRUCTURAL ISSUES
 THE GREAT RECESSION: UNEMPLOYMENT INSURANCE AND STRUCTURAL ISSUES Jesse Rothstein CLSRN Summer School June 2013 Unemployment Rate Percent of labor force, seasonally adjusted 12 10 Oct. 2009: 10.0% 8 6
CHAPTER 5 RESULT AND ANALYSIS
 CHAPTER 5 RESULT AND ANALYSIS This chapter presents the results of the study and its analysis in order to meet the objectives. These results confirm the presence and impact of the biases taken into consideration,
Canadian Labour Market and Skills Researcher Network
 Canadian Labour Market and Skills Researcher Network Working Paper No. 117 Employer-provided pensions, incomes, and hardship in early transitions to retirement Kevin Milligan University of British Columbia
COMMUNITY ADVANTAGE PANEL SURVEY: DATA COLLECTION UPDATE AND ANALYSIS OF PANEL ATTRITION
 COMMUNITY ADVANTAGE PANEL SURVEY: DATA COLLECTION UPDATE AND ANALYSIS OF PANEL ATTRITION Technical Report: March 2011 By Sarah Riley HongYu Ru Mark Lindblad Roberto Quercia Center for Community Capital
Fertility Decline and Work-Life Balance: Empirical Evidence and Policy Implications
 Fertility Decline and Work-Life Balance: Empirical Evidence and Policy Implications Kazuo Yamaguchi Hanna Holborn Gray Professor and Chair Department of Sociology The University of Chicago October, 2009
$1,000 1 ( ) $2,500 2,500 $2,000 (1 ) (1 + r) 2,000
 $2,500 2,500 $2,000 (1 ) (1 + r) 2,000") Answers To Chapter 9 Review Questions 1. Answer d. Other benefits include a more stable employment situation, more interesting and challenging work, and access to occupations with more prestige and more
Answers To Chapter 9 Review Questions 1. Answer d. Other benefits include a more stable employment situation, more interesting and challenging work, and access to occupations with more prestige and more
Happiness across the life span:
 Happiness across the life span: Evidence from urban Pakistan Khadija Shams a and Alexander Hendrik Kadow b a Dept. of Economics, Shaheed Benazir Bhutto Women University, Peshawar, Pakistan; email: kshams2008@gmail.com
Government spending and firms dynamics
 Government spending and firms dynamics Pedro Brinca Nova SBE Miguel Homem Ferreira Nova SBE December 2nd, 2016 Francesco Franco Nova SBE Abstract Using firm level data and government demand by firm we
Bank Switching and Interest Rates: Examining Annual Transfers Between Savings Accounts
 https://doi.org/10.1007/s10693-018-0305-x Bank Switching and Interest Rates: Examining Annual Transfers Between Savings Accounts Dirk F. Gerritsen 1 & Jacob A. Bikker 1,2 Received: 23 May 2017 /Revised:
EC989 Behavioural Economics. Sketch solutions for Class 2
 EC989 Behavioural Economics Sketch solutions for Class 2 Neel Ocean (adapted from solutions by Andis Sofianos) February 15, 2017 1 Prospect Theory 1. Illustrate the way individuals usually weight the probability
14.471: Fall 2012: Recitation 3: Labor Supply: Blundell, Duncan and Meghir EMA (1998)
") 14.471: Fall 2012: Recitation 3: Labor Supply: Blundell, Duncan and Meghir EMA (1998) Daan Struyven September 29, 2012 Questions: How big is the labor supply elasticitiy? How should estimation deal whith
14.471: Fall 2012: Recitation 3: Labor Supply: Blundell, Duncan and Meghir EMA (1998) Daan Struyven September 29, 2012 Questions: How big is the labor supply elasticitiy? How should estimation deal whith
Labor Economics Field Exam Spring 2011
 Labor Economics Field Exam Spring 2011 Instructions You have 4 hours to complete this exam. This is a closed book examination. No written materials are allowed. You can use a calculator. THE EXAM IS COMPOSED
Effects of Increased Elderly Employment on Other Workers Employment and Elderly s Earnings in Japan. Ayako Kondo Yokohama National University
 Effects of Increased Elderly Employment on Other Workers Employment and Elderly s Earnings in Japan Ayako Kondo Yokohama National University Overview Starting from April 2006, employers in Japan have to
Subjective Financial Situation and Overall Life Satisfaction: A Joint Modelling Approach
 Subjective Financial Situation and Overall Life Satisfaction: A Joint Modelling Approach Daniel Gray: daniel.gray@sheffield.ac.uk University of Sheffield Abstract Analysing the German Socio-Economic Panel
Unemployment Duration in the United Kingdom. An Incomplete Data Analysis. Ralf A. Wilke University of Nottingham
 Unemployment Duration in the United Kingdom An Incomplete Data Analysis Ralf A. Wilke University of Nottingham 1. Motivation The determinants for the length of unemployment and out of the labour market