Happiness and House Prices in Canada:
|
|
|
- Audrey Austin
- 5 years ago
- Views:
Transcription

1 2016, Vol.5(2), pp ISSN Happiness and House Prices in Canada: Hussaun A. Syed Wilfrid Laurier University, Canada The purpose of this study was to understand the relationship between happiness and housing prices in Canada. The happiness data were obtained from the General Social Survey between 2009 and 2013, asking respondents to report overall happiness level by using scale ranging between 1 to 10 points. House Price Indexes at the provincial level were constructed to cover the same period. The relationship between average house price change and average happiness was estimated using Ordinary Least Square and Logistic Regression techniques. Individual s characteristics were used as control variables. The study found that average happiness level is positively and significantly related to the change in housing prices for one group and not for another for homeowners but not for renters. In addition, individuals with better health are much happier than individuals with poor health. Similarly, individuals with higher income are happier than individuals with less income. The implication of this study is that the government should design attractive policies to encourage homeownerships. Keywords: House prices, happiness, well-being, life satisfaction, homeowners JEL: R31, O51 The economics of happiness is the study of relationships between human well-being and various factors that seem to affect their happiness level. There are many factors that affect the happiness of an individual in economics, including income, employment, social capital and health (Stutzer and Frey, 2012). In addition to the above-mentioned factors, wealth is considered to be an important aspect found in happiness literature. Frequent fluctuations in wealth occur when housing prices fluctuate. When housing prices fluctuate an individual may feel himself happy or unhappy due to fluctuation in the overall wealth. This paper investigates the hypothesis that homeowners feel happier because of the increase in house prices Manuscript received March 2, 2016; revised June 2, 2016; accepted June 14, The Author; CC BY-NC; Licensee IJMESS Corresponding author: hussaun@gmail.com in Canada. Hence, the research question is the following one: Do changes in housing prices can affect the measured happiness of Canadians in a different way between homeowners and nonhomeowners? It may also be helpful in our interpretation of measures of happiness if we observe responses to happiness from changes in wealth. There should be enough variation among Canadian provinces in house price change to detect this effect. In last 10 years Canada has observed tremendous growth in housing prices across the country (MLS Home Price Index, 2015). Within the large national variation there is a substantial regional variation as shown in Figure 1. Figure 1 shows that as compared to base year of 2007, growth in housing prices across all Canadian provinces is significant. Saskatchewan, Manitoba and Newfoundland observed growth of
2 58 more than 50 percent in these last 8 years. Ontario, British Columbia and Quebec experienced fast growth of more than 30 percent. New Brunswick and Nova Scotia experienced growth of close to 20 percent from 2007 to Hence, except for Alberta and Prince Edward Island, all provinces experienced tremendous growth in housing prices from 2007 to 2014 (MLS Home Price Index, 2015). This paper is structured as follow. Section 2 briefly introduces the theoretical background of the study and discusses previous studies about happiness literature. Section 3 discusses the methodology and econometric techniques used in this research. Section 4 presents the main results and findings followed by section 5 which provides the conclusion. Section 6 discusses the limitations. This consistent growth in housing prices LITERATURE REVIEW Source: Designed by Author. Data obtained from MLS Housing Price Index Figure 1: Housing Price Index over the last few years motivated us to explore the relationship between housing prices and happiness. As expected, the results and findings show that there is a positive relationship between happiness and increase in housing prices in Canada for homeowners. In addition, there is negative relationship between happiness and increase in housing prices for non-homeowners. The results are statistically significant. It is difficult to have a simple interpretation of the magnitude of the effect. Economics of happiness is a relatively new topic in research and applied economics. In most of the previous literature authors have conducted research on relationship between happiness and economic factors. The research linking happiness to housing prices is much more limited. This study is of its first kind to understand the relationship between housing prices and happiness in Canada. The next few sections are designed to shed light on previous research on happiness literature.
3 59 Syed The Measurement of Well-being or Happiness Although economists often use an objective measure of economic well-being, perhaps income, the subjective measurement of wellbeing uses survey based questions about how individuals feel about their happiness. Subjective measures gained their popularity in modern economics due to their multidimensional aspect (Bandura and Conceicao, 2008). A subjective measure captures all aspects of life including health, employment status, education, income, social capital, environment and more. In measuring subjective happiness, there are further two broad categories of survey designs. The first one focuses on questions related to happiness, as an example How happy are you? The answer to select from Not happy, Happy or Very Happy. Alternatively, the question asked the respondent to rank their happiness level on a scale of 1 to 10 with 1 being very dissatisfied and 10 being very satisfied. Bandura and Conceicao (2008) argue that the ranking method from 1 to 10 with multidimensional questionnaire produces the most reliable indication of happiness as it captures several aspects of individual s happiness. In addition, many authors have used such indices to infer happiness levels of individuals. Wolverson (2011) uses a Better Life Index that includes many of the economic indicators that are not included in GDP per capita. Items such as housing, education, environment, governance, life satisfaction, and work-life balance are combined. This index is not in common use. According to Better Life Index there are other measures of well-being. Bergheim (2006) prefers the Human Development Index (HDI), which seems to be much better measure of well-being. The index includes life expectancy at birth, education and GDP. However, the limitation of HDI is its narrowness and correlation with gross domestic product (GDP). Bergheim (2006) discusses a more comprehensive measure, Weighted Index of Social Progress, which includes such an important aspects of well-being, as education, health, income, role of women, environment and even social capital. Bergheim (2006) also discusses the Happy Planet Index (HPI) as a measure of well-being. The HPI focuses on life expectancy and happiness. HPI includes life satisfaction and consumption of natural resources. All these indices are alternative means of measuring happiness and may give a better picture of human well-being in comparison to GDP per capita. Current GDP per capita simply captures the output per person in a given country, but fails to capture another aspects like education, health and life expectancy at birth. The above mentioned indices have different weights for different economic factors. Index of well-being then can be calculated based on weighted average. As an example if we have 50 percent weight on GDP per capita and 50 percent on life expectancy the index can be measured using the following equation: This places weights on the relative importance of other factors that can influence happiness level. Hence, the happiness allows people to choose their own weights.
4 60 Therefore, authors use several different techniques and methods to measure the happiness level. There is no single universal measure of happiness. However, in choosing between methods of measurement of happiness between subjective survey questionnaires and economic indicators such as GDP per capita or certain indices, authors have found that survey questions produce the most compelling results. Sample across Countries This section of the study is designed to give its reader, in a concise manner, an overview of previous literature on happiness and various factors affecting happiness level in across country studies. In the past, GDP has been used as a measure of human well-being. GDP measures the market value of final goods and services produced in an economy. Indeed, much research tries to find better measures of happiness than GDP per capita. Costanza et al. (2009) consider GDP per capita to be less than ideal indicator of human well-being. It fails to capture many aspects of quality of life such as health, education and social capital. There is an important attempt in the literature to link per capita GDP to the survey measures of well-being. Easterlin and Angelescu (2009) gathered data from World Values Survey, Euro-Barometer and Latino-Barometer to try to understand the relationship between per capita GDP growth and happiness among the 37 countries. Authors used ordinary least square (OLS) technique to understand this relationship for period. Happiness is measured using different scales in different surveys, however, author decided to convert different point scales into one scale of 1 to 10 where 1 means very dissatisfied and 10 means very satisfied with life as a whole. GDP per capita and happiness seemed to have short term positive relationship; however, there was no significant long term relationship in his sample between the variables. Easterlin and Angelescu (2009) concluded that the short term positive relationship between happiness and per capita GDP growth was associated with other macroeconomic factors such as low unemployment and inflation. Easterlin and Angelescu s findings and hypotheses encouraged several other authors to conduct research on happiness literature. According to Oulton (2012), desires and preferences of people are directly linked to GDP per capita and hence an increase in GDP per capita would lead to higher well-being. Oulton (2012) argues that GDP per capita is a good indicator of happiness in cross countries data due to its high correlation with other human welfare factors such as life expectancy and inequality. Helliwell et al. (2012) in the World Happiness Report estimated the relationship between happiness and GDP per capita across 153 countries for the period of 1981 to Authors used survey method to measure happiness and included various control variables including age, health, religion and gender. Happiness is measured by using 3 different types of scales for different surveys from around the globe. Scales varied from 1 to 10, 0 to 10 and 1 to 7 response format where the minimum value being is very dissatisfied and maximum one is very satisfied. By using OLS technique authors found
5 61 Syed a positive significant relationship between happiness and GDP per capita. Sivak (2013) estimated the relationship between happiness and GDP per capita across European Union (EU) Countries for the period of 1973 to To measure happiness individuals were asked about their happiness level on scale ranging from 1 to 4 where 1 means Not at all satisfied and 4 means Very satisfied. Data were obtained using Euro-Barometer with sample size of 519 observations. This was a study using country-yearas the unit of observation. Sivak (2013) used OLS regression technique with country fixed effects. The main dependent variable was happiness variable and several control variables were concerned with inflation, unemployment, institutional quality and life expectancy. The author found that GDP per capita plays an important role in the overall wellbeing of individuals; however, the results vary across countries. Increase in GDP per capita in EU countries was associated with an increase in happiness level. According to Sivak (2013) unemployment has significant negative relationship with happiness. As an unemployment rate increases in a given country, happiness level decreases significantly. Inflation also has negative relationship; however, it is not as significant as unemployment. Similarly, life expectancy has negative relationship with happiness and is significant at 10 percent. On the other hand, institution quality has positive significant relationship with happiness. As the quality of institutions improves, the happiness level of individuals seems to increase (Sivak, 2013). One limitation of Sivak (2013) was the sample size. The sample size was small to observe the relationship across EU countries. Tella et al. (2001) obtained much larger sample across EU countries to obtain relationship between happiness and macroeconomic factors such as unemployment and inflation. Total sample size was 264,710 for 12 EU countries from period of 1975 to The data were obtained from Euro-Barometer. Using OLS technique they found that relationship between inflation and happiness and between unemployment and happiness were negative and significant. Tella et al. (2001) went one step further and shed light on which of these two economic indicators were more significant. Unemployment was more significantly related to happiness in comparison to inflation. Authors found that people are willing to trade 1.7 percentage-point increases in inflation for 1 percentage-point increase in unemployment. Hence, many authors have conducted research on happiness and macroeconomic factors such as GDP per capita, inflation and unemployment using across country samples and found that there is positive relationship between happiness and GDP per capita and negative relationship between unemployment and happiness. Samples from within Countries In this section happiness and macroeconomic factors are examined based on sample within countries. Some of the papers mentioned above are revisited to understand their research on within country samples. Sivak (2013) was discussed earlier in across sample studies; he also estimated the
6 62 relationship between well-being and GDP per capita within the US. He collected happiness data from General Social Survey (GSS) and GDP data from World Bank for the period of 1972 to The total numbers of observations were 29. Sivak (2013) found that an increase in GDP per capita has no significant relationship with well-being in America. He added other macroeconomic factors such as unemployment to the American part of the study and found more significant relationship with well-being. Relationship between unemployment and happiness was found to be negative and significant. Guo and Hu (2011) estimated the relationship between happiness and economic factors such as inflation, unemployment and GDP per capita in the USA. Individual data was obtained from General Social Survey (GSS) and national data from World Bank Data Bank. Happiness was measured based on self-reported survey from GSS. Individuals are asked about their happiness level from scale ranging 1 to 3 points where 1 means Not too Happy and 3 means Very Happy. They used 32,701 individual observations for the period of 1972 to Guo and Hu (2011) used OLS technique to understand this relationship. They also used several control and dummy variables including age, sex, race, marital status, work status, health and education. They found that increase in GDP per capita does not necessarily reflect that all individuals are richer. An unequal increase in wealth can have a negative effect on level of well-being of poor individuals. They found no significant relationship between well-being and GDP per capita. In within countries studies, Guo and Hu (2011) found that household income has significant positive relation with happiness. As the household income goes up, individuals feel themselves happier. According to them, this contradicting relationship between GDP per capita and happiness and income and happiness leads to further discussion on policy implications. In terms of control variables they found that health is the most significant variable and an improvement in health increases individual s happiness level by 20 percent as compare to base level of fair health. Married people are happier than people who never married. Finally, an increase in age causes happiness level to go up to a certain age level of 45 years. Guo and Hu (2011) also found that unemployment and inflation are negatively related to happiness and are statistically significant at 5 percent level. Easterlin (2001), using the GSS of the US mentioned that on average people with higher income responded to having higher subjective well-being. Author used survey question from GSS to gather happiness. Happiness was measured by asking individuals question about how does an individual feels about his or her life from the scale of 1 to 4 where 1 means Not Happy and 4 means Very Happy. Among people with low income only 16 percent responded very happy. In comparison, 44 percent of all interviewees whose income was above average, range of 75,000 and over per year responded very happy. According to Easterlin (2001), over the life cycle of an individual, personal income and happiness do not move together due to the individual s aspirations. He argued that as the time moves on, individual s
7 63 Syed aspirations grow and offset the increase in happiness caused by an increase in income. Hence, in the long run there is no significant relationship between income and happiness due to personal preferences and aspirations. Similar to above findings, Bayer and Juessen (2012) found that income and happiness are positively correlated. They collected the data from German Annual Socio-Economic Panel (SOEP) for the period from 1984 to The total number of observations in the sample was 224,127. Happiness is measured by using survey design questionnaire. Individuals were asked about their satisfaction level from scale of 0 to 10 where 0 means Completely Dissatisfied and 10 means Completely Satisfied. Authors also included several control variables such as age, marital status, health status and employment. Using probit model, authors also estimated permanent and temporary income shocks on happiness. Persistent income shocks found to be significantly related to happiness. Persistent income shocks cause happiness level to go up; however, transitory income shocks were not significant (Bayer and Juessen, 2012). We may conclude from above mentioned studies that there is positive relationship between income and happiness. However, there seems to be no significant relationship between happiness and GDP per capita in within country samples. On the contrary, economic factors such as unemployment have negative significant relationship with happiness. The question then arises, what about the other individual factors such as housing wealth? Is there any significant relationship between change in housing prices and happiness levels? House Prices and Happiness This section of the study will enlighten its readers about the relationship between happiness and housing prices. Authors have used samples within and sample across countries to understand relationship between happiness and housing with different techniques. These papers are examined below. Owning a house in Latin America makes people happier and more satisfied (Ruprah, 2010). The data was collected using Latino- Barometer, a public survey in Latin America consisting of 18 countries and more than 19,000 households. Ruprah (2010) used logit model to estimate relationship between happiness and home ownership across Latin American countries and also within USA. Happiness is measured by asking individuals about their happiness level from scale of 1 to 4, where 1 means Not Happy and 4 means Very Happy. The control variables included in the regression were marital status, education, age, employment and gender. The result was both significant and positive. In other words, people who own their home are happier as compare to people who do not own homes in Latin America and the US. Headey et al. (2004) argue that wealth effects are positively and significantly correlated with happiness in Australia, Germany, Hungary, Netherland and UK. Happiness data was collected from social surveys from each of the above mentioned country. Happiness was measured by asking individuals to rank from 0 to 10 about their overall life satisfaction level, where
8 64 0 means Totally Dissatisfied and 10 means Totally Satisfied. From the household data for these five countries, authors found that income is not significantly related to happiness within countries; however, wealth is, after controlling for age, health, education and gender. Wealth data is collected based on total assets after subtracting all liabilities. Wealth includes private dwellings, commercial properties, investments and bank accounts. Headey et al. (2004) discuss that due to the wealth effect people seem to increase their consumption. As consumption increases, happiness level increases too. In past, many authors had researched on whether owning a house makes an individual happier as compared to renters, however, little research has been done on how the owner feels when house prices fluctuate. Researchers have found contradicting evidence in terms of the home ownership and happiness relationship. Rossi and Weber (1996) collected subjective well-being responses of American people using GSS and National Survey of Families and Household. To measure happiness, individuals were asked about how does an individual feel about life on scale ranging from 1 to 10. The total number of observations obtained from two surveys in their study were 14,500 individuals. Rossi and Weber (1996) found that owners seem to be happier than renters. Owners are happier and more satisfied and feel that their life planning will turn out as they planned in comparison to renters. Similarly, Ratcliffe (2010) has done a thorough research in her paper entitled Housing wealth or economic climate: Why do house prices matter for well-being? regarding changes in housing prices in the UK and level of happiness. The data was obtained from British Household Panel Survey (BHPS) and General Health Questionnaire (GHQ) with the sample size of 82,603 individuals for the period of 1991 to Happiness was measured using responses of individuals on life and health satisfaction level by using twelve different survey questions. Author then created 36 point index of happiness from the above responses and identified individual as happier if higher point. The data were obtained from individuals over time, therefore, Fixed Effect (FE) estimation is used to control for time effects. Controlled variables included in the analysis are marital status, age, household size, employment and gender. The estimation was obtained for four different categories fully homeowners, mortgaged homeowners, renters, and social renters. Four categories were included in estimation to understand the wealth effects of housing prices, in other words, causal relationship between happiness and increase in housing prices. Ratcliffe (2010) found that the relationship between increase in housing prices and level of happiness is positive and significant. People feel happier as the price of their house goes up. Relationship is positive and significant for both fully owned and mortgaged owned homeowners. In addition, non-homeowners also feel happier as the price of houses goes up. The question arises, why non-homeowners or in other words, renters, feel happier when house prices increase? Author argued that it can be due to macroeconomic factors. As the house prices are going up, overall economy might be doing well, an unemployment
9 65 Syed rate might be falling and income levels might be increasing, hence, everyone in the economy feels happier. This lack of causal relationship between increase in housing prices and happiness confirms that there seems to be a little or no wealth effect due to increase in housing prices in UK. As home owners and renters both feel happier about increase in housing prices (Ratcliffe, 2010). Hence, above mentioned authors found that people do feel happier if they own home due to wealth effect. However, changes in home prices may not have causal relationship with happiness. METHODOLOGY The purpose of this paper is to understand the relationship between increase in housing prices and level of happiness in Canada. This paper is an attempt to test Ratcliffe (2010) research in Canadian context. It is important to understand this relationship as house prices have increased significantly in Canada over the last 10 years (MLS Home Price Index, 2015). The techniques used in this paper to capture effect of changes in housing prices on happiness level are ordinary least square (OLS) and logistic regression. OLS is a relevant method as it captures the relationship between X and Y variables and determine best fitted line, where Y is a dependent variable and X is a categorical and dummy independent variable. OLS technique is executed using linear probability model (LPM). LPM is appropriate in this research as dependent variable is a binary variable. However, one of the limitations of LPM model is that it does not satisfy the law of probability. In other words, in LPM model probability values can fall below 0 and above 1 which are difficult to interpret as probability values should fall between 0 and 1. In order to overcome this limitation an alternative technique of logistic regression was used. Logistic regression is interpreted in terms of odds ratio. Logistic regression is also appropriate in this research as logistic regression is used in binary dependent variable models. As logistic regression is nonlinear, the probabilities do not fall below or above 0 and 1. Therefore, logistic regression provides better outcome (See Appendix-I). 1 At the initial stage, dependent variable was estimated with only one independent variable. The basic regression model is the following one: HAPPY 7orHAPPY 8 0 1PCHANGE * HOMEOWN (1) The dependent variable HAPPY is actually either HAPPY7 or HAPPY8. Both are binary measures of happiness derived from the General Social Survey. In the GSS happiness was measured using a 1 to 10 scale. Individuals were asked about life satisfaction in general social survey (GSS) how do they feel about their life as a whole where 0 means Very Dissatisfied and 10 means Very Satisfied (Lu et al. 2015). HAPPY7 is a transformation from the responses to the life satisfaction variable of GSS. It is defined as 0 and 1 where 0 means Not Happy and 1 means Happy. Individuals whose response is from 0 to 6 were considered Not Happy and individuals whose 1 The graphs of fitted values for both models are included in the appendix-i.
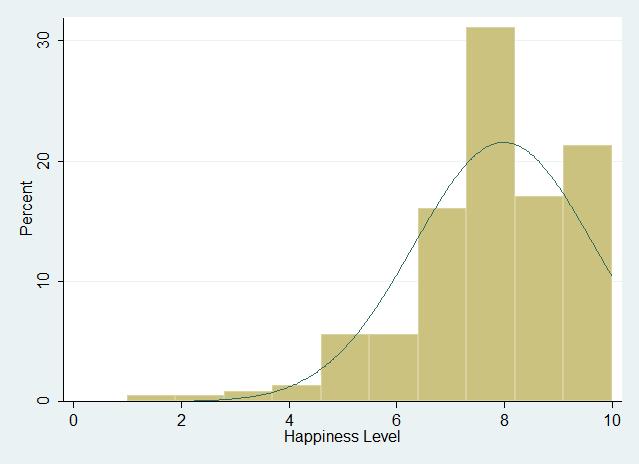
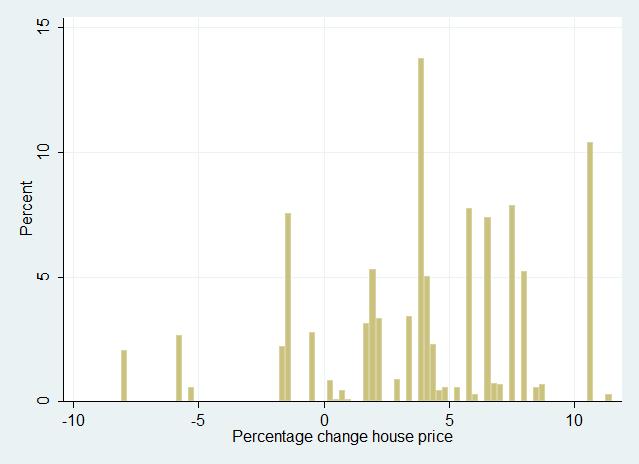
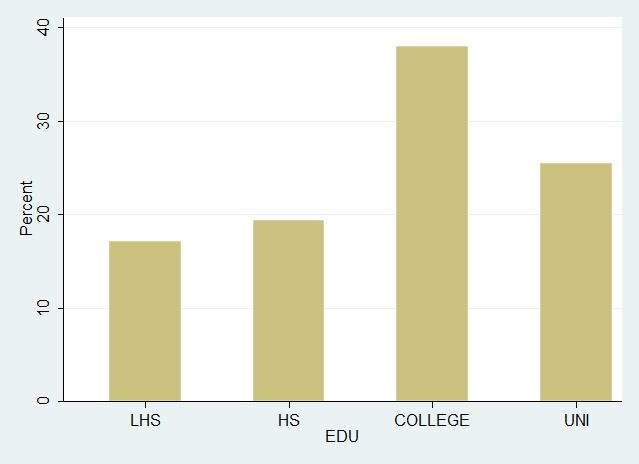
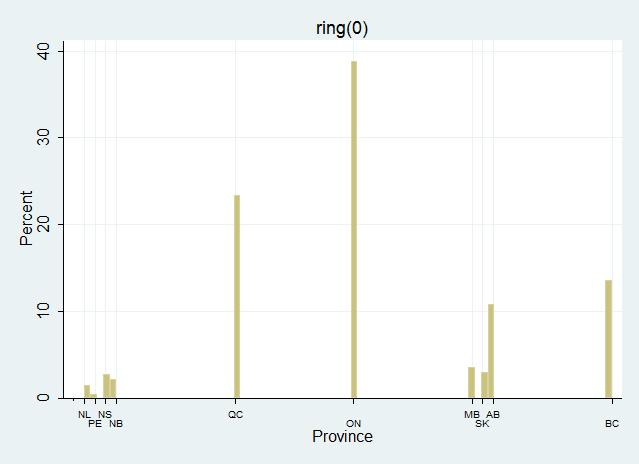
10 66 response is from 7 to 10 were considered Happy. In a similar way HAPPY8 is also transformed from life satisfaction variable of GSS. In HAPPY8 individuals whose response is from 0 to 7 were considered to be Not Happy and individuals whose response was from 8 to 10 were considered to be Happy. Purpose of redefining happy variable from HAPPY7 to HAPPY8 was to observe any sensitivity of our results to the exact choice of the happy-unhappy cut off. As happy variable is a binary variable it is measured in terms of probability in OLS method and as odds ratio in logistic method. When there is a change in independent variable the probability or odds of being happy changes. The most important independent variable in this regression is the interaction of PCHANGE and HOMEOWN where PCHANGE is the change in housing prices and HOMEOWN is dummy variable with 1 being member of household owns the home. Regression equation (1) does not include any control variables. Control variables are added to improve significance and standard errors, as these variables have significance on happiness. Equation (2) is as follows: HAPPY 7orHAPPY 8 PCHANGE * HOMEOWN Male Age Employment MaritalStatus 2 Pr ovince Education Income Health (2) Control variables in the above regression are divided into two categories, dummy variables and categorical variables. Male is a gender variable where 1 means male and 0 means female. Similarly, employment is a dummy variable with 1 means individual has employment and means individuals with no employment. Remaining variables are categorical variables and are defined below: -Age: This variable was divided into seven different categories of 20, 30, 40, 50, 60, 70, and 80. Individuals with the mean age of 20 years are categorized into group 20. Similarly, individuals with the means age of 30 are categorized into group 30 and so on. -Marital Status: There were six different categories of marital status including single, married, widowed, separated, common law and divorced. -Household Income: Household income variable was divided into nine different categories. Minimum income category was 15,000 per year and maximum was 160,000 per year income. -Education: There were four different categories of education including, less than high school, high school, college and university. College category contains individuals with 1, 2 or 3 years of college diploma. University category includes individuals with 4 or above years of posteducation. -Province: Province variable was divided into ten categories. All ten Canadian provinces are included in this study. -Health: There were five different categories of health. Individuals with poor health condition were grouped in Poor Health category and individuals with best health category were grouped in Excellent Health category. 2 2 The histogram of Age, Education, Happiness, House prices change, Income, Marital Status and Province are included in Appendix-II. Happiness variable histogram is the original life satisfaction from GSS. It shows total percentage of individuals with each level of happiness.
11 67 Syed The data used in this research was obtained from the General Social Survey (GSS) and House Price Index (HPI). GSS data was gathered to collect life satisfaction measure which is the representative of happiness measure as mentioned above in methodology part of the study. The main objective of GSS is to gather data to understand well-being levels and overall living condition of Canadians. GSS is a household survey and is conducted each year. Average time frame to conduct this survey and gather data is from 6 to 12 months. GSS data used in this study is from 2009 to GSS is an appropriate data tool for this research as it contains detailed information about many characteristics of individuals such as income, age, education, gender, household size, province of residence and so on. It contains information about individual s health status and life satisfaction levels which is the main research area of this study. To understand the relationship between happiness and housing prices in Canada, housing prices data was obtained from House Price Index (HPI), as GSS does not contain data on changes in housing prices in Canada. HPI collected and presented data as monthly price index. In this research happiness data was collected from 2009, hence housing data was transformed as an index with base of Changes in housing prices are observed from 2007 to One limitation of HPI data is that it is obtained on a city level and not on provincial level. For some provinces HPI data is available for more than one city and for others it is only one city. Hence, in order to have multiple cities representative of one province, data was transformed into weighted by population. As an example Alberta has housing index for Edmonton and Calgary. Weighted by population formula was used to combine these two indices as an index for Alberta. As mentioned earlier, HPI is a monthly index, however, GSS data is yearly; therefore, HPI data was converted into yearly data by using average of each month. Lastly, percentage change formula was used to obtain yearly change in housing prices in each province to capture the change in housing prices. Once the housing data was transformed, both data sets were merged by year and province to combine the datasets. The total number of observation in this study were 107,874. Table 1 (see Appendix-III) shows the summary statistics of dependent and independent variables along with dummy variables. As HAPPY7 is a binary variable, represents the percentage of individuals in the province who consider themselves to be happy. Table 1 shows percentage of happier in HAPPY7 variable are 85 percent and for HAPPY8 variable percentage is 69 percent. Mean percentage increase in housing prices is given by mean of PCHANGE, 3.63 percent. Gender variable is represented by MALE. It shows us that 49 percent of sample is male and 51 percent are female. Similar to gender variable, homeownership variable is also a dummy variable. The mean of HOMEOWN 0.79 tells us that 79 percent of individuals own the home. In terms of employment, 59 percent has either part time or full time employment status. Remaining variables in the table are categorical variables. Each categorical variable
12 68 has base group. In regression analysis base group was used to interpret findings of remaining groups in comparison to base group within the same category. As mean and standard deviation of categorical variables are not that informative, percentages are presented in some cases. Age variable has base group of 30 years and percentage of individuals with average age of 30 years is 16.7 percent. The base group of marital status category is SINGLE percent of individuals in the sample were single. Married is the biggest group in marital status category with percentage of 51.2 percent. The base group of the health status is POOR health. Percentage of individuals in poor health group was 2.6 percent. The data contains individuals from all ten provinces. The base group for provincial category is ON (Ontario). Percentage of individuals from Ontario was 38.8 percent. The base group of education category is LESS THAN HIGH SCHOOL, with the percentage of 16.9 percent. In other words 16.9 percent of individuals have no or less than high school education. Annual household income of 15,000 was considered as base group for income category. Percentage of individuals with household income of 15,000 is 6.3 percent. Lastly, household size of one person is base group of household size category. People with children were included in EXTRAPEOPLE variable. The percentage of individuals in EXTRAPEOPLE was 39.6 percent. The Data section contained information about variables used in this study and summary statistics of the variables. In the following section, main results and findings of the study are interpreted and presented. RESULTS AND DISCUSSION In this section of the study the main findings and results are interpreted and discussed. Table 2 (see Appendix-IV) and 3 (see Appendix-V) present the critical regression results for HAPPY7 and HAPPY8 as dependent variables respectively. As mentioned above, categorical variables have several different groups depending on the category. The table contains only two variables from each category. Full regression tables are included in Appendix-VI. Three different regression outcomes are presented in Table 2. Column one is regression outcome using OLS technique without any control variable. Column two presents regression outcome with OLS technique including control variables and column three presents logistic regression including control variables. The key coefficients of column two and three are discussed below. All the coefficients discussed below are statistically significant at 1 percent level. The coefficient of for HOMEOWN in column two tells us that if an individual owns the home, his or her probability of being happier is 2.5 percentage points higher than someone who does not own home. The coefficient for PCHANGE is It means that as compare to base group, non-homeowners, rising home prices make non-homeowners less happy. Each percentage point increase reduces the probability of being happy in the HAPPY7 category by almost half a percentage point. On the other hand, the coefficient of interaction of HOMEOWN and PCHANGE is , it means that if an individual owns the home and there is percentage
13 69 Syed point increase in housing prices, the probability of being happier in that province increases by 0.24 percentages point. The coefficient of MALE is It tells us that if an individual is male, his probability of being happier is 1.14 percentage points less than female. In the categorical variables, the variable of FAIR HEALTH tells us that as compare to POOR HEALTH, an individual with fair health status is much happier. His or her probability of being happier is 14.6 percentage points higher as compare to someone whose health is poor. Individuals with health status of excellent, their probability of being happier are 41.2 percentage points higher than individuals with poor health. As compared to age of 30 years, an individual with average age of 50 years is less happy. His or her probability of being happy reduces by 2.3 percentage point. However, as compare to age of 30 years, an individual with age of 60 years is happier. His or her probability of being happy increases by 4.4 percentage points. It seems that as an individual become older, his or her probability of being happy reduces. However, as an individual s age moves towards retirement, his or her probability of being happy increases. The interaction of age and employment reveals interesting results. The coefficient of tells us that as compared to age of 30, if an individual has employment and his or her age increases to 50 years, his or her probability of being happy reduces by 0.32 percentage point. However, as the age moves to 60 years and an individual has employment, his or her probability of being happy reduces by 6.75 percentage point as compare to age of 30 years. In other words, when age increases people feel happier as they are close to retirement, however, if an individual has to continue the work, an increase in age does not lead to happiness. Province dummy variable of Quebec shows that, an individual is happier in QC as compared to Ontario. If an individual resides in QC his or her probability of being happier is 3.5 percentage points higher as compare to someone who resides in ON. Similarly, people in Saskatchewan seem to be happier than people in Ontario. If an individual resides in SK, his or her probability of being happy is 4.17 percentage points higher than someone from ON. The marital status variable shows that married individuals are happier than singles. The coefficient of tells us that the probability of being happy is 9.50 percentage points higher for married individuals as compare to single individuals. Income variable shows trend of increase in happiness due to an increase in income. The coefficients of tells us that an individual with household income of 55,000 is happier than individual with household income of 15,000. His or her probability of being happier is 7.18 percentage points higher. As income increases to 90,000 his or her probability of being happy increases by 9.55 percentage point as compare to someone with 15,000 income. Lastly, education variable reveals surprising results. Regression tells us that as education level increases people become less happy. The coefficient of college variable is It tells us that as compare to people with less than high school education, people with college diploma are less happy. The probability of being happy reduces by 0.22 percentage point for individuals with college diploma as compare
14 70 to individuals with less than high school education. Probabilities in LPM model can fall below 0 and 1. Hence logistic regression was performed to force probabilities falling below 0 or above 1 to be below or equal to 1 or above or equal to 0. Coefficients of logistic regression were interpreted in terms of odds ratio rather than probability in OLS model. The odds ratio of tells us that the odds of being happier are times higher for homeowner than nonhomeowner. Similarly, when there is an increase in house price, the odds of being happy for nonhomeowners are times less than for homeowners. When there is 1 percentage increase in house price the odds of happiness for homeowners increase by times as compare to non-homeowners. Gender variable represented by MALE tells us that the odds of male being happier are times less than for female. Odds ratio of times tells us that as compare to individuals with poor health, the odds of being happy for an individual with fair health is times higher. And for individuals with excellent health the odds of being happy are times higher. In terms of AGE category, the odds of 50 years old individual being happier is 0.94 times less than as compare to someone of 30 years of age. However, as an individual reaches 60 years of age his or her odds of being happy increases. His or her odds of being happy are times higher than an individual with age of 30 years. The odds of being happy decreases if an individual has employment and his or her age increase to 50 or 60 years as compare to base of 30 years. If an individual is 60 years of age and working, his or her odd of being happy decreases by times as compare to if an individual is 30 years old and working. The odds of for Quebec tells us that, the odds of being happy for an individual living in Quebec is times higher than an individual living in Ontario. If an individual is married his or her odds of being happy is 2.27 times higher than if an individual is single. In terms of income category as individuals household income increases his or her odds of being happy increases. The odds ratio of tells us that if an individual has household income of 90,000 his or her odds of being happy are times higher than as compare to individual with household income of 15,000. Lastly, the odds of being happy for individuals with college diploma are times higher as compare to someone with less than high school diploma. The two techniques and their interpretations show that the trend in regression analysis is same for both techniques. When there is an increase in housing prices probability or odds of being happy increases. The only surprising result is the education. According to OLS technique an increase in education leads to less happiness, however, using odds technique an increase in education leads to more happiness. Table 3 represents the similar three regressions using OLS and logistic techniques, however, the dependent variable is HAPPY8. As mentioned earlier HAPPY8 was redefined as individuals from scale of 8 to 10 were considered happier and individuals from 1 to 7 were considered not happier. The coefficients and odds ratio from column two and three
15 71 Syed represent similar results that were observed in Table 2. When there is an increase in housing prices individuals who own home are happier. The probability of being happier is 0.27 percentage points higher as compare to non-homeowners in that province. In terms of odds ratio, the odds of being happier for homeowners when there is an increase in housing prices is 1.01 times higher. Table 3 was generated to capture any change in dependent variables by redefining happiness variable. However, in main independent variables there seems to be no sign or significance difference. The sign is as expected and statistically significant at 1 percent level similar to regression results in Table 2. Dummy and categorical variables also produced the same trend as what was observed in Table 2. Hence, by redefining happiness variables the results and findings are not that different. The full regression tables of HAPPY8 are provided in Appendix-VI. CONCLUSION In economics, happiness literature studies the relationship between happiness and other factors that affect the happiness. Among several other factors, housing prices is one of the most important as it fluctuate the individual s happiness by fluctuating wealth. Over the last few years, housing prices in Canada grew significantly in almost all the provinces. This research estimates the relationship between happiness and changes in housing prices for the period of 2009 to In past, many studies are conducted on happiness economics, however, only limited research is conducted on happiness and housing prices. Most studies conducted on happiness and housing prices found positive relationship between happiness and changes in housing prices. Similar to previous literature, this study also finds that happiness and changes in housing prices are positively related. The results show that there is a significant relationship between housing prices and happiness levels in Canada. When there is an increase in housing prices, homeowners are happier than non-homeowners. However, the magnitude of happiness level affected by change in housing prices seems to be small. In addition to change in housing prices, several control variables are included to observe happiness and individual s characteristics. Individuals with higher income levels responded happier as compare to individuals with less income. In addition, individuals with better health responded higher happiness levels as compare to individuals with poor or fair health. IMPLICATIONS To the best of my knowledge this is the first study to understand the relationship between changes in housing prices and happiness levels in Canadian context. The study focuses on happiness and well being measures captured through changes in housing prices. As discussed earlier changes in housing prices are positively linked to happiness levels. Policy makers can utilise this information in designing homeownership policies. Government can influence housing market by making changes in various economic tools such as interest rate and property taxes. This study encourages policy makers to consider happiness factor in addition to other factors used to design policy for home
16 72 investors. Due to this positive relationship, government and regulatory policy makers should implement policies to encourage people to invest more into houses. As more people become homeowners, percentage of population reporting happiness will increase. LIMITATIONS The limitation of this research is the cross sectional data. The data obtained was cross sectional with different individuals over time. Panel data with same individuals overtime might provide better happiness level information. As an example an individual with age 30 might be happier, however, same individual might not be happier at age 40. Sampling selection can also be a limitation of this research as sample may not be the true representative of the whole country s population. Future research, after controlling for these limitations, can improve the research outcomes. However, this research gives its readers an idea and trend of how individuals feel when housing prices change in Canada. the combined effects of wealth, income and consumption. IZA, Discussion Paper 1218, Helliwell, J., Layard, R. & Sachs, J. (2012). World happiness report. Sustainable Development Solutions Network. The Earth Institute, Columbia University, New York, USA. Lu, C., Schellenberg, G., Hou, F. & Helliiwell, J. F. (2015). How's life in the city? Life satisfaction across census metropolitan areas and economic region in Canada. Ottawa: Statistics Canada. MLS Home Price Index. (2015). Retrieved September 14, 2015, from ca/hpi_contact_en.html Oulton, N. (2012). Hooray for GDP! LSE Growth Commision, Ratcliffe, A. (2010). Housing wealth or economic climate: Why do house prices matter for well-being? The Centre for Market and Public Organization, Working Paper 10/234, Rossi, P. H. & Weber, E. (1996). The social benefits of homeownership: Empirical evidence from national surveys. Fannie Mae Foundation, 7(1): Ruprah, I. J. (2010). Does owning your home make you happier? Impact evidence from Latin America? Inter- American Development Bank,Working Paper: OVE/WP- 02/10, Sivak, T. (2013). Does higher GDP per capita cause higher life happiness? Central European University, Stutzer, A. & S. Frey, B. (2012). Recent developments in the economics of happiness:a selective overview. IZA, Discussion Paper 7078, Tella, R. D., MacCulloch, R. J. & Oswald, A. J. (2001). Preferences over inflation and unemployment: Evidence from surveys of happiness. The American Economic Review, 91(1): Wolverson, R. (2011). Will a global happiness index ever beat out GDP? Retrieved September 29, 2015, from Time Magazine: REFERENCES Bandura, R. & Conceicao, P. (2008). Measuring subjective wellbeing: A summary review of the literature. United Nations Development Programme, Bayer, C. & Juessen, F. (2013). Happiness and persistence of income shocks. IZA, Working Paper 6771, Bergheim, S. (2006). Measures of well-being: There is more to it than GDP. Deutsche Bank Research, Blanchard, O. & Johnson, D. (2013). Macroeconomics. Upper Saddle River, NJ: Pearson Education.. Costanza, R., Maureen, H., Posner, S. & Talberth, J. (2009). Beyond GDP: The need for new measures of progress. The Pardee Papers, 4, Easterlin, R. A. (2001). Income and happiness: Towards a unified theory. The Economic Journal, 111, Easterlin, R. & Angelescu, L. (2009). Happiness and growth of the world over: Time series evidence on the happinessincome paradox. IZA, Discussion Paper 4060, Guo, T. & Hu, L. (2011). Economic determinants of happiness: Evidence from the US General Social Survey, Headey, B., Muffels, R. & Wooden, M. (2004). Money doesn't buy happiness... Or does it? A reconsideration based on

17 73 Syed Appendix-I Fitted Value of HAPPY7 and PCHANGE using OLS Fitted Values of HAPPY7 and PCHANGE using Logistic

18 74 Fitted Values of HAPPY8 and PCHANGE using OLS Fitted Values of HAPPY8 and PCHANGE using logistic
19 75 Syed Appendix-II Histograms of Variables

20 76
The Relative Income Hypothesis: A comparison of methods.
 The Relative Income Hypothesis: A comparison of methods. Sarah Brown, Daniel Gray and Jennifer Roberts ISSN 1749-8368 SERPS no. 2015006 March 2015 The Relative Income Hypothesis: A comparison of methods.
Does Money Matter? Determining the Happiness of Canadians
 Does Money Matter? Determining the Happiness of Canadians Andrew Sharpe Executive Director, Centre for the Study of Living Standards CSLS-ICP Conference on the Implications of Happiness Research for Public
Relative Income and Hours Worked: Empirical Evidence from the US
 1 Relative Income and Hours Worked: Empirical Evidence from the US Stefano Bartolini and Ennio Bilancini University of Siena Abstract The so called happiness paradox, i.e. the non increasing long-term
BC JOBS PLAN ECONOMY BACKGROUNDER. Current statistics show that the BC Jobs Plan is working: The economy is growing and creating jobs.
 We know that uncertainty continues to remain in the global economy and we expect to see some monthly fluctuations in jobs numbers. That is why we will continue to create an environment that is welcoming
Highlights. For the purpose of this profile, the population is defined as women 15+ years.
 A L B E R T A L A B O U R F O R C E P R O F I L ES Women 2014 Highlights For the purpose of this profile, the population is defined as women 15+. Working Age Population of Women in Alberta The number of
The Effect of Household Characteristics on. the Probability of Homeownership in Canada
 The Effect of Household Characteristics on the Probability of Homeownership in Canada By Xinlei Wang Student No. 8148756 Major paper presented to the Department of Economics of the University of Ottawa
How exogenous is exogenous income? A longitudinal study of lottery winners in the UK
 How exogenous is exogenous income? A longitudinal study of lottery winners in the UK Dita Eckardt London School of Economics Nattavudh Powdthavee CEP, London School of Economics and MIASER, University
FREE PREVIEW Full report available for FREE to Canadian Franchise Association members
 The Economic Contribution of the Canadian FREE PREVIEW Full report available for FREE to Canadian Franchise Association members Franchise Industry January 2018 Prepared for: Canadian Franchise Association
Does Income Inequality Impact Individual Happiness? Evidence from Canada
 42 Does Income Inequality Impact Individual Happiness? Evidence from Canada Dr. Ehsan Latif Department of Economics, Thompson Rivers University, Canada Abstract: Using panel data from the Canadian National
Kim Manturuk American Sociological Association Social Psychological Approaches to the Study of Mental Health
 Linking Social Disorganization, Urban Homeownership, and Mental Health Kim Manturuk American Sociological Association Social Psychological Approaches to the Study of Mental Health 1 Preview of Findings
2017 Alberta Labour Force Profiles Youth
 2017 Alberta Labour Force Profiles Youth Highlights Population Statistics Labour Force Statistics 4 th highest proportion of youth in the working age population 1. 16.3% MB 2. 15.3% ON 2. 15.2% SK 4. 14.9%
Jamie Wagner Ph.D. Student University of Nebraska Lincoln
 An Empirical Analysis Linking a Person s Financial Risk Tolerance and Financial Literacy to Financial Behaviors Jamie Wagner Ph.D. Student University of Nebraska Lincoln Abstract Financial risk aversion
Absolute Income, Relative Income and Happiness: Comparison by Ethnic Groups
 Absolute Income, Relative Income and Happiness: Comparison by Ethnic Groups Richard Greenberg Advisor: Richard Ball April 27, 2017 Abstract Countries worldwide strive for economic growth that leads to
Catalogue no XIE. Income in Canada. Statistics Canada. Statistique Canada
 Catalogue no. 75-202-XIE Income in Canada 1999 Statistics Canada Statistique Canada How to obtain more information Specific inquiries about this product and related statistics or services should be directed
Adaptation, Anticipation and Social Interactions in Happiness: An Integrated Error-Correction Approach. Maarten Vendrik Maastricht University IZA
 Adaptation, Anticipation and Social Interactions in Happiness: An Integrated Error-Correction Approach Maarten Vendrik Maastricht University IZA Research area Dynamics of happiness of individual people
Alberta Minimum Wage Profile April March 2018
 Alberta Minimum Wage Profile April 2017 - March 2018 Introduction The Alberta Minimum Wage Profile presents current information on persons whose average hourly earnings 1 are at or below minimum in Alberta
June Decentralization, Provincial Tax Autonomy and Equalization in Canada
 June 20081 Decentralization, Provincial Tax Autonomy and Equalization in Canada Overview What are the interrelationships/connections between the high degree of tax decentralization and provincial tax autonomy
Post-Secondary Education, Training and Labour Prepared November New Brunswick Minimum Wage Report
 Post-Secondary Education, Training and Labour Prepared November 2018 2018 New Brunswick Minimum Wage Report Contents Section 1 Minimum Wage Rates in New Brunswick... 2 1.1 Recent History of Minimum Wage
Unemployment and Happiness
 Unemployment and Happiness Fumio Ohtake Osaka University Are unemployed people unhappier than employed people? To answer this question, this paper presents an extensive review of previous overseas studies
An assessment of Canadian Tax Policy for Charitable Giving: Addressing Methodological Challenges
 An assessment of Canadian Tax Policy for Charitable Giving: Addressing Methodological Challenges Belayet Hossain (bhossain@tru.ca) and Laura Lamb (llamb@tru.ca) Thompson Rivers University, British Columbia,
POVERTY PROFILE UPDATE FOR
 POVERTY PROFILE UPDATE FOR 1991 National Council of Welfare Jeanne Mance Building OTTAWA K1A 0K9 613 957-2961 Winter 1993 POVERTY IN CANADA IN 1991 The pages that follow contain selected poverty statistics
Catalogue no XIE. Income in Canada. Statistics Canada. Statistique Canada
 Catalogue no. 75-202-XIE Income in Canada 2000 Statistics Canada Statistique Canada How to obtain more information Specific inquiries about this product and related statistics or services should be directed
Alberta Minimum Wage Profile April March 2017
 Alberta Minimum Wage Profile April 2016 - March 2017 Introduction The Alberta Minimum Wage Profile presents current information on persons whose average hourly earnings 1 are at or below minimum wage in
2016 Alberta Labour Force Profiles Women
 2016 Alberta Labour Force Profiles Alberta s Highlights Population Statistics Labour Force Statistics lowest percentage of women in the working age population 1. 51.7% NS 2. 51.5% PEI 9. 49.6% SK 10. 49.3%
Alberta Labour Force Profiles
 Alberta Labour Force Profiles 2011 Highlights For the purpose of this profile, youth are defined as persons aged 15 to 24 years. 1. Alberta Population Statistics Among the provinces, Alberta had the third
Happy Voters. Exploring the Intersections between Economics and Psychology. Federica Liberini 1, Eugenio Proto 2 Michela Redoano 2.
 Exploring the Intersections between Economics and Psychology Federica Liberini 1, Eugenio Proto 2 Michela Redoano 2 1 ETH Zurich, 2 Warwick University and IZA 3 Warwick University 29 January 2015 Overview
Happiness across the life span:
 Happiness across the life span: Evidence from urban Pakistan Khadija Shams a and Alexander Hendrik Kadow b a Dept. of Economics, Shaheed Benazir Bhutto Women University, Peshawar, Pakistan; email: kshams2008@gmail.com
August 2015 Aboriginal Population Off-Reserve Package
 Labour Force Statistics Aboriginal Population Off-Reserve Package Package Includes: - Information for all Aboriginal people, First Nations and Métis - Working age population, labour force, employment,
October 2016 Aboriginal Population Off-Reserve Package
 Labour Force Statistics Aboriginal Population Off-Reserve Package Package Includes: - Information for all Aboriginal people, First Nations and Métis - Working age population, labour force, employment,
Saskatchewan Labour Force Statistics
 Saskatchewan Labour Force Statistics April 2017 UNADJUSTED DATA According to the Statistics Canada Labour Force Survey during the week covering April 9 th to 15 th,, 2017, there were 560,100 persons employed
Mortgage Loan Insurance Business Supplement
 CANADA MORTGAGE AND HOUSING CORPORATION Mortgage Loan Insurance Business Supplement FIRST QUARTER March 31, 2015 To supplement CMHC s unaudited Quarterly Consolidated financial statements, which are prepared
ERDE Research Project Welfare Generosity and Well-being: Evidence from Canada
 ERDE Research Project Welfare Generosity and Well-being: Evidence from Canada Fatima Tuz Zohora Environmental, Resource and Development Economics (ERDE) The University of Winnipeg 1 Abstract This paper
Does Growth make us Happier? A New Look at the Easterlin Paradox
 Does Growth make us Happier? A New Look at the Easterlin Paradox Felix FitzRoy School of Economics and Finance University of St Andrews St Andrews, KY16 8QX, UK Michael Nolan* Centre for Economic Policy
Post-Secondary Education, Training and Labour August New Brunswick Minimum Wage Factsheet 2017
 Post-Secondary Education, Training and Labour August 2017 New Brunswick Minimum Wage Factsheet 2017 Contents PART 1 - Minimum Wage Rates in New Brunswick... 3 1.1 Recent History of Minimum Wage in New
Does Inequality Reduce Happiness? Evidence from the States of the USA from the 1970s to the 1990s
 For Milan, March 2003. To be presented by Andrew Oswald, Warwick University. Email: andrew.oswald@warwick.ac.uk Does Inequality Reduce Happiness? Evidence from the States of the USA from the 1970s to the
2008 ANNUAL ALBERTA LABOUR MARKET REVIEW
 ANNUAL ALBERTA LABOUR MARKET REVIEW employment unemployment economic regions migration aboriginal people industries occupations education demographics Employment and Immigration EMPLOYMENT Employment increased
Introduction to Economic Growth, Unemployment, and Inflation McGraw-Hill Ryerson Ltd. Macroeconomics, Chapter 6 1
 Introduction to Economic Growth, Unemployment, and Inflation 2005 McGraw-Hill Ryerson Ltd. Macroeconomics, Chapter 6 1 In this chapter you will learn 6.1 The definition and causes of economic growth 6.2
2012 Annual Alberta Labour Market Review
 2012 Annual Alberta Labour Market Review Employment. Unemployment. Economic Regions. Migration Aboriginal People. Industries. Occupations. Education. Demographics Employment Alberta has the highest employment
Post-Secondary Education, Training and Labour Prepared May New Brunswick Minimum Wage Report
 Post-Secondary Education, Training and Labour Prepared May 2018 2018 New Brunswick Minimum Wage Report Contents Section 1 Minimum Wage Rates in New Brunswick... 2 1.1 Recent History of Minimum Wage in
Labor Participation and Gender Inequality in Indonesia. Preliminary Draft DO NOT QUOTE
 Labor Participation and Gender Inequality in Indonesia Preliminary Draft DO NOT QUOTE I. Introduction Income disparities between males and females have been identified as one major issue in the process
Income, pensions, spending and wealth
 CHAPTER 18 Income, pensions, spending and wealth After four years of growth, the median after-tax income for Canadian families of two or more people remained virtually stable in 2008 at $63,900. The level
Inter-ethnic Marriage and Partner Satisfaction
 DISCUSSION PAPER SERIES IZA DP No. 5308 Inter-ethnic Marriage and Partner Satisfaction Mathias Sinning Shane Worner November 2010 Forschungsinstitut zur Zukunft der Arbeit Institute for the Study of Labor
96 Centrepointe Dr., Ottawa, Ontario K2G 6B National Dental Hygiene Labour Survey
 96 Centrepointe Dr., Ottawa, Ontario K2G 6B1 2006-2007 National Dental Hygiene Labour Survey Executive Summary In 2006, the Canadian Dental Hygienists Association conducted its third national survey. The
April 2017 Alberta Indigenous People Living Off-Reserve Package
 Labour Force Statistics Alberta Indigenous People Living Off-Reserve Package Package Includes: - Information for all Indigenous people, First Nations and Métis - Working age population, labour force, employment,
November 2017 Alberta Indigenous People Living Off-Reserve Package
 Labour Force Statistics Alberta Indigenous People Living Off-Reserve Package Package Includes: - Information for all Indigenous people, First Nations and Métis - Working age population, labour force, employment,
December 2017 Alberta Indigenous People Living Off-Reserve Package
 Labour Force Statistics Alberta Indigenous People Living Off-Reserve Package Package Includes: - Information for all Indigenous people, First Nations and Métis - Working age population, labour force, employment,
January 2018 Alberta Indigenous People Living Off-Reserve Package
 Labour Force Statistics Alberta Indigenous People Living Off-Reserve Package Package Includes: - Information for all Indigenous people, First Nations and Métis - Working age population, labour force, employment,
Did the Social Assistance Take-up Rate Change After EI Reform for Job Separators?
 Did the Social Assistance Take-up Rate Change After EI for Job Separators? HRDC November 2001 Executive Summary Changes under EI reform, including changes to eligibility and length of entitlement, raise
BMO Estate and Trust Planning Online Survey. BMO Financial Group
 BMO Estate and Trust Planning Online Survey BMO Financial Group Context and Objectives BMO Financial Group Context and Objectives OBJECTIVES: Explore Canadians knowledge and awareness of wills and power
Comparing Ontario s Fiscal Position with Other Provinces
 Comparing Ontario s Fiscal Position with Other Provinces Key Points In 2017, the Ontario provincial government received $10,415 in total revenue per person 1, the lowest in the country. Despite the lowest
Mandated Labour Protections & Government Safety Nets: Economic outcomes and worker security
 Mandated Labour Protections & Government Safety Nets: Economic outcomes and worker security Debra Hevenstone Policy Studies Institute July 8, 2009 Debra Hevenstone (Policy Studies Institute) Labour Protections
A Profile of Payday Loans Consumers Based on the 2014 Canadian Financial Capability Survey. Wayne Simpson. Khan Islam*
 A Profile of Payday Loans Consumers Based on the 2014 Canadian Financial Capability Survey Wayne Simpson Khan Islam* * Professor and PhD Candidate, Department of Economics, University of Manitoba, Winnipeg
The Social Costs of Unemployment: Accounting for Unemployment Duration
 Thünen-Series of Applied Economic Theory Thünen-Reihe Angewandter Volkswirtschaftstheorie Working Paper No. 60 The Social Costs of Unemployment: Accounting for Unemployment Duration Carsten Ochsen Heinz
Consumption Inequality in Canada, Sam Norris and Krishna Pendakur
 Consumption Inequality in Canada, 1997-2009 Sam Norris and Krishna Pendakur Inequality has rightly been hailed as one of the major public policy challenges of the twenty-first century. In all member countries
Examining the Relationship between Household Satisfaction and Pollution
 Examining the Relationship between Household Satisfaction and Pollution Debra Israel Indiana State University Arik Levinson Georgetown University Paper to be Presented at the Eastern Economics Association
Comparison Income Effect on Subjective Well-Being
 Comparison Income Effect on Subjective Well-Being Abstract We follow the comparison income effect study on subjective well-being in Ferrer-i- Carbonell (2005), and test the robustness of those results
Federal Financial Support to Provinces and Territories: A Long-term Scenario Analysis
 Federal Financial Support to Provinces and Territories: A Long-term Scenario Analysis Ottawa, Canada March 8 www.pbo-dpb.gc.ca The Parliamentary Budget Officer (PBO) supports Parliament by providing economic
Do Domestic Chinese Firms Benefit from Foreign Direct Investment?
 Do Domestic Chinese Firms Benefit from Foreign Direct Investment? Chang-Tai Hsieh, University of California Working Paper Series Vol. 2006-30 December 2006 The views expressed in this publication are those
The determinants of retirement in Canada
 The determinants of retirement in Canada By Siyu Sun Student No. 6705238 Major paper presented to the department of economics of the University of Ottawa in partial fulfillment of the requirements of the
BC CAMPAIGN 2000 WHAT IS CHILD POVERTY? FACT SHEET #1 November 24, 2005
 WHAT IS CHILD POVERTY? FACT SHEET #1 Poverty in Canada is measured by using Statistics Canada's Low Income Cut-Offs (LICOs). The cut-offs are based on the concept that people in poverty live in "straitened
Working for minimum wage
 Working for minimum wage (IS 894 A1) Winter 1989 (Vol. 1, No. 3) Working for minimum wage Ernest B. Akyeampong Canadian attempts at regulating wages started with the federal "Fair Wages Policy" of 1900.
2017 Annual Alberta Labour Market Review
 2017 Annual Alberta Labour Market Review Employment. Unemployment. Economic Regions Migration. Indigenous People. Industries Occupations. Education. Demographics Employment Employment grew by 1. in Alberta
Individual Taxation Tax Planning Guide
 Taxable Income TABLE I1 ONTARIO (2014) TAX TABLE Tax Effective Marginal Rate Federal Ontario Total Rate Federal Ontario Total $ $ $ $ 10,000-17 17 0.2 0.0 5.0 5.0 11,000-67 67 0.6 12.9 5.1 18.0 12,000
The Flypaper Effect. Does equalization really contribute to better public services, or does it just stick to politicians and civil servants?
 AIMS Special Equalization Series Commentary Number 2 June 2006 The Flypaper Effect Does equalization really contribute to better public services, or does it just stick to politicians and civil servants?
Voluntary Health Organizations in Canada
 Voluntary Health Organizations in Canada Public Involvement and Support Laura Heinz Research Associate Canadian Centre for Philanthropy www.nsgvp.org 2 Voluntary Health Organizations in Canada Public Involvement
The persistence of regional unemployment: evidence from China
 Applied Economics, 200?,??, 1 5 The persistence of regional unemployment: evidence from China ZHONGMIN WU Canterbury Business School, University of Kent at Canterbury, Kent CT2 7PE UK E-mail: Z.Wu-3@ukc.ac.uk
AUGUST THE DUNNING REPORT: DIMENSIONS OF CORE HOUSING NEED IN CANADA Second Edition
 AUGUST 2009 THE DUNNING REPORT: DIMENSIONS OF CORE HOUSING NEED IN Second Edition Table of Contents PAGE Background 2 Summary 3 Trends 1991 to 2006, and Beyond 6 The Dimensions of Core Housing Need 8
2001 COOPERATIVE CREDIT ASSOCIATIONS - (in thousands of dollars) TABLE 1 - ASSETS
 TABLE 1 - ASSETS") TABLE 1 - ASSETS British Columbia Ontario Ltd. Nova Scotia Alberta Canada Cash resources 0 28,905 5 19,473 2,622 Deposits with regulated financial institutions.. 532,821 32,743 160,372 8,802 0 Securities
TABLE 1 - ASSETS British Columbia Ontario Ltd. Nova Scotia Alberta Canada Cash resources 0 28,905 5 19,473 2,622 Deposits with regulated financial institutions.. 532,821 32,743 160,372 8,802 0 Securities
BC CAMPAIGN FACT SHEETS
 2006 FACT SHEETS Fact Sheet #1 - What is Child Poverty? Fact Sheet #2 - BC Had the Worst Record Three Years in a Row Fact Sheet #3 - Child Poverty over the Years Fact Sheet #4 - Child Poverty by Family
Federal and Provincial/Territorial Tax Rates for Income Earned
 by a CCPC Effective January 1, 2015 and 2016 by a CCPC Effective January 1, 2015 1 Federal rates General corporate rate 38.0% 38.0% 38.0% Federal abatement (10.0) (10.0) (10.0) 28.0 28.0 28.0 business
Politics in Canada. For Publication February 9, 2016
 Politics in Canada For Publication February 9, 2016 Methodology Online survey conducted with Canadian citizens across all regions of Canada. This study was conducted online across all Canadian regions
The Effect of the Minimum Wage on the Employment Rate in Canada, by Eliana Shumakova ( ) Major Paper presented to the
 Major Paper presented to the") The Effect of the Minimum Wage on the Employment Rate in Canada, 1979 2016 by Eliana Shumakova (8494088) Major Paper presented to the Department of Economics of the University of Ottawa in partial fulfillment
The Effect of the Minimum Wage on the Employment Rate in Canada, 1979 2016 by Eliana Shumakova (8494088) Major Paper presented to the Department of Economics of the University of Ottawa in partial fulfillment
What s Hot & What s Not
 What s Hot & What s Not Warren Jestin SVP & Chief Economist Vancouver Real Estate Forum April 25, 27 The Economic Landscape is Shifting Global Growth Moves East 11 1 9 8 7 6 5 4 3 2 1 annual average %
To What Extent is Household Spending Reduced as a Result of Unemployment?
 To What Extent is Household Spending Reduced as a Result of Unemployment? Final Report Employment Insurance Evaluation Evaluation and Data Development Human Resources Development Canada April 2003 SP-ML-017-04-03E
SOURCES PUBLIC POLICY. The Budget Performance Index 2000: Comparing the Recent Fiscal Conduct of Canadian Governments. Contents
 PUBLIC POLICY SOURCES Number 39 The Budget Performance Index 2000: Comparing the Recent Fiscal Conduct of Canadian Governments by Joel Emes The Fraser Institute Contents Introduction... 3 The Budget Performance
Does Capitalism Flow to Poor Countries?
 Does Capitalism Flow to Poor Countries? Rich, 1975-97 Middle Income Poor, 1975-97 7% 7% 7% 6% 6% 6% 5% 5% 5% 4% 4% 4% 3% 3% 3% 2% 1% % Left Center Right 2% 1% % Left Center Right 2% 1% % Left Center Right
The current study builds on previous research to estimate the regional gap in
 Summary 1 The current study builds on previous research to estimate the regional gap in state funding assistance between municipalities in South NJ compared to similar municipalities in Central and North
Life Satisfaction and Preferences over Economic Growth and Institutional Quality
 Life Satisfaction and Preferences over Economic Growth and Institutional Quality Duha T. Altindag Auburn University, Department of Economics, altindag@auburn.edu Junyue Xu Moody s Analytics, junyue@gmail.com
How Does Education Affect Mental Well-Being and Job Satisfaction?
 A summary of a paper presented to a National Institute of Economic and Social Research conference, at the University of Birmingham, on Thursday June 6 How Does Education Affect Mental Well-Being and Job
RICHARD A. EASTERLIN. Is Reported Happiness Five Years Ago Comparable to Present Happiness? A Cautionary Note
 RICHARD A. EASTERLIN Is Reported Happiness Five Years Ago Comparable to Present Happiness? A Cautionary Note ABSTRACT: In the United States reported happiness five years ago is not comparable to present
The Gender Imbalance in Participation in Canadian Universities ( ) 1
 1") The Gender Imbalance in Participation in Canadian Universities (1977-2003) 1 Louis N. Christofides Department of Economics, Universities of Cyprus and Guelph Kallipoleos75, P. O. Box 20537, Nicosia 20537,
The Gender Imbalance in Participation in Canadian Universities (1977-2003) 1 Louis N. Christofides Department of Economics, Universities of Cyprus and Guelph Kallipoleos75, P. O. Box 20537, Nicosia 20537,
Catalogue no XIE. Income in Canada
 Catalogue no. 75-202-XIE Income in Canada 2005 How to obtain more information Specific inquiries about this product and related statistics or services should be directed to: Income in Canada, Statistics
2010 CSA Survey on Retirement and Investing
 2010 CSA Survey on Retirement and Investing Prepared for: Canadian Securities Administrators Executive Summary September 28, 2010 www.ipsos.ca TABLE OF CONTENTS EXECUTIVE SUMMARY... 1 Key Findings... 1
Equality and Fertility: Evidence from China
 Equality and Fertility: Evidence from China Chen Wei Center for Population and Development Studies, People s University of China Liu Jinju School of Labour and Human Resources, People s University of China
Happiness of Women and Men in Later Life: Nature, Determinants, and Prospects. Richard A. Easterlin University of Southern California.
 Happiness of Women and Men in Later Life: Nature, Determinants, and Prospects Richard A. Easterlin University of Southern California Abstract As they move into and through the retirement years women's
Macroeconomic Preferences by Income and Education Level: Evidence from Subjective Well-Being Data
 Review of Economics & Finance Submitted on 19/03/2015 Article ID: 1923-7529-2015-03-15-18 Heinz Welsch, and Jan Kühling Macroeconomic Preferences by Income and Education Level: Evidence from Subjective
Payroll Taxes in Canada from 1997 to 2007
 Payroll Taxes in Canada from 1997 to 2007 This paper describes the changes in the structure of payroll taxes in Canada and the provinces during the period 1997-2007. We report the average payroll tax per
An ex-post analysis of Italian fiscal policy on renovation
 An ex-post analysis of Italian fiscal policy on renovation Marco Manzo, Daniela Tellone VERY FIRST DRAFT, PLEASE DO NOT CITE June 9 th 2017 Abstract In June 2012, the share of dwellings renovation costs
Contents OCCUPATION MODELLING SYSTEM
 Contents Contents... 1 Introduction... 2 Why LMI?... 2 Why POMS?... 2 Data Reliability... 3 Document Content... 3 Key Occupation Labour Market Concepts... 4 Basic Labour Market Concepts... 4 Occupation
Subjective Financial Situation and Overall Life Satisfaction: A Joint Modelling Approach
 Subjective Financial Situation and Overall Life Satisfaction: A Joint Modelling Approach Daniel Gray: daniel.gray@sheffield.ac.uk University of Sheffield Abstract Analysing the German Socio-Economic Panel
Renters Report Future Home Buying Optimism, While Family Financial Assistance Is Most Available to Populations with Higher Homeownership Rates
 Renters Report Future Home Buying Optimism, While Family Financial Assistance Is Most Available to Populations with Higher Homeownership Rates National Housing Survey Topic Analysis Q3 2016 Published on
Alberta Self-Employment Profile
 Alberta Self-Employment Profile 2016 Overview Self-employment represents the entrepreneurial spirit of Alberta. This spirit is at the heart of Alberta s vibrant economy. By creating employment, producing
Economic Development and Subjective Well-Being. An in-depth study based on VARHS 2012
 Economic Development and Subjective Well-Being An in-depth study based on VARHS 2012 Introduction Aim: Understand how the many dimensions of economic development affect happiness/life satisfaction in rural
Exchange Rate Exposure and Firm-Specific Factors: Evidence from Turkey
 Journal of Economic and Social Research 7(2), 35-46 Exchange Rate Exposure and Firm-Specific Factors: Evidence from Turkey Mehmet Nihat Solakoglu * Abstract: This study examines the relationship between
The response of tax bases to the business cycle: the case of Alberta. Ergete Ferede
 The response of tax bases to the business cycle: the case of Alberta Ergete Ferede Grant MacEwan University, Edmonton, and Fellow, Institute of Public Economics February 11, 2013 Abstract One major concern
THE EFFECT OF DEMOGRAPHIC AND SOCIOECONOMIC FACTORS ON HOUSEHOLDS INDEBTEDNESS* Luísa Farinha** Percentage
 THE EFFECT OF DEMOGRAPHIC AND SOCIOECONOMIC FACTORS ON HOUSEHOLDS INDEBTEDNESS* Luísa Farinha** 1. INTRODUCTION * The views expressed in this article are those of the author and not necessarily those of
Riding the Commodity Price Roller-Coaster
 Riding the Commodity Price Roller-Coaster Presentation to FLAR in Cartagena, Colombia 10 July 2018 John Murray Former Deputy Governor, Bank of Canada Outline Why Canada is different from other industrial
Fiscal Sustainability Report 2017
 Fiscal Sustainability Report 217 Ottawa, Canada 5 October 217 www.pbo-dpb.gc.ca The Parliamentary Budget Officer (PBO) supports Parliament by providing analysis, including analysis of macro-economic and
Do School District Bond Guarantee Programs Matter?
 Providence College DigitalCommons@Providence Economics Student Papers Economics 12-2013 Do School District Bond Guarantee Programs Matter? Michael Cirrotti Providence College Follow this and additional
CONVERGENCES IN MEN S AND WOMEN S LIFE PATTERNS: LIFETIME WORK, LIFETIME EARNINGS, AND HUMAN CAPITAL INVESTMENT $
 CONVERGENCES IN MEN S AND WOMEN S LIFE PATTERNS: LIFETIME WORK, LIFETIME EARNINGS, AND HUMAN CAPITAL INVESTMENT $ Joyce Jacobsen a, Melanie Khamis b and Mutlu Yuksel c a Wesleyan University b Wesleyan