Health care economics. Ellen Andrews, PhD SCSU Spring 2018
|
|
|
- Shanna James
- 5 years ago
- Views:
Transcription
1 Health care economics Ellen Andrews, PhD SCSU Spring 2018
2 health care not like other sectors Consumers don t see the full bill no skin in the game Moral hazard Adverse selection Nearly impossible to price shop Providers drive demand Insurance spreads the costs But we pay the full bill taxes, lost wages, out of pocket
3 health care not like other sectors Expanding supply is expensive and highly regulated Strong incentives to blow leaves onto others lawns = cost shift Tax incentives make buying more health care more attractive than wages Essential spending consumers in need will prioritize Easier to ignore/delay costs when healthy
4 health care spending growth has slowed in US
5 Trends shifting temporary or structural? Health care costs rising more slowly Controversy about whether the slowdown is temporary, due to recession, or stronger Medicare also slowing, not sensitive to unemployment rate Slowdown pre-dated 2008 recession Structural changes including payment reforms
6 An annual percentage point difference in growth rates makes a very large difference in spending over time Projected annual change in U.S. per capita health spending , alternative scenarios $18,000 Projected NHE Per Capita Projected Plus 1 Percentage Point Projected Minus 1 Percentage Point $16,430 $16,000 $14,000 $14,944 $13,580 $12,000 $10,000 $8,000 $6, Source: Kaiser Family Foundation analysis of National Health Expenditure (NHE) data from Centers for Medicare and Medicaid Services, Office of the Actuary, National Health Statistics Group
7 Efficiency? administration as % of total US health care workforce 25 percent Source: Woolhandler et. al., NEJM 349:768, 2003
8 cost drivers New technology Prices Utilization Rising incomes Ownership interests, incentives Fragmentation of system Tax subsidies Aging population Administration
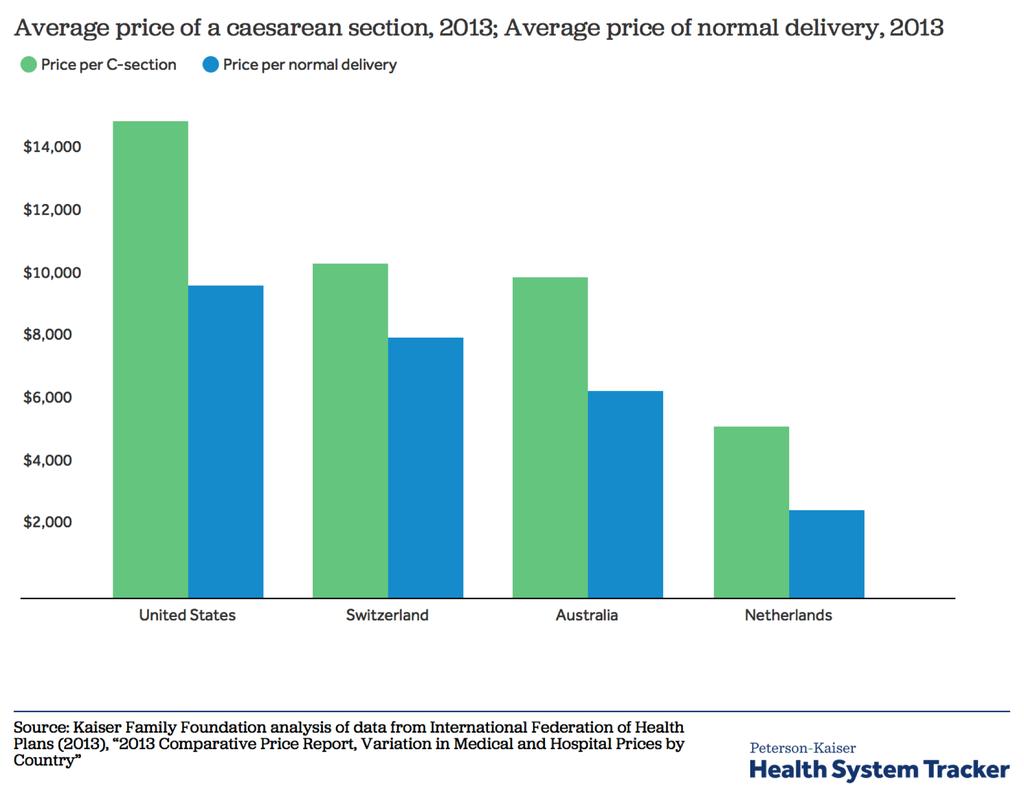
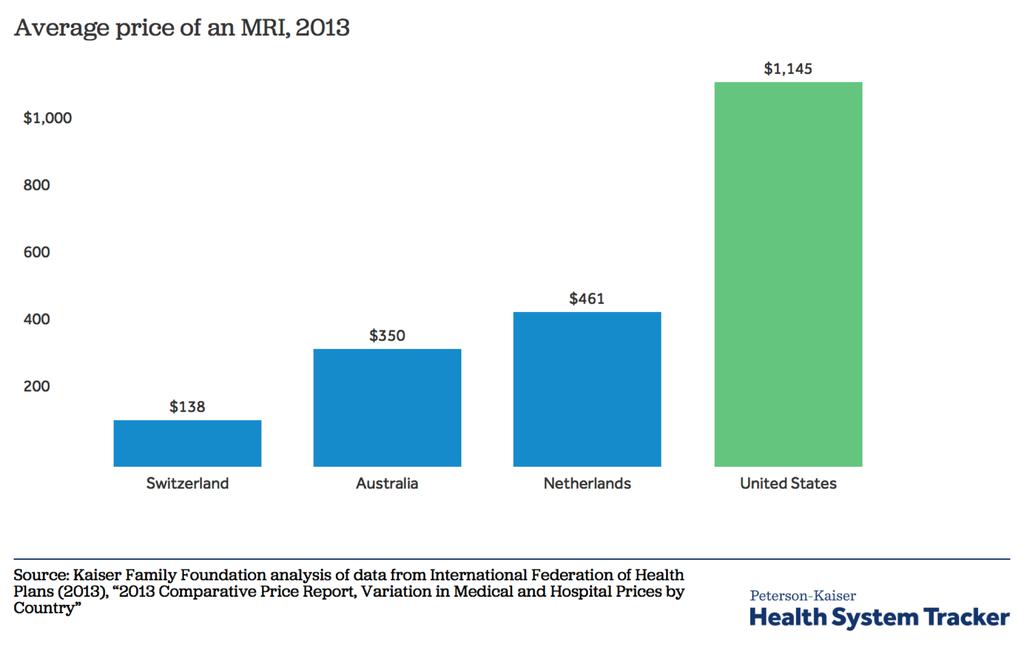
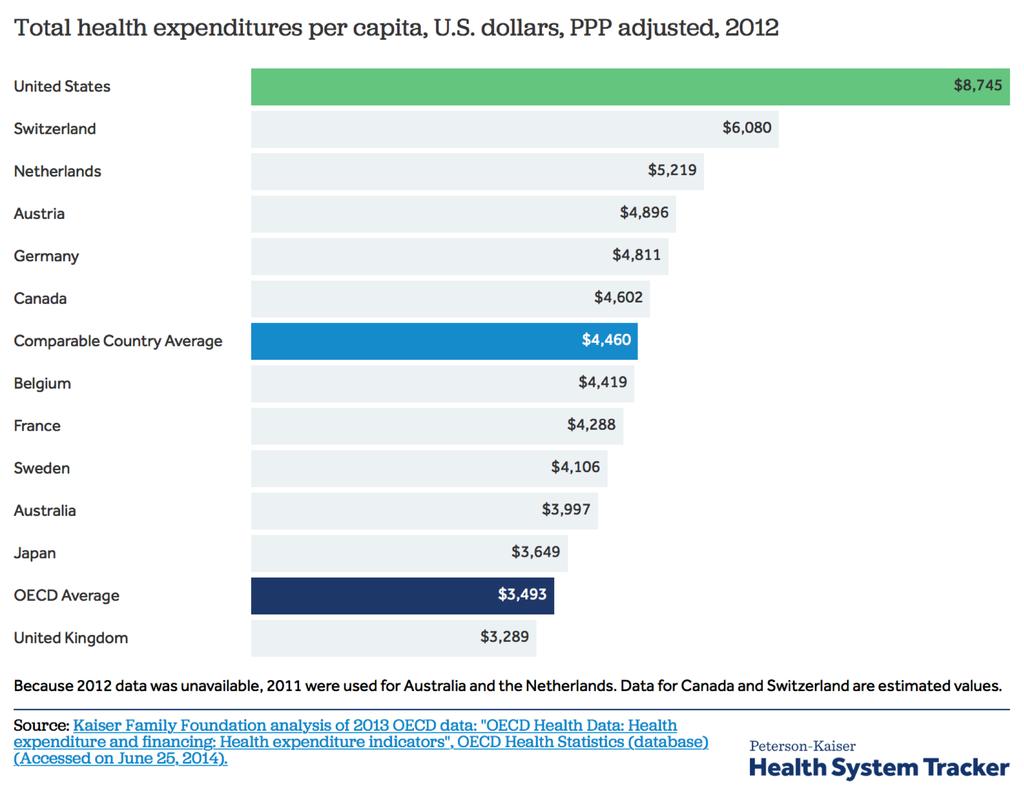
9 US higher costs than other countries and gap is rising
10
11
12

13 US life expectancy lower than all other comparable countries
14 US higher mortality rates than comparable countries
15 US higher in avoidable deaths

16 Medical errors higher in US
17 Spending on public health has increased, particularly by state and local governments Local and federal expenditures on public health, US $Millions, $80,000 Federal State and Local $70,000 $60,000 $50,000 $40,000 $30,000 $20,000 $10,000 $ Source: Kaiser Family Foundation analysis of National Health Expenditure (NHE) data from Centers for Medicare and Medicaid Services, Office of the Actuary, National Health Statistics Group
18 On average, larger shares of household budgets are devoted to health expenses than 10 years ago Average portion of household budget devoted to health (nonelderly families), % 5.0% 4.0% 3.0% 4.4% Total health expenses: 5.2% Insurance premiums: 3.1% 2.0% 1.0% Out-of-pocket costs: 2.1% 0.0% Source: Kaiser Family Foundation analysis of Consumer Expenditure Survey
 13% (by 22%) 70% 60% 50% 40% 30% 20% 10% 0% 19 to 34 35 to 44 45 to 54 55 to 64")

19 People age 55 and over account for about half of total health spending Share of total health spending by age group, % 90% Under 19 80% 11% of spending (by 25% of population) 13% (by 22%) 70% 60% 50% 40% 30% 20% 10% 0% 19 to to to to and over Share of Population 9% (by 13%) 16% (by 14%) 21% (by 12%) 31% (by 14%) Share of Spending Source: Kaiser Family Foundation analysis of Medical Expenditure Panel Survey, Agency for Healthcare Research and Quality, U.S. Department of Health and Human Services
20 CT healthcare spending Connecticut residents spend more per person on health care across payers than most Americans. However, per person health costs are rising more slowly in Connecticut than in most states, particularly for Medicaid members. In 2014 Connecticut devoted 14.4% of the state s economy to personal health care services, very close to the national average of 14.8% Over half of health spending in Connecticut is consumed by hospitals, physicians and clinics. Drug costs are the main driver of rising health costs in Connecticut, growing faster than any other sector. Since 2003, drug costs have grown faster in Connecticut than the rest of the nation Beginning in 2009, Medicare and Medicaid s combined share of Connecticut s health spending outpaced private health insurance. And the gap is growing. CT Health Policy Project November
21 $12,000 $10,000 $8,000 $6,000 $4,000 $2,000 $0 Per capita health spending United States CT Health Policy Project November Connecticut Key Findings Health spending is rising for both Connectic ut residents and all Americans 21
22 16% 14% 12% 10% 8% 6% 4% 2% 0% Health care share of GDP Key Findings In 2014 CT devoted 14.4% of our economy to health care, slightly below the US rate of 14.8% United States Connecticut CT Health Policy Project November
23 Per capita health spending, 2014 Key Findings $14,000 $12,000 $10,000 $8,000 $6,000 $4,000 $2,000 $0 All payers Medicaid Medicare private insurance Connecticut United States CT residents spend more on health care across payers than most Americans CT Health Policy Project November
24 Per capita spending, average annual growth 2001 to 2014 Key Findings percent growth Total Medicaid Medicare Private health insurance Connecticut United States CT Medicaid per person spending from 2001 through 2014 decreased while nationally costs have risen CT Health Policy Project November
25 Share of total health spending Connecticut, 2014 Key Findings 40% 35% 30% 25% 20% Private insurance is the main payer of health care in CT 15% 10% 5% 0% Medicaid Medicare Private insurance CT Health Policy Project November
26 Share of total Connecticut health spending Medicare + Medicaid, Private health insurance Key Findings 45% 40% 35% 30% 25% 20% 15% 10% 5% 0% Y1991 Y1992 Y1993 Y1994 Y1995 Y1996 Y1997 Private health insurance CT Health Policy Project November 2017 Y1998 Y1999 Y2000 Y2001 Y2002 Y2003 Y2004 Y2005 Y2006 Y2007 Y2008 Y2009 Y2010 Medicare + Medicaid Y2011 Y2012 Y2013 Y2014 In 2009, public coverage programs share of total CT health spending began to outpace private insurance And that gap is growing 26


27 State rank Per capita 2014 Average annual growth 1991 to 2014 CT Health Policy Project November 2017 Key Findings While CT s relative per capita health care costs are high among states, the rate of growth is much lower, particularly for Medicaid 27
28 Per capita spending by service drugs, nondurable products 14.97% nursing homes 8.66% Other 8.01% DME 1.43% home health care 3.00% dental 4.76% Other professionals 3.27% CT Health Policy Project November 2017 Connecticut, 2014 hospital physicians, clinics 22.17% Key Findings Over half of CT health spending goes to hospitals and physicians /clinics 28
29 8% 7% 6% 5% 4% 3% 2% 1% 0% Per capita average annual growth by total hospital physicians, clinics service Connecticut, 1991 to 2014 dental home health care nursing home drugs, nondurable products Key Findings Drugs and other nondurabl e products are the main driver of growing health costs in CT CT Health Policy Project November
30 Drug, nondurable product spending per capita Key Findings $1,600 $1,400 $1,200 $1,000 $800 $600 $400 $200 $ United States CT Health Policy Project January Connecticut Drug and other nondurabl e product spending is higher for CT residents than most Americans And the gap is growing 30
31 State rank per capita drugs, nondurable product spending Per capita 2014 Average annual growth 1991 to 2014 Total per capita drugs, nondurable products cost, 2014 per capita, avg annual percent growth, 1991 to 2014 Delaware New York highest Connecticut New York Rhode Island Alabama West Virginia New Jersey Pennsylvania Missouri Louisiana Massachusetts Nebraska North Carolina Florida New Hampshire Tennessee Kentucky South Carolina Hawaii Oklahoma North Dakota District of Columbia Arkansas Maine Vermont Iowa Maryland Mississippi Indiana Kansas Michigan Wisconsin Texas Ohio Delaware Connecticut Maine Rhode Island Missouri North Dakota Alabama Nebraska South Carolina Vermont Pennsylvania Massachusetts North Carolina West Virginia Louisiana Arkansas Wisconsin New Jersey New Hampshire Oklahoma District of Columbia Iowa Florida Mississippi South Dakota Kentucky Kansas Tennessee Indiana Texas Minnesota Maryland Illinois Key Findings CT residents spend more per person than all but one other state s residents on prescriptions and nondurable healthcare products and that rate is growing much faster than other states. Virginia Illinois Nevada California Ohio Michigan Virginia Hawaii CT Health Policy Project January
32 Drugs, nondurable products share of total per capita spending 20% 15% 10% 5% 0% United States CT Health Policy Project January Connecticut Key Findings Since 2003 spending on drugs and other nondurabl e products have grown faster in CT than nationally 32
33 Pharmacy percent of total spending, CT private insurance Key Findings 25% 20% 15% 10% 5% 0% 2010/ / / / / / /2015 CT Health Policy Project January 2018 Pharmace utical costs are consuming a growing share of CT private health insurance spending, rising to 23% in 2016/
34 Trends Conflicting signs about cost trends Market consolidation hospitals, practices, and health plans to increase market clout in negotiations with each other In most states, one insurer has half the total business Expected to accelerate under profit pressures of reform Raises costs and reduces options for consumers Inadequate state regulation Anti-trust concerns rising Concerns about physician and hospital interests in for-profit providers i.e. specialty hospitals, labs Strong lobbying interests, spending skyrockets, state and federal level
Annual Costs Cost of Care. Home Health Care
 2017 Cost of Care Home Health Care USA National $18,304 $47,934 $114,400 3% $18,304 $49,192 $125,748 3% Alaska $33,176 $59,488 $73,216 1% $36,608 $63,492 $73,216 2% Alabama $29,744 $38,553 $52,624 1% $29,744
Income from U.S. Government Obligations
 Baird s ----------------------------------------------------------------------------------------------------------------------------- --------------- Enclosed is the 2017 Tax Form for your account with
Checkpoint Payroll Sources All Payroll Sources
 Checkpoint Payroll Sources All Payroll Sources Alabama Alaska Announcements Arizona Arkansas California Colorado Connecticut Source Foreign Account Tax Compliance Act ( FATCA ) Under Chapter 4 of the Code
State Individual Income Taxes: Personal Exemptions/Credits, 2011
 Individual Income Taxes: Personal Exemptions/s, 2011 Elderly Handicapped Blind Deaf Disabled FEDERAL Exemption $3,700 $7,400 $3,700 $7,400 $0 $3,700 $0 $0 $0 $0 Alabama Exemption $1,500 $3,000 $1,500 $3,000
The Costs and Benefits of Half a Loaf: The Economic Effects of Recent Regulation of Debit Card Interchange Fees. Robert J. Shapiro
 The Costs and Benefits of Half a Loaf: The Economic Effects of Recent Regulation of Debit Card Interchange Fees Robert J. Shapiro October 1, 2013 The Costs and Benefits of Half a Loaf: The Economic Effects
Kentucky , ,349 55,446 95,337 91,006 2,427 1, ,349, ,306,236 5,176,360 2,867,000 1,462
 TABLE B MEMBERSHIP AND BENEFIT OPERATIONS OF STATE-ADMINISTERED EMPLOYEE RETIREMENT SYSTEMS, LAST MONTH OF FISCAL YEAR: MARCH 2003 Beneficiaries receiving periodic benefit payments Periodic benefit payments
The Effect of the Federal Cigarette Tax Increase on State Revenue
 FISCAL April 2009 No. 166 FACT The Effect of the Federal Cigarette Tax Increase on State Revenue By Patrick Fleenor Today the federal cigarette tax will rise from 39 cents to $1.01 per pack. The proceeds
MEDICAID BUY-IN PROGRAMS
 MEDICAID BUY-IN PROGRAMS Under federal law, states have the option of creating Medicaid buy-in programs that enable employed individuals with disabilities who make more than what is allowed under Section
Union Members in New York and New Jersey 2018
 For Release: Friday, March 29, 2019 19-528-NEW NEW YORK NEW JERSEY INFORMATION OFFICE: New York City, N.Y. Technical information: (646) 264-3600 BLSinfoNY@bls.gov www.bls.gov/regions/new-york-new-jersey
Pay Frequency and Final Pay Provisions
 Pay Frequency and Final Pay Provisions State Pay Frequency Minimum Final Pay Resign Final Pay Terminated Alabama Bi-weekly or semi-monthly No Provision No Provision Alaska Semi-monthly or monthly Next
Federal Rates and Limits
 Federal s and Limits FICA Social Security (OASDI) Base $118,500 Medicare (HI) Base No Limit Social Security (OASDI) Percentage 6.20% Medicare (HI) Percentage Maximum Employee Social Security (OASDI) Withholding
Aiming. Higher. Results from a Scorecard on State Health System Performance 2015 Edition. Douglas McCarthy, David C. Radley, and Susan L.
 Aiming Higher Results from a Scorecard on State Health System Performance Edition Douglas McCarthy, David C. Radley, and Susan L. Hayes December The COMMONWEALTH FUND overview On most of the indicators,
Summary of Benefits. Express Scripts Medicare. Value Choice S5660 & S5983. January 1, 2016 December 31, 2016
 Express Scripts Medicare Value Choice (a Medicare prescription drug plan (PDP) offered by Medco Containment Life Insurance Company and Medco Containment Insurance Company of New York (for members located
AIG Benefit Solutions Producer Licensing and Appointment Requirements by State
 3600 Route 66, Mail Stop 4J, Neptune, NJ 07754 AIG Benefit Solutions Producer Licensing and Appointment Requirements by State As an industry leader in the group insurance benefits market, AIG is firmly
2019 Summary of Benefits
 Plus Plan Value Plan S7126 2019 Summary of Benefits January 1, 2019 December 31, 2019 This booklet gives you a summary of what Mutual of Omaha Rx SM (PDP) Plus and Value plans cover and what you pay. It
CHAPTER 6. The Economic Contribution of Hospitals
 CHAPTER 6 The Economic Contribution of Hospitals Chart 6.1: National Health Expenditures as a Percentage of Gross Domestic Product and Breakdown of National Health Expenditures, 2014 U.S. GDP 2014 $3.03
Sales Tax Return Filing Thresholds by State
 Thanks to R&M Consulting for assistance in putting this together Sales Tax Return Filing Thresholds by State State Alabama Alaska Arizona Arkansas California Colorado Connecticut Delaware Filing Thresholds
State Corporate Income Tax Collections Decline Sharply
 Corporate Income Tax Collections Decline Sharply Nicholas W. Jenny and Donald J. Boyd The Rockefeller Institute Fiscal News: Vol. 1, No. 3 July 26, 2001 According to a report from the Congressional Budget
Q Homeowner Confidence Survey Results. May 20, 2010
 Q1 2010 Homeowner Confidence Survey Results May 20, 2010 The Zillow Homeowner Confidence Survey is fielded quarterly to determine the confidence level of American homeowners when it comes to the value
WikiLeaks Document Release
 WikiLeaks Document Release February 2, 2009 Congressional Research Service Report RS21071 Medicaid Expenditures, FY2003 and FY2004 Karen Tritz, Domestic Social Policy Division January 17, 2006 Abstract.
Tax Recommendations and Actions in Other States. Joel Michael House Research Department June 9, 2011
 Tax Recommendations and Actions in Other States Joel Michael House Research Department June 9, 2011 Governors FY 2012 Recommendations 12 governors recommend net revenue (tax and fee) increases 12 governors
Motor Vehicle Sales/Use, Tax Reciprocity and Rate Chart-2005
 The following is a Motor Vehicle Sales/Use Tax Reciprocity and Rate Chart which you may find helpful in determining the Sales/Use Tax liability of your customers who either purchase vehicles outside of
CRS Report for Congress
 Order Code RS21071 Updated February 15, 2005 CRS Report for Congress Received through the CRS Web Medicaid Expenditures, FY2002 and FY2003 Summary Karen L. Tritz Analyst in Social Legislation Domestic
State Income Tax Tables
 ALABAMA 1 st $1,000... 2% Next 5,000... 4% Over 6,000... 5% ALASKA... 0% ARIZONA 1 1 st $10,000... 2.87% Next 15,000... 3.2% Next 25,000... 3.74% Next 100,000... 4.72% Over 150,000... 5.04% ARKANSAS 1
April 20, and More After That, Center on Budget and Policy Priorities, March 27, First Street NE, Suite 510 Washington, DC 20002
 820 First Street NE, Suite 510 Washington, DC 20002 Tel: 202-408-1080 Fax: 202-408-1056 center@cbpp.org www.cbpp.org April 20, 2012 WHAT IF CHAIRMAN RYAN S MEDICAID BLOCK GRANT HAD TAKEN EFFECT IN 2001?
CLMS BRIEF 2 - Estimate of SUI Revenue, State-by-State
 CLMS BRIEF 2 - Estimate of SUI Revenue, State-by-State Estimating the Annual Amounts of Unemployment Insurance Tax Collections From Individual States for Financing Adult Basic Education/ Job Training Programs
Termination Final Pay Requirements
 State Involuntary Termination Voluntary Resignation Vacation Payout Requirement Alabama No specific regulations currently exist. No specific regulations currently exist. if the employer s policy provides
Metrics and Measurements for State Pension Plans. November 17, 2016 Greg Mennis
 Metrics and Measurements for State Pension Plans November 17, 2016 Greg Mennis Fiscal Sustainability Metrics Net Amortization Measures whether contributions are sufficient to reduce pension debt if plan
Impacts of Prepayment Penalties and Balloon Loans on Foreclosure Starts, in Selected States: Supplemental Tables
 THE UNIVERSITY NORTH CAROLINA at CHAPEL HILL T H E F R A N K H A W K I N S K E N A N I N S T I T U T E DR. MICHAEL A. STEGMAN, DIRECTOR T 919-962-8201 OF PRIVATE ENTERPRISE CENTER FOR COMMUNITY CAPITALISM
Undocumented Immigrants are:
 Immigrants are: Current vs. Full Legal Status for All Immigrants Appendix 1: Detailed State and Local Tax Contributions of Total Immigrant Population Current vs. Full Legal Status for All Immigrants
Chapter D State and Local Governments
 Chapter D State and Local Governments State and Local Governments contains detailed information on the taxes, revenues, and expenditures of states and localities. The public finances of these two levels
Required Training Completion Date. Asset Protection Reciprocity
 Completion Alabama Alaska Arizona Arkansas California State Certification: must complete initial 16 hours (8 hrs of general LTC CE and 8 hrs of classroom-only CE specifically on the CA for LTC prior to
House Republican Budget Plan: State-by-State Impact of Changes in Medicaid Financing
 I S S U E kaiser commission on medicaid and the uninsured MAY 2011 P A P E R House Republican Budget Plan: State-by-State Impact of Changes in Medicaid Financing Introduction John Holahan, Matthew Buettgens,
Fingerprint, Biographical Affidavit and Third-Party Verification Reports Requirements
 Updates to the State Specific Information Fingerprint, Biographical Affidavit and Third-Party Verification Reports Requirements State Requirements For Licensure Requirements After Licensure (Non-Domestic)
Medicaid and CHIP Eligibility, Enrollment, Renewal, and Cost-Sharing Policies as of January
 State Required in Medicaid Table 15 Premium, Enrollment Fee, and Cost-Sharing Requirements for Children January 2016 Premiums/Enrollment Fees Required in CHIP (Total = 36) Lowest Income at Which Premiums
MINIMUM WAGE WORKERS IN HAWAII 2013
 WEST INFORMATION OFFICE San Francisco, Calif. For release Wednesday, June 25, 2014 14-898-SAN Technical information: (415) 625-2282 BLSInfoSF@bls.gov www.bls.gov/ro9 Media contact: (415) 625-2270 MINIMUM
Budget Uncertainty in Medicaid. Federal Funds Information for States
 Budget Uncertainty in Medicaid Federal Funds Information for States www.ffis.org NCSL Legislative Summit August 2017 CHIP Funding State Flexibility DSH Cuts Uncertainty Block Grant ACA Expansion Per Capita
2012 RUN Powered by ADP Tax Changes
 2012 RUN Powered by ADP Tax Changes Dear Valued ADP Client, Beginning with your first payroll with checks dated in 2012, you and your employees may notice changes in your paychecks due to updated 2012
Fiscal Policy Project
 Fiscal Policy Project How Raising and Indexing the Minimum Wage has Impacted State Economies Introduction July 2012 New Mexico is one of 18 states that require most of their employers to pay a higher wage
Forecasting State and Local Government Spending: Model Re-estimation. January Equation
 Forecasting State and Local Government Spending: Model Re-estimation January 2015 Equation The REMI government spending estimation assumes that the state and local government demand is driven by the regional
Nation s Uninsured Rate for Children Drops to Another Historic Low in 2016
 Nation s Rate for Children Drops to Another Historic Low in 2016 by Joan Alker and Olivia Pham The number of uninsured children nationwide dropped to another historic low in 2016 with approximately 250,000
Ability-to-Repay Statutes
 Ability-to-Repay Statutes FEDERAL ALABAMA ALASKA ARIZONA ARKANSAS CALIFORNIA STATUTE Truth in Lending, Regulation Z Consumer Credit Secure and Fair Enforcement for Bankers, Brokers, and Loan Originators
PAY STATEMENT REQUIREMENTS
 PAY MENT 2017 PAY MENT Alabama Alaska Arizona Arkansas California Colorado Connecticut Delaware District of Columbia Florida Georgia No generally applicable wage payment law for private employers. Rate
Fingerprint and Biographical Affidavit Requirements
 Updates to the State-Specific Information Fingerprint and Biographical Affidavit Requirements State Requirements For Licensure Requirements After Licensure (Non-Domestic) Alabama NAIC biographical affidavit
ATHENE Performance Elite Series of Fixed Index Annuities
 Rates Effective August 8, 05 ATHE Performance Elite Series of Fixed Index Annuities State Availability Alabama Alaska Arizona Arkansas Product Montana Nebraska Nevada New Hampshire California PE New Jersey
Chartbook: Connecticut health care spending
 Chartbook: health care spending November 2017 CT Health Policy Project November 2017 1 Earlier this year, the US Centers for Medicare and Medicaid Services released updated State Health Expenditures through
# of Credit Unions As of March 31, 2011
 # of Credit Unions # of Credit Unins # of Credit Unions As of March 31, 2011 8,600 8,400 8,200 8,000 8,478 8,215 7,800 7,909 7,600 7,400 7,651 7,442 7,200 7,000 6,800 # of Credit Unions -Trend By Asset-Based
NOTICE TO MEMBERS CANADIAN DERIVATIVES CORPORATION CANADIENNE DE. Trading by U.S. Residents
 NOTICE TO MEMBERS CANADIAN DERIVATIVES CORPORATION CANADIENNE DE CLEARING CORPORATION COMPENSATION DE PRODUITS DÉRIVÉS NOTICE TO MEMBERS No. 2002-013 January 28, 2002 Trading by U.S. Residents This is
The table below reflects state minimum wages in effect for 2014, as well as future increases. State Wage Tied to Federal Minimum Wage *
 State Minimum Wages The table below reflects state minimum wages in effect for 2014, as well as future increases. Summary: As of Jan. 1, 2014, 21 states and D.C. have minimum wages above the federal minimum
Account-based medical plans Summary of Benefits and Coverage supplement
 Account-based medical plans Summary of Benefits and Coverage supplement We want you to have tools and resources to help you make informed health care decisions. For each of the medical plans this year,
Child Care Assistance Spending and Participation in 2016
 Policy solutions that work for low-income people Child Care Assistance Spending and Participation in 2016 i Background The Child Care and Development Block Grant (CCDBG) is the primary federal funding
THE STATE OF THE STATES IN DEVELOPMENTAL DISABILITIES
 THE STATE OF THE STATES IN DEVELOPMENTAL DISABILITIES Richard Hemp, Mary Kay Rizzolo, Shea Tanis, & David Braddock Universities of Colorado and Illinois-Chicago REINVENTING QUALITY CONFERENCE BALTIMORE,
Federal Registry. NMLS Federal Registry Quarterly Report Quarter I
 Federal Registry NMLS Federal Registry Quarterly Report 2012 Quarter I Updated June 6, 2012 Conference of State Bank Supervisors 1129 20 th Street, NW, 9 th Floor Washington, D.C. 20036-4307 NMLS Federal
Mapping the geography of retirement savings
 of savings A comparative analysis of retirement savings data by state based on information gathered from over 60,000 individuals who have used the VoyaCompareMe online tool. Mapping the geography of retirement
Table 15 Premium, Enrollment Fee, and Cost Sharing Requirements for Children, January 2017
 State Required in Medicaid Required in CHIP (Total = 36) 1 Lowest Income at Which Premiums Begin (Percent of the FPL) 2 Required in Medicaid Required in CHIP (Total = 36) 1 Lowest Income at Which Cost
Recourse for Employees Misclassified as Independent Contractors Department for Professional Employees, AFL-CIO
 Recourse for Employees Misclassified as Independent Contractors Department for Professional Employees, AFL-CIO State Relevant Agency Contact Information Online Resources Online Filing Alabama Department
MINIMUM WAGE WORKERS IN TEXAS 2016
 For release: Thursday, May 4, 2017 17-488-DAL SOUTHWEST INFORMATION OFFICE: Dallas, Texas Contact Information: (972) 850-4800 BLSInfoDallas@bls.gov www.bls.gov/regions/southwest MINIMUM WAGE WORKERS IN
STATE REVENUE AND SPENDING IN GOOD TIMES AND BAD 5
 STATE REVENUE AND SPENDING IN GOOD TIMES AND BAD 5 Part 2 Revenue States claim that the most immediate cause of strife in state budgets is current and anticipated drops in revenue. No doubt, a drop in
Cassidy-Graham Plan s Damaging Cuts to Health Care Funding Would Grow Dramatically in 2027
 820 First Street NE, Suite 510 Washington, DC 20002 Tel: 202-408-1080 Fax: 202-408-1056 center@cbpp.org www.cbpp.org September 15, 2017 Cassidy-Graham Plan s Damaging Cuts to Health Care Funding Would
American Economics Group Clear and Effective Economic Analysis. American Economics Group
 Presentation for: Federation Clear of and Tax Effective Administrators Economic Analysis 9/22/03 Charles W. de Seve, Ph.D. www.americaneconomics.com The Economy is Recovering : The National Economic Setting
Medicaid and State Budgets: Looking at the Facts Cindy Mann, Joan C. Alker and David Barish October 2007
 Medicaid and State Budgets: Looking at the Facts Cindy Mann, Joan C. Alker and David Barish Medicaid covered 60.9 million people in 2006, including 29.5 million children and 5.5 million people over 65.
Understanding Oregon s Throwback Rule for Apportioning Corporate Income
 Understanding Oregon s Throwback Rule for Apportioning Corporate Income Senate Interim Committee on Finance and Revenue January 12, 2018 2 Apportioning Corporate Income Apportionment is a method of dividing
Media Alert. First American CoreLogic Releases Q3 Negative Equity Data
 Contact Information Below Media Alert First American CoreLogic Releases Q3 Negative Equity Data First American CoreLogic, the first company to develop a national, state and city-level negative equity report,
JANUARY 30 DATA RELEASE WILL CAPTURE ONLY A PORTION OF THE JOBS CREATED OR SAVED BY THE RECOVERY ACT By Michael Leachman
 820 First Street NE, Suite 510 Washington, DC 20002 Tel: 202-408-1080 Fax: 202-408-1056 center@cbpp.org www.cbpp.org January 29, 2010 JANUARY 30 DATA RELEASE WILL CAPTURE ONLY A PORTION OF THE JOBS CREATED
Residual Income Requirements
 Residual Income Requirements ytzhxrnmwlzh Ch. 4, 9-e: Item 44, Balance Available for Family Support (04/10/09) Enter the appropriate residual income amount from the following tables in the guideline box.
# of Credit Unions As of September 30, 2011
 # of Credit Unions # of Credit Unions # of Credit Unions As of September 30, 2011 8,400 8,200 8,000 7,800 7,600 7,400 7,200 8,332 8,065 7,794 7,556 7,325 7,000 6,800 9,000 8,000 7,000 6,000 5,000 4,000
Introduction... 1 Survey Methodology... 1 Industry Breakouts... 2 Organization Size Breakouts... 3 Geographic Breakouts
 Introduction... 1 Survey Methodology... 1 Industry Breakouts... 2 Organization Size Breakouts... 3 Geographic Breakouts... 3... 4... 8 148 282 414 536 662... 8 148 282 414 536 662... 8 148 282 414 536
STATE BUDGET DEFICITS PROJECTED FOR FISCAL YEAR By Nicholas Johnson and Bob Zahradnik
 820 First Street, NE, Suite 510, Washington, DC 20002 Tel: 202-408-1080 Fax: 202-408-1056 center@cbpp.org www.cbpp.org Revised February 6, 2004 STATE BUDGET DEFICITS PROJECTED FOR FISCAL YEAR 2005 By Nicholas
8, ADP,
 2013 Tax Changes Beginning with your first payroll with checks dated in 2013, employees may notice changes in their paychecks due to updated 2013 federal and state tax requirements. This document will
DSH Reduction Allocation Process Flows. DRAFT Based on 5/15/13 NPRM
 DSH Reduction Allocation Process Flows 1 Overview The ACA mandates that the federal share of DSH payments be reduced by a specified dollar amount for each year between 2014 and 2020. The unreduced federal
IMPORTANT TAX INFORMATION
 IMPORTANT TAX INFORMATION The following information about your enclosed 1099-DIV from s should be used when preparing your 2017 tax return. Form 1099-DIV reports dividends, exempt-interest dividends, capital
American Economics Group Clear and Effective Economic Analysis. American Economics Group
 Presentation Clear for: and Effective Economic Analysis Federation of Tax Administrators By Charles W. de Seve, Ph.D. Retail Sales / Sales Taxes: The Current Recession Halts Retail Implications for The
DFA INVESTMENT DIMENSIONS GROUP INC. DIMENSIONAL INVESTMENT GROUP INC. Institutional Class Shares January 2018
 DFA INVESTMENT DIMENSIONS GROUP INC. DIMENSIONAL INVESTMENT GROUP INC. Institutional Class Shares January 2018 Supplementary Tax Information 2017 The following supplementary information may be useful in
TA X FACTS NORTHERN FUNDS 2O17
 TA X FACTS 2O17 Northern Funds Tax Facts provides specific information about your Northern Funds investment income and capital gain distributions for 2017. If you have any questions about how to apply
HOW MANY LOW-INCOME MEDICARE BENEFICIARIES IN EACH STATE WOULD BE DENIED THE MEDICARE PRESCRIPTION DRUG BENEFIT UNDER THE SENATE DRUG BILL?
 820 First Street, NE, Suite 510, Washington, DC 20002 Tel: 202-408-1080 Fax: 202-408-1056 center@cbpp.org www.cbpp.org HOW MANY LOW-INCOME MEDICARE BENEFICIARIES IN EACH STATE WOULD BE DENIED THE MEDICARE
By: Adelle Simmons and Laura Skopec ASPE
 ASPE RESEARCH BRIEF 47 MILLION WOMEN WILL HAVE GUARANTEED ACCESS TO WOMEN S PREVENTIVE SERVICES WITH ZERO COST-SHARING UNDER THE AFFORDABLE CARE ACT By: Adelle Simmons and Laura Skopec ASPE The Affordable
Do you charge an expedite fee for online filings?
 Topic: Expedite Fees and Online Filings Question by: Allison A. DeSantis : Ohio Date: March 14, 2012 Manitoba Corporations Canada Alabama Alaska Arizona Yes. The expedite fee is $35. We currently offer
medicaid a n d t h e How will the Medicaid Expansion for Adults Impact Eligibility and Coverage? Key Findings in Brief
 on medicaid a n d t h e uninsured July 2012 How will the Medicaid Expansion for Adults Impact Eligibility and Coverage? Key Findings in Brief Effective January 2014, the ACA establishes a new minimum Medicaid
2014 STATE AND FEDERAL MINIMUM WAGES HR COMPLIANCE CENTER
 2014 STATE AND FEDERAL MINIMUM WAGES HR COMPLIANCE CENTER The federal Fair Labor Standards Act (FLSA), which applies to most employers, establishes minimum wage and overtime requirements for the private
FHA Manual Underwriting Exceeding 31% / 43% DTI Eligibility Quick Reference
 Credit Score/ Compensating Factor(s)* No Compensating Factor One Compensating Factor Two Compensating Factors No Discretionary Debt Maximum DTI 31% / 43% 37% / 47% 40% / 50% 40% / 40% *Acceptable compensating
Insurer Participation on ACA Marketplaces,
 November 2018 Issue Brief Insurer Participation on ACA Marketplaces, 2014-2019 Rachel Fehr, Cynthia Cox, Larry Levitt Since the Affordable Care Act health insurance marketplaces opened in 2014, there have
State Unemployment Insurance Tax Survey
 444 N. Capitol Street NW, Suite 142, Washington, DC 20001 202-434-8020 fax 202-434-8033 www.workforceatm.org State Unemployment Insurance Tax Survey NATIONAL ASSOCIATION OF STATE WORKFORCE AGENCIES April
Q209 NATIONAL DELINQUENCY SURVEY FROM THE MORTGAGE BANKERS ASSOCIATION. Data as of June 30, 2009
 NATIONAL DELINQUENCY SURVEY FROM THE MORTGAGE BANKERS ASSOCIATION Q209 Data as of June 30, 2009 2009 Mortgage Bankers Association (MBA). All rights reserved, except as explicitly granted. Data are from
ADDITIONAL REQUIRED TRAINING before proceeding. Annuity Carrier Specific Product Training
 Reliance Standard REQUIRED CARRIER SPECIFIC TRAINING (CST) INSTRUCTIONS Annuity Carrier Specific Product Training and state mandated NAIC Annuity Training (see STATE ANNUITY SUITABILITY TRAINING REQUIREMENT
EBRI Databook on Employee Benefits Chapter 6: Employment-Based Retirement Plan Participation
 EBRI Databook on Employee Benefits Chapter 6: Employment-Based Retirement Plan Participation UPDATED July 2014 This chapter looks at the percentage of American workers who work for an employer who sponsors
Economic Impacts of Wait Times for Commercial Driver s Licenses Skills Tests
 Economic Impacts of Wait Times for Commercial Driver s Licenses Skills Tests Nam D. Pham, Ph.D. Mary Donovan January 2019 Economic Impact of Wait Times for Commercial Driver s Licenses Skills Tests Nam
FAPRI Analysis of Dairy Policy Options for the 2002 Farm Bill Conference
 FAPRI Analysis of Dairy Policy Options for the 2002 Farm Bill Conference FAPRI-UMC Report #04-02 April 11, 2002 Food and Agricultural Policy Research Institute University of Missouri 101 South Fifth Street
How Much Would a State Earned Income Tax Credit Cost in Fiscal Year 2018?
 820 First Street NE, Suite 510 Washington, DC 20002 Tel: 202-408-1080 Fax: 202-408-1056 center@cbpp.org www.cbpp.org Updated February 8, 2017 How Much Would a State Earned Income Tax Cost in Fiscal Year?
A d j u s t e r C r e d i t C E I n f o r m a t i o n S T A T E. DRI Will Submit Credit For You To Your State Agency. (hours ethics included)
") A d j u s t e r C r e d i t C E I n f o r m a t i o n NURSING HOME/ALF LITIGATION SEPTEMBER 13 14, 2018 NEW ORLEANS, LA Delaware Georgia Louisiana Mississippi New Hampshire North Carolina (hours ethics
A d j u s t e r C r e d i t C E I n f o r m a t i o n NURSING HOME/ALF LITIGATION SEPTEMBER 13 14, 2018 NEW ORLEANS, LA Delaware Georgia Louisiana Mississippi New Hampshire North Carolina (hours ethics
A d j u s t e r C r e d i t C E I n f o r m a t i o n S T A T E. DRI Will Submit Credit For You To Your State Agency. (hours ethics included)
") A d j u s t e r C r e d i t C E I n f o r m a t i o n INSURANCE COVERAGE AND CLAIMS INSTITUTE APRIL 3 5, 2019 CHICAGO, IL Delaware Georgia Louisiana Mississippi New Hampshire North Carolina (hours ethics
A d j u s t e r C r e d i t C E I n f o r m a t i o n INSURANCE COVERAGE AND CLAIMS INSTITUTE APRIL 3 5, 2019 CHICAGO, IL Delaware Georgia Louisiana Mississippi New Hampshire North Carolina (hours ethics
Figure 1. Medicaid Status of Medicare Beneficiaries, Partial Dual Eligibles (1.0 Million) 3% 15% 83% Medicare Beneficiaries = 38.
 3% 15% 83% Medicare Beneficiaries = 38.") I S S U E P A P E R kaiser commission on medicaid and the uninsured September 2003 A Prescription Drug Benefit in Medicare: Implications for Medicaid and Low- Income Medicare Beneficiaries A prescription
I S S U E P A P E R kaiser commission on medicaid and the uninsured September 2003 A Prescription Drug Benefit in Medicare: Implications for Medicaid and Low- Income Medicare Beneficiaries A prescription
SECTION 109 HOST STATE LOAN-TO-DEPOSIT RATIOS. The Board of Governors of the Federal Reserve System, the Federal Deposit Insurance
 SECTION 109 HOST STATE LOAN-TO-DEPOSIT RATIOS The Board of Governors of the Federal Reserve System, the Federal Deposit Insurance Corporation, and the Office of the Comptroller of the Currency (the agencies)
ADDITIONAL REQUIRED TRAINING before proceeding. Annuity Carrier Specific Product Training
 American Equity REQUIRED CARRIER SPECIFIC TRAINING (CST) INSTRUCTIONS Annuity Carrier Specific Product Training and state mandated NAIC Annuity Training (see STATE ANNUITY SUITABILITY TRAINING REQUIREMENT
STATE AND FEDERAL MINIMUM WAGES
 2017 STATE AND FEDERAL MINIMUM WAGES STATE AND FEDERAL MINIMUM WAGES The federal Fair Labor Standards Act (FLSA) establishes minimum wage and overtime requirements for most employers in the private sector
Q309 NATIONAL DELINQUENCY SURVEY FROM THE MORTGAGE BANKERS ASSOCIATION. Data as of September 30, 2009
 NATIONAL DELINQUENCY SURVEY FROM THE MORTGAGE BANKERS ASSOCIATION Q309 Data as of September 30, 2009 2009 Mortgage Bankers Association (MBA). All rights reserved, except as explicitly granted. Data are
Medicare Advantage Update. Southeastern Actuaries Conference November 15, 2007
 Stuart Rachlin, Consulting Actuary Tampa, FL F.S.A., M.A.A.A. Medicare Advantage Update Southeastern Actuaries Conference November 15, 2007 Grand Floridian Resort Orlando, FL Demand for Medicare Medicare
Employer-Funded Individual Health Insurance
 Employer-Funded Individual Health Insurance ANNUAL REPORT 2016 1 EXECUTIVE SUMMARY This 2016 Annual Report is intended to provide a detailed, nationwide profile of how employers and employees are using
Aetna Individual Direct Pay Commissions Schedule
 Aetna Individual Direct Pay Commissions Schedule Cards Issued Broker Rate Broker Tier Per Year 1st Yr 2nd Yr 3+ Yrs Levels 11-Jan 4.00% 4.00% 3.00% Bronze 24-Dec 6.00% 4.00% 3.00% Silver 25-49 8.00% 4.00%
Mutual Fund Tax Information
 2008 Mutual Fund Tax Information We have provided this information as a service to our shareholders. Thornburg Investment Management cannot and does not give tax or accounting advice. If you have further
Medicaid & CHIP: December 2014 Monthly Applications, Eligibility Determinations and Enrollment Report February 23, 2015
 DEPARTMENT OF HEALTH & HUMAN SERVICES Centers for Medicare & Medicaid Services 7500 Security Boulevard, Mail Stop S2-26-12 Baltimore, Maryland 21244-1850 Medicaid & CHIP: December 2014 Monthly Applications,