Precarious Employment. Brantford CMA 2017
|
|
|
- Laurel Banks
- 5 years ago
- Views:
Transcription

1 Precarious Employment Brantford CMA 2017

2 A skilled, resilient workforce contributing to dynamic communities Contributing Partners Brant County Health Unit City of Brantford Brantford-Brant Social Services Business Resource Centre This project is funded by the Government of Ontario. The views expressed in this document do not necessarily reflect those of the government of Ontario. The material in this report has been prepared by WPBGE and is drawn from a variety of sources considered reliable. We make no representation or warranty, expressed or implied, as to its accuracy or completeness. In providing this material, WPBGE does not assume and responsibility or liability. This research project was prepared by: Paul Knafelc, Community Benchmarks Inc. Jill Halyk, Workforce Planning Board of Grand Erie Jose Rodriguez, Workforce Planning Board of Grand Erie Mark Skeffington, Workforce Planning Board of Grand Erie
3 Table of Contents Presentation... 1 Purpose and Scope of Study... 6 What is Precarious Employment?... 6 Our Definition of Precarious Employment... 7 Who are Vulnerable Workers?... 7 The Impact of Precarious Employment... 8 Data Analysis... 9 Employment Trends... 9 Job Tenure... 9 Full time - Part Time Work Multiple Jobholders Permanent versus Temporary and Seasonal Work Self-Employment Income Levels Job Retention Recommendations for the Community References... 25

4 Presentation P a g e 1
5 P a g e 2
6 P a g e 3
7 P a g e 4


8 P a g e 5
9 P a g e 6 Purpose and Scope of Study Labour force statistics show that more people are working and that unemployment is low, however; little information exists about the nature of jobs within the Brantford CMA community. This study examines key characteristics associated with precarious employment to understand which workers are impacted. The study will assist community, education, and employment service organizations understand who is affected and what supports may be required. As there is no clear definition of precarious employment, this research will look at the definitions used by government, Statistics Canada and financial institutions to identify key characteristics and differences and to define the indicators for this study. The research will also examine vulnerable workers in relationship to precarious employment, providing insight into which workers experience the greatest risk of precarious employment and the impact on their lives. Statistical data, including employment levels, employment type full time, part-time, temporary, contract, tenure reasons for separation, and employment type by sector, will inform the prevalence of precarious employment within the community. Readers of this report should use the information as a framework for understanding precarious employment due to differences in the definitions and values contributed to precarious employment. What is Precarious Employment? Multiple definitions of precarious employment exist. For some, it relates to the continuity of work and an individual s confidence in their ability to earn an adequate living. For others, it relates to low income levels and a lack of control over their work environment. For the purpose of this study, we examined three definitions to determine the project s indicators. These included the Ministry of Labour s description outlined in the Changing Workplace Review (May 2017), Statistics Canada, and TD Financial. The Ministry of Labour defines precarious employment as work for remuneration characterized by uncertainty, low income, and limited social benefits and statutory entitlements. Statistics Canada expands this definition by describing the differences in standard and non-standard work conditions. Standard work conditions are those that reflect workers who have one employer, work full year, full time on the employer s premises, earn adequate wages, and enjoy access to benefits such as pensions and extended health care. Non-standard employment is work that includes part-time work, temporary employment, multiple jobholders and own-account employment (self-employed without paid employees).
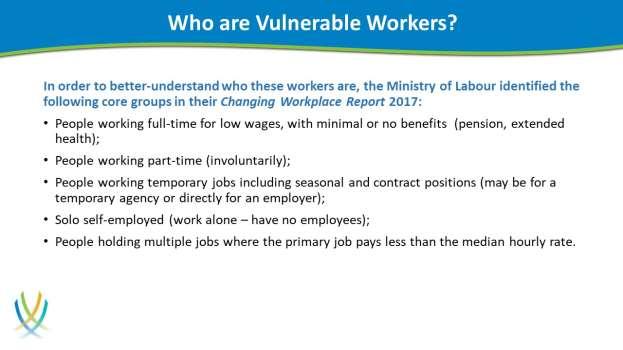
10 P a g e 7 TD Canada Financial defines precarious employment as jobs that are dependent on chance or uncertain developments, typified by a lack of security or stability from an economic perspective this includes characteristics of employment that may include: job instability as measured by separation or retention rates or the share of temporary employment; a lack of predictability of income, associated with seasonal and self-employment; Uncertainty regarding employment status, for instance among individuals waiting for call-backs; Lack of predictability in scheduling, measured by involuntary part-time employment. Our Definition of Precarious Employment We will use Statistics Canada s definition of precarious employment for this study and will focus on the characteristics of non-standard work. Statistics Canada Definition: Non-standard employment is work that includes part-time work, temporary employment, multiple jobholders and own-account employment (selfemployed without paid employees). Who are Vulnerable Workers? Vulnerable workers cross over all social groups and include those people employed in jobs that lack the financial security and tenure associated with standard employment. Simply put, vulnerable workers do not have a permanent, full-time job at a stable location that offers an adequate living wage. In order to better-understand who these workers are, the Ministry of Labour identified the following core groups in their Changing Workplace Report 2017: People working full-time for low wages, with minimal or no benefits (pension, extended health); People working part-time (involuntarily); People working temporary jobs including seasonal and contract positions (may be for a temporary agency or directly for an employer); Solo self-employed (work alone have no employees); People holding multiple jobs where the primary job pays less than the median hourly rate.
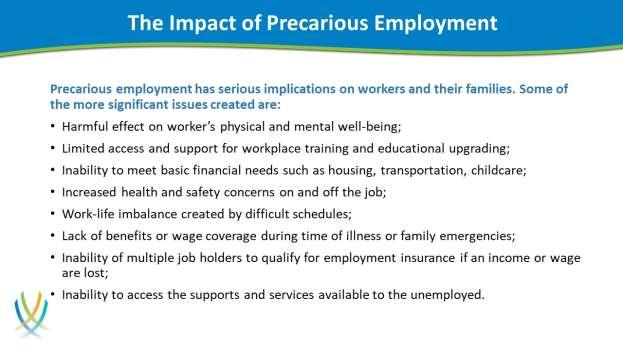
11 P a g e 8 The Impact of Precarious Employment Precarious employment has serious implications on workers and their families. Some of the more significant issues created are: Harmful effect on worker s physical and mental well-being; Limited access and support for workplace training and educational upgrading; Inability to meet basic financial needs such as housing, transportation, childcare; Increased health and safety concerns on and off the job; Work-life imbalance created by difficult schedules; Lack of benefits or wage coverage during time of illness or family emergencies; Inability of multiple job holders to qualify for employment insurance if an income or wage are lost; Inability to access the supports and services available to the unemployed. The analysis in this report seeks to understand the extend of precarious employment in the Brantford CMA by taking an in-depth look at how many people are affected by incomes below the low-income cutoff, involuntary part-time work, or are earning their living through self-employment.
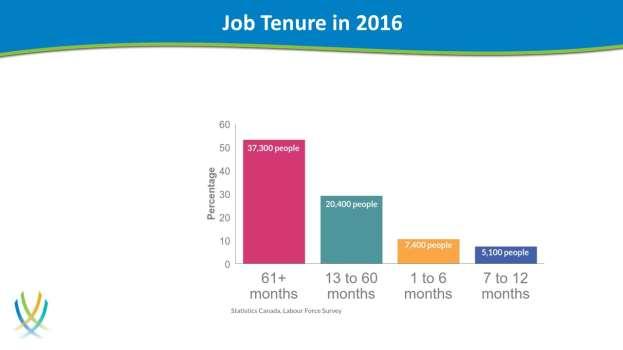
12 Total Employed - Thousands P a g e 9 Data Analysis Many people across the Brantford CMA believe that a significant share of jobs in the Brantford CMA are precarious and that the number is growing. This study looks at the key characteristics associated with precarious employment and provides a comparison of Brantford (CMA) to Ontario. The following analysis provides an overview of the characteristics and impacts of precarious employment in Brantford with the purpose of helping community organizations meet the needs of vulnerable workers. Employment Trends Total employment refers to the number of employees and the number of self-employed within the community. The number of jobs in Brantford (CMA) grew to a ten-year high of 70,200 in These total employment numbers provide a framework for understanding precarious employment within the community. Figure 1. Total Employed Brantford Census Metropolitan Area Source: Statistics Canada, Labour Force Survey Job Tenure Job instability and insecurity is a major factor in precarious employment. Vulnerable workers, particularly those in part-time, temporary or contract positions, live with the uncertainty of whether the job will continue. To gain some understanding of how long people are in their jobs, we looked at job tenure. Job tenure measures the number of consecutive months or years a person has worked with the current (or most recent) employer. The employee may have worked in one or more occupation or in one or more locations or businesses and still be considered to have continuous tenure if the employer has not changed. However, if a person has worked for the same employer over different periods, job tenure measures the most recent period of uninterrupted work. A temporary layoff does not constitute an interruption.
13 Total Employed - Thousands Job Tenure P a g e 10 Overall, a larger share of employees in the Brantford (CMA) have been employed for five or more years compared to Ontario and a smaller share under a year (see Figure 2). Figure 2. Total Employed by Job Tenure Brantford Census Metropolitan Area and Ontario 60+ months to 60 months to 12 months 1 to 6 months % Employed Ontario % Brantford % Source: Statistics Canada, Labour Force Survey Tenure patterns over a 10-year span show that the share of employees by tenue has changed little, suggesting that the stability of jobs has remained constant (see Figure 3). Figure 3. Total Employed by Job Tenure Trends Brantford Census Metropolitan Area to 6 months 7 to 12 months 13 to 60 months 61+ months Source: Statistics Canada, Labour Force Survey
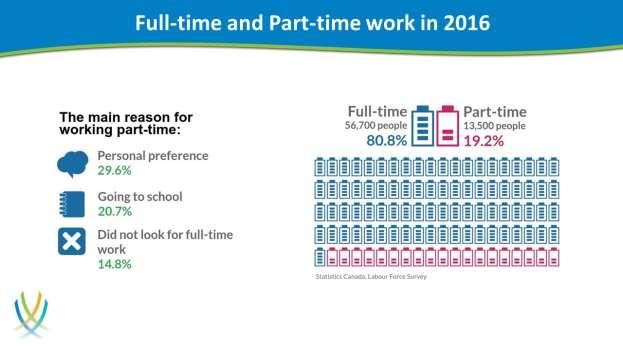
14 Total Employed Thousands P a g e 11 Full time - Part Time Work Full-time employment consists of persons who usually work 30 hours or more per week at their main or only job. Part-time employment consists of persons who usually work less than 30 hours per week at their main or only job. Precarious employment includes both full-time and part-time jobs that pay low wages, are insecure, and that provide workers with little control or choice of the hours scheduled or worked. By comparing the number of full-time and part-time jobs in the Brantford (CMA) to the community s total employment and to Ontario, we can gain an understanding of job security within the community. Employment numbers for Brantford (CMA) indicate that full-time jobs reached a 10-year high in 2016, representing over 80% of all jobs. In contrast, the number of part-time jobs fluctuated between 13,000 and 14,500 jobs, representing a slightly larger share of total employment than Ontario as a whole (see Figure 4 and Table 1). Figure 4. Number of People Employed, Full-time and Part-time Brantford Census Metropolitan Area Total Employed Employed Full-time Employed Part-time Source: Statistics Canada, Labour Force Survey Table 1. Proportion of People Employed Part-time Brantford Census Metropolitan Area and Ontario Brantford % Ontario % Source: Statistics Canada, Labour Force Survey
15 Job Tenure P a g e 12 In order to understand if these part-time jobs indicate precarious employment, we looked at why people are working part-time and how long they have worked in their current position (see Table 2). Table 2. Reasons for Part-time Employment Brantford Census Metropolitan Area 2016 Reasons for Part-Time Employment # % Own illness - - Caring for children - - Other personal or family responsibilities - - Going to school 2, Personal preference 4, Other voluntary - - Business Conditions, did not look for full-time work in last month 2, Could not find full-time work, did not look for full-time work in last month - - Business conditions, looked for full-time work in last month - - Could not find full-time work, looked for full-time work in last month - - Part-time employment, all reasons 13, Source: Statistics Canada, Labour Force Survey In 2016, just over half of all part-time workers in Brantford (CMA) chose to work part-time because of personal preference or because they attend school. Of the remaining workers, 2,000 people did not look for full-time work because they lacked confidence that jobs were available. These individuals and others who looked but could not find work, or whom family responsibilities prevented them from working fulltime, are most at-risk. Additional information looked at how long people have worked part-time in in their current job. Almost 10,000 (72.1%) workers have been in their job for more than a year, with the largest share (37.5%) working in the same job for more than five years. This suggests that the majority of people have some level of confidence and stability in their jobs (see Figure 5). Figure 5. Part-time Employment by Job Tenure Brantford Census Metropolitan Area and Ontario months 13 to 60 months 7 to 12 months 1 to 6 months Percentage Ontario Brantford Source: Statistics Canada, Labour Force Survey
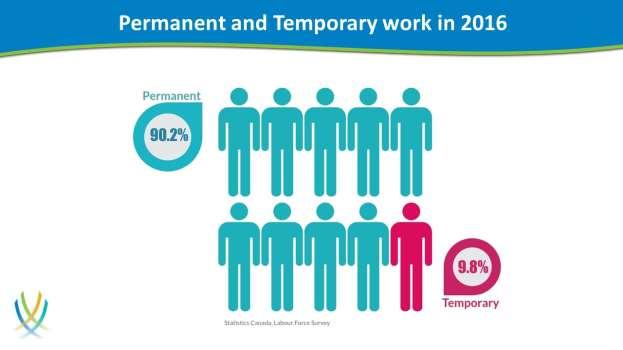
16 P a g e 13 Multiple Jobholders We know less about multiple jobholders. Multiple jobholders are defined as those people employed in two or more jobs simultaneously. Statistics at the Brantford (CMA) level are unavailable, however; Statistic Canada s Review of the Labour Market, 2016 shows that 5.5% of Ontario workers held multiple jobs in The number of people working multiple jobs has risen consistently since 1987, suggesting that an increasing number of workers may depend on more than one job to earn their livelihood or work in sectors with high levels of part-time employment. Youth aged 15 to 24 are most likely to work multiple jobs. In 2015, youth represented 7.2% of multiple jobholders compared to 4.3% for workers over the age of 55. Individuals employed within specific industry sectors and occupations are more likely to hold multiple jobs. These sectors represent two types of employment part-time work often associated with youth (retail, food services) and skilled workers and professionals in health and education (see Table 3). Table 3. Number of Multiple jobholders by top four Sectors (2-digits NAICS) in Brantford CMA NAIC Description Number 31, Wholesale and retail trade 55, Health care and social assistance 78, Education 39, Accommodation and food services 28,700 Source: Statistics Canada, Labour Force Survey, CANSIM Permanent versus Temporary and Seasonal Work Job insecurity is a primary factor attributed to precarious employment. A permanent job is one that is expected to last as long as the employee wants it, given that business conditions permit and that is there is no pre-determined termination date. In order to have a permanent job, one must be an employee. A temporary job has a predetermined end date, or ends as soon as a specific project is completed. Temporary jobs include seasonal jobs, temporary, term or contract jobs including work done through a temporary help agency, casual jobs, and other temporary work. In order to have a temporary job, one must be an employee. Labour force survey data for the Brantford (CMA) reveals that the majority of jobs (90.2%) in the community are permanent jobs, exceeding the provincial share by more than 3%. Temporary jobs account for 5,900 jobs or 9.6% of total employment, with most falling into the categories of seasonal or temporary work (see Table 4).
17 % of Employment # of Employees - Thousands P a g e 14 Table 4. Employee Job Permanency Brantford Census Metropolitan Area and Ontario 2016 Brantford % Ontario % Permanent Job Temporary Job Seasonal Job Term or Contract Job Casual Job x 3.0 Other Temporary Job x 0.1 Source: Statistics Canada, Labour Force Survey The number of temporary jobs has remained relatively stable over the past 10 years, with the highest peaks occurring in 2011 and 2015 (see Figure 6). Figure 6. Permanent and Temporary Employment Brantford Census Metropolitan Area Source: Statistics Canada, Labour Force Survey Total Employees Permanent Temporary During the past ten years, about 9 10% of all employment in the Brantford CMA was temporary. The rate has stayed fairly consistent, falling from 10.4% in 2007 to 9.5% in (see Figure 7). Figure 7. Distribution of Permanent and Temporary Employment Brantford Census Metropolitan Area 10.4% 8.7% 8.8% 9.2% 10.0% 9.6% 9.1% 10.1% 10.5% 9.6% 89.6% 91.4% 91.0% 90.8% 90.0% 90.4% 90.8% 89.9% 89.5% 90.2% Permanent % Temporary % Source: Statistics Canada, Labour Force Survey
18 % of Job Postings % of Employees P a g e 15 The industries with the largest share of permanent employees are: manufacturing, finance and insurance, real estate, rental and leasing, and professional, scientific and technical services. On the other hand, the industries that employ the largest share of temporary jobs are education services, information, culture and recreation, and agriculture (see Figure 8). Figure 8. Employee Job Permanency by North American Industry Classification Ontario Permanent Job Temporary Job Source: Statistics Canada, Labour Force Survey Many factors affect the number of temporary jobs within an area. Community feedback suggests that having an over-dependence on placement agencies is the major factor. Job vacancy data for indicates that temporary jobs account for about a quarter of all jobs and vacancies posted (see Figure 9). Figure 9. Job Postings by Duration % 69% 78% 72% 74% 75% 22% 31% 22% 28% 26% 25% Q Q Q Q Q Q2 Permanent Temporary Source: Vicinity Jobs, July 2017
19 Percentage P a g e 16 Job vacancies data also shows a declining trend in the total share of job postings by placement agencies, as seen in figure 10. The total of job postings placed by staffing agencies fell from 29% during the first three months of 2016 to 16% in Note: these postings include both temporary and full-time positions (see Figure 10). Figure 10. Job Postings by Source % 69% 72% 74% 75% 84% 29% 31% 28% 26% 25% 16% Q Q Q Q Q Q2 Placement Agency Employer Source: Vicinity Jobs, July 2017 Self-Employment By 2016, there were 9,600 self-employed workers in Brantford (CMA) according to Statistics Canada. This group includes self-employed owners of incorporated businesses (with or without employees), working owners of un-incorporated businesses (with or without employees), and self-employed persons who do not own a business (i.e. baby-sitters) (see Table 5). Table 5. Self-Employment Brantford Census Metropolitan Area Total Employed # Self-employed # Self-employed % ,800 9, ,700 9, ,600 8, ,400 8, ,500 7, ,500 9, ,900 9, ,600 9, ,300 9, ,200 8, Source: Statistics Canada, Labour Force Survey During the past 10 years, selfemployment rates have remained consistent, representing between 11.4% and 13.8% of Brantford (CMA) total employment
20 P a g e 17 Precarious employment includes people who are solely self-employed, meaning they have no employees or other sources of income. Earnings for self-employed represent two types: self-employed earnings that supplement other earned income and self-employed earnings only. Income data for 2014 indicates that 5,050 workers reported that self-employment was the only source of earnings at an average of $19, per year. These figures are less than the low-income cut-off for a single person and suggest a significant share of people have pursued self-employment as a means of earning a living (see Table 6). Table 6. Self-Employment Only Brantford Census Metropolitan Area Number of Tax filers with Self-employment Income Only # Total Self-employment Income Only $ Average $ , ,760,000 21, ,880 98,040,000 20, ,040 96,475,000 19, ,050 97,950,000 19, ,000 96,650,000 19, ,070 96,185,000 18, ,130 94,305,000 18, ,050 99,075,000 19,618 Source: Statistics Canada, Taxfiler Self-employment levels are also associated with the type of industry involved. In 2016, the largest share of self-employed people within Ontario occurred in agriculture followed by construction. These figures are not surprising due to the nature of family farms and independent construction contractors. The next highest sector includes people engaged in professional occupations, transportation and warehousing, and other services including automotive repair (see Figure 11).
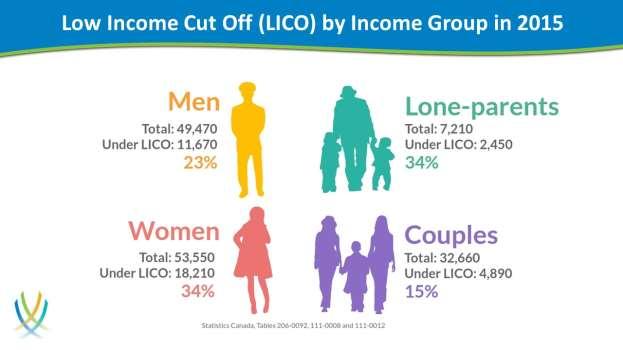
21 Percentage P a g e 18 Figure 11. Distribution of Employees and Self-Employed 2-Digits NAICS Employees % Self-Employed % Source: Statistics Canada, Labour Force Survey Income Levels Low wages are a factor for all types of precarious employment. While it is impossible to identify income by all employment types, we can look at income levels for individuals and types of families and compare their numbers to measures such as the low-income cut-off. Statistics Canada defines the low-income cut-off (LICO s) as an income threshold where a family is likely to spend 20% more of its income on food, shelter and clothing than the average family, leaving less income available for other expenses such as health, education, transportation and recreation. LICOs are calculated for families and communities of different sizes. Using the low-income cut-off for communities with a population of over 100,000, this report examines three groups single individuals, couple-families (average family of four) and lone-parent families (average family of three) (see Table 7). Table 7. Low income cut-offs (LICOs) before and after tax by community and family size in 2015 constant dollars Population 100,000 to 499,999 Family Size Source: Statistics Canada. Table Low income cut-offs (after tax) person $17,240 $20,000 3 persons $26,128 $30,000 4 persons $32,596 $40,000 Low income cut-offs (Before tax) 2015 (Approx.)
22 % of Male Population P a g e 19 Income data reported through Statistics Canada, reports annual earnings before tax. To estimate the number of low-income earners within the three groups, we identified the number of individual earners and families with incomes of $20,000.00, $30, and $40, before tax. We calculated taxes at 12.98% (for $20,000) % (for $30,000) and 20.37% (for $40,000) resulting in the low-income cut-off for the three groups (see Table 8). Table 8. Characteristics of single people with income less than $20,000 in Brantford CMA and Ontario Ontario Brantford CMA Total Both Sexes 3,182,890 29,880 Males 41% 39% Females 59% 61% Source: Statistics Canada, Table In terms of gender, for both the province and the census metropolitan area of Brantford, the number of females with low income is significantly higher than males. It is important to highlight that the percentage of each sex with an income less than $20,000 has experience a reduction in the last year (see Figures 12 and 13). The CMA of Brantford shows slightly smaller percentage of low-income individuals than the provinces for males and females. Figure 12. Percentage of Male Population with Income under $20, % 30% 28% 26% 24% 22% 20% Brantford (CMA) Ontario (Province) Source: Statistics Canada, Tables and
23 % of Couple-Families % of Female Population P a g e 20 Figure 13. Percentage of Female Population with Income under $20, % 40% 38% 36% 34% 32% Brantford (CMA) Ontario (Province) Source: Statistics Canada, Tables and As mentioned early in this section, it was possible to identify three different family groups; people living in couple-families, lone-parent families and persons not in census families. For the couple-families group, the results show that about 15% of these groups in Brantford CMA received what is consider a lowincome. Nevertheless, Brantford has performed better than the province in the last years (see Figure 14). Couple-family refers to a family that contains a married or common-law couple (either with or without children). A couple may be of opposite or same sex. In economic families, couple families only include families where the reference person has a legally married spouse or common-law partner in the family. Statistics Canada Figure 14. Percentage of Couple-Families with Income under $40, % 19% 18% 17% 16% 15% 14% There is a slightly smaller share of couple-families living below the low-income cut-off (Brantford CMA) Brantford (CMA) Ontario (Province) Source: Statistics Canada, Tables and Calculations for lone-parent families took into account an income (before tax) of $30,000, considering a three-person family group. The results show an important decline in the percentage of lone-parent families living below low-income cut-off; however, by 2015, 34% of this type of families in Brantford CMA still were under the LICO. When compared with the province, Brantford, despite having improved in the last years, is still 3.8% higher than the province.
24 % of Not in Census Families % of Lone-Parent Families P a g e 21 Figure 15. Percentage of Lone-Parent Families with Income under $30, % 40% 35% 30% 25% Brantford (CMA) Ontario (Province) Source: Statistics Canada, Tables and Lone-parent family refers to a family living in private households that are headed by lone-parents. A lone-parent is a man or woman, who is single, separated, divorced, or widowed who cares for one or more children with no assistance from a spouse or common-law partner in the home. Statistics Canada For the last group, defined as persons not in census families, we used a low-income cut-off of $20,000 to calculate the total number of individuals. In 2015, 30.9% of this group received an income under the LICO, almost 3% lower than province rate in the same year. For all family groups mentioned before, the percentage of individuals and families under the LICO s have been considerably reduced. Figure 16. Percentage of Persons not in Census Families with Income Under $20, % 36% 34% 32% 30% Brantford (CMA) Ontario (Province) Source: Statistics Canada, Tables and
25 P a g e 22 Persons not in census families are individuals who are not part of a census family - couple family or lone-parent family. These persons may live with their married children or with their children who have children of their own. They may be living with a family to whom they are related or unrelated. Statistics Canada
26 Thousands Thousands P a g e 23 Job Retention In addition to job tenure, we must understand the impact of job separations in relationship to precarious employment. We examined two aspects job leavers and job losers. Job leavers are unemployed persons who quit or terminated their employment voluntarily and immediately began looking for work. Job losers are unemployed persons who involuntarily lost their last job or who had completed a temporary job. This includes persons who were on temporary layoff expecting to return to work, as well as persons not on temporary layoff. Those not on temporary layoff include permanent job losers and persons whose temporary jobs ended. Over the past 10 years, the number of people voluntarily leaving their job has fluctuated, reaching a high of 5,300 people in The reasons behind so many job leavers are unclear, but growing opportunities in a tight labour market may mean that workers are more confident of finding better paying, stable jobs (see Figure 17). Figure 17. Reasons for Leaving Job during Previous Year Brantford Census Metropolitan Area Job Leavers Job Losers Source: Statistics Canada, Labour Force Survey In contrast, the number of job losers declined consistently, reaching a 10-year low of 3,200 in Almost all of these job losers (3,000) were due to permanent lay-off (see Figure 18). Figure 18. Job Losers: Permanent Layoff Brantford Census Metropolitan Area Job Losers Permanent Layoff Source: Statistics Canada, Labour Force Survey
27 P a g e 24 Recommendations for the Community On December 8, 2017 an advisory group worked together to identify the key priorities and actions needed to address the issues affecting vulnerable workers. These include: Childcare investigate what child care supports are available to working parents outside of fulltime, mainstream childcare hours; Transportation research and identify where job clusters exist within Brantford and area and work towards innovate transportation supports and solutions; Flexible employment services investigate what employment services are available to precariously employed people and develop flexible, access points for service; and Myth busting change the negative perception that all jobs are temporary and low paying to a tone of optimism and hope based on the facts that show our thriving economy and opportunities. Educate our leaders inform councils, community organizations, government representatives and others about precarious employment and encourage strategic activities that build the community s and residents economic prosperity.
28 P a g e 25 References Vosko L., Zukewich N, Cranford C., October 2003, precarious jobs: A new typology of employment. Statistics Canada. Vulnerable Workers in Precarious Jobs, Ontario.ca. DePratto, Economist; Bartlett, R. CFA, Senior Economist. March 26, Precarious Employment in Canada: Does the Evidence Square with the Anecdotes? Gaspard V., 2017, University of Guelph, Help Wanted: Precarious Employment in Rural Ontario. Analysis of Key Informant Interviews. Source: Bourbeau, E and Fields, A., April 2017, Annual review of the labour market, 2016, Statistics Canada. Law Commission of Ontario. Quick Facts about Vulnerable Workers and Precarious Work. Statistics Canada, 2016., Labour Force Survey. Statistics Canada. Table Low income cut-offs (LICOs) before and after tax by community and family size in 2015 constant dollars, occasional, CANSIM. Statistics Canada. Table Labour force survey estimates (LFS), multiple jobholders by North American Industry Classification System (NAICS), sex and age group, annual (persons), CANSIM. Statistics Canada. Table Characteristics of individuals, taxfilers and dependents with income by total income, sex and age groups, annual (number unless otherwise noted), CANSIM. Statistics Canada. Table Characteristics of families, distribution of total income by census family type and age of older partner, parent or individual, annual (number unless otherwise noted), CANSIM.
29 P a g e 26

30 P a g e 27
Make it Fair in Sudbury! Regional Perspective Who would improvements to employment laws directly affect?
 Make it Fair in Sudbury! Regional Perspective Who would improvements to employment laws directly affect? Population In the Greater Sudbury Census Metropolitan Area (CMA), the number of persons of working
A STATISTICAL PROFILE OF WOMEN IN THE SASKATCHEWAN LABOUR MARKET
 A STATISTICAL PROFILE OF WOMEN IN THE SASKATCHEWAN LABOUR MARKET A report prepared for: Status of Women Office Saskatchewan Ministry of Social Services by Sask Trends Monitor April 2017 Table of Contents
Post-Secondary Education, Training and Labour Prepared November New Brunswick Minimum Wage Report
 Post-Secondary Education, Training and Labour Prepared November 2018 2018 New Brunswick Minimum Wage Report Contents Section 1 Minimum Wage Rates in New Brunswick... 2 1.1 Recent History of Minimum Wage
Yukon Bureau of Statistics
 Yukon Bureau of Statistics 2 9 # 1 $ > - 2 + 6 & ± 8 < 3 π 7 9 1 ^ Highlights: Yukon Employment Annual Review 216 Yukon s 216 unemployment rate (.6%) decreased by.7 percentage points compared to 21 (6.3%).
Post-Secondary Education, Training and Labour Prepared May New Brunswick Minimum Wage Report
 Post-Secondary Education, Training and Labour Prepared May 2018 2018 New Brunswick Minimum Wage Report Contents Section 1 Minimum Wage Rates in New Brunswick... 2 1.1 Recent History of Minimum Wage in
Catalogue no XIE. Income in Canada
 Catalogue no. 75-202-XIE Income in Canada 2005 How to obtain more information Specific inquiries about this product and related statistics or services should be directed to: Income in Canada, Statistics
context about this report what is poverty?
 Poverty Trends in London September 2015 table of contents 3 3 3 4 5 5 6 8 9 10 11 12 13 14 14 15 15 16 context about this report what is poverty? who is most likely experiencing poverty? how is ontario
Alberta Low Wage Profile April March 2017
 Alberta Low Wage Profile April 2016 - March 2017 Introduction This Alberta Low Wage Profile presents current information on low wage earners which are persons whose average hourly earnings 1 are below
Alberta Low Wage Profile April March 2018
 Alberta Low Wage Profile April 2017 - March 2018 Introduction This Alberta Low Wage Profile presents current information on low wage earners which are persons whose average hourly earnings 1 are below
Region of Waterloo Planning, Development and Legislative Services Community Planning
 Region of Waterloo Planning, Development and Legislative Services Community Planning To: Chair Tom Galloway and Members of the Planning and Works Committee Date: April 4, 217 File Code: D7-4(A) Subject:
STATUS OF WOMEN OFFICE. Socio-Demographic Profiles of Saskatchewan Women. Aboriginal Women
 Socio-Demographic Profiles of Saskatchewan Women Aboriginal Women Aboriginal Women This statistical profile describes some of the social and economic characteristics of the growing population of Aboriginal
The Province of Prince Edward Island Employment Trends and Data Poverty Reduction Action Plan Backgrounder
 The Province of Prince Edward Island Employment Trends and Data Poverty Reduction Action Plan Backgrounder 5/17/2018 www.princeedwardisland.ca/poverty-reduction $000's Poverty Reduction Action Plan Backgrounder:
Prince Edward Island Labour Force Survey 2017 Annual Report. Highlights:
 Prince Edward Island Labour Force Survey 2017 Annual Report Highlights: Employment increased by 3.1 per cent in 2017, averaging 73,700. This was the second highest growth rate among provinces, behind only
Monthly Labour Force Survey Statistics November 2018
 800 Monthly Labour Force Survey Statistics CALGARY CMA Table 282-0135 Labour force survey estimates (LFS), by census metropolitan area based on 2011 census boundaries, 3-month moving average, seasonally
Monthly Labour Force Survey Statistics December 2018
 800 Monthly Labour Force Survey Statistics CALGARY CMA Table 282-0135 Labour force survey estimates (LFS), by census metropolitan area based on 2011 census boundaries, 3-month moving average, seasonally
City of Edmonton Population Change by Age,
 Population Change by Age, 1996-2001 2001 Edmonton Demographic Profile The City of Edmonton s 2001population increased by 49,800 since the 1996 census. Migration figures are not available at the municipal
Central West Ontario Social and Economic Inclusion Project. Brant County Profile. Prepared by:
 Central West Ontario Social and Economic Inclusion Project Brant County Profile Prepared by: December, 2003 1.0 Introduction to Brant County Brant County is located between Hamilton to the east and London
Socio-economic Profile for Northeastern Region Community Futures Development Corporation. Prepared for: FedNor/Industry Canada
 Socio-economic Profile for Community Futures Development Corporation Prepared for: FedNor/Industry Canada Statistics Canada Central Region June 2015 TABLE OF CONTENTS Introduction 4 Geography Note 5 List
Monitoring Report on EI Receipt by Reason for Job Separation
 Monitoring Report on EI Receipt by Reason for Job Separation Final Report Evaluation and Data Development Strategic Policy Human Resources Development Canada May 2003 SP-ML-018-05-03E (également disponible
ECONOMIC DEVELOPMENT YEAR 1, UNIVERSITY OF WATERLOO THE NORTHERN ECONOMY 17 JUNE 2016, THUNDER BAY
 6/7/216 ECONOMIC DEVELOPMENT YEAR 1, UNIVERSITY OF WATERLOO THE NORTHERN ECONOMY 17 JUNE 216, THUNDER BAY Overview Introduction to Northern Policy Institute GDP in the North Employment in the North Opportunities
SOUTH DAKOTA KIDS COUNT BEACOM SCHOOL OF BUSINESS UNIVERSITY OF SOUTH DAKOTA 414 E. CLARK STREET VERMILLION, SD
 Brookings County Compared to o SDSD Undergrad Enrollment approximately 11,225 o USD Undergrad Enrollment approximately 7,600 o Brookings County 1 year population estimate for 2013 is 32,968 o 1 year population
Guide to the Labour Force Survey Revised February 2002
 Catalogue no 71-543-GIE Guide to the Labour Force Survey Revised February 2002 How to obtain more information Specific inquiries about this product and related statistics or services should be directed
2017 Alberta Labour Force Profiles Youth
 2017 Alberta Labour Force Profiles Youth Highlights Population Statistics Labour Force Statistics 4 th highest proportion of youth in the working age population 1. 16.3% MB 2. 15.3% ON 2. 15.2% SK 4. 14.9%
Short- Term Employment Growth Forecast (as at February 19, 2015)
") Background According to Statistics Canada s Labour Force Survey records, employment conditions in Newfoundland and Labrador showed signs of weakening this past year. Having grown to a record level high
Background According to Statistics Canada s Labour Force Survey records, employment conditions in Newfoundland and Labrador showed signs of weakening this past year. Having grown to a record level high
Income, pensions, spending and wealth
 CHAPTER 18 Income, pensions, spending and wealth After four years of growth, the median after-tax income for Canadian families of two or more people remained virtually stable in 2008 at $63,900. The level
Post-Secondary Education, Training and Labour August New Brunswick Minimum Wage Factsheet 2017
 Post-Secondary Education, Training and Labour August 2017 New Brunswick Minimum Wage Factsheet 2017 Contents PART 1 - Minimum Wage Rates in New Brunswick... 3 1.1 Recent History of Minimum Wage in New
Alberta Low Wage Profile April 2015-March 2016
 Alberta Low Wage Profile April 2015-March 2016 Introduction This Alberta Low Wage Profile presents current information on persons whose average hourly earnings 1 are below $15 in Alberta and other provinces.
Alberta Minimum Wage Profile April March 2018
 Alberta Minimum Wage Profile April 2017 - March 2018 Introduction The Alberta Minimum Wage Profile presents current information on persons whose average hourly earnings 1 are at or below minimum in Alberta
Memorandum. Some of the report s key findings include:
 Community and Health Services Department Office of the Commissioner Memorandum To: From: Members of Committee of the Whole Katherine Chislett Commissioner of Community and Health Services Date: April 6,
Tell us what you think. Provide feedback to help make American Community Survey data more useful for you.
 DP03 SELECTED ECONOMIC CHARACTERISTICS 2016 American Community Survey 1-Year Estimates Supporting documentation on code lists, subject definitions, data accuracy, and statistical testing can be found on
Labour Market Bulletin
 Labour Market Bulletin Newfoundland and Labrador September 2015 This Labour Market Bulletin is a report providing an analysis of Labour Force Survey results for the province of Newfoundland and Labrador,
American Community Survey 5-Year Estimates
 DP03 SELECTED ECONOMIC CHARACTERISTICS 2012-2016 American Community Survey 5-Year Estimates Supporting documentation on code lists, subject definitions, data accuracy, and statistical testing can be found
American Community Survey 5-Year Estimates
 DP03 SELECTED ECONOMIC CHARACTERISTICS 2012-2016 American Community Survey 5-Year Estimates Supporting documentation on code lists, subject definitions, data accuracy, and statistical testing can be found
American Community Survey 5-Year Estimates
 DP03 SELECTED ECONOMIC CHARACTERISTICS 2012-2016 American Community Survey 5-Year Estimates Supporting documentation on code lists, subject definitions, data accuracy, and statistical testing can be found
American Community Survey 5-Year Estimates
 DP03 SELECTED ECONOMIC CHARACTERISTICS 2012-2016 American Community Survey 5-Year Estimates Supporting documentation on code lists, subject definitions, data accuracy, and statistical testing can be found
American Community Survey 5-Year Estimates
 DP03 SELECTED ECONOMIC CHARACTERISTICS 2012-2016 American Community Survey 5-Year Estimates Supporting documentation on code lists, subject definitions, data accuracy, and statistical testing can be found
American Community Survey 5-Year Estimates
 DP03 SELECTED ECONOMIC CHARACTERISTICS 2012-2016 American Community Survey 5-Year Estimates Supporting documentation on code lists, subject definitions, data accuracy, and statistical testing can be found
American Community Survey 5-Year Estimates
 DP03 SELECTED ECONOMIC CHARACTERISTICS 2012-2016 American Community Survey 5-Year Estimates Supporting documentation on code lists, subject definitions, data accuracy, and statistical testing can be found
American Community Survey 5-Year Estimates
 DP03 SELECTED ECONOMIC CHARACTERISTICS 2012-2016 American Community Survey 5-Year Estimates Supporting documentation on code lists, subject definitions, data accuracy, and statistical testing can be found
American Community Survey 5-Year Estimates
 DP03 SELECTED ECONOMIC CHARACTERISTICS 2012-2016 American Community Survey 5-Year Estimates Supporting documentation on code lists, subject definitions, data accuracy, and statistical testing can be found
American Community Survey 5-Year Estimates
 DP03 SELECTED ECONOMIC CHARACTERISTICS 2012-2016 American Community Survey 5-Year Estimates Supporting documentation on code lists, subject definitions, data accuracy, and statistical testing can be found
American Community Survey 5-Year Estimates
 DP03 SELECTED ECONOMIC CHARACTERISTICS 2012-2016 American Community Survey 5-Year Estimates Supporting documentation on code lists, subject definitions, data accuracy, and statistical testing can be found
American Community Survey 5-Year Estimates
 DP03 SELECTED ECONOMIC CHARACTERISTICS 2012-2016 American Community Survey 5-Year Estimates Supporting documentation on code lists, subject definitions, data accuracy, and statistical testing can be found
American Community Survey 5-Year Estimates
 DP03 SELECTED ECONOMIC CHARACTERISTICS 2012-2016 American Community Survey 5-Year Estimates Supporting documentation on code lists, subject definitions, data accuracy, and statistical testing can be found
American Community Survey 5-Year Estimates
 DP03 SELECTED ECONOMIC CHARACTERISTICS 2012-2016 American Community Survey 5-Year Estimates Supporting documentation on code lists, subject definitions, data accuracy, and statistical testing can be found
American Community Survey 5-Year Estimates
 DP03 SELECTED ECONOMIC CHARACTERISTICS 2012-2016 American Community Survey 5-Year Estimates Supporting documentation on code lists, subject definitions, data accuracy, and statistical testing can be found
American Community Survey 5-Year Estimates
 DP03 SELECTED ECONOMIC CHARACTERISTICS 2012-2016 American Community Survey 5-Year Estimates Supporting documentation on code lists, subject definitions, data accuracy, and statistical testing can be found
American Community Survey 5-Year Estimates
 DP03 SELECTED ECONOMIC CHARACTERISTICS 2012-2016 American Community Survey 5-Year Estimates Supporting documentation on code lists, subject definitions, data accuracy, and statistical testing can be found
American Community Survey 5-Year Estimates
 DP03 SELECTED ECONOMIC CHARACTERISTICS 2012-2016 American Community Survey 5-Year Estimates Supporting documentation on code lists, subject definitions, data accuracy, and statistical testing can be found
American Community Survey 5-Year Estimates
 DP03 SELECTED ECONOMIC CHARACTERISTICS 2012-2016 American Community Survey 5-Year Estimates Supporting documentation on code lists, subject definitions, data accuracy, and statistical testing can be found
American Community Survey 5-Year Estimates
 DP03 SELECTED ECONOMIC CHARACTERISTICS 2012-2016 American Community Survey 5-Year Estimates Supporting documentation on code lists, subject definitions, data accuracy, and statistical testing can be found
American Community Survey 5-Year Estimates
 DP03 SELECTED ECONOMIC CHARACTERISTICS 2012-2016 American Community Survey 5-Year Estimates Supporting documentation on code lists, subject definitions, data accuracy, and statistical testing can be found
American Community Survey 5-Year Estimates
 DP03 SELECTED ECONOMIC CHARACTERISTICS 2012-2016 American Community Survey 5-Year Estimates Supporting documentation on code lists, subject definitions, data accuracy, and statistical testing can be found
American Community Survey 5-Year Estimates
 DP03 SELECTED ECONOMIC CHARACTERISTICS 2012-2016 American Community Survey 5-Year Estimates Supporting documentation on code lists, subject definitions, data accuracy, and statistical testing can be found
American Community Survey 5-Year Estimates
 DP03 SELECTED ECONOMIC CHARACTERISTICS 2012-2016 American Community Survey 5-Year Estimates Supporting documentation on code lists, subject definitions, data accuracy, and statistical testing can be found
American Community Survey 5-Year Estimates
 DP03 SELECTED ECONOMIC CHARACTERISTICS 2012-2016 American Community Survey 5-Year Estimates Supporting documentation on code lists, subject definitions, data accuracy, and statistical testing can be found
American Community Survey 5-Year Estimates
 DP03 SELECTED ECONOMIC CHARACTERISTICS 2012-2016 American Community Survey 5-Year Estimates Supporting documentation on code lists, subject definitions, data accuracy, and statistical testing can be found
To What Extent is Household Spending Reduced as a Result of Unemployment?
 To What Extent is Household Spending Reduced as a Result of Unemployment? Final Report Employment Insurance Evaluation Evaluation and Data Development Human Resources Development Canada April 2003 SP-ML-017-04-03E
Perspectives on the Youth Labour Market in Canada
 Perspectives on the Youth Labour Market in Canada Presentation to the Financial Management Institute of Canada November 16 René Morissette Research Manager Analytical Studies Branch While unemployment
Labour Market Information Monthly
 Canada's population estimates: Subprovincial areas, July 1, 2014 On July 1, 2014, almost 7 in 10 Canadians, or 24,858,600 people, were living in a census metropolitan area (CMA). In turn, more than one
INDUSTRY PROFILES. Health Care and Social Assistance Industry
 INDUSTRY PROFILES Health Care and Social Assistance Industry June 2012 Overview: The Health Care and Social Assistance industry 1 in Alberta includes establishments and services such as: hospitals, nursing
AUGUST THE DUNNING REPORT: DIMENSIONS OF CORE HOUSING NEED IN CANADA Second Edition
 AUGUST 2009 THE DUNNING REPORT: DIMENSIONS OF CORE HOUSING NEED IN Second Edition Table of Contents PAGE Background 2 Summary 3 Trends 1991 to 2006, and Beyond 6 The Dimensions of Core Housing Need 8
Visit our Publications and Open Data Catalogue to find our complete inventory of our freely available information products.
 Welcome to Mississauga Data This report and other related documents can be found at www.mississauga.ca/data. Mississauga Data is the official City of Mississauga website that contains urban planning related
OTTAWA THIS QUARTER Q A quarterly view of Ottawa s employment landscape from your Local Employment Planning Council
 OTTAWA THIS QUARTER Who lives in Ottawa and where they live Where people work Industry view Ottawa s labour pool and employment What people do Occupation view A quarterly view of Ottawa s employment landscape
American Community Survey 5-Year Estimates
 DP03 SELECTED ECONOMIC CHARACTERISTICS 2013-2017 American Community Survey 5-Year Estimates Supporting documentation on code lists, subject definitions, data accuracy, and statistical testing can be found
THE EMPLOYMENT SITUATION: SEPTEMBER 2000
 Internet address: http://stats.bls.gov/newsrels.htm Technical information: USDL 00-284 Household data: (202) 691-6378 Transmission of material in this release is Establishment data: 691-6555 embargoed
Woodlands County Economic Indicators 2015
 Woodlands County Economic Indicators 215 Message from the Mayor In my time as Mayor, I have witnessed several recessions, and it certainly says a lot about our community. In 28, while businesses around
Highlights. For the purpose of this profile, the population is defined as women 15+ years.
 A L B E R T A L A B O U R F O R C E P R O F I L ES Women 2014 Highlights For the purpose of this profile, the population is defined as women 15+. Working Age Population of Women in Alberta The number of
Working for minimum wage
 Working for minimum wage (IS 894 A1) Winter 1989 (Vol. 1, No. 3) Working for minimum wage Ernest B. Akyeampong Canadian attempts at regulating wages started with the federal "Fair Wages Policy" of 1900.
FACT SHEET: LOW INCOME in LONDON
 Prepared by the Social Research and Planning Unit Social and Supports Division Services Department February, FACT SHEET: LOW INCOME in LONDON Highlights While low income is being reduced in London, there
SELECTED ECONOMIC CHARACTERISTICS American Community Survey 5-Year Estimates
 DP03 SELECTED ECONOMIC CHARACTERISTICS 2008-2012 American Community Survey 5-Year Estimates Supporting documentation on code lists, subject definitions, data accuracy, and statistical testing can be found
The labour force participation rate of Ontario youth remains well-below its historical average.
 February 1, 1 Ontario Records Strong Labour Market Performance in 17 The Ontario economy created 1, net new jobs in 17, the largest annual job gain since 3, while the unemployment rate dropped to. per
The Saskatchewan Labour Market
 The Saskatchewan Labour Market Presentation to: Yorkton Employer Seminar February 12, 2004 Yorkton, Saskatchewan Doug Elliott Sask Trends Monitor 444 19th Avenue Regina, Saskatchewan S4N 1H1 Tel: 306-522-5515
Alberta Labour Force Profiles
 Alberta Labour Force Profiles 2011 Highlights For the purpose of this profile, youth are defined as persons aged 15 to 24 years. 1. Alberta Population Statistics Among the provinces, Alberta had the third
Alberta Minimum Wage Profile April March 2017
 Alberta Minimum Wage Profile April 2016 - March 2017 Introduction The Alberta Minimum Wage Profile presents current information on persons whose average hourly earnings 1 are at or below minimum wage in
A Collection of Statistical Data for Huron County and its Census Subdivisions
 A Collection of Statistical Data for and its Census Subdivisions The following information is a collection of statistical data describing key elements (language, labour market, income levels, migration
LABOUR MARKET TRENDS IN SASKATCHEWAN
 LABOUR MARKET TRENDS IN SASKATCHEWAN Prepared for the: Saskatchewan Career Work Education Conference North Battleford, Saskatchewan October 27, 2016 Doug Elliott Sask Trends Monitor 444 19th Avenue Regina,
newstats 2016 NWT Annual Labour Force Activity NWT Bureau of Statistics Overview
 newstats NWT Bureau of Statistics Released: March 27, 2017 2016 NWT Annual Labour Force Activity Overview The Labour Force Survey is a source of monthly estimates of employment and unemployment. On a yearly
Market Study Report for the Municipality of Sioux Lookout. Prepared by:
 Market Study Report for the Municipality of Sioux Lookout Prepared by: March 31, 2011 Market Study Report For the Municipality of Sioux Lookout Prepared by: McSweeney & Associates 900 Greenbank Road Suite
Economic Standard of Living
 DESIRED OUTCOMES New Zealand is a prosperous society, reflecting the value of both paid and unpaid work. All people have access to adequate incomes and decent, affordable housing that meets their needs.
Québec City. Summary and Highlights. Innovation Systems Research Network. City-Region Profile
 Summary and Highlights City-Region Profile Key Indicators Population, 2001 682,745 30,007,085 Population Change 1996-2001 1.6% 4.0% % Foreign Born 2.9% 18.2% % BA Degree or higher 17.5% 15.4% Labour Force
Source(s): Statistics Canada, Cansim Table , Seasonally Adjusted
: Statistics Canada, Cansim Table , Seasonally Adjusted") Monthly Headlines Low Loonie Not Increasing Canadian Manufacturing Employment... Yet. From June to July, total employment fell by 600 (-0.3%) to 236,500 on a seasonally adjusted basis. i While full-time
Monthly Headlines Low Loonie Not Increasing Canadian Manufacturing Employment... Yet. From June to July, total employment fell by 600 (-0.3%) to 236,500 on a seasonally adjusted basis. i While full-time
NEW ZEALAND Overview of the tax-benefit system
 NEW ZEALAND 2005 1. Overview of the tax-benefit system The provision of social security benefits in New Zealand is funded from general taxation and not specific social security contributions. For example,
A Profile of Workplaces in Waterloo Region
 A Profile of Workplaces in Waterloo Region March 2010 Overview This report is a reference document for the Region of Waterloo Public Health s workplace health initiative, Project Health (http://www.projecthealth.ca),
Toronto s City #3: A Profile of Four Groups of Neighbourhoods
 Toronto s City #3: A Profile of Four Groups of Neighbourhoods A supplement to the Three Cities in Toronto analysis of trends, focused on City #3, the 40% of the City s neighbourhoods with the lowest incomes
Minnesota Minimum-Wage Report, 2015
 This document is made available electronically by the Minnesota Legislative Reference Library as part of an ongoing digital archiving project. http://www.leg.state.mn.us/lrl/lrl.asp Minnesota Minimum-Wage
Labrador City. Summary and Highlights. Innovation Systems Research Network. City-Region Profile
 Summary and Highlights Labrador Key Indicators Population, 2001 City 9,645 30,007,085 Population Change, 1996-2001 -7.9% 4.0% % Foreign Born 1.7% 18.2% % BA Degree or higher 7.3% 15.4% Labour Force 7,865
BC CAMPAIGN FACT SHEETS
 2006 FACT SHEETS Fact Sheet #1 - What is Child Poverty? Fact Sheet #2 - BC Had the Worst Record Three Years in a Row Fact Sheet #3 - Child Poverty over the Years Fact Sheet #4 - Child Poverty by Family
TRADE UNION MEMBERSHIP Statistical Bulletin
 TRADE UNION MEMBERSHIP 2016 Statistical Bulletin May 2017 Contents Introduction 3 Key findings 5 1. Long Term and Recent Trends 6 2. Private and Public Sectors 13 3. Personal and job characteristics 16
Analysis of Labour Force Survey Data for the Information Technology Occupations
 April 2006 Analysis of Labour Force Survey Data for the Information Technology Occupations 2000 2005 By: William G Wolfson, WGW Services Ltd. Contents Highlights... 2 Background... 4 1. Overview of Labour
2000 HOUSING AND POPULATION CENSUS
 Ministry of Finance and Economic Development CENTRAL STATISTICS OFFICE 2000 HOUSING AND POPULATION CENSUS REPUBLIC OF MAURITIUS ANALYSIS REPORT VOLUME VIII - ECONOMIC ACTIVITY CHARACTERISTICS June 2005
Catalogue no GIE. Guide to the Labour Force Survey
 Catalogue no. 71-543-GIE Guide to the Labour Force Survey 2006 How to obtain more information Specific inquiries about this product and related statistics or services should be directed to: Client Services,
Business insights. Employment and unemployment. Sharp rise in employment since early 1975
 Business insights Employment and unemployment Early each month, usually the first Friday, the United States Bureau of Labor Statistics (BLS) issues its report, "The Employment Situation." This publication
State of Ohio Workforce. 2 nd Quarter
 To Strengthen Ohio s Families through the Delivery of Integrated Solutions to Temporary Challenges State of Ohio Workforce 2 nd Quarter 2 0 1 2 Quarterly Report on the State of Ohio s Workforce Reference
Older Workers: Employment and Retirement Trends
 Cornell University ILR School DigitalCommons@ILR Federal Publications Key Workplace Documents 9-15-2008 Older Workers: Employment and Retirement Trends Patrick Purcell Congressional Research Service; Domestic
Submission to House of Commons Standing Committee on Finance Pre-Budget Consultation Giving Priority to Low-Income, Unattached, Women Seniors
 383 Parkdale Avenue Suite 402 Ottawa ( Ontario) K1Y 4R4 Tel. : (613) 729-6668 Fax. : (613) 729-9608 E-mail : casw@casw-acts.ca Submission to House of Commons Standing Committee on Finance Pre-Budget Consultation
NEW ZEALAND. 1. Overview of the tax-benefit system
 NEW ZEALAND 2006 1. Overview of the tax-benefit system The provision of social security benefits in New Zealand is funded from general taxation and not specific social security contributions. Social security
Minnesota Minimum-Wage Report, 2013
 This document is made available electronically by the Minnesota Legislative Reference Library as part of an ongoing digital archiving project. http://www.leg.state.mn.us/lrl/lrl.asp Minnesota Minimum-Wage
Overview of Ontario Agriculture, Population and Labour Statistics
 Overview of Ontario Agriculture, Population and Labour Statistics Prepared for: Ontario Pork Industry Council Prepared by: Lynn Marchand Ken McEwan June 2008 Acknowledgements The report Human Resource
New products and studies 19
 Catalogue 11-001-X (ISSN 1205-9137) Thursday, June 28, 2012 Released at 8:30 a.m. Eastern time Releases Payroll employment, earnings and hours, April 2012 (preliminary data) 2 In April, average weekly