Comprehensive Annual Financial Report
|
|
|
- Vivien Ruby Hood
- 5 years ago
- Views:
Transcription


1 Comprehensive Annual Financial Report For The Fiscal Year Ended June 30, 2012 Rebuilding the Foundation Washington, D.C.
2 Comprehensive Annual Financial Report For The Fiscal Year Ended June 30, 2012 Carol Dillon Kissal, Deputy General Manager Administration and Chief Financial Officer Prepared by: Office of Accounting Stephanie Audette, Comptroller Rebuilding the Foundation Washington, D.C.
3 Comprehensive Annual Financial Report for the fiscal year ended June 30, 2012 Table of Contents SECTION ONE - INTRODUCTORY (Unaudited) Letter of Transmittal 1 Board of Directors 6 General Manager s Executive Leadership Team 7 Organizational Chart 8 Certificate of Achievement for Excellence in Financial Reporting 9 SECTION TWO - FINANCIAL Independent Auditor s Report 10 Management s Discussion and Analysis 12 Financial Statements: Statements of Net Assets 22 Statements of Revenues, Expenses and Changes in Net Assets 24 Statements of Cash Flows 25 Notes to Basic Financial Statements 27 Required Supplementary Information Schedules of Funding Progress Pension Plans 61 Schedules of Funding Progress Postemployment Benefits Other than Pensions 62 SECTION THREE - STATISTICAL (Unaudited) Net Assets by Component 63 Changes in Net Assets 64 Revenue Base 65 Passenger Fare Structure 66 Ratios of Outstanding Debt by Type 67 Pledged-Revenue Coverage 68 Major Private Employers and Demographic Statistics 69 Authorized Employee Positions 70 Operating Indicators 71
4 SECTION ONE INTRODUCTORY (Unaudited) Letter of Transmittal Board of Directors General Manager s Executive Leadership Team Organizational Chart Certificate of Achievement for Excellence in Financial Reporting
5
6
7 The economies of the District of Columbia and the Washington region are heavily dependent on federal government spending. Spending has slowed recently as the 2009 stimulus projects are completed and as spending to support military actions in Iraq and Afghanistan also winds down. The more immediate concern is the fiscal cliff and the potential for sequestration beginning in January Agencies have intensified cost-cutting plans over the last year via staffing reductions and real estate consolidation, but these efforts would only be a first step if the current law remains unchanged. The additional cuts triggered by sequestration would be a worst-case scenario for the Washington region and would very likely send the region (and potentially the entire U.S.) back into recession. The impact on Authority ridership and revenue could be severe, given the number of federal employees and federal contractors who potentially could be furloughed and no longer traveling to work on Metrobus and Metrorail. Metrorail has also been negatively impacted by recent changes to the federal transit benefit subsidy, which is utilized by a majority of Metrorail riders. The longer-term outlook for the Washington region is mixed. Even if the immediate risks of sequestration are avoided, federal government spending is not expected to grow as strongly as it did during the previous decade. This will remove some of the insulation that the Washington region has had recently from broader macroeconomic trends. However, healthcare and high-tech start-ups are expected to be bright spots in the region s economy, with the former in particular providing a buffer to future recessions. Accordingly, the Authority is projecting relatively flat growth in passenger ridership in Ridership is expected to increase in 2014 with the opening of the new Metrorail Silver Line to Tysons Corner in Virginia. Long-term Financial Planning Capital Improvement Program The Authority and the local jurisdictions that provide funding for capital improvements executed a formal and comprehensive Capital Funding Agreement (CFA) for capital improvements, commonly known as the Capital Improvement Program. The Capital Improvement Program (CIP) uses an expenditure based strategy and has the following nine main components: Vehicles / Vehicle Parts is replacement or purchase of new rail cars, buses, paratransit vehicles and/or service vehicles, rehabilitation of rail cars and buses and replacement parts to maintain the vehicle fleet. Rail System Infrastructure Rehabilitation is multiple systems and equipment within the rail stations and tunnels that enable safe, reliable service. Maintenance Facilities is rehabilitation, maintenance, replacement and/or new bus garages and rail yards to support repairs to vehicle fleet. Systems and Technology is technology systems, software and equipment supporting transit operations and business functions. Track and Structures is steel running rail that guides the train cars, the cross ties and fasteners that hold the rail in place, the ballast bed that supports the cross ties, and the third rail that provides power to the train. Structures include the retaining walls that protect the track bed and underground tunnels, the concrete pads that keep the track bed properly elevated and the bridges that span roads and bodies of water. Passenger Facilities are facilities at the Authority s 86 Metro rail stations, including bus loops, bus stops, parking garages, surface lots, Kiss-and-Ride spaces, access roads, bike racks and bike lockers. 3
8 Maintenance Equipment is equipment to rehabilitate track and maintain the vehicle fleet (rail and bus). Other Facilities are facilities that house administrative offices, training rooms, revenue processing activities, material storage, police work and a print shop. Project Management and Support is a line of credit that provides the Authority with the ability to finance capital projects. The CIP includes funding from two Federal Transit Administration formula grant programs and dedicated federal funds. The dedicated federal funds were approved under the Passenger Rail Investment and Improvement Act (PRIIA) of 2008 (P.L , sometimes known as the "dedicated funding bill"). It authorized $1.5 billion over ten years for the Authority's capital and preventive maintenance projects, to be matched dollar-for-dollar by the Authority Compact jurisdictions. The CIP is a rolling six-year program which was derived from the Authority s 10-year $13.0 billion Capital Needs Inventory which is a prioritized list of the Authority s investment needs for the ten year period from fiscal year 2011 through fiscal year The Authority is advancing the largest capital budget since the construction of the Metrorail system. In fiscal year 2011, $770 million was invested through CIP projects, a significant increase over the previous year. The Authority is planning to invest approximately $5.3 billion through the fiscal year 2013 fiscal year 2018 CIP. Due to the fiscal cliff and the potential for sequestration beginning in January 2013, the Authority faces uncertainty regarding the level of future CIP investments as CIP is heavily dependent on the annual appropriation of Federal formula program funding and PRIIA funding. Awards and Acknowledgements Awards Certificate of Achievement for Excellence in Financial Reporting The Government Finance Officers Association (GFOA) awarded a Certificate of Achievement for Excellence in Financial Reporting (Certificate) to the Authority for its CAFR for the fiscal year ended June 30, The Authority has received this prestigious award for twenty-five consecutive years. In order to be awarded a Certificate the Authority had to publish an easily readable and efficiently organized CAFR. The content of the CAFR had to satisfy both generally accepted accounting principles and applicable legal requirements. A Certificate of Achievement is valid for only one year. We believe that this current CAFR will meet the Certificate of Achievement Program s requirements and we are submitting it to GFOA to determine its eligibility for another certificate. Distinguished Budget Presentation Award The Authority received the GFOA s Distinguished Budget Presentation Award for its fiscal year 2011 budget document. To qualify for the Distinguished Budget Presentation Award, the Authority s budget document had to be judged proficient as a policy document, a financial plan, an operations guide, and a communication device. 4
9
10 As of June 30, 2012 Board of Directors Chairman First Vice-Chairman Second Vice-Chairman Directors Catherine Hudgins Virginia Tom Downs District of Columbia Mortimer L. Downey Federal Government Muriel Bowser District of Columbia Marcel C. Acosta Federal Government Michael Barnes Maryland Alvin J. Nichols Maryland James Dyke Virginia Alternate Directors Terry Bellamy District of Columbia Tom Bulger District of Columbia Anthony R. Giancola Federal Government Artis Hampshire-Cowan Maryland Kathy Porter Maryland William D. Euille Virginia Mary Hynes Virginia 6
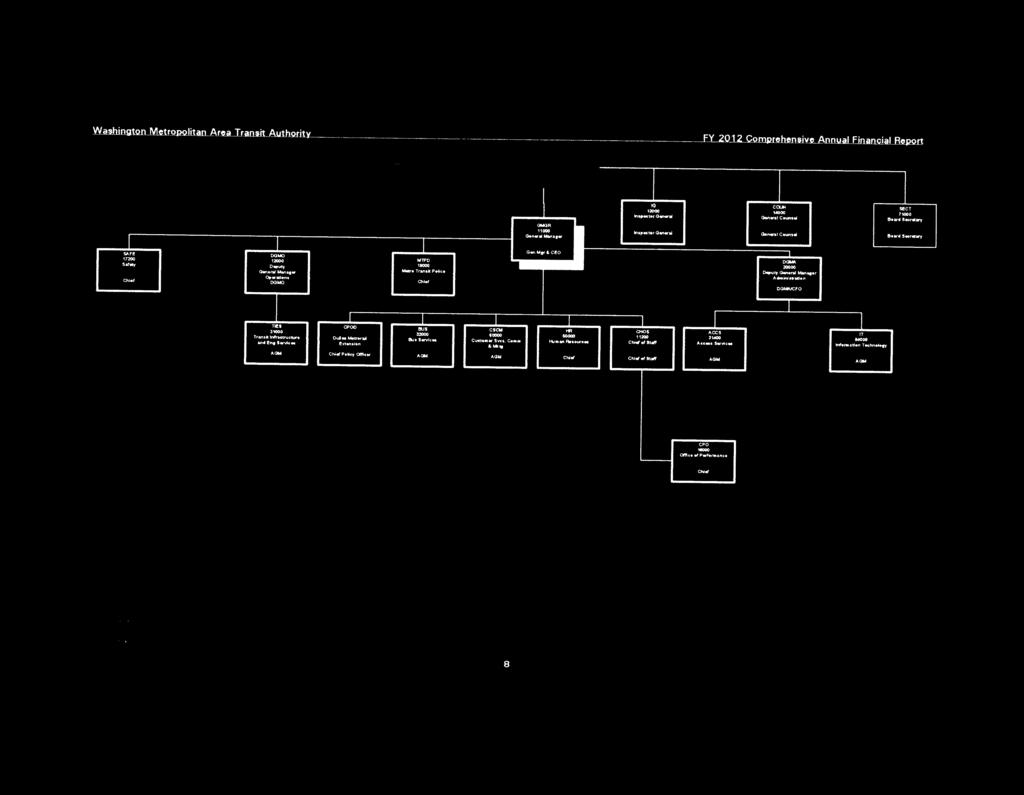
11 As of June 30, 2012 General Manager s Executive Leadership Team General Manager/CEO Chief of Staff Chief Human Resources Officer Assistant General Manager, Information Technology Assistant General Manager, Customer Service, Communications and Marketing Chief Performance Officer Chief Safety Officer Assistant General Manager, Access Services Deputy General Manager, Administration and Chief Financial Officer Deputy General Manager, Operations Inspector General General Counsel Assistant General Manager, Bus Services Chief, Metro Transit Police Dept Assistant General Manager, Infrastructure and Engineering Services Richard R. Sarles Barbara Richardson Gary Baldwin Kevin Borek Lynn Bowersox Andrea Burnside James Dougherty Christian T. Kent Carol D. Kissal Dave Kubicek Helen Lew Carol B. O Keeffe John P. Requa Michael A. Taborn A. Robert Troup 7

12
13
14 This Page Intentionally Left Blank
15 SECTION TWO - FINANCIAL Independent Auditor s Report Management s Discussion and Analysis Financial Statements: Statement of Net Assets Statements of Revenues, Expenses, and Changes in Net Assets Statements of Cash Flows Notes to Basic Financial Statements Required Supplementary Information: Schedules of Funding Progress Pension Plans Schedules of Funding Progress Postemployment Benefits Other than Pensions
16 CliftonLarsonAllen LLP Independent Auditor s Report To the Board of Directors Washington Metropolitan Area Transit Authority We have audited the accompanying statement of net assets, and the related statements of revenues, expenses and changes in net assets of Washington Metropolitan Area Transit Authority (Authority) as of and for the years ended June 30, 2012 and 2011, which collectively comprise the Authority s basic financial statements as listed in the table of contents. These financial statements are the responsibility of the Authority s management. Our responsibility is to express an opinion on these basic financial statements based on our audits. We did not jointly audit the financial statements of the pension plans of the Authority. Those financial statements were audited by other auditors whose reports have been furnished to us, and our opinion, insofar as it related to the amounts included for those pension plans, is based solely on the reports of the other auditors. We conducted our audits in accordance with auditing standards generally accepted in the United States of America and the standards applicable to financial audits contained in Government Auditing Standards, issued by the Comptroller General of the United States. Those standards require that we plan and perform the audit to obtain reasonable assurance about whether the financial statements are free of material misstatement. An audit includes examining, on a test basis, evidence supporting the amounts and disclosures in the financial statements. An audit also includes assessing the accounting principles used and significant estimates made by management, as well as evaluating the overall financial statement presentation. We believe that our audits provide a reasonable basis for our opinion. In our opinion, the financial statements referred to above present fairly, in all material respects, the financial position of the Authority as of June 30, 2012 and 2011, and the changes in its financial position and cash flows for the years then ended in conformity with accounting principles generally accepted in the United States of America. In accordance with Government Auditing Standards, we have also issued our report dated October 19, 2012 on our consideration of the Authority s internal control over financial reporting and on our tests of its compliance with certain provisions of laws, regulations, contracts, and grant agreements and other matters. The purpose of that report is to describe the scope of our testing of internal control over financial reporting and compliance and the results of that testing, and not to provide an opinion on the internal control over financial reporting or on compliance. 10
17 That report is an integral part of an audit performed in accordance with Government Auditing Standards and should be considered in assessing the results of our audit. Accounting principles generally accepted in the United States of America require that the Management s Discussion and Analysis and Required Supplementary Information on pages 12 through 21 and 61 and 62 be presented to supplement the basic financial statements. Such information, although not a part of the basic financial statements, is required by the Governmental Accounting Standards Board, who considers it to be an essential part of financial reporting for placing the basic financial statements in an appropriate operational, economic, or historical context. We have applied certain limited procedures to the required supplementary information in accordance with auditing standards generally accepted in the United States of America, which consisted of inquiries of management about the methods of preparing the information and comparing the information for consistency with management s responses to our inquiries, the basic financial statements, and other knowledge we obtained during our audit of the basic financial statements. However, we did not audit the information and express no opinion on it. The introductory section and statistical tables listed in the table of contents have not been subjected to the auditing procedures applied in the audit of the basic financial statements and, accordingly, we express no opinion on them. a Calverton, Maryland October 19,
18 Management s Discussion and Analysis As management of the Washington Metropolitan Area Transit Authority (Authority), we offer readers of the basic financial statements this overview and analysis of the financial activities of the Authority as of June 30, 2012, 2011 and 2010 and for the years then ended June 30, 2012 and This discussion and analysis is designed to assist the reader in focusing on significant financial issues and activities and to identify any noteworthy changes in financial position. We encourage readers to consider the information presented here in conjunction with the basic financial statements taken as a whole. Fiscal Year 2012 Financial Highlights Net assets decreased by $112.3 million or 1.3 percent due primarily to decreased capital contributions. Capital assets before depreciation and amortization increased by $757.2 million, largely attributable to purchases of hybrid electric bus, power distribution equipment, rail equipment, and service vehicles and station, track and tunnel rehabilitation. Capital contributions were $505.2 million, including funding from the Passenger Rail Investment and Improvement Act. Operating revenues increased by $12.2 million or 1.5 percent, due to increased ridership on rail and bus as well as increases in non-passenger revenue sources. Operating expenses increased by $54.8 million or 2.6 percent, due primarily to an increase in overtime completing system maintenance and repairs and higher material and supplies cost. Overview of the Basic Financial Statements This required annual report consists of three parts: Management s Discussion and Analysis, Basic Financial Statements and Required Supplementary Information. The basic financial statements also include notes that provide in more detail some of the information in the basic financial statements. Basic Financial Statements. The Authority s basic financial statements are prepared in conformity with generally accepted accounting principles in the United States of America (GAAP) as applied to an enterprise using the accrual basis of accounting. Under this basis, revenues are recognized in the period in which they are earned, and expenses are recognized in the period in which they are incurred. The Authority s basic financial statements are the Statements of Net Assets, the Statements of Revenues, Expenses and Changes in Net Assets and the Statements of Cash Flows. The Statements of Net Assets report the Authority s net assets. Net assets, the difference between assets and liabilities, are one way to measure the financial position of the Authority. This is only one measure, however, and the reader should consider other indicators, such as the rate of growth of operating subsidies, passenger fare levels, ridership, general economic conditions in the metropolitan area and the age and condition of capital assets used by the Authority. The Statements of Revenues, Expenses and Changes in Net Assets report all of the revenues earned and expenses incurred during the reporting periods. The Statements of Cash Flows provide information on cash receipts and cash payments during the reporting periods. The basic financial statements can be found on pages of this report. 12
19 Management s Discussion and Analysis Overview of the Basic Financial Statements (Continued) Notes to the Basic Financial Statements. The notes provide additional information that is essential to a full understanding of the data provided in the basic financial statements. The notes to the basic financial statements can be found on pages of this report. Required Supplementary Information. In addition to the basic financial statements and accompanying notes, this report also presents certain required supplementary information concerning the Authority s progress in funding its obligation to provide pension benefits and Post Employment Benefits Other Than Pensions (OPEB) to its employees. Required supplementary information can be found on pages of this report. Financial Analysis Statements of Net Assets As noted earlier, net assets may serve over time as an indicator of the Authority s financial position. This is only one measure; however, the reader should consider other indicators, such as the age and condition of the Authority s three-decade old system, as well as its need for increasing operating subsidies and ridership levels. The following table provides an overview of the Authority s financial position for the years ended June 30, 2012, 2011 and 2010: Table 1 Condensed Statements of Net Assets June 30, 2012, 2011 and 2010 (in thousands) Current Year Current and other assets $ 1,760,286 $ 2,038,898 $ 1,863,345 Capital assets 8,500,548 8,240,116 8,071,783 Total assets 10,260,834 10,279,014 9,935,128 Current liabilities 676, , ,557 Noncurrent liabilities 1,319,011 1,282,767 1,250,618 Total liabilities 1,995,594 1,901,449 1,865,175 Net assets: Investment in capital assets, net of related debt 7,939,835 8,051,479 7,772,110 Restricted Net Pension Trust Assets 136, , ,143 Capital Projects 146, , ,985 Contingency 32,815 5, Smart Card Reserve 8,131 6,165 6,494 Other 2,016 1,812 2,171 Total net assets $ 8,265,240 $ 8,377,565 $ 8,069,953 Net assets decreased by $112.3 million, or 1.3 percent, due primarily to decreased capital contributions. 13
20 Statements of Net Assets (Continued) Current Year (Continued) Management s Discussion and Analysis The largest portion of the Authority s net assets, $7.9 billion or 96.1 percent, reflects its investment in capital assets (e.g., land, buildings, transit facilities and revenue vehicles), less any related debt used to acquire those assets. The Authority uses these capital assets to provide public transportation services for the metropolitan area. Consequently, these assets are not available for future spending. Although the Authority s investment in its capital assets are reported net of related debt, it should be noted that the resources needed to repay this debt must be provided from other sources, since the capital assets themselves cannot be used to liquidate these liabilities. A portion of the Authority s net assets, $325.4 million or 3.9 percent, represents resources that are subject to external restrictions set by the governing jurisdictions. Restricted net assets include net pension assets, advance contributions for future construction, reimbursable projects and other targeted programs. Capital assets before depreciation and amortization increased by $757.2 million, largely attributable to the purchase of new buses, equipment installation and repairs to current bus fleet including cameras, data and network infrastructure enhancements as well as the opening of a new parking facility. Capital contributions were $505.2 million, including funding from the Passenger Rail Investment and Improvement Act. Noncurrent liabilities increased by $36.2 million or 2.8 percent, due mostly to increases in the unfunded OPEB liability and the liability for injury and damage claims, partially offset by a decrease in obligations under lease agreements. Prior Year Net assets increased by $307.6 million, or 3.8 percent, due primarily to increased capital contributions. The largest portion of the Authority s net assets, $8.1 billion or 96.1 percent, reflects its investment in capital assets (e.g., land, buildings, transit facilities and revenue vehicles), less any related debt used to acquire those assets. The Authority uses these capital assets to provide public transportation services for the metropolitan area. Consequently, these assets are not available for future spending. Although the Authority s investment in its capital assets is reported net of related debt, it should be noted that the resources needed to repay this debt must be provided from other sources, since the capital assets themselves cannot be used to liquidate these liabilities. A portion of the Authority s net assets, $326.1 million or 3.9 percent, represents resources that are subject to external restrictions set by the governing jurisdictions. Restricted net assets include net pension assets, advance contributions for future construction, reimbursable projects and other targeted programs. Capital assets before depreciation and amortization increased by $623.2 million, largely attributable to purchase of new hybrid electric bus, power distribution equipment, rail equipment, service vehicles and station, track and tunnel rehabilitation. Capital contributions were $886.6 million, including funding from the Passenger Rail Investment and Improvement Act. Noncurrent liabilities increased by $32.1 million or 2.6 percent, due mostly to the unfunded OPEB liability, partially offset by a decrease in obligations under lease agreements. As of June 30, 2011, nine of the 14
21 Management s Discussion and Analysis Prior Year (Continued) sixteen rail car leasing transactions were terminated reducing both assets and liabilities, but with minimal cost to the Authority, this slightly offsets the increase. Statements of Revenues, Expenses, and Changes in Net Assets The following financial information was derived from the Statements of Revenues, Expenses, and Changes in Net Assets and reflects how the Authority s net assets changed during the fiscal year: Table 2 Statements of Revenues, Expenses, and Changes in Net Assets For the Years Ended June 30, 2012, 2011 and 2010 (in thousands) OPERATING REVENUES Passenger $ 777,528 $ 763,900 $ 660,319 Advertising 18,284 17,518 42,104 Rental 20,604 22,335 24,161 Other ,248 Total operating revenues 816, , ,832 NONOPERATING REVENUES Investment income 1,309 1,377 1,578 Interest income from leasing transactions 34,882 38,452 40,114 Other 18,812 15,135 34,321 Total nonoperating revenues 55,003 54,964 76,013 Total revenues 871, , ,845 OPERATING EXPENSES Labor 647, , ,842 Fringe benefits 495, , ,450 Services 214, , ,713 Materials and supplies 139, , ,817 Utilities 79,413 84,747 94,284 Casualty and liability costs 24,764 19,727 14,015 Leases and rentals 4,000 3,726 3,355 Miscellaneous 2,495 4,463 3,724 Depreciation and amortization 526, , ,745 Total operating expenses 2,134,668 2,079,881 2,004,945 NONOPERATING EXPENSES Interest expense 51,377 56,390 59,694 Total expenses 2,186,045 2,136,271 2,064,639 Loss before capital grants/subsidies (1,314,372) (1,276,803) (1,260,794) Jurisdictional subsidies: Operations 680, , ,545 Interest 16,495 17,938 19,580 Capital contributions 505, , ,227 Change in net assets (112,325) 307, ,558 Net assets, beginning of year 8,377,565 8,069,953 7,948,395 Net assets, ending of year $ 8,265,240 $ 8,377,565 $ 8,069,953 15
22 Management s Discussion and Analysis Statements of Revenues, Expenses, and Changes in Net Assets (Continued) Revenues Current Year Total revenues for fiscal year 2012 totaled $871.7 million. Operating revenues, which include passenger revenue, totaled $816.7 million, an increase of $12.2 million or 1.5 percent as described below. Passenger revenue, a significant portion of the Authority s operating revenues, increased by $13.6 million or 1.8 percent. The passenger revenue increase can be attributed mostly to a system wide fiscal year increase in ridership of 3.0 percent. Passenger trips for the last three years are shown below: Passenger Trips (in thousands) 35,000 30,000 25,000 20,000 15,000 10,000 FY10 FY11 FY12 5,

23 Management s Discussion and Analysis Statements of Revenues, Expenses, and Changes in Net Assets (Continued) Revenues (Continued) Fiscal Year 2012 Revenues Subsidies 32.8% Capital contributions 24.4% Interest income 2.5% Other 0.9% Passenger revenue 37.5% Rental revenue 1.0% Advertising revenue 0.9% Prior Year Total revenues for fiscal year 2011 totaled $859.5 million. Operating revenues, which include passenger revenue, totaled $804.5 million, an increase of $76.7 million or 10.5 percent as described below. Passenger revenue, a significant portion of the Authority s operating revenues, increased by $103.6 million or 15.7 percent. The increase can be attributed to a fare increase implemented on June 27, 2010, for all modes of passenger transportation the Authority provides. 17

24 Management s Discussion and Analysis Statements of Revenues, Expenses, and Changes in Net Assets (Continued) Expenses Current Year Total expenses increased slightly to $2.2 billion in fiscal year 2012 when compared to prior fiscal year Operating expenses increased by $54.8 million or 2.6 percent as compared to fiscal year A review of significant changes is described below. Salaries and benefits overall decreased by $38.4 million or 3.2 percent, influenced by lower than expected pension cost and lower worker s compensation cost that compared favorable to prior years. However, Salaries experienced increases due to overtime related to system enhancements and repairs. Services for the year increased by $19.0 million or 9.7 percent. The rise in service expenses were attributed to decreased utilization of paratransit and delays in initiating service contracts. Materials and supplies increased by $29.6 million or 27.0 percent. Higher material and supplies cost, as well as purchasing non-capitalizable parts contributed to the increase in cost. Utilities decreased by $5.3 million or 6.3 percent, due to decreased electricity rates, and the results of certain favorable power hedging agreements. Depreciation and amortization expenses increased by $46.5 million or 9.7 percent due largely to an additional $756.6 million in depreciable assets placed into service in fiscal year Fiscal Year 2012 Expenses Labor/Fringes, 52.3% Services, 9.9% Materials and Supplies, 6.4% Utilities, 3.6% Casualty and Liability, 1.1% Leases and rentals, 0.2% Miscellaneous, 0.1% Interest Expense, 2.3% Depreciation and Amortization, 24.1% 18
25 Management s Discussion and Analysis Statements of Revenues, Expenses, and Changes in Net Assets (Continued) Expenses (Continued) Prior Year Total expenses remained relatively flat at $2.1 billion in fiscal year 2011 when compared to prior fiscal year Operating expenses increased by $74.9 million or 3.7 percent as compared to fiscal year A review of significant changes is described below. Salaries and benefits increased by $87.6 million or 8.0 percent. Salaries and benefits were influenced by non-cash expenses, including an increase in OPEB. Services for the year increased by $6.6 million or 3.5 percent. The rise in service expenses were attributed to increased usage of paratransit and professional services cost. Materials and supplies decreased by $30.0 million or 21.5 percent. The Authority was able to better manage cost due to significant outlays in fiscal year 2010 to rehabilitate and retrofit buses and rail cars. Utilities decreased by $9.5 million or 10.1 percent, due to decreased electricity rates, and the results of certain favorable power hedging agreements. Depreciation and amortization expenses increased by $13.4 million or 2.9 percent due largely to an additional $240 million in depreciable assets placed into service in fiscal year Capital Assets and Debt Administration The following table shows the capital assets of the Authority: Table 3 Schedules of Capital Assets June 30, 2012, 2011 and 2010 (in thousands) Land $ 456,727 $ 456,727 $ 447,314 Buildings and improvements 715, , ,866 Transit facilities 8,134,324 7,785,921 7,531,417 Revenue vehicles 2,726,122 2,571,021 2,419,188 Other equipment 2,425,296 2,233,467 2,203,974 Construction in progress 351, , ,837 Intangible costs 1,209,357 1,209,357 1,199,067 16,019,050 15,261,870 14,638,663 Less accumulated depreciation and amortization 7,518,502 7,021,754 6,566,880 Net capital assets $ 8,500,548 $ 8,240,116 $ 8,071,783 19
26 Capital Assets and Debt Administration (Continued) Capital Assets Current Year Management s Discussion and Analysis The Authority s net capital asset balance was $8,500.5 million (net of accumulated depreciation and amortization) as of June 30, 2012, an increase of $260.4 million or 3.2 percent. Capital assets before depreciation and amortization increased by $757.2 million as described below. Transit facilities increased by $348.4 million or 4.5 percent as a result of the new Glenmont parking facility, rail station, tunnel and parking rehabilitation activities. Other equipment increased by $191.8 million or 8.6 percent as a result of new station and bus repair equipment, bus cameras, parking lot readers, data, network and communication equipment. Revenue vehicles increased by $155.1 million or 6.0 percent, as a result of placing new buses into service. In addition, costs associated with rail car rehabilitation contributed to the increase. Additional information on the Authority s capital assets can be found in note 5 on pages of this report. Prior Year The Authority s net capital asset balance was $8,240.1 million (net of accumulated depreciation and amortization) as of June 30, 2011, an increase of $168.3 million or 2.1 percent. Capital assets before depreciation and amortization increased by $623.2 million as described below. Buildings and Improvements increased by $23.8 million or 3.6 percent as a result of rehabilitation activities. Transit facilities increased by $254.5 million or 3.4 percent as a result of rail station, tunnel and parking rehabilitation activities. Revenue vehicles increased by $151.8 million or 6.3 percent, as a result of placing new hybrid electric buses into service. In addition, costs associated with rail car rehabilitation contributed to the increase. Construction in Progress increased by $143.9 million or 80.0 percent. This increase can be attributed to the acquisition of power distribution equipment, rail equipment and service vehicles. 20
27 Management s Discussion and Analysis Future Capital Plans On June 24, 2010, the Authority s Board of Directors approved a six-year, $5.0 billion Capital Funding Agreement (CFA) with the Authority s jurisdictional partners. The prior six-year agreement expired on June 30, The new agreement provides the Authority with the resources to, among other things, enter into multi-year agreements to procure new rail cars to replace the oldest cars in the fleet, advance safety initiatives, replace deteriorated or damaged track, repair and upgrade stations and tunnels, replace obsolete communications and train control equipment, perform general building maintenance at many Authority facilities, and procure new buses to replace the oldest vehicles in the fleet. As part of the agreement, the Board of Directors is responsible for approving a new six-year capital plan prior to the start of each fiscal year. On May 24, 2012, the Board approved a new six-year plan, that includes $5.0 billion in capital investments by Authority s jurisdictional partners. Under the terms of the agreement, the Authority is required to update the jurisdictions and the Board of Directors quarterly about the progress of the capital program. Bonds and Other Debt The Authority s total outstanding bond debt as of June 30, 2012 and 2011 was $337.8 million and $370.6 million, respectively. By insuring some of its bonds, the Authority had obtained at the time of issuance, AAA rating from Standard and Poor s for those issuances. The bonds uninsured rating is A from Standard and Poor s and Aa3 by Moody s. Additional information on the Authority s bonds and other debt can be found in note 6 on pages of this report. Lease Obligations Information on these transactions can be found in notes 10 and 11 on pages of this report. Economic Factors Employment in the Washington, D.C. metropolitan area has felt the impact of the economic downturn, however, remains stronger than the national job market. According to the U.S. Department of Labor, Bureau of Labor Statistics, the employed labor force added nearly 65.0 thousand jobs or 2.2 percent pushing the employed workforce for the region over 3.0 million workers as June 30, The regional unemployment rate of 5.7 percent compares favorably with the national unemployment rate of 8.2 percent at June The region is the seat of the federal government, which accounts for more than 30.0 percent of the region s economy, according to George Mason University Center for Regional Analysis. Requests for Information This financial report is designed to provide interested readers with a general overview of the Authority s finances. Questions concerning this report or requests for additional financial information should be directed to the Office of Accounting, Washington Metropolitan Area Transit Authority, 600 Fifth St., NW, Washington, D.C , telephone number (202)
28 Statements of Net Assets June 30, 2012 and 2011 (in thousands) ASSETS Current assets: Cash and deposits (note 3) $ 137,564 $ 461,384 Investments (note 3) 174, ,261 Contributions receivable (note 4) 426, ,860 Accounts receivable and other assets (net of uncollectible accounts of $0.0 million in 2012 and $0.0 million in 2011) 60,556 67,331 Current portion of prefunded lease commitments (notes 10 and 11) 59,036 73,547 Materials and supplies inventory (net of allowance of $4,085 in 2012 and $3,527 in 2011) 112, ,142 Total current assets 971,181 1,206,525 Noncurrent assets: Long-term portion of contributions receivable (note 4) 188, ,418 Net pension asset (note 8) 136, ,858 Prefunded lease commitments, net of current portion (notes 10 and 11) 464, ,097 Capital assets (note 5): Construction in progress 351, ,748 Land 456, ,727 Transit facilities and equipment, net 7,692,532 7,459,641 Total noncurrent assets 9,289,653 9,072,489 Total assets $ 10,260,834 $ 10,279,014 The accompanying notes are an integral part of these basic financial statements. 22
29 Statements of Net Assets (Continued) June 30, 2012 and 2011 (in thousands) LIABILITIES Current liabilities: Accounts payable and accrued expenses $ 248,002 $ 212,884 Accrued salaries and benefits 114, ,489 Accrued interest payable 8,766 9,545 Unearned revenue 181, ,133 Current portion of estimated liability for injury and damage claims (notes 9 and 11) 30,792 54,871 Current portion of retainage on contracts (note 11) 2,253 5,133 Current portion of deferred lease revenue (note 11) 2,445 2,533 Current portion of bonds payable and other debt (notes 6 and 11) 29,150 33,547 Current portion of obligations under lease agreements (notes 10 and 11) 59,036 73,547 Total current liabilities 676, ,682 Noncurrent liabilities: Estimated liability for injury and damage claims (notes 9 and 11) 109,561 97,900 Retainage on contracts (note 11) 21,892 20,334 Unearned lease revenue (note 11) 12,206 14,982 Bonds payable and other debt (notes 6 and 11) 308, ,042 Obligations under lease agreements (notes 10 and 11) 464, ,097 Unfunded OPEB Liability (note 8) 402, ,412 Total noncurrent liabilities 1,319,011 1,282,767 Commitments and contingencies (notes 7, 8, 9 and 10) NET ASSETS Total liabilities 1,995,594 1,901,449 Invested in capital assets, net of related debt 7,939,835 8,051,479 Restricted Net Pension Trust Assets 136, ,858 Capital Projects 146, ,211 Contingency 32,815 5,040 Smart Card Reserve 8,131 6,165 Other 2,016 1,812 Total net assets $ 8,265,240 $ 8,377,565 23
30 Statements of Revenues, Expenses, and Changes in Net Assets For the Years Ended June 30, 2012 and 2011 (in thousands) OPERATING REVENUES Passenger $ 777,528 $ 763,900 Advertising 18,284 17,518 Rental 20,604 22,335 Other Total operating revenues 816, ,504 OPERATING EXPENSES Labor 647, ,132 Fringe benefits 495, ,808 Services 214, ,316 Materials and supplies 139, ,812 Utilities 79,413 84,747 Casualty and liability costs 24,764 19,727 Leases and rentals 4,000 3,726 Miscellaneous 2,495 4,463 Depreciation and amortization 526, ,150 Total operating expenses 2,134,668 2,079,881 Operating loss (1,317,998) (1,275,377) NONOPERATING REVENUES (EXPENSES) Investment income 1,309 1,377 Interest income from leasing transactions 34,882 38,452 Interest expense from leasing transactions (34,882) (38,452) Interest expense (16,495) (17,938) Other 18,812 15,135 Jurisdiction subsidies: Operations 680, ,880 Interest 16,495 17,938 Total nonoperating revenues (expenses), net 700, ,392 Loss before capital contributions (617,492) (578,985) Capital Contributions 505, ,597 Change in net assets (112,325) 307,612 Total net assets, beginning of year 8,377,565 8,069,953 Total net assets, ending of year $ 8,265,240 $ 8,377,565 The accompanying notes are an integral part of these basic financial statements. 24
31 Statements of Cash Flows For the Years Ended June 30, 2012 and 2011 (in thousands) CASH FLOW FROM OPERATING ACTIVITIES Cash received from operations $ 904,103 $ 826,436 Cash paid to suppliers (418,278) (412,601) Cash paid to employees (1,049,532) (1,053,445) Cash (paid) received for operating claims (37,182) 3,094 Net cash used in operating activities (600,889) (636,516) CASH FLOWS FROM NONCAPITAL FINANCING ACTIVITIES Cash received from jurisdictional subsidies 687, ,506 CASH FLOWS FROM CAPITAL AND RELATED FINANCING ACTIVITIES Construction of capital assets (767,700) (645,777) Capital contributions 396, ,668 Interest paid on bonds and other debt (17,275) (18,755) Principal paid on bonds, commercial paper and other debt (31,210) (34,705) Interest subsidy for revenue bonds 16,495 17,938 Net cash provided by (used in) capital and related financing activities (403,197) 208,369 CASH FLOWS FROM INVESTING ACTIVITIES Proceeds from sale and maturities of investments 10,725,441 8,580,351 Purchases of investments (10,750,947) (8,601,296) Interest received from operational investments 18,756 15,377 Net cash used in investing activities (6,750) (5,568) Net change in cash and deposits (323,820) 288,791 Cash and deposits, beginning of year 461, ,593 Cash and deposits, end of year $ 137,564 $ 461,384 The accompanying notes are an integral part of these basic financial statements. 25
32 Statements of Cash Flows (Continued) For the Years Ended June 30, 2012 and 2011 (in thousands) RECONCILIATION OF OPERATING LOSS TO NET CASH USED IN OPERATING ACTIVITIES Operating loss $ (1,317,998) $ (1,275,377) Adjustments to reconcile operating loss to net cash used in Operating activities: Depreciation and amortization expense 526, ,150 Effect of changes in operating assets and liabilities Accounts receivables (net) and other assets 6,775 (6,187) Materials and supplies inventory (12,440) (10,176) Net pension asset 12,488 4,285 Accounts payable and accrued expenses 35,118 (7,547) Accrued salaries and benefits (11,142) 25,374 Deferred revenue 80,659 28,120 Estimated liability for injury and damage claims (12,418) 22,822 Retainage on contracts (1,322) 3,185 OPEB obligation 92,699 98,835 Total adjustments 717, ,861 Net cash used in operating activities $ (600,889) $ (636,516) Noncash operating, investing, capital and financing activities: Increase (decrease) in fair value of investments $ 1,345 $ 1,141 Interest expense from leasing transaction $ (34,882) $ (38,452) Interest income from leasing transaction $ 34,882 $ 38,452 The accompanying notes are an integral part of these basic financial statements. 26
33 (1) Summary of Significant Accounting Policies (a) Organization Notes to Basic Financial Statements June 30, 2012 and 2011 The Washington Metropolitan Area Transit Authority (Authority) was created, effective February 20, 1967, by the Interstate Compact (Compact) by and between Maryland, Virginia and the District of Columbia, pursuant to Public Law , approved November 6, The Authority was created to plan, construct, finance and operate a public transit system serving the Washington Metropolitan Area Transit Zone (Zone). The Zone includes the following participating local jurisdictions: the District of Columbia; the cities of Alexandria, Falls Church, Fairfax, Manassas and Manassas Park; and the counties of Arlington, Fairfax, Loudoun and Prince William in Virginia, and Montgomery, Anne Arundel, Charles and Prince George's in Maryland. The Authority is governed by a Board of eight voting Directors and eight alternate Directors from each signatory to the compact and from the Federal government. The Directors and Alternates for Virginia are appointed by the Northern Virginia Transportation Commission; for the District of Columbia, by the City Council; and, for Maryland, by the Washington Suburban Transit Commission and for the Federal Government, by the Administrator of General Services. The Board of Directors (Board) governs and sets policy for the Authority. Subject to policy direction and delegations from the Board, the General Manager is responsible for all activities of the Authority. The staff carries out these activities through the approved organizational structure of the Authority. Based upon the provisions of GAAP, as applicable to government entities in the United States of America, management of the Authority has determined that it is a joint venture of the participating jurisdictions. (b) Financial Reporting Entity In evaluating the Authority as a reporting entity, management has addressed all potential component units that may fall within the Authority's oversight and control and, as such, be included within the Authority's basic financial statements. As defined by GAAP, established by the Governmental Accounting Standards Board (GASB), a legally separate, tax-exempt organization should be reported as a component unit of a reporting entity if all of the following criteria are met: 1) The economic resources received or held by the separate organization are entirely or almost entirely for the direct benefit of the primary government, its component units, or its constituents. 2) The primary government, or its component units, is entitled to, or has the ability to otherwise access, a majority of the economic resources received or held by the separate organization. 3) The economic resources received or held by an individual organization that the specific primary government, or its component units, is entitled to, or has the ability to otherwise access, are significant to the primary government. 27
34 Notes to Basic Financial Statements June 30, 2012 and 2011 (1) Summary of Significant Accounting Policies (Continued) (b) Financial Reporting Entity (Continued) The relative importance of each criterion must be evaluated in light of specific circumstances. The decision to include or exclude a potential component unit is left to the professional judgment of management. Included within the Authority's financial reporting entity are the planning, development and operation of the transit facilities serving the Washington, D.C. metropolitan area which are funded from the combined resources of the U.S. Government, the State of Maryland, the Commonwealth of Virginia, the District of Columbia, the participating local jurisdictions, and the Authority's operations. The Authority does not report any component units within its financial reporting entity. (c) Basis of Accounting The Authority prepares its basic financial statements using the accrual basis of accounting. The activities of the Authority are similar to those of proprietary funds of local jurisdictions, and, are therefore, reported in conformity with governmental accounting and financial reporting principles issued by GASB. The Authority records revenues when earned and reasonably measurable and records expenses when a liability is incurred, regardless of the timing of the cash flows. Revenues collected in advance are deferred until the period in which it is earned. The Authority applies all applicable Financial Accounting Standards Board Statements and Interpretations, Accounting Principles Board Opinions and Accounting Research Bulletins, issued on or before November 30, 1989 that do not conflict with or contradict GASB pronouncements. The Authority has elected not to follow subsequent private sector guidance. (d) Receivables and Payables The major components of the accounts receivable balance are payments due from governmental agencies (86.3 percent), companies (13.6 percent) and other receivables (0.1 percent). The major components of the accounts payable balance are payments due to vendors and contractors (87.7 percent), governmental agencies (12.2 percent) and other payables (0.1 percent). (e) Revenues and Expenses The Authority distinguishes operating revenues and expenses from nonoperating items. Operating revenues and expenses are those that result from providing services in connection with the Authority s principal ongoing operation. The principal operating revenues of the Authority are charges to customers for transportation that result in passenger revenues. Passenger revenues are recorded as revenue at the time services are performed. Cash received for services that have not been performed are recorded as deferred revenue. Operating revenues and expenses also include all revenues and expenses not associated with capital and related financing, noncapital financing, or investing activities, and expenses contributed to pension plans administered by the Authority. Nonoperating revenues include jurisdictional subsidies, investment income and interest income from leasing transactions and nonoperating expenses include interest expenses. 28
35 Notes to Basic Financial Statements June 30, 2012 and 2011 (1) Summary of Significant Accounting Policies (Continued) (f) Investments Investments are stated at fair value, which is based on quoted market prices. Investments consist primarily of advanced contributions and interest earned on such contributions. These advanced contributions are restricted for specific future capital projects. (g) Materials and Supplies Inventory Materials and supplies inventory is stated at the lower of cost or market, using the average cost methodology, net of an allowance for obsolete inventory. (h) Transit Facilities and Equipment Transit facilities and equipment are stated at cost, less accumulated depreciation and amortization. Determinations of the cost of rapid rail assets placed in service are made with the assistance of the Authority's consulting engineers. Such cost determinations are based upon the historical costs of the project provided by the Modular Input Output System (MIOS) reports. Interest expense related to construction and amounts expended in operating and testing each phase of the rail system prior to commencement of revenue-producing operations are capitalized as intangible costs. Transit facilities and equipment in service are depreciated or amortized using the straight-line method over the estimated useful lives of the assets. The useful lives employed in computing depreciation and amortization on principal classes of transit facilities and equipment are as follow: Buildings and improvements Rail transit facilities Revenue vehicles Other equipment Intangible costs years years years 2-20 years 3-40 years Capital assets include repairable assets, which are replacement parts with a unit cost of $500 or more and an estimated useful life in excess of one year. Other capital assets are defined as assets with an initial, individual cost of more than $5,000 and an estimated useful life in excess of one year. Any donated capital assets are recognized at their fair value on the date of donation. The Authority's policy is to expense maintenance and repair costs as incurred. (i) Grants Capital grants and operating grants, such as jurisdictional, operating and interest subsidies, are recognized as revenue when all applicable eligibility requirements have been met. The determination of the Authority s jurisdictional subsidies is based on its operating loss and nonoperating revenues, and does not include depreciation expense or the non-cash amount of OPEB. As a result, the Authority s change in net assets represents revenues from capital grants and subsidies, 29
Washington Metropolitan Area Transit Authority
 Washington Metropolitan Area Transit Authority Financial Report issued in Accordance with Government Auditing Standards For the Years Ended June 30, 2016 and 2015 Single Audit Reports issued in Accordance
Vision The Best Ride in the Nation
 Washington Metropolitan Area Transit Authority FY 2008 Comprehensive Annual Financial Report Vision The Best Ride in the Nation Mission Provide the nation s best transit service to our customers and improve
WASHINGTON METROPOLITAN AREA TRANSIT AUTHORITY WASHINGTON, DC. FINANCIAL STATEMENTS June 30, 2013
 WASHINGTON METROPOLITAN AREA TRANSIT AUTHORITY WASHINGTON, DC FINANCIAL STATEMENTS TABLE OF CONTENTS PAGE INDEPENDENT AUDITORS REPORT... 1 FINANCIAL STATEMENTS Statement of Net Position... 3 Statement
Washington Metropolitan Area Transit Authority
 Washington Metropolitan Area Transit Authority Financial Report For the Fiscal Years Ended June 30, 2017 and 2016 Table of Contents Washington Metropolitan Area Transit Authority Financial Report For the
POTOMAC AND RAPPAHANNOCK TRANSPORTATION COMMISSION
 POTOMAC AND RAPPAHANNOCK TRANSPORTATION COMMISSION FINANCIAL AND COMPLIANCE REPORTS YEAR ENDED JUNE 30, 2017 ASSURANCE, TAX & ADVISORY SERVICES TABLE OF CONTENTS FINANCIAL SECTION INDEPENDENT AUDITOR S
Washington Metropolitan Area Transit Authority Metro Budget Overview
 Washington Metropolitan Area Transit Authority Metro Budget Overview February 2011 Metro 10,877 Employees (10,974 budgeted) 1,491 Buses 588 Escalators and 237 Elevators 106 Miles of Track 92 Traction Power
CHICAGO TRANSIT AUTHORITY. FINANCIAL STATEMENTS AND SUPPLEMENTARY INFORMATION December 31, 2010 and 2009 (With Independent Auditors Report Thereon)
") FINANCIAL STATEMENTS AND SUPPLEMENTARY INFORMATION (With Independent Auditors Report Thereon) Chicago, Illinois FINANCIAL STATEMENTS CONTENTS Independent Auditors Report... 1 Management s Discussion and
FINANCIAL STATEMENTS AND SUPPLEMENTARY INFORMATION (With Independent Auditors Report Thereon) Chicago, Illinois FINANCIAL STATEMENTS CONTENTS Independent Auditors Report... 1 Management s Discussion and
Getting Metro Back on Track
 NVTC Presents: Getting Metro Back on Track A discussion with Virginia members of the WMATA Board @NovaTransit This forum is sponsored by the Northern Virginia Transportation Commission. Learn more about
CHICAGO TRANSIT AUTHORITY. FINANCIAL STATEMENTS AND SUPPLEMENTARY INFORMATION December 31, 2011 and 2010 (With Independent Auditors Report Thereon)
") FINANCIAL STATEMENTS AND SUPPLEMENTARY INFORMATION (With Independent Auditors Report Thereon) Chicago, Illinois FINANCIAL STATEMENTS CONTENTS Independent Auditors Report... 1 Management s Discussion and
FINANCIAL STATEMENTS AND SUPPLEMENTARY INFORMATION (With Independent Auditors Report Thereon) Chicago, Illinois FINANCIAL STATEMENTS CONTENTS Independent Auditors Report... 1 Management s Discussion and
Berks Area Regional Transportation Authority. Financial Statements and Supplementary Information. June 30, 2014 and 2013
 Financial Statements and Supplementary Information Table of Contents Page INDEPENDENT AUDITOR'S REPORT 1 to 3 MANAGEMENT'S DISCUSSION AND ANALYSIS 4 to 14 FINANCIAL STATEMENTS Statement of Net Position
SOUTHEASTERN PENNSYLVANIA TRANSPORTATION AUTHORITY. Financial Statements June 30, 2018 and (With Independent Auditors Report Thereon)
") SOUTHEASTERN PENNSYLVANIA TRANSPORTATION AUTHORITY Financial Statements June 30, 2018 and 2017 (With Independent Auditors Report Thereon) SOUTHEASTERN PENNSYLVANIA TRANSPORTATION AUTHORITY YEARS ENDED
SOUTHEASTERN PENNSYLVANIA TRANSPORTATION AUTHORITY Financial Statements June 30, 2018 and 2017 (With Independent Auditors Report Thereon) SOUTHEASTERN PENNSYLVANIA TRANSPORTATION AUTHORITY YEARS ENDED
CHATHAM AREA TRANSIT CHATHAM AREA TRANSIT AUTHORITY FINANCIAL REPORT
 CHATHAM AREA TRANSIT CHATHAM AREA TRANSIT AUTHORITY FINANCIAL REPORT Years Ended June 30, 2017 and 2016 CHATHAM AREA TRANSIT AUTHORITY TABLE OF CONTENTS Pages FINANCIAL SECTION: Independent Auditor s Report
Consent Item (A) Washington Metropolitan Area Transit Authority Board Action/Information Summary
 Washington Metropolitan Area Transit Authority Board Action/Information Summary") Consent Item (A) 07-28-2016 Washington Metropolitan Area Transit Authority Board Action/Information Summary Action Information MEAD Number: 201766 Resolution: Yes No TITLE: Renewal of Virginia PRIIA Funding
Consent Item (A) 07-28-2016 Washington Metropolitan Area Transit Authority Board Action/Information Summary Action Information MEAD Number: 201766 Resolution: Yes No TITLE: Renewal of Virginia PRIIA Funding
Report of Independent Auditors and Financial Statements with Supplementary Information June 30, 2017 and 2016
 Report of Independent Auditors and Financial Statements with Supplementary Information June 30, 2017 and 2016 (including Audit Comments and Disclosures Required by State Regulations) Board of Directors
City of Chicago Department of Water Management Water Fund Comprehensive Annual Financial Report For the Years Ended December 31, 2016 and 2015
 City of Chicago Department of Water Management Water Fund Comprehensive Annual Financial Report For the Years Ended December 31, 2016 and 2015 Rahm Emanuel, Mayor Carole L. Brown, Chief Financial Officer
Tri-County Metropolitan Transportation District of Oregon 2014 Annual Report
 Report of Independent Auditors and Financial Statements with Supplementary Information June 30, 2014 and 2013 Board of Directors Name District Bruce Warner, President #1 Joe Esmonde #2 Vacant #3 Consuelo
SOUTHEASTERN PENNSYLVANIA TRANSPORTATION AUTHORITY. Financial Statements June 30, 2017 and (With Independent Auditors Report Thereon)
") SOUTHEASTERN PENNSYLVANIA TRANSPORTATION AUTHORITY Financial Statements June 30, 2017 and 2016 (With Independent Auditors Report Thereon) SOUTHEASTERN PENNSYLVANIA TRANSPORTATION AUTHORITY YEARS ENDED
SOUTHEASTERN PENNSYLVANIA TRANSPORTATION AUTHORITY Financial Statements June 30, 2017 and 2016 (With Independent Auditors Report Thereon) SOUTHEASTERN PENNSYLVANIA TRANSPORTATION AUTHORITY YEARS ENDED
METROPOLITAN ATLANTA RAPID TRANSIT AUTHORITY FINANCIAL STATEMENTS AND SUPPLEMENTAL SCHEDULE. And. Independent Auditors Report
 FINANCIAL STATEMENTS AND SUPPLEMENTAL SCHEDULE And Independent Auditors Report TABLE OF CONTENTS INDEPENDENT AUDITORS REPORT... 1-2 MANAGEMENT S DISCUSSION AND ANALYSIS... 3-9 FINANCIAL STATEMENTS Statements
South Central Transit Authority. Financial Statements June 30, 2015
 Financial Statements Table of Contents Page INDEPENDENT AUDITOR'S REPORT 1 and 2 MANAGEMENT'S DISCUSSION AND ANALYSIS 3 to 6 FINANCIAL STATEMENTS Statement of Net Position 7 Statement of Revenues, Expenses,
CHICAGO TRANSIT AUTHORITY CHICAGO, ILLINOIS
 CHICAGO, ILLINOIS FINANCIAL STATEMENTS AND SUPPLEMENTARY INFORMATION Years Ended (With Independent Auditor s Report Thereon) Chicago, Illinois FINANCIAL STATEMENTS Years Ended TABLE OF CONTENTS Independent
NORTHERN VIRGINIA TRANSPORTATION COMMISSION
 NORTHERN VIRGINIA TRANSPORTATION COMMISSION Financial and Compliance Reports Year Ended June 30, 2018 ASSURANCE, TAX & ADVISORY SERVICES Table of Contents Page Independent Auditor s Report 1-3 Required
GM/CEO s Proposed FY2020 Budget
 Finance and Capital Committee Information Item IV-A November 1, 2018 GM/CEO s Proposed FY2020 Budget Washington Metropolitan Area Transit Authority Board Action/Information Summary Action Information MEAD
RAC Capital Presentatition May 5, 2010
 RAC Capital Presentation ti May 5, 2010 Flexible Six-Year Agreement Flexible Six-Year Agreement minimum funding commitment to match Federal funds, and to annually assess availability of additional funds
FORT WORTH TRANSPORTATION AUTHORITY
 FINANCIAL REPORT SEPTEMBER 30, 2010 C O N T E N T S INDEPENDENT AUDITOR'S REPORT... 1 MANAGEMENT'S DISCUSSION AND ANALYSIS... 3 Page BASIC FINANCIAL STATEMENTS Statements of Net Assets... 8 Statements
Operating Budget Report
 Operating Report Operating ($ in Millions) Operating Expenditures ($ in Millions) Jun-11 Jun-12 $ Percent Revenue $ 212,640 $ 217,643 $ 214,671 $ 2,973 1% Expense $ 359,102 $ 361,882 $ 366,332 $ 4,450
Northern Virginia Transportation Commission: 2018 Legislative and Policy Agenda
 Northern Virginia Transportation Commission: 2018 Legislative and Policy Agenda Northern Virginia s economic growth and global competitiveness are directly tied to the region s transit network. Transit
Getting Metro Back on Track
 NVTC Presents: Getting Metro Back on Track A discussion with Virginia members of the WMATA Board This forum is sponsored by the Northern Virginia Transportation Commission. It is separate and distinct
New Hanover County Airport Authority A Component Unit of New Hanover County. Financial Statements and Compliance Year Ended June 30, 2018
 New Hanover County Airport Authority A Component Unit of New Hanover County Financial Statements and Compliance Year Ended June 30, 2018 Contents Financial section Independent auditors report 1-3 Management
FINANCIAL STATEMENTS OF THE CITY OF VIRGINIA BEACH DEVELOPMENT AUTHORITY A COMPONENT UNIT OF THE CITY OF VIRGINIA BEACH, VIRGINIA
 FINANCIAL STATEMENTS OF THE CITY OF VIRGINIA BEACH DEVELOPMENT AUTHORITY A COMPONENT UNIT OF THE CITY OF VIRGINIA BEACH, VIRGINIA FOR FISCAL YEARS ENDED JUNE 30, 2018 AND JUNE 30, 2017 PREPARED BY DEPARTMENT
Whatcom Transportation Authority
 Financial Statements Audit Report Whatcom Transportation Authority Whatcom County For the period January 1, 2016 through December 31, 2017 Published April 30, 2018 Report No. 1021200 April 30, 2018 Office
HARBOR TRANSIT MULTI-MODAL TRANSPORTATION SYSTEM
 HARBOR TRANSIT MULTI-MODAL TRANSPORTATION SYSTEM FINANCIAL STATEMENTS FOR THE YEAR ENDED JUNE 30, 2017 Vredeveld Haefner LLC CPAs and Consultants TABLE OF CONTENTS FINANCIAL SECTION PAGE Independent Auditors
Report by Finance and Administration Committee (B) Washington Metropolitan Area Transit Authority Board Action/Information Summary
 Washington Metropolitan Area Transit Authority Board Action/Information Summary") Report by Finance and Administration Committee (B) 01-28-2016 Washington Metropolitan Area Transit Authority Board Action/Information Summary Action Information MEAD Number: 201701 Resolution: Yes No TITLE:
Report by Finance and Administration Committee (B) 01-28-2016 Washington Metropolitan Area Transit Authority Board Action/Information Summary Action Information MEAD Number: 201701 Resolution: Yes No TITLE:
Independent Auditor s Report
 Independent Auditor s Report To the City Council City of Hyattsville, Maryland We have audited the accompanying financial statements of the governmental activities, each major fund, and the aggregate remaining
NANTUCKET REGIONAL TRANSIT AUTHORITY (a component Unit of the Massachusetts Department of Transportation)
") (a component Unit of the Massachusetts Department of Transportation) Basic Financial Statements, Supplementary Data For the Year Ended June 30, 2015 Table of Contents Management s Discussion and Analysis
(a component Unit of the Massachusetts Department of Transportation) Basic Financial Statements, Supplementary Data For the Year Ended June 30, 2015 Table of Contents Management s Discussion and Analysis
WASHINGTON CONVENTION CENTER AUTHORITY. Basic Financial Statements, Supplementary Schedules, and Management s Discussion and Analysis
 Basic Financial Statements, Supplementary Schedules, and Management s Discussion and Analysis September 30, 2003 and 2002 (With Independent Auditors Reports Thereon) September 30, 2003 and 2002 Table of
Annual Financial Report
 TEXAS DEPARTMENT OF TRANSPORTATION Annual Financial Report (With Independent Auditors Report) For the Fiscal Year Ended August 31, 2012 Texas Department of Transportation Annual Financial Report (With
THE PHILADELPHIA PARKING AUTHORITY (A COMPONENT UNIT OF THE CITY OF PHILADELPHIA, PENNSYLVANIA)
") (A COMPONENT UNIT OF THE CITY OF PHILADELPHIA, PENNSYLVANIA) Financial Statements, Required Supplementary Information And Other Financial Information For the Years Ended March 31, 2017 and 2016 & Independent
(A COMPONENT UNIT OF THE CITY OF PHILADELPHIA, PENNSYLVANIA) Financial Statements, Required Supplementary Information And Other Financial Information For the Years Ended March 31, 2017 and 2016 & Independent
ROBINSON, FARMER, COX ASSOCIATES
 ROBINSON, FARMER, COX ASSOCIATES A PROFESSIONAL LIMITED LIABILITY COMPANY CERTIFIED PUBLIC ACCOUNTANTS Independent Auditors Report To the Honorable Members of the City Council City of Manassas, Virginia
Where Water Matters. Annual Financial Report
 Where Water Matters Annual Financial Report Year Ended June 30, 2016 2200 Pennsylvania Ave., NW 4th Floor East Washington, DC 20037 www.bcawatsonrice.com Telephone (202) 416-1749 Facsimile: (202) 737-2684
Tri-County Metropolitan Transportation District of Oregon 2013 Annual Report
 Report of Independent Auditors and Financial Statements with Supplementary Information June 30, 2013 and 2012 Board of Directors Name District Bruce Warner, President #1 Tiffany Sweitzer, Vice President
SUBURBAN MOBILITY AUTHORITY FOR REGIONAL TRANSPORTATION
 FINANCIAL STATEMENTS For the Years Ended June 30, 2008 and 2007 FINANCIAL STATEMENTS For the Years Ended June 30, 2008 and 2007 BASIC FINANCIAL STATEMENTS AND SUPPLEMENTARY INFORMATION For the Years Ended
HARBOR TRANSIT MULTI-MODAL TRANSPORTATION SYSTEM
 HARBOR TRANSIT MULTI-MODAL TRANSPORTATION SYSTEM FINANCIAL STATEMENTS FOR THE YEAR ENDED JUNE 30, 2018 Vredeveld Haefner LLC CPAs and Consultants TABLE OF CONTENTS FINANCIAL SECTION PAGE Independent Auditors
City of Chicago Department of Water Management Sewer Fund Comprehensive Annual Financial Report For the Year Ended December 31, 2012
 City of Chicago Department of Water Management Sewer Fund Comprehensive Annual Financial Report For the Year Ended December 31, 2012 Rahm Emanuel, Mayor Lois Scott, Chief Financial Officer Amer Ahmad,
HOUSING AND DINING SYSTEM
 Table of Contents Management s Discussion and Analysis... 3 Independent Auditor s Report... 11 Financial Statements Statements of Net Position... 14 Statements of Revenues, Expenses and Changes in Net
City of Chicago, Illinois Chicago O Hare International Airport
 City of Chicago, Illinois Chicago O Hare International Airport Basic Financial Statements for the Years Ended December 31, 2007 and 2006, Required Supplementary Information, Additional Information, Statistical
KNOX-CHAPMAN UTILITY DISTRICT OF KNOX COUNTY. Knoxville, Tennessee COMPREHENSIVE ANNUAL FINANCIAL REPORT
 KNOX-CHAPMAN UTILITY DISTRICT OF KNOX COUNTY Knoxville, Tennessee COMPREHENSIVE ANNUAL FINANCIAL REPORT For the Years Ended February 28, 2014 and 2013 PREPARED BY: Carol Taylor, Finance Director KNOX-CHAPMAN
Basic Financial Statements and Report of Independent Certified Public Accountants City of Dallas, Texas Dallas Water Utilities (An Enterprise Fund of
 Basic Financial Statements and Report of Independent Certified Public Accountants City of Dallas, Texas September 30, 2016 FINANCIAL STATEMENTS For Fiscal Year Ended September 30, 2016 TABLE OF CONTENTS
PULASKI COUNTY PUBLIC SERVICE AUTHORITY (A COMPONENT UNIT OF PULASKI COUNTY, VIRGINIA)
") PULASKI COUNTY PUBLIC SERVICE AUTHORITY (A COMPONENT UNIT OF PULASKI COUNTY, VIRGINIA) FINANCIAL REPORT YEAR ENDED JUNE 30, 2017 Pulaski County Public Service Authority (A Component Unit of Pulaski County,
PULASKI COUNTY PUBLIC SERVICE AUTHORITY (A COMPONENT UNIT OF PULASKI COUNTY, VIRGINIA) FINANCIAL REPORT YEAR ENDED JUNE 30, 2017 Pulaski County Public Service Authority (A Component Unit of Pulaski County,
PULASKI COUNTY PUBLIC SERVICE AUTHORITY (A COMPONENT UNIT OF PULASKI COUNTY, VIRGINIA)
") PULASKI COUNTY PUBLIC SERVICE AUTHORITY (A COMPONENT UNIT OF PULASKI COUNTY, VIRGINIA) FINANCIAL REPORT YEAR ENDED JUNE 30, 2016 Pulaski County Public Service Authority (A Component Unit of Pulaski County,
PULASKI COUNTY PUBLIC SERVICE AUTHORITY (A COMPONENT UNIT OF PULASKI COUNTY, VIRGINIA) FINANCIAL REPORT YEAR ENDED JUNE 30, 2016 Pulaski County Public Service Authority (A Component Unit of Pulaski County,
PROPOSED FISCAL YEAR 2011 BUDGET. Testimony of. Richard Sarles, General Manager. Washington Metropolitan Area Transit Authority.
 PROPOSED FISCAL YEAR 2011 BUDGET Testimony of Richard Sarles, General Manager Washington Metropolitan Area Transit Authority Before the Council of the District of Columbia Committee on Public Works and
City of Chicago Chicago Midway International Airport An Enterprise Fund of the City of Chicago
 City of Chicago Chicago Midway International Airport An Enterprise Fund of the City of Chicago Comprehensive Annual Financial Report For the Years Ended December 31, 2017 and 2016 Rahm Emanuel, Mayor Carole
Report of Independent Auditors and Financial Statements with Supplementary Information June 30, 2016 and 2015
 Report of Independent Auditors and Financial Statements with Supplementary Information and 2015 Board of Directors Name District Bruce Warner, President #1 Joe Esmonde #2 Vacant #3 Lori Irish Bauman #4
ARTESIA SPECIAL HOSPITAL DISTRICT EDDY COUNTY, NEW MEXICO FINANCIAL STATEMENTS
 ARTESIA SPECIAL HOSPITAL DISTRICT EDDY COUNTY, NEW MEXICO FINANCIAL STATEMENTS AS OF JUNE 30, 2010 AND 2009 (This page intentionally left blank) 2 INTRODUCTORY SECTION 3 (This page intentionally left blank)
Interurban Transit Partnership
 Single Audit Report Years Ended September 30, 2016 and 2015 The report accompanying these financial statements was issued by BDO USA, LLP, a Delaware limited liability partnership and the U.S. member of
BLUEFIELD STATE COLLEGE FINANCIAL STATEMENTS YEARS ENDED JUNE 30, 2018 AND 2017
 FINANCIAL STATEMENTS YEARS ENDED JUNE 30, 2018 AND 2017 TABLE OF CONTENTS YEARS ENDED JUNE 30, 2018 INDEPENDENT AUDITORS REPORT 1 MANAGEMENT S DISCUSSION AND ANALYSIS (RSI) (UNAUDITED) 3 FINANCIAL STATEMENTS
CITY OF GLENCOE, MINNESOTA FINANCIAL STATEMENTS AND SUPPLEMENTARY INFORMATION YEAR ENDED DECEMBER 31, 2014
 FINANCIAL STATEMENTS AND SUPPLEMENTARY INFORMATION YEAR ENDED DECEMBER 31, 2014 TABLE OF CONTENTS DECEMBER 31, 2014 INTRODUCTORY SECTION1 CITY OFFICIALS 1 FINANCIAL SECTION2 INDEPENDENT AUDITORS REPORT
WATER DIVISION OF THE CITY OF ST. LOUIS, MISSOURI (An Enterprise Fund of the City of St. Louis, Missouri)
") Basic Financial Statements and Other Information (With Independent Auditors Report Thereon) Table of Contents Page Independent Auditors Report 1 Management s Discussion and Analysis Unaudited 3 Basic Financial
Basic Financial Statements and Other Information (With Independent Auditors Report Thereon) Table of Contents Page Independent Auditors Report 1 Management s Discussion and Analysis Unaudited 3 Basic Financial
COMPREHENSIVE ANNUAL FINANCIAL REPORT
 School Board Members Barbara Horn, Chair Julius Melendez, Vice Chair Jay Wheeler Cindy Hartig Tom Long COMPREHENSIVE ANNUAL FINANCIAL REPORT For the Fiscal Year Ended June 30, 2012 THE SCHOOL DISTRICT
WORCESTER REGIONAL TRANSIT AUTHORITY (A Component Unit of the Massachusetts Department of Transportation) Financial Statements And Supplementary
 Financial Statements And Supplementary") Financial Statements And Supplementary Information For The Year Ended June 30, 2018 And Independent Auditors Report Financial Statements and Supplementary Information For The Year Ended June 30, 2018 And
Financial Statements And Supplementary Information For The Year Ended June 30, 2018 And Independent Auditors Report Financial Statements and Supplementary Information For The Year Ended June 30, 2018 And
MARTHA S VINEYARD REGIONAL TRANSIT AUTHORITY (a component Unit of the Massachusetts Department of Transportation)
") (a component Unit of the Massachusetts Department of Transportation) Basic Financial Statements, Supplementary Data For the Year Ended Table of Contents Management s Discussion and Analysis i vii Independent
(a component Unit of the Massachusetts Department of Transportation) Basic Financial Statements, Supplementary Data For the Year Ended Table of Contents Management s Discussion and Analysis i vii Independent
FY2018 Third Quarter Financial Update
 Finance and Committee Information Item IV-A May 10, 2018 Third Quarter Financial Update Page 30 of 53 Washington Metropolitan Area Transit Authority Board Action/Information Summary Action Information
DETROIT TRANSPORTATION CORPORATION
 FINANCIAL REPORT JUNE 30, 2017 Contents Page No. Independent Auditor s Report... 1 Management Discussion & Analysis... 3 Basic Financial Statements: Statement of Net Position... 9 Statement of Revenues,
Year Ended December 31, Comprehensive Annual Financial Report. (A Component Unit of the County of Kent, Michigan)
") Year Ended December 31, 2017 Comprehensive Annual Financial Report (A Component Unit of the County of Kent, Michigan) Year Ended December 31, 2017 Comprehensive Annual Financial Report (A Component Unit
Year Ended December 31, 2017 Comprehensive Annual Financial Report (A Component Unit of the County of Kent, Michigan) Year Ended December 31, 2017 Comprehensive Annual Financial Report (A Component Unit
WISCONSIN INDIANHEAD TECHNICAL COLLEGE
 WISCONSIN INDIANHEAD TECHNICAL COLLEGE Annual Audited Financial Statements for fiscal year ending, June 30, 2017 Wisconsin Indianhead Technical College District Shell Lake, WI Financial Statements With
CITY OF ANAHEIM WATER UTILITY FUND. Financial Statements. June 30, 2016 and (With Independent Auditors Report Thereon)
") Financial Statements (With Independent Auditors Report Thereon) Table of Contents Page Independent Auditors Report 1 Management s Discussion and Analysis (Unaudited) 3 Financial Statements: Statement of
Financial Statements (With Independent Auditors Report Thereon) Table of Contents Page Independent Auditors Report 1 Management s Discussion and Analysis (Unaudited) 3 Financial Statements: Statement of
DETROIT TRANSPORTATION CORPORATION
 FINANCIAL REPORT JUNE 30, 2015 Contents Page No. Independent Auditor s Report... 1 Management Discussion & Analysis... 3 Basic Financial Statements: Statement of Net Position... 8 Statement of Revenues,
CITY OF SANTA MONICA, CALIFORNIA
 Financial Statements and Required and Other Supplementary Information (with Independent Auditor s Reports Thereon) Table of Contents Independent Auditor s Report... 1 Management s Discussion and Analysis
Livingston County, Michigan. Financial Report with Supplemental Information December 31, 2017
 Financial Report with Supplemental Information December 31, 2017 Contents Independent Auditor's Report 1-2 Management's Discussion and Analysis 3-9 Basic Financial Statements Government-wide Financial
CITY OF FRIENDSWOOD, TEXAS
 COMPREHENSIVE ANNUAL FINANCIAL REPORT YEAR ENDED SEPTEMBER 30, 2011 Officials Issuing Report: Roger C. Roecker City Manager Cindy S. Edge Director of Administrative Services COMPREHENSIVE ANNUAL FINANCIAL
COMPREHENSIVE ANNUAL FINANCIAL REPORT. The York County School Division Component Unit of the County of York, Virginia
 COMPREHENSIVE ANNUAL FINANCIAL REPORT The York County School Division Component Unit of the County of York, Virginia For the Fiscal Year Ended June 30, 2010 Prepared by the Department of Finance Dennis
FINANCIAL REPORT METROPOLITAN WASHINGTON AIRPORTS AUTHORITY
 FINANCIAL REPORT METROPOLITAN WASHINGTON AIRPORTS AUTHORITY REPORT OF INDEPENDENT ACCOUNTANTS To the Board of Directors of the Metropolitan Washington Airports Authority In our opinion, the accompanying
PENNRIDGE SCHOOL DISTRICT
 ANNUAL FINANCIAL REPORT Year Ended June 30, 2011 INTRODUCTORY SECTION TABLE OF CONTENTS Page No. INTRODUCTORY SECTION Table of Contents... 1 FINANCIAL SECTION Independent Auditors' Report... 3 Management's
Operating Budget Report
 Operating Budget Report Operating Budget ($ in Millions) Operating Expenditures ($ in Millions) MTD May-FY2011 May - FY2012 Variance FY12 Actual Actual Budget $ Percent $140M Revenue $ 68,140 $ 70,480
CITY OF MINNETRISTA, MINNESOTA COMPREHENSIVE ANNUAL FINANCIAL REPORT YEAR ENDED DECEMBER 31, 2013
 , MINNESOTA COMPREHENSIVE ANNUAL FINANCIAL REPORT YEAR ENDED DECEMBER 31, 2013 PREPARED BY THE FINANCE DEPARTMENT OF THE CITY OF MINNETRISTA, MINNESOTA BRIAN GRIMM DIRECTOR OF FINANCE TABLE OF CONTENTS
FY2017 Budget Discussion
 Finance & Administration Committee Information Item IV-B November 5, 2015 FY2017 Budget Discussion Page 70 of 116 Washington Metropolitan Area Transit Authority Board Action/Information Summary Action
CARROLL COMMUNITY COLLEGE FINANCIAL STATEMENTS YEARS ENDED JUNE 30, 2017 AND 2016
 FINANCIAL STATEMENTS YEARS ENDED TABLE OF CONTENTS YEARS ENDED INDEPENDENT AUDITORS REPORT 1 MANAGEMENT S DISCUSSION AND ANALYSIS 3 FINANCIAL STATEMENTS STATEMENTS OF NET POSITION (DEFICIT) 13 STATEMENTS
CITY OF CENTERVILLE, GEORGIA ANNUAL FINANCIAL REPORT YEAR ENDED JUNE 30, 2011
 ANNUAL FINANCIAL REPORT YEAR ENDED JUNE 30, 2011 NICHOLS, CAULEY & ASSOCIATES, LLC Certified Public Accountants Certified Financial Planners Certified Internal Auditors Certified Government Auditing Professionals
HARBOR TRANSIT MULTI-MODAL TRANSPORTATION SYSTEM
 HARBOR TRANSIT MULTI-MODAL TRANSPORTATION SYSTEM FINANCIAL STATEMENTS FOR THE YEAR ENDED JUNE 30, 2015 Vredeveld Haefner LLC TABLE OF CONTENTS FINANCIAL SECTION PAGE Independent Auditors Report 1-2 Management
ROANOKE RAPIDS GRADED SCHOOL DISTRICT Roanoke Rapids, North Carolina. Financial Statements For the Fiscal Year Ended June 30, 2017
 ROANOKE RAPIDS GRADED SCHOOL DISTRICT Roanoke Rapids, North Carolina Financial Statements For the Fiscal Year Ended June 30, 2017 TABLE OF CONTENTS Exhibit Page No. Independent Auditors Report... 1 Management
MARTHA S VINEYARD REGIONAL TRANSIT AUTHORITY (a component Unit of the Massachusetts Department of Transportation)
") MARTHA S VINEYARD REGIONAL TRANSIT AUTHORITY (a component Unit of the Massachusetts Department of Transportation) Basic Financial Statements, Supplementary Data For the Years Ended June 30, 2013 and 2012
MARTHA S VINEYARD REGIONAL TRANSIT AUTHORITY (a component Unit of the Massachusetts Department of Transportation) Basic Financial Statements, Supplementary Data For the Years Ended June 30, 2013 and 2012
City of Chicago, Illinois Chicago Midway International Airport
 City of Chicago, Illinois Chicago Midway International Airport Basic Financial Statements as of and for the Years Ended December 31, 2009 and 2008, Required Supplementary Information, Additional Information,
NIAGARA FRONTIER TRANSPORTATION AUTHORITY (A Component Unit of the State of New York) FINANCIAL STATEMENTS. MARCH 31, 2018 and 2017
 FINANCIAL STATEMENTS. MARCH 31, 2018 and 2017") NIAGARA FRONTIER TRANSPORTATION AUTHORITY FINANCIAL STATEMENTS MARCH 31, 2018 and 2017 Table of Contents Page Independent Auditors Report 1 Management Certification: Management s Certification of the Financial
NIAGARA FRONTIER TRANSPORTATION AUTHORITY FINANCIAL STATEMENTS MARCH 31, 2018 and 2017 Table of Contents Page Independent Auditors Report 1 Management Certification: Management s Certification of the Financial
LEVY COUNTY, FLORIDA AUDIT REPORT SEPTEMBER 30, 2012
 LEVY COUNTY, FLORIDA AUDIT REPORT SEPTEMBER 30, 2012 Levy County, Florida Audit Report September 30, 2012 Table of Contents Page INDEPENDENT AUDITOR S REPORT... i MANAGEMENT S DISCUSSION AND ANALYSIS...
City of Bentonville, Arkansas
 Comprehensive Annual Financial Report For the Year Ended December 31, 2016 Prepared by: Denise Land Finance Director Jake Harper Assistant Finance Director Visit our web site at: www.bentonvillear.com
STATE OF ILLINOIS ILLINOIS STATE UNIVERSITY. FINANCIAL AUDIT (In Accordance with the Single Audit Act and OMB Circular A-133)
") STATE OF ILLINOIS ILLINOIS STATE UNIVERSITY FINANCIAL AUDIT (In Accordance with the Single Audit Act and OMB Circular A-133) For The Years Ended June 30, 2009 and 2008 Performed as Special Assistant Auditors
STATE OF ILLINOIS ILLINOIS STATE UNIVERSITY FINANCIAL AUDIT (In Accordance with the Single Audit Act and OMB Circular A-133) For The Years Ended June 30, 2009 and 2008 Performed as Special Assistant Auditors
TOWNSHIP OF TYRONE LIVINGSTON COUNTY, MICHIGAN ANNUAL FINANCIAL REPORT YEAR ENDED MARCH 31, 2018
 TOWNSHIP OF TYRONE LIVINGSTON COUNTY, MICHIGAN ANNUAL FINANCIAL REPORT YEAR ENDED MARCH 31, 2018 TABLE OF CONTENTS INDEPENDENT AUDITOR'S REPORT 1 MANAGEMENT S DISCUSSION AND ANALYSIS 5 BASIC FINANCIAL
Jackson County Board of Education
 Jackson County Board of Education Financial Statements Year Ended June 30, 2018 Sylva, North Carolina Members of the Board of Education Ali Laird-Large, Chairperson Elizabeth Cooper, Vice Chairperson Abigail
CARROLL COMMUNITY COLLEGE FINANCIAL STATEMENTS JUNE 30, 2016 AND 2015
 FINANCIAL STATEMENTS TABLE OF CONTENTS YEARS ENDED INDEPENDENT AUDITORS REPORT 1 MANAGEMENT S DISCUSSION AND ANALYSIS 3 FINANCIAL STATEMENTS STATEMENTS OF NET POSITION (DEFICIT) 12 STATEMENTS OF REVENUES,
CAPE COD REGIONAL TRANSIT AUTHORITY (a component Unit of the Massachusetts Department of Transportation)
") (a component Unit of the Massachusetts Department of Transportation) Basic Financial Statements, Supplementary Data For the Year Ended June 30, 2015 Table of Contents Management s Discussion and Analysis
(a component Unit of the Massachusetts Department of Transportation) Basic Financial Statements, Supplementary Data For the Year Ended June 30, 2015 Table of Contents Management s Discussion and Analysis
TEXAS DEPARTMENT OF TRANSPORTATION. Annual Financial Report For The Fiscal Year Ended August 31, (With Independent Auditor s Report)
") TEXAS DEPARTMENT OF TRANSPORTATION Annual Financial Report For The Fiscal Year Ended August 31, 2018 (With Independent Auditor s Report) Texas Department of Transportation Annual Financial Report (With
TEXAS DEPARTMENT OF TRANSPORTATION Annual Financial Report For The Fiscal Year Ended August 31, 2018 (With Independent Auditor s Report) Texas Department of Transportation Annual Financial Report (With
ALASKA RAILROAD CORPORATION. Financial Statements. December 31, 2006 and 2005
 Financial Statements (With Independent Auditors Report Thereon) Table of Contents Pages Management s Discussion and Analysis 1 7 Independent Auditors Report 8 9 Balance Sheets 10 Statements of Revenues,
City of Chicago, Illinois Chicago O Hare International Airport
 City of Chicago, Illinois Chicago O Hare International Airport Basic Financial Statements for the Years Ended December 31, 2005 and 2004, Required Supplementary Information, Additional Information, Statistical
Interurban Transit Partnership
 Single Audit Report Years Ended September 30, 2014 and 2013 The report accompanying these financial statements was issued by BDO USA, LLP, a Delaware limited liability partnership and the U.S. member of
Comprehensive Annual Financial Report
 Comprehensive Annual Financial Report For the Fiscal Year Ended June 30, 2017 The York County School Division County of York, Virginia (A Component Unit of the County of York, Virginia) Comprehensive Annual
YOSEMITE AREA REGIONAL TRANSPORTATION SYSTEM FINANCIAL STATEMENTS AND INDEPENDENT AUDITOR S REPORT FOR THE YEAR ENDED JUNE 30, 2016
 YOSEMITE AREA REGIONAL TRANSPORTATION SYSTEM FINANCIAL STATEMENTS AND INDEPENDENT AUDITOR S REPORT FOR THE YEAR ENDED JUNE 30, 2016 JUNE 30, 2016 TABLE OF CONTENTS Page FINANCIAL SECTION Independent Auditor
Jefferson County Public Transportation Benefit Area (Jefferson Transit Authority)
") Financial Statements Audit Report Jefferson County Public Transportation Benefit Area (Jefferson Transit Authority) For the period January 1, 2016 through December 31, 2016 Published August 3, 2017 Report
Financial Statements Audit Report Jefferson County Public Transportation Benefit Area (Jefferson Transit Authority) For the period January 1, 2016 through December 31, 2016 Published August 3, 2017 Report
Central Puget Sound Regional Transit Authority
 Central Puget Sound Regional Transit Authority Single Audit Reports for the Year Ended December 31, 2014 TABLE OF CONTENTS Audited Financial Statements Management s Discussion and Analysis... 1 Independent
SOUTHEAST MISSOURI STATE UNIVERSITY FINANCIAL STATEMENTS JUNE 30, 2018
 SOUTHEAST MISSOURI STATE UNIVERSITY FINANCIAL STATEMENTS JUNE 30, 2018 Contents Page Independent Auditors Report... 1-3 Management s Discussion And Analysis... 4-11 Financial Statements Statement Of Net
CAPE COD REGIONAL TRANSIT AUTHORITY (a component Unit of the Massachusetts Department of Transportation)
") (a component Unit of the Massachusetts Department of Transportation) Basic Financial Statements, Supplementary Data For the Year Ended June 30, 2017 Table of Contents Management s Discussion and Analysis
(a component Unit of the Massachusetts Department of Transportation) Basic Financial Statements, Supplementary Data For the Year Ended June 30, 2017 Table of Contents Management s Discussion and Analysis
Review FY09 Subsidy Allocation
 Finance, Administration and Oversight Committee Information Item IV-D March 13, 2008 Review FY09 Subsidy Allocation Washington Metropolitan Area Transportation Authority Board Action/Information Summary