6TH EDITION STATE HANDBOOK OF ECONOMIC, DEMOGRAPHIC & FISCAL INDICATORS. by David Baer PUBLIC POLICY INSTITUTE
|
|
|
- Cody Andrews
- 5 years ago
- Views:
Transcription
1

2 STATE HANDBOOK OF ECONOMIC, DEMOGRAPHIC & FISCAL INDICATORS 2006 by David Baer 6TH EDITION 2006 AARP. Reprinting only with permission. PUBLIC POLICY INSTITUTE
3 Table of Contents Pages Acknowledgments...iv Introduction...1 I. State Economic, Demographic, and Fiscal Summaries (including Puer Rico and the Virgin Islands) II. Tables and U.S. Maps III. Data Sources and Explanations iii
4 Acknowledgments The author is grateful the many individuals who contributed this handbook. In particular, thanks is first given Lee Cohen (formerly with AARP and now with the Social Security Administration) who used Excel create the initial pie charts and tables for the state summary section of the book. Second, the author is grateful various people from AARP s Public Policy Institute. This includes Carlos Figueiredo, who used his computer expertise enhance the initial tables and charts that were produced, as well as Sara Rix, John Gist, and Theresa Varner for reviewing the book s material. The author is also grateful Clare Hushbeck (AARP State Affairs), Felix Planas (Connecticut General Assembly, Office of Fiscal Analysis), Jay Wortley (Michigan Senate Fiscal Agency), Alan Dornfest (Idaho State Tax Commission), and all other state officials who ok time from their busy schedules review sections of the handbook. iv
5 Introduction The State Handbook of Economic, Demographic, and Fiscal Indicars 2006 represents the sixth edition of the state handbook series. We produce a new updated handbook biennially. It is an easy--use reference book for anyone in search of up--date information about state economic, demographic, and fiscal conditions. Policymakers, public officials, and policy analysts will find useful data on such pics as population, poverty rates, per capita state personal income, state and local revenues, expenditures, tax rates, and property tax relief programs. Gender and age comparisons are provided for some of the data. Throughout the book we use the most current data available. This handbook facilitates state-by-state and state-national comparisons, which can serve a variety of purposes. For example, a state's tax burden can be compared with the national average or with that of other states in the region. Per capita state personal income, unemployment, and median household income can be used assess how residents in one state fare vis-à-vis those in another. State Economic, Demographic, and Fiscal Summaries This part of the book features economic, demographic, and fiscal summaries of the entire United States, each state, and the District of Columbia, along with summaries for the Virgin Islands and Puer Rico. Most of the book s information is presented in this section. Users will find statistics on several major economic indicars, such as state personal income, median household income, and employment, as well as on population and poverty, distribution of household income, revenues, expenditures, tax rates, and debt ratio measures. A section on state-specific property tax relief summarizes homestead exemptions and credits, circuit breakers, and tax deferral programs, all of which are defined in the source notes and explanations section at the end of the book. We did not include all of the property tax rates, because they can vary within states, and because data on the varying rates are not easily available. In addition, nominal rates often do not equal effective rates. Homestead exemptions are reductions in the amount of assessed property value subject taxation. When reporting homestead exemptions, we note the assessed property value; however, the value of the tax reduction depends not only on the assessed property value but also on the fractional assessment level. For example, the fractional assessment percentage in Alabama is 10 percent for residential property, so the reported exemption value of $4,000 translates in an exemption of $40,000 in fair market value ($4,000 divided by 0.1). For this reason, assessed values must first be converted in fair market values before comparing homestead exemptions among states. 1
6 The section on state and local general revenues and expenditures shows revenues and expenditures per capita and as a percentage of state personal income, as well as average annual changes from The year 2002 was the most current year that we could obtain revenue and expenditure data from the U.S. Census Bureau. Comparisons can be made between each state and the national average of the amounts spent on expenditure programs. State and local debt information is provided on a per capita basis and per $1,000 of personal income. The composition of short-term and long-term debt is also presented. We have made some changes in the contents of the economic, demographic, and fiscal summaries since the 2003 Handbook. First, we now provide more current information on poverty rates by age and gender and the percent of households by age and income, thanks the new American Community Survey (ACS) by the Census Bureau. The ACS features a much larger sample size (about 800,000 households that will increase 3 million households in 2005) than the Current Population Survey (CPS) (about 100,000 households). State data are available on a more timely basis; instead of having wait for the decennial census, users can obtain new data yearly. Since we are now collecting poverty rate data from the ACS instead of the CPS, we no longer report the poverty rate in the economic indicars table (the first table in the state summaries). This is because we cannot make a 10-year comparison of state poverty rates until ACS has 10 years of poverty data. Second, we added health and long-term care state income tax exemptions and credits. We describe only those state tax exemptions and credits that are more generous than what are available on the federal return. Therefore, we exclude tax exemptions, e.g., medical savings account deductions, which are found in federal adjusted gross income. Further, we exclude state itemized deductions, since we only want describe tax exemptions and credits that benefit all taxpayers, not just those who itemize. Therefore, all the state health and long-term care tax provisions described here are available all state filers, whether they itemize or not. Finally, since we are only interested in the general population, we exclude state health and long-term care tax breaks that are targeted specifically for self-employed persons. Third, we described how the state tax income base is related the federal income tax base, such as federal adjusted gross income. The state income tax base may be unrelated the federal base; it may link federal adjusted gross income (AGI), federal taxable income, or federal gross income. If state taxable income is unrelated federal income, we say that the state s income tax base is not directly related federal income. Fourth, we highlighted the minimum income levels at which taxpayers must file their state income taxes. Fifth, because some states have local expenditure limits which may affect the amount of property taxes collected, we describe how localities limit the growth of their expenditures. 2
7 Tables and U.S. Maps The handbook provides tables and maps of selected state economic, demographic, and fiscal data (found primarily in the economic, demographic, and fiscal summaries part). This presentation of the data makes it easy compare any or all states and the District of Columbia on such economic indicars as per capita income or gross state product. The tables provide state rankings for easy comparisons. We do not include Puer Rico and the Virgin Islands because the data are either unavailable or not as current as state data, in the tables. Data Sources and Explanations Data sources and explanations of concepts or terms can be found in this part of the handbook. Most of the information in the handbook comes from the U.S. Bureau of the Census, including poverty rate by age group and household income by age group from the American Community Survey, median household income from the Current Population Survey, population estimates by age group based on decennial census data, and revenues and expenditures from the Census of Governments. We collected economic data, such as per capita income and gross state product, from the U.S. Bureau of Economic Analysis and employment data from the U.S. Bureau of Labor Statistics. In addition, we obtained tax rate and property tax relief information from a survey of state and local government offices, such as state legislative offices and state and local assessors offices. For Puer Rico and the Virgin Islands, we collected household income, poverty rate, and population data from U.S. decennial census data. Employment data came from the U.S. Bureau of Labor Statistics (Puer Rico) and the Virgin Island s Bureau of Economic Research. Per capita income came from Puer Rico s Department of the Treasury and the U.S. Census Bureau (Virgin Islands). Tax rates, general revenue, and general expenditure data came from Puer Rico s Department of the Treasury, the Virgin Islands Office of Management and Budget (revenues), the U.S. Internal Revenue Service (income tax data), and the Virgin Islands Bureau of Internal Revenue (miscellaneous tax data). As state and local economic conditions and demographic patterns change, policymakers may consider adjusting their policies on taxes and spending programs. These adjustments become more difficult when economic and demographic changes depart from hisrical trends. It is our belief that this publication will contribute more informed public policy decisions by identifying significant economic, demographic, and fiscal changes. 3
8 U.S. Economic Indicars US Average Annual Change Per Capita Income... $22,172 $33, % Median Household Income... $32,264 $44, % Gross State Product (in millions)... $6,865,513 $11,665, % Full- and Part-Time Positions (in thousands) 145, , % Employed Persons (in thousands) , , % Unemployment Rate % 5.5% n/a Sources: U.S. Bureau of the Census, U.S. Bureau of Economic Analysis, and the U.S. Bureau of Labor Statistics 2004 Population Under Age 18 6% 5% Males 26% 7% 7% Females 24% Ages Ages Ages 75 and over 63% 62% Population Population and Poverty Percentage Change Poverty Rate Total Population ,327, ,655, % 13.1% Males ,049, ,537, % 11.6% Under Age ,797,816 37,505, % 18.3% Ages ,739,159 91,878, % 9.6% Ages ,290,853 8,427, % 6.5% Ages 75 and over... 5,221,347 6,726, % 6.8% Females ,277, ,117, % 14.5% Under age ,107,089 35,772, % 18.6% Ages ,472,442 92,204, % 13.6% Ages ,412,129 10,035, % 9.7% Ages 75 and over... 9,286,186 11,104, % 13.3% Source: U.S. Bureau of the Census 4
9 U.S. Percent Distribution of Households by Age of Householder and Income, 2004 Less than $10,000 $10,000 $14,999 $15,000 $24,999 $25,000 $34,999 $35,000 $49,999 $50,000 $74,999 $75,000 $99,999 $100,000 or more All Households Age of Householder Under 25 years % 9.9% 19.7% 16.8% 15.5% 11.4% 3.3% 1.8% 100.0% years % 4.3% 10.1% 11.9% 16.9% 22.2% 12.7% 15.1% 100.0% years % 4.2% 9.0% 9.8% 14.4% 20.4% 13.6% 21.4% 100.0% 65 years and over % 12.8% 20.4% 14.7% 14.9% 12.6% 5.6% 6.8% 100.0% United States (all ages). 8.9% 6.3% 12.3% 12.0% 15.5% 19.0% 11.1% 15.0% 100.0% Source: U.S. Bureau of the Census Percent of Households by Household Income Bracket, 2004 Percent of Households 20.0% 18.0% 16.0% 14.0% 12.0% 10.0% 8.0% 6.0% 4.0% 2.0% 0.0% Less than $10,000 $10,000 $14,999 $15,000 $24,999 $25,000 $34,999 $35,000 $49,999 $50,000 $74,999 $75,000 $99,999 $100,000 or more 5
10 U.S. State and Local General Revenues, FY 2002 Average Annual Revenue Change General Revenues Percent of Personal (millions) Per Capita Income Total General Revenues... $1,684,776 $5, % 5.6% Own Sources... $1,324,241 $4, % 5.2% Taxes... $904,971 $3, % 4.9% Property Taxes... $279,122 $ % 4.5% General Sales Taxes... $222,987 $ % 5.4% Personal Income Taxes $202,858 $ % 5.8% Other Taxes... $200,005 $ % 4.3% Charges/Miscellaneous... $419,270 $1, % 5.7% Federal Aid... $360,534 $1, % 7.2% Source: U.S. Bureau of the Census (2002 data are the most current available.) 1992 General Revenue 2002 General Revenue Property Taxes 18% 18% 21% 17% General Sales Taxes Personal Income Taxes Other Taxes 26% 13% 13% Charges/Misc Federal Aid 13% 12% 25% 12% 12% 6
11 U.S. State and Local General Expenditures, FY 2002 General Expenditures Average Annual Expenditure Change Percent of Personal (millions) Per Capita Income State/Local Direct General Expends. $1,735,196 $6, % 5.9% To State/Local Government... $1,730,809 $6, % 5.9% Education*... $594,591 $2, % 6.2% Public Welfare... $279,598 $ % 6.1% Health and Hospitals... $146,380 $ % 5.2% Highways... $115,467 $ % 5.5% Public Safety*... $156,786 $ % 6.3% Environment... $102,382 $ % 5.1% Interest on General Debt... $75,303 $ % 3.1% Other... $260,303 $ % 6.5% To Federal Government... $4,387 $15 0.1% 1.9% *Education includes higher and lower education; public safety includes police, fire, corrections, and protection and inspection. Source: U.S. Bureau of the Census (2002 data are the most current available.) State and Local General Expenditures, FY 2002 (excluding payments federal government) 15% Education 6% 4% 9% 35% Public Welfare Health and Hospitals Highways Public Safety Environment 7% 8% 16% Interest on General Debt Other Total Debt Outstanding Long-term Debt Short-term Debt 2002 Debt Ratio Measures Per $1,000 Debt (billions) Per Capita of Personal Income Debt (billions) Percent of Total Debt (billions) Percent of Total United States... $1,681.4 $5,839 $192.9 $1, % $ % Source: U.S. Bureau of the Census 7
12 Alabama Economic Indicars Average Annual Change AL US AL US AL US Per Capita Income... $18,606 $22,172 $27,630 $33, % 4.1% Median Household Income... $27,196 $32,264 $36,579 $44, % 3.2% Gross State Product (in millions)... $88,581 $6,865,513 $139,840 $11,665, % 5.4% Full- and Part-Time Positions (in thousands) 2, ,224 2, , % 1.6% Employed Persons (in thousands).. 1, ,060 2, , % 1.2% Unemployment Rate % 6.1% 5.6% 5.5% n/a n/a Sources: U.S. Bureau of the Census, U.S. Bureau of Economic Analysis, and the U.S. Bureau of Labor Statistics 2004 Population Under Age 18 7% 4% Males 26% 8% 7% Females 23% Ages Ages Ages 75 and Over 63% 62% Population Poverty Rate Population and Poverty Percentage Change AL AL AL US AL US Total Population... 4,232,965 4,530, % 12.8% 16.1% 13.1% Males... 2,029,950 2,196, % 13.8% 13.8% 11.6% Under Age , , % 7.8% 23.5% 18.3% Ages ,263,222 1,391, % 16.7% 11.1% 9.6% Ages , , % 1.6% 6.7% 6.5% Ages 75 and Over... 81,587 98, % 28.8% 8.2% 6.8% Females... 2,203,015 2,333, % 11.9% 18.1% 14.5% Under Age , , % 8.1% 23.0% 18.6% Ages ,343,521 1,446, % 14.6% 17.0% 13.6% Ages , , % -3.6% 13.6% 9.7% Ages 75 and Over , , % 19.6% 16.7% 13.3% Source: U.S. Bureau of the Census 8
13 Alabama Percent Distribution of Households by Age of Householder and Income, 2004 Less than $10,000 $10,000 $14,999 $15,000 $24,999 $25,000 $34,999 $35,000 $49,999 $50,000 $74,999 $75,000 $99,999 $100,000 or more All Households Age of Householder Under 25 years % 12.8% 21.2% 14.3% 12.3% 6.0% 1.2% 0.8% 100.0% years % 6.8% 13.3% 12.6% 15.7% 22.7% 10.9% 8.7% 100.0% years % 5.3% 11.6% 12.2% 15.4% 19.4% 10.7% 15.4% 100.0% 65 years and over % 12.8% 21.4% 14.5% 13.8% 11.1% 5.2% 5.0% 100.0% Alabama (all ages) % 7.9% 14.9% 13.0% 15.0% 18.0% 9.0% 9.9% 100.0% United States (all ages). 8.9% 6.3% 12.3% 12.0% 15.5% 19.0% 11.1% 15.0% 100.0% Source: U.S. Bureau of the Census Percent of Households by Household Income Bracket, 2004 Percent of Households 20.0% 18.0% 16.0% 14.0% 12.0% 10.0% 8.0% 6.0% 4.0% 2.0% 0.0% Less than $10,000 $10,000 $14,999 $15,000 $24,999 $25,000 $34,999 $35,000 $49,999 $50,000 $74,999 $75,000 $99,999 $100,000 or more Alabama United States 9
14 State and Local General Revenues, FY 2002 Alabama Average Annual Revenue Change General Revenues Per Capita Percent of Personal Income (millions) AL US AL US AL US Total General Revenues... $23,741 $5,298 $5, % 19.3% 6.2% 5.6% Own Sources... $17,478 $3,900 $4, % 15.2% 5.7% 5.2% Taxes... $9,719 $2,169 $3, % 10.4% 5.0% 4.9% Property Taxes... $1,474 $329 $ % 3.2% 7.3% 4.5% General Sales Taxes... $2,968 $662 $ % 2.6% 5.0% 5.4% Personal Income Taxes. $2,127 $475 $ % 2.3% 5.1% 5.8% Other Taxes... $3,150 $703 $ % 2.3% 4.0% 4.3% Charges/Miscellaneous... $7,759 $1,731 $1, % 4.8% 6.6% 5.7% Federal Aid... $6,263 $1,398 $1, % 4.1% 8.0% 7.2% Source: U.S. Bureau of the Census (2002 data are the most current available.) 1992 General Revenue 2002 General Revenue Property Taxes 6% 6% General Sales Taxes Personal Income Taxes Other Taxes 22% 14% 10% 26% 13% 9% Charges/Misc Federal Aid 32% 16% 33% 13% 10
15 Alabama I. Personal Income Tax (2004) State Income Tax Base Alabama s income tax base is not directly linked the federal income tax base. Filing Requirements Taxpayers must file if their tal gross income equals or exceeds $1,875 (single) or $3,750 (married, filing jointly) Rate Structure Single Married, Filing Jointly Taxable Income Rate Taxable Income Rate First $ % First $1, % $500 - $3, % $1,000 - $6, % Over $3, % Over $6, % Public Pension Exemption... Full exemption Private Pension Exemption... Full exemption with a defined-benefit plan; no exemption with other plans Social Security Benefits... Full exemption Standard Deductions and Personal Exemptions Combined All ages... $1,875 - $3,500 (single); $3,750 - $7,000 (married, filing jointly) Other Deductions % of federal income taxes Local Income Taxes... None II. General Sales Tax Rates (2004) State % Combined state/local tax rates % 11.0% Sources: AARP 2005 telephone survey of state legislative staff, state departments of revenue, state controllers offices, state assessors offices, and state treasury offices. 11
16 Alabama III. Miscellaneous Tax Rates (2004) Corporate income (highest marginal rate) % All taxable income Gasoline (per gallon)... $0.16 Counties have rates from $0.01 $0.03 and cities from $0.01 $0.04. Cigarette (per pack of 20)... $0.165 Local taxes, where levied, are additional. Beer (per gallon)... $0.533 Counties levy an additional $0.52/gallon. IV. Real Property Tax Relief Programs (2005) Homestead Exemption or Credit Requirements Benefits All homeowners... $4,000 assessed value on state taxes $2,000 assessed value on county taxes (optional $2,000 assessed value exemption for other local taxing units) Homeowners age 65 and over... Full exemption from state taxes $2,000 assessed value on county taxes (optional $2,000 exemption for other local taxing units) Homeowners age 65 and over with state adjusted gross income (AGI) less than $12, $5,000 assessed value on local taxes Homeowners age 65 and over with federal AGI less than $7, Full exemption on state and local taxes Circuit Breaker... None Deferral Program... None V. Real Property Tax Limits, Caps, or Freezes (2005) Residential property tax rates cannot exceed 1/10 of 1% of fair market value (nominal rate) or 1% of fair market value (the effective rate using a 10% assessment ratio). Sources: AARP 2005 telephone survey of state legislative staff, state departments of revenue, state controllers offices, state assessors offices, and state treasury offices. 12
17 Alabama State and Local General Expenditures, FY 2002 General Expenditures Average Annual Expenditure Change Percent of Personal Per Capita Income (millions) AL US AL US AL US State/Local Direct General Expends... $24,605 $5,491 $6, % 19.9% 6.3% 5.9% To State/Local Government... $24,605 $5,491 $6, % 19.9% 6.3% 5.9% Education*... $8,320 $1,857 $2, % 6.8% 6.9% 6.2% Public Welfare... $4,162 $929 $ % 3.2% 8.2% 6.1% Health and Hospitals... $4,082 $911 $ % 1.7% 5.4% 5.2% Highways... $1,668 $372 $ % 1.3% 5.7% 5.5% Public Safety*... $1,537 $343 $ % 1.8% 5.9% 6.3% Environment... $1,421 $317 $ % 1.2% 6.2% 5.1% Interest on General Debt... $819 $183 $ % 0.9% 2.1% 3.1% Other... $2,595 $579 $ % 3.0% 5.8% 6.5% To Federal Government... $0 $0 $15 0.0% 0.1% 0.0% 1.9% *Education includes higher and lower education; public safety includes police, fire, corrections, and protection and inspection. Source: U.S. Bureau of the Census (2002 data are the most current available.) State and Local General Expenditures, FY 2002 (excluding payments federal government) 6% 6% 7% 11% Education 3% Public Welfare 33% 17% 17% Health and Hospitals Highways Public Safety Environment Interest on General Debt Other Total Debt Outstanding Long-term Debt Short-term Debt 2002 Debt Ratio Measures Per $1,000 Debt (billions) Per Capita of Personal Income Debt (billions) Percent of Total Debt (billions) Percent of Total Alabama (State and Local)... $19.1 $4,253 $ $ % $ % United States... $1,681.4 $5,839 $ $1, % $ % Source: U.S. Bureau of the Census 13
18 Alaska Economic Indicars Average Annual Change AK US AK US AK US Per Capita Income... $25,050 $22,172 $34,085 $33, % 4.1% Median Household Income... $45,367 $32,264 $55,218 $44, % 3.2% Gross State Product (in millions)... $23,110 $6,865,513 $34,023 $11,665, % 5.4% Full- and Part-Time Positions (in thousands) , , % 1.6% Employed Persons (in thousands) , , % 1.2% Unemployment Rate % 6.1% 7.5% 5.5% n/a n/a Sources: U.S. Bureau of the Census, U.S. Bureau of Economic Analysis, and the U.S. Bureau of Labor Statistics 2004 Population Under Age 18 4% Males 2% 29% Females 4% 3% 29% Ages Ages Ages 75 and Over 65% 64% Population Poverty Rate Population and Poverty Percentage Change AK AK AK US AK US Total Population , , % 12.8% 8.2% 13.1% Males , , % 13.8% 7.9% 11.6% Under Age ,422 96, % 7.8% 10.4% 18.3% Ages , , % 16.7% 7.3% 9.6% Ages ,565 12, % 1.6% 1.1% 6.5% Ages 75 and Over... 3,800 6, % 28.8% 0.9% 6.8% Females , , % 11.9% 8.6% 14.5% Under Age ,067 91, % 8.1% 12.2% 18.6% Ages , , % 14.6% 7.3% 13.6% Ages ,758 12, % -3.6% 3.5% 9.7% Ages 75 and Over... 5,205 9, % 19.6% 8.5% 13.3% Source: U.S. Bureau of the Census 14
19 Alaska Percent Distribution of Households by Age of Householder and Income, 2004 Less than $10,000 $10,000 $14,999 $15,000 $24,999 $25,000 $34,999 $35,000 $49,999 $50,000 $74,999 $75,000 $99,999 $100,000 or more All Households Age of Householder Under 25 years % 5.4% 22.1% 20.7% 15.0% 24.8% 4.3% 2.6% 100.0% years % 2.8% 8.6% 9.2% 15.7% 25.6% 17.3% 17.5% 100.0% years % 3.8% 6.8% 6.6% 14.9% 18.7% 16.1% 28.6% 100.0% 65 years and over % 12.9% 14.8% 14.9% 16.2% 19.5% 7.3% 11.3% 100.0% Alaska (all ages) % 4.5% 9.4% 9.4% 15.4% 21.9% 14.8% 20.6% 100.0% United States (all ages). 8.9% 6.3% 12.3% 12.0% 15.5% 19.0% 11.1% 15.0% 100.0% Source: U.S. Bureau of the Census Percent of Households by Household Income Bracket, 2004 Percent of Households 25.0% 20.0% 15.0% 10.0% 5.0% 0.0% Less than $10,000 $10,000 $14,999 $15,000 $24,999 $25,000 $34,999 $35,000 $49,999 $50,000 $74,999 $75,000 $99,999 $100,000 or more Alaska United States 15
20 State and Local General Revenues, FY 2002 Alaska Average Annual Revenue Change General Revenues Per Capita Percent of Personal Income (millions) AK US AK US AK US Total General Revenues... $7,209 $11,249 $5, % 19.3% 0.6% 5.6% Own Sources... $5,420 $8,457 $4, % 15.2% -0.9% 5.2% Taxes... $2,070 $3,230 $3, % 10.4% -1.0% 4.9% Property Taxes... $830 $1,295 $ % 3.2% 2.5% 4.5% General Sales Taxes... $122 $190 $ % 2.6% 4.8% 5.4% Personal Income Taxes. $0 $0 $ % 2.3% 0.0% 5.8% Other Taxes... $1,118 $1,745 $ % 2.3% -3.3% 4.3% Charges/Miscellaneous... $3,350 $5,227 $1, % 4.8% -0.9% 5.7% Federal Aid... $1,789 $2,792 $1, % 4.1% 7.7% 7.2% Source: U.S. Bureau of the Census 1992 General Revenue 2002 General Revenue Property Taxes General Sales Taxes Other Taxes 13% 9% 1% 23% 12% 25% 2% 16% Charges/Misc Federal Aid 54% 45% 16
21 Alaska I. Personal Income Tax (2004) No state or local personal income tax is levied. II. General Sales Tax Rates (2004) State... None Local... 0% 7% III. Miscellaneous Tax Rates (2004) Corporate income (highest marginal rate) % On income over $90,000 Gasoline (per gallon)... $0.08 There may be additional local taxes. Cigarette (per pack of 20)... $1.00* Local taxes, where levied, are additional. Beer (per gallon)... $1.07 *The cigarette tax increased $1.60 per pack starting on January 1, IV. Real Property Tax Relief Programs (2005) Homestead Exemption or Credit Requirements Benefits All homeowners... Local option exemption of up $20,000 assessed value Homeowners age 65 or older, disabled veterans, or surviving spouses over age $150,000 assessed value Volunteer firefighters or EMT homeowners... Local option exemption of up $10,000 assessed value Circuit Breaker... None Deferral Program... None V. Real Property Tax Limits, Caps, or Freezes (2005) Local real property tax rates cannot exceed the following rates: Home rule and first-class cities... $3 per $100 of assessed value Second-class cities... $2 per $100 of assessed value Boroughs... $3 per $100 of assessed value Sources: AARP 2005 telephone survey of state legislative staff, state departments of revenue, state controllers offices, state assessors offices, and state treasury offices. 17
22 State and Local General Expenditures, FY 2002 General Expenditures Alaska Average Annual Expenditure Change Percent of Personal Per Capita Income (millions) AK US AK US AK US State/Local Direct General Expends... $8,443 $13,175 $6, % 19.9% 3.4% 5.9% To State/Local Government... $8,443 $13,175 $6, % 19.9% 3.6% 5.9% Education*... $2,107 $3,287 $2, % 6.8% 4.3% 6.2% Public Welfare... $1,035 $1,615 $ % 3.2% 9.4% 6.1% Health and Hospitals... $263 $410 $ % 1.7% 1.6% 5.2% Highways... $916 $1,429 $ % 1.3% 4.1% 5.5% Public Safety*... $558 $871 $ % 1.8% 5.1% 6.3% Environment... $443 $692 $ % 1.2% 0.7% 5.1% Interest on General Debt... $427 $667 $ % 0.9% -6.0% 3.1% Other... $2,694 $4,204 $ % 3.0% 4.5% 6.5% To Federal Government... $0 $0 $15 0.0% 0.1% n/a 1.9% *Education includes higher and lower education; public safety includes police, fire, corrections, and protection and inspection. Source: U.S. Bureau of the Census State and Local General Expenditures, FY 2002 (excluding payments federal government) 32% 25% Education Public Welfare Health and Hospitals Highways Public Safety 12% Environment 5% 5% 7% 11% 3% Interest on General Debt Other Total Debt Outstanding Long-term Debt Short-term Debt 2002 Debt Ratio Measures Per $1,000 Debt (billions) Per Capita of Personal Income Debt (billions) Percent of Total Debt (billions) Percent of Total Alaska (State and Local)... $8.6 $13,491 $ $ % $ % United States... $1,681.4 $5,839 $ $1, % $ % Source: U.S. Bureau of the Census 18
23 THIS PAGE INTENTIONALLY LEFT BLANK 19
24 Arizona Economic Indicars Average Annual Change AZ US AZ US AZ US Per Capita Income... $19,212 $22,172 $28,609 $33, % 4.1% Median Household Income... $31,293 $32,264 $43,761 $44, % 3.2% Gross State Product (in millions)... $95,292 $6,865,513 $199,953 $11,665, % 5.4% Full- and Part-Time Positions (in thousands) 2, ,224 3, , % 1.6% Employed Persons (in thousands).. 1, ,060 2, , % 1.2% Unemployment Rate % 6.1% 5.0% 5.5% n/a n/a Sources: U.S. Bureau of the Census, U.S. Bureau of Economic Analysis, and the U.S. Bureau of Labor Statistics 2004 Population Under Age 18 Ages % 5% Males 28% 7% 7% Females 26% Ages Ages 75 and Over 60% 60% Population Poverty Rate Population and Poverty Percentage Change AZ AZ AZ US AZ US Total Population... 4,147,561 5,743, % 12.8% 14.2% 13.1% Males... 2,048,640 2,873, % 13.8% 13.4% 11.6% Under Age , , % 7.8% 19.7% 18.3% Ages ,229,772 1,755, % 16.7% 12.1% 9.6% Ages , , % 1.6% 5.1% 6.5% Ages 75 and Over... 95, , % 28.8% 5.0% 6.8% Females... 2,098,921 2,870, % 11.9% 15.0% 14.5% Under Age , , % 8.1% 20.9% 18.6% Ages ,233,999 1,708, % 14.6% 13.7% 13.6% Ages , , % -3.6% 8.0% 9.7% Ages 75 and Over , , % 19.6% 10.9% 13.3% Source: U.S. Bureau of the Census 20
25 Arizona Percent Distribution of Households by Age of Householder and Income, 2004 Less than $10,000 $10,000 $14,999 $15,000 $24,999 $25,000 $34,999 $35,000 $49,999 $50,000 $74,999 $75,000 $99,999 $100,000 or more All Households Age of Householder Under 25 years % 8.4% 21.5% 18.5% 11.2% 9.3% 3.7% 2.4% 100.0% years % 4.5% 12.3% 13.1% 17.7% 21.8% 12.3% 12.5% 100.0% years % 4.2% 11.4% 11.1% 15.8% 19.1% 13.0% 19.0% 100.0% 65 years and over % 11.9% 20.3% 14.7% 18.0% 14.3% 5.9% 6.1% 100.0% Arizona (all ages) % 6.2% 14.3% 13.1% 16.7% 18.4% 10.6% 12.7% 100.0% United States (all ages). 8.9% 6.3% 12.3% 12.0% 15.5% 19.0% 11.1% 15.0% 100.0% Source: U.S. Bureau of the Census Percent of Households by Household Income Bracket, 2004 Percent of Households 20.0% 18.0% 16.0% 14.0% 12.0% 10.0% 8.0% 6.0% 4.0% 2.0% 0.0% Less than $10,000 $10,000 $14,999 $15,000 $24,999 $25,000 $34,999 $35,000 $49,999 $50,000 $74,999 $75,000 $99,999 $100,000 or more Arizona United States 21
26 State and Local General Revenues, FY 2002 Arizona Average Annual Revenue Change General Revenues Per Capita Percent of Personal Income (millions) AZ US AZ US AZ US Total General Revenues... $25,524 $4,693 $5, % 19.3% 7.0% 5.6% Own Sources... $19,805 $3,641 $4, % 15.2% 6.3% 5.2% Taxes... $14,420 $2,651 $3, % 10.4% 6.4% 4.9% Property Taxes... $4,254 $782 $ % 3.2% 5.1% 4.5% General Sales Taxes... $5,783 $1,063 $ % 2.6% 8.5% 5.4% Personal Income Taxes. $2,091 $384 $ % 2.3% 5.4% 5.8% Other Taxes... $2,292 $421 $ % 2.3% 5.1% 4.3% Charges/Miscellaneous... $5,385 $990 $1, % 4.8% 6.0% 5.7% Federal Aid... $5,719 $1,051 $1, % 4.1% 10.3% 7.2% Source: U.S. Bureau of the Census (2002 data are the most current available.) 1992 General Revenue 2002 General Revenue Property Taxes General Sales Taxes Personal Income Taxes Other Taxes Charges/Misc 22% 17% 20% 20% 21% 22% 17% 23% Federal Aid 11% 10% 9% 8% 22
27 Arizona I. Personal Income Tax (2004) State Income Tax Base Arizona s income tax base is linked federal adjusted gross income. Filing Requirements Taxpayers must file if their gross income or Arizona adjusted gross income equals or exceeds the following: Filing Status Gross Income Arizona Adjusted Gross Income Single $15,000 $5,500 Married, Filing Jointly $15,000 $11,000 Rate Structure Single Married, Filing Jointly Taxable Income Rate Taxable Income Rate First $10, % First $20, % $10,001 - $25, % $20,001 - $50, % $25,001 - $50, % $50,001 - $100, % $50,001 - $150, % $100,001 - $300, % $150,001 and over 5.04% $300,001 and over 5.04% Public Pension Exemption... $2,500 Private Pension Exemption... None Social Security Benefits... Full exemption Medical Savings Account (MSA) Deduction Taxpayers may be able subtract deposits made in an MSA if the following conditions are met: The MSA qualifies as an MSA under Arizona law but not federal law. The taxpayer or his/her employer made deposits in the MSA. The taxpayer had include the deposits as part of federal adjusted gross income. Sources: AARP 2005 telephone survey of state legislative staff, state departments of revenue, state controllers offices, state assessors offices, and state treasury offices. 23
28 Arizona Standard Deductions and Personal Exemptions Combined Under age $6,150 (single); $12,300 (married, filing jointly; both spouses are under age 65) Age 65 or older... $8,250 (single); $16,500 (married, filing jointly; both spouses are age 65 or older) Local Income Taxes... None II. General Sales Tax (2004) State % Combined state/local tax rates % 10.6% III. Miscellaneous Tax Rates (2004) Corporate income (flat rate) % All taxable income ($50 minimum) Gasoline (per gallon)... $0.18 Cigarette (per pack of 20)... $1.18 Beer (per gallon)... $0.16 IV. Real Property Tax Relief Programs (2005) Homestead Exemption or Credit Requirements Benefits All homeowners... 35% of school taxes for operating and maintenance costs with a $500 cap on tax reduction Widows, widowers, disabled whose household income is $13,200 or less (no children under age 18 are living in the residence) or $18,840 or less (at least one child under 18 or disabled is living in residence) and whose home s tal assessed value does not exceed $20, $3,000 assessed value Sources: AARP 2005 telephone survey of state legislative staff, state departments of revenue, state controllers offices, state assessors offices, and state treasury offices. 24
29 Arizona Circuit Breaker Requirements Benefits Homeowners and renters age 65 or older whose income is less than $3,751 (single) or $5,501 (married, filing jointly), excluding Social Security benefits... Up $502 for income taxes paid Deferral Program Homeowners can defer all of their property taxes if they meet the following requirements: (1) are age 70 or older; (2) have lived in their residence for at least six years; (3) have lived in Arizona for at least 10 years; (4) have a taxable income of $10,000 or less; (5) may not own or have legal, equitable, beneficial, or security interest in any other residence or other real property; (6) have a real property cash value of $150,000 or less; and (7) must have paid all property taxes for all years preceding the year of applying for the deferral program. V. Real Property Tax Limits, Caps, or Freezes (2005) Assessed property values for operating expenses cannot annually increase by more than 10%, or 25% of the difference between the full cash value of the property (used for debt service) in the current year and the limited value of the property in the preceding year (whichever is greater). Generally, the limited assessed property value will not increase annually by more than 10% unless property values increase significantly. Local property tax rates must be adjusted so that tal existing property tax revenues in assessment districts do not increase by more than 2%. This limitation can be removed with voter approval, and it does not pertain new construction or bonded indebtedness. In addition, this limitation applies only counties, cities, wns, and community college districts. Property tax rates for individual homeowners cannot exceed 10% of the assessed property value. This limitation does not apply bonded indebtedness. Homeowners age 65 or older whose income is 400% of Supplemental Security Income (SSI) or less (single) or 500% of SSI (two or more persons) and who have lived in their primary residence at least two years are eligible for a freeze on the market value of their primary residence. VI. Local Expenditure Limits (2005) Counties, cities, and wns cannot increase their expenditures by more than the annual increase in the cost of living and population growth. Voters can approve higher expenditure growth. Sources: AARP 2005 telephone survey of state legislative staff, state departments of revenue, state controllers offices, state assessors offices, and state treasury offices. 25
30 State and Local General Expenditures, FY 2002 General Expenditures Arizona Average Annual Expenditure Change Percent of Personal Per Capita Income (millions) AZ US AZ US AZ US State/Local Direct General Expends... $25,252 $4,643 $6, % 19.9% 6.2% 5.9% To State/Local Government... $25,252 $4,643 $6, % 19.9% 6.2% 5.9% Education*... $8,796 $1,617 $2, % 6.8% 6.2% 6.2% Public Welfare... $3,286 $604 $ % 3.2% 5.7% 6.1% Health and Hospitals... $1,209 $222 $ % 1.7% 5.1% 5.2% Highways... $1,913 $352 $ % 1.3% 5.4% 5.5% Public Safety*... $3,043 $559 $ % 1.8% 7.7% 6.3% Environment... $1,944 $357 $ % 1.2% 7.6% 5.1% Interest on General Debt... $1,091 $201 $ % 0.9% 0.6% 3.1% Other... $3,970 $730 $ % 3.0% 8.3% 6.5% To Federal Government... $0 $0 $15 0.0% 0.1% 0.0% 1.9% *Education includes higher and lower education; public safety includes police, fire, corrections, and protection and inspection. Source: U.S. Bureau of the Census (2002 data are the most current available.) State and Local General Expenditures, FY 2002 (excluding payments federal government) 16% Education Public Welfare 4% 34% Health and Hospitals Highways 8% Public Safety Environment 12% 8% 5% 13% Interest on General Debt Other Total Debt Outstanding Long-term Debt Short-term Debt 2002 Debt Ratio Measures Per $1,000 Debt (billions) Per Capita of Personal Income Debt (billions) Percent of Total Debt (billions) Percent of Total Arizona (State and Local)... $26.6 $4,892 $ $ % $ % United States... $1,681.4 $5,839 $ $1, % $ % Source: U.S. Bureau of the Census 26
31 THIS PAGE INTENTIONALLY LEFT BLANK 27
32 Arkansas Economic Indicars Average Annual Change AR US AR US AR US Per Capita Income... $17,350 $22,172 $25,724 $33, % 4.1% Median Household Income... $25,565 $32,264 $34,963 $44, % 3.2% Gross State Product (in millions)... $50,179 $6,865,513 $80,902 $11,665, % 5.4% Full- and Part-Time Positions (in thousands) 1, ,224 1, , % 1.6% Employed Persons (in thousands).. 1, ,060 1, , % 1.2% Unemployment Rate % 6.1% 5.7% 5.5% n/a n/a Sources: U.S. Bureau of the Census, U.S. Bureau of Economic Analysis, and the U.S. Bureau of Labor Statistics 2004 Population Under Age 18 7% 5% Males 26% 8% 8% Females 24% Ages Ages Ages 75 and Over 62% 60% Population Poverty Rate Population and Poverty Percentage Change AR AR AR US AR US Total Population... 2,450,605 2,752, % 12.8% 17.9% 13.1% Males... 1,182,048 1,348, % 13.8% 15.7% 11.6% Under Age , , % 7.8% 26.1% 18.3% Ages , , % 16.7% 12.7% 9.6% Ages ,812 94, % 1.6% 8.0% 6.5% Ages 75 and Over... 59,652 65, % 28.8% 9.4% 6.8% Females... 1,268,557 1,403, % 11.9% 20.1% 14.5% Under Age , , % 8.1% 25.6% 18.6% Ages , , % 14.6% 19.0% 13.6% Ages , , % -3.6% 12.8% 9.7% Ages 75 and Over , , % 19.6% 19.4% 13.3% Source: U.S. Bureau of the Census 28
33 Arkansas Percent Distribution of Households by Age of Householder and Income, 2004 Less than $10,000 $10,000 $14,999 $15,000 $24,999 $25,000 $34,999 $35,000 $49,999 $50,000 $74,999 $75,000 $99,999 $100,000 or more All Households Age of Householder Under 25 years % 7.3% 19.7% 17.7% 16.9% 9.5% 0.3% 0.0% 100.0% years % 6.3% 15.9% 14.8% 16.6% 20.9% 9.2% 6.8% 100.0% years % 6.7% 12.8% 13.1% 17.3% 18.1% 9.6% 10.9% 100.0% 65 years and over % 15.4% 22.9% 15.5% 14.7% 10.4% 3.8% 2.6% 100.0% Arkansas (all ages) % 8.5% 16.6% 14.6% 16.4% 16.8% 7.5% 6.8% 100.0% United States (all ages). 8.9% 6.3% 12.3% 12.0% 15.5% 19.0% 11.1% 15.0% 100.0% Source: U.S. Bureau of the Census Percent of Households by Household Income Bracket, 2004 Percent of Households 20.0% 18.0% 16.0% 14.0% 12.0% 10.0% 8.0% 6.0% 4.0% 2.0% 0.0% Less than $10,000 $10,000 $14,999 $15,000 $24,999 $25,000 $34,999 $35,000 $49,999 $50,000 $74,999 $75,000 $99,999 $100,000 or more Arkansas United States 29
34 State and Local General Revenues, FY 2002 Arkansas Average Annual Revenue Change General Revenues Per Capita Percent of Personal Income (millions) AR US AR US AR US Total General Revenues... $13,260 $4,897 $5, % 19.3% 6.7% 5.6% Own Sources... $9,614 $3,551 $4, % 15.2% 6.3% 5.2% Taxes... $6,461 $2,386 $3, % 10.4% 5.9% 4.9% Property Taxes... $1,004 $371 $ % 3.2% 4.8% 4.5% General Sales Taxes... $2,541 $938 $ % 2.6% 7.5% 5.4% Personal Income Taxes. $1,566 $578 $ % 2.3% 6.3% 5.8% Other Taxes... $1,350 $499 $ % 2.3% 3.7% 4.3% Charges/Miscellaneous... $3,153 $1,165 $1, % 4.8% 7.1% 5.7% Federal Aid... $3,645 $1,346 $1, % 4.1% 7.8% 7.2% Source: U.S. Bureau of the Census (2002 data are the most current available.) 1992 General Revenue 2002 General Revenue Property Taxes 9% 8% General Sales Taxes Personal Income Taxes Other Taxes 25% 18% 27% 19% Charges/Misc Federal Aid 23% 13% 12% 24% 10% 12% 30
35 Arkansas I. Personal Income Tax (2004) State Income Tax Base Arkansas income tax base is not directly linked the federal income tax base. Filing Requirements Taxpayers must file if their gross income equals or exceeds the following: Filing Status Gross Income Single and under age 65 $7,800 Single and age 65 or older $9,300 Married, filing jointly and both spouses under age 65 $15,500 Married, filing jointly and both spouses age 65 or older $16,200 Rate Structure All Taxpayers Taxable Income Rate Taxable Income Rate First $3, % $10,300 - $17, % $3,400 - $6, % $17,100 - $28, % $6,800 - $10, % Over $28, % Public and Private Pension Exemptions... $6,000* *The $6,000 exemption can include IRA distributions if a taxpayer is age or older. Social Security Benefits... Full exemption Standard Deductions All ages... $2,000 (single); $4,000 (married, filing jointly) Personal Tax Credits... $20 per person (under age 65) $40 per person (age 65 or older) $60 per person (age 65 or older)* *The $20 extra personal tax credit for taxpayers age 65 or older applies only if they did not claim the $6,000 retirement income exemption (which includes the deduction of pension income). Sources: AARP 2005 telephone survey of state legislative staff, state departments of revenue, state controllers offices, state assessors offices, and state treasury offices. 31
36 Arkansas Medically Necessary Food Credit... Up $2,400 per person for a child with phenylkenuria and other metabolic disorders. Local Income Taxes... Localities are allowed levy a net income tax in first-class cities. II. General Sales Tax Rates (2004) State... 6%* Combined state/local tax rates % 11.5% *The state imposes a statewide tax of 7% in the city of Texarkana. III. Miscellaneous Tax Rates (2004) Corporate income (highest marginal rate) % On income over $100,000 Gasoline (per gallon)... $0.215 Cigarette (per pack of 20)... $0.59 Beer (per gallon)... $0.242 IV. Real Property Tax Relief Programs (2005) Homestead Exemption or Credit Requirements Benefits All homeowners... $300 credit Circuit Breaker... None Deferral Program... None Sources: AARP 2005 telephone survey of state legislative staff, state departments of revenue, state controllers offices, state assessors offices, and state treasury offices. 32
37 Arkansas V. Real Property Tax Limits, Caps, or Freezes (2005) Real Property Tax Rate Limits* Cities... $5 per $1,000 of taxable value Counties... $5 per $1,000 of taxable value Libraries... $5 per $1,000 of taxable value Police pensions... $1 per $1,000 of taxable value Fire pensions... $1 per $1,000 of taxable value County road tax... $3 per $1,000 of taxable value Assessed property values may not increase by more than 5% per year for homeowners under age 65. Unless there are substantial improvements the property, assessed property values may not increase for homeowners age 65 and older or disabled. However, assessed property values can decrease for all homeowners if property values decrease. *School property tax rates have no limits but must be approved by the voters. Local taxing district property tax revenue is limited a 10% annual increase because of higher reassessments in property value. Sources: AARP 2005 telephone survey of state legislative staff, state departments of revenue, state controllers offices, state assessors offices, and state treasury offices. 33
38 State and Local General Expenditures, FY 2002 General Expenditures Arkansas Average Annual Expenditure Change Percent of Personal Per Capita Income (millions) AR US AR US AR US State/Local Direct General Expends... $13,068 $4,827 $6, % 19.9% 7.0% 5.9% To State/Local Government... $13,068 $4,827 $6, % 19.9% 7.0% 5.9% Education*... $4,783 $1,767 $2, % 6.8% 6.2% 6.2% Public Welfare... $2,593 $958 $ % 3.2% 8.2% 6.1% Health and Hospitals... $915 $338 $ % 1.7% 5.2% 5.2% Highways... $1,307 $483 $ % 1.3% 7.5% 5.5% Public Safety*... $993 $367 $ % 1.8% 9.3% 6.3% Environment... $726 $268 $ % 1.2% 8.1% 5.1% Interest on General Debt... $416 $154 $ % 0.9% 2.9% 3.1% Other... $1,335 $493 $ % 3.0% 8.7% 6.5% To Federal Government... $0 $0 $15 0.0% 0.1% -31.8% 1.9% *Education includes higher and lower education; public safety includes police, fire, corrections, and protection and inspection. Source: U.S. Bureau of the Census (2002 data are the most current available.) State and Local General Expenditures, FY 2002 (excluding payments federal government) 6% 8% 10% 10% Education 3% Public Welfare 36% 7% 20% Health and Hospitals Highways Public Safety Environment Interest on General Debt Other Total Debt Outstanding Long-term Debt Short-term Debt 2002 Debt Ratio Measures Per $1,000 Debt (billions) Per Capita of Personal Income Debt (billions) Percent of Total Debt (billions) Percent of Total Arkansas (State and Local)... $8.8 $3,233 $ $ % $ % United States... $1,681.4 $5,839 $ $1, % $ % Source: U.S. Bureau of the Census 34
39 THIS PAGE INTENTIONALLY LEFT BLANK 35
40 California Economic Indicars Average Annual Change CA US CA US CA US Per Capita Income... $23,203 $22,172 $35,172 $33, % 4.1% Median Household Income... $35,331 $32,264 $49,230 $44, % 3.2% Gross State Product (in millions)... $862,481 $6,865,513 $1,550,753 $11,665, % 5.4% Full- and Part-Time Positions (in thousands) 16, ,224 20, , % 1.6% Employed Persons (in thousands)... 13, ,060 16, , % 1.2% Unemployment Rate % 6.1% 6.2% 5.5% n/a n/a Sources: U.S. Bureau of the Census, U.S. Bureau of Economic Analysis, and the U.S. Bureau of Labor Statistics 2004 Population Under Age 18 Ages % 4% Males 27% 6% 6% Females 26% Ages Ages 75 and Over 64% 62% Population Poverty Rate Population and Poverty Percentage Change CA CA CA US CA US Total Population...31,317,179 35,893, % 12.8% 13.3% 13.1% Males...15,657,731 17,913, % 13.8% 12.2% 11.6% Under Age ,451,724 4,914, % 7.8% 18.8% 18.3% Ages ,789,760 11,380, % 16.7% 10.2% 9.6% Ages , , % 1.6% 6.5% 6.5% Ages 75 and Over , , % 28.8% 6.2% 6.8% Females... 15,659,448 17,980, % 11.9% 14.4% 14.5% Under Age ,220,380 4,682, % 8.1% 19.0% 18.6% Ages ,464,600 11,093, % 14.6% 13.6% 13.6% Ages ,075,189 1,053, % -3.6% 8.1% 9.7% Ages 75 and Over ,279 1,150, % 19.6% 9.8% 13.3% Source: U.S. Bureau of the Census 36
41 California Percent Distribution of Households by Age of Householder and Income, 2004 Less than $10,000 $10,000 $14,999 $15,000 $24,999 $25,000 $34,999 $35,000 $49,999 $50,000 $74,999 $75,000 $99,999 $100,000 or more All Households Age of Householder Under 25 years % 7.8% 18.6% 14.1% 18.4% 14.6% 6.3% 3.5% 100.0% years % 4.0% 9.2% 10.6% 15.6% 20.1% 13.7% 20.9% 100.0% years % 3.6% 7.6% 8.6% 12.8% 19.1% 14.1% 27.7% 100.0% 65 years and over % 10.7% 18.3% 13.7% 14.7% 14.2% 6.9% 10.7% 100.0% California (all ages) % 5.3% 10.8% 10.6% 14.6% 18.4% 12.2% 20.6% 100.0% United States (all ages). 8.9% 6.3% 12.3% 12.0% 15.5% 19.0% 11.1% 15.0% 100.0% Source: U.S. Bureau of the Census Percent of Households by Household Income Bracket, 2004 Percent of Households 25.0% 20.0% 15.0% 10.0% 5.0% 0.0% Less than $10,000 $10,000 $14,999 $15,000 $24,999 $25,000 $34,999 $35,000 $49,999 $50,000 $74,999 $75,000 $99,999 $100,000 or more California United States 37
42 State and Local General Revenues, FY 2002 California Average Annual Revenue Change General Revenues Per Capita Percent of Personal Income (millions) CA US CA US CA US Total General Revenues... $226,644 $6,478 $5, % 19.3% 5.8% 5.6% Own Sources... $178,394 $5,099 $4, % 15.2% 5.4% 5.2% Taxes... $120,424 $3,442 $3, % 10.4% 5.0% 4.9% Property Taxes... $30,243 $864 $ % 3.2% 3.6% 4.5% General Sales Taxes... $31,293 $894 $ % 2.6% 4.6% 5.4% Personal Income Taxes. $33,047 $945 $ % 2.3% 6.9% 5.8% Other Taxes... $25,842 $739 $ % 2.3% 5.1% 4.3% Charges/Miscellaneous... $57,970 $1,657 $1, % 4.8% 6.2% 5.7% Federal Aid... $48,250 $1,379 $1, % 4.1% 7.2% 7.2% Source: U.S. Bureau of the Census (2002 data are the most current available.) 1992 General Revenue 2002 General Revenue Property Taxes General Sales Taxes Personal Income Taxes Other Taxes 19% 16% 15% 21% 13% 14% Charges/Misc Federal Aid 25% 12% 13% 26% 11% 15% 38
43 California I. Personal Income Tax (2004) State Income Tax Base California s income tax base is linked federal adjusted gross income. Filing Requirements Taxpayers must file if they are required file if either California gross income or California adjusted gross income is more than the following income thresholds. Gross Income Thresholds Age and Filing Status Number of Dependents or more Under age 65 (single) $12,729 $21,562 $28,187 Under age 65 (married, filing jointly); both $25,457 $34,290 $40,915 spouses are under age 65 Age 65 and older (single) $16,979 $23,604 $28,904 Age 65 and older (married, filing jointly); both spouses are age 65 and older $33,957 $40,582 $45,882 Adjusted Gross Income Thresholds Age and Filing Status Number of Dependents or more Under age 65 (single) $10,183 $19,016 $25,641 Under age 65 (married, filing jointly); both $20,365 $29,198 $35,823 spouses are under age 65 Age 65 and older (single) $14,433 $21,058 $26,358 Age 65 and older (married, filing jointly); both spouses are age 65 and older $28,865 $35,490 $40,790 Sources: AARP 2005 telephone survey of state legislative staff, state departments of revenue, state controllers offices, state assessors offices, and state treasury offices. 39
44 California Rate Structure Single Married, Filing Jointly Taxable Income Rate Taxable Income Rate First $6, % First $12, % $6,148 - $14, % $12,295 - $29, % $14,572 - $22, % $29,143 - $45, % $22,998 - $31, % $45,995 - $63, % $31,926 - $40, % $63,851 - $80, % $40,347 and over 9.3% $80,693 and over 9.3% Public and Private Pension Exemptions... None Social Security Benefits... Full exemption Standard Deductions All ages... $3,165 (single); $6,330 (married, filing jointly) Personal Credits* Under age $85 (single); $170 (married, filing jointly; both spouses are under age 65) Age 65 or older... $170 (single); $340 (married, filing jointly; both spouses are age 65 or older) *Personal tax credits begin phase out for taxpayers whose federal adjusted gross income is more than $139,921 (single) or $279,846 (married, filing jointly). Renter Credit Renters whose income is $29,955 or less (single) or $59,910 or less (married, filing jointly) are eligible receive an income tax credit of $60 (single) or $120 (married, filing jointly). Local Income Taxes... None II. General Sales Tax Rates (2004) State % Combined state/local tax rates % 9.0% Sources: AARP 2005 telephone survey of state legislative staff, state departments of revenue, state controllers offices, state assessors offices, and state treasury offices. 40
45 California III. Miscellaneous Tax Rates (2004) Corporate income (highest marginal rate) % Gasoline (per gallon)... $0.18 Cigarette (per pack of 20)... $0.87 Beer (per gallon)... $0.20 All taxable income An additional 6.0% sales tax is levied. IV. Real Property Tax Relief Programs (2005) Homestead Exemption or Credit Requirements Benefits All homeowners... $7,000 assessed value Disabled veterans... $100,000 assessed value* Disabled veterans whose income is $44,907 or less... $150,000 assessed value* *Disabled veterans may not receive the $7,000 exemption for the general population if they are receiving the disabled veteran exemption. Circuit Breaker Requirements Benefits Homeowners and renters age 62 or older, blind, or disabled whose income is $39,699 or less... Homeowners: up $473 Renters: up $348 Deferral Program Requirements Benefits Homeowners age 62 or older, blind, or disabled whose income is $24,000 or less and who have at least a 20% equity in their home... Deferral of up all property taxes V. Real Property Tax Limits, Caps, or Freezes (2005) Growth in assessed property values for individual property owners cannot increase by more than 2% or the inflation rate (whichever is less). Property tax rates cannot exceed 1% of market value (this does not include bonded indebtedness). Sources: AARP 2005 telephone survey of state legislative staff, state departments of revenue, state controllers offices, state assessors offices, and state treasury offices. 41
46 California Local Expenditure Limits (2005) Local governments (excluding school districts and community colleges) cannot annually increase their expenditures by more than the increase in California per capita personal income or percentage growth in non-residential new construction (depending on local government) and population growth. School districts and community colleges cannot annually increase their expenditures by more than the increase in California per capita personal income and population growth. Voters can, if desired, approve higher expenditure growth, and the expenditure limit does not apply bonded indebtedness and may not apply emergencies. Sources: AARP 2005 telephone survey of state legislative staff, state departments of revenue, state controllers offices, state assessors offices, and state treasury offices. 42
47 California State and Local General Expenditures, FY 2002 General Expenditures Average Annual Expenditure Change Percent of Personal Per Capita Income (millions) CA US CA US CA US State/Local Direct General Expends... $238,503 $6,817 $6, % 19.9% 6.1% 5.9% To State/Local Government...$235,627 $6,734 $6, % 19.9% 6.2% 5.9% Education*... $76,827 $2,196 $2, % 6.8% 6.9% 6.2% Public Welfare... $35,559 $1,016 $ % 3.2% 5.8% 6.1% Health and Hospitals... $20,961 $599 $ % 1.7% 4.9% 5.2% Highways... $11,467 $328 $ % 1.3% 6.4% 5.5% Public Safety*... $27,229 $778 $ % 1.8% 6.2% 6.3% Environment... $15,258 $436 $ % 1.2% 5.0% 5.1% Interest on General Debt... $8,683 $248 $ % 0.9% 4.0% 3.1% Other... $39,642 $1,133 $ % 3.0% 6.7% 6.5% To Federal Government... $2,876 $82 $15 0.3% 0.1% 1.8% 1.9% *Education includes higher and lower education; public safety includes police, fire, corrections, and protection and inspection. Source: U.S. Bureau of the Census (2002 data are the most current available.) State and Local General Expenditures, FY 2002 (excluding payments federal government) 17% Education Public Welfare 4% 32% Health and Hospitals Highways 6% Public Safety Environment 12% Interest on General Debt 5% 9% 15% Other Total Debt Outstanding Long-term Debt Short-term Debt 2002 Debt Ratio Measures Per $1,000 Debt (billions) Per Capita of Personal Income Debt (billions) Percent of Total Debt (billions) Percent of Total California (State and Local)... $209.7 $5,993 $ $ % $ % United States... $1,681.4 $5,839 $ $1, % $ % Source: U.S. Bureau of the Census 43
48 Colorado Economic Indicars Average Annual Change CO US CO US CO US Per Capita Income... $23,004 $22,172 $36,109 $33, % 4.1% Median Household Income... $37,833 $32,264 $51,057 $44, % 3.2% Gross State Product (in millions)... $100,434 $6,865,513 $199,969 $11,665, % 5.4% Full- and Part-Time Positions (in thousands) 2, ,224 2, , % 1.6% Employed Persons (in thousands).. 1, ,060 2, , % 1.2% Unemployment Rate % 6.1% 5.5% 5.5% n/a n/a Sources: U.S. Bureau of the Census, U.S. Bureau of Economic Analysis, and the U.S. Bureau of Labor Statistics 2004 Population Under Age 18 5% 3% Males 26% Females 6% 6% 25% Ages Ages Ages 75 and Over 66% 63% Population Poverty Rate Population and Poverty Percentage Change CO CO CO US CO US Total Population... 3,653,910 4,601, % 12.8% 11.1% 13.1% Males... 1,810,412 2,321, % 13.8% 10.1% 11.6% Under Age , , % 7.8% 13.6% 18.3% Ages ,163,191 1,522, % 16.7% 9.1% 9.6% Ages , , % 1.6% 8.3% 6.5% Ages 75 and Over... 57,171 79, % 28.8% 3.1% 6.8% Females... 1,843,498 2,279, % 11.9% 12.2% 14.5% Under Age , , % 8.1% 15.5% 18.6% Ages ,159,573 1,448, % 14.6% 11.5% 13.6% Ages , , % -3.6% 9.8% 9.7% Ages 75 and Over... 98, , % 19.6% 7.3% 13.3% Source: U.S. Bureau of the Census 44
49 Colorado Percent Distribution of Households by Age of Householder and Income, 2004 Less than $10,000 $10,000 $14,999 $15,000 $24,999 $25,000 $34,999 $35,000 $49,999 $50,000 $74,999 $75,000 $99,999 $100,000 or more All Households Age of Householder Under 25 years % 9.0% 23.0% 19.7% 14.4% 10.5% 4.3% 1.4% 100.0% years % 3.0% 9.1% 11.4% 16.7% 21.8% 14.5% 16.7% 100.0% years % 3.0% 7.7% 9.3% 14.3% 22.2% 14.1% 23.8% 100.0% 65 years and over % 12.7% 18.7% 16.3% 16.6% 13.6% 5.4% 6.7% 100.0% Colorado (all ages) % 5.0% 11.2% 12.1% 15.7% 19.8% 12.1% 16.4% 100.0% United States (all ages). 8.9% 6.3% 12.3% 12.0% 15.5% 19.0% 11.1% 15.0% 100.0% Source: U.S. Bureau of the Census Percent of Households by Household Income Bracket, 2004 Percent of Households 25.0% 20.0% 15.0% 10.0% 5.0% 0.0% Less than $10,000 $10,000 $14,999 $15,000 $24,999 $25,000 $34,999 $35,000 $49,999 $50,000 $74,999 $75,000 $99,999 $100,000 or more Colorado United States 45
50 State and Local General Revenues, FY 2002 Colorado Average Annual Revenue Change General Revenues Per Capita Percent of Personal Income (millions) CO US CO US CO US Total General Revenues... $26,041 $5,789 $5, % 19.3% 7.3% 5.6% Own Sources... $21,772 $4,840 $4, % 15.2% 7.2% 5.2% Taxes... $13,900 $3,090 $3, % 10.4% 7.0% 4.9% Property Taxes... $4,162 $925 $ % 3.2% 5.9% 4.5% General Sales Taxes... $4,128 $918 $ % 2.6% 8.2% 5.4% Personal Income Taxes. $3,476 $773 $ % 2.3% 8.0% 5.8% Other Taxes... $2,134 $475 $ % 2.3% 5.7% 4.3% Charges/Miscellaneous... $7,872 $1,750 $1, % 4.8% 7.7% 5.7% Federal Aid... $4,269 $949 $1, % 4.1% 7.4% 7.2% Source: U.S. Bureau of the Census (2002 data are the most current available.) 1992 General Revenue 2002 General Revenue Property Taxes General Sales Taxes Personal Income Taxes Other Taxes 16% 18% 15% 16% 16% 16% Charges/Misc 30% 31% Federal Aid 12% 13% 9% 8% 46
51 Colorado I. Personal Income Tax (2004) State Income Tax Base Colorado s income tax base is linked federal taxable income. Filing Requirements Taxpayers must file a tax return if they are required file a federal income tax return or if they have a current-year Colorado income tax liability. Rate Structure 4.63% of federal taxable income Public and Private Pension Exemptions... $20,000 for persons ages $24,000 for persons age 65 or older Social Security Benefits The $20,000 (ages 55 64) or $24,000 (age 65 or older) pension exemption also includes Social Security benefits the extent included in federal taxable income. If pension income and Social Security benefits exceed the pension exemptions, the excess income is taxed. Only taxpayers whose provisional income* is $25,000 or higher (single) or $32,000 or higher (married, filing jointly) are subject taxation of their Social Security benefits. *Provisional income consists of federal adjusted gross income, tax-exempt interest, certain foreign-source income, and one-half of the taxpayer s Social Security or Railroad Retirement Tier 1 benefit (U.S. House Committee on the Budget, Omnibus Budget Reconciliation Act of 1993, 103 rd Congress, 1 st sess., 1993, Conference Report , p. 594). Standard Deductions and Personal Exemptions Combined* Under age 65*... $7,950 (single); $15,900 (married, filing jointly; both spouses are under age 65) Age 65 or older*... $9,150 (single); $17,800 (married, filing jointly; both spouses are age 65 or older) *Personal exemptions equal $3,100 per exemption (single have one exemption and married couples have two). Taxpayers with federal adjusted gross income greater than $142,700 (single) or $214,050 (married, filing jointly) receive lower personal exemption amounts. Medical Savings Accounts... Taxpayers can deduct contributions and interest that were not already deducted on the federal return. Sources: AARP 2005 telephone survey of state legislative staff, state departments of revenue, state controllers offices, state assessors offices, and state treasury offices. 47
52 Colorado Interest Deduction... Interest on obligations of the United States that were part of federal taxable income. Capital Gains Deduction... Some capital gains income included in federal taxable income is deductible. Long-Term Care Insurance Premiums Credit Eligible taxpayers can claim a tax credit of 25% of their insurance premiums up a maximum of $150 per policy. Taxpayers need have a federal taxable income of less than $50,000 (single filers and married, filing jointly for one insurance policy) qualify for the credit. Local Income Taxes... None II. General Sales Tax Rates (2004) State % Combined state/local tax rates % 9.2% III. Miscellaneous Tax Rates (2004) Corporate income (highest marginal rate) % All taxable income Gasoline (per gallon)... $0.22 Cigarette (per pack of 20)... $0.20 Local taxes, where levied, are additional. Beer (per gallon)... $0.08 IV. Real Property Tax Relief Programs (2005) Homestead Exemption or Credit... None Circuit Breaker Requirements Benefits Homeowners and renters age 65 or older, disabled, or surviving spouse age 58 or older whose income is $11,000 or less (single) or $14,700 or less (married couples)... Up $600 Deferral Program* Requirements Benefits Homeowners age 65 or older... Full deferral of property taxes *Colorado also has an additional local option program work pay off tax liability. Sources: AARP 2005 telephone survey of state legislative staff, state departments of revenue, state controllers offices, state assessors offices, and state treasury offices. 48
53 Colorado V. Real Property Tax Limits, Caps, or Freezes (2005) Real Property Tax Rate Limits Local taxing districts cannot increase real property tax rates from the previous year without voter approval. Real Property Tax Limits Except for local growth, local taxing districts cannot annually increase property taxes by more than the inflation rate. This inflation limit may be exceeded with voter approval, such as bonded indebtedness. Local growth for school districts is the percentage change in school enrollment; local growth for other local governments is the growth in new property value. Counties, cities, and wns not chartered as home rule cannot raise property taxes more than 5.5% above the previous year s revenue. This limitation may be exceeded by capital expenditures and bonded indebtedness. Moreover, it does not apply property additions and improvements. All taxing entities must obtain voter approval exceed the 5.5% limit. Sources: AARP 2005 telephone survey of state legislative staff, state departments of revenue, state controllers offices, state assessors offices, and state treasury offices. 49
54 State and Local General Expenditures, FY 2002 General Expenditures Colorado Average Annual Expenditure Change Percent of Personal Per Capita Income (millions) CO US CO US CO US State/Local Direct General Expends... $27,102 $6,025 $6, % 19.9% 7.6% 5.9% To State/Local Government... $27,099 $6,024 $6, % 19.9% 7.6% 5.9% Education*... $9,011 $2,003 $2, % 6.8% 6.9% 6.2% Public Welfare... $2,823 $628 $ % 3.2% 6.3% 6.1% Health and Hospitals... $2,040 $454 $ % 1.7% 9.0% 5.2% Highways... $2,836 $630 $ % 1.3% 10.4% 5.5% Public Safety*... $2,470 $549 $ % 1.8% 8.0% 6.3% Environment... $1,790 $398 $ % 1.2% 8.1% 5.1% Interest on General Debt... $1,258 $280 $ % 0.9% 3.1% 3.1% Other... $4,870 $1,083 $ % 3.0% 9.1% 6.5% To Federal Government... $4 $1 $15 0.0% 0.1% -13.9% 1.9% *Education includes higher and lower education; public safety includes police, fire, corrections, and protection and inspection. Source: U.S. Bureau of the Census (2002 data are the most current available.) State and Local General Expenditures, FY 2002 (excluding payments federal government) 18% Education Public Welfare 33% Health and Hospitals 5% Highways 7% Public Safety Environment 9% 10% 8% 10% Interest on General Debt Other Total Debt Outstanding Long-term Debt Short-term Debt 2002 Debt Ratio Measures Per $1,000 Debt (billions) Per Capita of Personal Income Debt (billions) Percent of Total Debt (billions) Percent of Total Colorado (State and Local)... $28.5 $6,328 $ $ % $ % United States... $1,681.4 $5,839 $ $1, % $ % Source: U.S. Bureau of the Census 50
55 THIS PAGE INTENTIONALLY LEFT BLANK 51
56 Connecticut Economic Indicars Average Annual Change CT US CT US CT US Per Capita Income... $29,693 $22,172 $45,506 $33, % 4.1% Median Household Income... $41,097 $32,264 $55,390 $44, % 3.2% Gross State Product (in millions)... $111,171 $6,865,513 $185,802 $11,665, % 5.4% Full- and Part-Time Positions (in thousands) 1, ,224 2, , % 1.6% Employed Persons (in thousands).. 1, ,060 1, , % 1.2% Unemployment Rate % 6.1% 4.9% 5.5% n/a n/a Sources: U.S. Bureau of the Census, U.S. Bureau of Economic Analysis, and the U.S. Bureau of Labor Statistics 2004 Population Under Age 18 6% 6% Males 25% 7% 9% Females 23% Ages Ages Ages 75 and Over 63% 61% Population Poverty Rate Population and Poverty Percentage Change CT CT CT US CT US Total Population... 3,268,346 3,503, % 12.8% 7.6% 13.1% Males... 1,583,906 1,700, % 13.8% 6.9% 11.6% Under Age , , % 7.8% 12.3% 18.3% Ages ,452 1,080, % 16.7% 5.2% 9.6% Ages ,953 96, % 1.6% 2.6% 6.5% Ages 75 and Over... 74,520 94, % 28.8% 5.5% 6.8% Females... 1,684,440 1,803, % 11.9% 8.2% 14.5% Under Age , , % 8.1% 8.6% 18.6% Ages ,022,809 1,111, % 14.6% 8.1% 13.6% Ages , , % -3.6% 5.7% 9.7% Ages 75 and Over , , % 19.6% 10.8% 13.3% Source: U.S. Bureau of the Census 52
57 Connecticut Percent Distribution of Households by Age of Householder and Income, 2004 Less than $10,000 $10,000 $14,999 $15,000 $24,999 $25,000 $34,999 $35,000 $49,999 $50,000 $74,999 $75,000 $99,999 $100,000 or more All Households Age of Householder Under 25 years % 14.5% 14.2% 10.9% 13.1% 16.5% 7.2% 4.4% 100.0% years % 2.7% 5.7% 7.6% 13.8% 23.3% 16.1% 26.4% 100.0% years % 2.9% 5.5% 6.7% 12.6% 17.8% 15.2% 34.1% 100.0% 65 years and over % 9.8% 17.1% 13.9% 13.9% 14.1% 9.0% 11.4% 100.0% Connecticut (all ages) % 4.7% 8.4% 8.7% 13.3% 19.0% 13.9% 25.4% 100.0% United States (all ages). 8.9% 6.3% 12.3% 12.0% 15.5% 19.0% 11.1% 15.0% 100.0% Source: U.S. Bureau of the Census Percent of Households by Household Income Bracket, 2004 Percent of Households 30.0% 25.0% 20.0% 15.0% 10.0% 5.0% 0.0% Less than $10,000 $10,000 $14,999 $15,000 $24,999 $25,000 $34,999 $35,000 $49,999 $50,000 $74,999 $75,000 $99,999 $100,000 or more Connecticut United States 53
58 State and Local General Revenues, FY 2002 Connecticut Average Annual Revenue Change General Revenues Per Capita Percent of Personal Income (millions) CT US CT US CT US Total General Revenues... $22,805 $6,593 $5, % 19.3% 4.1% 5.6% Own Sources... $18,766 $5,425 $4, % 15.2% 3.9% 5.2% Taxes... $15,125 $4,373 $3, % 10.4% 4.0% 4.9% Property Taxes... $5,995 $1,733 $ % 3.2% 3.8% 4.5% General Sales Taxes... $3,044 $880 $ % 2.6% 3.8% 5.4% Personal Income Taxes. $3,685 $1,065 $ % 2.3% 7.0% 5.8% Other Taxes... $2,400 $694 $ % 2.3% 1.1% 4.3% Charges/Miscellaneous... $3,641 $1,053 $1, % 4.8% 3.3% 5.7% Federal Aid... $4,039 $1,168 $1, % 4.1% 5.0% 7.2% Source: U.S. Bureau of the Census (2002 data are the most current available.) 1992 General Revenue 2002 General Revenue Property Taxes General Sales Taxes Personal Income Taxes Other Taxes 17% 16% 27% 16% 18% 26% Charges/Misc Federal Aid 14% 12% 14% 11% 16% 13% 54
59 Connecticut I. Personal Income Tax (2004) State Income Tax Base Connecticut s income tax base is linked federal adjusted gross income. Filing Requirements Taxpayers must file a tax return if they had Connecticut income tax withheld, or made estimated tax payments Connecticut, or had a federal alternative minimum tax liability, or if their gross income exceeds $12,625 (single) or $24,000 (married, filing jointly). Rate Structure Single Married, Filing Jointly Taxable Income Rate Taxable Income Rate First $10, % First $20, % Over $10, % Over $20, % Public and Private Pension Exemptions... None Social Security Benefits Only taxpayers whose federal adjusted gross income is $50,000 or higher (single) or $60,000 or higher (married, filing jointly) are subject taxation of their Social Security benefits. For those taxpayers who are taxed, up 25% of their benefits can be taxed. Personal Exemptions All ages... Ranges from $0 $12,750 (single) and $0 $24,000 (married, filing jointly), depending on adjusted gross income Personal Tax Credits Taxpayers whose Connecticut adjusted gross income is between $12,750 and $55,500 (single) and between $24,000 and $100,500 (married, filing jointly) receive tax credits ranging from 75% 1%, depending on income. Tax credit percentages decrease as income increases. Taxpayers with adjusted gross incomes of less than $12,750 (single) or $24,000 (married, filing jointly) do not have pay taxes due personal exemptions. Local Income Taxes... None Sources: AARP 2005 telephone survey of state legislative staff, state departments of revenue, state controllers offices, state assessors offices, and state treasury offices. 55
60 Connecticut II. General Sales Tax Rates (2004) State % Combined state/local tax rates % III. Miscellaneous Tax Rates (2004) Corporate income (highest marginal rate) % All taxable income Gasoline (per gallon)... $0.25 Cigarette (per pack of 20)... $1.51 Beer (per gallon)... $0.20 IV. Real Property Tax Relief Programs (2005) Homestead Exemption or Credit Requirements Benefits Homeowners age 65 or older or fully disabled homeowners... Local option property tax relief Circuit Breaker* Requirements Benefits Homeowners and renters age 65 or older, fully disabled, or surviving spouses 50 or older whose income is $27,700 or less (single) or $33,900 or less (married couples)... Up $1,000 (single) or $1,250 (married couples); renters receive 35% of rent and utilities up $700 (single) or $900 (married couples) *Connecticut also offers a circuit breaker program whereby residents of all ages and incomes are eligible for an income tax credit of up $350 off their real estate or car tax. Deferral Program... None V. Real Property Tax Limits, Caps, or Freezes (2005) No statewide limits, caps, or freezes are provided. Sources: AARP 2005 telephone survey of state legislative staff, state departments of revenue, state controllers offices, state assessors offices, and state treasury offices. 56
61 Connecticut State and Local General Expenditures, FY 2002 General Expenditures Average Annual Expenditure Change Percent of Personal Per Capita Income (millions) CT US CT US CT US State/Local Direct General Expends... $24,199 $6,996 $6, % 19.9% 4.5% 5.9% To State/Local Government... $24,199 $6,996 $6, % 19.9% 4.5% 5.9% Education*... $7,852 $2,270 $2, % 6.8% 5.0% 6.2% Public Welfare... $3,472 $1,004 $ % 3.2% 3.4% 6.1% Health and Hospitals... $1,903 $550 $ % 1.7% 5.2% 5.2% Highways... $1,224 $354 $ % 1.3% 1.0% 5.5% Public Safety*... $1,974 $571 $ % 1.8% 4.4% 6.3% Environment... $1,135 $328 $ % 1.2% 3.1% 5.1% Interest on General Debt... $1,429 $413 $ % 0.9% 4.2% 3.1% Other... $5,210 $1,506 $ % 3.0% 6.1% 6.5% To Federal Government... $0 $0 $15 0.0% 0.1% 0.0% 1.9% *Education includes higher and lower education; public safety includes police, fire, corrections, and protection and inspection. Source: U.S. Bureau of the Census (2002 data are the most current available.) State and Local General Expenditures, FY 2002 (excluding payments federal government) Education 22% Public Welfare 32% Health and Hospitals Highways 6% Public Safety 5% Environment Interest on General Debt 8% 5% 8% 14% Other Total Debt Outstanding Long-term Debt Short-term Debt 2002 Debt Ratio Measures Per $1,000 Debt (billions) Per Capita of Personal Income Debt (billions) Percent of Total Debt (billions) Percent of Total Connecticut (State and Local)... $27.8 $8,028 $ $ % $ % United States... $1,681.4 $5,839 $ $1, % $ % Source: U.S. Bureau of the Census 57
62 Delaware Economic Indicars Average Annual Change DE US DE US DE US Per Capita Income... $23,530 $22,172 $35,559 $33, % 4.1% Median Household Income... $35,873 $32,264 $47,968 $44, % 3.2% Gross State Product (in millions)... $25,128 $6,865,513 $54,274 $11,665, % 5.4% Full- and Part-Time Positions (in thousands) , , % 1.6% Employed Persons (in thousands) , , % 1.2% Unemployment Rate % 6.1% 4.1% 5.5% n/a n/a Sources: U.S. Bureau of the Census, U.S. Bureau of Economic Analysis, and the U.S. Bureau of Labor Statistics 2004 Population Under Age 18 7% 5% Males 25% 7% 7% Females 22% Ages Ages Ages 75 and Over 63% 64% Population Poverty Rate Population and Poverty Percentage Change DE DE DE US DE US Total Population , , % 12.8% 9.9% 13.1% Males , , % 13.8% 8.7% 11.6% Under Age ,218 99, % 7.8% 14.1% 18.3% Ages , , % 16.7% 7.4% 9.6% Ages ,009 26, % 1.6% 4.3% 6.5% Ages 75 and Over... 12,933 19, % 28.8% 4.1% 6.8% Females , , % 11.9% 11.1% 14.5% Under Age ,115 94, % 8.1% 13.5% 18.6% Ages , , % 14.6% 10.6% 13.6% Ages ,458 31, % -3.6% 9.0% 9.7% Ages 75 and Over... 22,794 31, % 19.6% 9.9% 13.3% Source: U.S. Bureau of the Census 58
63 Delaware Percent Distribution of Households by Age of Householder and Income, 2004 Less than $10,000 $10,000 $14,999 $15,000 $24,999 $25,000 $34,999 $35,000 $49,999 $50,000 $74,999 $75,000 $99,999 $100,000 or more All Households Age of Householder Under 25 years % 6.5% 16.7% 19.0% 18.8% 15.1% 5.0% 0.3% 100.0% years % 3.9% 8.6% 11.1% 16.1% 23.8% 14.9% 17.2% 100.0% years % 4.4% 7.1% 8.3% 13.9% 22.0% 16.7% 22.3% 100.0% 65 years and over % 10.1% 20.2% 15.3% 15.3% 14.5% 7.0% 7.6% 100.0% Delaware (all ages) % 5.5% 10.9% 11.4% 15.3% 20.8% 13.4% 16.2% 100.0% United States (all ages). 8.9% 6.3% 12.3% 12.0% 15.5% 19.0% 11.1% 15.0% 100.0% Source: U.S. Bureau of the Census Percent of Households by Household Income Bracket, 2004 Percent of Households 25.0% 20.0% 15.0% 10.0% 5.0% 0.0% Less than $10,000 $10,000 $14,999 $15,000 $24,999 $25,000 $34,999 $35,000 $49,999 $50,000 $74,999 $75,000 $99,999 $100,000 or more Delaware United States 59
64 State and Local General Revenues, FY 2002 Delaware Average Annual Revenue Change General Revenues Per Capita Percent of Personal Income (millions) DE US DE US DE US Total General Revenues... $5,600 $6,947 $5, % 19.3% 6.4% 5.6% Own Sources... $4,641 $5,757 $4, % 15.2% 6.0% 5.2% Taxes... $2,687 $3,333 $3, % 10.4% 5.2% 4.9% Property Taxes... $400 $496 $ % 3.2% 5.8% 4.5% General Sales Taxes... $0 $0 $ % 2.6% 0.0% 5.4% Personal Income Taxes.. $763 $947 $ % 2.3% 3.8% 5.8% Other Taxes... $1,524 $1,890 $ % 2.3% 5.8% 4.3% Charges/Miscellaneous... $1,954 $2,424 $1, % 4.8% 7.3% 5.7% Federal Aid... $959 $1,190 $1, % 4.1% 8.1% 7.2% Source: U.S. Bureau of the Census (2002 data are the most current available.) 1992 General Revenue 2002 General Revenue Property Taxes 15% 8% 17% 7% Personal Income Taxes Other Taxes 17% 14% Charges/Misc 31% Federal Aid 35% 27% 29% 60
65 Delaware I. Personal Income Tax (2004) State Income Tax Base Delaware s income tax base is linked federal adjusted gross income. Filing Requirements Taxpayers must file a tax return if their gross income exceeds the following amounts: Filing Status Gross Income Filing Status Gross Income Single, under age 60 $9,400 Married, filing jointly, under age 60 Single, ages $12,200 Married, filing jointly, ages Single, age 65 or older $14,700 Married, filing jointly, age 65 or older $15,450 $17,950 $20,450 Rate Structure All Taxpayers Taxable Income Rate Taxable Income Rate $0 - $2, % $20,000 - $25, % $2,000 - $5, % $25,000 - $60, % $5,000 - $10, % Over $60, % $10,000 - $20, % Public and Private Pension Exemptions... $12,500 for persons age 60 or older $2,000 for persons under age 60 Social Security Benefits... Full exemption Standard Deductions Under age $3,250 (single); $6,500 (married, filing jointly) Age 65 or older... $5,750 (single); $11,500 (married, filing jointly; both spouses are age 65 or older) Sources: AARP 2005 telephone survey of state legislative staff, state departments of revenue, state controllers offices, state assessors offices, and state treasury offices. 61
66 Delaware Deduction for Persons Age 60 or Older or Disabled Persons age 60 or older or disabled can receive a $2,000 (single) or $4,000 (married, filing jointly) deduction if their annual earnings are less than $2,500 (single) or $5,000 (married, filing jointly) and their other deductions (excluding the standard or itemized deduction) are $10,000 (single) or $20,000 (married, filing jointly) or less. Personal Tax Credits Under age $110 (single); $220 (married, filing jointly) Age 60 or older... $220 (single); $440 (married, filing jointly) Local Income Taxes... The city of Wilmingn has a 1.25% wage tax. II. General Sales Tax Rates (2004) No state or local general sales tax is levied. III. Miscellaneous Tax Rates (2004) Corporate income (highest marginal rate) % All taxable income Gasoline (per gallon)... $0.23 Cigarette (per pack of 20)... $0.55 Beer (per gallon)... $0.156 IV. Real Property Tax Relief Programs (2005) Homestead Exemption or Credit Requirements Benefits Homeowners age 65 or older... Up a 50% tax credit or $500 (whichever is less) on school property taxes* *The homestead credit is a local option program. Some localities offer homestead exemptions for nonschool property taxes for homeowners age 65 or older or disabled. Circuit Breaker... None Deferral Program... None Sources: AARP 2005 telephone survey of state legislative staff, state departments of revenue, state controllers offices, state assessors offices, and state treasury offices. 62
67 Delaware V. Real Property Tax Limits, Caps, or Freezes (2005) When property is reassessed, tal county property tax revenues for taxing districts cannot increase by more than 15% from the previous year. This limitation does not include new construction and new additions existing property. Moreover, when property is reassessed, tal school property taxes cannot increase by more than 10% from the previous year. Voters can approve an increase higher than the 10% limit in subsequent years. Sources: AARP 2005 telephone survey of state legislative staff, state departments of revenue, state controllers offices, state assessors offices, and state treasury offices. 63
68 Delaware State and Local General Expenditures, FY 2002 General Expenditures Average Annual Expenditure Change Percent of Per Capita Personal Income (millions) DE US DE US DE US State/Local Direct General Expends... $5,358 $6,647 $6, % 19.9% 6.2% 5.9% To State/Local Government... $5,357 $6,645 $6, % 19.9% 6.2% 5.9% Education*... $1,937 $2,402 $2, % 6.8% 5.9% 6.2% Public Welfare... $659 $818 $ % 3.2% 8.5% 6.1% Health and Hospitals... $327 $405 $ % 1.7% 7.5% 5.2% Highways... $464 $576 $ % 1.3% 5.5% 5.5% Public Safety*... $512 $636 $ % 1.8% 7.6% 6.3% Environment... $300 $372 $ % 1.2% 3.3% 5.1% Interest on General Debt... $326 $405 $ % 0.9% 1.2% 3.1% Other... $831 $1,031 $ % 3.0% 8.7% 6.5% To Federal Government... $1 $1 $15 0.0% 0.1% 2.6% 1.9% *Education includes higher and lower education; public safety includes police, fire, corrections, and protection and inspection. Source: U.S. Bureau of the Census (2002 data are the most current available.) State and Local General Expenditures, FY 2002 (excluding payments federal government) 16% Education Public Welfare 6% 6% 10% 35% Health and Hospitals Highways Public Safety Environment 9% 6% 12% Interest on General Debt Other Total Debt Outstanding Long-term Debt Short-term Debt 2002 Debt Ratio Measures Per $1,000 Debt (billions) Per Capita of Personal Income Debt (billions) Percent of Total Debt (billions) Percent of Total Delaware (State and Local)... $5.5 $6,864 $ $ % $ % United States... $1,681.4 $5,839 $ $1, % $ % Source: U.S. Bureau of the Census 64
69 THIS PAGE INTENTIONALLY LEFT BLANK 65
70 District of Columbia Economic Indicars Average Annual Change DC US DC US DC US Per Capita Income... $30,835 $22,172 $52,101 $33, % 4.1% Median Household Income... $30,116 $32,264 $43,426 $44, % 3.2% Gross State Product (in millions)... $46,842 $6,865,513 $76,685 $11,665, % 5.4% Full- and Part-Time Positions (in thousands) , , % 1.6% Employed Persons (in thousands) , , % 1.2% Unemployment Rate % 6.1% 8.2% 5.5% n/a n/a Sources: U.S. Bureau of the Census, U.S. Bureau of Economic Analysis, and the U.S. Bureau of Labor Statistics 2004 Population Under Age 18 6% 4% Males 21% 7% 7% Females 19% Ages Ages Ages 75 and Over 69% 67% Population Poverty Rate Population and Poverty Percentage Change DC DC DC US DC US Total Population , , % 12.8% 18.9% 13.1% Males , , % 13.8% 16.8% 11.6% Under Age ,800 55, % 7.8% 35.3% 18.3% Ages , , % 16.7% 11.9% 9.6% Ages ,483 14, % 1.6% 9.6% 6.5% Ages 75 and Over... 10,974 11, % 28.8% 9.1% 6.8% Females , , % 11.9% 20.8% 14.5% Under Age ,433 54, % 8.1% 32.5% 18.6% Ages , , % 14.6% 18.1% 13.6% Ages ,582 19, % -3.6% 15.3% 9.7% Ages 75 and Over... 22,638 21, % 19.6% 19.8% 13.3% Source: U.S. Bureau of the Census 66
71 District of Columbia Percent Distribution of Households by Age of Householder and Income, 2004 Less than $10,000 $10,000 $14,999 $15,000 $24,999 $25,000 $34,999 $35,000 $49,999 $50,000 $74,999 $75,000 $99,999 $100,000 or more All Households Age of Householder Under 25 years % 7.4% 14.9% 13.0% 16.3% 11.2% 3.3% 3.9% 100.0% years % 4.5% 8.6% 10.2% 18.1% 16.7% 10.9% 21.3% 100.0% years % 4.2% 8.4% 7.4% 12.3% 17.3% 11.0% 28.2% 100.0% 65 years and over % 9.4% 15.1% 13.2% 11.7% 12.8% 8.9% 12.2% 100.0% District of Columbia (all ages). 12.6% 5.4% 10.0% 10.0% 15.0% 15.9% 10.2% 20.9% 100.0% United States (all ages) % 6.3% 12.3% 12.0% 15.5% 19.0% 11.1% 15.0% 100.0% Source: U.S. Bureau of the Census Percent of Households by Household Income Bracket, 2004 Percent of Households 25.0% 20.0% 15.0% 10.0% 5.0% 0.0% Less than $10,000 $10,000 $14,999 $15,000 $24,999 $25,000 $34,999 $35,000 $49,999 $50,000 $74,999 $75,000 $99,999 $100,000 or more District of Columbia United States 67
72 State and Local General Revenues, FY 2002 District of Columbia Average Annual Revenue Change General Revenues Per Capita Percent of Personal Income (millions) DC US DC US DC US Total General Revenues... $6,922 $12,260 $5, % 19.3% 3.9% 5.6% Own Sources... $4,082 $7,230 $4, % 15.2% 3.4% 5.2% Taxes... $3,228 $5,717 $3, % 10.4% 3.0% 4.9% Property Taxes... $803 $1,423 $ % 3.2% -1.2% 4.5% General Sales Taxes... $558 $989 $ % 2.6% 2.4% 5.4% Personal Income Taxes. $949 $1,681 $ % 2.3% 4.2% 5.8% Other Taxes... $917 $1,624 $ % 2.3% 7.8% 4.3% Charges/Miscellaneous... $854 $1,513 $1, % 4.8% 4.9% 5.7% Federal Aid... $2,840 $5,030 $1, % 4.1% 4.8% 7.2% Source: U.S. Bureau of the Census (2002 data are the most current available.) 1992 General Revenue 2002 General Revenue Property Taxes General Sales Taxes Personal Income Taxes Other Taxes 39% 19% 9% 41% 12% 8% 14% Charges/Misc Federal Aid 11% 9% 13% 12% 13% 68
73 District of Columbia I. Personal Income Tax (2004) State Income Tax Base The District of Columbia s income tax base is linked federal adjusted gross income. Filing Requirements Taxpayers must file if they are required file a federal return. Rate Structure All Taxpayers Taxable Income Rate First $10, % $10,000 - $30, % Over $30, % Public Pension Exemption... $3,000 for persons age 62 or older Private Pension Exemption... None Social Security Benefits... Full exemption Standard Deductions and Personal Exemptions Combined Under age $3,370 (single); $4,740 (married, filing jointly; both spouses are under age 65) Age 65 or older... $4,740 (single); $7,480 (married, filing jointly; both spouses are age 65 or older) Local Income Taxes... Not applicable II. General Sales Tax Rates (2004) General sales tax rate % Sources: AARP 2005 telephone survey of state legislative staff, state departments of revenue, state controllers offices, state assessors offices, and state treasury offices. 69
74 District of Columbia III. Miscellaneous Tax Rates (2004) Corporate income (highest marginal rate) % Includes two 2.5% surtaxes Gasoline (per gallon)... $0.20 Cigarette (per pack of 20)... $1.00 Beer (per gallon)...$0.09 IV. Real Property Tax Relief Programs (2005) Homestead Exemption or Credit Requirements Benefits All homeowners... $38,000 assessed value (changes $60,000 for bills payable in 2006) Homeowners age 65 or older whose income is $100,000 or less... 50% reduction in tax liability Circuit Breaker Requirements Benefits Homeowners and renters whose income is $20,000 or less... Up a $750 tax credit Deferral Program Requirements Benefits All homeowners... Defer taxes owed in excess of 110% of prior tax liability Sources: AARP 2005 telephone survey of state legislative staff, state departments of revenue, state controllers offices, state assessors offices, and state treasury offices. 70
75 District of Columbia Homeowners whose income is less than $50, Defer taxes owed in excess of prior year s taxes as long as the tal amount of deferred taxes (plus accrued interest) does not equal or exceed 25% of the assessed property value (program starts in 2006) Homeowners age 65 or older whose income is less than $50, Defer all property taxes owed until the tal amount of deferred taxes (plus accrued interest) equals or exceeds 25% of the assessed property value (starting in 2006) V. Real Property Tax Limits, Caps, or Freezes (2005) Homeowners do not have pay property taxes on any assessments that exceed 12% of the prior year s assessment. This effectively limits property tax assessments a 12% annual increase. The 12% limit changes 10% for bills payable in Homeowners who have lived in their home for at least seven consecutive years and whose household income equaled or was less than $29,680 (one household member) $59,360 (eight household members) are eligible for limiting annual increases in their property taxes no more than 5%. This is accomplished through an income tax credit equal the amount of property taxes exceeding a 5% annual increase. Sources: AARP 2005 telephone survey of state legislative staff, state departments of revenue, state controllers offices, state assessors offices, and state treasury offices. 71
76 State and Local General Expenditures, FY 2002 General Expenditures District of Columbia Average Annual Expenditure Change Percent of Personal Per Capita Income (millions) DC US DC US DC US State/Local Direct General Expends... $6,180 $10,944 $6, % 19.9% 3.4% 5.9% To State/Local Government... $6,180 $10,944 $6, % 19.9% 3.4% 5.9% Education*... $1,175 $2,081 $2, % 6.8% 4.7% 6.2% Public Welfare... $1,462 $2,590 $ % 3.2% 5.3% 6.1% Health and Hospitals... $555 $983 $ % 1.7% 0.4% 5.2% Highways... $69 $123 $ % 1.3% -5.5% 5.5% Public Safety*... $756 $1,340 $ % 1.8% 0.3% 6.3% Environment... $557 $987 $ % 1.2% 9.3% 5.1% Interest on General Debt... $236 $418 $ % 0.9% 0.0% 3.1% Other... $1,369 $2,424 $ % 3.0% 3.7% 6.5% To Federal Government... $0 $0 $15 0.0% 0.1% 0.0% 1.9% *Education includes higher and lower education; public safety includes police, fire, corrections, and protection and inspection. Source: U.S. Bureau of the Census (2002 data are the most current available.) State and Local General Expenditures, FY 2002 (excluding payments federal government) 22% 19% Education Public Welfare Health and Hospitals Highways 4% Public Safety 9% 24% Environment Interest on General Debt 12% 1% 9% Other Total Debt Outstanding Long-term Debt Short-term Debt 2002 Debt Ratio Measures Per $1,000 Debt (billions) Per Capita of Personal Income Debt (billions) Percent of Total Debt (billions) Percent of Total District of Columbia (State and Local).. $5.4 $9,627 $ $ % $ % United States... $1,681.4 $5,839 $ $1, % $ % Source: U.S. Bureau of the Census 72
77 THIS PAGE INTENTIONALLY LEFT BLANK 73
78 Florida Economic Indicars Average Annual Change FL US FL US FL US Per Capita Income... $21,666 $22,172 $31,460 $33, % 4.1% Median Household Income... $29,294 $32,264 $40,554 $44, % 3.2% Gross State Product (in millions)... $322,073 $6,865,513 $599,068 $11,665, % 5.4% Full- and Part-Time Positions (in thousands) 7, ,224 9, , % 1.6% Employed Persons (in thousands)... 6, ,060 7, , % 1.2% Unemployment Rate % 6.1% 4.8% 5.5% n/a n/a Sources: U.S. Bureau of the Census, U.S. Bureau of Economic Analysis, and the U.S. Bureau of Labor Statistics 2004 Population Under Age 18 8% 7% Males 24% 9% 10% Females 22% Ages Ages Ages 75 and Over 61% 59% Population Poverty Rate Population and Poverty Percentage Change FL FL FL US FL US Total Population...13,961,798 17,397, % 12.8% 12.2% 13.1% Males... 6,762,583 8,524, % 13.8% 10.6% 11.6% Under Age ,685,119 2,049, % 7.8% 18.2% 18.3% Ages ,967,583 5,199, % 16.7% 8.5% 9.6% Ages , , % 1.6% 7.5% 6.5% Ages 75 and Over , , % 28.8% 6.3% 6.8% Females... 7,199,215 8,872, % 11.9% 13.7% 14.5% Under Age ,603,454 1,953, % 8.1% 17.1% 18.6% Ages ,116,853 5,266, % 14.6% 13.0% 13.6% Ages , , % -3.6% 10.4% 9.7% Ages 75 and Over , , % 19.6% 13.0% 13.3% Source: U.S. Bureau of the Census 74
79 Florida Percent Distribution of Households by Age of Householder and Income, 2004 Less than $10,000 $10,000 $14,999 $15,000 $24,999 $25,000 $34,999 $35,000 $49,999 $50,000 $74,999 $75,000 $99,999 $100,000 or more All Households Age of Householder Under 25 years % 7.5% 19.1% 20.9% 17.0% 12.3% 3.2% 1.1% 100.0% years % 4.4% 11.4% 14.0% 17.7% 22.4% 11.7% 12.8% 100.0% years % 5.2% 10.6% 11.5% 16.0% 20.3% 11.3% 18.3% 100.0% 65 years and over % 12.6% 20.0% 14.8% 15.6% 13.2% 5.6% 7.3% 100.0% Florida (all ages) % 7.0% 13.7% 13.7% 16.5% 18.8% 9.6% 12.7% 100.0% United States (all ages). 8.9% 6.3% 12.3% 12.0% 15.5% 19.0% 11.1% 15.0% 100.0% Source: U.S. Bureau of the Census Percent of Households by Household Income Bracket, 2004 Percent of Households 20.0% 18.0% 16.0% 14.0% 12.0% 10.0% 8.0% 6.0% 4.0% 2.0% 0.0% Less than $10,000 $10,000 $14,999 $15,000 $24,999 $25,000 $34,999 $35,000 $49,999 $50,000 $74,999 $75,000 $99,999 $100,000 or more Florida United States 75
80 State and Local General Revenues, FY 2002 Florida Average Annual Revenue Change General Revenues Per Capita Percent of Personal Income (millions) FL US FL US FL US Total General Revenues... $86,663 $5,195 $5, % 19.3% 6.5% 5.6% Own Sources... $71,707 $4,299 $4, % 15.2% 6.1% 5.2% Taxes... $44,840 $2,688 $3, % 10.4% 5.6% 4.9% Property Taxes... $15,754 $944 $ % 3.2% 4.7% 4.5% General Sales Taxes... $15,034 $901 $ % 2.6% 5.9% 5.4% Personal Income Taxes. $0 $0 $ % 2.3% 0.0% 5.8% Other Taxes... $14,052 $842 $ % 2.3% 6.5% 4.3% Charges/Miscellaneous... $26,867 $1,611 $1, % 4.8% 7.0% 5.7% Federal Aid... $14,956 $897 $1, % 4.1% 8.9% 7.2% Source: U.S. Bureau of the Census (2002 data are the most current available.) 1992 General Revenue 2002 General Revenue Property Taxes 14% 22% 17% 18% General Sales Taxes Other Taxes Charges/Misc Federal Aid 29% 19% 32% 17% 16% 16% 76
81 Florida I. Personal Income Tax (2004) No state or local personal income tax is levied. II. General Sales Tax Rates (2004) State % Combined state/local tax rates % 7.5% III. Miscellaneous Tax Rates (2004) Corporate income (highest marginal rate) % All taxable income Gasoline (per gallon)... $0.202 Most counties tax an additional $0.07 per gallon. Cigarette (per pack of 20)... $0.339 Beer (per gallon)... $0.48 IV. Real Property Tax Relief Programs (2005) Homestead Exemption or Credit Requirements Benefits All homeowners... $25,000 assessed value Widows, blind, disabled... Additional $500 assessed value Fully disabled whose income is $21,539 or less... Full exemption Fully disabled veterans... Full exemption Homestead Exemption or Credit Requirements Benefits Homeowners age 65 or older whose income is $22,096 or less... Additional exemption of $25,000 in assessed value (available by county or municipal ordinance) Circuit Breaker... None Sources: AARP 2005 telephone survey of state legislative staff, state departments of revenue, state controllers offices, state assessors offices, and state treasury offices. 77
82 Florida Deferral Program Requirements Benefits All homeowners... Defer taxes exceeding 5% of income Homeowners age 65 or older... Defer taxes exceeding 3% of income Requirements Benefits Homeowners under age 70 whose income is $10,000 or less... Full deferral of property taxes Homeowners age 70 and older whose income is $12,000 or less... Full deferral of property taxes V. Real Property Tax Limits, Caps, or Freezes (2005) Limits on Growth in Assessed Property Values For homestead property that has not changed ownership in the previous year, annual growth in assessed property values shall not exceed 3% or the inflation rate (CPI) (whichever is lower). This is known as the Save Our Home Provision and applies individual property owners. Real Property Tax Rate Limits* County... $1.00 per $100 of assessed value Cities... $1.00 per $100 of assessed value School districts... $1.00 per $100 of assessed value *These limits do not apply bonded indebtedness. Sources: AARP 2005 telephone survey of state legislative staff, state departments of revenue, state controllers offices, state assessors offices, and state treasury offices. 78
83 Florida State and Local General Expenditures, FY 2002 General Expenditures Average Annual Expenditure Change Percent of Personal Per Capita Income (millions) FL US FL US FL US State/Local Direct General Expends... $87,082 $5,220 $6, % 19.9% 6.3% 5.9% To State/Local Government... $87,082 $5,220 $6, % 19.9% 6.3% 5.9% Education*... $25,795 $1,546 $2, % 6.8% 5.8% 6.2% Public Welfare... $12,500 $749 $ % 3.2% 8.5% 6.1% Health and Hospitals... $7,491 $449 $ % 1.7% 5.0% 5.2% Highways... $6,720 $403 $ % 1.3% 7.1% 5.5% Public Safety*... $10,182 $610 $ % 1.8% 6.4% 6.3% Environment... $7,804 $468 $ % 1.2% 6.7% 5.1% Interest on General Debt... $4,176 $250 $ % 0.9% 3.1% 3.1% Other... $12,413 $744 $ % 3.0% 6.8% 6.5% To Federal Government... $0 $0 $15 0.0% 0.1% n/a 1.9% *Education includes higher and lower education; public safety includes police, fire, corrections, and protection and inspection. Source: U.S. Bureau of the Census (2002 data are the most current available.) State and Local General Expenditures, FY 2002 (excluding payments federal government) 14% Education 5% 29% Public Welfare Health and Hospitals 9% Highways Public Safety 12% 8% 9% 14% Environment Interest on General Debt Other Total Debt Outstanding Long-term Debt Short-term Debt 2002 Debt Ratio Measures Per $1,000 Debt (billions) Per Capita of Personal Income Debt (billions) Percent of Total Debt (billions) Percent of Total Florida (State and Local)... $90.3 $5,412 $ $ % $ % United States... $1,681.4 $5,839 $ $1, % $ % Source: U.S. Bureau of the Census 79
84 Georgia Economic Indicars Average Annual Change GA US GA US GA US Per Capita Income... $20,711 $22,172 $30,074 $33, % 4.1% Median Household Income... $31,467 $32,264 $40,970 $44, % 3.2% Gross State Product (in millions)... $184,256 $6,865,513 $343,125 $11,665, % 5.4% Full- and Part-Time Positions (in thousands) 4, ,224 5, , % 1.6% Employed Persons (in thousands).. 3, ,060 4, , % 1.2% Unemployment Rate % 6.1% 4.6% 5.5% n/a n/a Sources: U.S. Bureau of the Census, U.S. Bureau of Economic Analysis, and the U.S. Bureau of Labor Statistics 2004 Population Under Age 18 5% 3% Males 27% Females 6% 5% 26% Ages Ages Ages 75 and Over 65% 63% Population Poverty Rate Population and Poverty Percentage Change GA GA GA US GA US Total Population... 7,045,900 8,829, % 12.8% 14.8% 13.1% Males... 3,423,779 4,365, % 13.8% 12.4% 11.6% Under Age ,016 1,192, % 7.8% 20.1% 18.3% Ages ,185,519 2,826, % 16.7% 9.6% 9.6% Ages , , % 1.6% 8.6% 6.5% Ages 75 and Over... 98, , % 28.8% 9.0% 6.8% Females... 3,622,121 4,463, % 11.9% 17.1% 14.5% Under Age ,596 1,140, % 8.1% 22.5% 18.6% Ages ,268,394 2,823, % 14.6% 15.0% 13.6% Ages , , % -3.6% 13.9% 9.7% Ages 75 and Over , , % 19.6% 19.7% 13.3% Source: U.S. Bureau of the Census 80
85 Georgia Percent Distribution of Households by Age of Householder and Income, 2004 Less than $10,000 $10,000 $14,999 $15,000 $24,999 $25,000 $34,999 $35,000 $49,999 $50,000 $74,999 $75,000 $99,999 $100,000 or more All Households Age of Householder Under 25 years % 13.5% 19.2% 16.2% 12.8% 7.2% 4.4% 1.4% 100.0% years % 4.3% 10.8% 12.6% 18.4% 22.1% 11.7% 13.2% 100.0% years % 4.8% 9.1% 10.5% 15.0% 19.9% 13.2% 19.8% 100.0% 65 years and over % 12.7% 20.5% 13.8% 14.1% 11.3% 5.1% 5.4% 100.0% Georgia (all ages) % 6.4% 12.2% 12.3% 16.2% 18.8% 10.7% 13.6% 100.0% United States (all ages). 8.9% 6.3% 12.3% 12.0% 15.5% 19.0% 11.1% 15.0% 100.0% Source: U.S. Bureau of the Census Percent of Households by Household Income Bracket, 2004 Percent of Households 20.0% 18.0% 16.0% 14.0% 12.0% 10.0% 8.0% 6.0% 4.0% 2.0% 0.0% Less than $10,000 $10,000 $14,999 $15,000 $24,999 $25,000 $34,999 $35,000 $49,999 $50,000 $74,999 $75,000 $99,999 $100,000 or more Georgia United States 81
86 State and Local General Revenues, FY 2002 Georgia Average Annual Revenue Change General Revenues Per Capita Percent of Personal Income (millions) GA US GA US GA US Total General Revenues... $44,360 $5,194 $5, % 19.3% 7.1% 5.6% Own Sources... $35,002 $4,099 $4, % 15.2% 6.8% 5.2% Taxes... $24,058 $2,817 $3, % 10.4% 6.8% 4.9% Property Taxes... $6,640 $778 $ % 3.2% 5.9% 4.5% General Sales Taxes... $7,493 $877 $ % 2.6% 7.7% 5.4% Personal Income Taxes. $6,488 $760 $ % 2.3% 7.7% 5.8% Other Taxes... $3,437 $403 $ % 2.3% 5.2% 4.3% Charges/Miscellaneous... $10,944 $1,282 $1, % 4.8% 6.6% 5.7% Federal Aid... $9,357 $1,096 $1, % 4.1% 8.2% 7.2% Source: U.S. Bureau of the Census (2002 data are the most current available.) 1992 General Revenue 2002 General Revenue Property Taxes General Sales Taxes Personal Income Taxes Other Taxes 19% 17% 16% 21% 15% 17% Charges/Misc 25% 24% Federal Aid 14% 15% 9% 8% 82
87 Georgia I. Personal Income Tax (2004) State Income Tax Base Georgia s income tax base is linked federal adjusted gross income. Filing Requirements Taxpayers must file if their income exceeds the following: Filing Status Under Age 65 Age 65 and older Income $5,000 (single); $8,400 (married, filing jointly; both spouses under age 65). $6,300 (single); $11,000 (married, filing jointly; both spouses age 65 and older). Rate Structure Single Married, Filing Jointly Taxable Income Rate Taxable Income Rate First $ % First $1, % $750 - $2, % $1,000 - $3, % $2,250 - $3, % $3,000 - $5, % $3,750 - $5, % $5,000 - $7, % $5,250 - $7, % $7,000 - $10, % Over $7, % Over $10, % Retirement Income Exemption $15,000 exemption (persons age 62 or older); the first $4,000 of the $15,000 exemption may be earned income. Social Security Benefits... Full exemption Standard Deductions and Personal Exemptions Combined Under age $5,000 (single); $8,400 (married, filing jointly; both spouses are under age 65) Age 65 or older... $6,300 (single); $11,000 (married, filing jointly; both spouses are age 65 or older) Sources: AARP 2005 telephone survey of state legislative staff, state departments of revenue, state controllers offices, state assessors offices, and state treasury offices. 83
88 Georgia Low-Income Credit Taxpayers whose federal adjusted gross income is less than $20,000 may be eligible for a tax credit up the following amounts: Filing Status Income Under Age 65 $26 (single); $52 (married filing jointly; both spouses under age 65 with no children). Age 65 and older $52 (single); $104 (married filing jointly; both spouses age 65 and older with no children). Local Income Taxes... Localities can levy a 1% tax on Georgia taxable income only if they do not levy a local general sales tax. II. General Sales Tax Rates (2004) State % Combined state/local tax rates % 8.0% III. Miscellaneous Tax Rates (2004) Corporate income (highest marginal rate) % All taxable income Gasoline (per gallon)... $0.075 A 1% sales tax and a 3% excise tax also apply. Cigarette (per pack of 20)... $0.12 Beer (per gallon)... $0.323 Local taxes where levied are additional. Sources: AARP 2005 telephone survey of state legislative staff, state departments of revenue, state controllers offices, state assessors offices, and state treasury offices. 84
89 Georgia IV. Real Property Tax Relief Programs (2005) Homestead Exemption or Credit Requirements Benefits All homeowners... $2,000 assessed value (from state, county, and school taxes, except for school taxes levied by municipalities and bonded indebtedness) $8,000 assessed value (from state, county, school, municipal, and some special district taxes) Homeowners age 65 or older whose household income is $10,000 or less; household income does not include retirement income up $46, $4,000 assessed value for state and county taxes Homeowners age 62 or older whose household income is $10,000 or less; household income does not include retirement income up $46, $10,000 assessed value for school property taxes Disabled veterans residing in an independent or county school district... $50,000 assessed value for state, county, municipal, and school taxes Circuit Breaker... None Deferral Program Requirements Benefits Homeowners age 62 or older whose income is $15,000 or less... Defer taxes on the first $50,000 of assessed value V. Real Property Tax Limits, Caps, or Freezes (2005) Homeowners age 62 or older whose federal adjusted gross income is $30,000 or less are eligible receive a freeze on their assessed property value for state and county property taxes (except for bonded indebtedness). If homeowners are granted this freeze, they do not qualify for homestead exemptions. The freeze does not apply improvements or land that is added the homestead. County school systems cannot levy a property tax rate greater than $20 per $1,000 of assessed value without state legislative approval. This limit does not pertain bonded indebtedness. Sources: AARP 2005 telephone survey of state legislative staff, state departments of revenue, state controllers offices, state assessors offices, and state treasury offices. 85
90 State and Local General Expenditures, FY 2002 General Expenditures Georgia Average Annual Expenditure Change Percent of Personal Per Capita Income (millions) GA US GA US GA US State/Local Direct General Expends... $44,951 $5,264 $6, % 19.9% 7.2% 5.9% To State/Local Government... $44,951 $5,264 $6, % 19.9% 7.2% 5.9% Education*... $17,366 $2,034 $2, % 6.8% 9.1% 6.2% Public Welfare... $6,159 $721 $ % 3.2% 6.2% 6.1% Health and Hospitals... $4,832 $566 $ % 1.7% 2.9% 5.2% Highways... $2,939 $344 $ % 1.3% 7.9% 5.5% Public Safety*... $4,143 $485 $ % 1.8% 8.1% 6.3% Environment... $2,836 $332 $ % 1.2% 8.0% 5.1% Interest on General Debt... $1,132 $133 $ % 0.9% 2.9% 3.1% Other... $5,544 $649 $ % 3.0% 7.7% 6.5% To Federal Government... $0 $0 $15 0.0% 0.1% 0.0% 1.9% *Education includes higher and lower education; public safety includes police, fire, corrections, and protection and inspection. Source: U.S. Bureau of the Census (2002 data are the most current available.) State and Local General Expenditures, FY 2002 (excluding payments federal government) 3% 6% 12% 38% Education Public Welfare Health and Hospitals Highways 9% Public Safety Environment 7% Interest on General Debt Other 11% 14% Total Debt Outstanding Long-term Debt Short-term Debt 2002 Debt Ratio Measures Per $1,000 Debt (billions) Per Capita of Personal Income Debt (billions) Percent of Total Debt (billions) Percent of Total Georgia (State and Local)... $34.3 $4,017 $ $ % $ % United States... $1,681.4 $5,839 $ $1, % $ % Source: U.S. Bureau of the Census 86
91 THIS PAGE INTENTIONALLY LEFT BLANK 87
92 Hawaii Economic Indicars Average Annual Change HI US HI US HI US Per Capita Income... $24,777 $22,172 $32,606 $33, % 4.1% Median Household Income... $42,255 $32,264 $56,454 $44, % 3.2% Gross State Product (in millions)... $36,256 $6,865,513 $50,322 $11,665, % 5.4% Full- and Part-Time Positions (in thousands) , , % 1.6% Employed Persons (in thousands) , , % 1.2% Unemployment Rate % 6.1% 3.3% 5.5% n/a n/a Sources: U.S. Bureau of the Census, U.S. Bureau of Economic Analysis, and the U.S. Bureau of Labor Statistics 2004 Population Under Age 18 6% 6% Males 24% 7% 9% Females 23% Ages Ages Ages 75 and Over 64% 61% Population Poverty Rate Population and Poverty Percentage Change HI HI HI US HI US Total Population... 1,173,903 1,262, % 12.8% 10.6% 13.1% Males , , % 13.8% 9.4% 11.6% Under Age , , % 7.8% 12.4% 18.3% Ages , , % 16.7% 8.7% 9.6% Ages ,120 35, % 1.6% 7.5% 6.5% Ages 75 and Over... 26,238 36, % 28.8% 6.1% 6.8% Females , , % 11.9% 11.7% 14.5% Under Age , , % 8.1% 16.6% 18.6% Ages , , % 14.6% 10.5% 13.6% Ages ,692 43, % -3.6% 9.8% 9.7% Ages 75 and Over... 31,028 56, % 19.6% 9.2% 13.3% Source: U.S. Bureau of the Census 88
93 Hawaii Percent Distribution of Households by Age of Householder and Income, 2004 Less than $10,000 $10,000 $14,999 $15,000 $24,999 $25,000 $34,999 $35,000 $49,999 $50,000 $74,999 $75,000 $99,999 $100,000 or more All Households Age of Householder Under 25 years % 9.1% 8.2% 17.5% 22.1% 16.9% 2.2% 1.7% 100.0% years % 3.9% 7.1% 9.9% 18.1% 24.5% 14.0% 15.6% 100.0% years % 2.9% 8.8% 8.8% 11.6% 18.7% 15.2% 28.7% 100.0% 65 years and over % 9.5% 12.9% 10.6% 13.1% 18.6% 10.8% 14.7% 100.0% Hawaii (all ages) % 5.0% 9.2% 10.0% 14.6% 20.5% 13.2% 19.9% 100.0% United States (all ages). 8.9% 6.3% 12.3% 12.0% 15.5% 19.0% 11.1% 15.0% 100.0% Source: U.S. Bureau of the Census Percent of Households by Household Income Bracket, 2004 Percent of Households 25.0% 20.0% 15.0% 10.0% 5.0% 0.0% Less than $10,000 $10,000 $14,999 $15,000 $24,999 $25,000 $34,999 $35,000 $49,999 $50,000 $74,999 $75,000 $99,999 $100,000 or more Hawaii United States 89
94 State and Local General Revenues, FY 2002 Hawaii Average Annual Revenue Change General Revenues Per Capita Percent of Personal Income (millions) HI US HI US HI US Total General Revenues... $7,429 $6,018 $5, % 19.3% 2.7% 5.6% Own Sources... $5,881 $4,764 $4, % 15.2% 2.2% 5.2% Taxes... $4,240 $3,434 $3, % 10.4% 2.3% 4.9% Property Taxes... $615 $498 $ % 3.2% 1.0% 4.5% General Sales Taxes... $1,612 $1,306 $ % 2.6% 2.2% 5.4% Personal Income Taxes. $1,112 $900 $ % 2.3% 2.1% 5.8% Other Taxes... $901 $730 $ % 2.3% 3.6% 4.3% Charges/Miscellaneous... $1,642 $1,330 $1, % 4.8% 2.1% 5.7% Federal Aid... $1,547 $1,254 $1, % 4.1% 5.1% 7.2% Source: U.S. Bureau of the Census (2002 data are the most current available.) 1992 General Revenue 2002 General Revenue Property Taxes General Sales Taxes Personal Income Taxes Other Taxes Charges/Misc 23% 17% 10% 23% 22% 21% 8% 22% Federal Aid 11% 16% 12% 15% 90
95 Hawaii I. Personal Income Tax (2004) State Income Tax Base Hawaii s income tax base is linked federal adjusted gross income. Filing Requirements Taxpayers must file if they are doing business in Hawaii or if their gross income subject Hawaii tax exceeds the following amounts: Age Group Under Age 65 Age 65 or older Income Thresholds $2,540 (single); $3,980 (married, filing jointly; both spouses are under age 65). $3,580 (single); $6,060 (married, filing jointly; both spouses are age 65 or older). Rate Structure Single Married, Filing Jointly Taxable Income Rate Taxable Income Rate First $2, % First $4, % $2,000 - $4, % $4,000 - $8, % $4,000 - $8, % $8,000 - $16, % $8,000 - $12, % $16,000 - $24, % $12,000 - $16, % $24,000 - $32, % $16,000 - $20, % $32,000 - $40, % $20,000 - $30, % $40,000 - $60, % $30,000 - $40, % $60,000 - $80, % Over $40, % Over $80, % Public Pensions... Full exemption Private Pensions... Pensions with only employer contributions are exempt; pensions with employee contributions are partially taxable. Social Security Benefits... Full exemption Standard Deductions and Personal Exemptions Combined Under age $2,540 (single); $3,980 (married, filing jointly; both spouses are under age 65) Age 65 or older... $3,580 (single); $6,060 (married, filing jointly; both spouses are age 65 or older) Sources: AARP 2005 telephone survey of state legislative staff, state departments of revenue, state controllers offices, state assessors offices, and state treasury offices. 91
96 Hawaii Local Income Taxes... None II. General Sales Tax Rates (2004) State % Combined state/local tax rates % III. Miscellaneous Tax Rates (2004) Corporate income (highest marginal rate) % On income over $100,000 Gasoline (per gallon)... $0.16 Counties rates vary from $0.088 $0.165 per gallon. Cigarette (per pack of 20)... $1.42* Local taxes, where levied, are additional. Beer (per gallon)... $0.54 For draft beer; counties levy an additional $0.52/gallon. *The $1.42 tax includes a stamp tax of $ IV. Real Property Tax Relief Programs (Honolulu, HI) (2005) Homestead Exemption or Credit* Requirements Benefits Homeowners under age $40,000 assessed value Homeowners ages $60,000 assessed value Homeowners ages $80,000 assessed value Homeowners ages $100,000 assessed value Homeowners age $120,000 assessed value Disabled, blind, hearing impaired... $25,000 assessed value Fully disabled veterans... Full exemption if owner-occupied *All homeowners have pay a minimum real property tax of $100. Sources: AARP 2005 telephone survey of state legislative staff, state departments of revenue, state controllers offices, state assessors offices, and state treasury offices. 92
97 Hawaii Circuit Breaker Requirements Benefits Homeowners age 55 or older whose income is $20,000 or less... Up $500 Renter s Tax Credit Requirements Benefits Renters whose annual rent is greater than $1,000 and whose income is less than $30, Under age 65: $50 (single); $100 (married, filing jointly) Age 65 or older: $100 (single); $200 (married, filing jointly; both spouses are age 65 and older) Deferral Program... None V. Real Property Tax Limits, Caps, or Freezes (Honolulu, HI) (2005) No limits, caps, or freezes are provided. Sources: AARP 2005 telephone survey of state legislative staff, state departments of revenue, state controllers offices, state assessors offices, and state treasury offices. 93
98 State and Local General Expenditures, FY 2002 General Expenditures Hawaii Average Annual Expenditure Change Percent of Personal Per Capita Income (millions) HI US HI US HI US State/Local Direct General Expends... $8,304 $6,726 $6, % 19.9% 3.2% 5.9% To State/Local Government... $8,289 $6,715 $6, % 19.9% 3.2% 5.9% Education*... $2,257 $1,829 $2, % 6.8% 5.3% 6.2% Public Welfare... $1,141 $924 $ % 3.2% 6.7% 6.1% Health and Hospitals... $652 $528 $ % 1.7% 4.8% 5.2% Highways... $419 $339 $ % 1.3% -0.3% 5.5% Public Safety*... $553 $448 $ % 1.8% 4.1% 6.3% Environment... $682 $552 $ % 1.2% 0.9% 5.1% Interest on General Debt... $573 $464 $ % 0.9% 4.9% 3.1% Other... $2,012 $1,630 $ % 3.0% 0.5% 6.5% To Federal Government... $14 $12 $15 0.0% 0.1% 3.1% 1.9% *Education includes higher and lower education; public safety includes police, fire, corrections, and protection and inspection. Source: U.S. Bureau of the Census (2002 data are the most current available.) State and Local General Expenditures, FY 2002 (excluding payments federal government) 7% 24% 8% 7% 5% 8% 27% 14% Education Public Welfare Health and Hospitals Highways Public Safety Environment Interest on General Debt Other Total Debt Outstanding Long-term Debt Short-term Debt 2002 Debt Ratio Measures Per $1,000 Debt (billions) Per Capita of Personal Income Debt (billions) Percent of Total Debt (billions) Percent of Total Hawaii (State and Local)... $8.4 $6,843 $ $ % $ % United States... $1,681.4 $5,839 $ $1, % $ % Source: U.S. Bureau of the Census 94
99 THIS PAGE INTENTIONALLY LEFT BLANK 95
100 Idaho Economic Indicars Average Annual Change ID US ID US ID US Per Capita Income... $18,707 $22,172 $26,839 $33, % 4.1% Median Household Income... $31,536 $32,264 $44,430 $44, % 3.2% Gross State Product (in millions)... $24,817 $6,865,513 $43,571 $11,665, % 5.4% Full- and Part-Time Positions (in thousands) , , % 1.6% Employed Persons (in thousands) , , % 1.2% Unemployment Rate % 6.1% 4.7% 5.5% n/a n/a Sources: U.S. Bureau of the Census, U.S. Bureau of Economic Analysis, and the U.S. Bureau of Labor Statistics 2004 Population Under Age 18 Ages % 4% Males 27% 6% 6% Females 26% Ages Ages 75 and Over 63% 62% Population Poverty Rate Population and Poverty Percentage Change ID ID ID US ID US Total Population... 1,135,459 1,393, % 12.8% 14.5% 13.1% Males , , % 13.8% 13.6% 11.6% Under Age , , % 7.8% 21.2% 18.3% Ages , , % 16.7% 11.3% 9.6% Ages ,738 40, % 1.6% 6.0% 6.5% Ages 75 and Over... 23,774 30, % 28.8% 7.6% 6.8% Females , , % 11.9% 15.5% 14.5% Under Age , , % 8.1% 18.0% 18.6% Ages , , % 14.6% 16.0% 13.6% Ages ,242 43, % -3.6% 3.8% 9.7% Ages 75 and Over... 35,556 44, % 19.6% 11.5% 13.3% Source: U.S. Bureau of the Census 96
101 Idaho Percent Distribution of Households by Age of Householder and Income, 2004 Less than $10,000 $10,000 $14,999 $15,000 $24,999 $25,000 $34,999 $35,000 $49,999 $50,000 $74,999 $75,000 $99,999 $100,000 or more All Households Age of Householder Under 25 years % 12.5% 24.1% 12.9% 20.6% 6.8% 1.7% 2.8% 100.0% years % 6.0% 12.9% 14.5% 19.7% 22.7% 10.9% 8.4% 100.0% years % 4.5% 9.2% 13.3% 16.5% 22.7% 11.6% 14.9% 100.0% 65 years and over % 13.7% 22.7% 15.9% 16.7% 13.4% 3.2% 5.3% 100.0% Idaho (all ages) % 7.5% 14.3% 14.2% 18.0% 19.7% 9.0% 9.7% 100.0% United States (all ages). 8.9% 6.3% 12.3% 12.0% 15.5% 19.0% 11.1% 15.0% 100.0% Source: U.S. Bureau of the Census Percent of Households by Household Income Bracket, 2004 Percent of Households 25.0% 20.0% 15.0% 10.0% 5.0% 0.0% Less than $10,000 $10,000 $14,999 $15,000 $24,999 $25,000 $34,999 $35,000 $49,999 $50,000 $74,999 $75,000 $99,999 $100,000 or more Idaho United States 97
102 State and Local General Revenues, FY 2002 Idaho Average Annual Revenue Change General Revenues Per Capita Percent of Personal Income (millions) ID US ID US ID US Total General Revenues... $6,620 $4,928 $5, % 19.3% 6.7% 5.6% Own Sources... $5,204 $3,875 $4, % 15.2% 6.4% 5.2% Taxes... $3,291 $2,450 $3, % 10.4% 5.6% 4.9% Property Taxes... $959 $714 $ % 3.2% 7.1% 4.5% General Sales Taxes... $796 $593 $ % 2.6% 6.1% 5.4% Personal Income Taxes. $842 $627 $ % 2.3% 4.6% 5.8% Other Taxes... $694 $516 $ % 2.3% 4.7% 4.3% Charges/Miscellaneous... $1,913 $1,425 $1, % 4.8% 7.8% 5.7% Federal Aid... $1,415 $1,054 $1, % 4.1% 7.8% 7.2% Source: U.S. Bureau of the Census (2002 data are the most current available.) 1992 General Revenue 2002 General Revenue Property Taxes General Sales Taxes Personal Income Taxes Other Taxes 19% 14% 13% 21% 14% 12% Charges/Misc Federal Aid 26% 15% 30% 13% 13% 10% 98
103 Idaho I. Personal Income Tax (2004) State Income Tax Base Idaho s income tax base is linked federal adjusted gross income. Filing Requirements Taxpayers must file if they are required file a federal tax return or if Idaho gross income exceeds the following income thresholds: Age Group Under Age 65 Age 65 or older Income Thresholds $7,950 (single); $15,900 (married, filing jointly; both spouses are under age 65). $9,150 (single); $17,800 (married, filing jointly; both spouses are age 65 or older). Rate Structure Single Married, Filing Jointly Taxable Income Rate Taxable Income Rate First $1, % First $2, % $1,129 - $2, % $2,258 - $4, % $2,258 $3, % $4,515 - $6, % $3,387 - $4, % $6,773 - $9, % $4,515 - $5, % $9,031 - $11, % $5,644 - $8, % $11,288 - $16, % $8,466 - $22, % $16,933 - $45, % Over $22, % Over $45, % Public Pension Exemption $21,900 (single) and $32,850 (married, filing jointly) exemption reduced by Social Security and Railroad Retirement benefits received for persons age 65 or older or ages and disabled. Allowable state/municipal pension exemptions are limited a city s police retirement fund or from the state s fire fighters retirement fund. Private Pension Exemption... None Social Security Benefits... Full exemption Sources: AARP 2005 telephone survey of state legislative staff, state departments of revenue, state controllers offices, state assessors offices, and state treasury offices. 99
104 Idaho Medical Savings Account (MSA) Deduction*... $2,000 (single); $4,000 (married) in contributions* *Taxpayers cannot deduct reimbursements that were redeposited in an Idaho MSA and MSA amounts that were already deducted on the federal return. Health Insurance Premiums Deduction... Premiums can be deducted if they were not already deducted on the federal return. Long-Term Care Insurance Deduction... Premiums can be deducted if they were not already deducted on the Idaho return or the federal return. Standard Deductions and Personal Exemptions Combined Under age 65*... $7,950 (single); $15,900 (married, filing jointly; both spouses are under age 65) Age 65 or older*... $9,150 (single); $17,800 (married, filing jointly; both spouses are age 65 or older) *Personal exemptions equal $3,100 per exemption (singles have one exemption and married couples have two). Taxpayers with federal adjusted gross income greater than $142,700 (single) or $214,050 (married, filing jointly) receive lower personal exemption amounts. Local Income Taxes... None II. General Sales Tax Rates (2004) State... 6%* Combined state/local tax rates... 6% 9%** * The general sales tax rate will revert 5% effective July 1, **Almost all taxing jurisdictions levy a combined state/local tax rate of 5%. Only some local taxing jurisdictions levy an additional local tax rate of up 3%. III. Miscellaneous Tax Rates (2004) Corporate income (highest marginal rate) % All taxable income Gasoline (per gallon)... $0.25 Cigarette (per pack of 20)... $0.57 Beer (per gallon)... $0.15 A 15% surcharge is levied on beer sold in the state dispensary. Sources: AARP 2005 telephone survey of state legislative staff, state departments of revenue, state controllers offices, state assessors offices, and state treasury offices. 100
105 Idaho IV. Real Property Tax Relief Programs (2005) Homestead Exemption or Credit Requirements Benefits All homeowners... $50,000 assessed value or 50% of assessed value, whichever is less, for residential improvements Circuit Breaker Requirements Benefits Homeowners age 65 or older, veterans, disabled, blind, surviving spouses whose income is $22,040 or less... Up $1,200 Deferral Program... None V. Real Property Tax Limits, Caps, or Freezes (2005) Local taxing district property tax revenue is limited a 3% annual increase. This limitation does not apply new construction and annexations or voter-approved increases. Idaho has a number of statury maximum tax rates for various taxing authorities, as shown below: Airport (counties)... $0.04 per $100 of assessed value District court (counties)... $0.04 per $100 of assessed value Parks and recreation (counties)... $0.01 per $100 of assessed value Of the two above limits, the 3% cap tends dominate. Sources: AARP 2005 telephone survey of state legislative staff, state departments of revenue, state controllers offices, state assessors offices, and state treasury offices. 101
106 State and Local General Expenditures, FY 2002 General Expenditures Idaho Average Annual Expenditure Change Percent of Per Capita Personal Income (millions) ID US ID US ID US State/Local Direct General Expends... $6,804 $5,065 $6, % 19.9% 7.4% 5.9% To State/Local Government... $6,804 $5,065 $6, % 19.9% 7.4% 5.9% Education*... $2,423 $1,804 $2, % 6.8% 6.8% 6.2% Public Welfare... $1,035 $771 $ % 3.2% 10.4% 6.1% Health and Hospitals... $605 $451 $ % 1.7% 7.3% 5.2% Highways... $618 $460 $ % 1.3% 6.0% 5.5% Public Safety*... $600 $447 $ % 1.8% 8.1% 6.3% Environment... $550 $410 $ % 1.2% 7.2% 5.1% Interest on General Debt... $210 $156 $ % 0.9% 4.7% 3.1% Other... $763 $568 $ % 3.0% 7.2% 6.5% To Federal Government... $0 $0 $15 0.0% 0.1% n/a 1.9% *Education includes higher and lower education; public safety includes police, fire, corrections, and protection and inspection. Source: U.S. Bureau of the Census (2002 data are the most current available.) State and Local General Expenditures, FY 2002 (excluding payments federal government) 3% 8% 9% 9% 11% Education Public Welfare Health and Hospitals 36% Highways Public Safety Environment Interest on General Debt Other 9% 15% Total Debt Outstanding Long-term Debt Short-term Debt 2002 Debt Ratio Measures Per $1,000 Debt (billions) Per Capita of Personal Income Debt (billions) Percent of Total Debt (billions) Percent of Total Idaho (State and Local)... $4.0 $2,967 $ $ % $ % United States... $1,681.4 $5,839 $ $1, % $ % Source: U.S. Bureau of the Census 102
107 THIS PAGE INTENTIONALLY LEFT BLANK 103
108 Illinois Economic Indicars Average Annual Change IL US IL US IL US Per Capita Income... $23,969 $22,172 $34,725 $33, % 4.1% Median Household Income... $35,081 $32,264 $46,132 $44, % 3.2% Gross State Product (in millions)... $343,363 $6,865,513 $521,900 $11,665, % 5.4% Full- and Part-Time Positions (in thousands) 6, ,224 7, , % 1.6% Employed Persons (in thousands).. 5, ,060 6, , % 1.2% Unemployment Rate % 6.1% 6.2% 5.5% n/a n/a Sources: U.S. Bureau of the Census, U.S. Bureau of Economic Analysis, and the U.S. Bureau of Labor Statistics 2004 Population Under Age 18 5% 4% Males 27% 7% 7% Females 24% Ages Ages Ages 75 and Over 64% 62% Population Poverty Rate Population and Poverty Percentage Change IL IL IL US IL US Total Population... 11,804,986 12,713, % 12.8% 11.9% 13.1% Males... 5,743,373 6,243, % 13.8% 10.7% 11.6% Under Age ,583,364 1,655, % 7.8% 16.7% 18.3% Ages ,568,242 3,969, % 16.7% 8.9% 9.6% Ages , , % 1.6% 5.0% 6.5% Ages 75 and Over , , % 28.8% 6.3% 6.8% Females... 6,061,613 6,470, % 11.9% 13.1% 14.5% Under Age ,506,498 1,582, % 8.1% 16.9% 18.6% Ages ,658,077 3,985, % 14.6% 12.3% 13.6% Ages , , % -3.6% 8.1% 9.7% Ages 75 and Over , , % 19.6% 12.5% 13.3% Source: U.S. Bureau of the Census 104
109 Illinois Percent Distribution of Households by Age of Householder and Income, 2004 Less than $10,000 $10,000 $14,999 $15,000 $24,999 $25,000 $34,999 $35,000 $49,999 $50,000 $74,999 $75,000 $99,999 $100,000 or more All Households Age of Householder Under 25 years % 10.1% 18.7% 14.7% 15.9% 11.9% 5.2% 2.5% 100.0% years % 3.8% 8.2% 10.9% 15.8% 22.7% 14.0% 17.9% 100.0% years % 3.8% 7.7% 7.7% 13.5% 21.5% 15.3% 23.5% 100.0% 65 years and over % 12.7% 21.0% 15.5% 14.1% 12.7% 6.2% 6.9% 100.0% Illinois (all ages) % 5.9% 11.1% 10.9% 14.7% 19.7% 12.4% 16.9% 100.0% United States (all ages). 8.9% 6.3% 12.3% 12.0% 15.5% 19.0% 11.1% 15.0% 100.0% Source: U.S. Bureau of the Census Percent of Households by Household Income Bracket, 2004 Percent of Households 25.0% 20.0% 15.0% 10.0% 5.0% 0.0% Less than $10,000 $10,000 $14,999 $15,000 $24,999 $25,000 $34,999 $35,000 $49,999 $50,000 $74,999 $75,000 $99,999 $100,000 or more Illinois United States 105
110 State and Local General Revenues, FY 2002 Illinois Average Annual Revenue Change General Revenues Per Capita Percent of Personal Income (millions) IL US IL US IL US Total General Revenues... $69,098 $5,490 $5, % 19.3% 5.4% 5.6% Own Sources... $56,382 $4,480 $4, % 15.2% 5.1% 5.2% Taxes... $41,570 $3,303 $3, % 10.4% 4.9% 4.9% Property Taxes... $15,873 $1,261 $ % 3.2% 4.8% 4.5% General Sales Taxes... $7,528 $598 $ % 2.6% 3.2% 5.4% Personal Income Taxes. $7,471 $594 $ % 2.3% 5.0% 5.8% Other Taxes... $10,697 $850 $ % 2.3% 6.5% 4.3% Charges/Miscellaneous... $14,812 $1,177 $1, % 4.8% 5.7% 5.7% Federal Aid... $12,717 $1,010 $1, % 4.1% 6.6% 7.2% Source: U.S. Bureau of the Census (2002 data are the most current available.) 1992 General Revenue 2002 General Revenue Property Taxes General Sales Taxes Personal Income Taxes Other Taxes Charges/Misc 21% 16% 25% 13% 21% 18% 24% 11% Federal Aid 14% 11% 15% 11% 106
111 Illinois I. Personal Income Tax (2004) State Income Tax Base Illinois income tax base is linked federal adjusted gross income. Filing Requirements Taxpayers must file if they filed a federal return or if their Illinois base income exceeds their personal exemption (as shown below). Rate Structure 3.0% of taxable income Public and Private Pension Exemptions... Full exemption Social Security Benefits... Full exemption Personal Exemptions Under age $2,000 (single); $4,000 (married, filing jointly) Age 65 or older... $3,000 (single); $6,000 (married, filing jointly; both spouses are age 65 or older) Local Income Taxes... None II. General Sales Tax Rates (2004) State %* Combined state/local tax rates % 8.75%** *State-mandated rate of 6.25%; of which the state levy is 5.0%; the municipal levy is 1.0%, and the county levy is 0.25%. **Includes sales taxes administered by the Illinois Department of Revenue; does not include any additional local sales taxes. III. Miscellaneous Tax Rates (2004) Corporate income (highest marginal rate) % All taxable income; corporations also pay an additional 2.5% replacement tax. Gasoline (per gallon)... $0.19 An additional 5.0% state sales tax is levied. Local option taxes are additional. Cigarette (per pack of 20)... $0.98 Local taxes, where levied, are additional. Beer (per gallon)... $0.185 Local taxes, where levied, are additional. Sources: AARP 2005 telephone survey of state legislative staff, state departments of revenue, state controllers offices, state assessors offices, and state treasury offices. 107
112 Illinois IV. Real Property Tax Relief Programs (2004) Homestead Exemptions or Credits Requirements Benefits All homeowners, renters, or nursing home residents age 65 or older or disabled... Up $5,000 equalized assessed value based on the increase in equalized assessed value since 1977 All homeowners... Up a $75,000 exemption for the fair cash value that was added the homestead property by any new improvement or by rebuilding after a catastrophic event; the exemption continues for four years from the date the improvement was completed and occupied. Homeowners age 65 or older... Additional $3,000 equalized assessed value Disabled veterans... Up $58,000 assessed value on a specially adapted home purchased or constructed with federal funds Circuit Breaker Requirements Benefits Homeowners, renters, or nursing home residents age 65 or older or disabled whose income is $21,218 or less (one-person household) or $28,480 or less (two-person household) or $35,740 or less (three persons or more per household)... Up $700 Deferral Program Requirements Benefits Homeowners age 65 or older who have owned and occupied their homes for the last three years whose income is $40,000 or less... Full deferral of property taxes Sources: AARP 2005 telephone survey of state legislative staff, state departments of revenue, state controllers offices, state assessors offices, and state treasury offices. 108
113 Illinois V. Real Property Tax Limits, Caps, or Freezes (2004) Counties have the option of limiting increases in assessed property values no more than 7% for homeowners. So far, only Cook County adopted this option. Homeowners age 65 or older whose household income is $45,000 or less may receive a freeze on their equalized assessed real property value based on the value the year prior the year they first apply and qualify for (base year value) or for a later year in which they apply and qualify if the property value is less than the base year value. Some taxing districts cannot annually increase tal property taxes by more than the inflation rate or 5% (whichever is less). In general, this limitation does not apply improvements, additions, or pre-existing bonded indebtedness. In addition, voters can override this limitation. Sources: AARP 2005 telephone survey of state legislative staff, state departments of revenue, state controllers offices, state assessors offices, and state treasury offices. 109
114 State and Local General Expenditures, FY 2002 General Expenditures Illinois Average Annual Expenditure Change Percent of Personal Per Capita Income (millions) IL US IL US IL US State/Local Direct General Expends... $73,822 $5,866 $6, % 19.9% 6.2% 5.9% To State/Local Government... $73,819 $5,866 $6, % 19.9% 6.2% 5.9% Education*... $25,953 $2,062 $2, % 6.8% 6.9% 6.2% Public Welfare... $9,861 $784 $ % 3.2% 4.7% 6.1% Health and Hospitals... $5,199 $413 $ % 1.7% 7.1% 5.2% Highways... $5,676 $451 $ % 1.3% 4.7% 5.5% Public Safety*... $6,771 $538 $ % 1.8% 6.4% 6.3% Environment... $5,114 $406 $ % 1.2% 6.4% 5.1% Interest on General Debt... $3,926 $312 $ % 0.9% 4.9% 3.1% Other... $11,318 $899 $ % 3.0% 6.8% 6.5% To Federal Government... $3 $0 $15 0.0% 0.1% 4.8% 1.9% *Education includes higher and lower education; public safety includes police, fire, corrections, and protection and inspection. Source: U.S. Bureau of the Census (2002 data are the most current available.) State and Local General Expenditures, FY 2002 (excluding payments federal government) 15% Education Public Welfare 5% 36% Health and Hospitals Highways 7% Public Safety Environment 9% Interest on General Debt 8% 7% 13% Other Total Debt Outstanding Long-term Debt Short-term Debt 2002 Debt Ratio Measures Per $1,000 Debt (billions) Per Capita of Personal Income Debt (billions) Percent of Total Debt (billions) Percent of Total Illinois (State and Local)... $80.9 $6,431 $ $ % $ % United States... $1,681.4 $5,839 $ $1, % $ % Source: U.S. Bureau of the Census 110
115 THIS PAGE INTENTIONALLY LEFT BLANK 111
116 Indiana Economic Indicars Average Annual Change IN US IN US IN US Per Capita Income... $20,761 $22,172 $30,070 $33, % 4.1% Median Household Income... $27,858 $32,264 $42,327 $44, % 3.2% Gross State Product (in millions)... $141,157 $6,865,513 $227,569 $11,665, % 5.4% Full- and Part-Time Positions (in thousands) 3, ,224 3, , % 1.6% Employed Persons (in thousands).. 2, ,060 3, , % 1.2% Unemployment Rate % 6.1% 5.2% 5.5% n/a n/a Sources: U.S. Bureau of the Census, U.S. Bureau of Economic Analysis, and the U.S. Bureau of Labor Statistics 2004 Population Under Age 18 6% 5% Males 27% 7% 8% Females 25% Ages Ages Ages 75 and Over 62% 60% Population Poverty Rate Population and Poverty Percentage Change IN IN IN US IN US Total Population... 5,745,626 6,237, % 12.8% 10.8% 13.1% Males... 2,790,710 3,068, % 13.8% 9.0% 11.6% Under Age , , % 7.8% 13.8% 18.3% Ages ,742,259 1,932, % 16.7% 7.6% 9.6% Ages , , % 1.6% 5.8% 6.5% Ages 75 and Over , , % 28.8% 3.4% 6.8% Females... 2,954,916 3,168, % 11.9% 12.5% 14.5% Under Age , , % 8.1% 15.9% 18.6% Ages ,797,191 1,932, % 14.6% 11.9% 13.6% Ages , , % -3.6% 7.4% 9.7% Ages 75 and Over , , % 19.6% 10.9% 13.3% Source: U.S. Bureau of the Census 112
117 Indiana Percent Distribution of Households by Age of Householder and Income, 2004 Less than $10,000 $10,000 $14,999 $15,000 $24,999 $25,000 $34,999 $35,000 $49,999 $50,000 $74,999 $75,000 $99,999 $100,000 or more All Households Age of Householder Under 25 years % 12.2% 20.7% 16.9% 13.4% 13.5% 2.3% 1.3% 100.0% years % 3.2% 9.7% 15.2% 18.6% 25.2% 11.3% 10.2% 100.0% years % 3.4% 9.9% 11.0% 15.5% 23.4% 15.6% 16.1% 100.0% 65 years and over % 13.9% 22.3% 17.6% 16.4% 10.4% 4.3% 4.1% 100.0% Indiana (all ages) % 6.0% 13.0% 14.3% 16.7% 20.8% 10.9% 10.5% 100.0% United States (all ages). 8.9% 6.3% 12.3% 12.0% 15.5% 19.0% 11.1% 15.0% 100.0% Source: U.S. Bureau of the Census Percent of Households by Household Income Bracket, 2004 Percent of Households 25.0% 20.0% 15.0% 10.0% 5.0% 0.0% Less than $10,000 $10,000 $14,999 $15,000 $24,999 $25,000 $34,999 $35,000 $49,999 $50,000 $74,999 $75,000 $99,999 $100,000 or more Indiana United States 113
118 State and Local General Revenues, FY 2002 Indiana Average Annual Revenue Change General Revenues Per Capita Percent of Personal Income (millions) IN US IN US IN US Total General Revenues... $32,363 $5,255 $5, % 19.3% 5.4% 5.6% Own Sources... $26,080 $4,235 $4, % 15.2% 5.2% 5.2% Taxes... $16,987 $2,758 $3, % 10.4% 4.8% 4.9% Property Taxes... $5,976 $970 $ % 3.2% 6.2% 4.5% General Sales Taxes... $3,798 $617 $ % 2.6% 3.9% 5.4% Personal Income Taxes. $4,121 $669 $ % 2.3% 3.4% 5.8% Other Taxes... $3,091 $502 $ % 2.3% 5.3% 4.3% Charges/Miscellaneous... $9,093 $1,477 $1, % 4.8% 5.9% 5.7% Federal Aid... $6,283 $1,020 $1, % 4.1% 6.5% 7.2% Source: U.S. Bureau of the Census (2002 data are the most current available.) 1992 General Revenue 2002 General Revenue Property Taxes General Sales Taxes Personal Income Taxes Other Taxes 17% 17% 14% 19% 18% 12% Charges/Misc 27% 28% Federal Aid 10% 15% 10% 13% 114
119 Indiana I. Personal Income Tax (2004) State Income Tax Base Indiana s income tax base is linked federal adjusted gross income. Filing Requirements Taxpayers must file if their gross income exceeds their personal exemptions. Rate Structure 3.4% of adjusted gross income Public Pension Exemption... $2,000 exemption less Social Security and Railroad Retirement benefits received for federal civilian retirees age 62 or older; $2,000 exemption for military retirees age 60 or older Private Pension Exemption... None Social Security Benefits... Full exemption Long-Term Care Insurance Deduction Taxpayers can deduct long-term care insurance premiums paid for Indiana Partnership long-term care insurance minus any deductions already taken on the federal return. Medical Savings Account (MSA) Deduction MSA contributions are deductible if the taxpayer s employer deposited funds in certain medical care savings accounts. Taxpayers cannot claim this deduction if they already claimed a MSA deduction on the federal return. Personal Exemptions Under age $1,000 (single); $2,000 (married, filing jointly; both spouses are under age 65) Age 65 or older... $2,000 $2,500 (single); $4,000 $5,000 (married, filing jointly; both spouses are age 65 or older) Sources: AARP 2005 telephone survey of state legislative staff, state departments of revenue, state controllers offices, state assessors offices, and state treasury offices. 115
120 Indiana Unified Tax Credit Taxpayers age 65 or older whose household income is less than $10,000 are eligible for a tax credit ranging from $40 $100 (single) and $80 $140 (married, filing jointly). Local Income Taxes Additional local optional county tax; rates range from 0% 1.3% of taxable income. II. General Sales Tax Rates (2004) State % Combined state/local tax rates % III. Miscellaneous Tax Rates (2004) Corporate income (highest marginal rate) % Gasoline (per gallon)... $0.18 An additional 6.0% sales tax is levied. Cigarette (per pack of 20)... $0.555 Local taxes, where levied, are additional. Beer (per gallon)... $0.115 IV. Real Property Tax Relief Programs (2005) Homestead Exemption or Credit Requirements Benefits All homeowners... 20% of net tax (after other credits) plus a deduction of $35,000 assessed value or one-half of the tal assessed value (whichever is less) Homestead Exemption Requirements Benefits Homeowners age 65 or older, blind, or disabled whose income is $25,000 or less (age 65 or older) or $17,000 or less (blind or disabled). In addition, the estate value for the primary residence cannot exceed $144,000 in assessed value for homeowners age 65 or older.... $6,000 assessed value or one-half the assessed value (whichever is less) for age 65 or older; $6,000 assessed value for blind or disabled Sources: AARP 2005 telephone survey of state legislative staff, state departments of revenue, state controllers offices, state assessors offices, and state treasury offices. 116
121 Indiana Other Property Tax Reductions Requirements Benefits All homeowners and renters... $2,500 of their property taxes from their taxable personal income (homeowners); $2,500 from their taxable personal income (renters) Circuit Breaker... None Deferral Program... None V. Real Property Tax Limits, Caps, or Freezes (2005) Local taxing units cannot raise property taxes by more than the six-year average growth in Indiana nonfarm personal income. Local taxing units may appeal this limit if tal assessed value growth exceeds the statewide assessed value growth by at least 3%. Moreover, local taxing units might be able raise property taxes above this limit for a variety of reasons, including rising pension payments and the costs of operating a new court. Indiana also has statury limits on property tax rates for local capital projects. Sources: AARP 2005 telephone survey of state legislative staff, state departments of revenue, state controllers offices, state assessors offices, and state treasury offices. 117
122 State and Local General Expenditures, FY 2002 General Expenditures Indiana Average Annual Expenditure Change Percent of Personal Per Capita Income (millions) IN US IN US IN US State/Local Direct General Expends... $32,796 $5,326 $6, % 19.9% 5.9% 5.9% To State/Local Government... $32,796 $5,326 $6, % 19.9% 5.9% 5.9% Education*... $12,193 $1,980 $2, % 6.8% 5.1% 6.2% Public Welfare... $5,313 $863 $ % 3.2% 7.0% 6.1% Health and Hospitals... $2,876 $467 $ % 1.7% 3.9% 5.2% Highways... $2,031 $330 $ % 1.3% 5.3% 5.5% Public Safety*... $2,312 $375 $ % 1.8% 7.2% 6.3% Environment... $1,924 $312 $ % 1.2% 7.5% 5.1% Interest on General Debt... $1,176 $191 $ % 0.9% 5.0% 3.1% Other... $4,972 $807 $ % 3.0% 7.8% 6.5% To Federal Government... $0 $0 $15 0.0% 0.1% n/a 1.9% *Education includes higher and lower education; public safety includes police, fire, corrections, and protection and inspection. Source: U.S. Bureau of the Census (2002 data are the most current available.) State and Local General Expenditures, FY 2002 (excluding payments federal government) 4% 6% 7% 6% 15% 9% 16% 37% Education Public Welfare Health and Hospitals Highways Public Safety Environment Interest on General Debt Other Total Debt Outstanding Long-term Debt Short-term Debt 2002 Debt Ratio Measures Per $1,000 Debt (billions) Per Capita of Personal Income Debt (billions) Percent of Total Debt (billions) Percent of Total Indiana (State and Local)... $24.1 $3,909 $ $ % $ % United States... $1,681.4 $5,839 $ $1, % $ % Source: U.S. Bureau of the Census 118
123 THIS PAGE INTENTIONALLY LEFT BLANK 119
124 Iowa Economic Indicars Average Annual Change IA US IA US IA US Per Capita Income... $20,301 $22,172 $30,970 $33, % 4.1% Median Household Income... $33,079 $32,264 $43,512 $44, % 3.2% Gross State Product (in millions)... $69,150 $6,865,513 $111,114 $11,665, % 5.4% Full- and Part-Time Positions (in thousands) 1, ,224 1, , % 1.6% Employed Persons (in thousands).. 1, ,060 1, , % 1.2% Unemployment Rate % 6.1% 4.8% 5.5% n/a n/a Sources: U.S. Bureau of the Census, U.S. Bureau of Economic Analysis, and the U.S. Bureau of Labor Statistics 2004 Population Under Age 18 6% 6% Males 24% 7% 10% Females 22% Ages Ages Ages 75 and Over 64% 61% Population Poverty Rate Population and Poverty Percentage Change IA IA IA US IA US Total Population... 2,829,422 2,954, % 12.8% 9.9% 13.1% Males... 1,374,848 1,454, % 13.8% 8.3% 11.6% Under Age , , % 7.8% 13.2% 18.3% Ages , , % 16.7% 6.9% 9.6% Ages ,693 91, % 1.6% 5.1% 6.5% Ages 75 and Over... 73,746 86, % 28.8% 6.5% 6.8% Females... 1,454,574 1,500, % 11.9% 11.5% 14.5% Under Age , , % 8.1% 11.7% 18.6% Ages , , % 14.6% 11.9% 13.6% Ages , , % -3.6% 6.1% 9.7% Ages 75 and Over , , % 19.6% 12.4% 13.3% Source: U.S. Bureau of the Census 120
125 Iowa Percent Distribution of Households by Age of Householder and Income, 2004 Less than $10,000 $10,000 $14,999 $15,000 $24,999 $25,000 $34,999 $35,000 $49,999 $50,000 $74,999 $75,000 $99,999 $100,000 or more All Households Age of Householder Under 25 years % 12.5% 21.8% 18.4% 20.1% 9.7% 1.7% 0.5% 100.0% years % 3.4% 10.9% 11.9% 21.4% 25.4% 11.7% 9.9% 100.0% years % 4.4% 8.7% 11.2% 17.5% 23.0% 15.1% 14.1% 100.0% 65 years and over % 14.6% 22.9% 17.0% 15.1% 10.4% 3.8% 4.1% 100.0% Iowa (all ages) % 6.9% 13.6% 13.3% 18.5% 20.0% 10.4% 9.4% 100.0% United States (all ages). 8.9% 6.3% 12.3% 12.0% 15.5% 19.0% 11.1% 15.0% 100.0% Source: U.S. Bureau of the Census Percent of Households by Household Income Bracket, 2004 Percent of Households 25.0% 20.0% 15.0% 10.0% 5.0% 0.0% Less than $10,000 $10,000 $14,999 $15,000 $24,999 $25,000 $34,999 $35,000 $49,999 $50,000 $74,999 $75,000 $99,999 $100,000 or more Iowa United States 121
126 State and Local General Revenues, FY 2002 Iowa Average Annual Revenue Change General Revenues Per Capita Percent of Personal Income (millions) IA US IA US IA US Total General Revenues... $16,871 $5,749 $5, % 19.3% 5.1% 5.6% Own Sources... $13,245 $4,513 $4, % 15.2% 4.5% 5.2% Taxes... $8,330 $2,839 $3, % 10.4% 3.8% 4.9% Property Taxes... $2,878 $981 $ % 3.2% 3.5% 4.5% General Sales Taxes... $2,016 $687 $ % 2.6% 6.7% 5.4% Personal Income Taxes. $1,814 $618 $ % 2.3% 2.5% 5.8% Other Taxes... $1,622 $553 $ % 2.3% 2.6% 4.3% Charges/Miscellaneous... $4,915 $1,675 $1, % 4.8% 5.8% 5.7% Federal Aid... $3,626 $1,236 $1, % 4.1% 7.6% 7.2% Source: U.S. Bureau of the Census (2002 data are the most current available.) 1992 General Revenue 2002 General Revenue Property Taxes General Sales Taxes Personal Income Taxes Other Taxes 17% 20% 10% 21% 17% 12% Charges/Misc 27% Federal Aid 14% 29% 11% 12% 10% 122
127 Iowa I. Personal Income Tax (2004) State Income Tax Base Iowa s income tax base is not directly linked the federal income tax base. Filing Requirements Taxpayers must file if their Iowa net income exceeds $9,000 (single) or $13,500 (married, filing jointly). Rate Structure All Taxpayers Taxable Income Rate Taxable Income Rate First $1, % $18,631 - $24, % $1,243 - $2, % $24,841 - $37, % $2,485 - $4, % $37,261 - $55, % $4,969 - $11, % Over $55, % $11,179 - $18, % Pension and Retirement Income Exemption Taxpayers age 55 or older or disabled can claim an exemption of $6,000 (single) or $12,000 (married, filing jointly). Social Security Benefits Only taxpayers whose provisional income* is $25,000 or higher (single) or $32,000 or higher (married, filing jointly) are subject taxation of up 50% of their Social Security benefits. *Provisional income consists of federal adjusted gross income, tax-exempt interest, certain foreign-source income, and one-half of the taxpayer s Social Security or Railroad Retirement Tier 1 benefit (U.S. House Committee on the Budget, Omnibus Budget Reconciliation Act of 1993, 103 rd Congress, 1 st sess., 1993, Conference Report , p. 594). Health and Dental Insurance Deduction % for health and dental insurance premiums Long-Term Care Insurance Deduction % for long-term care insurance premiums Standard Deductions (all ages)... $1,580 (single); $3,880 (married, filing jointly) Other Deductions... Full federal income tax deduction Sources: AARP 2005 telephone survey of state legislative staff, state departments of revenue, state controllers offices, state assessors offices, and state treasury offices. 123
128 Iowa Personal Tax Credits Under age $40 (single) and $80 (married, filing jointly) Age 65 or older... $60 (single) and $120 (married, filing jointly; both spouses are age 65 or older) Local Income Taxes... Optional school district surtax and emergency medical services surtax II. General Sales Tax Rates (2004) State % Combined state/local tax rates % 7.0% III. Miscellaneous Tax Rates (2004) Corporate income (highest marginal rate) % On income of $250,000 or more Gasoline (per gallon)... $0.205 (for non-ethanol); $0.19 (for ethanol) Cigarette (per pack of 20)... $0.36 Beer (per gallon)... $0.19 IV. Real Property Tax Relief Programs (2005) Homestead Exemption or Credit Requirements Benefits All homeowners... $4,850 assessed value Disabled veterans whose income is $35,000 or less... Full exemption Circuit Breaker Requirements Benefits Homeowners and renters age 65 or older or disabled whose income is $17,589 or less... Up $1,000 Deferral Program Requirements Benefits Supplemental Security Income recipients... Full deferral of property taxes. Sources: AARP 2005 telephone survey of state legislative staff, state departments of revenue, state controllers offices, state assessors offices, and state treasury offices. 124
129 Iowa V. Real Property Tax Limits, Caps, or Freezes (2005) On a statewide basis, taxable real property values cannot exceed a 4% annual increase. This does not include improvements or additions. Taxing districts have various property tax rate limits, such as $3.50 per $1,000 for a county s general fund. These limits do not apply bonded indebtedness. School districts are constrained in how much they can raise in property taxes for their operating budget based on a school aid formula. Sources: AARP 2005 telephone survey of state legislative staff, state departments of revenue, state controllers offices, state assessors offices, and state treasury offices. 125
130 State and Local General Expenditures, FY 2002 General Expenditures Iowa Average Annual Expenditure Change Percent of Personal Per Capita Income (millions) IA US IA US IA US State/Local Direct General Expends... $17,229 $5,871 $6, % 19.9% 5.4% 5.9% To State/Local Government... $17,186 $5,856 $6, % 19.9% 5.4% 5.9% Education*... $6,467 $2,204 $2, % 6.8% 5.4% 6.2% Public Welfare... $2,682 $914 $ % 3.2% 6.7% 6.1% Health and Hospitals... $1,886 $643 $ % 1.7% 5.4% 5.2% Highways... $1,762 $600 $ % 1.3% 3.4% 5.5% Public Safety*... $1,005 $343 $ % 1.8% 6.2% 6.3% Environment... $1,016 $346 $ % 1.2% 4.8% 5.1% Interest on General Debt... $376 $128 $ % 0.9% 0.3% 3.1% Other... $1,991 $679 $ % 3.0% 6.7% 6.5% To Federal Government... $42 $14 $15 0.1% 0.1% 7.2% 1.9% *Education includes higher and lower education; public safety includes police, fire, corrections, and protection and inspection. Source: U.S. Bureau of the Census (2002 data are the most current available.) State and Local General Expenditures, FY 2002 (excluding payments federal government) 2% 6% 6% 12% 37% Education Public Welfare Health and Hospitals Highways Public Safety 10% Environment Interest on General Debt 11% 16% Other Total Debt Outstanding Long-term Debt Short-term Debt 2002 Debt Ratio Measures Per $1,000 Debt (billions) Per Capita of Personal Income Debt (billions) Percent of Total Debt (billions) Percent of Total Iowa (State and Local)... $9.5 $3,235 $ $ % $ % United States... $1,681.4 $5,839 $ $1, % $ % Source: U.S. Bureau of the Census 126
131 THIS PAGE INTENTIONALLY LEFT BLANK 127
132 Kansas Economic Indicars Average Annual Change KS US KS US KS US Per Capita Income... $20,990 $22,172 $31,003 $33, % 4.1% Median Household Income... $28,322 $32,264 $40,987 $44, % 3.2% Gross State Product (in millions)... $61,805 $6,865,513 $98,946 $11,665, % 5.4% Full- and Part-Time Positions (in thousands) 1, ,224 1, , % 1.6% Employed Persons (in thousands).. 1, ,060 1, , % 1.2% Unemployment Rate % 6.1% 5.5% 5.5% n/a n/a Sources: U.S. Bureau of the Census, U.S. Bureau of Economic Analysis, and the U.S. Bureau of Labor Statistics 2004 Population Under Age 18 6% 5% Males 26% 7% 8% Females 24% Ages Ages Ages 75 and Over 63% 61% Population Poverty Rate Population and Poverty Percentage Change KS KS KS US KS US Total Population... 2,569,118 2,735, % 12.8% 10.5% 13.1% Males... 1,262,797 1,358, % 13.8% 8.9% 11.6% Under Age , , % 7.8% 10.8% 18.3% Ages , , % 16.7% 8.7% 9.6% Ages ,564 77, % 1.6% 5.7% 6.5% Ages 75 and Over... 59,378 70, % 28.8% 4.6% 6.8% Females...1,306,321 1,377, % 11.9% 12.2% 14.5% Under Age , , % 8.1% 14.3% 18.6% Ages , , % 14.6% 11.7% 13.6% Ages ,169 92, % -3.6% 8.3% 9.7% Ages 75 and Over , , % 19.6% 12.6% 13.3% Source: U.S. Bureau of the Census 128
133 Kansas Percent Distribution of Households by Age of Householder and Income, 2004 Less than $10,000 $10,000 $14,999 $15,000 $24,999 $25,000 $34,999 $35,000 $49,999 $50,000 $74,999 $75,000 $99,999 $100,000 or more All Households Age of Householder Under 25 years % 10.6% 22.2% 13.7% 15.3% 11.2% 0.7% 0.8% 100.0% years % 3.7% 11.2% 13.4% 20.1% 23.9% 10.9% 11.5% 100.0% years % 4.1% 9.5% 9.4% 16.2% 23.5% 13.6% 17.0% 100.0% 65 years and over % 14.7% 21.6% 16.0% 13.2% 12.5% 4.7% 5.6% 100.0% Kansas (all ages) % 6.6% 13.5% 12.5% 17.0% 20.5% 9.8% 11.4% 100.0% United States (all ages). 8.9% 6.3% 12.3% 12.0% 15.5% 19.0% 11.1% 15.0% 100.0% Source: U.S. Bureau of the Census Percent of Households by Household Income Bracket, 2004 Percent of Households 25.0% 20.0% 15.0% 10.0% 5.0% 0.0% Less than $10,000 $10,000 $14,999 $15,000 $24,999 $25,000 $34,999 $35,000 $49,999 $50,000 $74,999 $75,000 $99,999 $100,000 or more Kansas United States 129
134 State and Local General Revenues, FY 2002 Kansas Average Annual Revenue Change General Revenues Per Capita Percent of Personal Income (millions) KS US KS US KS US Total General Revenues... $14,635 $5,395 $5, % 19.3% 5.5% 5.6% Own Sources... $11,537 $4,253 $4, % 15.2% 4.9% 5.2% Taxes... $7,975 $2,940 $3, % 10.4% 4.8% 4.9% Property Taxes... $2,525 $931 $ % 3.2% 3.1% 4.5% General Sales Taxes... $2,295 $846 $ % 2.6% 6.9% 5.4% Personal Income Taxes. $1,855 $684 $ % 2.3% 8.3% 5.8% Other Taxes... $1,301 $479 $ % 2.3% 1.7% 4.3% Charges/Miscellaneous... $3,562 $1,313 $1, % 4.8% 5.1% 5.7% Federal Aid... $3,098 $1,142 $1, % 4.1% 8.1% 7.2% Source: U.S. Bureau of the Census (2002 data are the most current available.) 1992 General Revenue 2002 General Revenue Property Taxes General Sales Taxes Personal Income Taxes Other Taxes 17% 22% 21% 17% 16% Charges/Misc 24% 14% 24% Federal Aid 13% 10% 9% 13% 130
135 Kansas I. Personal Income Tax (2004) State Income Tax Base Kansas income tax base is linked federal adjusted gross income. Filing Requirements Taxpayers must file if they are required file a federal tax return or their Kansas adjusted gross income exceeds the combined Kansas standard deduction and personal exemption. Rate Structure Single Married, Filing Jointly Taxable Income Rate Taxable Income Rate First $15, % First $30, % $15,000 - $30, % $30,000 - $60, % Over $30, % Over $60, % Public Pension Exemption... Full exemption Private Pension Exemption... None Social Security Benefits Only taxpayers whose provisional income* is $25,000 or higher (single) or $32,000 or higher (married, filing jointly) are subject taxation of their Social Security benefits. *Provisional income consists of federal adjusted gross income, tax-exempt interest, certain foreign-source income, and one-half of the taxpayer s Social Security or Railroad Retirement Tier 1 benefit (U.S. House Committee on the Budget, Omnibus Budget Reconciliation Act of 1993, 103 rd Congress, 1 st sess., 1993, Conference Report , p. 594). Standard Deductions and Personal Exemptions Combined Under age $5,250 (single); $10,500 (married, filing jointly) Age 65 or older... $6,100 (single); $11,900 (married, filing jointly; both spouses are age 65 or older) Local Income Taxes... None Sources: AARP 2005 telephone survey of state legislative staff, state departments of revenue, state controllers offices, state assessors offices, and state treasury offices. 131
136 Kansas II. General Sales Tax Rates (2004) State % Combined state/local tax rates % 8.3% III. Miscellaneous Tax Rates (2004) Corporate income (highest marginal rate) %* Gasoline (per gallon)... $0.23 Cigarette (per pack of 20)... $0.79 Beer (per gallon)... $0.18 *This includes a 4.0% tax on tal taxable income and a 3.35% surtax on taxable income over $50,000. IV. Real Property Tax Relief Programs (2005) Homestead Exemption or Credit Requirements Benefits All homeowners... $2,300 assessed value or $20,000 fair market value for school property taxes* *The exemption does not apply bonded indebtedness. Circuit Breaker Requirements Benefits Homeowners and renters, age 55 or older, disabled, or with dependent children whose income is $25,000 or less... Up a $600 tax credit Deferral Program... None V. Real Property Tax Limits, Caps, or Freezes (2005) No statewide limits, caps, or freezes are provided. Sources: AARP 2005 telephone survey of state legislative staff, state departments of revenue, state controllers offices, state assessors offices, and state treasury offices. 132
137 Kansas State and Local General Expenditures, FY 2002 General Expenditures Average Annual Expenditure Change Percent of Personal Per Capita Income (millions) KS US KS US KS US State/Local Direct General Expends... $14,876 $5,484 $6, % 19.9% 5.6% 5.9% To State/Local Government... $14,876 $5,483 $6, % 19.9% 5.6% 5.9% Education*... $5,501 $2,028 $2, % 6.8% 4.6% 6.2% Public Welfare... $2,003 $738 $ % 3.2% 8.2% 6.1% Health and Hospitals... $1,231 $454 $ % 1.7% 5.3% 5.2% Highways... $1,528 $563 $ % 1.3% 4.8% 5.5% Public Safety*... $1,106 $408 $ % 1.8% 5.4% 6.3% Environment... $713 $263 $ % 1.2% 4.6% 5.1% Interest on General Debt... $633 $233 $ % 0.9% 3.6% 3.1% Other... $2,161 $797 $ % 3.0% 8.0% 6.5% To Federal Government... $0 $0 $15 0.0% 0.1% 36.7% 1.9% *Education includes higher and lower education; public safety includes police, fire, corrections, and protection and inspection. Source: U.S. Bureau of the Census (2002 data are the most current available.) State and Local General Expenditures, FY 2002 (excluding payments federal government) 15% 4% 5% 7% 10% 8% 13% 38% Education Public Welfare Health and Hospitals Highways Public Safety Environment Interest on General Debt Other Total Debt Outstanding Long-term Debt Short-term Debt 2002 Debt Ratio Measures Per $1,000 Debt (billions) Per Capita of Personal Income Debt (billions) Percent of Total Debt (billions) Percent of Total Kansas (State and Local)... $12.5 $4,589 $ $ % $ % United States... $1,681.4 $5,839 $ $1, % $ % Source: U.S. Bureau of the Census 133
138 Kentucky Economic Indicars Average Annual Change KY US KY US KY US Per Capita Income... $18,225 $22,172 $27,151 $33, % 4.1% Median Household Income... $26,595 $32,264 $35,643 $44, % 3.2% Gross State Product (in millions)... $86,283 $6,865,513 $136,446 $11,665, % 5.4% Full- and Part-Time Positions (in thousands) 2, ,224 2, , % 1.6% Employed Persons (in thousands).. 1, ,060 1, , % 1.2% Unemployment Rate % 6.1% 5.3% 5.5% n/a n/a Sources: U.S. Bureau of the Census, U.S. Bureau of Economic Analysis, and the U.S. Bureau of Labor Statistics 2004 Population Under Age 18 6% 4% Males 25% 7% 7% Females 23% Ages Ages Ages 75 and Over 65% 63% Population Poverty Rate Population and Poverty Percentage Change KY KY KY US KY US Total Population... 3,823,215 4,145, % 12.8% 17.4% 13.1% Males... 1,853,049 2,033, % 13.8% 15.3% 11.6% Under Age , , % 7.8% 24.1% 18.3% Ages ,160,917 1,316, % 16.7% 13.0% 9.6% Ages , , % 1.6% 8.2% 6.5% Ages 75 and Over... 72,883 87, % 28.8% 9.9% 6.8% Females... 1,970,166 2,112, % 11.9% 19.4% 14.5% Under Age , , % 8.1% 26.0% 18.6% Ages ,207,905 1,330, % 14.6% 18.0% 13.6% Ages , , % -3.6% 14.3% 9.7% Ages 75 and Over , , % 19.6% 16.4% 13.3% Source: U.S. Bureau of the Census 134
139 Kentucky Percent Distribution of Households by Age of Householder and Income, 2004 Less than $10,000 $10,000 $14,999 $15,000 $24,999 $25,000 $34,999 $35,000 $49,999 $50,000 $74,999 $75,000 $99,999 $100,000 or more All Households Age of Householder Under 25 years % 12.5% 22.0% 18.1% 13.7% 7.0% 1.5% 0.0% 100.0% years % 5.9% 12.3% 12.7% 18.0% 21.4% 9.8% 8.9% 100.0% years % 6.0% 13.2% 12.2% 14.7% 18.8% 11.8% 12.8% 100.0% 65 years and over % 16.0% 23.5% 14.4% 13.5% 9.0% 3.9% 3.9% 100.0% Kentucky (all ages) % 8.4% 15.5% 13.2% 15.6% 17.1% 8.8% 8.8% 100.0% United States (all ages). 8.9% 6.3% 12.3% 12.0% 15.5% 19.0% 11.1% 15.0% 100.0% Source: U.S. Bureau of the Census Percent of Households by Household Income Bracket, 2004 Percent of Households 20.0% 18.0% 16.0% 14.0% 12.0% 10.0% 8.0% 6.0% 4.0% 2.0% 0.0% Less than $10,000 $10,000 $14,999 $15,000 $24,999 $25,000 $34,999 $35,000 $49,999 $50,000 $74,999 $75,000 $99,999 $100,000 or more Kentucky United States 135
140 State and Local General Revenues, FY 2002 Kentucky Average Annual Revenue Change General Revenues Per Capita Percent of Personal Income (millions) KY US KY US KY US Total General Revenues... $21,231 $5,191 $5, % 19.3% 5.7% 5.6% Own Sources... $15,817 $3,867 $4, % 15.2% 5.3% 5.2% Taxes... $10,781 $2,636 $3, % 10.4% 5.0% 4.9% Property Taxes... $1,977 $483 $ % 3.2% 5.9% 4.5% General Sales Taxes... $2,312 $565 $ % 2.6% 5.4% 5.4% Personal Income Taxes. $3,496 $855 $ % 2.3% 5.5% 5.8% Other Taxes... $2,995 $732 $ % 2.3% 3.8% 4.3% Charges/Miscellaneous... $5,037 $1,231 $1, % 4.8% 5.8% 5.7% Federal Aid... $5,414 $1,324 $1, % 4.1% 6.9% 7.2% Source: U.S. Bureau of the Census (2002 data are the most current available.) 1992 General Revenue 2002 General Revenue Property Taxes General Sales Taxes Personal Income Taxes Other Taxes Charges/Misc 23% 9% 11% 17% 26% 9% 11% 16% Federal Aid 23% 17% 24% 14% 136
141 Kentucky I. Personal Income Tax (2004) State Income Tax Base Kentucky s income tax base is linked federal adjusted gross income. Filing Requirements Taxpayers must file if they receive $5,000 or more from self-employment or if their Kentucky adjusted gross income exceeds the following: Filing Status Kentucky Adjusted Gross Income Under age 65 $5,000 Age 65 and single $5,000 Age 65 and married filing jointly; both spouses are age 65 $6,800 and older Rate Structure All Taxpayers Taxable Income Rate Taxable Income Rate First $3, % $5,000 - $8, % $3,000 - $4, % Over $8, % $4,000 - $5, % Public Pension Exemption Full exemption for those retiring before January 1, Exemption is prorated based on the amount of time worked before and after January 1, 1998 for those retiring after January 1, 1998; however, regardless of their work period, public employees retiring after January 1, 1998 are eligible for at least a $38,775 exemption. Private Pension Exemption...$38,775 Social Security Benefits... Full exemption Standard Deductions (all ages)... $1,800 (single); $3,600 (married, filing jointly) Long-Term Care Insurance Deduction... Long-term care insurance premiums can be deducted as long as they are not deducted elsewhere on the tax return, such as an itemized deduction, or paid with pre-tax income. Sources: AARP 2005 telephone survey of state legislative staff, state departments of revenue, state controllers offices, state assessors offices, and state treasury offices. 137
142 Kentucky Health Insurance Deduction... Health insurance premiums can be deducted as long as they are not deducted elsewhere on the tax return, such as an itemized deduction, or paid with pre-tax income. Any deduction must be reduced by the amount of their federal health coverage tax credit. Personal Tax Credits Under age $20 (single) and $40 (married, filing jointly) Age 65 or older... $40 (single) and $80 (married, filing jointly) Low-Income Tax Credit Eligibility... Single persons and married couples whose combined Kentucky adjusted gross income is less than $25,000 Benefit... Ranging from all taxes 5% of taxes, depending on adjusted gross income Local Income Taxes... Some localities levy a tax on wages. II. General Sales Tax Rates (2004) State...6.0% Combined state/local tax rates % III. Miscellaneous Tax Rates (2004) Corporate income (highest marginal rate) % On income over $250,000 Gasoline (per gallon)... $0.15 Cigarette (per pack of 20)... $0.03* Plus a $0.001 enforcement tax on each package Beer (per gallon)... $0.081 *The cigarette tax rate is scheduled increase $0.30 per pack on June 1, Sources: AARP 2005 telephone survey of state legislative staff, state departments of revenue, state controllers offices, state assessors offices, and state treasury offices. 138
143 Kentucky IV. Real Property Tax Relief Programs (2005) Homestead Exemption or Credit Requirements Benefits Homeowners age 65 or older or tally disabled... $28,000 assessed value Circuit Breaker... None Deferral Program... None V. Real Property Tax Limits, Caps, or Freezes (2005) Real property taxes cannot increase by more than 4% each year unless voters approve a higher increase. This excludes growth from new property. Real Property Tax Rate Limits Counties cannot levy property tax rates above $0.50 per $100 of assessed value; an additional levy of up $0.20 per $100 may be used for roads if approved by the voters. Cities cannot levy property tax rates that exceed $0.75 $1.50 per $100 of assessed value (depending on the city population) without voter approval. School districts cannot levy property tax rates more than $1.50 per $100 of assessed value. This limit does not apply debt service. Sources: AARP 2005 telephone survey of state legislative staff, state departments of revenue, state controllers offices, state assessors offices, and state treasury offices. 139
144 State and Local General Expenditures, FY 2002 General Expenditures Kentucky Average Annual Expenditure Change Percent of Personal Per Capita Income (millions) KY US KY US KY US State/Local Direct General Expends... $21,592 $5,279 $6, % 19.9% 6.1% 5.9% To State/Local Government... $21,592 $5,279 $6, % 19.9% 6.1% 5.9% Education*... $6,878 $1,682 $2, % 6.8% 5.5% 6.2% Public Welfare... $4,816 $1,178 $ % 3.2% 7.2% 6.1% Health and Hospitals... $1,445 $353 $ % 1.7% 6.2% 5.2% Highways... $1,952 $477 $ % 1.3% 6.3% 5.5% Public Safety*... $1,555 $380 $ % 1.8% 7.7% 6.3% Environment... $1,207 $295 $ % 1.2% 5.6% 5.1% Interest on General Debt... $1,490 $364 $ % 0.9% 3.8% 3.1% Other... $2,248 $550 $ % 3.0% 6.4% 6.5% To Federal Government... $0 $0 $15 0.0% 0.1% 0.0% 1.9% *Education includes higher and lower education; public safety includes police, fire, corrections, and protection and inspection. Source: U.S. Bureau of the Census (2002 data are the most current available.) State and Local General Expenditures, FY 2002 (excluding payments federal government) 7% 6% 7% 9% 10% Education Public Welfare 32% Health and Hospitals Highways Public Safety Environment Interest on General Debt Other 7% 22% Total Debt Outstanding Long-term Debt Short-term Debt 2002 Debt Ratio Measures Per $1,000 Debt (billions) Per Capita of Personal Income Debt (billions) Percent of Total Debt (billions) Percent of Total Kentucky (State and Local)... $27.1 $6,635 $ $ % $ % United States... $1,681.4 $5,839 $ $1, % $ % Source: U.S. Bureau of the Census 140
145 THIS PAGE INTENTIONALLY LEFT BLANK 141
146 Louisiana Economic Indicars Average Annual Change LA US LA US LA US Per Capita Income... $18,411 $22,172 $27,219 $33, % 4.1% Median Household Income... $25,676 $32,264 $36,440 $44, % 3.2% Gross State Product (in millions)...$101,943 $6,865,513 $152,944 $11,665, % 5.4% Full- and Part-Time Positions (in thousands) 2, ,224 2, , % 1.6% Employed Persons (in thousands).. 1, ,060 1, , % 1.2% Unemployment Rate % 6.1% 5.7% 5.5% n/a n/a Sources: U.S. Bureau of the Census, U.S. Bureau of Economic Analysis, and the U.S. Bureau of Labor Statistics 2004 Population Under Age 18 6% 4% Males 27% 7% 7% Females 25% Ages Ages Ages 75 and Over 63% 61% Population Poverty Rate Population and Poverty Percentage Change LA LA LA US LA US Total Population...4,306,500 4,515, % 12.8% 19.4% 13.1% Males...2,071,824 2,193, % 13.8% 16.4% 11.6% Under Age , , % 7.8% 29.7% 18.3% Ages ,249,490 1,382, % 16.7% 11.6% 9.6% Ages , , % 1.6% 7.8% 6.5% Ages 75 and Over... 72,120 91, % 28.8% 11.4% 6.8% Females... 2,234,676 2,321, % 11.9% 22.1% 14.5% Under Age , , % 8.1% 30.4% 18.6% Ages ,337,090 1,440, % 14.6% 19.6% 13.6% Ages , , % -3.6% 15.9% 9.7% Ages 75 and Over , , % 19.6% 21.5% 13.3% Source: U.S. Bureau of the Census 142
147 Louisiana Percent Distribution of Households by Age of Householder and Income, 2004 Less than $10,000 $10,000 $14,999 $15,000 $24,999 $25,000 $34,999 $35,000 $49,999 $50,000 $74,999 $75,000 $99,999 $100,000 or more All Households Age of Householder Under 25 years % 11.4% 21.3% 15.0% 11.5% 8.1% 1.1% 0.7% 100.0% years % 6.8% 12.6% 13.9% 16.6% 20.0% 10.4% 9.1% 100.0% years % 6.1% 13.3% 10.5% 14.7% 18.2% 11.6% 14.4% 100.0% 65 years and over % 14.7% 20.9% 14.1% 13.7% 7.9% 5.0% 6.4% 100.0% Louisiana (all ages) % 8.4% 15.1% 12.8% 15.0% 16.1% 9.1% 9.9% 100.0% United States (all ages). 8.9% 6.3% 12.3% 12.0% 15.5% 19.0% 11.1% 15.0% 100.0% Source: U.S. Bureau of the Census Percent of Households by Household Income Bracket, 2004 Percent of Households 20.0% 18.0% 16.0% 14.0% 12.0% 10.0% 8.0% 6.0% 4.0% 2.0% 0.0% Less than $10,000 $10,000 $14,999 $15,000 $24,999 $25,000 $34,999 $35,000 $49,999 $50,000 $74,999 $75,000 $99,999 $100,000 or more Louisiana United States 143
148 State and Local General Revenues, FY 2002 Louisiana Average Annual Revenue Change General Revenues Per Capita Percent of Personal Income (millions) LA US LA US LA US Total General Revenues... $26,048 $5,818 $5, % 19.3% 5.3% 5.6% Own Sources... $19,563 $4,370 $4, % 15.2% 5.4% 5.2% Taxes... $12,182 $2,721 $3, % 10.4% 5.6% 4.9% Property Taxes... $1,940 $433 $ % 3.2% 5.2% 4.5% General Sales Taxes... $4,838 $1,081 $ % 2.6% 5.9% 5.4% Personal Income Taxes. $1,789 $400 $ % 2.3% 7.5% 5.8% Other Taxes... $3,615 $807 $ % 2.3% 4.7% 4.3% Charges/Miscellaneous... $7,381 $1,649 $1, % 4.8% 5.0% 5.7% Federal Aid... $6,485 $1,448 $1, % 4.1% 5.0% 7.2% Source: U.S. Bureau of the Census (2002 data are the most current available.) 1992 General Revenue 2002 General Revenue Property Taxes 8% 7% General Sales Taxes Personal Income Taxes Other Taxes Charges/Misc 25% 18% 6% 25% 19% 7% Federal Aid 28% 15% 28% 14% 144
149 Louisiana I. Personal Income Tax (2004) State Income Tax Base Louisiana s income tax base is linked federal adjusted gross income. Filing Requirements Taxpayers must file if they filed a federal tax return. Rate Structure Single Married, Filing Jointly Taxable Income Rate Taxable Income Rate First $12, % First $25, % $12,501 - $25, % $25,001 - $50, % Over $25, % Over $50, % Public Pension Exemption... Full exemption Private Pension and Annuity Exemption... $6,000 for persons age 65 or older Social Security Benefits... Full exemption Standard Deductions and Personal Exemptions Combined Under age $4,500 (single); $9,000 (married, filing jointly) Age 65 or older... $5,500 (single); $11,000 (married, filing jointly; both spouses are age 65 or older) Other Deductions... Full federal income tax deduction Local Income Taxes... None II. General Sales Tax Rates (2004) State % Combined state/local tax rates % 10.0% Sources: AARP 2005 telephone survey of state legislative staff, state departments of revenue, state controllers offices, state assessors offices, and state treasury offices. 145
150 Louisiana III. Miscellaneous Tax Rates (2004) Corporate income (highest marginal rate) % On income over $200,000 Gasoline (per gallon)... $0.20 Cigarette (per pack of 20)... $0.36 Beer (per gallon)... $0.323 Parishes and cities may levy an additional $0.048 per gallon tax. IV. Real Property Tax Relief Programs (2005) Homestead Exemption or Credit Requirements Benefits All homeowners... $7,500 assessed value; does not apply municipal taxes except in Orleans Parish Circuit Breaker... None Deferral Program... None V. Real Property Tax Limits, Caps, or Freezes (2005) Individual real property assessments will remain frozen and unchanged for homeowners age 65 or older whose household income is less than $56,774 per year. All taxing districts are limited by maximum property tax rates that are set by the state legislature. During reassessment of real property (every four years), local taxing districts must adjust their real property tax rates so that the tal revenue collected for the districts remains the same as the previous year. This adjustment of property tax rates does not apply additions and property improvements. Moreover, property tax rates could still be raised further with voter approval. Sources: AARP 2005 telephone survey of state legislative staff, state departments of revenue, state controllers offices, state assessors offices, and state treasury offices. 146
151 Louisiana State and Local General Expenditures, FY 2002 General Expenditures Average Annual Expenditure Change Percent of Personal Per Capita Income (millions) LA US LA US LA US State/Local Direct General Expends... $24,321 $5,432 $6, % 19.9% 4.4% 5.9% To State/Local Government... $24,321 $5,432 $6, % 19.9% 4.4% 5.9% Education*... $7,994 $1,786 $2, % 6.8% 5.4% 6.2% Public Welfare... $3,362 $751 $ % 3.2% 2.8% 6.1% Health and Hospitals... $3,621 $809 $ % 1.7% 5.9% 5.2% Highways... $1,531 $342 $ % 1.3% 2.2% 5.5% Public Safety*... $2,124 $474 $ % 1.8% 6.1% 6.3% Environment... $1,450 $324 $ % 1.2% 3.5% 5.1% Interest on General Debt... $1,054 $235 $ % 0.9% -2.3% 3.1% Other... $3,184 $711 $ % 3.0% 6.1% 6.5% To Federal Government... $0 $0 $15 0.0% 0.1% 0.0% 1.9% *Education includes higher and lower education; public safety includes police, fire, corrections, and protection and inspection. Source: U.S. Bureau of the Census (2002 data are the most current available.) State and Local General Expenditures, FY 2002 (excluding payments federal government) 4% 13% 33% Education Public Welfare Health and Hospitals 6% Highways Public Safety 9% Environment 6% 15% 14% Interest on General Debt Other Total Debt Outstanding Long-term Debt Short-term Debt 2002 Debt Ratio Measures Per $1,000 Debt (billions) Per Capita of Personal Income Debt (billions) Percent of Total Debt (billions) Percent of Total Louisiana (State and Local)... $21.0 $4,687 $ $ % $ % United States... $1,681.4 $5,839 $ $1, % $ % Source: U.S. Bureau of the Census 147
152 Maine Economic Indicars Average Annual Change ME US ME US ME US Per Capita Income... $19,387 $22,172 $29,973 $33, % 4.1% Median Household Income... $30,316 $32,264 $41,363 $44, % 3.2% Gross State Product (in millions)... $26,204 $6,865,513 $43,336 $11,665, % 5.4% Full- and Part-Time Positions (in thousands) , , % 1.6% Employed Persons (in thousands) , , % 1.2% Unemployment Rate % 6.1% 4.6% 5.5% n/a n/a Sources: U.S. Bureau of the Census, U.S. Bureau of Economic Analysis, and the U.S. Bureau of Labor Statistics 2004 Population Under Age 18 7% 6% Males 23% 7% 9% Females 20% Ages Ages Ages 75 and Over 64% 64% Population Poverty Rate Population and Poverty Percentage Change ME ME ME US ME US Total Population... 1,237,687 1,317, % 12.8% 12.3% 13.1% Males , , % 13.8% 11.0% 11.6% Under Age , , % 7.8% 16.3% 18.3% Ages , , % 16.7% 10.1% 9.6% Ages ,320 44, % 1.6% 3.6% 6.5% Ages 75 and Over... 27,177 35, % 28.8% 8.9% 6.8% Females , , % 11.9% 13.6% 14.5% Under Age , , % 8.1% 17.9% 18.6% Ages , , % 14.6% 12.5% 13.6% Ages ,459 50, % -3.6% 8.4% 9.7% Ages 75 and Over... 49,608 58, % 19.6% 16.1% 13.3% Source: U.S. Bureau of the Census 148
153 Maine Percent Distribution of Households by Age of Householder and Income, 2004 Less than $10,000 $10,000 $14,999 $15,000 $24,999 $25,000 $34,999 $35,000 $49,999 $50,000 $74,999 $75,000 $99,999 $100,000 or more All Households Age of Householder Under 25 years % 8.6% 12.6% 29.1% 17.6% 5.0% 0.0% 0.0% 100.0% years % 2.7% 10.5% 11.4% 19.0% 25.4% 12.1% 10.6% 100.0% years % 4.0% 10.0% 10.2% 16.5% 22.0% 14.1% 15.8% 100.0% 65 years and over % 16.2% 22.2% 16.9% 13.5% 9.7% 4.9% 3.7% 100.0% Maine (all ages) % 6.4% 12.9% 13.0% 16.7% 19.7% 10.8% 10.7% 100.0% United States (all ages). 8.9% 6.3% 12.3% 12.0% 15.5% 19.0% 11.1% 15.0% 100.0% Source: U.S. Bureau of the Census Percent of Households by Household Income Bracket, 2004 Percent of Households 25.0% 20.0% 15.0% 10.0% 5.0% 0.0% Less than $10,000 $10,000 $14,999 $15,000 $24,999 $25,000 $34,999 $35,000 $49,999 $50,000 $74,999 $75,000 $99,999 $100,000 or more Maine United States 149
154 State and Local General Revenues, FY 2002 Maine Average Annual Revenue Change General Revenues Per Capita Percent of Personal Income (millions) ME US ME US ME US Total General Revenues... $8,077 $6,224 $5, % 19.3% 5.5% 5.6% Own Sources... $6,176 $4,759 $4, % 15.2% 5.2% 5.2% Taxes... $4,541 $3,499 $3, % 10.4% 5.3% 4.9% Property Taxes... $1,912 $1,473 $ % 3.2% 6.0% 4.5% General Sales Taxes... $836 $644 $ % 2.6% 3.8% 5.4% Personal Income Taxes. $1,073 $827 $ % 2.3% 6.1% 5.8% Other Taxes... $720 $555 $ % 2.3% 4.2% 4.3% Charges/Miscellaneous... $1,635 $1,260 $1, % 4.8% 4.9% 5.7% Federal Aid... $1,901 $1,465 $1, % 4.1% 6.6% 7.2% Source: U.S. Bureau of the Census (2002 data are the most current available.) 1992 General Revenue 2002 General Revenue Property Taxes General Sales Taxes Personal Income Taxes Other Taxes Charges/Misc 21% 21% 23% 12% 24% 20% 24% 10% Federal Aid 10% 13% 9% 13% 150
155 Maine I. Personal Income Tax (2004) State Income Tax Base Maine s income tax base is linked federal adjusted gross income. Filing Requirements Taxpayers must file if they are required file a federal return and if their taxable Maine income results in having income tax liability. Rate Structure Single Married, Filing Jointly Taxable Income Rate Taxable Income Rate First $4, % First $8, % $4,350 - $8, % $8,700 - $17, % $8,650 - $17, % $17,350 - $34, % Over $17, % Over $34, % Public and Private Pension Exemptions... $6,000 exemption reduced by Social Security and Railroad Retirement benefits (except for military pensions) Military Pension Exemption... $6,000 exemption Social Security Benefits... Full exemption Standard Deductions and Personal Exemptions Combined Under age $7,700 (single); $13,850 (married, filing jointly; both spouses are under age 65) Age 65 or older... $8,650 (single); $15,750 (married, filing jointly; both spouses are age 65 or older) Long-Term Care Insurance Deduction... Long-term care insurance premiums can be deducted; however, any premiums that are deducted must be reduced by any premiums claimed as a Maine itemized deduction Elderly Tax Credit Twenty percent of the federal elderly tax credit can be claimed. Local Income Taxes... None Sources: AARP 2005 telephone survey of state legislative staff, state departments of revenue, state controllers offices, state assessors offices, and state treasury offices. 151
156 Maine II. General Sales Tax Rates (2004) State % Combined state/local tax rates % III. Miscellaneous Tax Rates (2004) Corporate income (highest marginal rate) % On income over $250,000 Gasoline (per gallon)... $0.252 Cigarette (per pack of 20)... $1.00 Beer (per gallon)... $0.35 IV. Real Property Tax Relief Programs (2005) Homestead Exemption* Requirements Benefits All homeowners... $13,000 assessed value Blind homeowners... $4,000 assessed value WWI veterans age 62 or older... $7,000 assessed value WWI widows of veterans age 62 or older... $7,000 assessed value Other veterans age 62 or older... $5,000 assessed value Other widows of veterans age 62 or older... $5,000 assessed value Disabled (paraplegic) and dependents... $47,500 assessed value *All exemption amounts assume that real property is assessed at 100% of the fair market value. Circuit Breaker Requirements Benefits Homeowners and renters age 62 or older or disabled age 55 or older whose income is $12,400 or less (single with no dependents) or $15,300 or less (with a spouse or dependents)... Up a $400 tax credit* Starting in 2005, for property taxes in 2004, homeowners and renters whose income is $74,500 or less (single with no dependents) or $99,500 or less (someone with a spouse or dependents)... Up a $2,000 tax credit* *Any homeowner or renter who qualifies for both circuit breaker programs will receive a tax credit equal the larger of the two programs. Sources: AARP 2005 telephone survey of state legislative staff, state departments of revenue, state controllers offices, state assessors offices, and state treasury offices. 152
157 Maine Deferral Program Requirements Benefits Homeowners age 65 or older who first applied the program in 1990, whose income is $32,000 or less... Full deferral of property taxes V. Real Property Tax Limits, Caps, or Freezes (2005) In 2005, the state legislature passed property tax caps affecting counties and municipalities. When state and local tax burdens (state and local taxes as a percentage of personal income) are in the p one-third of states, county and municipal property taxes cannot increase by more than the 10-year average in real personal income growth (up 2.75%) plus the growth rate in all new real property. When state and local tax burdens are in the middle one-third of states, county and municipal property taxes cannot increase by more than the 10-year average in real personal income growth plus the forecasted growth in the CPI plus the growth rate in all new real property. The property tax caps can be overridden through referenda, court orders or decrees, unfunded state or federal mandates, or extraordinary events, such as natural disasters. Sources: AARP 2005 telephone survey of state legislative staff, state departments of revenue, state controllers offices, state assessors offices, and state treasury offices. 153
158 State and Local General Expenditures, FY 2002 General Expenditures Maine Average Annual Expenditure Change Percent of Personal Per Capita Income (millions) ME US ME US ME US State/Local Direct General Expends... $7,984 $6,152 $6, % 19.9% 5.4% 5.9% To State/Local Government... $7,948 $6,124 $6, % 19.9% 5.4% 5.9% Education*... $2,491 $1,920 $2, % 6.8% 4.4% 6.2% Public Welfare... $1,792 $1,381 $ % 3.2% 6.0% 6.1% Health and Hospitals... $500 $385 $ % 1.7% 9.2% 5.2% Highways... $618 $476 $ % 1.3% 4.6% 5.5% Public Safety*... $449 $346 $ % 1.8% 4.4% 6.3% Environment... $424 $327 $ % 1.2% 3.5% 5.1% Interest on General Debt... $329 $253 $ % 0.9% 1.6% 3.1% Other... $1,346 $1,037 $ % 3.0% 8.4% 6.5% To Federal Government... $36 $28 $15 0.1% 0.1% 17.2% 1.9% *Education includes higher and lower education; public safety includes police, fire, corrections, and protection and inspection. Source: U.S. Bureau of the Census (2002 data are the most current available.) State and Local General Expenditures, FY 2002 (excluding payments federal government) 4% 17% 31% Education Public Welfare Health and Hospitals Highways 5% Public Safety 6% Environment Interest on General Debt 8% Other 6% 23% Total Debt Outstanding Long-term Debt Short-term Debt 2002 Debt Ratio Measures Per $1,000 Debt (billions) Per Capita of Personal Income Debt (billions) Percent of Total Debt (billions) Percent of Total Maine (State and Local)... $6.3 $4,890 $ $ % $ % United States... $1,681.4 $5,839 $ $1, % $ % Source: U.S. Bureau of the Census 154
159 THIS PAGE INTENTIONALLY LEFT BLANK 155
160 Maryland Economic Indicars Average Annual Change MD US MD US MD US Per Capita Income... $25,587 $22,172 $39,629 $33, % 4.1% Median Household Income... $39,198 $32,264 $57,319 $44, % 3.2% Gross State Product (in millions)... $132,052 $6,865,513 $227,991 $11,665, % 5.4% Full- and Part-Time Positions (in thousands) 2, ,224 3, , % 1.6% Employed Persons (in thousands).. 2, ,060 2, , % 1.2% Unemployment Rate % 6.1% 4.2% 5.5% n/a n/a Sources: U.S. Bureau of the Census, U.S. Bureau of Economic Analysis, and the U.S. Bureau of Labor Statistics 2004 Population Under Age 18 5% 4% Males 26% 6% 7% Females 24% Ages Ages Ages 75 and Over 65% 63% Population Poverty Rate Population and Poverty Percentage Change MD MD MD US MD US Total Population... 4,985,411 5,558, % 12.8% 8.8% 13.1% Males... 2,420,483 2,690, % 13.8% 7.9% 11.6% Under Age , , % 7.8% 11.5% 18.3% Ages ,552,585 1,715, % 16.7% 6.8% 9.6% Ages , , % 1.6% 5.1% 6.5% Ages 75 and Over... 81, , % 28.8% 4.9% 6.8% Females... 2,564,928 2,867, % 11.9% 9.6% 14.5% Under Age , , % 8.1% 11.3% 18.6% Ages ,614,800 1,812, % 14.6% 8.9% 13.6% Ages , , % -3.6% 8.2% 9.7% Ages 75 and Over , , % 19.6% 11.4% 13.3% Source: U.S. Bureau of the Census 156
161 Maryland Percent Distribution of Households by Age of Householder and Income, 2004 Less than $10,000 $10,000 $14,999 $15,000 $24,999 $25,000 $34,999 $35,000 $49,999 $50,000 $74,999 $75,000 $99,999 $100,000 or more All Households Age of Householder Under 25 years % 9.3% 17.1% 19.1% 14.8% 19.2% 4.1% 3.7% 100.0% years % 2.4% 6.5% 8.8% 16.4% 22.1% 16.7% 22.2% 100.0% years % 1.9% 6.3% 7.5% 12.5% 19.2% 14.7% 32.6% 100.0% 65 years and over % 10.0% 16.2% 14.2% 14.6% 14.6% 8.4% 12.7% 100.0% Maryland (all ages) % 4.0% 8.7% 9.7% 14.5% 19.4% 13.8% 23.7% 100.0% United States (all ages). 8.9% 6.3% 12.3% 12.0% 15.5% 19.0% 11.1% 15.0% 100.0% Source: U.S. Bureau of the Census Percent of Households by Household Income Bracket, 2004 Percent of Households 25.0% 20.0% 15.0% 10.0% 5.0% 0.0% Less than $10,000 $10,000 $14,999 $15,000 $24,999 $25,000 $34,999 $35,000 $49,999 $50,000 $74,999 $75,000 $99,999 $100,000 or more Maryland United States 157
162 State and Local General Revenues, FY 2002 Maryland Average Annual Revenue Change General Revenues Per Capita Percent of Personal Income (millions) MD US MD US MD US Total General Revenues... $32,319 $5,939 $5, % 19.3% 5.8% 5.6% Own Sources... $26,391 $4,850 $4, % 15.2% 5.6% 5.2% Taxes... $19,874 $3,652 $3, % 10.4% 5.6% 4.9% Property Taxes... $5,412 $995 $ % 3.2% 5.4% 4.5% General Sales Taxes... $2,690 $494 $ % 2.6% 5.5% 5.4% Personal Income Taxes. $7,644 $1,405 $ % 2.3% 5.9% 5.8% Other Taxes... $4,127 $759 $ % 2.3% 5.6% 4.3% Charges/Miscellaneous... $6,517 $1,198 $1, % 4.8% 5.3% 5.7% Federal Aid... $5,927 $1,089 $1, % 4.1% 7.1% 7.2% Source: U.S. Bureau of the Census (2002 data are the most current available.) 1992 General Revenue 2002 General Revenue Property Taxes General Sales Taxes Personal Income Taxes Other Taxes Charges/Misc 21% 16% 18% 9% 20% 18% 17% 8% Federal Aid 13% 23% 13% 24% 158
163 Maryland I. Personal Income Tax (2004) State Income Tax Base Maryland s income tax base is linked federal adjusted gross income. Filing Requirements Taxpayers must file if their tal gross income plus addition modifications and less any social security and railroad retirement benefits equals or exceeds the federal minimum filing income thresholds. Minimum Filing Income Thresholds Under age $7,950 (single); $15,900 (married, filing jointly; both spouses are under age 65) Age 65 or older... $9,150 (single); $17,800 (married, filing jointly, both spouses are age 65 or older) Rate Structure Single Married, Filing Jointly Taxable Income Rate Taxable Income Rate First $1, % First $1, % $1,000 - $2, % $1,000 - $2, % $2,000 - $3, % $2,000 - $3, % Over $3, % Over $3, % Public and Private Pension Exemptions $20,700 exemption reduced by Social Security and Federal Railroad Retirement benefits for persons age 65 and over; some military pensioners are eligible for an additional pension exemption of up $2,500. Social Security Benefits... Full exemption Sources: AARP 2005 telephone survey of state legislative staff, state departments of revenue, state controllers offices, state assessors offices, and state treasury offices. 159
164 Maryland Standard Deductions and Personal Exemptions Combined* Under age $3,900 $4,400 (single); $7,800 $8,800 (married, filing jointly; both spouses are under age 65) Age 65 or older... $4,900 $5,400 (single); $9,800 $10,800 (married, filing jointly; both spouses are age 65 or older) *Standard deductions equal 15% of Maryland adjusted gross income with a minimum deduction of $1,500 (single) and $3,000 (married, filing jointly) and a maximum deduction of $2,000 (single) and $4,000 (married, filing jointly). Personal exemptions equal $2,400 (single) and $4,800 (married, filing jointly). Long-Term Care Insurance Credit Taxpayers can claim a tax credit up $260 (under age 41), $490 (ages 41 50), and $500 (over age 50) for long-term insurance premiums. The credit can only be claimed for one tax year, and the insured cannot have been covered by long-term care insurance before July 1, Local Income Taxes...From 1.25% 3.2% of Maryland taxable income II. General Sales Tax Rates (2004) State % Combined state/local tax rates % III. Miscellaneous Tax Rates (2004) Corporate income (highest marginal rate) % On all taxable income Gasoline (per gallon)... $0.235 Cigarette (per pack of 20)... $1.00 Beer (per gallon)... $0.09 Sources: AARP 2005 telephone survey of state legislative staff, state departments of revenue, state controllers offices, state assessors offices, and state treasury offices. 160
165 Maryland IV. Real Property Tax Relief Programs (2005) Homestead Exemption or Credit... None Circuit Breaker Requirements Benefits All homeowners; renters, age 60 and older, or disabled, or under age 60 with dependent(s), whose household net worth is $200,000 or less*... Up $600 for renters; up taxes paid on the first $150,000 assessed value for homeowners *The $200,000 does not include the primary residence that is occupied. Deferral Program (local option program) Requirements Benefits Homeowners age 65 or older or disabled and who have lived in their home for at least five years and meet local income guidelines... Full deferral of property taxes V. Real Property Tax Limits, Caps, or Freezes (2005) Assessed property values established by the state government cannot annually increase by more than 10%. Local governments have the option of further limiting the annual increase in assessed values. Property values are also limited by phasing in increases in fair market value over a three-year period. Sources: AARP 2005 telephone survey of state legislative staff, state departments of revenue, state controllers offices, state assessors offices, and state treasury offices. 161
166 State and Local General Expenditures, FY 2002 General Expenditures Maryland Average Annual Expenditure Change Percent of Personal Per Capita Income (millions) MD US MD US MD US State/Local Direct General Expends... $31,796 $5,843 $6, % 19.9% 5.9% 5.9% To State/Local Government... $31,796 $5,843 $6, % 19.9% 5.9% 5.9% Education*... $12,142 $2,231 $2, % 6.8% 6.9% 6.2% Public Welfare... $4,737 $871 $ % 3.2% 5.7% 6.1% Health and Hospitals... $1,490 $274 $ % 1.7% 5.2% 5.2% Highways... $1,855 $341 $ % 1.3% 5.2% 5.5% Public Safety*... $3,281 $603 $ % 1.8% 6.1% 6.3% Environment... $2,141 $394 $ % 1.2% 4.4% 5.1% Interest on General Debt... $1,368 $251 $ % 0.9% 2.6% 3.1% Other... $4,781 $879 $ % 3.0% 5.8% 6.5% To Federal Government... $0 $0 $15 0.0% 0.1% n/a 1.9% *Education includes higher and lower education; public safety includes police, fire, corrections, and protection and inspection. Source: U.S. Bureau of the Census (2002 data are the most current available.) State and Local General Expenditures, FY 2002 (excluding payments federal government) 15% Education Public Welfare 7% 4% 38% Health and Hospitals Highways Public Safety Environment 10% Interest on General Debt 6% 5% 15% Other Total Debt Outstanding Long-term Debt Short-term Debt 2002 Debt Ratio Measures Per $1,000 Debt (billions) Per Capita of Personal Income Debt (billions) Percent of Total Debt (billions) Percent of Total Maryland (State and Local)... $25.7 $4,716 $ $ % $ % United States... $1,681.4 $5,839 $ $1, % $ % Source: U.S. Bureau of the Census 162
167 THIS PAGE INTENTIONALLY LEFT BLANK 163
168 Massachusetts Economic Indicars Average Annual Change MA US MA US MA US Per Capita Income... $26,303 $22,172 $42,102 $33, % 4.1% Median Household Income... $40,500 $32,264 $52,370 $44, % 3.2% Gross State Product (in millions)... $185,335 $6,865,513 $317,798 $11,665, % 5.4% Full- and Part-Time Positions (in thousands) 3, ,224 4, , % 1.6% Employed Persons (in thousands).. 2, ,060 3, , % 1.2% Unemployment Rate % 6.1% 5.1% 5.5% n/a n/a Sources: U.S. Bureau of the Census, U.S. Bureau of Economic Analysis, and the U.S. Bureau of Labor Statistics 2004 Population Under Age 18 6% 5% Males 24% 7% 9% Females 22% Ages Ages Ages 75 and Over 65% 62% Population Poverty Rate Population and Poverty Percentage Change MA MA MA US MA US Total Population... 6,031,352 6,416, % 12.8% 9.2% 13.1% Males... 2,901,803 3,106, % 13.8% 7.9% 11.6% Under Age , , % 7.8% 12.4% 18.3% Ages ,842,895 2,010, % 16.7% 6.3% 9.6% Ages , , % 1.6% 6.0% 6.5% Ages 75 and Over , , % 28.8% 8.0% 6.8% Females... 3,129,549 3,310, % 11.9% 10.5% 14.5% Under Age , , % 8.1% 12.7% 18.6% Ages ,917,024 2,087, % 14.6% 9.8% 13.6% Ages , , % -3.6% 9.9% 9.7% Ages 75 and Over , , % 19.6% 10.1% 13.3% Source: U.S. Bureau of the Census 164
169 Massachusetts Percent Distribution of Households by Age of Householder and Income, 2004 Less than $10,000 $10,000 $14,999 $15,000 $24,999 $25,000 $34,999 $35,000 $49,999 $50,000 $74,999 $75,000 $99,999 $100,000 or more All Households Age of Householder Under 25 years % 5.0% 14.5% 13.2% 19.5% 16.8% 4.0% 5.6% 100.0% years % 3.4% 5.9% 7.7% 14.4% 22.6% 15.8% 24.4% 100.0% years % 3.4% 6.0% 7.6% 11.3% 19.6% 15.5% 30.7% 100.0% 65 years and over % 13.9% 18.9% 12.5% 15.1% 12.8% 5.7% 9.2% 100.0% Massachusetts (all ages).. 7.7% 5.7% 9.0% 8.9% 13.6% 19.2% 13.1% 22.8% 100.0% United States (all ages) % 6.3% 12.3% 12.0% 15.5% 19.0% 11.1% 15.0% 100.0% Source: U.S. Bureau of the Census Percent of Households by Household Income Bracket, 2004 Percent of Households 25.0% 20.0% 15.0% 10.0% 5.0% 0.0% Less than $10,000 $10,000 $14,999 $15,000 $24,999 $25,000 $34,999 $35,000 $49,999 $50,000 $74,999 $75,000 $99,999 $100,000 or more Massachusetts United States 165
170 State and Local General Revenues, FY 2002 Massachusetts Average Annual Revenue Change General Revenues Per Capita Percent of Personal Income (millions) MA US MA US MA US Total General Revenues... $39,002 $6,082 $5, % 19.3% 4.3% 5.6% Own Sources... $32,826 $5,119 $4, % 15.2% 4.6% 5.2% Taxes... $23,895 $3,726 $3, % 10.4% 4.6% 4.9% Property Taxes... $8,722 $1,360 $ % 3.2% 5.2% 4.5% General Sales Taxes... $3,696 $576 $ % 2.6% 6.4% 5.4% Personal Income Taxes. $7,913 $1,234 $ % 2.3% 4.0% 5.8% Other Taxes... $3,565 $556 $ % 2.3% 2.7% 4.3% Charges/Miscellaneous... $8,930 $1,393 $1, % 4.8% 4.9% 5.7% Federal Aid... $6,176 $963 $1, % 4.1% 2.4% 7.2% Source: U.S. Bureau of the Census (2002 data are the most current available.) 1992 General Revenue 2002 General Revenue Property Taxes General Sales Taxes Personal Income Taxes Other Taxes Charges/Misc 21% 19% 20% 8% 16% 22% 24% 9% Federal Aid 11% 21% 9% 20% 166
171 Massachusetts I. Personal Income Tax (2004) State Income Tax Base Massachusetts income tax base is linked federal gross income. Filing Requirements Taxpayers must file if their gross income exceeds $8,000. Rate Structure All Taxpayers Taxable Income Earned income, interest, dividends, and longterm capital gains (not collectible assets and those assets held for more than one year) Short-term capital gains and long-term capital gains from the sale of collectibles Rate 5.3% 12% Public Pension Exemption... Full exemption Private Pension Exemption... None Social Security Benefits... Full exemption Personal Exemptions Under age $3,300 (single); $6,600 (married, filing jointly) Age 65 or older... $4,000 (single); $8,000 (married, filing jointly; both spouses are age 65 or older) Local Income Taxes... None II. General Sales Tax Rates (2004) State % Combined state/local tax rates % Sources: AARP 2005 telephone survey of state legislative staff, state departments of revenue, state controllers offices, state assessors offices, and state treasury offices. 167
172 Massachusetts III. Miscellaneous Tax Rates (2004) Corporate income (highest marginal rate) %* Gasoline (per gallon)... $0.21 Cigarette (per pack of 20)... $1.51 Beer (per gallon)... $0.106 *Corporations pay an excise tax equal the greater of the following: (a) $2.60 (includes surtax) per $1,000 of value of Massachusetts tangible property not taxed locally or net worth allocated Massachusetts, plus 9.5% of net income, or (b) $456, whichever is greater. IV. Property Tax Relief Programs (2005) Homestead Exemption or Credit Requirements Benefits Homeowners age 70 or older, surviving spouses, and certain veterans whose income is $13,000 or less (single) or $15,000 or less (married couple)... $4,000 assessed value or $500 (whichever is greater); local option raise the maximum credit from $500 $1,000, change the age requirement from 70 65, and increase the income requirements from $13,000 $20,000 (single) and from $15,000 $30,000 (married couple) Homeowners age 70 or older and surviving spouses... $2,000 assessed value or $175 (whichever is greater); local option have higher benefits Blind homeowners... $5,000 assessed value or $ (whichever is greater); local option up $500 Disabled (paraplegic veterans) homeowners... Full exemption Circuit Breaker Requirements Benefits Homeowners and renters age 65 or older whose income is $45,000 or less (single) or $67,000 or less (married, filing jointly). In addition, the residence cannot exceed $600,000 in assessed value.... Up an $840 tax credit Sources: AARP 2005 telephone survey of state legislative staff, state departments of revenue, state controllers offices, state assessors offices, and state treasury offices. 168
173 Massachusetts Renter s Tax Deduction Requirements Benefits All renters.....income tax deduction equal 50% of the yearly rent (up $3,000 for single persons and married couples filing jointly) Deferral Program Requirements Benefits Homeowners age 65 or older who have lived in Massachusetts for at least 10 years and owned real property in Massachusetts for at least 5 years - whose income is $20,000 or less or $40,000 or less (local option)... Deferral of all or a portion of the taxes each year until the amount deferred plus 8% simple interest reaches 50% of the applicant s interest in the property V. Real Property Tax Limits, Caps, or Freezes (2005) Generally, local taxing districts cannot levy more than 2.5% of the tal full and fair cash value of all taxable real and personal property (levy ceiling). In addition, local taxing districts cannot annually increase tal real and personal property taxes by more than 2.5% from the previous year s tal allowable property taxes (levy limit). In summary, a local taxing district cannot raise more than the levy ceiling or the levy limit (whichever is less). The levy limit does not pertain new property growth and higher allowable property taxes approved by voters. Moreover, a community can assess taxes in excess of its levy limit or its levy ceiling through debt exclusions and capital outlay expenditure exclusions. Sources: AARP 2005 telephone survey of state legislative staff, state departments of revenue, state controllers offices, state assessors offices, and state treasury offices. 169
174 State and Local General Expenditures, FY 2002 General Expenditures Massachusetts Average Annual Expenditure Change Percent of Per Capita Personal Income (millions) MA US MA US MA US State/Local Direct General Expends... $42,527 $6,632 $6, % 19.9% 5.5% 5.9% To State/Local Government... $42,347 $6,604 $6, % 19.9% 5.5% 5.9% Education*... $13,443 $2,096 $2, % 6.8% 7.7% 6.2% Public Welfare... $5,731 $894 $ % 3.2% 1.2% 6.1% Health and Hospitals... $3,174 $495 $ % 1.7% 4.0% 5.2% Highways... $3,257 $508 $ % 1.3% 9.5% 5.5% Public Safety*... $3,594 $560 $ % 1.8% 5.7% 6.3% Environment... $1,768 $276 $ % 1.2% 2.9% 5.1% Interest on General Debt... $3,236 $505 $ % 0.9% 6.5% 3.1% Other... $8,142 $1,270 $ % 3.0% 5.9% 6.5% To Federal Government... $181 $28 $15 0.1% 0.1% 2.0% 1.9% *Education includes higher and lower education; public safety includes police, fire, corrections, and protection and inspection. Source: U.S. Bureau of the Census (2002 data are the most current available.) State and Local General Expenditures, FY 2002 (excluding payments federal government) 19% Education Public Welfare 32% Health and Hospitals 8% Highways Public Safety 4% 8% 8% 7% 14% Environment Interest on General Debt Other Total Debt Outstanding Long-term Debt Short-term Debt 2002 Debt Ratio Measures Per $1,000 Debt (billions) Per Capita of Personal Income Debt (billions) Percent of Total Debt (billions) Percent of Total Massachusetts (State and Local)... $65.3 $10,187 $ $ % $ % United States... $1,681.4 $5,839 $ $1, % $ % Source: U.S. Bureau of the Census 170
175 THIS PAGE INTENTIONALLY LEFT BLANK 171
176 Michigan Economic Indicars Average Annual Change MI US MI US MI US Per Capita Income... $22,694 $22,172 $32,052 $33, % 4.1% Median Household Income... $35,284 $32,264 $42,328 $44, % 3.2% Gross State Product (in millions)... $246,064 $6,865,513 $372,169 $11,665, % 5.4% Full- and Part-Time Positions (in thousands) 5, ,224 5, , % 1.6% Employed Persons (in thousands).. 4, ,060 4, , % 1.2% Unemployment Rate % 6.1% 7.1% 5.5% n/a n/a Sources: U.S. Bureau of the Census, U.S. Bureau of Economic Analysis, and the U.S. Bureau of Labor Statistics 2004 Population Under Age 18 6% 5% Males 26% 7% 8% Females 24% Ages Ages Ages 75 and Over 63% 61% Population Poverty Rate Population and Poverty Percentage Change MI MI MI US MI US Total Population... 9,584,481 10,112, % 12.8% 12.3% 13.1% Males... 4,658,540 4,968, % 13.8% 10.8% 11.6% Under Age ,287,755 1,298, % 7.8% 16.9% 18.3% Ages ,886,425 3,154, % 16.7% 9.2% 9.6% Ages , , % 1.6% 4.4% 6.5% Ages 75 and Over , , % 28.8% 6.0% 6.8% Females...4,925,941 5,143, % 11.9% 13.7% 14.5% Under Age ,228,087 1,235, % 8.1% 18.3% 18.6% Ages ,994,743 3,177, % 14.6% 12.8% 13.6% Ages , , % -3.6% 8.1% 9.7% Ages 75 and Over , , % 19.6% 11.8% 13.3% Source: U.S. Bureau of the Census 172
177 Michigan Percent Distribution of Households by Age of Householder and Income, 2004 Less than $10,000 $10,000 $14,999 $15,000 $24,999 $25,000 $34,999 $35,000 $49,999 $50,000 $74,999 $75,000 $99,999 $100,000 or more All Households Age of Householder Under 25 years % 10.3% 23.5% 16.6% 13.6% 10.1% 3.7% 0.9% 100.0% years % 4.1% 9.0% 12.6% 16.0% 23.8% 13.2% 14.4% 100.0% years % 3.8% 8.7% 9.9% 13.9% 21.4% 14.2% 20.9% 100.0% 65 years and over % 11.8% 22.1% 16.9% 16.4% 12.6% 5.1% 4.8% 100.0% Michigan (all ages) % 5.9% 12.4% 12.7% 15.2% 19.9% 11.4% 14.1% 100.0% United States (all ages). 8.9% 6.3% 12.3% 12.0% 15.5% 19.0% 11.1% 15.0% 100.0% Source: U.S. Bureau of the Census Percent of Households by Household Income Bracket, 2004 Percent of Households 25.0% 20.0% 15.0% 10.0% 5.0% 0.0% Less than $10,000 $10,000 $14,999 $15,000 $24,999 $25,000 $34,999 $35,000 $49,999 $50,000 $74,999 $75,000 $99,999 $100,000 or more Michigan United States 173
178 State and Local General Revenues, FY 2002 Michigan Average Annual Revenue Change General Revenues Per Capita Percent of Personal Income (millions) MI US MI US MI US Total General Revenues... $57,942 $5,770 $5, % 19.3% 5.0% 5.6% Own Sources... $45,398 $4,521 $4, % 15.2% 4.5% 5.2% Taxes... $30,644 $3,051 $3, % 10.4% 4.3% 4.9% Property Taxes... $9,793 $975 $ % 3.2% 1.3% 4.5% General Sales Taxes... $7,784 $775 $ % 2.6% 7.8% 5.4% Personal Income Taxes. $6,598 $657 $ % 2.3% 6.1% 5.8% Other Taxes... $6,469 $644 $ % 2.3% 4.3% 4.3% Charges/Miscellaneous... $14,754 $1,469 $1, % 4.8% 5.0% 5.7% Federal Aid... $12,543 $1,249 $1, % 4.1% 6.9% 7.2% Source: U.S. Bureau of the Census (2002 data are the most current available.) 1992 General Revenue 2002 General Revenue Property Taxes General Sales Taxes Personal Income Taxes Other Taxes 18% 24% 22% 17% 13% Charges/Misc Federal Aid 26% 12% 10% 10% 26% 11% 11% 174
179 Michigan I. Personal Income Tax (2004) State Income Tax Base Michigan s income tax base is linked federal adjusted gross income. Filing Requirements Taxpayers must file if they owe Michigan tax, if adjusted gross income exceeds the exemption amounts, or if due a tax refund. Rate Structure 3.95% of taxable income Public Pension Exemption... Full exemption Private Pension Exemption... $38,550 (single) and $77,100 (married, filing jointly) Social Security Benefits... Full exemption Personal Exemptions Under age $3,100 (single); $6,200 (married, filing jointly; both spouses are under age 65) Age 65 or older... $5,100 (single); $10,200 (married, filing jointly; both spouses are age 65 or older) Senior Citizens Deduction Taxpayers age 65 or older may subtract interest, dividends, and capital gains up $8,595 (single) or $17,190 (married, filing jointly) from Michigan adjusted gross income. The maximum allowable deductions of $8,595 (single) or $17,190 (married, filing jointly) are reduced by any pension deduction taken. Elderly Tax Credit Deduction Taxpayers can deduct the federal elderly tax credit that was claimed on the federal form 1040, line 48. Local Income Taxes... Rates range from 0% 2.4%. Sources: AARP 2005 telephone survey of state legislative staff, state departments of revenue, state controllers offices, state assessors offices, and state treasury offices. 175
180 Michigan II. General Sales Tax Rates (2004) State % Combined state/local tax rates % III. Miscellaneous Tax Rates (2004) Corporate income (highest marginal rate) % The tax is a flat value-added tax, not an income tax. Gasoline (per gallon)... $0.19 An additional 6.0% sales tax is levied. Cigarette (per pack of 20)... $2.00 Beer (per gallon)... $0.203 IV. Real Property Tax Relief Programs (2005) Homestead Exemption or Credit Requirements Benefits Certain disabled veterans... Full exemption Circuit Breaker Requirements Benefits Homeowners and renters whose income is $82,650 or less... Up $1,200 Deferral Program Requirements Benefits Homeowners 65 or older or permanently disabled who have lived in their home for at least five years, whose income is $18,621 or less... Special assessments over $300 V. Real Property Tax Limits, Caps, or Freezes (2005) Individual real property values cannot annually increase by more than 5% or inflation (whichever is less). Local property tax rates must be reduced so that tal property taxes in a taxing district do not increase more than the inflation rate. This limitation can be removed with voter approval, and this limitation does not pertain property additions and improvements (local growth) and bonded indebtedness. City property tax rates cannot exceed $2.00 per $100 of assessed value without voter approval. This limitation does not apply debt service. Sources: AARP 2005 telephone survey of state legislative staff, state departments of revenue, state controllers offices, state assessors offices, and state treasury offices. 176
181 Michigan State and Local General Expenditures, FY 2002 General Expenditures Average Annual Expenditure Change Percent of Per Capita Personal Income (millions) MI US MI US MI US State/Local Direct General Expends... $60,783 $6,053 $6, % 19.9% 5.5% 5.9% To State/Local Government... $60,723 $6,047 $6, % 19.9% 5.6% 5.9% Education*... $23,745 $2,365 $2, % 6.8% 5.9% 6.2% Public Welfare... $9,837 $980 $ % 3.2% 5.7% 6.1% Health and Hospitals... $5,347 $532 $ % 1.7% 4.1% 5.2% Highways... $3,219 $321 $ % 1.3% 5.3% 5.5% Public Safety*... $5,072 $505 $ % 1.8% 5.2% 6.3% Environment... $3,597 $358 $ % 1.2% 5.9% 5.1% Interest on General Debt... $2,382 $237 $ % 0.9% 5.8% 3.1% Other... $7,523 $749 $ % 3.0% 5.3% 6.5% To Federal Government... $60 $6 $15 0.0% 0.1% 0.7% 1.9% *Education includes higher and lower education; public safety includes police, fire, corrections, and protection and inspection. Source: U.S. Bureau of the Census (2002 data are the most current available.) State and Local General Expenditures, FY 2002 (excluding payments federal government) 4% 6% 12% 40% Education Public Welfare Health and Hospitals Highways 8% Public Safety Environment 5% 9% 16% Interest on General Debt Other Total Debt Outstanding Long-term Debt Short-term Debt 2002 Debt Ratio Measures Per $1,000 Debt (billions) Per Capita of Personal Income Debt (billions) Percent of Total Debt (billions) Percent of Total Michigan (State and Local)... $54.3 $5,407 $ $ % $ % United States... $1,681.4 $5,839 $ $1, % $ % Source: U.S. Bureau of the Census 177
182 Minnesota Economic Indicars Average Annual Change MN US MN US MN US Per Capita Income... $22,985 $22,172 $36,173 $33, % 4.1% Median Household Income... $33,644 $32,264 $56,125 $44, % 3.2% Gross State Product (in millions)... $124,733 $6,865,513 $223,822 $11,665, % 5.4% Full- and Part-Time Positions (in thousands) 2, ,224 3, , % 1.6% Employed Persons (in thousands).. 2, ,060 2, , % 1.2% Unemployment Rate % 6.1% 4.7% 5.5% n/a n/a Sources: U.S. Bureau of the Census, U.S. Bureau of Economic Analysis, and the U.S. Bureau of Labor Statistics 2004 Population Under Age 18 6% 5% Males 25% 6% 8% Females 24% Ages Ages Ages 75 and Over 64% 62% Population Poverty Rate Population and Poverty Percentage Change MN MN MN US MN US Total Population... 4,566,028 5,100, % 12.8% 8.3% 13.1% Males... 2,244,739 2,531, % 13.8% 7.2% 11.6% Under Age , , % 7.8% 10.7% 18.3% Ages ,378,860 1,635, % 16.7% 6.4% 9.6% Ages , , % 1.6% 3.1% 6.5% Ages 75 and Over... 97, , % 28.8% 4.8% 6.8% Females... 2,321,289 2,569, % 11.9% 9.4% 14.5% Under Age , , % 8.1% 10.6% 18.6% Ages ,382,559 1,609, % 14.6% 8.7% 13.6% Ages , , % -3.6% 6.0% 9.7% Ages 75 and Over , , % 19.6% 15.2% 13.3% Source: U.S. Bureau of the Census 178
183 Minnesota Percent Distribution of Households by Age of Householder and Income, 2004 Less than $10,000 $10,000 $14,999 $15,000 $24,999 $25,000 $34,999 $35,000 $49,999 $50,000 $74,999 $75,000 $99,999 $100,000 or more All Households Age of Householder Under 25 years % 6.0% 23.7% 20.4% 18.2% 12.6% 6.2% 0.9% 100.0% years % 2.2% 6.8% 10.2% 16.2% 25.9% 16.9% 16.9% 100.0% years % 3.5% 7.2% 8.2% 15.0% 23.5% 15.2% 22.5% 100.0% 65 years and over % 12.3% 19.3% 16.3% 18.0% 13.0% 5.7% 4.7% 100.0% Minnesota (all ages) % 4.8% 10.3% 11.2% 16.2% 21.8% 13.5% 15.7% 100.0% United States (all ages). 8.9% 6.3% 12.3% 12.0% 15.5% 19.0% 11.1% 15.0% 100.0% Source: U.S. Bureau of the Census Percent of Households by Household Income Bracket, 2004 Percent of Households 25.0% 20.0% 15.0% 10.0% 5.0% 0.0% Less than $10,000 $10,000 $14,999 $15,000 $24,999 $25,000 $34,999 $35,000 $49,999 $50,000 $74,999 $75,000 $99,999 $100,000 or more Minnesota United States 179
184 State and Local General Revenues, FY 2002 Minnesota Average Annual Revenue Change General Revenues Per Capita Percent of Personal Income (millions) MN US MN US MN US Total General Revenues... $33,193 $6,606 $5, % 19.3% 5.3% 5.6% Own Sources... $27,105 $5,394 $4, % 15.2% 5.0% 5.2% Taxes... $18,456 $3,673 $3, % 10.4% 5.2% 4.9% Property Taxes... $5,215 $1,038 $ % 3.2% 4.0% 4.5% General Sales Taxes... $3,782 $753 $ % 2.6% 5.5% 5.4% Personal Income Taxes. $5,443 $1,083 $ % 2.3% 6.1% 5.8% Other Taxes... $4,016 $799 $ % 2.3% 5.2% 4.3% Charges/Miscellaneous... $8,649 $1,721 $1, % 4.8% 4.6% 5.7% Federal Aid... $6,088 $1,212 $1, % 4.1% 6.9% 7.2% Source: U.S. Bureau of the Census (2002 data are the most current available.) 1992 General Revenue 2002 General Revenue Property Taxes General Sales Taxes Personal Income Taxes Other Taxes 16% 18% 11% 18% 16% 11% Charges/Misc 28% 27% Federal Aid 15% 16% 12% 12% 180
185 Minnesota I. Personal Income Tax (2004) State Income Tax Base Minnesota s income tax base is linked federal taxable income. Filing Requirements Taxpayers must file if they are required file a federal return. Rate Structure Single Married, Filing Jointly Taxable Income Rate Taxable Income Rate First $19, % First $28, % $19,440 - $63, % $28,420 - $112, % Over $63, % Over $112, % Retirement Income Exemption Exemption amounts from any income source equal $9,600 (single) or $12,000 (married, filing jointly) less nontaxable Social Security, Railroad Retirement benefits, and one-half of federal adjusted gross income over $14,500 (single) or $18,000 (married, filing jointly). Taxpayers age 65 or older or disabled must meet the following eligibility requirements qualify: adjusted gross income must be less than $33,700 (single) or $42,000 (married, filing jointly), and Railroad Retirement benefits and nontaxable Social Security benefits must be less than $9,600 (single) or $12,000 (married, filing jointly). The exemption amounts assume that both spouses are age 65 or older if filing jointly. Social Security Benefits Only taxpayers whose provisional income* is $25,000 or higher (single) or $32,000 or higher (married, filing jointly) are subject taxation of their Social Security benefits. *Provisional income consists of federal adjusted gross income, tax-exempt interest, certain foreign-source income, and one-half of the taxpayer s Social Security or Railroad Retirement Tier 1 benefit (U.S. House Committee on the Budget, Omnibus Budget Reconciliation Act of 1993, 103 rd Congress, 1 st sess., 1993, Conference Report , p. 594). Sources: AARP 2005 telephone survey of state legislative staff, state departments of revenue, state controllers offices, state assessors offices, and state treasury offices. 181
186 Minnesota Standard Deductions and Personal Exemptions Combined Under age 65*... $7,950 (single); $15,900 (married, filing jointly; both spouses are under age 65) Age 65 or older*... $9,150 (single); $17,800 (married, filing jointly; both spouses are age 65 or older) *Personal exemptions equal $3,100 per exemption (single have one exemption and married couples have two). Taxpayers with federal adjusted gross income greater than $142,700 (single) or $214,050 (married, filing jointly) receive lower personal exemption amounts. Long-Term Care Insurance Credit Taxpayers can claim a tax credit for long-term care insurance premiums if their policy qualifies as a federal itemized deduction and has a lifetime benefit limit of $100,000 or more. The amount of the credit does not include what was claimed as a federal itemized deduction. The credit equals 25% of the tal amount of the premiums paid up $100 per person. Local Income Taxes... None II. General Sales Tax Rates (2004) State % Combined state/local tax rates % 7.5% III. Miscellaneous Tax Rates (2004) Corporate income (highest marginal rate) % All taxable income Gasoline (per gallon)... $0.20 Cigarette (per pack of 20)... $0.48 Beer (per gallon)... $0.08 (alcohol content of 3.2% or less); $0.15 (alcohol content over 3.2%) IV. Real Property Tax Relief Programs (2005) Homestead Exemption or Credit Requirements Benefits All homeowners % of the first $76,000 of the taxable market value with a maximum tax credit of $304 at a market value of $76,000. The credit is reduced by 0.09% of the taxable market value in excess of $76,000 until the credit equals zero at property valued at $413,800 and greater. Sources: AARP 2005 telephone survey of state legislative staff, state departments of revenue, state controllers offices, state assessors offices, and state treasury offices. 182
187 Minnesota Circuit Breaker Requirements Benefits Homeowners and renters whose income is less than $87,780 (homeowners) or less than $47,350 (renters)... Up $1,640 (homeowners) or $1,350 (renters) Deferral Program Requirements Benefits Homeowners age 65 or older who have lived in a residence for at least 15 years, whose income is $60,000 or less. In addition, homeowners must have at least 25% equity in their homes... Deferral of property taxes in excess of 3% of their income in the year preceding the deferral application Deferral Program (local option program) Requirements Benefits Homeowners age 65 or older or fully disabled... Deferral of special assessments V. Real Property Tax Limits, Caps, or Freezes (2005) For property assessed in 2004 and payable in 2005, assessed property values cannot increase annually by more than 15% or 25% of the difference between the current market value and the preceding year s assessed value (whichever is greater). This limitation does not apply home improvements. This limitation will be phased out over a six-year period, until it is tally eliminated for properties assessed in 2007 and paid in If property taxes homeowners increase by more than 12% a year, homeowners can receive a property tax refund equal 60% of property taxes exceeding the 12% increase. However, this tax refund is subject certain conditions. First, homeowners must apply for the refund. Second, qualify, homeowners must have owned and lived in the same property for at least two consecutive years. Third, property taxes have increase at least $100 more than the previous year. Fourth, the 12% limit does not pertain home improvements or new construction. Fifth, homeowners cannot receive more than a $1,000 refund in property taxes because of this tax limitation. Sixth, any tax refund issued the previous year is subtracted from the previous year s taxes in calculating the current year s refund. Sources: AARP 2005 telephone survey of state legislative staff, state departments of revenue, state controllers offices, state assessors offices, and state treasury offices. 183
188 State and Local General Expenditures, FY 2002 General Expenditures Minnesota Average Annual Expenditure Change Percent of Personal Per Capita Income (millions) MN US MN US MN US State/Local Direct General Expends... $34,933 $6,952 $6, % 19.9% 5.5% 5.9% To State/Local Government... $34,933 $6,952 $6, % 19.9% 5.5% 5.9% Education*... $11,266 $2,242 $2, % 6.8% 5.6% 6.2% Public Welfare... $7,473 $1,487 $ % 3.2% 7.5% 6.1% Health and Hospitals... $1,965 $391 $ % 1.7% 0.3% 5.2% Highways... $2,681 $533 $ % 1.3% 4.3% 5.5% Public Safety*... $2,182 $434 $ % 1.8% 6.0% 6.3% Environment... $2,204 $439 $ % 1.2% 4.6% 5.1% Interest on General Debt... $1,455 $289 $ % 0.9% 1.5% 3.1% Other... $5,706 $1,136 $ % 3.0% 7.4% 6.5% To Federal Government... $0 $0 $15 0.0% 0.1% 0.0% 1.9% *Education includes higher and lower education; public safety includes police, fire, corrections, and protection and inspection. Source: U.S. Bureau of the Census (2002 data are the most current available.) State and Local General Expenditures, FY 2002 (excluding payments federal government) 16% 4% 6% 6% 8% 6% 21% 33% Education Public Welfare Health and Hospitals Highways Public Safety Environment Interest on General Debt Other Total Debt Outstanding Long-term Debt Short-term Debt 2002 Debt Ratio Measures Per $1,000 Debt (billions) Per Capita of Personal Income Debt (billions) Percent of Total Debt (billions) Percent of Total Minnesota (State and Local)... $32.0 $6,370 $ $ % $ % United States... $1,681.4 $5,839 $ $1, % $ % Source: U.S. Bureau of the Census 184
189 THIS PAGE INTENTIONALLY LEFT BLANK 185
190 Mississippi Economic Indicars Average Annual Change MS US MS US MS US Per Capita Income... $16,291 $22,172 $24,379 $33, % 4.1% Median Household Income... $25,400 $32,264 $34,930 $44, % 3.2% Gross State Product (in millions)... $50,642 $6,865,513 $76,166 $11,665, % 5.4% Full- and Part-Time Positions (in thousands) 1, ,224 1, , % 1.6% Employed Persons (in thousands).. 1, ,060 1, , % 1.2% Unemployment Rate % 6.1% 6.2% 5.5% n/a n/a Sources: U.S. Bureau of the Census, U.S. Bureau of Economic Analysis, and the U.S. Bureau of Labor Statistics 2004 Population Under Age 18 Ages % 4% Males 27% 7% 7% Females 25% Ages Ages 75 and Over 63% 61% Population Poverty Rate Population and Poverty Percentage Change MS MS MS US MS US Total Population... 2,663,450 2,902, % 12.8% 21.6% 13.1% Males... 1,275,967 1,408, % 13.8% 18.4% 11.6% Under Age , , % 7.8% 29.9% 18.3% Ages , , % 16.7% 14.6% 9.6% Ages ,103 85, % 1.6% 10.1% 6.5% Ages 75 and Over... 50,859 57, % 28.8% 10.3% 6.8% Females... 1,387,483 1,494, % 11.9% 24.6% 14.5% Under Age , , % 8.1% 32.0% 18.6% Ages , , % 14.6% 22.8% 13.6% Ages , , % -3.6% 15.4% 9.7% Ages 75 and Over... 95, , % 19.6% 22.8% 13.3% Source: U.S. Bureau of the Census 186
191 Mississippi Percent Distribution of Households by Age of Householder and Income, 2004 Less than $10,000 $10,000 $14,999 $15,000 $24,999 $25,000 $34,999 $35,000 $49,999 $50,000 $74,999 $75,000 $99,999 $100,000 or more All Households Age of Householder Under 25 years % 11.4% 17.2% 18.6% 8.7% 7.3% 3.6% 0.2% 100.0% years % 7.3% 14.2% 14.1% 15.9% 19.8% 9.1% 7.4% 100.0% years % 7.1% 14.1% 11.8% 15.2% 17.5% 9.7% 11.8% 100.0% 65 years and over % 15.0% 23.3% 13.1% 12.1% 10.1% 3.2% 4.2% 100.0% Mississippi (all ages) % 9.1% 16.3% 13.3% 14.4% 16.1% 7.7% 7.9% 100.0% United States (all ages). 8.9% 6.3% 12.3% 12.0% 15.5% 19.0% 11.1% 15.0% 100.0% Source: U.S. Bureau of the Census Percent of Households by Household Income Bracket, 2004 Percent of Households 20.0% 18.0% 16.0% 14.0% 12.0% 10.0% 8.0% 6.0% 4.0% 2.0% 0.0% Less than $10,000 $10,000 $14,999 $15,000 $24,999 $25,000 $34,999 $35,000 $49,999 $50,000 $74,999 $75,000 $99,999 $100,000 or more Mississippi United States 187
192 State and Local General Revenues, FY 2002 Mississippi Average Annual Revenue Change General Revenues Per Capita Percent of Personal Income (millions) MS US MS US MS US Total General Revenues... $15,293 $5,333 $5, % 19.3% 6.8% 5.6% Own Sources... $10,667 $3,720 $4, % 15.2% 6.4% 5.2% Taxes... $6,524 $2,275 $3, % 10.4% 6.5% 4.9% Property Taxes... $1,647 $574 $ % 3.2% 5.6% 4.5% General Sales Taxes... $2,341 $817 $ % 2.6% 7.1% 5.4% Personal Income Taxes. $985 $344 $ % 2.3% 8.4% 5.8% Other Taxes... $1,551 $541 $ % 2.3% 5.5% 4.3% Charges/Miscellaneous... $4,144 $1,445 $1, % 4.8% 6.3% 5.7% Federal Aid... $4,625 $1,613 $1, % 4.1% 7.8% 7.2% Source: U.S. Bureau of the Census (2002 data are the most current available.) 1992 General Revenue 2002 General Revenue Property Taxes 12% 11% General Sales Taxes Personal Income Taxes Other Taxes 28% 15% 31% 15% Charges/Misc 6% 6% Federal Aid 28% 11% 27% 10% 188
193 Mississippi I. Personal Income Tax (2004) State Income Tax Base Mississippi s income tax base is not directly linked the federal income tax base. Filing Requirements Taxpayers should file if their Mississippi income tax was withheld from their wages or if their gross income was greater than $8,300 (single) or $16,600 (married) plus $1,500 for each dependent. Rate Structure All Taxpayers Taxable Income Rate First $5, % $5,000 - $10, % Over $10, % Public and Private Pension Exemptions... Full exemption Social Security Benefits... Full exemption Standard Deductions and Personal Exemptions Combined Under age 65*... $8,300 (single); $16,600 (married, filing jointly) Age 65 or older*... $9,800 (single); $19,600 (married, filing jointly; both spouses are age 65 or older) Local Income Taxes... None II. General Sales Tax Rates (2004) State % Combined state/local tax rates % 7.25% III. Miscellaneous Tax Rates (2004) Corporate income (highest marginal rate) % On income over $10,000 Gasoline (per gallon)... $0.184 Three counties levy a $0.03 per gallon tax. Cigarette (per pack of 20)... $0.18 Beer (per gallon)... $0.427 Sources: AARP 2005 telephone survey of state legislative staff, state departments of revenue, state controllers offices, state assessors offices, and state treasury offices. 189
194 Mississippi IV. Real Property Tax Relief Programs (2005) Homestead Exemption or Credit Requirements Benefits Homeowners under age $300 maximum tax credit Homeowners age 65 or older or disabled... $7,500 assessed value Circuit Breaker... None Deferral Program... None V. Real Property Tax Limits, Caps, or Freezes (2005) Property taxes for a local taxing district cannot increase annually by more than 10% from any one of the three previous fiscal years. This limit does not apply new property, and voters can approve taxes beyond this limit. Sources: AARP 2005 telephone survey of state legislative staff, state departments of revenue, state controllers offices, state assessors offices, and state treasury offices. 190
195 Mississippi State and Local General Expenditures, FY 2002 General Expenditures Average Annual Expenditure Change Percent of Per Capita Personal Income (millions) MS US MS US MS US State/Local Direct General Expends... $15,384 $5,365 $6, % 19.9% 6.8% 5.9% To State/Local Government... $15,384 $5,365 $6, % 19.9% 6.8% 5.9% Education*... $5,101 $1,779 $2, % 6.8% 6.7% 6.2% Public Welfare... $3,236 $1,129 $ % 3.2% 10.7% 6.1% Health and Hospitals... $2,140 $746 $ % 1.7% 5.6% 5.2% Highways... $1,236 $431 $ % 1.3% 5.1% 5.5% Public Safety*... $1,024 $357 $ % 1.8% 8.6% 6.3% Environment... $626 $218 $ % 1.2% 5.4% 5.1% Interest on General Debt... $497 $173 $ % 0.9% 4.1% 3.1% Other... $1,523 $531 $ % 3.0% 4.3% 6.5% To Federal Government... $0 $0 $15 0.0% 0.1% 0.0% 1.9% *Education includes higher and lower education; public safety includes police, fire, corrections, and protection and inspection. Source: U.S. Bureau of the Census (2002 data are the most current available.) State and Local General Expenditures, FY 2002 (excluding payments federal government) 3% 4% 7% 8% 14% 10% Education Public Welfare 33% Health and Hospitals Highways Public Safety Environment Interest on General Debt Other 21% Total Debt Outstanding Long-term Debt Short-term Debt 2002 Debt Ratio Measures Per $1,000 Debt (billions) Per Capita of Personal Income Debt (billions) Percent of Total Debt (billions) Percent of Total Mississippi (State and Local)... $9.9 $3,464 $ $ % $ % United States... $1,681.4 $5,839 $ $1, % $ % Source: U.S. Bureau of the Census 191
196 Missouri Economic Indicars Average Annual Change MO US MO US MO US Per Capita Income... $20,848 $22,172 $30,516 $33, % 4.1% Median Household Income... $30,190 $32,264 $42,094 $44, % 3.2% Gross State Product (in millions)... $128,473 $6,865,513 $203,294 $11,665, % 5.4% Full- and Part-Time Positions (in thousands) 3, ,224 3, , % 1.6% Employed Persons (in thousands).. 2, ,060 2, , % 1.2% Unemployment Rate % 6.1% 5.7% 5.5% n/a n/a Sources: U.S. Bureau of the Census, U.S. Bureau of Economic Analysis, and the U.S. Bureau of Labor Statistics 2004 Population Under Age 18 6% 5% Males 25% 7% 8% Females 23% Ages Ages Ages 75 and Over 64% 62% Population Poverty Rate Population and Poverty Percentage Change MO MO MO US MO US Total Population... 5,281,206 5,754, % 12.8% 11.8% 13.1% Males... 2,550,171 2,810, % 13.8% 10.3% 11.6% Under Age , , % 7.8% 16.1% 18.3% Ages ,552,284 1,783, % 16.7% 8.6% 9.6% Ages , , % 1.6% 5.1% 6.5% Ages 75 and Over , , % 28.8% 7.4% 6.8% Females... 2,731,035 2,943, % 11.9% 13.3% 14.5% Under Age , , % 8.1% 16.3% 18.6% Ages ,618,671 1,820, % 14.6% 12.5% 13.6% Ages , , % -3.6% 8.5% 9.7% Ages 75 and Over , , % 19.6% 15.8% 13.3% Source: U.S. Bureau of the Census 192
197 Missouri Percent Distribution of Households by Age of Householder and Income, 2004 Less than $10,000 $10,000 $14,999 $15,000 $24,999 $25,000 $34,999 $35,000 $49,999 $50,000 $74,999 $75,000 $99,999 $100,000 or more All Households Age of Householder Under 25 years % 9.4% 24.1% 15.5% 12.7% 11.1% 2.3% 0.7% 100.0% years % 4.0% 10.4% 13.4% 20.7% 23.1% 10.8% 11.1% 100.0% years % 4.5% 9.9% 9.7% 16.4% 22.2% 12.9% 16.8% 100.0% 65 years and over % 13.6% 21.4% 15.2% 15.4% 11.6% 4.6% 4.9% 100.0% Missouri (all ages) % 6.6% 13.4% 12.6% 17.5% 19.6% 9.7% 11.2% 100.0% United States (all ages). 8.9% 6.3% 12.3% 12.0% 15.5% 19.0% 11.1% 15.0% 100.0% Source: U.S. Bureau of the Census Percent of Households by Household Income Bracket, 2004 Percent of Households 25.0% 20.0% 15.0% 10.0% 5.0% 0.0% Less than $10,000 $10,000 $14,999 $15,000 $24,999 $25,000 $34,999 $35,000 $49,999 $50,000 $74,999 $75,000 $99,999 $100,000 or more Missouri United States 193
198 State and Local General Revenues, FY 2002 Missouri Average Annual Revenue Change General Revenues Per Capita Percent of Personal Income (millions) MO US MO US MO US Total General Revenues... $29,062 $5,117 $5, % 19.3% 6.4% 5.6% Own Sources... $21,733 $3,826 $4, % 15.2% 5.8% 5.2% Taxes... $15,123 $2,663 $3, % 10.4% 5.8% 4.9% Property Taxes... $3,880 $683 $ % 3.2% 6.5% 4.5% General Sales Taxes... $4,246 $748 $ % 2.6% 5.0% 5.4% Personal Income Taxes. $3,929 $692 $ % 2.3% 6.7% 5.8% Other Taxes... $3,068 $540 $ % 2.3% 4.9% 4.3% Charges/Miscellaneous... $6,610 $1,164 $1, % 4.8% 5.8% 5.7% Federal Aid... $7,329 $1,290 $1, % 4.1% 8.7% 7.2% Source: U.S. Bureau of the Census (2002 data are the most current available.) 1992 General Revenue 2002 General Revenue Property Taxes General Sales Taxes Personal Income Taxes Other Taxes 20% 13% 17% 24% 13% 15% Charges/Misc Federal Aid 25% 13% 23% 14% 12% 11% 194
199 Missouri I. Personal Income Tax (2004) State Income Tax Base Missouri s income tax base is linked federal adjusted gross income. Filing Requirements Taxpayers must file if they were required file a federal income tax return unless their Missouri adjusted gross income is less than $1,200 or less than the Missouri standard deduction and personal exemption combined. Rate Structure All Taxpayers Taxable Income Rate Taxable Income Rate First $1, % $5,001 - $6, % $1,001 - $2, % $6,001 - $7, % $2,001 - $3, % $7,001 - $8, % $3,001 - $4, % $8,001 - $9, % $4,001 - $5, % Over $9, % Public Pension Exemption* $6,000 exemption for persons earning less than $25,000 (single) or $32,000 (married, filing jointly), not including federal taxable Social Security benefits. The exemption is phased out for persons whose income is greater than $31,000 (single) or $44,000 (married, filing jointly)**. Private Pension Exemption* $6,000 exemption for persons earning less than $25,000 (single) or $32,000 (married, filing jointly), not including federal taxable Social Security benefits. The exemption is phased out for persons whose income is greater than $31,000 (single) or $44,000 (married, filing jointly).** *A taxpayer receiving both a public and private pension cannot receive more than a combined exemption of $6,000. **The $44,000 income threshold assumes that both spouses are receiving a pension. Sources: AARP 2005 telephone survey of state legislative staff, state departments of revenue, state controllers offices, state assessors offices, and state treasury offices. 195
200 Missouri Social Security Benefits Only taxpayers whose provisional income* is $25,000 or higher (single) or $32,000 or higher (married, filing jointly) are subject taxation of their Social Security benefits. *Provisional income consists of federal adjusted gross income, tax-exempt interest, certain foreign-source income, and one-half of the taxpayer s Social Security or Railroad Retirement Tier 1 benefit (U.S. House Committee on the Budget, Omnibus Budget Reconciliation Act of 1993, 103 rd Congress, 1 st sess., 1993, Conference Report , p. 594). Standard Deductions and Personal Exemptions Combined Under age 65*... $6,950 (single); $13,900 (married, filing jointly; both spouses are under age 65) Age 65 or older*... $8,150 (single); $15,800 (married, filing jointly; both spouses are age 65 or older) *Missouri s standard deductions are the same as those used for federal tax purposes. Long-Term Care Insurance Deduction... Residents may be eligible deduct up 50% of their insurance premiums. Other Deductions... Federal income taxes up $5,000 (single) or $10,000 (married, filing jointly) Local Income Taxes... Kansas City and St. Louis levy a 1% earned income/net profits tax. II. General Sales Tax Rates (2004) State % Combined state/local tax rates % 8.225% III. Miscellaneous Tax Rates (2004) Corporate income (highest marginal rate) % On all taxable income Gasoline (per gallon)... $0.17 Cigarette (per pack of 20)... $0.17 Beer (per gallon)... $0.06 Sources: AARP 2005 telephone survey of state legislative staff, state departments of revenue, state controllers offices, state assessors offices, and state treasury offices. 196
201 Missouri IV. Real Property Tax Relief Programs (2005) Homestead Exemption or Credit... None Circuit Breaker Requirements Benefits Homeowners and renters, age 65 or older or tally disabled, or persons age 60 or older receiving surviving spousal Social Security benefits whose income is $25,000 or less (single) or $27,000 or less (married couples)... Up $750 Deferral Program... None V. Real Property Tax Limits, Caps, or Freezes (2005) Property taxes for local taxing districts (or political subdivisions) cannot increase annually by more than the inflation rate or 5% (whichever is less). This revenue limitation percentage applies only if tal assessed property valuations increase by at least that same percentage. This limitation does not apply property additions and improvements or bonded indebtedness. If the current property tax rate is less than the rate necessary achieve a 5% or inflation growth in tax revenue, then the current tax rate is used, resulting in a lower growth rate in tax revenues. Starting with 2006 tax bills, property taxes cannot increase by more than 2.5% (non-assessment year) or 5.0% (assessment year) for homeowners age 65 and older or tally disabled whose federal adjusted gross income is $70,000 or less. The reduction in property taxes is through a tax credit that qualified homeowners would have apply for. However, the credit must be appropriated by the state legislature. Eligible homeowners cannot apply for the circuit breaker program for the same tax period. Real Property Tax Rate Limits Counties with tal assessed value of $300 million or more cannot levy property tax rates above $0.35 per $100 of assessed value; other counties are limited $0.5 per $100 of assessed value. This limitation does not apply debt service and may be exceeded with voter approval. Finally, counties can levy up an additional $0.5 per $100 of assessed value for roads and bridges. Municipalities cannot levy property tax rates more than $1 per $100 of assessed value. This limit does not apply debt service and may be exceeded with voter approval. School districts formed of cities and wn are cannot levy property tax rates more than $2.75 per $100 of assessed value; all other districts are limited $0.65 per $100 of assessed value. Both limits do not apply debt service and may be increased with voter approval. Sources: AARP 2005 telephone survey of state legislative staff, state departments of revenue, state controllers offices, state assessors offices, and state treasury offices. 197
202 State and Local General Expenditures, FY 2002 General Expenditures Missouri Average Annual Expenditure Change Percent of Personal Per Capita Income (millions) MO US MO US MO US State/Local Direct General Expends... $29,048 $5,114 $6, % 19.9% 6.7% 5.9% To State/Local Government... $29,045 $5,114 $6, % 19.9% 6.7% 5.9% Education*... $10,556 $1,859 $2, % 6.8% 6.7% 6.2% Public Welfare... $5,520 $972 $ % 3.2% 7.9% 6.1% Health and Hospitals... $2,433 $428 $ % 1.7% 6.1% 5.2% Highways... $2,473 $435 $ % 1.3% 6.7% 5.5% Public Safety*... $2,419 $426 $ % 1.8% 7.7% 6.3% Environment... $1,307 $230 $ % 1.2% 3.4% 5.1% Interest on General Debt... $1,038 $183 $ % 0.9% 3.6% 3.1% Other... $3,299 $581 $ % 3.0% 7.5% 6.5% To Federal Government... $4 $1 $15 0.0% 0.1% n/a 1.9% *Education includes higher and lower education; public safety includes police, fire, corrections, and protection and inspection. Source: U.S. Bureau of the Census (2002 data are the most current available.) State and Local General Expenditures, FY 2002 (excluding payments federal government) 4% 4% 8% 11% 37% Education Public Welfare Health and Hospitals Highways Public Safety Environment 9% Interest on General Debt 8% 19% Other Total Debt Outstanding Long-term Debt Short-term Debt 2002 Debt Ratio Measures Per $1,000 Debt (billions) Per Capita of Personal Income Debt (billions) Percent of Total Debt (billions) Percent of Total Missouri (State and Local)... $24.2 $4,269 $ $ % $ % United States... $1,681.4 $5,839 $ $1, % $ % Source: U.S. Bureau of the Census 198
203 THIS PAGE INTENTIONALLY LEFT BLANK 199
204 Montana Economic Indicars Average Annual Change MT US MT US MT US Per Capita Income... $17,861 $22,172 $27,666 $33, % 4.1% Median Household Income... $27,631 $32,264 $33,987 $44, % 3.2% Gross State Product (in millions)... $16,961 $6,865,513 $27,482 $11,665, % 5.4% Full- and Part-Time Positions (in thousands) , , % 1.6% Employed Persons (in thousands) , , % 1.2% Unemployment Rate % 6.1% 4.4% 5.5% n/a n/a Sources: U.S. Bureau of the Census, U.S. Bureau of Economic Analysis, and the U.S. Bureau of Labor Statistics 2004 Population Under Age 18 7% 5% Males 23% 7% 8% Females 22% Ages Ages Ages 75 and Over 65% 63% Population Poverty Rate Population and Poverty Percentage Change MT MT MT US MT US Total Population , , % 12.8% 14.2% 13.1% Males , , % 13.8% 12.7% 11.6% Under Age , , % 7.8% 18.2% 18.3% Ages , , % 16.7% 11.9% 9.6% Ages ,832 31, % 1.6% 4.0% 6.5% Ages 75 and Over... 20,318 24, % 28.8% 7.9% 6.8% Females , , % 11.9% 15.6% 14.5% Under Age , , % 8.1% 20.2% 18.6% Ages , , % 14.6% 15.0% 13.6% Ages ,358 34, % -3.6% 9.7% 9.7% Ages 75 and Over... 31,598 36, % 19.6% 13.5% 13.3% Source: U.S. Bureau of the Census 200
205 Montana Percent Distribution of Households by Age of Householder and Income, 2004 Less than $10,000 $10,000 $14,999 $15,000 $24,999 $25,000 $34,999 $35,000 $49,999 $50,000 $74,999 $75,000 $99,999 $100,000 or more All Households Age of Householder Under 25 years % 13.7% 19.4% 21.2% 16.1% 6.9% 0.0% 0.3% 100.0% years % 5.7% 16.9% 17.2% 17.0% 20.4% 8.2% 6.0% 100.0% years % 6.3% 12.4% 12.2% 15.7% 21.6% 11.7% 11.5% 100.0% 65 years and over % 13.7% 22.6% 14.9% 17.3% 11.4% 3.6% 4.3% 100.0% Montana (all ages) % 8.1% 16.4% 15.0% 16.5% 18.2% 8.2% 7.5% 100.0% United States (all ages). 8.9% 6.3% 12.3% 12.0% 15.5% 19.0% 11.1% 15.0% 100.0% Source: U.S. Bureau of the Census Percent of Households by Household Income Bracket, 2004 Percent of Households 25.0% 20.0% 15.0% 10.0% 5.0% 0.0% Less than $10,000 $10,000 $14,999 $15,000 $24,999 $25,000 $34,999 $35,000 $49,999 $50,000 $74,999 $75,000 $99,999 $100,000 or more Montana United States 201
206 State and Local General Revenues, FY 2002 Montana Average Annual Revenue Change General Revenues Per Capita Percent of Personal Income (millions) MT US MT US MT US Total General Revenues... $5,122 $5,625 $5, % 19.3% 4.4% 5.6% Own Sources... $3,532 $3,878 $4, % 15.2% 3.3% 5.2% Taxes... $2,135 $2,345 $3, % 10.4% 2.9% 4.9% Property Taxes... $852 $936 $ % 3.2% 1.6% 4.5% General Sales Taxes... $0 $0 $ % 2.6% 0.0% 5.4% Personal Income Taxes.. $518 $568 $ % 2.3% 4.9% 5.8% Other Taxes... $765 $840 $ % 2.3% 3.3% 4.3% Charges/Miscellaneous... $1,397 $1,533 $1, % 4.8% 3.8% 5.7% Federal Aid... $1,590 $1,746 $1, % 4.1% 7.4% 7.2% Source: U.S. Bureau of the Census (2002 data are the most current available.) 1992 General Revenue 2002 General Revenue Property Taxes 23% 22% 17% Personal Income Taxes 31% Other Taxes 10% Charges/Misc 10% Federal Aid 28% 17% 27% 15% 202
207 Montana I. Personal Income Tax (2004) State Income Tax Base Montana s income tax base is linked federal adjusted gross income. Filing Requirements Taxpayers must file if their federal adjusted gross income equals or exceeds the following federal adjusted gross income values: Under age $3,440 (single); $6,880 (married, filing jointly; both spouses are under age 65) Age 65 or older... $5,280 (single); $10,560 (married, filing jointly; both spouses are age 65 or older) Rate Structure All Taxpayers Taxable Income Rate Taxable Income Rate First $2, % $18,401 - $22, % $2,301 - $4, % $22,901 - $32, % $4,601 - $9, % $32,101 - $45, % $9,201 - $13, % $45,901 - $80, % $13,801 - $18, % $80,301 and over 11.0% Public and Private Pension Exemptions... Up $3,600 based on income, phased out for persons with adjusted gross income of $31,800 or greater (single) or $33,600 (married, filing jointly, when both spouses have pension income) Social Security Benefits Only taxpayers whose provisional income* is $25,000 or higher (single) or $32,000 or higher (married, filing jointly) are subject taxation of their Social Security benefits. *Provisional income consists of federal adjusted gross income, tax-exempt interest, certain foreign-source income, and one-half of the taxpayer s Social Security or Railroad Retirement Tier 1 benefit (U.S. House Committee on the Budget, Omnibus Budget Reconciliation Act of 1993, 103 rd Congress, 1 st sess., 1993, Conference Report , p. 594). Sources: AARP 2005 telephone survey of state legislative staff, state departments of revenue, state controllers offices, state assessors offices, and state treasury offices. 203
208 Montana Standard Deductions and Personal Exemptions Combined Under age $3,370 - $5,280 (single); $6,740 - $10,560 (married, filing jointly; both spouses are under age 65) Age 65 or older... $5,210 - $7,120 (single); $10,420 - $14,240 (married, filing jointly; both spouses are age 65 or older) Interest Income Deduction Taxpayers age 65 or older can deduct up $800 (single) or $1,600 (married, filing jointly) in interest income. Medical Savings Accounts Deduction Each taxpayer can deduct up $3,000 (single) or $6,000 (married, filing jointly) in annual contributions a medical savings account plus interest or other income earned on the principal. These contributions cannot be deducted elsewhere, such as an itemized deduction, in order qualify as a deduction. Health Insurance Premiums Deduction Taxpayers who are shareholders of an S corporation can deduct health insurance premiums paid on their behalf by an S corporation. However, the cost of the premiums must be included in the shareholders federal adjusted gross income in order be deducted. These premiums cannot be deducted as an itemized deduction. Federal Income Tax Deduction On the short form, taxpayers can either deduct federal income taxes paid or the standard deduction; on the long form, taxpayers can deduct federal income taxes paid if they itemize on the Montana form their deductions. Local Income Taxes... None II. General Sales Tax Rates (2004) No state or local general sales tax III. Miscellaneous Tax Rates (2004) Corporate income (highest marginal rate) % All taxable income Gasoline (per gallon)... $0.27 Cigarette (per pack of 20)... $0.70 Beer (per gallon)... $0.042 $0.139 Sources: AARP 2005 telephone survey of state legislative staff, state departments of revenue, state controllers offices, state assessors offices, and state treasury offices. 204 Counties may add a $0.01 or $0.02 cent per gallon tax.
209 Montana IV. Real Property Tax Relief Programs (2005) Homestead Exemption or Credit... None Circuit Breakers Disabled Veterans Tax Break Fully disabled veterans whose adjusted income is $40,618 less (single) or $46,867 or less (married, filing jointly) or $35,411 or less (surviving spouse) receive a 50% 100% reduction in tax rates, depending on income. Elderly Homeowner and Renter Credit Requirements Benefits Homeowners and renters age 62 or older whose income is less than $45, Up a $1,000 refundable credit against income taxes for property taxes paid Low-Income Property Tax Assistance Program Requirements Benefits Homeowners whose income is $17,670 or less (single) or $23,560 or less (married, filing jointly)*... The property tax rate is reduced.** The property tax rate reduction only applies the first $100,000 of taxable value. *Homeowners must occupy their home at least seven months out of the year. **Program works by reducing property tax rates by 20%, 50%, or 70%, depending on household income. Extended Property Tax Assistance Program (EPTAP) EPTAP reduces increases in property taxes on qualifying residential properties because of the 2003 reappraisal of property. Allowable property tax increases range from 24% (household income of $25,000 or less) 36% (household income less than $75,000). To qualify, homeowners must meet the following eligibility criteria: Household income must be $75,000 or less. Residential property values must have increased at least 24%. Property taxes must have increased at least $250. Homeowners must have owned their homes as of December 31, Deferral Program... None Sources: AARP 2005 telephone survey of state legislative staff, state departments of revenue, state controllers offices, state assessors offices, and state treasury offices. 205
210 Montana V. Real Property Tax Limits, Caps, or Freezes (2005) Real property values are now reappraised every six years based on fair market value. To mitigate increases in property values because of reassessments, property value increases between appraisals are phased in over a six-year period. The current reappraisal cycle is from January 1, 2003, December 31, This means that the fair market value determined in 2003 will not be used, for tax purposes, in calculating property tax liability until Between 2003 and 2007, annual increases in assessments will be prescribed by the state legislature. Additional tax levies are allowable only with voter approval or for certain emergencies. Local property tax revenues (not including school districts) can only increase by no more than one-half of the average inflation rate for the prior three years. Increases beyond that are allowable only with voter approval or for certain emergencies. This limitation does not apply new construction. Property Tax Rate Limits $9.50 per $100 of assessed value for the state government property tax $0.60 per $100 of assessed value for universities Sources: AARP 2005 telephone survey of state legislative staff, state departments of revenue, state controllers offices, state assessors offices, and state treasury offices. 206
211 Montana State and Local General Expenditures, FY 2002 General Expenditures Average Annual Expenditure Change Percent of Personal Per Capita Income (millions) MT US MT US MT US State/Local Direct General Expends... $5,052 $5,547 $6, % 19.9% 5.2% 5.9% To State/Local Government... $5,051 $5,546 $6, % 19.9% 5.2% 5.9% Education*... $1,792 $1,968 $2, % 6.8% 5.2% 6.2% Public Welfare... $671 $737 $ % 3.2% 6.4% 6.1% Health and Hospitals... $378 $415 $ % 1.7% 8.2% 5.2% Highways... $542 $596 $ % 1.3% 4.2% 5.5% Public Safety*... $356 $391 $ % 1.8% 8.4% 6.3% Environment... $365 $401 $ % 1.2% 5.8% 5.1% Interest on General Debt... $210 $231 $ % 0.9% -2.8% 3.1% Other... $735 $808 $ % 3.0% 5.9% 6.5% To Federal Government... $1 $1 $15 0.0% 0.1% n/a 1.9% *Education includes higher and lower education; public safety includes police, fire, corrections, and protection and inspection. Source: U.S. Bureau of the Census (2002 data are the most current available.) State and Local General Expenditures, FY 2002 (excluding payments federal government) 15% Education 4% 36% Public Welfare Health and Hospitals 7% Highways 7% Public Safety Environment 11% 7% 13% Interest on General Debt Other Total Debt Outstanding Long-term Debt Short-term Debt 2002 Debt Ratio Measures Per $1,000 Debt (billions) Per Capita of Personal Income Debt (billions) Percent of Total Debt (billions) Percent of Total Montana (State and Local)... $4.0 $4,352 $ $ % $ % United States... $1,681.4 $5,839 $ $1, % $ % Source: U.S. Bureau of the Census 207
212 Nebraska Economic Indicars Average Annual Change NE US NE US NE US Per Capita Income... $20,751 $22,172 $32,276 $33, % 4.1% Median Household Income... $31,794 $32,264 $43,761 $44, % 3.2% Gross State Product (in millions)... $42,838 $6,865,513 $68,183 $11,665, % 5.4% Full- and Part-Time Positions (in thousands) 1, ,224 1, , % 1.6% Employed Persons (in thousands) , , % 1.2% Unemployment Rate % 6.1% 3.8% 5.5% n/a n/a Sources: U.S. Bureau of the Census, U.S. Bureau of Economic Analysis, and the U.S. Bureau of Labor Statistics 2004 Population Under Age 18 6% 5% Males 26% 7% 8% Females 24% Ages Ages Ages 75 and Over 63% 61% Population Poverty Rate Population and Poverty Percentage Change NE NE NE US NE US Total Population... 1,621,551 1,747, % 12.8% 11.0% 13.1% Males , , % 13.8% 10.2% 11.6% Under Age , , % 7.8% 14.0% 18.3% Ages , , % 16.7% 9.6% 9.6% Ages ,890 50, % 1.6% 3.4% 6.5% Ages 75 and Over... 38,883 46, % 28.8% 5.8% 6.8% Females , , % 11.9% 11.8% 14.5% Under Age , , % 8.1% 12.1% 18.6% Ages , , % 14.6% 12.0% 13.6% Ages ,226 60, % -3.6% 6.8% 9.7% Ages 75 and Over... 71,095 74, % 19.6% 13.2% 13.3% Source: U.S. Bureau of the Census 208
213 Nebraska Percent Distribution of Households by Age of Householder and Income, 2004 Less than $10,000 $10,000 $14,999 $15,000 $24,999 $25,000 $34,999 $35,000 $49,999 $50,000 $74,999 $75,000 $99,999 $100,000 or more All Households Age of Householder Under 25 years % 10.7% 20.9% 22.4% 19.0% 9.5% 1.4% 1.3% 100.0% years % 4.2% 11.4% 12.7% 17.9% 24.9% 11.9% 10.5% 100.0% years % 4.3% 9.0% 11.0% 17.0% 22.2% 13.4% 17.3% 100.0% 65 years and over % 14.6% 22.9% 14.8% 17.5% 11.4% 4.2% 4.5% 100.0% Nebraska (all ages) % 6.9% 13.7% 13.3% 17.6% 20.0% 10.0% 10.9% 100.0% United States (all ages). 8.9% 6.3% 12.3% 12.0% 15.5% 19.0% 11.1% 15.0% 100.0% Source: U.S. Bureau of the Census Percent of Households by Household Income Bracket, 2004 Percent of Households 25.0% 20.0% 15.0% 10.0% 5.0% 0.0% Less than $10,000 $10,000 $14,999 $15,000 $24,999 $25,000 $34,999 $35,000 $49,999 $50,000 $74,999 $75,000 $99,999 $100,000 or more Nebraska United States 209
214 State and Local General Revenues, FY 2002 Nebraska Average Annual Revenue Change General Revenues Per Capita Percent of Personal Income (millions) NE US NE US NE US Total General Revenues... $9,821 $5,689 $5, % 19.3% 5.5% 5.6% Own Sources... $7,848 $4,546 $4, % 15.2% 5.1% 5.2% Taxes... $5,316 $3,079 $3, % 10.4% 5.1% 4.9% Property Taxes... $1,749 $1,013 $ % 3.2% 4.2% 4.5% General Sales Taxes... $1,287 $746 $ % 2.6% 5.2% 5.4% Personal Income Taxes. $1,153 $668 $ % 2.3% 5.9% 5.8% Other Taxes... $1,127 $653 $ % 2.3% 5.7% 4.3% Charges/Miscellaneous... $2,532 $1,466 $1, % 4.8% 5.1% 5.7% Federal Aid... $1,973 $1,143 $1, % 4.1% 7.3% 7.2% Source: U.S. Bureau of the Census (2002 data are the most current available.) 1992 General Revenue 2002 General Revenue Property Taxes General Sales Taxes Personal Income Taxes Other Taxes Charges/Misc 28% 17% 20% 13% 26% 20% 18% 13% Federal Aid 11% 11% 11% 12% 210
215 Nebraska I. Personal Income Tax (2004) State Income Tax Base Nebraska s income tax base is linked federal adjusted gross income. Filing Requirements Taxpayers must file if they are required file a federal return and report a federal liability or if they have $5,000 or more in Nebraska adjustments federal adjusted gross income. Rate Structure Table 1* (for those with adjusted gross income less than $142,700) Single Married, Filing Jointly Taxable Income Rate Taxable Income Rate First $2, % First $4, % $2,400 - $17, % $4,000 - $30, % $17,000 - $26, % $30,000 - $46, % Over $26, % Over $46, % *The tax liability for taxpayers whose adjusted gross income is more than $1 equals the tax calculated from table 1 plus the tax calculated from table 2. Rate Structure Table 2 (for those with adjusted gross income more than $142,700) Single Married, Filing Jointly Adjusted Gross Income (AGI) Tax add is: Adjusted Gross Income (AGI) Tax add is: Over $142,701 - $166, % of AGI over $142,700 Over $142,701 - $182, % of AGI over $142,700 $166,701 - $312,700 $ % of AGI over $166,700 $182,701 - $442,700 $ % of AGI over $188,700 $312,701 - $407,700 $ % of AGI over $312,700 $442,701 - $610,200 $1, % of AGI over $442,700 Over $407,700 $ Over $610,200 $1, Sources: AARP 2005 telephone survey of state legislative staff, state departments of revenue, state controllers offices, state assessors offices, and state treasury offices. 211
216 Nebraska Public and Private Pension Exemption... None Social Security Benefits Only taxpayers whose provisional income* is $25,000 or higher (single) or $32,000 or higher (married, filing jointly) are subject taxation of their Social Security benefits. *Provisional income consists of federal adjusted gross income, tax-exempt interest, certain foreign-source income, and one-half of the taxpayer s Social Security or Railroad Retirement Tier 1 benefit (U.S. House Committee on the Budget, Omnibus Budget Reconciliation Act of 1993, 103 rd Congress, 1 st sess., 1993, Conference Report , p. 594). Standard Deductions* Under age $4,850 (single); $8,140 (married, filing jointly) Age 65 or older... $6,030 (single); $10,100 (married, filing jointly; both spouses are age 65 or older) *Standard deductions start phasing out for taxpayers with adjusted gross incomes of $137,300 or higher. Personal Exemption Tax Credits $101 (single); $202 (married, filing jointly) for those whose federal adjusted gross income is $72,000 or less (single) or $119,000 or less (married, filing jointly); taxpayers with higher income are eligible for a lower tax credit until it phases out at over $172,000 (single) and over $219,000 (married, filing jointly) in federal adjusted gross income. Elderly or Disabled Tax Credit Taxpayers age 65 or older or disabled may qualify for the credit. The credit equals the amount of the federal elderly tax credit. Usually taxpayers do not qualify if their federal adjusted gross income is $17,500 or more (single) or $20,000 or more (married, filing jointly, if only one spouse is eligible) or $25,000 or more (married, filing jointly, if both spouses are eligible). Local Income Taxes... None II. General Sales Tax Rates (2004) State % Combined state/local tax rates % 7% III. Miscellaneous Tax Rates (2004) Corporate income (highest marginal rate) % On income over $50,000 Gasoline (per gallon)... $0.254 Cigarette (per pack of 20)... $0.64 Beer (per gallon)... $0.31 Sources: AARP 2005 telephone survey of state legislative staff, state departments of revenue, state controllers offices, state assessors offices, and state treasury offices. 212
217 Nebraska IV. Real Property Tax Relief Programs (2005) Homestead Exemption or Credit... None Circuit Breaker Requirements Benefits Homeowners age 65 or older whose income is $25,700 or less (single) or $30,300 or less (married couples). In addition, the homestead value cannot exceed $95,000 or 150% of the county s average assessed value (whichever is greater) plus $20, Up $40,000 assessed value or 80% of the county s average assessed value (whichever is greater) Circuit Breaker Requirements Benefits Disabled homeowners whose income is $28,300 or less (single) or $32,600 or less (married couples). In addition, the homestead value cannot exceed $110,000 or 175% of the county s average assessed value (whichever is greater) plus $20, $50,000 assessed value or 100% of the county s average assessed value (whichever is greater) Deferral Program... None V. Real Property Tax Limits, Caps, or Freezes (2005) Tax Rate Limits Rural local areas... $1.74 per $100 of assessed value* Municipalities... $2.19 $2.24 per $100 of assessed value* *Voters can decide approve property tax rates exceeding these limits. These tax rate limits do not pertain bonded indebtedness, capital lease contracts approved prior July 1, 1998, or levies used pay for liability judgments. Sources: AARP 2005 telephone survey of state legislative staff, state departments of revenue, state controllers offices, state assessors offices, and state treasury offices. 213
218 Nebraska Local political subdivisions, other than school districts, cannot annually increase various revenue funds by more than 2.5% as part of their budgetary process. These funds include property taxes, local sales taxes, and state aid (includes homestead exemption reimbursement, insurance premiums tax receipts, and street and roads funds). The 2.5% limit does not pertain growth in real property valuation due improvements ( the extent that such growth exceeds 2.5%). The 2.5% limit does not apply bonded indebtedness. An additional 1% growth rate can apply if approved by at least a three-fourths majority vote of the governing body, and voters can approve higher revenue increases. VI. Local Expenditure Limits (2005) School districts cannot annually increase general expenditures by more than 0% 3% ( ); above average or average spending school systems are limited 0%; other school systems can have increases of up 3%. School districts can increase their spending limit by an additional percentage point with a three-fourths approval vote of the school board. Voters can approve higher expenditure growth. Sources: AARP 2005 telephone survey of state legislative staff, state departments of revenue, state controllers offices, state assessors offices, and state treasury offices. 214
219 Nebraska State and Local General Expenditures, FY 2002 General Expenditures Average Annual Expenditure Change Percent of Per Capita Personal Income (millions) NE US NE US NE US State/Local Direct General Expends... $9,759 $5,653 $6, % 19.9% 5.9% 5.9% To State/Local Government... $9,745 $5,645 $6, % 19.9% 5.9% 5.9% Education*... $3,797 $2,199 $2, % 6.8% 5.4% 6.2% Public Welfare... $1,703 $986 $ % 3.2% 8.8% 6.1% Health and Hospitals... $607 $351 $ % 1.7% 2.2% 5.2% Highways... $924 $535 $ % 1.3% 5.1% 5.5% Public Safety*... $712 $412 $ % 1.8% 7.8% 6.3% Environment... $551 $319 $ % 1.2% 5.8% 5.1% Interest on General Debt... $256 $148 $ % 0.9% 1.8% 3.1% Other... $1,196 $693 $ % 3.0% 7.2% 6.5% To Federal Government... $14 $8 $15 0.0% 0.1% 11.1% 1.9% *Education includes higher and lower education; public safety includes police, fire, corrections, and protection and inspection. Source: U.S. Bureau of the Census (2002 data are the most current available.) State and Local General Expenditures, FY 2002 (excluding payments federal government) 3% 6% 12% 40% Education Public Welfare Health and Hospitals Highways 7% Public Safety Environment 9% Interest on General Debt 6% 17% Other Total Debt Outstanding Long-term Debt Short-term Debt 2002 Debt Ratio Measures Per $1,000 Debt (billions) Per Capita of Personal Income Debt (billions) Percent of Total Debt (billions) Percent of Total Nebraska (State and Local)... $7.9 $4,579 $ $ % $ % United States... $1,681.4 $5,839 $ $1, % $ % Source: U.S. Bureau of the Census 215
220 Nevada Economic Indicars Average Annual Change NV US NV US NV US Per Capita Income... $23,772 $22,172 $33,783 $33, % 4.1% Median Household Income... $35,871 $32,264 $47,330 $44, % 3.2% Gross State Product (in millions)... $44,855 $6,865,513 $100,317 $11,665, % 5.4% Full- and Part-Time Positions (in thousands) ,224 1, , % 1.6% Employed Persons (in thousands) ,060 1, , % 1.2% Unemployment Rate % 6.1% 4.3% 5.5% n/a n/a Sources: U.S. Bureau of the Census, U.S. Bureau of Economic Analysis, and the U.S. Bureau of Labor Statistics 2004 Population Under Age 18 6% 4% Males 26% Females 7% 5% 26% Ages Ages Ages 75 and Over 64% 62% Population Poverty Rate Population and Poverty Percentage Change NV NV NV US NV US Total Population... 1,456,388 2,334, % 12.8% 12.6% 13.1% Males ,363 1,188, % 13.8% 11.3% 11.6% Under Age , , % 7.8% 19.0% 18.3% Ages , , % 16.7% 9.1% 9.6% Ages ,362 76, % 1.6% 5.2% 6.5% Ages 75 and Over... 24,325 45, % 28.8% 4.9% 6.8% Females ,025 1,145, % 11.9% 13.9% 14.5% Under Age , , % 8.1% 18.6% 18.6% Ages , , % 14.6% 13.1% 13.6% Ages ,491 77, % -3.6% 8.6% 9.7% Ages 75 and Over... 34,637 62, % 19.6% 6.3% 13.3% Source: U.S. Bureau of the Census 216
221 Nevada Percent Distribution of Households by Age of Householder and Income, 2004 Less than $10,000 $10,000 $14,999 $15,000 $24,999 $25,000 $34,999 $35,000 $49,999 $50,000 $74,999 $75,000 $99,999 $100,000 or more All Households Age of Householder Under 25 years % 5.6% 19.7% 18.3% 22.7% 13.2% 5.7% 3.4% 100.0% years % 2.4% 11.9% 14.0% 21.4% 19.7% 12.5% 12.5% 100.0% years % 3.7% 8.8% 9.9% 17.1% 22.4% 12.6% 19.1% 100.0% 65 years and over % 11.0% 17.6% 13.5% 18.2% 14.6% 7.9% 8.0% 100.0% Nevada (all ages) % 4.6% 12.3% 12.7% 19.4% 19.4% 11.3% 13.5% 100.0% United States (all ages). 8.9% 6.3% 12.3% 12.0% 15.5% 19.0% 11.1% 15.0% 100.0% Source: U.S. Bureau of the Census Percent of Households by Household Income Bracket, 2004 Percent of Households 25.0% 20.0% 15.0% 10.0% 5.0% 0.0% Less than $10,000 $10,000 $14,999 $15,000 $24,999 $25,000 $34,999 $35,000 $49,999 $50,000 $74,999 $75,000 $99,999 $100,000 or more Nevada United States 217
222 State and Local General Revenues, FY 2002 Nevada Average Annual Revenue Change General Revenues Per Capita Percent of Personal Income (millions) NV US NV US NV US Total General Revenues... $11,417 $5,265 $5, % 19.3% 9.3% 5.6% Own Sources... $9,785 $4,513 $4, % 15.2% 9.3% 5.2% Taxes... $6,433 $2,967 $3, % 10.4% 9.1% 4.9% Property Taxes... $1,702 $785 $ % 3.2% 10.3% 4.5% General Sales Taxes... $2,217 $1,022 $ % 2.6% 9.4% 5.4% Personal Income Taxes. $0 $0 $ % 2.3% 0.0% 5.8% Other Taxes... $2,514 $1,159 $ % 2.3% 8.0% 4.3% Charges/Miscellaneous... $3,352 $1,546 $1, % 4.8% 9.8% 5.7% Federal Aid... $1,632 $753 $1, % 4.1% 9.5% 7.2% Source: U.S. Bureau of the Census (2002 data are the most current available.) 1992 General Revenue 2002 General Revenue Property Taxes 14% 14% 14% 15% General Sales Taxes Other Taxes Charges/Misc 28% 19% 30% 19% Federal Aid 25% 22% 218
223 Nevada I. Personal Income Tax (2004) No state or local personal income tax is levied. II. General Sales Tax Rates (2004) State %* Combined state/local tax rates % 7.25% *The state imposes a 6.5% sales tax rate. Of the 6.5%, the state collects taxes from levying a 2.0% tax rate, while localities collect taxes from the remaining 4.5% tax rate. III. Miscellaneous Tax Rates (2004) Corporate income (highest marginal rate)... No tax Gasoline (per gallon)... $0.24 Cigarette (per pack of 20)... $0.80 Beer (per gallon)... $0.16 Localities may levy up $0.09 more per gallon. IV. Real Property Tax Relief Programs (2005) Homestead Exemption or Credit* Requirements Benefits Veterans... $2,063 assessed value Disabled veterans... Up $20,626 assessed value (depending on disability) Surviving spouse... $1,031 assessed value Blind... $3,094 assessed value *Exemptions may apply either real property or a mor vehicle. Circuit Breaker Requirements Benefits Homeowners and renters age 62 or older whose income is $26,190 or less and the assessed value of their home cannot exceed $200,000 or have liquid assets exceeding $150, Up $500 Deferral Program... None Sources: AARP 2005 telephone survey of state legislative staff, state departments of revenue, state controllers offices, state assessors offices, and state treasury offices. 219
224 Nevada V. Real Property Tax Limits, Caps, or Freezes (2005) Generally, combined property tax rates cannot exceed $3.64 per $100 of assessed value. This limitation may be exceeded in certain small localities (county population of 40,000 or less) with voter approval if the combined rate was $3.50 or greater on June 25, This limitation does not apply school bonded indebtedness or the state real property tax for capital projects approved by the voters. Localities (except school districts) cannot raise property taxes by more than 6% per year. This limitation does not include new construction, improvements and additions, bonded indebtedness, or capital improvement projects (that are not funded from the operating budget). Property taxes on single-family owner-occupied homes cannot increase by more than 3% per year. Sources: AARP 2005 telephone survey of state legislative staff, state departments of revenue, state controllers offices, state assessors offices, and state treasury offices. 220
225 Nevada State and Local General Expenditures, FY 2002 General Expenditures Average Annual Expenditure Change Percent of Per Capita Personal Income (millions) NV US NV US NV US State/Local Direct General Expends... $11,774 $5,430 $6, % 19.9% 8.3% 5.9% To State/Local Government... $11,766 $5,427 $6, % 19.9% 8.3% 5.9% Education*... $3,679 $1,697 $2, % 6.8% 8.7% 6.2% Public Welfare... $1,120 $517 $ % 3.2% 8.7% 6.1% Health and Hospitals... $923 $426 $ % 1.7% 8.7% 5.2% Highways... $1,271 $586 $ % 1.3% 11.2% 5.5% Public Safety*... $1,612 $744 $ % 1.8% 9.1% 6.3% Environment... $792 $365 $ % 1.2% 7.4% 5.1% Interest on General Debt... $676 $312 $ % 0.9% 5.3% 3.1% Other... $1,693 $781 $ % 3.0% 6.6% 6.5% To Federal Government... $7 $3 $15 0.0% 0.1% 7.3% 1.9% *Education includes higher and lower education; public safety includes police, fire, corrections, and protection and inspection. Source: U.S. Bureau of the Census (2002 data are the most current available.) State and Local General Expenditures, FY 2002 (excluding payments federal government) 14% Education 7% 6% 14% 11% 8% 30% 10% Public Welfare Health and Hospitals Highways Public Safety Environment Interest on General Debt Other Total Debt Outstanding Long-term Debt Short-term Debt 2002 Debt Ratio Measures Per $1,000 Debt (billions) Per Capita of Personal Income Debt (billions) Percent of Total Debt (billions) Percent of Total Nevada (State and Local)... $15.8 $7,274 $ $ % $ % United States... $1,681.4 $5,839 $ $1, % $ % 221
226 New Hampshire Economic Indicars Average Annual Change NH US NH US NH US Per Capita Income... $23,607 $22,172 $36,676 $33, % 4.1% Median Household Income... $35,245 $32,264 $56,886 $44, % 3.2% Gross State Product (in millions)... $29,456 $6,865,513 $51,871 $11,665, % 5.4% Full- and Part-Time Positions (in thousands) , , % 1.6% Employed Persons (in thousands) , , % 1.2% Unemployment Rate % 6.1% 3.8% 5.5% n/a n/a Sources: U.S. Bureau of the Census, U.S. Bureau of Economic Analysis, and the U.S. Bureau of Labor Statistics 2004 Population Under Age 18 6% 5% Males 24% 6% Females 7% 23% Ages Ages Ages 75 and Over 65% 64% Population Poverty Rate Population and Poverty Percentage Change NH NH NH US NH US Total Population... 1,133,054 1,299, % 12.8% 7.6% 13.1% Males , , % 13.8% 6.5% 11.6% Under Age , , % 7.8% 10.6% 18.3% Ages , , % 16.7% 4.9% 9.6% Ages ,976 37, % 1.6% 7.6% 6.5% Ages 75 and Over... 21,247 29, % 28.8% 6.4% 6.8% Females , , % 11.9% 8.6% 14.5% Under Age , , % 8.1% 8.7% 18.6% Ages , , % 14.6% 8.4% 13.6% Ages ,441 41, % -3.6% 6.6% 9.7% Ages 75 and Over... 38,751 48, % 19.6% 11.9% 13.3% Source: U.S. Bureau of the Census 222
227 New Hampshire Percent Distribution of Households by Age of Householder and Income, 2004 Less than $10,000 $10,000 $14,999 $15,000 $24,999 $25,000 $34,999 $35,000 $49,999 $50,000 $74,999 $75,000 $99,999 $100,000 or more All Households Age of Householder Under 25 years % 9.6% 9.8% 12.6% 23.2% 20.5% 3.5% 0.8% 100.0% years % 2.0% 6.1% 9.7% 14.9% 26.4% 17.0% 19.5% 100.0% years % 3.0% 6.7% 9.1% 12.2% 21.3% 18.7% 24.7% 100.0% 65 years and over % 11.5% 20.2% 12.7% 16.4% 15.4% 5.7% 6.4% 100.0% New Hampshire (all ages). 6.3% 4.5% 9.1% 10.1% 14.4% 22.1% 15.0% 18.4% 100.0% United States (all ages) % 6.3% 12.3% 12.0% 15.5% 19.0% 11.1% 15.0% 100.0% Source: U.S. Bureau of the Census Percent of Households by Household Income Bracket, 2004 Percent of Households 25.0% 20.0% 15.0% 10.0% 5.0% 0.0% Less than $10,000 $10,000 $14,999 $15,000 $24,999 $25,000 $34,999 $35,000 $49,999 $50,000 $74,999 $75,000 $99,999 $100,000 or more New Hampshire United States 223
228 State and Local General Revenues, FY 2002 New Hampshire Average Annual Revenue Change General Revenues Per Capita Percent of Personal Income (millions) NH US NH US NH US Total General Revenues... $6,406 $5,022 $5, % 19.3% 4.4% 5.6% Own Sources... $5,110 $4,006 $4, % 15.2% 4.2% 5.2% Taxes... $3,599 $2,821 $3, % 10.4% 3.7% 4.9% Property Taxes... $2,169 $1,701 $ % 3.2% 3.8% 4.5% General Sales Taxes... $0 $0 $ % 2.6% 0.0% 5.4% Personal Income Taxes.. $71 $56 $ % 2.3% 7.4% 5.8% Other Taxes... $1,358 $1,065 $ % 2.3% 3.5% 4.3% Charges/Miscellaneous... $1,511 $1,185 $1, % 4.8% 5.6% 5.7% Federal Aid... $1,296 $1,016 $1, % 4.1% 5.2% 7.2% Source: U.S. Bureau of the Census (2002 data are the most current available.) 1992 General Revenue 2002 General Revenue Property Taxes 19% 20% Personal Income Taxes 36% 34% Other Taxes Charges/Misc Federal Aid 21% 1% 24% 1% 23% 21% 224
229 New Hampshire I. Personal Income Tax (2004) State Income Tax Base New Hampshire s income tax base is not directly linked the federal income tax base. Filing Requirements Taxpayers must file if their gross taxable interest and dividend income exceeds $2,400 (single) or $4,800 (married, filing jointly). Rate Structure A tax is levied only on interest and dividends at a rate of 5.0%. Local Income Taxes... None II. General Sales Tax Rates (2004) No state or local general sales tax is levied. III. Miscellaneous Tax Rates (2004) Corporate income (highest marginal rate) % Gasoline (per gallon)... $0.18 Cigarette (per pack of 20)... $0.52 Beer (per gallon)... $0.30 IV. Real Property Tax Relief Programs (2005) Homestead Exemption Eligibility Requirements and Benefits Homeowners age 65 or older who have been New Hampshire residents for at least five years may be eligible for the homestead exemption. Income requirements can vary depending on the locality, but household income cannot exceed $13,400 (single) or $20,400 (married). Asset requirements (excluding a person s residence) cannot exceed $35,000. The income and assets limits as well as the homestead exemptions can be increased with voter approval. Homestead exemptions have equal at least $5,000 in assessed property value. Sources: AARP 2005 telephone survey of state legislative staff, state departments of revenue, state controllers offices, state assessors offices, and state treasury offices. 225
230 New Hampshire Homestead Exemption Disabled homeowners who have been New Hampshire residents for at least five years, whose income is $13,400 or less (single) or $20,400 or less (married), and whose assets are $35,000 or less (excluding a person s residence) are eligible for the exemption. The income and assets limits as well as the homestead exemption can be increased with voter approval. The amount of the exemption and level of income and assets (excluding the value of the property owner s residence) are determined by local approval. Veterans... Tax credit of $50 or from $51 $500 (depending on locality) for qualifying veterans with local approval Disabled veterans... Tax credit ranging from $700 or $701 $2,000 (depending on locality) and a tal exemption for specially adapted households with local approval Blind or deaf... $15,000 assessed value with local approval Circuit Breaker Requirements Benefits Homeowners whose income is $20,000 or less (single) or $40,000 or less (married filers)... Up a tax credit equal the entire state education property tax that is owed Deferral Program (local option program) Requirements Benefits Homeowners age 65 or older or disabled who have owned their homes for at least 5 years... Up 85% of the tax can be deferred. V. Real Property Tax Limits, Caps, or Freezes (2005) No statewide limits, caps, or freezes are provided. Sources: AARP 2005 telephone survey of state legislative staff, state departments of revenue, state controllers offices, state assessors offices, and state treasury offices. 226
231 New Hampshire State and Local General Expenditures, FY 2002 General Expenditures Average Annual Expenditure Change Percent of Per Capita Personal Income (millions) NH US NH US NH US State/Local Direct General Expends... $6,343 $4,973 $6, % 19.9% 3.4% 5.9% To State/Local Government... $6,343 $4,973 $6, % 19.9% 3.4% 5.9% Education*... $2,439 $1,912 $2, % 6.8% 6.4% 6.2% Public Welfare... $1,030 $807 $ % 3.2% -2.4% 6.1% Health and Hospitals... $184 $144 $ % 1.7% 1.8% 5.2% Highways... $504 $395 $ % 1.3% 6.0% 5.5% Public Safety*... $477 $374 $ % 1.8% 3.3% 6.3% Environment... $265 $208 $ % 1.2% 2.3% 5.1% Interest on General Debt... $406 $318 $ % 0.9% 1.1% 3.1% Other... $1,038 $814 $ % 3.0% 6.6% 6.5% To Federal Government... $0 $0 $15 0.0% 0.1% 0.0% 1.9% *Education includes higher and lower education; public safety includes police, fire, corrections, and protection and inspection. Source: U.S. Bureau of the Census (2002 data are the most current available.) State and Local General Expenditures, FY 2002 (excluding payments federal government) 16% Education Public Welfare 6% 4% 8% 39% Health and Hospitals Highways Public Safety Environment 8% 3% 16% Interest on General Debt Other Total Debt Outstanding Long-term Debt Short-term Debt 2002 Debt Ratio Measures Per $1,000 Debt (billions) Per Capita of Personal Income Debt (billions) Percent of Total Debt (billions) Percent of Total New Hampshire (State and Local)... $7.2 $5,661 $ $ % $ % United States... $1,681.4 $5,839 $ $1, % $ % Source: U.S. Bureau of the Census 227
232 New Jersey Economic Indicars Average Annual Change NJ US NJ US NJ US Per Capita Income... $27,558 $22,172 $41,636 $33, % 4.1% Median Household Income... $42,280 $32,264 $55,446 $44, % 3.2% Gross State Product (in millions)... $254,546 $6,865,513 $416,053 $11,665, % 5.4% Full- and Part-Time Positions (in thousands) 4, ,224 4, , % 1.6% Employed Persons (in thousands).. 3, ,060 4, , % 1.2% Unemployment Rate % 6.1% 4.8% 5.5% n/a n/a Sources: U.S. Bureau of the Census, U.S. Bureau of Economic Analysis, and the U.S. Bureau of Labor Statistics 2004 Population Under Age 18 6% 5% Males 26% 7% 8% Females 24% Ages Ages Ages 75 and Over 63% 61% Population Poverty Rate Population and Poverty Percentage Change NJ NJ NJ US NJ US Total Population... 7,918,796 8,698, % 12.8% 8.5% 13.1% Males... 3,831,125 4,235, % 13.8% 7.1% 11.6% Under Age ,683 1,102, % 7.8% 11.3% 18.3% Ages ,400,798 2,677, % 16.7% 5.6% 9.6% Ages , , % 1.6% 6.6% 6.5% Ages 75 and Over , , % 28.8% 4.7% 6.8% Females... 4,087,671 4,463, % 11.9% 9.9% 14.5% Under Age ,006 1,053, % 8.1% 12.4% 18.6% Ages ,489,748 2,739, % 14.6% 8.9% 13.6% Ages , , % -3.6% 8.7% 9.7% Ages 75 and Over , , % 19.6% 11.0% 13.3% Source: U.S. Bureau of the Census 228
233 New Jersey Percent Distribution of Households by Age of Householder and Income, 2004 Less than $10,000 $10,000 $14,999 $15,000 $24,999 $25,000 $34,999 $35,000 $49,999 $50,000 $74,999 $75,000 $99,999 $100,000 or more All Households Age of Householder Under 25 years % 4.6% 15.3% 15.9% 15.5% 19.9% 8.7% 4.6% 100.0% years % 2.3% 6.6% 8.1% 13.0% 20.6% 16.0% 28.8% 100.0% years % 2.8% 5.5% 6.7% 11.5% 18.0% 15.7% 35.1% 100.0% 65 years and over % 12.3% 18.1% 12.8% 14.3% 13.6% 7.4% 11.3% 100.0% New Jersey (all ages) % 4.7% 8.9% 8.8% 12.8% 18.1% 13.8% 26.8% 100.0% United States (all ages). 8.9% 6.3% 12.3% 12.0% 15.5% 19.0% 11.1% 15.0% 100.0% Source: U.S. Bureau of the Census Percent of Households by Household Income Bracket, 2004 Percent of Households 30.0% 25.0% 20.0% 15.0% 10.0% 5.0% 0.0% Less than $10,000 $10,000 $14,999 $15,000 $24,999 $25,000 $34,999 $35,000 $49,999 $50,000 $74,999 $75,000 $99,999 $100,000 or more New Jersey United States 229
234 State and Local General Revenues, FY 2002 New Jersey Average Annual Revenue Change General Revenues Per Capita Percent of Personal Income (millions) NJ US NJ US NJ US Total General Revenues... $55,256 $6,442 $5, % 19.3% 4.0% 5.6% Own Sources... $46,307 $5,399 $4, % 15.2% 3.8% 5.2% Taxes... $34,629 $4,037 $3, % 10.4% 4.0% 4.9% Property Taxes... $16,050 $1,871 $ % 3.2% 4.4% 4.5% General Sales Taxes... $5,997 $699 $ % 2.6% 4.0% 5.4% Personal Income Taxes. $6,867 $801 $ % 2.3% 5.3% 5.8% Other Taxes... $5,715 $666 $ % 2.3% 1.7% 4.3% Charges/Miscellaneous... $11,678 $1,361 $1, % 4.8% 3.4% 5.7% Federal Aid... $8,949 $1,043 $1, % 4.1% 5.2% 7.2% Source: U.S. Bureau of the Census (2002 data are the most current available.) 1992 General Revenue 2002 General Revenue Property Taxes 14% 16% General Sales Taxes 29% 30% Personal Income Taxes Other Taxes 22% 21% Charges/Misc Federal Aid 13% 11% 11% 10% 12% 11% 230
235 New Jersey I. Personal Income Tax (2004) State Income Tax Base New Jersey s income tax base is not directly linked the federal income tax base. Filing Requirements Taxpayers must file if their gross income exceeds $10,000 (single) or $20,000 (married, filing jointly). Rate Structure Single Married, Filing Jointly Taxable Income Rate Taxable Income Rate First $20, % First $20, % $20,001 - $35, % $20,001 - $50, % $35,001 - $40, % $50,001 - $70, % $40,001 - $75, % $70,001 - $80, % $75,001 - $500, % $80,001 - $150, % Over $500, % $150,001 - $500, % Over $500, % Public and Private Pension Exemptions... $15,000 (single) and $20,000 (married, filing jointly) for persons age 62 or over or disabled Additional Retirement Income Exemption Taxpayers age 62 or older who did not claim the maximum allowable pension exemption may be able claim an additional retirement income exclusion if their wages, net profits from business, partnership income, and S corporation income equal $3,000 or less. The additional retirement income exclusion equals the difference between the maximum pension exemptions (shown above) and the amount a taxpayer claims for the pension exemption. Therefore, taxpayers cannot claim more than the maximum pension exemptions (shown above) for both the pension exemption and the additional retirement income exemption. Taxpayers who have never received and never will receive or be eligible for Social Security or Railroad Retirement benefits may be able receive an additional retirement income exemption up $3,000 (single) or $6,000 (married, filing jointly). Social Security Benefits... Full exemption Sources: AARP 2005 telephone survey of state legislative staff, state departments of revenue, state controllers offices, state assessors offices, and state treasury offices. 231
236 New Jersey Medical Expense Deduction Expenses in excess of 2% of income can be deducted. This is not an itemized deduction. Medical expenses involving contributions a medical savings account or amounts taken as a deduction for self-employed health insurance cannot be deducted. Personal Exemptions Combined Under age $1,000 (single); $2,000 (married, filing jointly) Age 65 or older... $2,000 (single); $4,000 (married, filing jointly; both spouses are age 65 or older) Local Income Taxes... None II. General Sales Tax Rates (2004) State %* Combined state/local tax rates %* *Some areas, known as urban enterprise zones, are allowed levy a general sales tax of 3%. III. Miscellaneous Tax Rates (2004) Corporate income (highest marginal rate) % On all taxable income Gasoline (per gallon)... $0.105 An additional $0.04 per gallon gross receipts tax is also levied for a tal of $0.145 per gallon. Cigarette (per pack of 20)... $1.50 Beer (per gallon)... $0.12 IV. Real Property Tax Relief Programs (2005) Homestead Credit Requirements Benefits Homeowners age 65 or older, or who are tally disabled, or their surviving spouses age 55 or older with incomes not over $10,000 (excluding Social Security benefits or a government pension up the maximum benefit amount allowed for Social Security, whichever is greater)... $250 property tax deduction Sources: AARP 2005 telephone survey of state legislative staff, state departments of revenue, state controllers offices, state assessors offices, and state treasury offices. 232
237 New Jersey Veterans or surviving spouses of veterans... $100 property tax deduction Homeowners and renters under age 65 whose income is more than $10,000 (single) or $20,000 (married, filing jointly) or homeowners and renters age 65 and older (all incomes) are eligible for a property tax credit or deduction.... Deduction equals the tal amount of property taxes paid (or 18% of the rent paid for renters) up $10,000 from their taxable personal income for income taxes.* *If the tax savings from this deduction exceeds $50, taxpayers would take this deduction. However, if the tax savings from this deduction does not exceed $50, taxpayers would not take this deduction but instead would take a $50 refundable tax credit off their income taxes. Residents whose income is less than $10,000 are not entitled a $50 property tax credit, unless they are age 65 or older or disabled. Taxpayers age 65 or older or disabled receive the $50 credit aumatically with their FAIR rebate check. Circuit Breaker (FAIR Program)* Requirements Benefits Homeowners age 65 or older or disabled whose gross income is $200,000 or less... Up a $1,200 rebate Renters age 65 or older or disabled whose income is $100,000 or less... Up a $825 rebate Renter Rebate (FAIR Program) Renters under age 65 whose income is $100,000 or less... $150 rebate Deferral Program... None Sources: AARP 2005 telephone survey of state legislative staff, state departments of revenue, state controllers offices, state assessors offices, and state treasury offices. 233
238 New Jersey V. Real Property Tax Limits, Caps, or Freezes (2004) To qualify for the property tax freeze for 2005, homeowners age 65 or older or permanently disabled must meet the following eligibility requirements: (1) have an income of less than $38,475 (single) or $47,177 (married, filing jointly) in 2001; (2) have an income of less than $39,475 (single) or $48,404 (married, filing jointly) in 2002; (3) have an income of less than $40,028 (single) or $49,082 (married couples) in 2003; (4) have an income of less than $40,869 (single) or $50,113 (married couples) in 2004; (5) have an income of less than $41,972 (single) or $51,466 (married couples) in 2005; (6) have lived in their homes for at least three years; (7) have been New Jersey residents at least 10 years; and (8) have paid property taxes from The reimbursement for the year 2004 equals the amount of property taxes paid in 2004 that exceeds the amount paid in the base year (the first year that a homeowner met all of the requirements). The base year could be as early as VI. Local Expenditure Limits (2005) Local municipalities and counties cannot increase their appropriations by more than 2.5% or the cost of living (price deflar for state and local government purchases of goods and services), whichever is less, over the previous year. Exceptions this limit include capital expenditures and any amount approved by referendum. In addition, counties may increase their annual appropriations by as much as 3.5% over the prior year through a majority vote of the governing body. Sources: AARP 2005 telephone survey of state legislative staff, state departments of revenue, state controllers offices, state assessors offices, and state treasury offices. 234
239 New Jersey State and Local General Expenditures, FY 2002 General Expenditures Average Annual Expenditure Change Percent of Personal Per Capita Income (millions) NJ US NJ US NJ US State/Local Direct General Expends... $54,467 $6,350 $6, % 19.9% 4.0% 5.9% To State/Local Government... $54,387 $6,341 $6, % 19.9% 4.0% 5.9% Education*... $20,544 $2,395 $2, % 6.8% 5.9% 6.2% Public Welfare... $6,608 $770 $ % 3.2% 1.2% 6.1% Health and Hospitals... $2,736 $319 $ % 1.7% 4.6% 5.2% Highways... $2,963 $345 $ % 1.3% 1.4% 5.5% Public Safety*... $5,182 $604 $ % 1.8% 4.9% 6.3% Environment... $3,531 $412 $ % 1.2% 3.0% 5.1% Interest on General Debt... $2,377 $277 $ % 0.9% 0.5% 3.1% Other... $10,446 $1,218 $ % 3.0% 4.4% 6.5% To Federal Government... $79 $9 $15 0.0% 0.1% -1.3% 1.9% *Education includes higher and lower education; public safety includes police, fire, corrections, and protection and inspection. Source: U.S. Bureau of the Census (2002 data are the most current available.) State and Local General Expenditures, FY 2002 (excluding payments federal government) 19% 4% 6% 10% 5% 5% 12% 39% Education Public Welfare Health and Hospitals Highways Public Safety Environment Interest on General Debt Other Total Debt Outstanding Long-term Debt Short-term Debt 2002 Debt Ratio Measures Per $1,000 Debt (billions) Per Capita of Personal Income Debt (billions) Percent of Total Debt (billions) Percent of Total New Jersey (State and Local)... $57.6 $6,714 $ $ % $ % United States... $1,681.4 $5,839 $ $1, % $ % Source: U.S. Bureau of the Census 235
240 New Mexico Economic Indicars Average Annual Change NM US NM US NM US Per Capita Income... $17,631 $22,172 $26,154 $33, % 4.1% Median Household Income... $26,905 $32,264 $39,467 $44, % 3.2% Gross State Product (in millions)... $41,143 $6,865,513 $61,012 $11,665, % 5.4% Full- and Part-Time Positions (in thousands) ,224 1, , % 1.6% Employed Persons (in thousands) , , % 1.2% Unemployment Rate % 6.1% 5.7% 5.5% n/a n/a Sources: U.S. Bureau of the Census, U.S. Bureau of Economic Analysis, and the U.S. Bureau of Labor Statistics 2004 Population Under Age 18 6% 4% Males 27% 7% 6% Females 25% Ages Ages Ages 75 and Over 63% 62% Population Poverty Rate Population and Poverty Percentage Change NM NM NM US NM US Total Population... 1,653,329 1,903, % 12.8% 19.3% 13.1% Males , , % 13.8% 17.3% 11.6% Under Age , , % 7.8% 25.7% 18.3% Ages , , % 16.7% 15.1% 9.6% Ages ,885 59, % 1.6% 10.7% 6.5% Ages 75 and Over... 29,893 41, % 28.8% 6.5% 6.8% Females , , % 11.9% 21.2% 14.5% Under Age , , % 8.1% 29.7% 18.6% Ages , , % 14.6% 19.2% 13.6% Ages ,264 66, % -3.6% 13.3% 9.7% Ages 75 and Over... 45,525 61, % 19.6% 15.2% 13.3% Source: U.S. Bureau of the Census 236
241 New Mexico Percent Distribution of Households by Age of Householder and Income, 2004 Less than $10,000 $10,000 $14,999 $15,000 $24,999 $25,000 $34,999 $35,000 $49,999 $50,000 $74,999 $75,000 $99,999 $100,000 or more All Households Age of Householder Under 25 years % 13.8% 23.6% 20.8% 10.3% 6.1% 1.1% 0.8% 100.0% years % 6.9% 12.9% 14.7% 19.0% 20.7% 10.1% 8.5% 100.0% years % 5.6% 13.2% 12.2% 16.2% 17.0% 10.8% 14.1% 100.0% 65 years and over % 16.5% 21.5% 13.0% 14.4% 15.0% 4.4% 5.2% 100.0% New Mexico (all ages) % 8.9% 15.6% 13.9% 16.3% 17.0% 8.5% 9.3% 100.0% United States (all ages). 8.9% 6.3% 12.3% 12.0% 15.5% 19.0% 11.1% 15.0% 100.0% Source: U.S. Bureau of the Census Percent of Households by Household Income Bracket, 2004 Percent of Households 20.0% 18.0% 16.0% 14.0% 12.0% 10.0% 8.0% 6.0% 4.0% 2.0% 0.0% Less than $10,000 $10,000 $14,999 $15,000 $24,999 $25,000 $34,999 $35,000 $49,999 $50,000 $74,999 $75,000 $99,999 $100,000 or more New Mexico United States 237
242 State and Local General Revenues, FY 2002 New Mexico Average Annual Revenue Change General Revenues Per Capita Percent of Personal Income (millions) NM US NM US NM US Total General Revenues... $10,868 $5,858 $5, % 19.3% 6.0% 5.6% Own Sources... $7,744 $4,174 $4, % 15.2% 4.8% 5.2% Taxes... $4,878 $2,629 $3, % 10.4% 5.6% 4.9% Property Taxes... $756 $407 $ % 3.2% 8.2% 4.5% General Sales Taxes... $1,765 $951 $ % 2.6% 3.9% 5.4% Personal Income Taxes. $983 $530 $ % 2.3% 8.2% 5.8% Other Taxes... $1,374 $741 $ % 2.3% 4.9% 4.3% Charges/Miscellaneous... $2,867 $1,545 $1, % 4.8% 3.7% 5.7% Federal Aid... $3,124 $1,684 $1, % 4.1% 9.7% 7.2% Source: U.S. Bureau of the Census (2002 data are the most current available.) 1992 General Revenue 2002 General Revenue Property Taxes General Sales Taxes Personal Income Taxes Other Taxes Charges/Misc 20% 6% 20% 7% 29% 7% 16% 9% Federal Aid 33% 14% 26% 13% 238
243 New Mexico I. Personal Income Tax (2004) State Income Tax Base New Mexico s income tax base is linked federal adjusted gross income. Filing Requirements Taxpayers must file if they are required file a federal tax return, if they want claim a refund or if they want claim any New Mexico rebates or credits. Rate Structure Single Married, Filing Jointly Taxable Income Rate Taxable Income Rate First $5, % First $8, % $5,501 - $11, % $8,001 - $16, % $11,001 - $16, % $16,001 - $24, % $16,001 - $26, % $24,001 - $40, % $26,001 and over 6.8% $40,001 and over 6.8% Income Exemption Eligibility... Taxpayers age 65 or older or blind Income ceilings... $28,500 (single); $51,000 (married, filing jointly) Exemption amount... Up $8,000 depending on income Social Security Benefits Only taxpayers whose provisional income* is $25,000 or higher (single) or $32,000 or higher (married, filing jointly) are subject taxation of their Social Security benefits. *Provisional income consists of federal adjusted gross income, tax-exempt interest, certain foreign-source income, and one-half of the taxpayer s Social Security or Railroad Retirement Tier 1 benefit (U.S. House Committee on the Budget, Omnibus Budget Reconciliation Act of 1993, 103 rd Congress, 1 st sess., 1993, Conference Report , p. 594). Medical Savings Account (MSA) Exemption MSA contributions, interest, and some withdrawals are exempt the extent that they were not deducted in determining federal taxable income. The MSA must be established by a selfemployed person or by an employer for an employee. Sources: AARP 2005 telephone survey of state legislative staff, state departments of revenue, state controllers offices, state assessors offices, and state treasury offices. 239
244 New Mexico Medical Care Expense Deduction Taxpayers can deduct from 10% 25% of unreimbursed and uncompensated medical care expenses (depending on income). These expenses cannot be deducted if they were already itemized on the federal return. These expenses can include premium costs for long-term care insurance, qualified long-term care services, and unreimbursed insurance premiums and copayments that were not deducted on the federal return. Standard Deductions and Personal Exemptions Combined* Under age 65*... $7,950 (single); $15,900 (married, filing jointly; both spouses are under age 65) Age 65 or older*... $9,150 (single); $17,800 (married, filing jointly; both spouses are age 65 or older) *Personal exemptions equal $3,100 per exemption (single have one exemption and married couples have two). Taxpayers with federal adjusted gross income greater than $142,700 (single) or $214,050 (married, filing jointly) receive lower personal exemption amounts. Low-Income Tax Credit Eligibility... Taxpayers whose modified gross income is $22,000 or less; moreover, taxpayers cannot claim this credit if they are eligible be claimed as a dependent or are actually claimed as a dependent Tax credit amount... Up $450 Local Income Taxes... None II. General Sales Tax Rates (2004) State % Combined state/local tax rates % % III. Miscellaneous Tax Rates (2004) Corporate income (highest marginal rate) % Gasoline (per gallon)... $0.17 Cigarette (per pack of 20)... $0.91 Beer (per gallon)... $0.41 On income over $1 million An additional $0.01 tax is levied for the petroleum products loading fee. Sources: AARP 2005 telephone survey of state legislative staff, state departments of revenue, state controllers offices, state assessors offices, and state treasury offices. 240
245 New Mexico IV. Real Property Tax Relief Programs (2005) Homestead Exemption or Credit Requirements Benefits All homeowners... $2,000 assessed value Circuit Breaker Requirements Benefits Homeowners and renters age 65 or older whose modified gross income is $16,000 or less*... Up a $250 tax credit (from personal income taxes) Los Alamos County homeowners whose modified gross income is $24,000 or less also qualify for a property tax credit of up $350 (from personal income taxes). Deferral Program... None V. Real Property Tax Limits, Caps, or Freezes (2005) New Mexico has a number of statury maximum tax rates for various tax districts, as shown below: Schools (general purposes)... $0.50 per $1,000 of net taxable value Municipalities (general purposes)... $7.65 per $1,000 of net taxable value Counties (general purposes)... $11.85 per $1,000 of net taxable value The above maximum rates do not pertain bonded indebtedness and may be raised with voter approval. Property tax revenues from local taxing districts cannot increase annually by more than 5% or inflation (whichever is less). This limitation applies existing properties and not additional properties and improvements. Moreover, this limitation does not apply debt service. The value of existing real property values cannot increase more than 3% of the prior year s value or more than 6.1% of the property value from two years ago (whichever is higher). This limitation does not apply physical improvements, a change in ownership, or a change in use or zoning. The limitation will not apply a county having a ratio of property tax value sales price of less than 85%. Assessed property values will be frozen for homeowners age 65 and older whose household income is $18,000 or less. Sources: AARP 2005 telephone survey of state legislative staff, state departments of revenue, state controllers offices, state assessors offices, and state treasury offices. 241
246 State and Local General Expenditures, FY 2002 General Expenditures New Mexico Average Annual Expenditure Change Percent of Personal Per Capita Income (millions) NM US NM US NM US State/Local Direct General Expends... $11,436 $6,164 $6, % 19.9% 6.4% 5.9% To State/Local Government... $11,436 $6,164 $6, % 19.9% 6.4% 5.9% Education*... $4,176 $2,251 $2, % 6.8% 6.9% 6.2% Public Welfare... $2,077 $1,119 $ % 3.2% 10.9% 6.1% Health and Hospitals... $829 $447 $ % 1.7% 4.0% 5.2% Highways... $1,143 $616 $ % 1.3% 4.4% 5.5% Public Safety*... $990 $534 $ % 1.8% 6.6% 6.3% Environment... $637 $343 $ % 1.2% 4.4% 5.1% Interest on General Debt... $378 $204 $ % 0.9% 2.8% 3.1% Other... $1,206 $650 $ % 3.0% 5.5% 6.5% To Federal Government... $0 $0 $15 0.0% 0.1% 0.0% 1.9% *Education includes higher and lower education; public safety includes police, fire, corrections, and protection and inspection. Source: U.S. Bureau of the Census (2002 data are the most current available.) State and Local General Expenditures, FY 2002 (excluding payments federal government) 11% Education 3% 6% 9% 10% 36% Public Welfare Health and Hospitals Highways Public Safety Environment Interest on General Debt Other 7% 18% Total Debt Outstanding Long-term Debt Short-term Debt 2002 Debt Ratio Measures Per $1,000 Debt (billions) Per Capita of Personal Income Debt (billions) Percent of Total Debt (billions) Percent of Total New Mexico (State and Local)... $8.6 $4,638 $ $ % $ % United States... $1,681.4 $5,839 $ $1, % $ % Source: U.S. Bureau of the Census 242
247 THIS PAGE INTENTIONALLY LEFT BLANK 243
248 New York Economic Indicars Average Annual Change NY US NY US NY US Per Capita Income... $25,785 $22,172 $38,333 $33, % 4.1% Median Household Income... $31,899 $32,264 $44,664 $44, % 3.2% Gross State Product (in millions)... $569,398 $6,865,513 $896,739 $11,665, % 5.4% Full- and Part-Time Positions (in thousands) 9, ,224 10, , % 1.6% Employed Persons (in thousands).. 8, ,060 8, , % 1.2% Unemployment Rate % 6.1% 5.8% 5.5% n/a n/a Sources: U.S. Bureau of the Census, U.S. Bureau of Economic Analysis, and the U.S. Bureau of Labor Statistics 2004 Population Under Age 18 6% 5% Males 25% 7% 8% Females 23% Ages Ages Ages 75 and Over 64% 62% Population Poverty Rate Population and Poverty Percentage Change NY NY NY US NY US Total Population...18,156,652 19,227, % 12.8% 14.2% 13.1% Males... 8,724,495 9,304, % 13.8% 12.7% 11.6% Under Age ,308,885 2,338, % 7.8% 20.5% 18.3% Ages ,467,962 5,960, % 16.7% 10.4% 9.6% Ages , , % 1.6% 8.4% 6.5% Ages 75 and Over , , % 28.8% 8.5% 6.8% Females... 9,432,157 9,922, % 11.9% 15.6% 14.5% Under Age ,202,107 2,233, % 8.1% 20.9% 18.6% Ages ,772,574 6,201, % 14.6% 14.2% 13.6% Ages , , % -3.6% 12.5% 9.7% Ages 75 and Over , , % 19.6% 14.1% 13.3% Source: U.S. Bureau of the Census 244
249 New York Percent Distribution of Households by Age of Householder and Income, 2004 Less than $10,000 $10,000 $14,999 $15,000 $24,999 $25,000 $34,999 $35,000 $49,999 $50,000 $74,999 $75,000 $99,999 $100,000 or more All Households Age of Householder Under 25 years % 7.2% 18.1% 15.2% 14.1% 10.2% 3.8% 4.9% 100.0% years % 4.0% 9.5% 10.4% 14.7% 21.4% 13.3% 18.9% 100.0% years % 4.3% 8.6% 9.3% 12.8% 18.9% 13.2% 24.7% 100.0% 65 years and over % 12.6% 18.9% 13.4% 13.9% 12.6% 6.1% 8.7% 100.0% New York (all ages) % 6.1% 11.5% 10.8% 13.8% 18.2% 11.4% 18.4% 100.0% United States (all ages). 8.9% 6.3% 12.3% 12.0% 15.5% 19.0% 11.1% 15.0% 100.0% Source: U.S. Bureau of the Census Percent of Households by Household Income Bracket, 2004 Percent of Households 20.0% 18.0% 16.0% 14.0% 12.0% 10.0% 8.0% 6.0% 4.0% 2.0% 0.0% Less than $10,000 $10,000 $14,999 $15,000 $24,999 $25,000 $34,999 $35,000 $49,999 $50,000 $74,999 $75,000 $99,999 $100,000 or more New York United States 245
250 State and Local General Revenues, FY 2002 New York Average Annual Revenue Change General Revenues Per Capita Percent of Personal Income (millions) NY US NY US NY US Total General Revenues... $155,541 $8,122 $5, % 19.3% 4.2% 5.6% Own Sources... $119,356 $6,232 $4, % 15.2% 3.6% 5.2% Taxes... $88,878 $4,641 $3, % 10.4% 3.3% 4.9% Property Taxes... $26,826 $1,401 $ % 3.2% 2.3% 4.5% General Sales Taxes... $16,630 $868 $ % 2.6% 4.2% 5.4% Personal Income Taxes. $30,208 $1,577 $ % 2.3% 5.2% 5.8% Other Taxes... $15,214 $794 $ % 2.3% 1.3% 4.3% Charges/Miscellaneous... $30,477 $1,591 $1, % 4.8% 4.3% 5.7% Federal Aid... $36,186 $1,889 $1, % 4.1% 6.6% 7.2% Source: U.S. Bureau of the Census (2002 data are the most current available.) 1992 General Revenue 2002 General Revenue Property Taxes General Sales Taxes Personal Income Taxes Other Taxes Charges/Misc 19% 19% 20% 11% 20% 23% 17% 11% Federal Aid 13% 18% 10% 19% 246
251 New York I. Personal Income Tax (2004) State Income Tax Base New York s income tax base is linked federal adjusted gross income. Filing Requirements Taxpayers must file if they filed a federal return or if their federal adjusted gross income plus New York additions (on the New York tax return) exceeds $3,000 (single and the taxpayer can be claimed as a dependent on another person s return) or $4,000 (single and married, filing jointly). Rate Structure Single Married, Filing Jointly Taxable Income Rate Taxable Income Rate First $8, % First $16, % $8,001 - $11, % $16,001 - $22, % $11,001 - $13, % $22,001 - $26, % $13,001 - $20, % $26,001 - $40, % $20,001 - $100, % $40,001 - $150, % $100,001 - $500, % $150,001 - $500, % Over $500, % Over $500, % Public Pension Exemption... Full exemption Private Pension Exemption... $20,000 exemption for persons age 59 1/2 or older Social Security Benefits... Full exemption Standard Deductions (all ages)... $7,500 (single); $14,600 (married, filing jointly) Long-Term Care Expense Deduction Residents in a continuing care retirement community can deduct the portion of fees they paid for the cost of providing long-term benefits from $260 (age 40 or younger) $3,250 (age 71 and older). Household Tax Credits Single taxpayers receive tax credits ranging from $75 (federal adjusted gross income of $5,000 or less) $0 (federal adjusted gross income of $28,000 or over). Married taxpayers filing jointly receive tax credits ranging from $105 (federal adjusted gross income of $5,000 or less) $0 (federal adjusted gross income of $32,000 or more). This assumes that both spouses have no dependents. Sources: AARP 2005 telephone survey of state legislative staff, state departments of revenue, state controllers offices, state assessors offices, and state treasury offices. 247
252 New York Long-Term Care Insurance Credit... 20% of the premiums Local Income Taxes Yonkers... 5% of the net state income tax Rate Structure New York City Local Income Tax Single Married, Filing Jointly City Taxable Income Rate City Taxable Income Rate First $12, % First $21, % $12,000 - $25, % $21,600 - $45, % $25,000 - $50, % $45,000 - $90, % $50,000 - $100, % $90,000 - $150, % $100,000 - $500, % $150,000 - $500, % Over $500, % Over $500, % II. General Sales Tax Rates (2004) State % Combined state/local tax rates % 8.75% III. Miscellaneous Tax Rates (2005) Corporate income (highest marginal rate) % Gasoline (per gallon)... $0.08 Cigarette (per pack of 20)... $1.50 Beer (per gallon)... $0.11 All taxable income Gasoline is subject the sales tax and a petroleum tax of $ New York City levies another $1.50 per pack tax. New York City levies another $0.12 per gallon tax. IV. Real Property Tax Relief Programs (2005) Homestead Exemption or Credit Requirements Benefits Homeowners age 65 or older whose household income is $64,650 or less... $50,000 exemption off the full value of their primary residence for school property taxes* Sources: AARP 2005 telephone survey of state legislative staff, state departments of revenue, state controllers offices, state assessors offices, and state treasury offices. 248
253 New York All other homeowners... $30,000 exemption off the full value of their primary residence for school property taxes* *These average exemption amounts increase in counties where median home prices exceed the state average but are not reduced if median home prices are below the state average. New York City homeowners are also eligible receive a tax credit off their local personal income taxes based on their school property taxes. Qualifying veterans... Local option exemption of 15% of assessed value (up a maximum of $12,000 if they served during wartime) plus an additional exemption of 10% of assessed value (up a maximum of $8,000 if they served in a combat zone). An additional exemption is available disabled veterans equal one-half of their service-related disability ratings. Exemptions apply all local property taxes except for school property taxes. Circuit Breaker Requirements Benefits Homeowners and renters (except public subsidized housing) whose income is $18,000 or less. In addition, the value of real properties cannot exceed $85, Up $375 for persons age 65 or older; $75 for others (tax credits for personal income taxes) Homeowners age 65 or older or disabled with income of $32,399 or less... Local option program with exemption ranging from 5% of the assessed value (income of $31,000 $32,399) 50% of assessed value (income of $24,000 or less) Deferral Program... None Sources: AARP 2005 telephone survey of state legislative staff, state departments of revenue, state controllers offices, state assessors offices, and state treasury offices. 249
254 New York V. Real Property Tax Limits, Caps, or Freezes (2005)* Counties % 2.0% of average full market value for five years* Cities and villages % of average full market value for five years (except New York City); 2.5% of average full market value for five years (New York City)* * These limits do not include bonded indebtedness or funding for special long-term purposes; nor do they apply wns, school districts, or special districts, except school districts in cities of 125,000 or more that have no separate taxing powers or limits but are subject tax limits for cities described above. For New York City and Nassau County, assessed property values for one, two, or three family residential property cannot increase more than 6% per year or 20% over a five-year period. For New York City, assessed property values cannot increase more than 8% annually or 30 % over a five-year period for property consisting of four ten residential units. The assessment limits do not apply additions or improvements made the property since the last assessment. Sources: AARP 2005 telephone survey of state legislative staff, state departments of revenue, state controllers offices, state assessors offices, and state treasury offices. 250
255 New York State and Local General Expenditures, FY 2002 General Expenditures Average Annual Expenditure Change Percent of Per Capita Personal Income (millions) NY US NY US NY US State/Local Direct General Expends... $161,740 $8,445 $6, % 19.9% 4.7% 5.9% To State/Local Government...$161,130 $8,414 $6, % 19.9% 4.7% 5.9% Education*... $47,723 $2,492 $2, % 6.8% 5.3% 6.2% Public Welfare... $32,503 $1,697 $ % 3.2% 4.5% 6.1% Health and Hospitals... $13,008 $679 $ % 1.7% 2.7% 5.2% Highways... $7,078 $370 $ % 1.3% 3.3% 5.5% Public Safety*... $14,557 $760 $ % 1.8% 4.8% 6.3% Environment... $7,073 $369 $ % 1.2% 3.1% 5.1% Interest on General Debt... $8,329 $435 $ % 0.9% 2.5% 3.1% Other... $30,858 $1,611 $ % 3.0% 6.1% 6.5% To Federal Government... $610 $32 $15 0.1% 0.1% 3.3% 1.9% *Education includes higher and lower education; public safety includes police, fire, corrections, and protection and inspection. Source: U.S. Bureau of the Census (2002 data are the most current available.) State and Local General Expenditures, FY 2002 (excluding payments federal government) 19% 31% Education Public Welfare Health and Hospitals 5% 4% Highways Public Safety Environment 9% 4% 8% 20% Interest on General Debt Other Total Debt Outstanding Long-term Debt Short-term Debt 2002 Debt Ratio Measures Per $1,000 Debt (billions) Per Capita of Personal Income Debt (billions) Percent of Total Debt (billions) Percent of Total New York (State and Local)... $195.3 $10,199 $ $ % $ % United States... $1,681.4 $5,839 $ $1, % $ % Source: U.S. Bureau of the Census 251
256 North Carolina Economic Indicars Average Annual Change NC US NC US NC US Per Capita Income... $20,400 $22,172 $29,303 $33, % 4.1% Median Household Income... $30,114 $32,264 $40,365 $44, % 3.2% Gross State Product (in millions)... $179,574 $6,865,513 $336,398 $11,665, % 5.4% Full- and Part-Time Positions (in thousands) 4, ,224 4, , % 1.6% Employed Persons (in thousands).. 3, ,060 4, , % 1.2% Unemployment Rate % 6.1% 5.5% 5.5% n/a n/a Sources: U.S. Bureau of the Census, U.S. Bureau of Economic Analysis, and the U.S. Bureau of Labor Statistics 2004 Population Under Age 18 6% 4% Males 26% 7% 7% Females 24% Ages Ages Ages 75 and Over 64% 62% Population Poverty Rate Population and Poverty Percentage Change NC NC NC US NC US Total Population... 7,060,959 8,541, % 12.8% 15.2% 13.1% Males... 3,424,044 4,198, % 13.8% 13.0% 11.6% Under Age ,339 1,082, % 7.8% 21.4% 18.3% Ages ,174,438 2,694, % 16.7% 10.6% 9.6% Ages , , % 1.6% 6.1% 6.5% Ages 75 and Over , , % 28.8% 6.3% 6.8% Females... 3,636,915 4,342, % 11.9% 17.4% 14.5% Under Age ,083 1,035, % 8.1% 22.4% 18.6% Ages ,238,485 2,695, % 14.6% 15.8% 13.6% Ages , , % -3.6% 11.1% 9.7% Ages 75 and Over , , % 19.6% 20.2% 13.3% Source: U.S. Bureau of the Census 252
257 North Carolina Percent Distribution of Households by Age of Householder and Income, 2004 Less than $10,000 $10,000 $14,999 $15,000 $24,999 $25,000 $34,999 $35,000 $49,999 $50,000 $74,999 $75,000 $99,999 $100,000 or more All Households Age of Householder Under 25 years % 11.1% 21.9% 14.7% 18.2% 6.6% 1.7% 0.9% 100.0% years % 5.6% 13.1% 12.0% 18.1% 21.4% 11.1% 10.9% 100.0% years % 5.3% 10.7% 11.3% 15.4% 20.8% 12.0% 15.7% 100.0% 65 years and over % 13.3% 20.7% 14.0% 14.2% 10.7% 5.5% 5.5% 100.0% North Carolina (all ages) % 7.3% 14.3% 12.3% 16.4% 18.2% 9.8% 10.9% 100.0% United States (all ages) % 6.3% 12.3% 12.0% 15.5% 19.0% 11.1% 15.0% 100.0% Source: U.S. Bureau of the Census Percent of Households by Household Income Bracket, 2004 Percent of Households 20.0% 18.0% 16.0% 14.0% 12.0% 10.0% 8.0% 6.0% 4.0% 2.0% 0.0% Less than $10,000 $10,000 $14,999 $15,000 $24,999 $25,000 $34,999 $35,000 $49,999 $50,000 $74,999 $75,000 $99,999 $100,000 or more North Carolina United States 253
258 State and Local General Revenues, FY 2002 North Carolina Average Annual Revenue Change General Revenues Per Capita Percent of Personal Income (millions) NC US NC US NC US Total General Revenues... $44,165 $5,313 $5, % 19.3% 7.2% 5.6% Own Sources... $33,924 $4,081 $4, % 15.2% 6.6% 5.2% Taxes... $22,576 $2,716 $3, % 10.4% 5.9% 4.9% Property Taxes... $5,422 $652 $ % 3.2% 6.8% 4.5% General Sales Taxes... $4,909 $591 $ % 2.6% 5.0% 5.4% Personal Income Taxes. $7,265 $874 $ % 2.3% 7.3% 5.8% Other Taxes... $4,980 $599 $ % 2.3% 4.2% 4.3% Charges/Miscellaneous... $11,348 $1,365 $1, % 4.8% 8.1% 5.7% Federal Aid... $10,241 $1,232 $1, % 4.1% 9.5% 7.2% Source: U.S. Bureau of the Census (2002 data are the most current available.) 1992 General Revenue 2002 General Revenue Property Taxes General Sales Taxes Personal Income Taxes Other Taxes 19% 13% 14% 23% 12% 11% Charges/Misc Federal Aid 23% 16% 27% 16% 15% 11% 254
259 North Carolina I. Personal Income Tax (2004) State Income Tax Base North Carolina s income tax base is linked federal taxable income. Filing Requirements Taxpayers must file if their federal gross income exceeds the minimum filing thresholds. Minimum Filing Income Thresholds Under age $5,500 (single); $11,000 (married, filing jointly; both spouses are under age 65) Age 65 or older... $6,250 (single); $12,200 (married, filing jointly; both spouses are age 65 or older) Rate Structure Single Married, Filing Jointly Taxable Income Rate Taxable Income Rate First $12, % First $21, % $12,750 - $60, % $21,250 - $100, % $60,000 - $120, % $100,000 - $200, % Over $120, % Over $200, % Public Pension Exemption* North Carolina state and local retirees and federal retirees who worked for five years or more as of August 12, 1989, receive a full pension exemption off their defined benefit plan. This benefit also applies the state s 401K and 457 plans if the retiree contributed the plan prior August 12, Other government retirees receive up a $4,000 exemption per taxpayer. Private Pension Exemption*... $2,000 exemption per taxpayer *Total private and public exemptions may not exceed $4,000 per taxpayer for those retirees who did not qualify for the full public pension exemption. Social Security Benefits... Full exemption Sources: AARP 2005 telephone survey of state legislative staff, state departments of revenue, state controllers offices, state assessors offices, and state treasury offices. 255
260 North Carolina Standard Deductions and Personal Exemptions Combined Under age $5,500 (single); $10,000 (married, filing jointly)* Age 65 or older... $6,250 (single); $11,200 (married, filing jointly; both spouses are age 65 or older)* *Personal exemptions for these figures are for taxpayers whose federal adjusted gross income is less than $60,000 (single) or $100,000 (married, filing jointly). Personal exemptions are less for taxpayers with higher incomes. Local Income Taxes... None II. General Sales Tax Rates (2004) State %* Combined state/local tax rates % 7.0%** *The state tax rate will change 4.0% on July 1, **Only Mecklenburg County has a combined rate of 7.0%; the other counties have a combined rate of 6.5%. III. Miscellaneous Tax Rates (2004) Corporate income (highest marginal rate) % On all taxable income Gasoline (per gallon)... $0.271 (starting July 1, 2005) Cigarette (per pack of 20)... $0.05* Beer (per gallon)... $0.532 *The cigarette tax rate will be $0.30 per pack (September 1, 2005) and $0.35 per pack (July 1, 2006). IV. Real Property Tax Relief Programs (2005) Homestead Exemption or Credit Requirements Benefits Homeowners age 65 or older or disabled with disposable income below $18, Exempt on the first $20,000 of assessed value or 50% of the assessed value (whichever is greater) Disabled veterans... $38,000 assessed value Circuit Breaker... None Deferral Program... None Sources: AARP 2005 telephone survey of state legislative staff, state departments of revenue, state controllers offices, state assessors offices, and state treasury offices. 256
261 North Carolina V. Real Property Tax Limits, Caps, or Freezes (2005) Counties or cities are subject a property tax rate cap of $1.50 per $100 of appraised real property value. However, with voter approval, counties and cities may levy a higher property tax rate. Sources: AARP 2005 telephone survey of state legislative staff, state departments of revenue, state controllers offices, state assessors offices, and state treasury offices. 257
262 State and Local General Expenditures, FY 2002 General Expenditures North Carolina Average Annual Expenditure Change Percent of Per Capita Personal Income (millions) NC US NC US NC US State/Local Direct General Expends... $44,540 $5,359 $6, % 19.9% 7.5% 5.9% To State/Local Government... $44,540 $5,359 $6, % 19.9% 7.5% 5.9% Education*... $15,262 $1,836 $2, % 6.8% 6.3% 6.2% Public Welfare... $7,657 $921 $ % 3.2% 9.6% 6.1% Health and Hospitals... $6,087 $732 $ % 1.7% 8.5% 5.2% Highways... $3,017 $363 $ % 1.3% 6.6% 5.5% Public Safety*... $3,457 $416 $ % 1.8% 7.0% 6.3% Environment... $2,563 $308 $ % 1.2% 7.7% 5.1% Interest on General Debt... $1,343 $162 $ % 0.9% 6.3% 3.1% Other... $5,154 $620 $ % 3.0% 8.1% 6.5% To Federal Government... $0 $0 $15 0.0% 0.1% 0.0% 1.9% *Education includes higher and lower education; public safety includes police, fire, corrections, and protection and inspection. Source: U.S. Bureau of the Census (2002 data are the most current available.) State and Local General Expenditures, FY 2002 (excluding payments federal government) 3% 6% 12% 33% Education Public Welfare Health and Hospitals Highways 8% Public Safety Environment 7% Interest on General Debt Other 14% 17% Total Debt Outstanding Long-term Debt Short-term Debt 2002 Debt Ratio Measures Per $1,000 Debt (billions) Per Capita of Personal Income Debt (billions) Percent of Total Debt (billions) Percent of Total North Carolina (State and Local)... $33.5 $4,026 $ $ % $ % United States... $1,681.4 $5,839 $ $1, % $ % Source: U.S. Bureau of the Census 258
263 THIS PAGE INTENTIONALLY LEFT BLANK 259
264 North Dakota Economic Indicars Average Annual Change ND US ND US ND US Per Capita Income... $19,006 $22,172 $29,247 $33, % 4.1% Median Household Income... $28,278 $32,264 $39,261 $44, % 3.2% Gross State Product (in millions)... $14,036 $6,865,513 $22,687 $11,665, % 5.4% Full- and Part-Time Positions (in thousands) , , % 1.6% Employed Persons (in thousands) , , % 1.2% Unemployment Rate % 6.1% 3.4% 5.5% n/a n/a Sources: U.S. Bureau of the Census, U.S. Bureau of Economic Analysis, and the U.S. Bureau of Labor Statistics 2004 Population Under Age 18 Ages % 6% Males 23% 7% 10% Females 21% Ages Ages 75 and Over 65% 62% Population Poverty Rate Population and Poverty Percentage Change ND ND ND US ND US Total Population , , % 12.8% 12.1% 13.1% Males , , % 13.8% 10.4% 11.6% Under Age ,656 71, % 7.8% 16.0% 18.3% Ages , , % 16.7% 9.3% 9.6% Ages ,860 19, % 1.6% 4.8% 6.5% Ages 75 and Over... 17,647 19, % 28.8% 6.6% 6.8% Females , , % 11.9% 13.7% 14.5% Under Age ,963 67, % 8.1% 15.0% 18.6% Ages , , % 14.6% 13.0% 13.6% Ages ,882 23, % -3.6% 9.0% 9.7% Ages 75 and Over... 28,910 30, % 19.6% 20.1% 13.3% Source: U.S. Bureau of the Census 260
265 North Dakota Percent Distribution of Households by Age of Householder and Income, 2004 Less than $10,000 $10,000 $14,999 $15,000 $24,999 $25,000 $34,999 $35,000 $49,999 $50,000 $74,999 $75,000 $99,999 $100,000 or more All Households Age of Householder Under 25 years % 11.8% 20.3% 16.1% 14.8% 5.8% 3.0% 1.4% 100.0% years % 4.7% 13.9% 12.2% 19.0% 27.1% 10.3% 6.6% 100.0% years % 4.4% 10.5% 11.0% 16.9% 25.1% 13.8% 12.6% 100.0% 65 years and over % 14.1% 20.8% 15.9% 15.9% 10.9% 3.3% 3.6% 100.0% North Dakota (all ages).. 9.8% 7.3% 14.8% 12.9% 17.2% 21.0% 9.4% 7.6% 100.0% United States (all ages). 8.9% 6.3% 12.3% 12.0% 15.5% 19.0% 11.1% 15.0% 100.0% Source: U.S. Bureau of the Census Percent of Households by Household Income Bracket, 2004 Percent of Households 25.0% 20.0% 15.0% 10.0% 5.0% 0.0% Less than $10,000 $10,000 $14,999 $15,000 $24,999 $25,000 $34,999 $35,000 $49,999 $50,000 $74,999 $75,000 $99,999 $100,000 or more North Dakota United States 261
266 State and Local General Revenues, FY 2002 North Dakota Average Annual Revenue Change General Revenues Per Capita Percent of Personal Income (millions) ND US ND US ND US Total General Revenues... $3,994 $6,302 $5, % 19.3% 5.2% 5.6% Own Sources... $2,838 $4,478 $4, % 15.2% 4.6% 5.2% Taxes... $1,729 $2,728 $3, % 10.4% 5.0% 4.9% Property Taxes... $532 $840 $ % 3.2% 4.5% 4.5% General Sales Taxes... $395 $622 $ % 2.6% 4.7% 5.4% Personal Income Taxes. $200 $315 $ % 2.3% 5.3% 5.8% Other Taxes... $602 $950 $ % 2.3% 5.6% 4.3% Charges/Miscellaneous... $1,109 $1,750 $1, % 4.8% 4.0% 5.7% Federal Aid... $1,156 $1,824 $1, % 4.1% 6.7% 7.2% Source: U.S. Bureau of the Census (2002 data are the most current available.) 1992 General Revenue 2002 General Revenue Property Taxes General Sales Taxes Personal Income Taxes Other Taxes 25% 14% 10% 5% 29% 13% 10% 5% Charges/Misc Federal Aid 32% 14% 28% 15% 262
267 North Dakota I. Personal Income Tax (2004) State Income Tax Base North Dakota s income tax base is linked federal taxable income. Filing Requirements Taxpayers must file if they are required file a federal return. Rate Structure (Form ND-1)* Single Married, Filing Jointly Taxable Income Rate Taxable Income Rate First $29, % First $48, % $29,051 - $70, % $48,501 - $117, % $70,351 - $146, % $117,251 - $178, % $146,751 - $319, % $178,651 - $319, % Over $319, % Over $319, % Rate Structure (Form ND-2)* All Taxpayers Taxable Income Rate Taxable Income Rate First $3, % $15,001 - $25, % $3,001 - $5, % $25,001 - $35, % $5,001 - $8, % $35,001 - $50, % $8,001 - $15, % Over $50, % *In most cases, tax liability is less with Form ND-2 because of lower marginal tax rates. Public Pension Exemption** Federal/military... $5,000 exemption less Social Security benefits received for persons age 50 or older State/local... $5,000 exemption less Social Security benefits received for public safety persons Private Pension Exemption... None **Only taxpayers who fill out the long form can deduct pension income. Sources: AARP 2005 telephone survey of state legislative staff, state departments of revenue, state controllers offices, state assessors offices, and state treasury offices. 263
268 North Dakota Social Security Benefits Only taxpayers whose provisional income* is $25,000 or higher (single) or $32,000 or higher (married, filing jointly) are subject taxation of their Social Security benefits. *Provisional income consists of federal adjusted gross income, tax-exempt interest, certain foreign-source income, and one-half of the taxpayer s Social Security or Railroad Retirement Tier 1 benefit (U.S. House Committee on the Budget, Omnibus Budget Reconciliation Act of 1993, 103 rd Congress, 1 st sess., 1993, Conference Report , p. 594). Standard Deductions and Personal Exemptions Combined* Under age 65*... $7,950 (single); $15,900 (married, filing jointly; both spouses are under age 65) Age 65 or older*... $9,150 (single); $17,800 (married, filing jointly; both spouses are age 65 or older) *Personal exemptions equal $3,100 per exemption (single have one exemption and married couples have two). Taxpayers with federal adjusted gross income greater than $142,700 (single) or $214,050 (married, filing jointly) receive lower personal exemption amounts. Medical Expenses Deduction... Taxpayers can deduct medical expenses not allowed as a federal itemized deduction on tax Form ND-2. Long-Term Insurance Premiums Credit... Taxpayers can claim a tax credit equal 25% of long-term care insurance premiums or $100 times the number of qualifying persons covered by the policy (whichever is less). Other Deductions... Full federal income tax deduction for taxpayers who fill out Form ND-2. Local Income Taxes... None II. General Sales Tax Rates (2004) State % Combined state/local tax rates % 7.0% Sources: AARP 2005 telephone survey of state legislative staff, state departments of revenue, state controllers offices, state assessors offices, and state treasury offices. 264
269 North Dakota III. Miscellaneous Tax Rates (2004) Corporate income (highest marginal rate) % On income over $30,000 Gasoline (per gallon)... $0.21 Cigarette (per pack of 20)... $0.44 Beer (per gallon)... $0.16 in bottles/cans and $0.08 per gallon sold in bulk containers IV. Real Property Tax Relief Programs (2005) Homestead Exemption or Credit... None Circuit Breaker Requirements Benefits Homeowners and renters age 65 or older or permanently disabled whose income is $14,000 or less. In addition, for homeowners, assets may not exceed $50,000 (excluding the first $80,000 of the homestead s market value).... Homeowners $2,000 in taxable value; renters $240 tax refund Deferral Program Requirements Benefits Homeowners age 65 or older whose income is $14,000 or less. In addition, assets may not exceed $50,000 (excluding the first $80,000 of the homestead s market value).... Defer up $6,000 of special assessments V. Real Property Tax Limits, Caps, or Freezes (2005) Real Property Tax Rate Limits Counties... $2.30 per $100 of taxable value Municipalities... $3.80 or $4.00 per $100 of taxable value School Districts... $18.50 per $100 of taxable value The above limits apply the general fund levy; they do not apply various special fund levies, such as debt service and emergency levies. Local taxing districts cannot collect more than the highest amount of property taxes collected for the previous three years. This limitation does not apply property improvements and additions, capital improvements, or bonded indebtedness. In addition, voters can approve higher property tax collections. Because of this limitation, many local governments can set their property tax rates higher than the above property tax rate limits. Sources: AARP 2005 telephone survey of state legislative staff, state departments of revenue, state controllers offices, state assessors offices, and state treasury offices. 265
270 State and Local General Expenditures, FY 2002 General Expenditures North Dakota Average Annual Expenditure Change Percent of Per Capita Personal Income (millions) ND US ND US ND US State/Local Direct General Expends... $3,886 $6,132 $6, % 19.9% 4.5% 5.9% To State/Local Government... $3,886 $6,132 $6, % 19.9% 4.5% 5.9% Education*... $1,311 $2,069 $2, % 6.8% 3.6% 6.2% Public Welfare... $664 $1,047 $ % 3.2% 6.1% 6.1% Health and Hospitals... $104 $164 $ % 1.7% 1.9% 5.2% Highways... $461 $727 $ % 1.3% 4.9% 5.5% Public Safety*... $193 $304 $ % 1.8% 6.0% 6.3% Environment... $300 $473 $ % 1.2% 4.3% 5.1% Interest on General Debt... $150 $237 $ % 0.9% 1.0% 3.1% Other... $704 $1,112 $ % 3.0% 6.0% 6.5% To Federal Government... $0 $0 $15 0.0% 0.1% 0.0% 1.9% *Education includes higher and lower education; public safety includes police, fire, corrections, and protection and inspection. Source: U.S. Bureau of the Census (2002 data are the most current available.) State and Local General Expenditures, FY 2002 (excluding payments federal government) 18% Education Public Welfare 33% Health and Hospitals 4% Highways 8% Public Safety Environment 5% Interest on General Debt 12% 3% 17% Other Total Debt Outstanding Long-term Debt Short-term Debt 2002 Debt Ratio Measures Per $1,000 Debt (billions) Per Capita of Personal Income Debt (billions) Percent of Total Debt (billions) Percent of Total North Dakota (State and Local)... $2.9 $4,583 $ $ % $ % United States... $1,681.4 $5,839 $ $1, % $ % Source: U.S. Bureau of the Census 266
271 THIS PAGE INTENTIONALLY LEFT BLANK 267
272 Ohio Economic Indicars Average Annual Change OH US OH US OH US Per Capita Income... $21,712 $22,172 $31,135 $33, % 4.1% Median Household Income... $31,855 $32,264 $42,954 $44, % 3.2% Gross State Product (in millions)... $278,508 $6,865,513 $419,866 $11,665, % 5.4% Full- and Part-Time Positions (in thousands) 6, ,224 6, , % 1.6% Employed Persons (in thousands).. 5, ,060 5, , % 1.2% Unemployment Rate % 6.1% 6.1% 5.5% n/a n/a Sources: U.S. Bureau of the Census, U.S. Bureau of Economic Analysis, and the U.S. Bureau of Labor Statistics 2004 Population Under Age 18 6% 5% Males 25% 7% 8% Females 23% Ages Ages Ages 75 and Over 64% 62% Population Poverty Rate Population and Poverty Percentage Change OH OH OH US OH US Total Population...11,111,451 11,459, % 12.8% 12.5% 13.1% Males... 5,362,870 5,580, % 13.8% 10.9% 11.6% Under Age ,459,937 1,420, % 7.8% 17.9% 18.3% Ages ,309,437 3,538, % 16.7% 9.0% 9.6% Ages , , % 1.6% 4.9% 6.5% Ages 75 and Over , , % 28.8% 5.6% 6.8% Females... 5,748,581 5,878, % 11.9% 14.0% 14.5% Under Age ,388,801 1,359, % 8.1% 18.7% 18.6% Ages ,469,480 3,616, % 14.6% 13.3% 13.6% Ages , , % -3.6% 6.8% 9.7% Ages 75 and Over , , % 19.6% 11.8% 13.3% Source: U.S. Bureau of the Census 268
273 Ohio Percent Distribution of Households by Age of Householder and Income, 2004 Less than $10,000 $10,000 $14,999 $15,000 $24,999 $25,000 $34,999 $35,000 $49,999 $50,000 $74,999 $75,000 $99,999 $100,000 or more All Households Age of Householder Under 25 years % 8.5% 19.7% 17.8% 12.7% 12.6% 2.2% 0.5% 100.0% years % 4.2% 10.2% 12.3% 18.1% 23.8% 12.7% 10.8% 100.0% years % 4.2% 8.7% 10.4% 14.9% 23.0% 13.5% 17.7% 100.0% 65 years and over % 12.5% 24.5% 17.3% 15.8% 11.4% 4.4% 4.1% 100.0% Ohio (all ages) % 6.2% 13.2% 12.9% 16.1% 20.2% 10.7% 11.4% 100.0% United States (all ages). 8.9% 6.3% 12.3% 12.0% 15.5% 19.0% 11.1% 15.0% 100.0% Source: U.S. Bureau of the Census Percent of Households by Household Income Bracket, 2004 Percent of Households 25.0% 20.0% 15.0% 10.0% 5.0% 0.0% Less than $10,000 $10,000 $14,999 $15,000 $24,999 $25,000 $34,999 $35,000 $49,999 $50,000 $74,999 $75,000 $99,999 $100,000 or more Ohio United States 269
274 State and Local General Revenues, FY 2002 Ohio Average Annual Revenue Change General Revenues Per Capita Percent of Personal Income (millions) OH US OH US OH US Total General Revenues... $65,568 $5,746 $5, % 19.3% 5.7% 5.6% Own Sources... $51,704 $4,531 $4, % 15.2% 5.4% 5.2% Taxes... $36,165 $3,169 $3, % 10.4% 5.3% 4.9% Property Taxes... $10,643 $933 $ % 3.2% 5.2% 4.5% General Sales Taxes... $7,687 $674 $ % 2.6% 5.8% 5.4% Personal Income Taxes. $11,794 $1,034 $ % 2.3% 6.2% 5.8% Other Taxes... $6,042 $529 $ % 2.3% 3.4% 4.3% Charges/Miscellaneous... $15,539 $1,362 $1, % 4.8% 5.5% 5.7% Federal Aid... $13,863 $1,215 $1, % 4.1% 6.8% 7.2% Source: U.S. Bureau of the Census (2002 data are the most current available.) 1992 General Revenue 2002 General Revenue Property Taxes General Sales Taxes Personal Income Taxes Other Taxes 19% 17% 12% 21% 16% 12% Charges/Misc 24% 24% Federal Aid 17% 18% 11% 9% 270
275 Ohio I. Personal Income Tax (2004) State Income Tax Base Ohio s income tax base is linked federal adjusted gross income. Filing Requirements Taxpayers must file if their federal adjusted gross income equals or exceeds the following: Under age $4,200 (single); $7,900 (married, filing jointly; both spouses are under age 65) Age 65 or older... $8,600 (single); $11,250 (married, filing jointly; both spouses are age 65 or older) Rate Structure All Taxpayers Taxable Income Rate Taxable Income Rate First $5, % $40,000 - $80, % $5,000 - $10, % $80,000 - $100, % $10,000 - $15, % $100,000 - $200, % $15,000 - $20, % Over $200, % $20,000 - $40, % Retirement Income Tax Credit Tax credits are available up $200 for $8,000 or more of retirement income. Personal Exemptions All ages... $1,300 (single); $2,600 (married, filing jointly) Personal Exemption Tax Credits All ages... $20 (single); $40 (married, filing jointly) Senior Citizen Tax Credit... $50 (single and married, filing jointly) for taxpayers age 65 or older Social Security Benefits... Full exemption Sources: AARP 2005 telephone survey of state legislative staff, state departments of revenue, state controllers offices, state assessors offices, and state treasury offices. 271
276 Ohio Medical Savings Account (MSA) Deduction Taxpayers can deduct up $3,643 (per taxpayer or spouse) in contributions as long as the contributions were not already deducted on the federal return. Interest earned in the account is also deductible as long as it is part of federal adjusted gross income. Long-Term Care Insurance Deduction Taxpayers can deduct unsubsidized premiums as long as they were not already claimed as deductions on the federal return for calculating federal adjusted gross income. Health Insurance Deduction Taxpayers can deduct unsubsidized premiums as long as they were not already claimed as deductions on the federal return for calculating federal adjusted gross income. Medical and Dental Expense Deduction Taxpayers can deduct medical and dental expenses (excluding unreimbursed health insurance and long-term care insurance premiums) that exceed 7.5% of their federal adjusted gross income. This is not an itemized deduction. Local Income Taxes... Ranges from 0.25% 2.85% on earned income II. General Sales Tax Rates (2004) State % Combined state/local tax rates % 9.0% III. Miscellaneous Tax Rates (2004) Corporate income (highest marginal rate) %* Gasoline (per gallon)... $0.24 Cigarette (per pack of 20)... $0.55 Beer (per gallon)... $0.18; $0.14/oz. for bottles/cans with 12 oz. or less *8.5% on net income in excess of $50,000 or four mills times the value of sck, whichever is greater Sources: AARP 2005 telephone survey of state legislative staff, state departments of revenue, state controllers offices, state assessors offices, and state treasury offices. 272
277 Ohio IV. Real Property Tax Relief Programs (2005) Homestead Exemption or Credit Requirements Benefits All homeowners % of property taxes Circuit Breaker Requirements Benefits Homeowners age 65 or older or disabled whose income is $25,400 or less... Up a $5,400 reduction in the taxable/assessed value of a homestead Deferral Program... None V. Real Property Tax Limits, Caps, or Freezes (2005) Real Property Tax Rate Limits Total local real property tax rates for all taxing units cannot exceed 1% of the property s true market value without voter approval. Most local jurisdictions levy tax rates beyond this constitutional limit. Real Property Revenue Limits Local taxing districts cannot collect higher property tax revenues because of higher aggregate property tax reassessments for the entire individual tax district. This does not apply property additions and improvements or bonded indebtedness and only applies revenues collected from property tax rates exceeding 1%. Sources: AARP 2005 telephone survey of state legislative staff, state departments of revenue, state controllers offices, state assessors offices, and state treasury offices. 273
278 State and Local General Expenditures, FY 2002 General Expenditures Ohio Average Annual Expenditure Change Percent of Personal Per Capita Income (millions) OH US OH US OH US State/Local Direct General Expends... $67,050 $5,876 $6, % 19.9% 5.9% 5.9% To State/Local Government... $67,047 $5,876 $6, % 19.9% 5.9% 5.9% Education*... $23,623 $2,070 $2, % 6.8% 5.8% 6.2% Public Welfare... $12,278 $1,076 $ % 3.2% 5.8% 6.1% Health and Hospitals... $5,454 $478 $ % 1.7% 5.5% 5.2% Highways... $4,092 $359 $ % 1.3% 4.2% 5.5% Public Safety*... $5,710 $500 $ % 1.8% 6.3% 6.3% Environment... $3,513 $308 $ % 1.2% 5.2% 5.1% Interest on General Debt... $2,695 $236 $ % 0.9% 4.8% 3.1% Other... $9,682 $849 $ % 3.0% 7.6% 6.5% To Federal Government... $3 $0 $15 0.0% 0.1% 4.2% 1.9% *Education includes higher and lower education; public safety includes police, fire, corrections, and protection and inspection. Source: U.S. Bureau of the Census State and Local General Expenditures, FY 2002 (excluding payments federal government) 4% 5% 9% 6% 14% 8% 18% 36% Education Public Welfare Health and Hospitals Highways Public Safety Environment Interest on General Debt Other Total Debt Outstanding Long-term Debt Short-term Debt 2002 Debt Ratio Measures Per $1,000 Debt (billions) Per Capita of Personal Income Debt (billions) Percent of Total Debt (billions) Percent of Total Ohio (State and Local)... $51.3 $4,500 $ $ % $ % United States... $1,681.4 $5,839 $ $1, % $ % Source: U.S. Bureau of the Census 274
279 THIS PAGE INTENTIONALLY LEFT BLANK 275
280 Oklahoma Economic Indicars Average Annual Change OK US OK US OK US Per Capita Income... $18,374 $22,172 $27,819 $33, % 4.1% Median Household Income... $26,991 $32,264 $39,681 $44, % 3.2% Gross State Product (in millions)... $67,137 $6,865,513 $107,600 $11,665, % 5.4% Full- and Part-Time Positions (in thousands) 1, ,224 2, , % 1.6% Employed Persons (in thousands).. 1, ,060 1, , % 1.2% Unemployment Rate % 6.1% 4.8% 5.5% n/a n/a Sources: U.S. Bureau of the Census, U.S. Bureau of Economic Analysis, and the U.S. Bureau of Labor Statistics 2004 Population Under Age 18 7% 5% Males 25% 8% 7% Females 23% Ages Ages Ages 75 and Over 63% 62% Population Poverty Rate Population and Poverty Percentage Change OK OK OK US OK US Total Population... 3,246,119 3,523, % 12.8% 15.3% 13.1% Males... 1,583,084 1,740, % 13.8% 13.8% 11.6% Under Age , , % 7.8% 21.8% 18.3% Ages ,699 1,102, % 16.7% 11.8% 9.6% Ages , , % 1.6% 7.1% 6.5% Ages 75 and Over... 70,316 82, % 28.8% 4.7% 6.8% Females... 1,663,035 1,783, % 11.9% 16.8% 14.5% Under Age , , % 8.1% 19.5% 18.6% Ages ,943 1,096, % 14.6% 17.1% 13.6% Ages , , % -3.6% 12.0% 9.7% Ages 75 and Over , , % 19.6% 10.7% 13.3% Source: U.S. Bureau of the Census 276
281 Oklahoma Percent Distribution of Households by Age of Householder and Income, 2004 Less than $10,000 $10,000 $14,999 $15,000 $24,999 $25,000 $34,999 $35,000 $49,999 $50,000 $74,999 $75,000 $99,999 $100,000 or more All Households Age of Householder Under 25 years % 11.5% 22.8% 13.2% 17.1% 9.4% 1.0% 0.6% 100.0% years % 4.8% 12.3% 16.0% 16.8% 21.2% 9.7% 7.8% 100.0% years % 6.2% 11.0% 13.4% 16.4% 17.7% 12.0% 13.8% 100.0% 65 years and over % 15.7% 22.8% 15.6% 12.9% 11.4% 4.8% 4.7% 100.0% Oklahoma (all ages) % 8.1% 14.8% 14.8% 15.9% 17.0% 8.9% 8.8% 100.0% United States (all ages). 8.9% 6.3% 12.3% 12.0% 15.5% 19.0% 11.1% 15.0% 100.0% Source: U.S. Bureau of the Census Percent of Households by Household Income Bracket, 2004 Percent of Households 20.0% 18.0% 16.0% 14.0% 12.0% 10.0% 8.0% 6.0% 4.0% 2.0% 0.0% Less than $10,000 $10,000 $14,999 $15,000 $24,999 $25,000 $34,999 $35,000 $49,999 $50,000 $74,999 $75,000 $99,999 $100,000 or more Oklahoma United States 277
282 State and Local General Revenues, FY 2002 Oklahoma Average Annual Revenue Change General Revenues Per Capita Percent of Personal Income (millions) OK US OK US OK US Total General Revenues... $18,061 $5,178 $5, % 19.3% 6.2% 5.6% Own Sources... $13,648 $3,913 $4, % 15.2% 5.5% 5.2% Taxes... $8,782 $2,518 $3, % 10.4% 5.3% 4.9% Property Taxes... $1,482 $425 $ % 3.2% 6.7% 4.5% General Sales Taxes... $2,600 $745 $ % 2.6% 5.3% 5.4% Personal Income Taxes. $2,286 $655 $ % 2.3% 6.5% 5.8% Other Taxes... $2,413 $692 $ % 2.3% 3.7% 4.3% Charges/Miscellaneous... $4,866 $1,395 $1, % 4.8% 5.7% 5.7% Federal Aid... $4,413 $1,265 $1, % 4.1% 8.8% 7.2% Source: U.S. Bureau of the Census (2002 data are the most current available.) 1992 General Revenue 2002 General Revenue Property Taxes General Sales Taxes Personal Income Taxes Other Taxes 19% 8% 16% 24% 8% 14% Charges/Misc 28% 12% 13% Federal Aid 17% 28% 13% 278
283 Oklahoma I. Personal Income Tax (2004) State Income Tax Base Oklahoma s income tax base is linked federal adjusted gross income. Filing Requirements Taxpayers who have sufficient gross income for filing a federal return must file. In addition, taxpayers who have any withholding or make Oklahoma estimated tax payments must file. Rate Structure Single Method One* Married, Filing Jointly Taxable Income Rate Taxable Income Rate First $1, % First $2, % $1,000 - $2, % $2,000 - $5, % $2,500 - $3, % $5,000 - $7, % $3,750 - $4, % $7,500 - $9, % $4,900 - $6, % $9,800 - $12, % $6,200 - $7, % $12,200 - $15, % $7,700 - $10, % $15,000 - $21, % Over $10, %* Over $21, %* Rate Structure Single Method Two* Married, Filing Jointly Taxable Income Rate Taxable Income Rate First $1, % First $2, % $1,000 - $2, % $2,000 - $5, % $2,500 - $3, % $5,000 - $7, % $3,750 - $4, % $7,500 - $8, % $4,900 - $6, % $8,900 - $10, % $6,100 - $7, % $10,400 - $12, % $7,500 - $9, % $12,000 - $13, % $9,000 - $10, % $13,250 - $15, % $10,500 - $12, % $15,000 - $18, % $12,500 - $16, % $18,000 - $24, % $16,000 and over 10.0% $24,000 and over 10.0% *Taxpayers have the choice of using method one or method two calculate their income taxes. With method two, taxpayers can deduct their federal taxes from their taxable income; with method one, taxpayers cannot deduct their federal taxes from their taxable income but face lower marginal tax rates than with method two. Sources: AARP 2005 telephone survey of state legislative staff, state departments of revenue, state controllers offices, state assessors offices, and state treasury offices. 279
284 Oklahoma Public Pension Exemption*... $5,500 exemption Private Pension Exemption*... $5,500 exemption for taxpayers age 65 or older and whose adjusted gross income is $25,000 or less (single) or $50,000 or less (married, filing jointly). *Total public and private exemptions cannot exceed $5,500 per person. Social Security Benefits... Full exemption Standard Deductions and Personal Exemptions Combined Under age 65*... $2,000 $3,000 (single); $3,000 $4,000 (married, filing jointly) Age 65 or older*... $2,000 $4,000 (single); $3,000 $6,000 (married, filing jointly, where both spouses are age 65 or older) Medical Savings Accounts (MSA) Deduction Taxpayers can deduct contributions made and interest earned from an Oklahoma MSA. Taxpayers cannot deduct those contributions if they were already deducted on their federal return. Other Deductions... Full federal income tax deduction using method two (see above) Local Income Taxes... None II. General Sales Tax Rates (2004) State % Combined state/local tax rates % 10.75% III. Miscellaneous Tax Rates (2004) Corporate income (highest marginal rate) % Gasoline (per gallon)... $0.16 All taxable income Another $0.01 per gallon tax is imposed on gas sold by a distribur. Cigarette (per pack of 20)... $0.23 Beer (per gallon)... $0.403 Over 3.2% alcohol $0.36 Other alcohol beer beverages Sources: AARP 2005 telephone survey of state legislative staff, state departments of revenue, state controllers offices, state assessors offices, and state treasury offices. 280
285 Oklahoma IV. Real Property Tax Relief Programs (2005) Homestead Exemption or Credit* Requirements Benefits All homeowners... $1,000 assessed value or $2,000 if income is $20,000 or less *Effective January 1, 2006, some disabled veterans will not have pay property taxes. Circuit Breaker Requirements Benefits Homeowners age 65 or older or disabled, whose income is $12,000 or less... Up a $200 tax credit Deferral Program... None V. Real Property Tax Limits, Caps, or Freezes (2005) Real Property Valuation Cap The fair cash value of assessed real property cannot increase by more than 5% per year. Senior Citizen Valuation Freeze The fair cash value of assessed real property remains unchanged for homeowners once they reach age 65 if their household income is $25,000 or less.* *Effective January 1, 2005, the household income eligibility requirement will change from $25,000 the United States Department of Housing and Urban Development median income for the county. Property Tax Rate Limits Property tax rate limits for each local taxing unit can vary from % of the assessed property value (health department levy) 1.5% of the assessed property value (school district levy). Sources: AARP 2005 telephone survey of state legislative staff, state departments of revenue, state controllers offices, state assessors offices, and state treasury offices. 281
286 State and Local General Expenditures, FY 2002 General Expenditures Oklahoma Average Annual Expenditure Change Percent of Per Capita Personal Income (millions) OK US OK US OK US State/Local Direct General Expends... $18,196 $5,216 $6, % 19.9% 6.0% 5.9% To State/Local Government... $18,154 $5,205 $6, % 19.9% 6.1% 5.9% Education*... $6,904 $1,979 $2, % 6.8% 6.3% 6.2% Public Welfare... $3,192 $915 $ % 3.2% 7.8% 6.1% Health and Hospitals... $1,305 $374 $ % 1.7% 1.5% 5.2% Highways... $1,544 $443 $ % 1.3% 4.9% 5.5% Public Safety*... $1,504 $431 $ % 1.8% 7.7% 6.3% Environment... $922 $264 $ % 1.2% 5.9% 5.1% Interest on General Debt... $523 $150 $ % 0.9% 0.9% 3.1% Other... $2,261 $648 $ % 3.0% 8.0% 6.5% To Federal Government... $42 $12 $15 0.0% 0.1% 0.7% 1.9% *Education includes higher and lower education; public safety includes police, fire, corrections, and protection and inspection. Source: U.S. Bureau of the Census (2002 data are the most current available.) State and Local General Expenditures, FY 2002 (excluding payments federal government) 3% 5% 12% 38% Education Public Welfare Health and Hospitals Highways 8% Public Safety Environment 9% Interest on General Debt 7% 18% Other Total Debt Outstanding Long-term Debt Short-term Debt 2002 Debt Ratio Measures Per $1,000 Debt (billions) Per Capita of Personal Income Debt (billions) Percent of Total Debt (billions) Percent of Total Oklahoma (State and Local)... $12.5 $3,586 $ $ % $ % United States... $1,681.4 $5,839 $ $1, % $ % Source: U.S. Bureau of the Census 282
287 THIS PAGE INTENTIONALLY LEFT BLANK 283
288 Oregon Economic Indicars Average Annual Change OR US OR US OR US Per Capita Income... $21,060 $22,172 $30,584 $33, % 4.1% Median Household Income... $31,456 $32,264 $41,184 $44, % 3.2% Gross State Product (in millions)... $74,435 $6,865,513 $128,103 $11,665, % 5.4% Full- and Part-Time Positions (in thousands) 1, ,224 2, , % 1.6% Employed Persons (in thousands)... 1, ,060 1, , % 1.2% Unemployment Rate % 6.1% 7.4% 5.5% n/a n/a Sources: U.S. Bureau of the Census, U.S. Bureau of Economic Analysis, and the U.S. Bureau of Labor Statistics 2004 Population Under Age 18 6% 5% Males 24% 7% 8% Females 23% Ages Ages Ages 75 and Over 65% 62% Population Poverty Rate Population and Poverty Percentage Change OR OR OR US OR US Total Population... 3,087,142 3,594, % 12.8% 14.1% 13.1% Males... 1,521,465 1,786, % 13.8% 13.1% 11.6% Under Age , , % 7.8% 19.8% 18.3% Ages ,714 1,152, % 16.7% 12.1% 9.6% Ages , , % 1.6% 4.5% 6.5% Ages 75 and Over... 73,827 91, % 28.8% 3.2% 6.8% Females... 1,565,677 1,807, % 11.9% 15.0% 14.5% Under Age , , % 8.1% 18.5% 18.6% Ages ,701 1,130, % 14.6% 15.2% 13.6% Ages , , % -3.6% 7.6% 9.7% Ages 75 and Over , , % 19.6% 9.8% 13.3% Source: U.S. Bureau of the Census 284
289 Oregon Percent Distribution of Households by Age of Householder and Income, 2004 Less than $10,000 $10,000 $14,999 $15,000 $24,999 $25,000 $34,999 $35,000 $49,999 $50,000 $74,999 $75,000 $99,999 $100,000 or more All Households Age of Householder Under 25 years % 13.5% 20.9% 19.5% 14.7% 11.3% 1.1% 1.0% 100.0% years % 5.1% 11.6% 12.7% 17.5% 23.9% 11.0% 10.7% 100.0% years % 3.9% 9.7% 10.6% 15.3% 22.1% 14.1% 15.3% 100.0% 65 years and over % 13.3% 19.9% 16.6% 16.1% 15.7% 4.2% 6.0% 100.0% Oregon (all ages) % 6.9% 13.2% 13.1% 16.2% 20.8% 10.2% 10.9% 100.0% United States (all ages). 8.9% 6.3% 12.3% 12.0% 15.5% 19.0% 11.1% 15.0% 100.0% Source: U.S. Bureau of the Census Percent of Households by Household Income Bracket, 2004 Percent of Households 25.0% 20.0% 15.0% 10.0% 5.0% 0.0% Less than $10,000 $10,000 $14,999 $15,000 $24,999 $25,000 $34,999 $35,000 $49,999 $50,000 $74,999 $75,000 $99,999 $100,000 or more Oregon United States 285
290 State and Local General Revenues, FY 2002 Oregon Average Annual Revenue Change General Revenues Per Capita Percent of Personal Income (millions) OR US OR US OR US Total General Revenues... $21,625 $6,138 $5, % 19.3% 6.0% 5.6% Own Sources... $15,187 $4,311 $4, % 15.2% 4.7% 5.2% Taxes... $9,003 $2,555 $3, % 10.4% 3.8% 4.9% Property Taxes... $3,139 $891 $ % 3.2% 2.1% 4.5% General Sales Taxes... $0 $0 $ % 2.6% 0.0% 5.4% Personal Income Taxes.. $3,675 $1,043 $ % 2.3% 5.2% 5.8% Other Taxes... $2,189 $621 $ % 2.3% 4.3% 4.3% Charges/Miscellaneous... $6,184 $1,755 $1, % 4.8% 6.2% 5.7% Federal Aid... $6,438 $1,827 $1, % 4.1% 10.3% 7.2% Source: U.S. Bureau of the Census (2002 data are the most current available.) 1992 General Revenue 2002 General Revenue Property Taxes Personal Income Taxes 20% 21% 29% 15% Other Taxes 17% Charges/Misc 18% Federal Aid 29% 10% 12% 29% 286
291 Oregon I. Personal Income Tax (2004) State Income Tax Base Oregon s income tax base is linked federal adjusted gross income. Filing Requirements Taxpayers must file if they file a federal tax return or have $1 or more of Oregon income tax withheld from wages. Residents are also required file if their gross income exceeds the following amounts: Under age $4,620 (single); $9,245 (married, filing jointly; both spouses are under age 65) Age 65 or older... $5,820 (single); $11,245 (married, filing jointly; both spouses are age 65 or older) Rate Structure Single Married, Filing Jointly Taxable Income Rate Taxable Income Rate First $2, % First $5, % $2,500 - $6, % $5,000 - $12, % Over $6, % Over $12, % Retirement Income Tax Credit* Tax credits are available up 9% of pension income for persons age 62 or older whose income is less than $22,500 (single) or $45,000 (married, filing jointly), who have received less than $7,500 (single) or $15,000 (married, filing jointly) in Social Security benefits and Tier 1 Railroad Retirement benefits, and whose household income plus their Social Security benefits and Tier 1 Railroad Retirement benefits is less than $22,500 (single) or $45,000 (married, filing jointly). Federal pensioners retiring before Ocber 1, 1991, are eligible receive a full exemption on their federal pension income. Federal pensioners retiring after Ocber 1, 1991, can receive an exemption on their federal pension income based on the time they worked prior Ocber 1, 1991, compared with their tal service time. Social Security Benefits... Full exemption Standard Deduction Under age $1,720 (single); $3,445 (married, filing jointly; both spouses are under age 65) Age 65 or older... $2,920 (single); $5,445 (married, filing jointly; both spouses are age 65 or older) Sources: AARP 2005 telephone survey of state legislative staff, state departments of revenue, state controllers offices, state assessors offices, and state treasury offices. 287
292 Oregon Health Insurance Premiums Deduction Taxpayers who have an employer that provides taxable health insurance them and their samesex partner may qualify for a deduction. Other Deductions... Federal income taxes owed up $4,000 Personal Exemption Credit... $151 (single); $302 (married, filing jointly) Elderly or Disabled Tax Credit*... 40% of the federal elderly or disabled tax credit *Taxpayers may claim either the retirement income tax credit or the elderly or disabled tax credit, but not both. Long-Term Care Insurance Premiums Credit... 15% of their insurance premiums or $500 (whichever is less); only policies issued in 2000 or later qualify. Local Income Taxes... Multnomah County residents pay a 1.25% income tax on Oregon taxable income from II. General Sales Tax Rates (2004) No state or local sales tax is levied. III. Miscellaneous Tax Rates (2004) Corporate income (highest marginal rate) % Gasoline (per gallon)... $0.24 Cigarette (per pack of 20)... $1.28 Beer (per gallon)... $0.084 IV. Real Property Tax Relief Programs (2005) All taxable income Local taxes, where levied, are additional Homestead Exemption or Credit Requirements Benefits Disabled veterans or surviving spouses... $15,000 assessed value Service-linked disabled veterans or surviving spouses... $18,000 assessed value Sources: AARP 2005 telephone survey of state legislative staff, state departments of revenue, state controllers offices, state assessors offices, and state treasury offices. 288
293 Oregon Circuit Breaker Requirements Benefits Renters age 58 or older whose income is $10,000 or less and household assets are less than $25, Difference between yearly rent paid and 20% of yearly household income; benefit cannot exceed $2,100 per year. Deferral Program Requirements Benefits Persons age 62 or older or disabled with household income of $34,000 or less are initially eligible enter the deferral program. Upon entering the program, recipients must have federal adjusted gross income of $34,000 or less continue qualifying for the program.... Defer the payment of homestead property taxes Persons age 62 or older with household income of $34,000 or less are initially eligible enter the deferral program. Upon entering the program, recipients must have federal adjusted gross income of $34,000 or less continue qualifying for the program.... Defer the payment of special assessments V. Real Property Tax Limits, Caps, or Freezes (2005) Growth in assessed values of real property cannot exceed 3% per year. This limit does not apply new construction or major improvement projects (with market values greater than $10,000 in one year or $25,000 over five years). Total school property tax rates cannot exceed 0.5% of the market value of individual properties. Total non-school operating tax rates cannot exceed 1% of the market value of individual properties. Taxing districts cannot impose property tax rates beyond certain prescribed limits (otherwise known as permanent limits on assessed property values) without voter approval. Voter-approved bonds may exceed any of the limits described earlier. Of the above limits, for an individual property, whatever limit (or combination of limits) yields the lowest tax controls rules. Sources: AARP 2005 telephone survey of state legislative staff, state departments of revenue, state controllers offices, state assessors offices, and state treasury offices. 289
294 State and Local General Expenditures, FY 2002 General Expenditures Oregon Average Annual Expenditure Change Percent of Per Capita Personal Income (millions) OR US OR US OR US State/Local Direct General Expends... $22,990 $6,525 $6, % 19.9% 6.9% 5.9% To State/Local Government... $22,990 $6,525 $6, % 19.9% 6.9% 5.9% Education*... $7,543 $2,141 $2, % 6.8% 6.1% 6.2% Public Welfare... $4,045 $1,148 $ % 3.2% 11.6% 6.1% Health and Hospitals... $2,194 $623 $ % 1.7% 9.3% 5.2% Highways... $1,197 $340 $ % 1.3% 4.2% 5.5% Public Safety*... $2,174 $617 $ % 1.8% 8.2% 6.3% Environment... $1,447 $411 $ % 1.2% 5.0% 5.1% Interest on General Debt... $737 $209 $ % 0.9% -3.0% 3.1% Other... $3,654 $1,037 $ % 3.0% 7.6% 6.5% To Federal Government... $0 $0 $15 0.0% 0.1% 0.0% 1.9% *Education includes higher and lower education; public safety includes police, fire, corrections, and protection and inspection. Source: U.S. Bureau of the Census (2002 data are the most current available.) State and Local General Expenditures, FY 2002 (excluding payments federal government) 3% 16% 33% Education Public Welfare Health and Hospitals 6% Highways 9% Public Safety Environment 5% 10% 18% Interest on General Debt Other Total Debt Outstanding Long-term Debt Short-term Debt 2002 Debt Ratio Measures Per $1,000 Debt (billions) Per Capita of Personal Income Debt (billions) Percent of Total Debt (billions) Percent of Total Oregon (State and Local)... $18.8 $5,344 $ $ % $ % United States... $1,681.4 $5,839 $ $1, % $ % Source: U.S. Bureau of the Census 290
295 THIS PAGE INTENTIONALLY LEFT BLANK 291
296 Pennsylvania Economic Indicars Average Annual Change PA US PA US PA US Per Capita Income... $22,414 $22,172 $33,257 $33, % 4.1% Median Household Income... $32,066 $32,264 $44,131 $44, % 3.2% Gross State Product (in millions)... $298,329 $6,865,513 $468,089 $11,665, % 5.4% Full- and Part-Time Positions (in thousands) 6, ,224 7, , % 1.6% Employed Persons (in thousands).. 5, ,060 5, , % 1.2% Unemployment Rate % 6.1% 5.5% 5.5% n/a n/a Sources: U.S. Bureau of the Census, U.S. Bureau of Economic Analysis, and the U.S. Bureau of Labor Statistics 2004 Population Under Age 18 Ages % 6% Males 24% 7% 10% Females 22% Ages Ages 75 and Over 64% 61% Population Poverty Rate Population and Poverty Percentage Change PA PA PA US PA US Total Population...12,042,545 12,406, % 12.8% 11.7% 13.1% Males... 5,782,868 6,013, % 13.8% 10.1% 11.6% Under Age ,483,396 1,452, % 7.8% 16.2% 18.3% Ages ,542,894 3,794, % 16.7% 8.6% 9.6% Ages , , % 1.6% 5.6% 6.5% Ages 75 and Over , , % 28.8% 6.1% 6.8% Females... 6,259,677 6,392, % 11.9% 13.1% 14.5% Under Age ,408,576 1,384, % 8.1% 17.3% 18.6% Ages ,704,689 3,878, % 14.6% 12.5% 13.6% Ages , , % -3.6% 8.5% 9.7% Ages 75 and Over , , % 19.6% 10.6% 13.3% Source: U.S. Bureau of the Census 292
297 Pennsylvania Percent Distribution of Households by Age of Householder and Income, 2004 Less than $10,000 $10,000 $14,999 $15,000 $24,999 $25,000 $34,999 $35,000 $49,999 $50,000 $74,999 $75,000 $99,999 $100,000 or more All Households Age of Householder Under 25 years % 10.1% 19.0% 18.0% 15.9% 7.7% 2.1% 1.9% 100.0% years % 4.0% 8.8% 12.2% 17.3% 23.2% 13.3% 14.1% 100.0% years % 3.8% 8.2% 9.4% 14.9% 22.1% 13.7% 20.2% 100.0% 65 years and over % 15.9% 24.0% 16.0% 13.7% 11.0% 4.0% 4.4% 100.0% Pennsylvania (all ages).. 9.0% 7.1% 12.7% 12.3% 15.5% 19.2% 10.7% 13.5% 100.0% United States (all ages). 8.9% 6.3% 12.3% 12.0% 15.5% 19.0% 11.1% 15.0% 100.0% Source: U.S. Bureau of the Census Percent of Households by Household Income Bracket, 2004 Percent of Households 25.0% 20.0% 15.0% 10.0% 5.0% 0.0% Less than $10,000 $10,000 $14,999 $15,000 $24,999 $25,000 $34,999 $35,000 $49,999 $50,000 $74,999 $75,000 $99,999 $100,000 or more Pennsylvania United States 293
298 State and Local General Revenues, FY 2002 Pennsylvania Average Annual Revenue Change General Revenues Per Capita Percent of Personal Income (millions) PA US PA US PA US Total General Revenues... $71,961 $5,837 $5, % 19.3% 4.7% 5.6% Own Sources... $55,935 $4,537 $4, % 15.2% 4.3% 5.2% Taxes... $37,627 $3,052 $3, % 10.4% 3.7% 4.9% Property Taxes... $10,911 $885 $ % 3.2% 4.1% 4.5% General Sales Taxes... $7,500 $608 $ % 2.6% 5.2% 5.4% Personal Income Taxes. $9,510 $771 $ % 2.3% 3.8% 5.8% Other Taxes... $9,706 $787 $ % 2.3% 2.1% 4.3% Charges/Miscellaneous... $18,308 $1,485 $1, % 4.8% 5.9% 5.7% Federal Aid... $16,026 $1,300 $1, % 4.1% 6.2% 7.2% Source: U.S. Bureau of the Census (2002 data are the most current available.) 1992 General Revenue 2002 General Revenue Property Taxes General Sales Taxes Personal Income Taxes Other Taxes 19% 16% 10% 23% 15% 10% Charges/Misc Federal Aid 24% 14% 26% 13% 17% 13% 294
299 Pennsylvania I. Personal Income Tax (2004) State Income Tax Base Pennsylvania s income tax base is not directly linked the federal income tax base. Filing Requirements Taxpayers must file if they have Pennsylvania gross taxable income exceeding $33 or they have incurred a loss from any transaction as an individual, sole proprier, partner in a partnership, or Pennsylvania S corporation shareholder. Rate Structure 3.07% of taxable income Public and Private Pension Income... Full exemption Social Security Benefits... Full exemption Standard Deductions and Personal Exemptions Combined None Local Income Taxes Many cities and boroughs levy earned income taxes. Philadelphia and Pittsburgh levy a wage and net profits tax. Philadelphia also levies a school district investment income tax. II. General Sales Tax Rates (2004) State % Combined state/local tax rates % 7.0%* *Only the city of Philadelphia and Allegheny County levy a local 1% general sales tax. No other locality levies a local general sales tax. III. Miscellaneous Tax Rates (2004) Corporate income (highest marginal rate) % All taxable income Gasoline (per gallon)... $0.12 Cigarette (per pack of 20)... $1.35 Beer (per gallon)... $0.08 An additional $0.142 per gallon oil franchise tax Sources: AARP 2005 telephone survey of state legislative staff, state departments of revenue, state controllers offices, state assessors offices, and state treasury offices. 295
300 Pennsylvania IV. Real Property Tax Relief Programs (2005) Homestead Exemptions/Exclusions Requirements Benefits Homeowners... School districts and municipalities have the option of offering an exclusion of up 50% of the median assessed value of residential properties for property taxes (Act 50). Homeowners... School districts have the option of offering an exclusion of up 50% of the median assessed value of residential properties for property taxes (Act 72). School districts cannot increase their budget more than the cost of living qualify for the program. Fully disabled veterans with service-related disability... Full exemption Circuit Breaker Requirements Benefits Homeowners and renters age 65 or older, surviving spouses age 50 or older, or permanently disabled (age 18 or older) whose income is $15,000 or less... Up a $500 property tax rebate Deferral Program (local option program) Requirements Benefits Homeowners whose household income is under $15, Defer real property taxes in excess of the prior year s property tax liability Sources: AARP 2005 telephone survey of state legislative staff, state departments of revenue, state controllers offices, state assessors offices, and state treasury offices. 296
301 Pennsylvania V. Real Property Tax Limits, Caps, or Freezes (2005) Total aggregate property taxes following the year of assessment cannot annually increase by more than 5% or 10%, depending on the political subdivision. This limit does not apply new construction or additions. Any percentage increase in aggregate school (for those school districts that have opted in local tax reform) property taxes because of higher property assessments cannot be greater than the percentage change in statewide average weekly wages in the preceding year. This limitation does not apply new additions and improvements, emergencies, and bonded indebtedness and can be overridden through a voter referendum. Property Tax Rate Limits* Boroughs... $3.00 per $100 of taxable value Second-class wnships... $1.40 per $100 of taxable value Cities... $2.50 per $100 of taxable value First-class wnships... $3.00 per $100 of taxable value Counties... $2.50 $3.00 per $100 of taxable value *Exceptions these limits include bonded indebtedness and special levies. In addition, these limits do not apply Philadelphia, Pittsburgh, Scrann, and the Philadelphia School District. VI. Local Expenditure Limits (2005) School districts that have opted in local tax reform under Act 72 cannot increase their budgets by more than the cost of living. In exchange, school districts will receive more state aid from state slot machine revenues. The increase in state aid will result in lower property taxes homeowners through a homestead exclusion of up 50% of the median assessed value of residential properties for property taxes. Sources: AARP 2005 telephone survey of state legislative staff, state departments of revenue, state controllers offices, state assessors offices, and state treasury offices. 297
302 State and Local General Expenditures, FY 2002 General Expenditures Pennsylvania Average Annual Expenditure Change Percent of Personal Per Capita Income (millions) PA US PA US PA US State/Local Direct General Expends... $73,670 $5,976 $6, % 19.9% 5.1% 5.9% To State/Local Government... $73,312 $5,947 $6, % 19.9% 5.1% 5.9% Education*... $24,296 $1,971 $2, % 6.8% 4.7% 6.2% Public Welfare... $14,486 $1,175 $ % 3.2% 4.6% 6.1% Health and Hospitals... $5,153 $418 $ % 1.7% 6.9% 5.2% Highways... $5,290 $429 $ % 1.3% 7.0% 5.5% Public Safety*... $5,592 $454 $ % 1.8% 7.3% 6.3% Environment... $3,453 $280 $ % 1.2% 3.9% 5.1% Interest on General Debt... $4,046 $328 $ % 0.9% 2.8% 3.1% Other... $10,996 $892 $ % 3.0% 5.6% 6.5% To Federal Government... $358 $29 $15 0.1% 0.1% 14.4% 1.9% *Education includes higher and lower education; public safety includes police, fire, corrections, and protection and inspection. Source: U.S. Bureau of the Census (2002 data are the most current available.) State and Local General Expenditures, FY 2002 (excluding payments federal government) 15% 6% 5% 8% 7% 7% 20% 32% Education Public Welfare Health and Hospitals Highways Public Safety Environment Interest on General Debt Other Total Debt Outstanding Long-term Debt Short-term Debt 2002 Debt Ratio Measures Per $1,000 Debt (billions) Per Capita of Personal Income Debt (billions) Percent of Total Debt (billions) Percent of Total Pennsylvania (State and Local)... $83.8 $6,798 $ $ % $ % United States... $1,681.4 $5,839 $ $1, % $ % Source: U.S. Bureau of the Census 298
303 THIS PAGE INTENTIONALLY LEFT BLANK 299
304 Rhode Island Economic Indicars Average Annual Change RI US RI US RI US Per Capita Income... $22,097 $22,172 $34,180 $33, % 4.1% Median Household Income... $31,928 $32,264 $48,129 $44, % 3.2% Gross State Product (in millions)... $24,375 $6,865,513 $41,679 $11,665, % 5.4% Full- and Part-Time Positions (in thousands) , , % 1.6% Employed Persons (in thousands) , , % 1.2% Unemployment Rate % 6.1% 5.2% 5.5% n/a n/a Sources: U.S. Bureau of the Census, U.S. Bureau of Economic Analysis, and the U.S. Bureau of Labor Statistics 2004 Population Under Age 18 6% 6% Males 24% 6% 10% Females 21% Ages Ages Ages 75 and Over 64% 63% Population Poverty Rate Population and Poverty Percentage Change RI RI RI US RI US Total Population ,412 1,080, % 12.8% 12.8% 13.1% Males , , % 13.8% 10.7% 11.6% Under Age , , % 7.8% 21.2% 18.3% Ages , , % 16.7% 7.4% 9.6% Ages ,318 28, % 1.6% 5.4% 6.5% Ages 75 and Over... 23,753 31, % 28.8% 7.3% 6.8% Females , , % 11.9% 14.8% 14.5% Under Age , , % 8.1% 20.9% 18.6% Ages , , % 14.6% 13.8% 13.6% Ages ,847 35, % -3.6% 8.5% 9.7% Ages 75 and Over... 46,935 54, % 19.6% 11.0% 13.3% Source: U.S. Bureau of the Census 300
305 Rhode Island Percent Distribution of Households by Age of Householder and Income, 2004 Less than $10,000 $10,000 $14,999 $15,000 $24,999 $25,000 $34,999 $35,000 $49,999 $50,000 $74,999 $75,000 $99,999 $100,000 or more All Households Age of Householder Under 25 years % 14.4% 14.4% 13.9% 14.5% 12.4% 4.4% 4.3% 100.0% years % 6.9% 7.9% 10.3% 14.0% 23.4% 16.0% 14.3% 100.0% years % 2.9% 7.5% 7.9% 13.0% 22.6% 15.7% 23.6% 100.0% 65 years and over % 14.4% 23.6% 13.3% 12.7% 12.5% 5.5% 6.3% 100.0% Rhode Island (all ages).. 8.7% 7.4% 11.4% 10.2% 13.4% 20.3% 13.1% 15.5% 100.0% United States (all ages). 8.9% 6.3% 12.3% 12.0% 15.5% 19.0% 11.1% 15.0% 100.0% Source: U.S. Bureau of the Census Percent of Households by Household Income Bracket, 2004 Percent of Households 25.0% 20.0% 15.0% 10.0% 5.0% 0.0% Less than $10,000 $10,000 $14,999 $15,000 $24,999 $25,000 $34,999 $35,000 $49,999 $50,000 $74,999 $75,000 $99,999 $100,000 or more Rhode Island United States 301
306 State and Local General Revenues, FY 2002 Rhode Island Average Annual Revenue Change General Revenues Per Capita Percent of Personal Income (millions) RI US RI US RI US Total General Revenues... $6,636 $6,209 $5, % 19.3% 4.6% 5.6% Own Sources... $4,870 $4,556 $4, % 15.2% 4.3% 5.2% Taxes... $3,622 $3,389 $3, % 10.4% 4.6% 4.9% Property Taxes... $1,462 $1,368 $ % 3.2% 3.7% 4.5% General Sales Taxes... $732 $684 $ % 2.6% 6.5% 5.4% Personal Income Taxes. $824 $770 $ % 2.3% 5.6% 5.8% Other Taxes... $605 $566 $ % 2.3% 3.4% 4.3% Charges/Miscellaneous... $1,248 $1,168 $1, % 4.8% 3.5% 5.7% Federal Aid... $1,766 $1,652 $1, % 4.1% 5.4% 7.2% Source: U.S. Bureau of the Census (2002 data are the most current available.) 1992 General Revenue 2002 General Revenue Property Taxes General Sales Taxes 25% 24% 27% 22% Personal Income Taxes Other Taxes Charges/Misc 9% 11% Federal Aid 21% 10% 11% 19% 9% 12% 302
307 Rhode Island I. Personal Income Tax (2004) State Income Tax Base Rhode Island s income tax base is linked federal adjusted gross income. Filing Requirements Taxpayers must file if they are required file a federal tax return or have received Rhode Island income exceeding federal personal exemptions. Rate Structure Single Married, Filing Jointly Taxable Income Rate Taxable Income Rate First $29, % First $48, % $29,051 - $70, % $48,501 - $117, % $70,351 - $146, % $117,251 - $178, % $146,751 - $319, % $178,651 - $319, % $319, % $319, % Public and Private Pension Exemptions... None Social Security Benefits Only taxpayers whose provisional income* is $25,000 or higher (single) or $32,000 or higher (married, filing jointly) are subject taxation of their Social Security benefits. *Provisional income consists of federal adjusted gross income, tax-exempt interest, certain foreign-source income, and one-half of the taxpayer s Social Security or Railroad Retirement Tier 1 benefit (U.S. House Committee on the Budget, Omnibus Budget Reconciliation Act of 1993, 103 rd Congress, 1 st sess., 1993, Conference Report , p. 594). Standard Deductions and Personal Exemptions Combined* Under age 65*... $7,950 (single); $14,350 (married, filing jointly, both spouses are under age 65) Age 65 or older*... $9,150 (single); $16,250 (married, filing jointly, both spouses are age 65 or older) *Personal exemptions equal $3,100 per exemption (single have one exemption and married couples have two). Taxpayers with federal adjusted gross income greater than $142,700 (single) or $214,050 (married, filing jointly) receive lower personal exemption amounts. Local Income Taxes... None Sources: AARP 2005 telephone survey of state legislative staff, state departments of revenue, state controllers offices, state assessors offices, and state treasury offices. 303
308 Rhode Island II. General Sales Tax Rates (2004) State % Combined state/local tax rates % III. Miscellaneous Tax Rates (2004) Corporate income (highest marginal rate) % Gasoline (per gallon)... $0.30 Cigarette (per pack of 20)... $2.46 Beer (per gallon)... $0.097 All taxable income Plus a 7% sales tax IV. Real Property Tax Relief Programs (2005) Homestead Exemption or Credit* Requirements Benefits Veterans... $1,000 assessed value Blind... $6,000 assessed value *NOTE: Some localities may provide other forms of homestead exemptions. Circuit Breaker* Eligibility... Homeowners and renters age 65 or older, or recipients of Social Security Disability Income payments Income ceiling... $30,000 Maximum benefit... $250 tax credit *If sufficient state monies are available, homeowners and renters under age 65 can also apply receive full or partial credit after June 30. Deferral Program... No statewide programs are available; however, some cities and wns offer such programs. V. Real Property Tax Limits, Caps, or Freezes (2005) Local taxing districts cannot annually increase local property tax revenues by more than 5.5%. Exceptions this limit include various special emergency situations, increases in bonded indebtedness, and losses in non-property tax revenues. Sources: AARP 2005 telephone survey of state legislative staff, state departments of revenue, state controllers offices, state assessors offices, and state treasury offices. 304
309 Rhode Island State and Local General Expenditures, FY 2002 General Expenditures Average Annual Expenditure Change Percent of Personal Per Capita Income (millions) RI US RI US RI US State/Local Direct General Expends... $6,784 $6,347 $6, % 19.9% 3.6% 5.9% To State/Local Government... $6,756 $6,321 $6, % 19.9% 3.6% 5.9% Education*... $2,180 $2,040 $2, % 6.8% 5.0% 6.2% Public Welfare... $1,667 $1,559 $ % 3.2% 8.3% 6.1% Health and Hospitals... $299 $280 $ % 1.7% 1.7% 5.2% Highways... $331 $310 $ % 1.3% 3.5% 5.5% Public Safety*... $670 $627 $ % 1.8% 5.5% 6.3% Environment... $298 $279 $ % 1.2% 0.0% 5.1% Interest on General Debt... $324 $303 $ % 0.9% -0.7% 3.1% Other... $987 $923 $ % 3.0% -1.5% 6.5% To Federal Government... $28 $26 $15 0.1% 0.1% 6.7% 1.9% *Education includes higher and lower education; public safety includes police, fire, corrections, and protection and inspection. Source: U.S. Bureau of the Census (2002 data are the most current available.) State and Local General Expenditures, FY 2002 (excluding payments federal government) 15% 5% 4% 10% 5% 4% 25% 32% Education Public Welfare Health and Hospitals Highways Public Safety Environment Interest on General Debt Other Total Debt Outstanding Long-term Debt Short-term Debt 2002 Debt Ratio Measures Per $1,000 Debt (billions) Per Capita of Personal Income Debt (billions) Percent of Total Debt (billions) Percent of Total Rhode Island (State and Local)... $7.3 $6,871 $ $ % $ % United States... $1,681.4 $5,839 $ $1, % $ % Source: U.S. Bureau of the Census 305
310 South Carolina Economic Indicars Average Annual Change SC US SC US SC US Per Capita Income... $18,365 $22,172 $27,153 $33, % 4.1% Median Household Income... $29,846 $32,264 $38,747 $44, % 3.2% Gross State Product (in millions)... $81,033 $6,865,513 $136,125 $11,665, % 5.4% Full- and Part-Time Positions (in thousands) 1, ,224 2, , % 1.6% Employed Persons (in thousands).. 1, ,060 1, , % 1.2% Unemployment Rate % 6.1% 6.8% 5.5% n/a n/a Sources: U.S. Bureau of the Census, U.S. Bureau of Economic Analysis, and the U.S. Bureau of Labor Statistics 2004 Population Under Age 18 6% 4% Males 26% 7% 7% Females 23% Ages Ages Ages 75 and Over 64% 63% Population Poverty Rate Population and Poverty Percentage Change SC SC SC US SC US Total Population... 3,666,456 4,198, % 12.8% 15.7% 13.1% Males... 1,769,268 2,045, % 13.8% 13.6% 11.6% Under Age , , % 7.8% 23.2% 18.3% Ages ,115,055 1,306, % 16.7% 10.3% 9.6% Ages , , % 1.6% 7.8% 6.5% Ages 75 and Over... 59,873 85, % 28.8% 10.1% 6.8% Females... 1,897,188 2,152, % 11.9% 17.7% 14.5% Under Age , , % 8.1% 22.4% 18.6% Ages ,171,471 1,346, % 14.6% 16.2% 13.6% Ages , , % -3.6% 13.5% 9.7% Ages 75 and Over , , % 19.6% 20.4% 13.3% Source: U.S. Bureau of the Census 306
311 South Carolina Percent Distribution of Households by Age of Householder and Income, 2004 Less than $10,000 $10,000 $14,999 $15,000 $24,999 $25,000 $34,999 $35,000 $49,999 $50,000 $74,999 $75,000 $99,999 $100,000 or more All Households Age of Householder Under 25 years % 12.0% 19.3% 16.0% 13.9% 15.0% 4.4% 0.5% 100.0% years % 5.3% 13.7% 13.4% 16.7% 21.3% 12.4% 10.4% 100.0% years % 5.8% 10.0% 11.4% 14.4% 18.0% 13.7% 16.1% 100.0% 65 years and over % 11.9% 19.0% 13.9% 15.9% 12.0% 4.1% 6.8% 100.0% South Carolina (all ages). 10.9% 7.2% 13.7% 12.9% 15.5% 17.9% 10.8% 11.2% 100.0% United States (all ages) % 6.3% 12.3% 12.0% 15.5% 19.0% 11.1% 15.0% 100.0% Source: U.S. Bureau of the Census Percent of Households by Household Income Bracket, 2004 Percent of Households 20.0% 18.0% 16.0% 14.0% 12.0% 10.0% 8.0% 6.0% 4.0% 2.0% 0.0% Less than $10,000 $10,000 $14,999 $15,000 $24,999 $25,000 $34,999 $35,000 $49,999 $50,000 $74,999 $75,000 $99,999 $100,000 or more South Carolina United States 307
312 State and Local General Revenues, FY 2002 South Carolina Average Annual Revenue Change General Revenues Per Capita Percent of Personal Income (millions) SC US SC US SC US Total General Revenues... $21,239 $5,173 $5, % 19.3% 6.5% 5.6% Own Sources... $15,907 $3,874 $4, % 15.2% 6.2% 5.2% Taxes... $9,752 $2,375 $3, % 10.4% 5.6% 4.9% Property Taxes... $3,096 $754 $ % 3.2% 6.9% 4.5% General Sales Taxes... $2,435 $593 $ % 2.6% 5.1% 5.4% Personal Income Taxes. $2,349 $572 $ % 2.3% 5.2% 5.8% Other Taxes... $1,871 $456 $ % 2.3% 4.6% 4.3% Charges/Miscellaneous... $6,155 $1,499 $1, % 4.8% 7.2% 5.7% Federal Aid... $5,333 $1,299 $1, % 4.1% 7.7% 7.2% Source: U.S. Bureau of the Census (2002 data are the most current available.) 1992 General Revenue 2002 General Revenue Property Taxes General Sales Taxes Personal Income Taxes Other Taxes 22% 14% 13% 25% 15% 11% Charges/Misc Federal Aid 27% 11% 13% 29% 9% 11% 308
313 South Carolina I. Personal Income Tax (2004) State Income Tax Base South Carolina s income tax base is linked federal taxable income. Filing Requirements Taxpayers under age 65 must file if they filed a federal tax return that includes income taxable by South Carolina. Taxpayers age 65 or older must file if their gross income is greater than the federal gross income filing requirement plus $15,000 (single) or $30,000 (married, filing jointly; both spouses are age 65 or older). Rate Structure All Taxpayers Taxable Income Rate First $2, % $2,501 - $5, % $5,001 - $7, % $7,501 - $10, % $10,001 - $12, % Over $12, % Retirement Deduction $3,000 deduction for persons claiming the deduction under age 65; $10,000 deduction for persons claiming the deduction at age 65 or older. Social Security Benefits... Full exemption Senior Citizen Deduction Taxpayers age 65 or older may receive a deduction of $15,000 (single) or $15,000 per spouse (married, filing jointly) against any source of income. However, the deductions are reduced by any retirement deduction taken. Standard Deductions and Personal Exemptions Combined* Under age 65*... $7,950 (single); $15,900 (married, filing jointly, both spouses are under age 65) Age 65 or older*... $9,150 (single); $17,800 (married, filing jointly, both spouses are age 65 or older) *Personal exemptions equal $3,100 per exemption (single have one exemption and married couples have two). Taxpayers with federal adjusted gross income greater than $142,700 (single) or $214,050 (married, filing jointly) receive lower personal exemption amounts. Sources: AARP 2005 telephone survey of state legislative staff, state departments of revenue, state controllers offices, state assessors offices, and state treasury offices. 309
314 South Carolina Long-Term Care Expense Credit... 20% tax credit for nursing home expenses or inhome or community care expenses up $300; no credit is allowed for expenses paid from public source funds, such as Medicaid. Local Income Taxes... None II. General Sales Tax Rates (2004) State % Combined state/local tax rates % 7.0% III. Miscellaneous Tax Rates (2004) Corporate income (highest marginal rate) % All taxable income Gasoline (per gallon)... $0.16 Cigarette (per pack of 20)... $0.07 Beer (per gallon)... $0.768 IV. Real Property Tax Relief Programs (2005) Homestead Exemption or Credit Requirements Benefits All homeowners... $100,000 fair market value (school operating taxes only) Age 65 or older, blind, or permanently disabled... $50,000 fair market value Paraplegics and disabled veterans... Full exemption for the homestead and the value of the land up one acre. Circuit Breaker... None Deferral Program... None V. Real Property Tax Limits, Caps, or Freezes (2005) Local taxing districts cannot increase their property tax rates by more than the inflation rate (CPI rate) from the previous year. This limitation does not apply bonded indebtedness or new construction/property or additions. This limit can be overridden for various reasons or circumstances, including the following: (1) a decision by a majority vote of the local governing body that has provided public notice, (2) in cases of emergencies declared by the governor, and (3) in order raise revenues comply with judicial mandates. Sources: AARP 2005 telephone survey of state legislative staff, state departments of revenue, state controllers offices, state assessors offices, and state treasury offices. 310
315 South Carolina State and Local General Expenditures, FY 2002 General Expenditures Average Annual Expenditure Change Percent of Personal Per Capita Income (millions) SC US SC US SC US State/Local Direct General Expends... $23,820 $5,801 $6, % 19.9% 7.3% 5.9% To State/Local Government... $23,820 $5,801 $6, % 19.9% 7.3% 5.9% Education*... $8,380 $2,041 $2, % 6.8% 6.9% 6.2% Public Welfare... $4,374 $1,065 $ % 3.2% 8.7% 6.1% Health and Hospitals... $3,143 $766 $ % 1.7% 6.3% 5.2% Highways... $1,491 $363 $ % 1.3% 9.1% 5.5% Public Safety*... $1,602 $390 $ % 1.8% 5.8% 6.3% Environment... $971 $237 $ % 1.2% 5.4% 5.1% Interest on General Debt... $1,159 $282 $ % 0.9% 8.6% 3.1% Other... $2,700 $658 $ % 3.0% 7.8% 6.5% To Federal Government... $0 $0 $15 0.0% 0.1% 0.0% 1.9% *Education includes higher and lower education; public safety includes police, fire, corrections, and protection and inspection. Source: U.S. Bureau of the Census (2002 data are the most current available.) State and Local General Expenditures, FY 2002 (excluding payments federal government) 5% 4% 7% 11% 36% Education Public Welfare Health and Hospitals Highways Public Safety 6% Environment Interest on General Debt 13% 18% Other Total Debt Outstanding Long-term Debt Short-term Debt 2002 Debt Ratio Measures Per $1,000 Debt (billions) Per Capita of Personal Income Debt (billions) Percent of Total Debt (billions) Percent of Total South Carolina (State and Local)... $22.9 $5,571 $ $ % $ % United States... $1,681.4 $5,839 $ $1, % $ % Source: U.S. Bureau of the Census 311
316 South Dakota Economic Indicars Average Annual Change SD US SD US SD US Per Capita Income... $19,392 $22,172 $30,617 $33, % 4.1% Median Household Income... $29,733 $32,264 $41,189 $44, % 3.2% Gross State Product (in millions)... $17,014 $6,865,513 $29,386 $11,665, % 5.4% Full- and Part-Time Positions (in thousands) , , % 1.6% Employed Persons (in thousands) , , % 1.2% Unemployment Rate % 6.1% 3.5% 5.5% n/a n/a Sources: U.S. Bureau of the Census, U.S. Bureau of Economic Analysis, and the U.S. Bureau of Labor Statistics 2004 Population Under Age 18 6% 6% Males 26% 7% 9% Females 24% Ages Ages Ages 75 and Over 62% 60% Population Poverty Rate Population and Poverty Percentage Change SD SD SD US SD US Total Population , , % 12.8% 11.0% 13.1% Males , , % 13.8% 10.4% 11.6% Under Age ,360 97, % 7.8% 15.4% 18.3% Ages , , % 16.7% 9.2% 9.6% Ages ,569 24, % 1.6% 6.2% 6.5% Ages 75 and Over... 18,870 22, % 28.8% 4.8% 6.8% Females , , % 11.9% 11.6% 14.5% Under Age ,757 93, % 8.1% 14.2% 18.6% Ages , , % 14.6% 10.7% 13.6% Ages ,810 28, % -3.6% 6.8% 9.7% Ages 75 and Over... 31,851 34, % 19.6% 14.7% 13.3% Source: U.S. Bureau of the Census 312
317 South Dakota Percent Distribution of Households by Age of Householder and Income, 2004 Less than $10,000 $10,000 $14,999 $15,000 $24,999 $25,000 $34,999 $35,000 $49,999 $50,000 $74,999 $75,000 $99,999 $100,000 or more All Households Age of Householder Under 25 years % 11.8% 19.9% 19.9% 18.0% 6.9% 2.0% 0.7% 100.0% years % 6.1% 11.3% 15.1% 18.0% 25.5% 10.7% 7.1% 100.0% years % 4.2% 10.3% 12.9% 16.7% 22.4% 13.5% 13.1% 100.0% 65 years and over % 15.0% 23.7% 15.4% 14.3% 11.0% 4.0% 3.9% 100.0% South Dakota (all ages) 9.0% 7.9% 14.4% 14.8% 16.7% 19.8% 9.5% 8.0% 100.0% United States (all ages). 8.9% 6.3% 12.3% 12.0% 15.5% 19.0% 11.1% 15.0% 100.0% Source: U.S. Bureau of the Census Percent of Households by Household Income Bracket, 2004 Percent of Households 25.0% 20.0% 15.0% 10.0% 5.0% 0.0% Less than $10,000 $10,000 $14,999 $15,000 $24,999 $25,000 $34,999 $35,000 $49,999 $50,000 $74,999 $75,000 $99,999 $100,000 or more South Dakota United States 313
318 State and Local General Revenues, FY 2002 South Dakota Average Annual Revenue Change General Revenues Per Capita Percent of Personal Income (millions) SD US SD US SD US Total General Revenues... $3,902 $5,131 $5, % 19.3% 5.3% 5.6% Own Sources... $2,752 $3,618 $4, % 15.2% 4.8% 5.2% Taxes... $1,841 $2,422 $3, % 10.4% 5.2% 4.9% Property Taxes... $668 $878 $ % 3.2% 4.5% 4.5% General Sales Taxes... $672 $884 $ % 2.6% 5.9% 5.4% Personal Income Taxes. $0 $0 $ % 2.3% n/a 5.8% Other Taxes... $501 $659 $ % 2.3% 5.4% 4.3% Charges/Miscellaneous... $910 $1,197 $1, % 4.8% 3.9% 5.7% Federal Aid... $1,150 $1,513 $1, % 4.1% 6.7% 7.2% Source: U.S. Bureau of the Census (2002 data are the most current available.) 1992 General Revenue 2002 General Revenue Property Taxes General Sales Taxes 26% 18% 30% 17% Other Taxes Charges/Misc 16% 17% Federal Aid 27% 13% 23% 13% 314
319 South Dakota I. Personal Income Tax (2004) No state or local personal income tax is levied. II. General Sales Tax Rates (2004) State % Combined state/local tax rates % 6.0% III. Miscellaneous Tax Rates (2004) Corporate income (highest marginal rate)... No tax* Gasoline (per gallon)... $0.22 Counties and cities operating public transportation systems may levy a $0.01 tax. Cigarette (per pack of 20)... $0.53 Beer (per gallon)... $0.274 *The only corporations taxed are financial institutions, savings and loan associations, and mining companies. IV. Real Property Tax Relief Programs (2005) Homestead Exemption or Credit Requirements Benefits Paraplegic veterans with specially adapted housing... Full exemption Circuit Breaker Requirements Benefits Homeowners age 65 or older or disabled whose income is $9,750 or less (single) or $12,750 or less (multiple-member household)*... Up 35% of taxes due (single); 55% of taxes due (multiple-member household) *Homeowners must have owned the real property for which the refund is claimed for at least three years or have been state residents for five years. Renters age 65 or older or disabled whose income is less than $9,750 (single) or $12,750 (multiple-member household) may apply for a sales tax refund. Sources: AARP 2005 telephone survey of state legislative staff, state departments of revenue, state controllers offices, state assessors offices, and state treasury offices. 315
320 South Dakota Circuit Breaker (local option program) Requirements Benefits Homeowners age 65 or older or disabled whose income is $5,758 or less (single) or $7,765 or less (multiple-member household)*... Up 35% of municipal taxes due (single); 55% of municipal taxes due (multiple-member household) *Homeowners must have owned and resided in their real property for which the reduction is claimed for at least five years. Deferral Program Homeowners age 70 or older whose income is less than $16,000 (single) or $20,000 (multiplemember household) may defer all property taxes due. In addition, in order qualify, homeowners must have owned their own home for at least three years or lived in the state for at least five years, and resided for at least eight months of the previous year in the single-family dwelling in order qualify. V. Real Property Tax Limits, Caps, or Freezes (2005) Non-school local property taxes cannot annually exceed 3% or inflation (whichever is less) for the local taxing district. The 3% limit does not pertain new construction and can be overridden through voter approval. School property tax rates are set by the state legislature. School property tax rates for school operating budgets cannot exceed $5.13 per $1,000 value for owner-occupied dwellings. Homeowners age 65 or older or disabled whose income is less than $20,440 (single-household) or $25,550 (multiple-member household) are eligible receive a freeze on their assessed property value. Other eligibility requirements include the following: 1) homeowners must have resided for at least 200 days of the previous year; 2) homeowners must have owned their residence for at least one year; and 3) the home s market value must be less than $150,000, unless the homeowner already received the freeze in a preceding year. Sources: AARP 2005 telephone survey of state legislative staff, state departments of revenue, state controllers offices, state assessors offices, and state treasury offices. 316
321 South Dakota State and Local General Expenditures, FY 2002 General Expenditures Average Annual Expenditure Change Percent of Personal Per Capita Income (millions) SD US SD US SD US State/Local Direct General Expends... $3,885 $5,108 $6, % 19.9% 5.3% 5.9% To State/Local Government... $3,885 $5,108 $6, % 19.9% 5.3% 5.9% Education*... $1,360 $1,789 $2, % 6.8% 5.4% 6.2% Public Welfare... $605 $795 $ % 3.2% 7.1% 6.1% Health and Hospitals... $171 $224 $ % 1.7% 3.6% 5.2% Highways... $580 $763 $ % 1.3% 6.5% 5.5% Public Safety*... $246 $324 $ % 1.8% 6.9% 6.3% Environment... $281 $370 $ % 1.2% 5.9% 5.1% Interest on General Debt... $173 $227 $ % 0.9% 0.5% 3.1% Other... $468 $616 $ % 3.0% 3.4% 6.5% To Federal Government... $0 $0 $15 0.0% 0.1% n/a 1.9% *Education includes higher and lower education; public safety includes police, fire, corrections, and protection and inspection. Source: U.S. Bureau of the Census (2002 data are the most current available.) State and Local General Expenditures, FY 2002 (excluding payments federal government) 12% Education 7% 6% 4% 36% Public Welfare Health and Hospitals Highways Public Safety Environment 15% 4% 16% Interest on General Debt Other Total Debt Outstanding Long-term Debt Short-term Debt 2002 Debt Ratio Measures Per $1,000 Debt (billions) Per Capita of Personal Income Debt (billions) Percent of Total Debt (billions) Percent of Total South Dakota (State and Local)... $3.5 $4,538 $ $ % $ % United States... $1,681.4 $5,839 $ $1, % $ % Source: U.S. Bureau of the Census 317
322 Tennessee Economic Indicars Average Annual Change TN US TN US TN US Per Capita Income... $20,233 $22,172 $29,806 $33, % 4.1% Median Household Income... $28,639 $32,264 $38,223 $44, % 3.2% Gross State Product (in millions)... $128,905 $6,865,513 $217,626 $11,665, % 5.4% Full- and Part-Time Positions (in thousands) 3, ,224 3, , % 1.6% Employed Persons (in thousands).. 2, ,060 2, , % 1.2% Unemployment Rate % 6.1% 5.4% 5.5% n/a n/a Sources: U.S. Bureau of the Census, U.S. Bureau of Economic Analysis, and the U.S. Bureau of Labor Statistics 2004 Population Under Age 18 6% 4% Males 25% 7% 7% Females 22% Ages Ages Ages 75 and Over 65% 64% Population Poverty Rate Population and Poverty Percentage Change TN TN TN US TN US Total Population... 5,163,016 5,900, % 12.8% 14.5% 13.1% Males... 2,489,071 2,886, % 13.8% 12.3% 11.6% Under Age , , % 7.8% 21.1% 18.3% Ages ,567,260 1,868, % 16.7% 9.7% 9.6% Ages , , % 1.6% 7.1% 6.5% Ages 75 and Over... 96, , % 28.8% 9.2% 6.8% Females... 2,673,945 3,014, % 11.9% 16.6% 14.5% Under Age , , % 8.1% 21.1% 18.6% Ages ,648,988 1,903, % 14.6% 15.3% 13.6% Ages , , % -3.6% 11.5% 9.7% Ages 75 and Over , , % 19.6% 19.1% 13.3% Source: U.S. Bureau of the Census 318
323 Tennessee Percent Distribution of Households by Age of Householder and Income, 2004 Less than $10,000 $10,000 $14,999 $15,000 $24,999 $25,000 $34,999 $35,000 $49,999 $50,000 $74,999 $75,000 $99,999 $100,000 or more All Households Age of Householder Under 25 years % 13.0% 22.8% 15.4% 14.5% 9.4% 1.3% 1.0% 100.0% years % 5.1% 11.6% 14.2% 18.6% 23.8% 10.4% 8.9% 100.0% years % 5.6% 11.3% 11.2% 16.3% 20.4% 11.2% 14.8% 100.0% 65 years and over % 15.4% 20.9% 14.0% 12.4% 11.7% 4.2% 6.1% 100.0% Tennessee (all ages) % 7.8% 14.0% 13.2% 16.3% 19.3% 8.9% 9.9% 100.0% United States (all ages). 8.9% 6.3% 12.3% 12.0% 15.5% 19.0% 11.1% 15.0% 100.0% Source: U.S. Bureau of the Census Percent of Households by Household Income Bracket, 2004 Percent of Households 25.0% 20.0% 15.0% 10.0% 5.0% 0.0% Less than $10,000 $10,000 $14,999 $15,000 $24,999 $25,000 $34,999 $35,000 $49,999 $50,000 $74,999 $75,000 $99,999 $100,000 or more Tennessee United States 319
324 State and Local General Revenues, FY 2002 Tennessee Average Annual Revenue Change General Revenues Per Capita Percent of Personal Income (millions) TN US TN US TN US Total General Revenues... $27,484 $4,745 $5, % 19.3% 5.8% 5.6% Own Sources... $19,880 $3,432 $4, % 15.2% 5.2% 5.2% Taxes... $12,974 $2,240 $3, % 10.4% 5.3% 4.9% Property Taxes... $3,453 $596 $ % 3.2% 6.9% 4.5% General Sales Taxes... $5,842 $1,009 $ % 2.6% 5.8% 5.4% Personal Income Taxes. $146 $25 $ % 2.3% 4.6% 5.8% Other Taxes... $3,533 $610 $ % 2.3% 3.2% 4.3% Charges/Miscellaneous... $6,906 $1,192 $1, % 4.8% 5.0% 5.7% Federal Aid... $7,604 $1,313 $1, % 4.1% 7.5% 7.2% Source: U.S. Bureau of the Census (2002 data are the most current available.) 1992 General Revenue 2002 General Revenue Property Taxes General Sales Taxes Personal Income Taxes Other Taxes 24% 11% 21% 27% 13% 21% Charges/Misc Federal Aid 26% 17% 1% 25% 13% 1% 320
325 Tennessee I. Personal Income Tax (2004)* State Income Tax Base Tennessee s income tax base is not directly linked the federal income tax base. Filing Requirements Taxpayers must file if their taxable interest and dividend income exceeds $1,250 (single) or $2,500 (married, filing jointly). *Taxpayers age 65 or older may not have pay the personal income tax if their tal income from all sources is $16,200 or less (single) or $27,000 or less (married, filing jointly; either spouse is age 65 or older). Rate Structure A tax is levied only on sck dividends and interest from bonds and other obligations at 6%. Exceptions apply certain commercial instruments, for certain instruments of indebtedness issued by Tennessee banks and thrifts, federal obligations, and certain other income. Personal Exemptions All ages... $1,250 (single); $2,500 (married, filing jointly) Local Income Taxes... None II. General Sales Tax Rates (2004) State %* Combined state/local tax rates % 9.75% *Food from grocery sres is taxed at 6.0%. III. Miscellaneous Tax Rates (2004) Corporate income (highest marginal rate) % All taxable income Gasoline (per gallon)... $0.214 This includes a $0.01 special petroleum tax. Cigarette (per pack of 20)... $0.20 Beer (per gallon)... $0.138 Local taxes are additional. Sources: AARP 2005 telephone survey of state legislative staff, state departments of revenue, state controllers offices, state assessors offices, and state treasury offices. 321
326 Tennessee IV. Real Property Tax Relief Programs (2005) Homestead Exemption or Credit Requirements Benefits Homeowners age 65 or older or disabled whose income is $12,980 or less... Tax credit is based on the first $18,000 market value or on a maximum assessed value of $4,500; actual tax reduction depends on the effective tax rate and other related facrs. Disabled veteran homeowners... Tax credit is based on the first $150,000 market value or on a maximum assessed value of $37,500; actual tax reduction depends on the effective tax rate and other related facrs. Circuit breaker... None Deferral Program (local option programs) Requirements Benefits Homeowners age 65 and older or disabled whose income is $12,000 or less or an income of $25,000 or less (if approved by a two-thirds majority vote of the governing body)... Property taxes may be deferred up $60,000 of the property s market value. Homeowners age 65 and older (who reached age 65 on or before March 27, 1980) whose income is $12,000 or less or $25,000 or less (if approved by a two-thirds majority vote of the governing body) and whose home s fair market value is less than $50, Property taxes that exceed property taxes in 1979 may be deferred. Homeowners age 65 and older (who reached age 65 after March 27, 1980) whose income is $12,000 or less or $25,000 or less (if approved by a two-thirds majority vote of the governing body) and whose home s fair market value is less than $50, Property taxes that exceed property taxes at age 65 may be deferred. V. Real Property Tax Limits, Caps, or Freezes (2005) No statewide limits, caps, or freezes are provided. Sources: AARP 2005 telephone survey of state legislative staff, state departments of revenue, state controllers offices, state assessors offices, and state treasury offices. 322
327 Tennessee State and Local General Expenditures, FY 2002 General Expenditures Average Annual Expenditure Change Percent of Personal Per Capita Income (millions) TN US TN US TN US State/Local Direct General Expends... $28,952 $4,998 $6, % 19.9% 6.5% 5.9% To State/Local Government... $28,952 $4,998 $6, % 19.9% 6.5% 5.9% Education*... $9,468 $1,635 $2, % 6.8% 7.0% 6.2% Public Welfare... $6,458 $1,115 $ % 3.2% 9.3% 6.1% Health and Hospitals... $3,300 $570 $ % 1.7% 5.8% 5.2% Highways... $1,773 $306 $ % 1.3% 2.9% 5.5% Public Safety*... $2,198 $379 $ % 1.8% 5.9% 6.3% Environment... $1,371 $237 $ % 1.2% 4.0% 5.1% Interest on General Debt... $922 $159 $ % 0.9% 2.5% 3.1% Other... $3,462 $598 $ % 3.0% 6.4% 6.5% To Federal Government... $0 $0 $15 0.0% 0.1% n/a 1.9% *Education includes higher and lower education; public safety includes police, fire, corrections, and protection and inspection. Source: U.S. Bureau of the Census (2002 data are the most current available.) State and Local General Expenditures, FY 2002 (excluding payments federal government) 3% 5% 12% 33% Education Public Welfare Health and Hospitals Highways 8% Public Safety 6% Environment Interest on General Debt 11% 22% Other Total Debt Outstanding Long-term Debt Short-term Debt 2002 Debt Ratio Measures Per $1,000 Debt (billions) Per Capita of Personal Income Debt (billions) Percent of Total Debt (billions) Percent of Total Tennessee (State and Local)... $21.1 $3,648 $ $ % $ % United States... $1,681.4 $5,839 $ $1, % $ % Source: U.S. Bureau of the Census 323
328 Texas Economic Indicars Average Annual Change TX US TX US TX US Per Capita Income... $20,189 $22,172 $30,697 $33, % 4.1% Median Household Income... $30,755 $32,264 $41,326 $44, % 3.2% Gross State Product (in millions)... $478,143 $6,865,513 $884,136 $11,665, % 5.4% Full- and Part-Time Positions (in thousands) 10, ,224 12, , % 1.6% Employed Persons (in thousands)... 8, ,060 10, , % 1.2% Unemployment Rate % 6.1% 6.1% 5.5% n/a n/a Sources: U.S. Bureau of the Census, U.S. Bureau of Economic Analysis, and the U.S. Bureau of Labor Statistics 2004 Population Under Age 18 5% 3% Males 29% Females 6% 5% 27% Ages Ages Ages 75 and Over 63% 62% Population Poverty Rate Population and Poverty Percentage Change TX TX TX US TX US Total Population...18,338,319 22,490, % 12.8% 16.6% 13.1% Males... 9,038,897 11,201, % 13.8% 15.0% 11.6% Under Age ,705,625 3,202, % 7.8% 22.9% 18.3% Ages ,566,612 7,059, % 16.7% 12.0% 9.6% Ages , , % 1.6% 9.4% 6.5% Ages 75 and Over , , % 28.8% 10.7% 6.8% Females... 9,299,422 11,288, % 11.9% 18.2% 14.5% Under Age ,580,257 3,064, % 8.1% 23.0% 18.6% Ages ,613,266 6,946, % 14.6% 16.7% 13.6% Ages , , % -3.6% 11.5% 9.7% Ages 75 and Over , , % 19.6% 18.2% 13.3% Source: U.S. Bureau of the Census 324
329 Texas Percent Distribution of Households by Age of Householder and Income, 2004 Less than $10,000 $10,000 $14,999 $15,000 $24,999 $25,000 $34,999 $35,000 $49,999 $50,000 $74,999 $75,000 $99,999 $100,000 or more All Households Age of Householder Under 25 years % 12.4% 18.4% 18.2% 14.3% 10.1% 2.2% 0.8% 100.0% years % 4.9% 12.6% 12.7% 17.3% 20.0% 11.0% 13.7% 100.0% years % 4.6% 9.7% 9.9% 14.3% 19.8% 13.0% 20.8% 100.0% 65 years and over % 12.1% 19.1% 14.3% 14.7% 12.7% 5.5% 6.6% 100.0% Texas (all ages) % 6.5% 13.1% 12.4% 15.6% 18.0% 10.1% 14.1% 100.0% United States (all ages). 8.9% 6.3% 12.3% 12.0% 15.5% 19.0% 11.1% 15.0% 100.0% Source: U.S. Bureau of the Census Percent of Households by Household Income Bracket, 2004 Percent of Households 20.0% 18.0% 16.0% 14.0% 12.0% 10.0% 8.0% 6.0% 4.0% 2.0% 0.0% Less than $10,000 $10,000 $14,999 $15,000 $24,999 $25,000 $34,999 $35,000 $49,999 $50,000 $74,999 $75,000 $99,999 $100,000 or more Texas United States 325
330 State and Local General Revenues, FY 2002 Texas Average Annual Revenue Change General Revenues Per Capita Percent of Personal Income (millions) TX US TX US TX US Total General Revenues...$109,128 $5,024 $5, % 19.3% 6.8% 5.6% Own Sources... $86,214 $3,969 $4, % 15.2% 6.2% 5.2% Taxes... $58,981 $2,715 $3, % 10.4% 6.0% 4.9% Property Taxes... $24,521 $1,129 $ % 3.2% 6.5% 4.5% General Sales Taxes... $18,322 $843 $ % 2.6% 5.7% 5.4% Personal Income Taxes. $0 $0 $ % 2.3% -30.0% 5.8% Other Taxes... $16,138 $743 $ % 2.3% 5.5% 4.3% Charges/Miscellaneous... $27,233 $1,254 $1, % 4.8% 6.5% 5.7% Federal Aid... $22,915 $1,055 $1, % 4.1% 9.3% 7.2% Source: U.S. Bureau of the Census (2002 data are the most current available.) 1992 General Revenue 2002 General Revenue Property Taxes 17% 23% 21% 22% General Sales Taxes Other Taxes Charges/Misc Federal Aid 25% 18% 25% 17% 17% 15% 326
331 Texas I. Personal Income Tax (2004) No state or local personal income tax is levied. II. General Sales Tax Rates (2004) State % Combined state/local tax rates % 8.25% III. Miscellaneous Tax Rates (2004) Corporate income (highest marginal rate)... No tax Gasoline (per gallon)... $0.20 Cigarette (per pack of 20)... $0.41 Beer (per gallon)... $0.194 IV. Real Property Tax Relief Programs (2005) Homestead Exemption or Credit Requirements Benefits All homeowners... $3,000 assessed value for county taxes; additional local option of up 20% of assessed value Under age $15,000 assessed value for school taxes Age 65 or older or disabled... $25,000 assessed value for school taxes; additional local option of at least $3,000 assessed value for other local taxes Circuit Breaker... None Deferral Program Requirements Benefits Homeowners age 65 or older or disabled... Defer all property taxes due. The interest rate on deferred taxes is 8% per year. Sources: AARP 2005 telephone survey of state legislative staff, state departments of revenue, state controllers offices, state assessors offices, and state treasury offices. 327
332 Texas V. Real Property Tax Limits, Caps, or Freezes (2005) School property taxes do not increase once a homeowner reaches age 65. This also applied surviving spouses who are at least age 55. This does not include additions or improvements the property. School property tax rates levied for maintenance and operations cannot exceed $1.50 per $100 of value. This can be overridden with voter approval. Residential homestead assessed values cannot increase by more than 10% times the number of years since the last reappraisal. Sources: AARP 2005 telephone survey of state legislative staff, state departments of revenue, state controllers offices, state assessors offices, and state treasury offices. 328
333 Texas State and Local General Expenditures, FY 2002 General Expenditures Average Annual Expenditure Change Percent of Per Capita Personal Income (millions) TX US TX US TX US State/Local Direct General Expends... $111,604 $5,138 $6, % 19.9% 7.1% 5.9% To State/Local Government... $111,604 $5,138 $6, % 19.9% 7.1% 5.9% Education*... $45,703 $2,104 $2, % 6.8% 7.6% 6.2% Public Welfare... $14,903 $686 $ % 3.2% 7.3% 6.1% Health and Hospitals... $10,104 $465 $ % 1.7% 6.9% 5.2% Highways... $7,527 $346 $ % 1.3% 6.5% 5.5% Public Safety*... $10,088 $464 $ % 1.8% 7.4% 6.3% Environment... $5,743 $264 $ % 1.2% 6.1% 5.1% Interest on General Debt... $4,999 $230 $ % 0.9% 3.5% 3.1% Other... $12,537 $577 $ % 3.0% 7.7% 6.5% To Federal Government... $0 $0 $15 0.0% 0.1% n/a 1.9% *Education includes higher and lower education; public safety includes police, fire, corrections, and protection and inspection. Source: U.S. Bureau of the Census (2002 data are the most current available.) State and Local General Expenditures, FY 2002 (excluding payments federal government) 11% Education 4% 5% 9% 7% 42% Public Welfare Health and Hospitals Highways Public Safety Environment Interest on General Debt 9% 13% Other Total Debt Outstanding Long-term Debt Short-term Debt 2002 Debt Ratio Measures Per $1,000 Debt (billions) Per Capita of Personal Income Debt (billions) Percent of Total Debt (billions) Percent of Total Texas (State and Local)... $119.2 $5,488 $ $ % $ % United States... $1,681.4 $5,839 $ $1, % $ % Source: U.S. Bureau of the Census 329
334 Utah Economic Indicars Average Annual Change UT US UT US UT US Per Capita Income... $17,566 $22,172 $26,946 $33, % 4.1% Median Household Income... $35,716 $32,264 $50,970 $44, % 3.2% Gross State Product (in millions)... $42,218 $6,865,513 $82,611 $11,665, % 5.4% Full- and Part-Time Positions (in thousands) 1, ,224 1, , % 1.6% Employed Persons (in thousands) ,060 1, , % 1.2% Unemployment Rate % 6.1% 5.2% 5.5% n/a n/a Sources: U.S. Bureau of the Census, U.S. Bureau of Economic Analysis, and the U.S. Bureau of Labor Statistics 2004 Population Under Age 18 Ages Males 4% 3% 32% Females 5% 5% 30% Ages Ages 75 and Over 61% 60% Population Poverty Rate Population and Poverty Percentage Change UT UT UT US UT US Total Population...1,930,436 2,389, % 12.8% 10.9% 13.1% Males ,638 1,199, % 13.8% 10.1% 11.6% Under Age , , % 7.8% 12.7% 18.3% Ages , , % 16.7% 9.5% 9.6% Ages ,644 52, % 1.6% 3.7% 6.5% Ages 75 and Over... 29,283 39, % 28.8% 3.7% 6.8% Females ,798 1,189, % 11.9% 11.8% 14.5% Under Age , , % 8.1% 14.0% 18.6% Ages , , % 14.6% 11.5% 13.6% Ages ,566 59, % -3.6% 6.0% 9.7% Ages 75 and Over... 44,675 56, % 19.6% 7.7% 13.3% Source: U.S. Bureau of the Census 330
335 Utah Percent Distribution of Households by Age of Householder and Income, 2004 Less than $10,000 $10,000 $14,999 $15,000 $24,999 $25,000 $34,999 $35,000 $49,999 $50,000 $74,999 $75,000 $99,999 $100,000 or more All Households Age of Householder Under 25 years % 6.4% 21.0% 19.3% 21.0% 16.4% 0.7% 0.5% 100.0% years % 2.8% 8.5% 14.2% 19.4% 26.4% 13.8% 9.7% 100.0% years % 3.8% 8.2% 8.8% 14.5% 22.8% 16.3% 21.0% 100.0% 65 years and over % 9.8% 20.9% 13.9% 18.9% 16.2% 6.0% 7.5% 100.0% Utah (all ages) % 4.6% 11.6% 12.9% 17.9% 22.7% 12.1% 12.0% 100.0% United States (all ages). 8.9% 6.3% 12.3% 12.0% 15.5% 19.0% 11.1% 15.0% 100.0% Source: U.S. Bureau of the Census Percent of Households by Household Income Bracket, 2004 Percent of Households 25.0% 20.0% 15.0% 10.0% 5.0% 0.0% Less than $10,000 $10,000 $14,999 $15,000 $24,999 $25,000 $34,999 $35,000 $49,999 $50,000 $74,999 $75,000 $99,999 $100,000 or more Utah United States 331
336 State and Local General Revenues, FY 2002 Utah Average Annual Revenue Change General Revenues Per Capita Percent of Personal Income (millions) UT US UT US UT US Total General Revenues... $12,499 $5,388 $5, % 19.3% 7.7% 5.6% Own Sources... $9,886 $4,262 $4, % 15.2% 7.6% 5.2% Taxes... $6,026 $2,598 $3, % 10.4% 6.9% 4.9% Property Taxes... $1,420 $612 $ % 3.2% 5.4% 4.5% General Sales Taxes... $1,970 $849 $ % 2.6% 7.3% 5.4% Personal Income Taxes. $1,605 $692 $ % 2.3% 7.5% 5.8% Other Taxes... $1,031 $444 $ % 2.3% 7.7% 4.3% Charges/Miscellaneous... $3,860 $1,664 $1, % 4.8% 8.6% 5.7% Federal Aid... $2,613 $1,126 $1, % 4.1% 8.1% 7.2% Source: U.S. Bureau of the Census (2002 data are the most current available.) 1992 General Revenue 2002 General Revenue Property Taxes General Sales Taxes Personal Income Taxes Other Taxes 20% 14% 16% 21% 11% 16% Charges/Misc Federal Aid 29% 8% 13% 31% 8% 13% 332
337 Utah I. Personal Income Tax (2004) State Income Tax Base Utah s income tax base is linked federal adjusted gross income. Filing Requirements Taxpayers must file if they are required file a federal tax return. Moreover, taxpayers must file if their gross income equals or exceeds the following: Filing Status Gross Income Single; under age 65 $7,950 Single; age 65 or older $9,150 Married, filing jointly; both spouses under age 65 $15,900 Married, filing jointly; one spouse age 65 or older $16,850 Married, filing jointly; both spouses age 65 or older $17,800 Rate Structure Single Married, Filing Jointly Taxable Income Rate Taxable Income Rate First $ % First $1, % $864 - $1, % $1,727 - $3, % $1,727 - $2, % $3,451 - $5, % $2,589 - $3, % $5,177 - $6, % $3,451 - $4, % $6,901 - $8, % Over $4, % Over $8, % Public and Private Pension Exemptions Persons under age 65 may exempt up $4,800 on pension and annuity income and taxable Social Security benefits. Persons age 65 or over may exempt up $7,500 on all income sources. Exemptions are reduced by 50 cents for each $1 of adjusted gross income (and certain interest income) that exceeds $25,000 (single) and $32,000 (married, filing jointly). Social Security Benefits Only taxpayers whose provisional income* is $25,000 or higher (single) or $32,000 or higher (married, filing jointly) are subject taxation of their Social Security benefits. *Provisional income consists of federal adjusted gross income, tax-exempt interest, certain foreign-source income, and one-half of the taxpayer s Social Security or Railroad Retirement Tier 1 benefit (U.S. House Committee on the Budget, Omnibus Budget Reconciliation Act of 1993, 103 rd Congress, 1 st sess., 1993, Conference Report , p. 594). Sources: AARP 2005 telephone survey of state legislative staff, state departments of revenue, state controllers offices, state assessors offices, and state treasury offices. 333
338 Utah Standard Deductions and Personal Exemptions Combined Under age 65*... $6,950 (single); $12,350 (married, filing jointly) Age 65 or older*... $8,100 (single); $14,050 (married, filing jointly, where both spouses are age 65 or older) *Personal exemptions equal $2,250 per exemption (75% of federal exemption). Taxpayers with federal adjusted gross income greater than $137,300 (single) or $206,000 (married, filing jointly) receive lower personal exemption amounts. Health Insurance Deduction Taxpayers may deduct 100% of their health insurance premiums; however, they cannot deduct premiums that were itemized or deducted from federal taxable income. Further, they cannot deduct premiums if they or their spouses are eligible participate in a health plan that is fully or partially funded by an employer or former employer. Long-Term Care Insurance Premium Deduction Taxpayers may deduct long-term care insurance premiums provided that they have not been deducted for federal income tax purposes. Medical Savings Account (MSA) Deduction Taxpayers may subtract contributions an MSA as long as the contributions were not already deducted on their federal return. Other Deductions... One-half of federal taxes paid Local Income Taxes...None II. General Sales Tax Rates (2004) State % Combined state/local tax rates % 8.75% III. Miscellaneous Tax Rates (2004) Corporate income (highest marginal rate) % Gasoline (per gallon)... $0.245 Cigarette (per pack of 20)... $0.695 Beer (per gallon)... $0.355 (3.2% alcohol) Sources: AARP 2005 telephone survey of state legislative staff, state departments of revenue, state controllers offices, state assessors offices, and state treasury offices. 334
339 Utah IV. Real Property Tax Relief Programs (2005) Homestead Exemption or Credit Requirements Benefits Disabled veterans... Up $200,000 taxable value Blind persons... Up $11,500 taxable value Indigent hardship... Local option abate 50% of tax, up $676, if income is less than $25,369 for homeowners age 65 and older Circuit Breaker Requirements Benefits Homeowners and renters age 65 or older or widowed whose income is $25,369 or less... Homeowners: Up a $676 tax credit plus an additional credit equal the tax on 20% of the fair market value; renters: up a $676 tax credit Deferral Program (local option program) Requirements Benefits Homeowners age 65 or older or disabled whose income is less than $25, Defer up all property taxes V. Real Property Tax Limits, Caps, or Freezes (2005) Utah has a number of statury maximum tax rates for various tax districts. Examples of these rates are shown below: Schools (basic levy)... Set by the Utah State Tax Commission and the State Office of Education Cities (general purposes)... $7 per $1,000 of taxable value Counties (general purposes)... $3.20 per $1,000 of taxable value* County libraries... $1 per $1,000 of taxable value Fire protection districts... $0.80 per $1,000 of taxable value State assessing and collecting... $0.30 per $1,000 of taxable value The above rates do not apply bonded indebtedness. *If tal taxable value is more than $100 million; otherwise, this limit does not apply. Sources: AARP 2005 telephone survey of state legislative staff, state departments of revenue, state controllers offices, state assessors offices, and state treasury offices. 335
340 State and Local General Expenditures, FY 2002 General Expenditures Utah Average Annual Expenditure Change Percent of Personal Per Capita Income (millions) UT US UT US UT US State/Local Direct General Expends... $12,861 $5,544 $6, % 19.9% 8.3% 5.9% To State/Local Government... $12,861 $5,544 $6, % 19.9% 8.3% 5.9% Education*... $5,196 $2,240 $2, % 6.8% 7.7% 6.2% Public Welfare... $1,595 $688 $ % 3.2% 8.9% 6.1% Health and Hospitals... $858 $370 $ % 1.7% 7.7% 5.2% Highways... $1,017 $438 $ % 1.3% 9.2% 5.5% Public Safety*... $1,025 $442 $ % 1.8% 9.8% 6.3% Environment... $886 $382 $ % 1.2% 9.5% 5.1% Interest on General Debt... $425 $183 $ % 0.9% 3.1% 3.1% Other... $1,857 $801 $ % 3.0% 9.3% 6.5% To Federal Government... $0 $0 $15 0.0% 0.1% -12.1% 1.9% *Education includes higher and lower education; public safety includes police, fire, corrections, and protection and inspection. Source: U.S. Bureau of the Census (2002 data are the most current available.) State and Local General Expenditures, FY 2002 (excluding payments federal government) 14% 3% 7% 8% 8% 41% Education Public Welfare Health and Hospitals Highways Public Safety Environment Interest on General Debt Other 7% 12% Total Debt Outstanding Long-term Debt Short-term Debt 2002 Debt Ratio Measures Per $1,000 Debt (billions) Per Capita of Personal Income Debt (billions) Percent of Total Debt (billions) Percent of Total Utah (State and Local)... $13.2 $5,712 $ $ % $ % United States... $1,681.4 $5,839 $ $1, % $ % Source: U.S. Bureau of the Census 336
341 THIS PAGE INTENTIONALLY LEFT BLANK 337
342 Vermont Economic Indicars Average Annual Change VT US VT US VT US Per Capita Income... $20,226 $22,172 $31,737 $33, % 4.1% Median Household Income... $35,802 $32,264 $47,487 $44, % 3.2% Gross State Product (in millions)... $13,717 $6,865,513 $21,921 $11,665, % 5.4% Full- and Part-Time Positions (in thousands) , , % 1.6% Employed Persons (in thousands) , , % 1.2% Unemployment Rate % 6.1% 3.7% 5.5% n/a n/a Sources: U.S. Bureau of the Census, U.S. Bureau of Economic Analysis, and the U.S. Bureau of Labor Statistics 2004 Population Under Age 18 6% 5% Males 23% 7% 8% Females 21% Ages Ages Ages 75 and Over 66% 64% Population Poverty Rate Population and Poverty Percentage Change VT VT VT US VT US Total Population , , % 12.8% 9.0% 13.1% Males , , % 13.8% 7.6% 11.6% Under Age ,452 69, % 7.8% 10.0% 18.3% Ages , , % 16.7% 7.1% 9.6% Ages ,457 19, % 1.6% 4.5% 6.5% Ages 75 and Over... 11,124 15, % 28.8% 8.8% 6.8% Females , , % 11.9% 10.4% 14.5% Under Age ,440 65, % 8.1% 13.5% 18.6% Ages , , % 14.6% 9.7% 13.6% Ages ,994 21, % -3.6% 7.5% 9.7% Ages 75 and Over... 20,302 24, % 19.6% 10.6% 13.3% Source: U.S. Bureau of the Census 338
343 Vermont Percent Distribution of Households by Age of Householder and Income, 2004 Less than $10,000 $10,000 $14,999 $15,000 $24,999 $25,000 $34,999 $35,000 $49,999 $50,000 $74,999 $75,000 $99,999 $100,000 or more All Households Age of Householder Under 25 years % 7.6% 19.1% 21.2% 23.3% 8.3% 2.2% 0.6% 100.0% years % 3.6% 9.4% 11.5% 19.2% 26.7% 13.4% 10.4% 100.0% years % 4.0% 7.1% 10.7% 16.3% 24.2% 14.5% 18.2% 100.0% 65 years and over % 13.0% 21.5% 14.3% 13.8% 14.4% 4.5% 6.7% 100.0% Vermont (all ages) % 5.8% 11.4% 12.2% 17.1% 22.3% 11.5% 12.4% 100.0% United States (all ages). 8.9% 6.3% 12.3% 12.0% 15.5% 19.0% 11.1% 15.0% 100.0% Source: U.S. Bureau of the Census Percent of Households by Household Income Bracket, 2004 Percent of Households 25.0% 20.0% 15.0% 10.0% 5.0% 0.0% Less than $10,000 $10,000 $14,999 $15,000 $24,999 $25,000 $34,999 $35,000 $49,999 $50,000 $74,999 $75,000 $99,999 $100,000 or more Vermont United States 339
344 State and Local General Revenues, FY 2002 Vermont Average Annual Revenue Change General Revenues Per Capita Percent of Personal Income (millions) VT US VT US VT US Total General Revenues... $3,857 $6,257 $5, % 19.3% 5.0% 5.6% Own Sources... $2,770 $4,494 $4, % 15.2% 4.1% 5.2% Taxes... $1,965 $3,188 $3, % 10.4% 4.0% 4.9% Property Taxes... $824 $1,336 $ % 3.2% 3.9% 4.5% General Sales Taxes... $215 $348 $ % 2.6% 3.2% 5.4% Personal Income Taxes. $408 $662 $ % 2.3% 4.2% 5.8% Other Taxes... $519 $842 $ % 2.3% 4.5% 4.3% Charges/Miscellaneous... $805 $1,306 $1, % 4.8% 4.2% 5.7% Federal Aid... $1,087 $1,763 $1, % 4.1% 7.7% 7.2% Source: U.S. Bureau of the Census 1992 General Revenue 2002 General Revenue Property Taxes General Sales Taxes Personal Income Taxes Other Taxes 22% 23% 7% 28% 21% 6% Charges/Misc Federal Aid 23% 14% 11% 21% 13% 11% 340
345 Vermont I. Personal Income Tax (2004) State Income Tax Base Vermont s income tax base is linked federal taxable income. Filing Requirements Generally, taxpayers must file if they are required file a federal tax return and received more than $100 of Vermont income. Rate Structure Single Married, Filing Jointly Taxable Income Rate Taxable Income Rate First $29, % First $48, % $29,051 - $70, % $48,501 - $117, % $70,351 - $146, % $117,251 - $178, % $146,751 - $319, % $178,651 - $319, % $319,101 and over 9.5% $319,101 and over 9.5% Public and Private Pension Exemptions... None Social Security Benefits Only taxpayers whose provisional income* is $25,000 or higher (single) or $32,000 or higher (married, filing jointly) are subject taxation of their Social Security benefits. *Provisional income consists of federal adjusted gross income, tax-exempt interest, certain foreign-source income, and one-half of the taxpayer s Social Security or Railroad Retirement Tier 1 benefit (U.S. House Committee on the Budget, Omnibus Budget Reconciliation Act of 1993, 103 rd Congress, 1 st sess., 1993, Conference Report , p. 594). Standard Deductions and Personal Exemptions Combined* Under age 65*... $7,950 (single); $15,900 (married, filing jointly, both spouses are under age 65) Age 65 or older*... $9,150 (single); $17,800 (married, filing jointly, both spouses are age 65 or older) *Personal exemptions equal $3,100 per exemption (single have one exemption and married couples have two). Taxpayers with federal adjusted gross income greater than $142,700 (single) or $214,050 (married, filing jointly) receive lower personal exemption amounts. Local Income Taxes... None Sources: AARP 2005 telephone survey of state legislative staff, state departments of revenue, state controllers offices, state assessors offices, and state treasury offices. 341
346 Vermont II. General Sales Tax Rates (2004) State % (starting on Ocber 1, 2004) Combined state/local tax rates % 7.0% (starting on Ocber 1, 2004)* *The wns of Manchester, Stratn, and Willisn levy a 1% local sales tax. III. Miscellaneous Tax Rates (2004) Corporate income (highest marginal rate) % On income over $250,000 Gasoline (per gallon)... $0.20 Cigarette (per pack of 20)... $1.19 Beer (per gallon)... $0.265 (at the distribur level) IV. Real Property Tax Relief Programs (2005) Homestead Exemption or Credit Requirements Benefits Disabled veterans... $10,000 assessed value Local option increase the exemption $20,000 assessed value Circuit Breaker Requirements Benefits Homeowners and renters whose income is $47,000 or less... The benefit equals the difference between school and municipal property taxes and a percentage (3.5% 5%) of household income or property taxes on the first $15,000 of the home s value (whichever is less); renters receive a tax refund equal the difference between school property taxes and a percentage (3.5% 5%) of household income Sources: AARP 2005 telephone survey of state legislative staff, state departments of revenue, state controllers offices, state assessors offices, and state treasury offices. 342
347 Vermont Homeowner whose income is over $47,000 and less than $75, The benefit equals the difference between school property taxes and a percentage (2.0% 4.5%) of household income. Homeowners whose income is $75,000 $88, The benefit equals the difference between school property taxes (up taxes assessed on the first $160,000 of market value) and a percentage (2.0% 4.5%) of household income. Deferral Program... None V. Real Property Tax Limits, Caps, or Freezes (2005) No statewide limits, caps, or freezes are provided. Sources: AARP 2005 telephone survey of state legislative staff, state departments of revenue, state controllers offices, state assessors offices, and state treasury offices. 343
348 State and Local General Expenditures, FY 2002 General Expenditures Vermont Average Annual Expenditure Change Percent of Personal Per Capita Income (millions) VT US VT US VT US State/Local Direct General Expends... $3,815 $6,188 $6, % 19.9% 5.2% 5.9% To State/Local Government... $3,805 $6,172 $6, % 19.9% 5.2% 5.9% Education*... $1,460 $2,369 $2, % 6.8% 4.9% 6.2% Public Welfare... $757 $1,228 $ % 3.2% 7.4% 6.1% Health and Hospitals... $88 $142 $ % 1.7% 2.6% 5.2% Highways... $362 $588 $ % 1.3% 3.8% 5.5% Public Safety*... $229 $371 $ % 1.8% 6.5% 6.3% Environment... $174 $282 $ % 1.2% 2.8% 5.1% Interest on General Debt... $164 $265 $ % 0.9% 2.4% 3.1% Other... $572 $927 $ % 3.0% 6.0% 6.5% To Federal Government... $10 $16 $15 0.1% 0.1% -1.1% 1.9% *Education includes higher and lower education; public safety includes police, fire, corrections, and protection and inspection. Source: U.S. Bureau of the Census State and Local General Expenditures, FY 2002 (excluding payments federal government) 15% Education Public Welfare 4% 5% 6% 38% Health and Hospitals Highways Public Safety Environment 10% 2% 20% Interest on General Debt Other Total Debt Outstanding Long-term Debt Short-term Debt 2002 Debt Ratio Measures Per $1,000 Debt (billions) Per Capita of Personal Income Debt (billions) Percent of Total Debt (billions) Percent of Total Vermont (State and Local)... $3.2 $5,206 $ $ % $ % United States... $1,681.4 $5,839 $ $1, % $ % Source: U.S. Bureau of the Census 344
349 THIS PAGE INTENTIONALLY LEFT BLANK 345
350 Virginia Economic Indicars Average Annual Change VA US VA US VA US Per Capita Income... $23,305 $22,172 $36,175 $33, % 4.1% Median Household Income... $37,647 $32,264 $51,438 $44, % 3.2% Gross State Product (in millions)... $177,008 $6,865,513 $329,332 $11,665, % 5.4% Full- and Part-Time Positions (in thousands) 3, ,224 4, , % 1.6% Employed Persons (in thousands).. 3, ,060 3, , % 1.2% Unemployment Rate % 6.1% 3.7% 5.5% n/a n/a Sources: U.S. Bureau of the Census, U.S. Bureau of Economic Analysis, and the U.S. Bureau of Labor Statistics 2004 Population Under Age 18 6% 4% Males 25% 6% 7% Females 23% Ages Ages Ages 75 and Over 65% 64% Population Poverty Rate Population and Poverty Percentage Change VA VA VA US VA US Total Population... 6,536,771 7,459, % 12.8% 9.5% 13.1% Males... 3,201,122 3,671, % 13.8% 8.2% 11.6% Under Age , , % 7.8% 13.2% 18.3% Ages ,092,581 2,394, % 16.7% 6.6% 9.6% Ages , , % 1.6% 5.6% 6.5% Ages 75 and Over , , % 28.8% 6.4% 6.8% Females... 3,335,649 3,788, % 11.9% 10.7% 14.5% Under Age , , % 8.1% 12.5% 18.6% Ages ,120,473 2,413, % 14.6% 10.0% 13.6% Ages , , % -3.6% 8.4% 9.7% Ages 75 and Over , , % 19.6% 13.0% 13.3% Source: U.S. Bureau of the Census 346
351 Virginia Percent Distribution of Households by Age of Householder and Income, 2004 Less than $10,000 $10,000 $14,999 $15,000 $24,999 $25,000 $34,999 $35,000 $49,999 $50,000 $74,999 $75,000 $99,999 $100,000 or more All Households Age of Householder Under 25 years % 8.1% 19.8% 15.1% 16.5% 15.0% 3.8% 4.3% 100.0% years % 3.6% 8.5% 11.0% 16.3% 23.4% 14.0% 19.0% 100.0% years % 3.0% 8.6% 9.2% 13.2% 18.8% 14.2% 27.8% 100.0% 65 years and over % 11.0% 19.4% 12.4% 14.2% 14.8% 8.0% 9.0% 100.0% Virginia (all ages) % 5.0% 11.1% 10.8% 14.7% 19.6% 12.4% 19.6% 100.0% United States (all ages). 8.9% 6.3% 12.3% 12.0% 15.5% 19.0% 11.1% 15.0% 100.0% Source: U.S. Bureau of the Census Percent of Households by Household Income Bracket, 2004 Percent of Households 25.0% 20.0% 15.0% 10.0% 5.0% 0.0% Less than $10,000 $10,000 $14,999 $15,000 $24,999 $25,000 $34,999 $35,000 $49,999 $50,000 $74,999 $75,000 $99,999 $100,000 or more Virginia United States 347
352 State and Local General Revenues, FY 2002 Virginia Average Annual Revenue Change General Revenues Per Capita Percent of Personal Income (millions) VA US VA US VA US Total General Revenues... $39,026 $5,365 $5, % 19.3% 6.2% 5.6% Own Sources... $32,791 $4,508 $4, % 15.2% 5.9% 5.2% Taxes... $22,131 $3,043 $3, % 10.4% 5.7% 4.9% Property Taxes... $6,711 $923 $ % 3.2% 4.9% 4.5% General Sales Taxes... $3,587 $493 $ % 2.6% 5.6% 5.4% Personal Income Taxes. $6,711 $923 $ % 2.3% 7.3% 5.8% Other Taxes... $5,123 $704 $ % 2.3% 5.0% 4.3% Charges/Miscellaneous... $10,660 $1,466 $1, % 4.8% 6.4% 5.7% Federal Aid... $6,235 $857 $1, % 4.1% 7.8% 7.2% Source: U.S. Bureau of the Census (2002 data are the most current available.) 1992 General Revenue 2002 General Revenue Property Taxes General Sales Taxes Personal Income Taxes Other Taxes Charges/Misc 26% 14% 19% 10% 28% 16% 17% 9% Federal Aid 16% 17% 15% 13% 348
353 Virginia I. Personal Income Tax (2004) State Income Tax Base Virginia s income tax base is linked federal adjusted gross income. Filing Requirements Taxpayers must file if their Virginia gross income equals or exceeds $5,000 (single) or $8,000 (married, filing jointly) Rate Structure All Taxpayers Taxable Income Rate First $3, % $3,000 - $5, % $5,000 - $17, % Over $17, % Retirement Income (age deduction)* Ages $6,000 deduction from any income source for each spouse age 62 64* Age 65 or older... $12,000 deduction from any income source for each spouse age 65 or older** *Taxpayers born on or between January 2, 1940 and January 1, 1942 are eligible. **Taxpayers born on or before January 1, 1939 are eligible for the entire $12,000 deduction; those born on or between January 2, 1939 and January 1, 1940, receive up a $12,000 deduction (the $12,000 deduction phases out for those whose federal adjusted gross income exceeds $50,000 (single) or $75,000 (married)). Military Retirement Income Veterans who have been awarded the Congressional Medal of Honor can deduct military retirement income. Social Security Benefits... Full exemption Sources: AARP 2005 telephone survey of state legislative staff, state departments of revenue, state controllers offices, state assessors offices, and state treasury offices. 349
354 Virginia Standard Deductions and Personal Exemptions Combined Under age $4,000 (single); $7,800 (married, filing jointly; both spouses are under age 65) Age 65 or older... $4,900 (single); $9,600 (married, filing jointly; both spouses are age 65 or older) Long-Term Care Insurance Premium Deduction Taxpayers may deduct long-term care insurance premiums provided that they have not been deducted for federal income tax purposes. Disability Income Deduction Taxpayers may deduct up $20,000 of disability income reported as wages (or payments in lieu of wages) on their federal return as defined under Internal Revenue Code Section 22. The subtraction applies income received for permanent and tal disability. Taxpayers may not claim both the retirement income deduction and this deduction. Low-Income Tax Credit * Eligibility...Taxpayers whose Virginia adjusted gross income is below federal poverty guidelines Benefits...$300 per exemption *The low-income tax credit is non-refundable and may not be claimed if a taxpayer or his/her spouse or any of his/her dependents claimed any of the following state tax breaks: retirement deduction (otherwise known as the age deduction), Virginia National Guard deduction, military pay subtraction, subtraction for state and federal employees whose salary is $15,000 or less, and an additional exemption for taxpayers who are age 65 and older or blind. In addition, someone who is claimed as a dependent on another taxpayer s return cannot claim this credit. Local Income Taxes... None II. General Sales Tax Rates (2004) State % Combined state/local tax rates % Sources: AARP 2005 telephone survey of state legislative staff, state departments of revenue, state controllers offices, state assessors offices, and state treasury offices. 350
355 Virginia III. Miscellaneous Tax Rates (2004) Corporate income (highest marginal rate) % On all taxable income Gasoline (per gallon)... $0.177 An additional 2% sales tax applies in the Northern Virginia Transportation District. Cigarette (per pack of 20)... $0.20* Local taxes, where levied, are additional. Beer (per gallon)... $0.02 (Small bottles); $ (large bottles) *Effective September 1, 2004, the cigarette tax rate increased 20 cents per pack. It will increase $0.30 per pack on July 1, IV. Real Property Tax Relief Programs (2005) Homestead Exemption or Credit (local option program) Requirements Homeowners age 65 or older or disabled whose income is at or below $50,000 and whose net worth is below $200,000 (excluding dwelling plus 10 acres surrounding dwelling) can receive a tax refund up all of their property taxes. Some Northern Virginian jurisdictions allow the same tax refund for persons with incomes below $72,000 and whose net worth is below $340,000 (excluding dwelling plus 25 acres surrounding dwelling). Circuit Breaker... None Deferral Program (local option program) Requirements Homeowners age 65 or older or disabled with incomes at or below $30,000 and whose net worth is below $100,000 (excluding dwelling) can defer up all of their property taxes. Some Northern Virginia jurisdictions provide tax deferrals for homeowners with incomes below $72,000 and whose net worth is below $340,000 (excluding dwelling plus 25 acres surrounding dwelling). All homeowners can defer property taxes that exceed 105% (or more) of prior year s tax. V. Real Property Tax Limits, Caps, or Freezes (2005) No statewide limits, caps, or freezes are provided. Sources: AARP 2005 telephone survey of state legislative staff, state departments of revenue, state controllers offices, state assessors offices, and state treasury offices. 351
356 State and Local General Expenditures, FY 2002 General Expenditures Virginia Average Annual Expenditure Change Percent of Personal Per Capita Income (millions) VA US VA US VA US State/Local Direct General Expends... $39,269 $5,399 $6, % 19.9% 6.2% 5.9% To State/Local Government... $39,267 $5,399 $6, % 19.9% 6.2% 5.9% Education*... $15,149 $2,083 $2, % 6.8% 6.5% 6.2% Public Welfare... $4,674 $643 $ % 3.2% 7.2% 6.1% Health and Hospitals... $3,184 $438 $ % 1.7% 5.5% 5.2% Highways... $3,102 $426 $ % 1.3% 5.8% 5.5% Public Safety*... $3,555 $489 $ % 1.8% 6.1% 6.3% Environment... $2,152 $296 $ % 1.2% 4.6% 5.1% Interest on General Debt... $1,706 $234 $ % 0.9% 3.6% 3.1% Other... $5,746 $790 $ % 3.0% 7.2% 6.5% To Federal Government... $2 $0 $15 0.0% 0.1% n/a 1.9% *Education includes higher and lower education; public safety includes police, fire, corrections, and protection and inspection. Source: U.S. Bureau of the Census (2002 data are the most current available.) State and Local General Expenditures, FY 2002 (excluding payments federal government) 15% 4% 5% 9% 8% 8% 12% 39% Education Public Welfare Health and Hospitals Highways Public Safety Environment Interest on General Debt Other Total Debt Outstanding Long-term Debt Short-term Debt 2002 Debt Ratio Measures Per $1,000 Debt (billions) Per Capita of Personal Income Debt (billions) Percent of Total Debt (billions) Percent of Total Virginia (State and Local)... $35.4 $4,870 $ $ % $ % United States... $1,681.4 $5,839 $ $1, % $ % Source: U.S. Bureau of the Census 352
357 THIS PAGE INTENTIONALLY LEFT BLANK 353
358 Washingn Economic Indicars Average Annual Change WA US WA US WA US Per Capita Income... $22,938 $22,172 $35,017 $33, % 4.1% Median Household Income... $33,533 $32,264 $49,820 $44, % 3.2% Gross State Product (in millions)... $146,726 $6,865,513 $261,549 $11,665, % 5.4% Full- and Part-Time Positions (in thousands) 3, ,224 3, , % 1.6% Employed Persons (in thousands)... 2, ,060 3, , % 1.2% Unemployment Rate % 6.1% 6.2% 5.5% n/a n/a Sources: U.S. Bureau of the Census, U.S. Bureau of Economic Analysis, and the U.S. Bureau of Labor Statistics 2004 Population Under Age 18 6% 4% Males 25% 6% Females 7% 23% Ages Ages Ages 75 and Over 65% 64% Population Poverty Rate Population and Poverty Percentage Change WA WA WA US WA US Total Population... 5,334,896 6,203, % 12.8% 13.1% 13.1% Males... 2,648,185 3,094, % 13.8% 12.5% 11.6% Under Age , , % 7.8% 18.1% 18.3% Ages ,666,250 2,027, % 16.7% 11.4% 9.6% Ages , , % 1.6% 5.6% 6.5% Ages 75 and Over , , % 28.8% 5.7% 6.8% Females... 2,686,711 3,109, % 11.9% 13.8% 14.5% Under Age , , % 8.1% 16.3% 18.6% Ages ,647,490 1,986, % 14.6% 13.5% 13.6% Ages , , % -3.6% 9.2% 9.7% Ages 75 and Over , , % 19.6% 10.7% 13.3% Source: U.S. Bureau of the Census 354
359 Washingn Percent Distribution of Households by Age of Householder and Income, 2004 Less than $10,000 $10,000 $14,999 $15,000 $24,999 $25,000 $34,999 $35,000 $49,999 $50,000 $74,999 $75,000 $99,999 $100,000 or more All Households Age of Householder Under 25 years % 9.6% 17.3% 17.9% 18.0% 10.5% 3.0% 2.2% 100.0% years % 4.9% 9.1% 11.2% 16.5% 23.1% 13.5% 15.5% 100.0% years % 3.5% 7.4% 8.7% 14.2% 20.8% 15.8% 22.1% 100.0% 65 years and over % 11.2% 18.8% 15.1% 16.1% 16.1% 7.0% 5.8% 100.0% Washingn (all ages) % 5.8% 10.7% 11.4% 15.7% 20.2% 12.5% 15.4% 100.0% United States (all ages). 8.9% 6.3% 12.3% 12.0% 15.5% 19.0% 11.1% 15.0% 100.0% Source: U.S. Bureau of the Census Percent of Households by Household Income Bracket, 2004 Percent of Households 25.0% 20.0% 15.0% 10.0% 5.0% 0.0% Less than $10,000 $10,000 $14,999 $15,000 $24,999 $25,000 $34,999 $35,000 $49,999 $50,000 $74,999 $75,000 $99,999 $100,000 or more Washingn United States 355
360 State and Local General Revenues, FY 2002 Washingn Average Annual Revenue Change General Revenues Per Capita Percent of Personal Income (millions) WA US WA US WA US Total General Revenues... $36,345 $5,990 $5, % 19.3% 6.0% 5.6% Own Sources... $29,303 $4,830 $4, % 15.2% 5.7% 5.2% Taxes... $19,514 $3,216 $3, % 10.4% 5.1% 4.9% Property Taxes... $5,791 $954 $ % 3.2% 5.3% 4.5% General Sales Taxes... $9,231 $1,522 $ % 2.6% 4.8% 5.4% Personal Income Taxes. $0 $0 $ % 2.3% 0.0% 5.8% Other Taxes... $4,492 $740 $ % 2.3% 5.3% 4.3% Charges/Miscellaneous... $9,790 $1,614 $1, % 4.8% 7.0% 5.7% Federal Aid... $7,042 $1,161 $1, % 4.1% 7.8% 7.2% Source: U.S. Bureau of the Census (2002 data are the most current available.) $4, General Revenue 2002 General Revenue Property Taxes 16% 17% 19% 16% General Sales Taxes Other Taxes Charges/Misc Federal Aid 25% 29% 28% 25% 13% 12% 356
361 Washingn I. Personal Income Tax (2004) No state or local personal income tax is levied. II. General Sales Tax Rates (2004) State % Combined state/local tax rates % 8.9% III. Miscellaneous Tax Rates (2004) Corporate income (highest marginal rate)... No tax Gasoline (per gallon)... $0.23 Cigarette (per pack of 20)... $1.425 Local taxes where levied are additional Beer (per gallon)... $0.154 (Small breweries) and $0.26 (large breweries) IV. Real Property Tax Relief Programs (2005) Homestead Exemption or Credit... None Circuit Breaker Requirements Benefits Homeowners age 61 or older or disabled whose income is $35,000 or less... Up 60% of tal assessed value or $50,000 assessed value (whichever is greater) Deferral Program Requirements Benefits Homeowners age 60 or older with an income of $40,000 or less... Defer 80% of the equity value Sources: AARP 2005 telephone survey of state legislative staff, state departments of revenue, state controllers offices, state assessors offices, and state treasury offices. 357
362 Washingn V. Real Property Tax Limits, Caps, or Freezes (2005) Non-School District Limits The aggregate or combined property tax rate for all local taxing districts cannot exceed $10 per $1,000 of market value. Property taxes cannot increase annually by more than 1% or inflation (whichever is less). However, for districts with a population of less than 10,000, property taxes collected cannot increase annually by more than 1%. These limitations do not pertain new construction or bonded indebtedness and can be removed with voter approval. School District Limits Local school districts cannot impose property taxes without voter approval. Freeze on Assessed Property Values Homeowners age 61 or older or disabled with incomes of less than $30,000 qualify for having their assessed property values frozen. Sources: AARP 2005 telephone survey of state legislative staff, state departments of revenue, state controllers offices, state assessors offices, and state treasury offices. 358
363 Washingn State and Local General Expenditures, FY 2002 General Expenditures Average Annual Expenditure Change Percent of Per Capita Personal Income (millions) WA US WA US WA US State/Local Direct General Expends... $38,657 $6,372 $6, % 19.9% 5.9% 5.9% To State/Local Government... $38,646 $6,370 $6, % 19.9% 5.9% 5.9% Education*... $12,866 $2,121 $2, % 6.8% 5.2% 6.2% Public Welfare... $6,198 $1,022 $ % 3.2% 8.4% 6.1% Health and Hospitals... $4,013 $661 $ % 1.7% 7.4% 5.2% Highways... $2,376 $392 $ % 1.3% 5.3% 5.5% Public Safety*... $3,316 $547 $ % 1.8% 5.0% 6.3% Environment... $2,988 $493 $ % 1.2% 4.0% 5.1% Interest on General Debt... $1,539 $254 $ % 0.9% 5.3% 3.1% Other... $5,349 $882 $ % 3.0% 6.5% 6.5% To Federal Government... $11 $2 $15 0.0% 0.1% -8.3% 1.9% *Education includes higher and lower education; public safety includes police, fire, corrections, and protection and inspection. Source: U.S. Bureau of the Census (2002 data are the most current available.) State and Local General Expenditures, FY 2002 (excluding payments federal government) 14% Education 8% 9% 4% 33% Public Welfare Health and Hospitals Highways Public Safety Environment 6% 10% 16% Interest on General Debt Other Total Debt Outstanding Long-term Debt Short-term Debt 2002 Debt Ratio Measures Per $1,000 Debt (billions) Per Capita of Personal Income Debt (billions) Percent of Total Debt (billions) Percent of Total Washingn (State and Local)... $45.6 $7,509 $ $ % $ % United States... $1,681.4 $5,839 $ $1, % $ % Source: U.S. Bureau of the Census 359
364 West Virginia Economic Indicars Average Annual Change WV US WV US WV US Per Capita Income... $17,194 $22,172 $25,681 $33, % 4.1% Median Household Income... $23,564 $32,264 $33,286 $44, % 3.2% Gross State Product (in millions)... $34,855 $6,865,513 $49,454 $11,665, % 5.4% Full- and Part-Time Positions (in thousands) , , % 1.6% Employed Persons (in thousands) , , % 1.2% Unemployment Rate % 6.1% 5.3% 5.5% n/a n/a Sources: U.S. Bureau of the Census, U.S. Bureau of Economic Analysis, and the U.S. Bureau of Labor Statistics 2004 Population Under Age 18 7% 6% Males 22% 8% 9% Females 20% Ages Ages Ages 75 and Over 65% 63% Population Poverty Rate Population and Poverty Percentage Change WV WV WV US WV US Total Population...1,818,490 1,815, % 12.8% 17.9% 13.1% Males , , % 13.8% 16.3% 11.6% Under Age , , % 7.8% 25.3% 18.3% Ages , , % 16.7% 14.9% 9.6% Ages ,169 65, % 1.6% 8.5% 6.5% Ages 75 and Over... 41,809 51, % 28.8% 6.4% 6.8% Females , , % 11.9% 19.4% 14.5% Under Age , , % 8.1% 23.4% 18.6% Ages , , % 14.6% 19.2% 13.6% Ages ,239 78, % -3.6% 12.8% 9.7% Ages 75 and Over... 77,168 82, % 19.6% 18.2% 13.3% Source: U.S. Bureau of the Census 360
365 West Virginia Percent Distribution of Households by Age of Householder and Income, 2004 Less than $10,000 $10,000 $14,999 $15,000 $24,999 $25,000 $34,999 $35,000 $49,999 $50,000 $74,999 $75,000 $99,999 $100,000 or more All Households Age of Householder Under 25 years % 9.4% 17.4% 17.7% 11.2% 7.5% 1.4% 1.4% 100.0% years % 7.1% 15.7% 10.7% 18.5% 20.2% 9.8% 6.2% 100.0% years % 7.9% 14.0% 13.2% 15.2% 17.9% 9.4% 10.7% 100.0% 65 years and over % 16.6% 21.9% 18.3% 13.2% 8.6% 3.5% 2.3% 100.0% West Virginia (all ages) % 9.8% 16.6% 13.9% 15.6% 15.9% 7.7% 6.7% 100.0% United States (all ages). 8.9% 6.3% 12.3% 12.0% 15.5% 19.0% 11.1% 15.0% 100.0% Source: U.S. Bureau of the Census Percent of Households by Household Income Bracket, 2004 Percent of Households 20.0% 18.0% 16.0% 14.0% 12.0% 10.0% 8.0% 6.0% 4.0% 2.0% 0.0% Less than $10,000 $10,000 $14,999 $15,000 $24,999 $25,000 $34,999 $35,000 $49,999 $50,000 $74,999 $75,000 $99,999 $100,000 or more West Virginia United States 361
366 State and Local General Revenues, FY 2002 West Virginia Average Annual Revenue Change General Revenues Per Capita Percent of Personal Income (millions) WV US WV US WV US Total General Revenues... $10,111 $5,601 $5, % 19.3% 5.3% 5.6% Own Sources... $7,112 $3,940 $4, % 15.2% 4.7% 5.2% Taxes... $4,641 $2,571 $3, % 10.4% 4.4% 4.9% Property Taxes... $901 $499 $ % 3.2% 5.4% 4.5% General Sales Taxes... $963 $533 $ % 2.6% 1.9% 5.4% Personal Income Taxes. $1,035 $573 $ % 2.3% 5.4% 5.8% Other Taxes... $1,743 $965 $ % 2.3% 5.1% 4.3% Charges/Miscellaneous... $2,471 $1,369 $1, % 4.8% 5.2% 5.7% Federal Aid... $2,999 $1,661 $1, % 4.1% 6.8% 7.2% Source: U.S. Bureau of the Census (2002 data are the most current available.) 1992 General Revenue 2002 General Revenue Property Taxes 9% 9% General Sales Taxes Personal Income Taxes Other Taxes 25% 13% 10% 30% 10% 10% Charges/Misc Federal Aid 25% 18% 24% 17% 362
367 West Virginia I. Personal Income Tax (2004) State Income Tax Base West Virginia s income tax base is linked federal adjusted gross income. Filing Requirements Taxpayers must file if they filed a federal return or if their West Virginia adjusted gross income is greater than their personal exemptions ($2,000 per exemption) or $500 if they claimed zero exemptions. Rate Structure Single or Married, Filing Jointly Married, Filing Separately Taxable Income Rate Taxable Income Rate First $10, % First $5, % $10,000 - $25, % $5,000 - $12, % $25,000 - $40, % $12,500 - $20, % $40,000 - $60, % $20,000 - $30, % Over $60, % Over $30, % Public Pension Exemption $2,000 pension exemption; some West Virginia public safety officials receive a full pension exemption. Military Pension Exemption In addition the $2,000 pension exemption, military retirees can receive up a $20,000 exemption for military pension income. Private Pension Exemption... None Income Exemption Persons age 65 or older or disabled can exclude up $8,000 from any income source, but the public and military pension exemptions count ward the $8,000 exemption. Sources: AARP 2005 telephone survey of state legislative staff, state departments of revenue, state controllers offices, state assessors offices, and state treasury offices. 363
368 West Virginia Social Security Benefits Only taxpayers whose provisional income* is $25,000 or higher (single) or $32,000 or higher (married, filing jointly) are subject taxation of their Social Security benefits. *Provisional income consists of federal adjusted gross income, tax-exempt interest, certain foreign-source income, and one-half of the taxpayer s Social Security or Railroad Retirement Tier 1 benefit (U.S. House Committee on the Budget, Omnibus Budget Reconciliation Act of 1993, 103 rd Congress, 1 st sess., 1993, Conference Report , p. 594). Long-Term Care Insurance Deduction Taxpayers can deduct premiums as long as they were not already claimed as deductions on the federal return for calculating federal adjusted gross income. Medical Savings Account Deduction Taxpayers can deduct up $2,000 in contributions a West Virginia medical savings account as long as those contributions were not already claimed as deductions for calculating federal adjusted gross income. Interest earned on the account is also tax deductible. Personal Exemptions All ages... $2,000 (single); $4,000 (married, filing jointly) Local Income Taxes... None II. General Sales Tax Rates (2004) State...6.0% Combined state/local tax rates...6.0% III. Miscellaneous Tax Rates (2004) Corporate income (highest marginal rate) % On all taxable income Gasoline (per gallon)... $0.254 Cigarette (per pack of 20)... $0.55 Local taxes, where levied, are additional. Beer (per gallon)... $0.177 The tax affects beer not exceeding 3.2% alcohol by weight. Sources: AARP 2005 telephone survey of state legislative staff, state departments of revenue, state controllers offices, state assessors offices, and state treasury offices. 364
369 West Virginia IV. Real Property Tax Relief Programs (2005) Homestead Exemption Requirements Benefits Age 65 or older or disabled... $20,000 assessed value Homestead Credit Age 65 or older or disabled who benefit from the homestead exemption program and whose federal adjusted gross income is equal or less than 150% of the federal poverty guidelines (e.g., $14,355 for a household size of one and $19,245 for a household size of two)... Refundable income tax credit equal the amount of property taxes paid on the first $10,000 of taxable assessed value over the $20,000 homestead exemption Circuit Breaker Requirements Benefits Homeowners and renters age 65 or older whose income is $5,000 or less... $125 tax credit Deferral Program... None V. Real Property Tax Limits, Caps, or Freezes (2005) Residential property tax rates cannot exceed $1.00 per $100 of assessed value (current levy limit). Residents can vote increase property tax rates up 100% (schools) or 50% (counties and municipalities) over the current levy limit (known as the excess levy). Residents can also vote approve higher property tax rates finance bonded indebtedness. The current levy limit does not include bonded indebtedness. Property tax revenues for each county generally cannot increase annually by more than 3%, depending on the county, because of higher assessed property values (levy rollback). This does not apply bonded indebtedness, new construction, additions existing property, or excess levies. Moreover, counties and municipalities can hold a public hearing raise property tax collections generally up a 12% annual increase as long as it conforms the current levy limit. The state legislature can increase property taxes for school purposes beyond the levy rollback through a public hearing as long as it conforms the current levy limit. Sources: AARP 2005 telephone survey of state legislative staff, state departments of revenue, state controllers offices, state assessors offices, and state treasury offices. 365
370 State and Local General Expenditures, FY 2002 General Expenditures West Virginia Average Annual Expenditure Change Percent of Personal Per Capita Income (millions) WV US WV US WV US State/Local Direct General Expends... $9,848 $5,455 $6, % 19.9% 5.2% 5.9% To State/Local Government... $9,848 $5,455 $6, % 19.9% 5.2% 5.9% Education*... $3,519 $1,949 $2, % 6.8% 4.6% 6.2% Public Welfare... $2,139 $1,185 $ % 3.2% 6.9% 6.1% Health and Hospitals... $516 $286 $ % 1.7% 2.3% 5.2% Highways... $1,041 $576 $ % 1.3% 6.7% 5.5% Public Safety*... $498 $276 $ % 1.8% 9.0% 6.3% Environment... $476 $264 $ % 1.2% 4.0% 5.1% Interest on General Debt... $446 $247 $ % 0.9% 0.5% 3.1% Other... $1,213 $672 $ % 3.0% 5.6% 6.5% To Federal Government... $0 $0 $15 0.0% 0.1% 0.0% 1.9% *Education includes higher and lower education; public safety includes police, fire, corrections, and protection and inspection. Source: U.S. Bureau of the Census (2002 data are the most current available.) State and Local General Expenditures, FY 2002 (excluding payments federal government) 5% 5% 12% 35% Education Public Welfare Health and Hospitals Highways 5% Public Safety Environment 11% Interest on General Debt 5% 22% Other Total Debt Outstanding Long-term Debt Short-term Debt 2002 Debt Ratio Measures Per $1,000 Debt (billions) Per Capita of Personal Income Debt (billions) Percent of Total Debt (billions) Percent of Total West Virginia (State and Local)... $8.1 $4,478 $ $ % $ % United States... $1,681.4 $5,839 $ $1, % $ % Source: U.S. Bureau of the Census 366
371 THIS PAGE INTENTIONALLY LEFT BLANK 367
372 Wisconsin Economic Indicars Average Annual Change WI US WI US WI US Per Capita Income... $21,413 $22,172 $32,063 $33, % 4.1% Median Household Income... $35,388 $32,264 $45,931 $44, % 3.2% Gross State Product (in millions)... $128,394 $6,865,513 $211,616 $11,665, % 5.4% Full- and Part-Time Positions (in thousands) 3, ,224 3, , % 1.6% Employed Persons (in thousands).. 2, ,060 2, , % 1.2% Unemployment Rate % 6.1% 4.9% 5.5% n/a n/a Sources: U.S. Bureau of the Census, U.S. Bureau of Economic Analysis, and the U.S. Bureau of Labor Statistics 2004 Population Under Age 18 6% 5% Males 25% 7% 8% Females 23% Ages Ages Ages 75 and Over 64% 62% Population Poverty Rate Population and Poverty Percentage Change WI WI WI US WI US Total Population... 5,095,504 5,509, % 12.8% 10.7% 13.1% Males... 2,499,268 2,726, % 13.8% 9.4% 11.6% Under Age , , % 7.8% 13.2% 18.3% Ages ,530,918 1,756, % 16.7% 8.5% 9.6% Ages , , % 1.6% 3.6% 6.5% Ages 75 and Over , , % 28.8% 8.2% 6.8% Females... 2,596,236 2,782, % 11.9% 12.1% 14.5% Under Age , , % 8.1% 14.8% 18.6% Ages ,543,118 1,728, % 14.6% 11.7% 13.6% Ages , , % -3.6% 4.9% 9.7% Ages 75 and Over , , % 19.6% 13.0% 13.3% Source: U.S. Bureau of the Census 368
373 Wisconsin Percent Distribution of Households by Age of Householder and Income, 2004 Less than $10,000 $10,000 $14,999 $15,000 $24,999 $25,000 $34,999 $35,000 $49,999 $50,000 $74,999 $75,000 $99,999 $100,000 or more All Households Age of Householder Under 25 years % 13.2% 15.9% 15.4% 15.4% 16.2% 2.0% 0.4% 100.0% years % 4.2% 8.2% 10.9% 19.3% 27.3% 13.4% 11.3% 100.0% years % 3.2% 8.5% 9.9% 15.7% 24.3% 15.6% 17.1% 100.0% 65 years and over % 14.3% 21.9% 16.1% 16.5% 11.9% 4.6% 4.3% 100.0% Wisconsin (all ages) % 6.5% 11.6% 11.9% 17.2% 22.3% 11.6% 11.2% 100.0% United States (all ages). 8.9% 6.3% 12.3% 12.0% 15.5% 19.0% 11.1% 15.0% 100.0% Source: U.S. Bureau of the Census Percent of Households by Household Income Bracket, 2004 Percent of Households 25.0% 20.0% 15.0% 10.0% 5.0% 0.0% Less than $10,000 $10,000 $14,999 $15,000 $24,999 $25,000 $34,999 $35,000 $49,999 $50,000 $74,999 $75,000 $99,999 $100,000 or more Wisconsin United States 369
374 State and Local General Revenues, FY 2002 Wisconsin Average Annual Revenue Change General Revenues Per Capita Percent of Personal Income (millions) WI US WI US WI US Total General Revenues... $32,555 $5,984 $5, % 19.3% 5.5% 5.6% Own Sources... $26,100 $4,797 $4, % 15.2% 5.1% 5.2% Taxes... $18,610 $3,421 $3, % 10.4% 4.9% 4.9% Property Taxes... $6,466 $1,189 $ % 3.2% 4.9% 4.5% General Sales Taxes... $3,914 $719 $ % 2.6% 5.9% 5.4% Personal Income Taxes. $4,974 $914 $ % 2.3% 4.7% 5.8% Other Taxes... $3,256 $599 $ % 2.3% 4.2% 4.3% Charges/Miscellaneous... $7,490 $1,377 $1, % 4.8% 5.8% 5.7% Federal Aid... $6,456 $1,187 $1, % 4.1% 7.3% 7.2% Source: U.S. Bureau of the Census (2002 data are the most current available.) 1992 General Revenue 2002 General Revenue Property Taxes General Sales Taxes Personal Income Taxes Other Taxes Charges/Misc 22% 17% 21% 12% 23% 20% 20% 12% Federal Aid 11% 17% 10% 15% 370
375 Wisconsin I. Personal Income Tax (2004) State Income Tax Base Wisconsin s income tax base is linked federal adjusted gross income. Filing Requirements Taxpayers must file if their Wisconsin gross income equals or exceeds $9,000 (single); $18,000 (married, filing jointly) Rate Structure Single Married, Filing Jointly Taxable Income Rate Taxable Income Rate First $8, % First $11, % $8,611 - $17, % $11,481 - $22, % $17,221 - $129, % $22,961 - $172, % $129,151 and over 6.75% $172,201 and over 6.75% Public Pension Exemption Federal and certain state and municipal pensioners who retired prior January 1, 1964, or became members of the retirement system as of December 31, 1963, and then retired at a later date, qualify for a tax exemption on their pension income. For state and local retirees, only certain Milwaukee city, Milwaukee County, and the Wisconsin teachers retirement systems qualify for exemptions subject the aforementioned conditions. All military pension income, including surviving spousal benefits, is exempt. Private Pension Exemption... None Social Security Benefits Only taxpayers whose provisional income* is $25,000 or higher (single) or $32,000 or higher (married, filing jointly) are subject taxation of up 50% of their Social Security benefits. *Provisional income consists of federal adjusted gross income, tax-exempt interest, certain foreign-source income, and one-half of the taxpayer s Social Security or Railroad Retirement Tier 1 benefit (U.S. House Committee on the Budget, Omnibus Budget Reconciliation Act of 1993, 103 rd Congress, 1 st sess., 1993, Conference Report , p. 594). Sources: AARP 2005 telephone survey of state legislative staff, state departments of revenue, state controllers offices, state assessors offices, and state treasury offices. 371
376 Wisconsin Standard Deductions (all ages)... $0 $7,950 (single);* $0 $14,330 (married, filing jointly)* *Standard deductions for singles range from $7,950 (adjusted gross income of $11,470) $0 (adjusted gross income of $77,720); for married, filing jointly, standard deductions range from $14,330 (adjusted gross income of less than $16,100) $0 (adjusted gross income of $88,554 or more). Personal Exemptions... $700 (under age 65) $950 (age 65 or older) Health Insurance Premium Deduction One-half of health insurance premiums, except for long-term care insurance premiums, may be deducted if taxpayers employers did not contribute ward the cost of their insurance costs. Long-Term Care Insurance Premium Deduction Insurance premiums may be deducted if they were not already deducted on the federal return. Itemized Deduction Credit Taxpayers can claim a credit equal 5% of the amount that certain federal itemized deductions, such as medical and dental expenses, exceed Wisconsin s standard deduction. However, the deductions for health and long-term care insurance premiums may not be counted ward this credit. Local Income Taxes... None II. General Sales Tax Rates (2004) State % Combined state/local tax rates % 5.6% III. Miscellaneous Tax Rates (2004) Corporate income (highest marginal rate) % On all taxable income* Gasoline (per gallon)... $0.321 Cigarette (per pack of 20)... $0.77 Beer (per gallon)... $0.065 *Additionally, the greater of $25 or 3.0% of gross tax liability is imposed. The tax may not exceed $9,800. Sources: AARP 2005 telephone survey of state legislative staff, state departments of revenue, state controllers offices, state assessors offices, and state treasury offices. 372
377 Wisconsin IV. Real Property Tax Relief Programs (2005) Homestead Exemption or Credit Requirements Benefits All homeowners and renters... $300 tax credit subtracted from personal income taxes Circuit Breaker Requirements Benefits Homeowners and renters whose income is $24,500 or less... Up a $1,160 tax credit Deferral Program Requirements Benefits Homeowners age 65 or older or disabled, with incomes at or below $20, Defer up $2,500 in property taxes on their dwelling V. Real Property Tax Limits, Caps or Freezes (2005) District boards in the Wisconsin Technical College System (WTCS) cannot levy a property tax rate exceeding $1.50 per $1,000 of their equalized property valuation for any purposes except debt service. Property tax rates for county governments cannot exceed the rates established for 1992 unless they are approved by a voter referendum. This limitation does not apply debt service. Annual increases in school property taxes are limited by the allowable annual increase in a school district s per pupil revenue. Under this limit, the maximum amount of school property taxes that can be levied equals the school district s revenue limit minus general state school aid and state computer aid. The allowable increase in revenue per pupil cannot exceed $241 in The limit does not pertain community service functions, such as adult education, and debt service (depending on when and how a school district s borrowing decisions were made). A school district can exceed its revenue limit by a voter referendum. VI. Local Expenditure Limits (2005) Municipalities have the option of limiting annual increases in their expenditures in exchange for state aid. Annual increases are limited by the Consumer Price Index (CPI) and the growth in a municipality s property value (equal 60% of the percentage change in a municipality s growth because of new construction). The maximum allowable growth rate of a municipality s property value for calculating the expenditure limit is 2%. To qualify for state aid, municipalities must levy a property tax rate in excess of $5 per $1,000 of assessed value. The expenditure limit does not pertain debt service. Sources: AARP 2005 telephone survey of state legislative staff, state departments of revenue, state controllers offices, state assessors offices, and state treasury offices. 373
378 State and Local General Expenditures, FY 2002 General Expenditures Wisconsin Average Annual Expenditure Change Percent of Personal Per Capita Income (millions) WI US WI US WI US State/Local Direct General Expends... $34,003 $6,250 $6, % 19.9% 5.6% 5.9% To State/Local Government... $34,003 $6,250 $6, % 19.9% 5.7% 5.9% Education*... $12,565 $2,310 $2, % 6.8% 5.5% 6.2% Public Welfare... $5,560 $1,022 $ % 3.2% 5.3% 6.1% Health and Hospitals... $2,082 $383 $ % 1.7% 5.2% 5.2% Highways... $2,986 $549 $ % 1.3% 7.0% 5.5% Public Safety*... $3,107 $571 $ % 1.8% 7.0% 6.3% Environment... $2,368 $435 $ % 1.2% 4.1% 5.1% Interest on General Debt... $1,457 $268 $ % 0.9% 4.4% 3.1% Other... $3,879 $713 $ % 3.0% 6.4% 6.5% To Federal Government... $0 $0 $15 0.0% 0.1% n/a 1.9% *Education includes higher and lower education; public safety includes police, fire, corrections, and protection and inspection. Source: U.S. Bureau of the Census (2002 data are the most current available.) State and Local General Expenditures, FY 2002 (excluding payments federal government) 4% 7% 11% 38% Education Public Welfare Health and Hospitals Highways 9% Public Safety Environment Interest on General Debt 9% Other 6% 16% Total Debt Outstanding Long-term Debt Short-term Debt 2002 Debt Ratio Measures Per $1,000 Debt (billions) Per Capita of Personal Income Debt (billions) Percent of Total Debt (billions) Percent of Total Wisconsin (State and Local)... $30.3 $5,574 $ $ % $ % United States... $1,681.4 $5,839 $ $1, % $ % Source: U.S. Bureau of the Census 374
379 THIS PAGE INTENTIONALLY LEFT BLANK 375
380 Wyoming Economic Indicars Average Annual Change WY US WY US WY US Per Capita Income... $20,498 $22,172 $34,199 $33, % 4.1% Median Household Income... $33,140 $32,264 $45,456 $44, % 3.2% Gross State Product (in millions)... $14,087 $6,865,513 $23,979 $11,665, % 5.4% Full- and Part-Time Positions (in thousands) , , % 1.6% Employed Persons (in thousands) , , % 1.2% Unemployment Rate % 6.1% 3.9% 5.5% n/a n/a Sources: U.S. Bureau of the Census, U.S. Bureau of Economic Analysis, and the U.S. Bureau of Labor Statistics 2004 Population 6% 5% Males 24% 7% Females 7% 23% Under Age 18 Ages Ages Ages 75 and Over 65% 63% Population Poverty Rate Population and Poverty Percentage Change WY WY WY US WY US Total Population , , % 12.8% 10.3% 13.1% Males , , % 13.8% 8.0% 11.6% Under Age ,970 60, % 7.8% 12.9% 18.3% Ages , , % 16.7% 6.9% 9.6% Ages ,402 15, % 1.6% 4.1% 6.5% Ages 75 and Over... 8,371 11, % 28.8% 5.1% 6.8% Females , , % 11.9% 12.5% 14.5% Under Age ,252 56, % 8.1% 15.2% 18.6% Ages , , % 14.6% 12.6% 13.6% Ages ,553 17, % -3.6% 7.6% 9.7% Ages 75 and Over... 13,689 16, % 19.6% 7.5% 13.3% Source: U.S. Bureau of the Census 376
381 Wyoming Percent Distribution of Households by Age of Householder and Income, 2004 Less than $10,000 $10,000 $14,999 $15,000 $24,999 $25,000 $34,999 $35,000 $49,999 $50,000 $74,999 $75,000 $99,999 $100,000 or more All Households Age of Householder Under 25 years % 9.0% 24.0% 19.9% 19.4% 7.7% 2.6% 3.4% 100.0% years % 3.3% 11.9% 12.7% 17.4% 25.4% 14.0% 9.5% 100.0% years % 3.4% 8.9% 10.9% 15.8% 24.2% 15.5% 15.7% 100.0% 65 years and over % 12.3% 20.7% 13.3% 17.7% 13.9% 5.7% 6.5% 100.0% Wyoming (all ages) % 5.5% 13.4% 12.7% 17.0% 21.3% 12.1% 10.9% 100.0% United States (all ages). 8.9% 6.3% 12.3% 12.0% 15.5% 19.0% 11.1% 15.0% 100.0% Source: U.S. Bureau of the Census Percent of Households by Household Income Bracket, 2004 Percent of Households 25.0% 20.0% 15.0% 10.0% 5.0% 0.0% Less than $10,000 $10,000 $14,999 $15,000 $24,999 $25,000 $34,999 $35,000 $49,999 $50,000 $74,999 $75,000 $99,999 $100,000 or more Wyoming United States 377
382 State and Local General Revenues, FY 2002 Wyoming Average Annual Revenue Change General Revenues Per Capita Percent of Personal Income (millions) WY US WY US WY US Total General Revenues... $4,237 $8,487 $5, % 19.3% 5.0% 5.6% Own Sources... $3,050 $6,109 $4, % 15.2% 4.7% 5.2% Taxes... $1,818 $3,643 $3, % 10.4% 5.3% 4.9% Property Taxes... $692 $1,387 $ % 3.2% 4.3% 4.5% General Sales Taxes... $580 $1,161 $ % 2.6% 9.4% 5.4% Personal Income Taxes. $0 $0 $ % 2.3% 0.0% 5.8% Other Taxes... $546 $1,094 $ % 2.3% 3.4% 4.3% Charges/Miscellaneous... $1,231 $2,467 $1, % 4.8% 4.0% 5.7% Federal Aid... $1,187 $2,378 $1, % 4.1% 5.8% 7.2% Source: U.S. Bureau of the Census (2002 data are the most current available.) 1992 General Revenue 2002 General Revenue Property Taxes General Sales Taxes 26% 18% 28% 16% Other Taxes 9% 14% Charges/Misc Federal Aid 15% 13% 32% 29% 378
383 Wyoming I. Personal Income Tax (2004) No state or local personal income tax is levied. II. General Sales Tax Rates (2004) State % Combined state/local tax rates % 6.0% III. Miscellaneous Tax Rates (2004) Corporate income (highest marginal rate)... No tax Gasoline (per gallon)... $0.14 Cigarette (per pack of 20)... $0.60 Beer (per gallon)... $0.02 IV. Real Property Tax Relief Programs (2005) Homestead Exemption or Credit Requirements Benefits Certain honorably discharged veterans and surviving spouses... $2,000 assessed value not exceed a tal tax benefit of $800; disabled veterans may receive an additional exemption equal $2,000 assessed value times their certified percentage of disability Homeowners who have resided in Wyoming for at least 5 years, whose eligible income does not exceed one-half of the median household income of the county of residence, and whose household assets are $20,000 or less per adult (excluding the residence itself and certain other assets)... 50% of the previous year s property taxes or 50% of the median residential property tax in the county (whichever is less) Circuit Breaker... None Sources: AARP 2005 telephone survey of state legislative staff, state departments of revenue, state controllers offices, state assessors offices, and state treasury offices. 379
384 Wyoming Deferral Program (local option program) Requirements Benefits Homeowners age 62 or older or disabled or persons who purchased their property prior December 31, Defer up 50% of taxes due if their income is 150% of the poverty level or less V. Real Property Tax Limits, Caps, or Freezes (2005) Property Tax Rate Limits Wyoming has a number of property tax rate limits applied various local taxing units. For example, schools cannot levy a rate greater than $2.50 per $100 of taxable value. However, in general, voters can override these limits, and these limits do not apply bonded indebtedness. Sources: AARP 2005 telephone survey of state legislative staff, state departments of revenue, state controllers offices, state assessors offices, and state treasury offices. 380
385 Wyoming State and Local General Expenditures, FY 2002 General Expenditures Average Annual Expenditure Change Percent of Personal Per Capita Income (millions) WY US WY US WY US State/Local Direct General Expends... $3,853 $7,719 $6, % 19.9% 4.2% 5.9% To State/Local Government... $3,853 $7,719 $6, % 19.9% 4.2% 5.9% Education*... $1,277 $2,559 $2, % 6.8% 3.7% 6.2% Public Welfare... $381 $764 $ % 3.2% 6.9% 6.1% Health and Hospitals... $516 $1,034 $ % 1.7% 6.4% 5.2% Highways... $477 $956 $ % 1.3% 2.9% 5.5% Public Safety*... $290 $580 $ % 1.8% 5.1% 6.3% Environment... $318 $637 $ % 1.2% 3.5% 5.1% Interest on General Debt... $128 $256 $ % 0.9% -1.7% 3.1% Other... $466 $933 $ % 3.0% 5.1% 6.5% To Federal Government... $0 $0 $15 0.0% 0.1% n/a 1.9% *Education includes higher and lower education; public safety includes police, fire, corrections, and protection and inspection. Source: U.S. Bureau of the Census (2002 data are the most current available.) State and Local General Expenditures, FY 2002 (excluding payments federal government) 12% Education 3% 8% 34% Public Welfare Health and Hospitals Highways 8% Public Safety Environment 12% 13% 10% Interest on General Debt Other Total Debt Outstanding Long-term Debt Short-term Debt 2002 Debt Ratio Measures Per $1,000 Debt (billions) Per Capita of Personal Income Debt (billions) Percent of Total Debt (billions) Percent of Total Wyoming (State and Local)... $2.4 $4,784 $ $ % $ % United States... $1,681.4 $5,839 $ $1, % $ % Source: U.S. Bureau of the Census 381
386 Puer Rico Economic Indicars 1980s and 1990s 1990s and 2000s Average Annual Change* PR US PR US PR US Per Capita Income (1993 and 2003)... $6,835 $21,346 $11,566 $31, % 4.0% Median Household Income (1989 and 1999)... $8,895 $30,056 $14,412 $41, % 3.4% Per Capita Gross Domestic Product (1993 and 2003)... $10,256 $25,826 $19,220 $37, % 3.9% Poverty Rate (1989 and 1999) % 13.1% 48.2% 12.4% n/a n/a Employed persons, in thousands (1994 and 2004)... 1, ,060 1, , % 1.2% Unemployment Rate (1994 and 2004) % 6.1% 10.6% 5.5% n/a n/a *Average annual change is based on the years identified under the economic indicars header. Sources: U.S. Bureau of the Census, U.S. Bureau of Economic Analysis, and the U.S. Bureau of Labor Statistics 2000 Population Under Age 18 6% 4% Males 30% 7% 5% Females 27% Ages Ages Ages 75 and Over 60% 61% Population Poverty Rate Population and Poverty Percentage Change PR PR PR US PR US Total Population... 3,522,037 3,808, % 13.2% 48.2% 12.4% Males... 1,705,642 1,833, % 13.9% 47.0% 16.4% Under Age , , % 13.7% 58.4% 9.6% Ages ,812 1,088, % 13.8% 42.3% 9.6% Ages , , % 4.6% 37.5% 6.6% Ages 75 and Over... 63,550 77, % 32.1% 44.7% 7.5% Females... 1,816,395 1,975, % 12.5% 49.4% 13.5% Under Age , , % 13.6% 58.5% 16.7% Ages ,064,814 1,202, % 12.6% 45.8% 12.6% Ages , , % -0.8% 43.8% 10.1% Ages 75 and Over... 77, , % 23.3% 50.7% 13.9% Source: U.S. Bureau of the Census 382
387 Puer Rico Percent Distribution of Households by Age of Householder and Income, 1999 $10,000 $14,999 $15,000 $24,999 $25,000 $34,999 $35,000 $49,999 $50,000 $74,999 $75,000 $99,999 All Households Age of Householder Less than $10,000 $100,000 or more Under 25 years % 16.7% 15.7% 6.3% 2.7% 1.2% 0.3% 0.4% 100.0% years % 13.9% 19.8% 12.8% 10.7% 6.6% 2.2% 2.2% 100.0% years % 13.4% 18.6% 11.3% 9.9% 6.8% 2.5% 3.2% 100.0% 65 years and over % 15.9% 17.3% 8.4% 5.8% 3.2% 1.2% 1.7% 100.0% Puer Rico (all ages) % 14.3% 18.6% 11.0% 8.9% 5.7% 2.0% 2.4% 100.0% United States (all ages).. 9.5% 6.3% 12.8% 12.8% 16.5% 19.5% 10.2% 12.3% 100.0% Source: U.S. Bureau of the Census Percent of Households by Household Income Bracket, % Percent of Households 35.0% 30.0% 25.0% 20.0% 15.0% 10.0% 5.0% 0.0% Less than $10,000 $10,000 $14,999 $15,000 $24,999 $25,000 $34,999 $35,000 $49,999 $50,000 $74,999 $75,000 $99,999 $100,000 or more Puer Rico United States 383
388 Percent of Personal Income Puer Rico Average Annual Revenue Change General Revenues, FY 2004 General Revenues Per Capita (millions) PR PR PR Total General Revenues... $12,100 $3, % 6.5% Total Internal Revenues... $8,445 $2, % 7.0% Taxes... $7,127 $1, % 7.0% Income Taxes*... $5,062 $1, % 9.5% Other Taxes... $2,066 $ % 2.9% Other Internal Revenues... $1,318 $ % 6.6% Intergovernmental... $3,655 $ % 5.4% *Includes corporate and individual income taxes. Source: Puer Rico Department of the Treasury 2004 General Revenue Income Taxes 30% Other Taxes 42% Other Internal Revenues Intergovernmental 11% 17% 384
389 Puer Rico I. Personal Income Tax (2004) Income Tax Base Puer Rico s income tax base is not directly linked the federal income tax base. Filing Requirements Taxpayers must file if their tal gross income exceeds $3,300 (single) and $6,000 (married, living with spouse, and filing jointly) Rate Structure Single and Married Couples Filing Jointly Taxable Income Rate Taxable Income Rate First $2,000 7% $30,001 - $50,000 28% $2,001 - $17,000 10% Over $50,000 33% $17,001 - $30,000 15% Annuity and Pension Exemption Taxpayers may receive an annuity and pension exemption of up $8,000 (under age 60) or $12,000 (age 60 and older). Social Security Benefits... Full exemption Tax Deduction Taxpayers who are married, living with their spouse, and are filing jointly are eligible receive a $3,000 deduction if both spouses receive earned income. Military Deduction Puer Rican residents who are veterans of the United States Armed Forces are eligible for a $500 deduction. Standard Deductions and Personal Exemptions Combined All ages... $3,400 (single); $6,150 (married, filing jointly and living with spouse) Sources: AARP 2005 telephone survey of state legislative staff, state departments of revenue, state controllers offices, state assessors offices, and state treasury offices. 385
390 Puer Rico Tax Credit Taxpayers (single, head of household, or married, filing jointly) whose adjusted gross income is $10,000 or less and whose only source of income comes from salaries do not have pay income taxes. Tax Credit Taxpayers (single, head of household, or married, filing jointly) must meet various eligibility requirements receive a tax credit. These include the following: (1) adjusted gross income is over $10,000 but not over $50,000; (2) their only source of income consists of wages and salaries (subject withholding in Puer Rico), pensions, and tips; and (3) they cannot claim any other tax credit (except the credit for contributions the Educational Foundation for Free Selection of Schools). The credit amount ranges from $50 $150 (singles) and from $50 $250 (married living with spouse and filing jointly), depending on adjusted gross income (higher adjusted gross incomes means higher credit amounts). II. General Sales Tax Rates (2004) No general sales tax is levied; however, Puer Rico levies a general excise tax of 6.6% that is reflected in the price of most goods. III. Miscellaneous Tax Rates (2004) Cigarette (per pack of 20)... $1.23 Beer (per gallon)... $0.70 (0.5% 1.5% alcohol content) $4.50 (1.5% alcohol content) $4.12 (greater than 1.5% alcohol content for five or more gallon measures) Sources: AARP 2005 telephone survey of state legislative staff, state departments of revenue, state controllers offices, state assessors offices, and state treasury offices. 386
391 Puer Rico General Expenditures, FY 2004 General Expenditures (millions) Percent of Personal Income Average Annual Expend. Change Per Capita PR PR PR PR Total Expenditures $15,175 $3, % 9.7% Education... $3,474 $ % 8.7% Public Housing and Welfare... $2,738 $ % 6.0% Health $2,177 $ % 27.5% General Government... $1,777 $ % 17.9% Public Safety... $1,765 $ % 8.3% Debt Service... $1,264 $ % 6.6% Economic Development... $869 $ % 13.9% Capital Outlays... $582 $ % 0.6% Intergovernmental... $529 $ % 11.1% Source: Puer Rico Department of the Treasury 2004 General Expenditures 6% 4% 3% 23% Education 12% 8% 12% 14% 18% Public Housing and Welfare Health General Government Public Safety Debt Service Economic Development Capital Outlays Intergovernmental 387
392 Virgin Islands Economic Indicars 1980s and 1990s 1990s and 2000s Average Annual Change* VI US VI US VI US Per Capita Income (1989 and 1999)... $9,440 $19,584 $13,139 $28, % 3.8% Median Household Income (1989 and 1999)... $22,050 $30,056 $24,704 $41, % 3.4% Per Capita Gross Product (1990 and 2000)... $15,599 $23,333 $21,518 $34, % 4.1% Poverty Rate (1989 and 1999) % 13.1% 32.5% 12.4% n/a n/a Employed Persons, in thousands (1993 and 2003) , , % 1.4% Unemployment Rate (1993 and 2003) % 6.9% 9.4% 6.0% n/a n/a *Average annual change is based on the years identified under the economic indicars header. Sources: U.S. Bureau of the Census, U.S. Bureau of Economic Analysis, and the Virgin Islands Government Development Bank 2000 Population Males Females Under Age 18 Ages % 2% 33% 6% 4% 30% Ages Ages 75 and Over 60% 60% Population Poverty Rate Population and Poverty Percentage Change VI VI VI US VI US Total Population , , % 13.2% 27.1% 13.1% Males... 49,210 51, % 13.9% 24.8% 11.5% Under Age ,825 17, % 13.7% 37.1% 18.0% Ages ,544 30, % 13.8% 17.0% 9.2% Ages ,970 2, % 4.6% 24.0% 7.1% Ages 75 and Over , % 32.1% 29.7% 10.8% Females... 52,599 56, % 12.5% 29.3% 14.6% Under Age ,602 17, % 13.6% 36.5% 18.5% Ages ,359 34, % 12.6% 24.7% 12.8% Ages ,313 3, % -0.8% 33.5% 12.9% Ages 75 and Over... 1,325 1, % 23.3% 37.4% 19.8% Source: U.S. Bureau of the Census 388
393 Virgin Islands Percent Distribution of Households by Age of Householder and Income, 1999 Less than $10,000 $10,000 $14,999 $15,000 $24,999 $25,000 $34,999 $35,000 $49,999 $50,000 $74,999 $75,000 $99,999 $100,000 or more All Households Age of Householder Under 25 years % 12.7% 17.7% 10.7% 7.7% 3.5% 1.3% 1.0% 100.0% years % 8.9% 17.3% 14.2% 14.7% 12.0% 4.5% 3.2% 100.0% years % 7.5% 14.4% 12.3% 15.2% 14.6% 6.9% 6.9% 100.0% 65 years and over % 10.6% 15.1% 10.9% 10.5% 9.3% 3.9% 4.8% 100.0% Virgin Islands (all ages). 26.0% 8.6% 15.7% 12.8% 14.1% 12.4% 5.4% 5.0% 100.0% United States (all ages). 9.5% 6.3% 12.8% 12.8% 16.5% 19.5% 10.2% 12.3% 100.0% Source: U.S. Bureau of the Census Percent of Households by Household Income Bracket, 1999 Percent of Households 30.0% 25.0% 20.0% 15.0% 10.0% 5.0% 0.0% Less than $10,000 $10,000 $14,999 $15,000 $24,999 $25,000 $34,999 $35,000 $49,999 $50,000 $74,999 $75,000 $99,999 $100,000 or more Virgin Islands United States 389
394 Virgin Islands General Revenues and Federal Grants, FY 2004 Percent of Personal Income Average Annual Revenue Change General Revenues Per Capita (millions) VI VI VI Genl. Revenues and Federal Grants... $823 $7, % 5.8% General Revenues... $557 $5, % 6.6% Taxes... $544 $4, % 6.7% Income Taxes*... $316 $2, % 6.9% Other Taxes... $228 $2, % 6.3% Other Internal Revenues... $13 $ % 5.9% Federal Grants... $266 $2, % 4.3% *Includes corporate and individual income taxes and is reduced by tax refunds. Source: United States Virgin Islands, Office of the Governor, Office of Management and Budget 2004 General Revenue and Federal Grants Income Taxes Other Taxes 32% 38% Other Internal Revenues Federal Grants 2% 28% 390
395 Virgin Islands I. Personal Income Tax (2004)* Income Tax Base Virgin Island s income tax base is linked federal taxable income. Rate Structure Single Married, Filing Jointly Taxable Income Rate Taxable Income Rate First $7,150 10% First $14,300 10% $7,150 - $29,050 15% $14,300 - $58,100 15% $29,050 - $70,350 27% $58,100 - $117,250 25% $70,350- $146,750 30% $117,250 - $178,650 28% $146,750 - $319,100 35% $178,650 - $319,100 33% $319,100 and over 38.6% $319,100 and over 35% *The above marginal tax rates and income brackets are the same as the federal ones. Virgin Island taxpayers pay the same income taxes as U.S. taxpayers pay the federal government; however, the monies go the Virgin Islands. Virgin Island residents do not have pay federal income taxes unless they receive federal income. Public and Private Pension Exemptions... None Social Security Benefits Only taxpayers whose provisional income* is $25,000 or higher (single) or $32,000 or higher (married, filing jointly) are subject taxation of their Social Security benefits. *Provisional income consists of federal adjusted gross income, tax-exempt interest, certain foreign-source income, and one-half of the taxpayer s Social Security or Railroad Retirement Tier 1 benefit (U.S. House Committee on the Budget, Omnibus Budget Reconciliation Act of 1993, 103 rd Congress, 1 st sess., 1993, Conference Report , p. 594). Standard Deductions and Personal Exemptions Combined* Under age 65*... $7,950 (single); $15,900 (married, filing jointly; both spouses are under age 65) Age 65 or older*... $9,150 (single); $17,800 (married, filing jointly; both spouses are age 65 or older) *Personal exemptions equal $3,100 per exemption (single have one exemption and married couples have two). Taxpayers with federal adjusted gross income greater than $142,700 (single) or $214,050 (married, filing jointly) receive lower personal exemption amounts. Sources: AARP 2005 telephone survey of state legislative staff, state departments of revenue, state controllers offices, state assessors offices, and state treasury offices. 391
396 Virgin Islands II. General Sales Tax Rates (2004) No general sales tax is levied. III. Miscellaneous Tax Rates (2004) Cigarette... 25% of the sales price U.S. beer (per case)... $1.55 Foreign beer (per case)... $2.08 Sources: AARP 2005 telephone survey of state legislative staff, state departments of revenue, state controllers offices, state assessors offices, and state treasury offices. 392
397 Table 1 Per Capita Income, 2004 Rank State Per Capita Income Rank State Average Annual Change, District of Columbia $52,101 1 District of Columbia 5.4% 2 Connecticut $45,506 2 Wyoming 5.3% 3 Massachusetts $42,102 3 Massachusetts 4.8% 4 New Jersey $41,636 4 South Dakota 4.7% 5 Maryland $39,629 5 Minnesota 4.6% 6 New York $38,333 6 Colorado 4.6% 7 New Hampshire $36,676 7 Vermont 4.6% 8 Virginia $36,175 8 Nebraska 4.5% 9 Minnesota $36,173 9 New Hampshire 4.5% 10 Colorado $36, Virginia 4.5% 11 Delaware $35, Montana 4.5% 12 California $35, Maryland 4.5% 13 Washingn $35, Rhode Island 4.5% 14 Illinois $34, Maine 4.5% 15 Wyoming $34, North Dakota 4.4% 16 Rhode Island $34, Utah 4.4% 17 Alaska $34, Connecticut 4.4% 18 Nevada $33, Washingn 4.3% 19 Pennsylvania $33, Iowa 4.3% 20 Hawaii $32, Texas 4.3% 21 Nebraska $32, California 4.2% 22 Wisconsin $32, Oklahoma 4.2% 23 Michigan $32, Delaware 4.2% 24 Vermont $31, New Jersey 4.2% 25 Florida $31, Wisconsin 4.1% 26 Ohio $31, Mississippi 4.1% 27 Kansas $31, West Virginia 4.1% 28 Iowa $30, Kentucky 4.1% 29 Texas $30, Arizona 4.1% 30 South Dakota $30, New York 4.0% 31 Oregon $30, Alabama 4.0% 32 Missouri $30, Pennsylvania 4.0% 33 Georgia $30, New Mexico 4.0% 34 Indiana $30, Arkansas 4.0% 35 Maine $29, South Carolina 4.0% 36 Tennessee $29, Louisiana 4.0% 37 North Carolina $29, Kansas 4.0% 38 North Dakota $29, Tennessee 3.9% 39 Arizona $28, Missouri 3.9% 40 Oklahoma $27, Oregon 3.8% 41 Montana $27, Georgia 3.8% 42 Alabama $27, Florida 3.8% 43 Louisiana $27, Illinois 3.8% 44 South Carolina $27, Indiana 3.8% 45 Kentucky $27, North Carolina 3.7% 46 Utah $26, Idaho 3.7% 47 Idaho $26, Ohio 3.7% 48 New Mexico $26, Nevada 3.6% 49 Arkansas $25, Michigan 3.5% 50 West Virginia $25, Alaska 3.1% 51 Mississippi $24, Hawaii 2.8% National Average $33,041 National Average 4.1% 393
398
399 Table 2 Median Household Income, 2004 Rank State Median Household Income Rank State Average Annual Change, Maryland $57,319 1 Minnesota 5.3% 2 New Hampshire $56,886 2 New Hampshire 4.9% 3 Hawaii $56,454 3 Indiana 4.3% 4 Minnesota $56,125 4 Rhode Island 4.2% 5 New Jersey $55,446 5 Washingn 4.0% 6 Connecticut $55,390 6 Oklahoma 3.9% 7 Alaska $55,218 7 New Mexico 3.9% 8 Massachusetts $52,370 8 Maryland 3.9% 9 Virginia $51,438 9 Kansas 3.8% 10 Colorado $51, District of Columbia 3.7% 11 Utah $50, Utah 3.6% 12 Washingn $49, Louisiana 3.6% 13 California $49, West Virginia 3.5% 14 Rhode Island $48, Idaho 3.5% 15 Delaware $47, New York 3.4% 16 Vermont $47, Arizona 3.4% 17 Nevada $47, Missouri 3.4% 18 Illinois $46, California 3.4% 19 Wisconsin $45, North Dakota 3.3% 20 Wyoming $45, South Dakota 3.3% 21 New York $44, Florida 3.3% 22 Idaho $44, Nebraska 3.2% 23 Pennsylvania $44, Pennsylvania 3.2% 24 Arizona $43, Mississippi 3.2% 25 Nebraska $43, Wyoming 3.2% 26 Iowa $43, Arkansas 3.2% 27 District of Columbia $43, Virginia 3.2% 28 Ohio $42, Maine 3.2% 29 Michigan $42, Colorado 3.0% 30 Indiana $42, Ohio 3.0% 31 Missouri $42, Connecticut 3.0% 32 Maine $41, Alabama 3.0% 33 Texas $41, Texas 3.0% 34 South Dakota $41, North Carolina 3.0% 35 Oregon $41, Kentucky 3.0% 36 Kansas $40, Delaware 2.9% 37 Georgia $40, Hawaii 2.9% 38 Florida $40, Tennessee 2.9% 39 North Carolina $40, Vermont 2.9% 40 Oklahoma $39, Nevada 2.8% 41 New Mexico $39, Iowa 2.8% 42 North Dakota $39, Illinois 2.8% 43 South Carolina $38, New Jersey 2.7% 44 Tennessee $38, Oregon 2.7% 45 Alabama $36, Georgia 2.7% 46 Louisiana $36, South Carolina 2.6% 47 Kentucky $35, Wisconsin 2.6% 48 Arkansas $34, Massachusetts 2.6% 49 Mississippi $34, Montana 2.1% 50 Montana $33, Alaska 2.0% 51 West Virginia $33, Michigan 1.8% National Average $44,389 National Average 3.2% 395
400
401 Table 3 Gross State Product, 2004 Rank State Gross State Product (millions) Rank State Average Annual Change, California $1,550,753 1 Nevada 8.4% 2 New York $896,739 2 Delaware 8.0% 3 Texas $884,136 3 Arizona 7.7% 4 Florida $599,068 4 Colorado 7.1% 5 Illinois $521,900 5 Utah 6.9% 6 Pennsylvania $468,089 6 North Carolina 6.5% 7 Ohio $419,866 7 Georgia 6.4% 8 New Jersey $416,053 8 Virginia 6.4% 9 Michigan $372,169 9 Florida 6.4% 10 Georgia $343, Texas 6.3% 11 North Carolina $336, California 6.0% 12 Virginia $329, Minnesota 6.0% 13 Massachusetts $317, Washingn 6.0% 14 Washingn $261, New Hampshire 5.8% 15 Maryland $227, Idaho 5.8% 16 Indiana $227, South Dakota 5.6% 17 Minnesota $223, Maryland 5.6% 18 Tennessee $217, Oregon 5.6% 19 Wisconsin $211, Massachusetts 5.5% 20 Missouri $203, Rhode Island 5.5% 21 Colorado $199, Wyoming 5.5% 22 Arizona $199, Tennessee 5.4% 23 Connecticut $185, South Carolina 5.3% 24 Louisiana $152, Connecticut 5.3% 25 Alabama $139, Maine 5.2% 26 Kentucky $136, Wisconsin 5.1% 27 South Carolina $136, District of Columbia 5.1% 28 Oregon $128, New Jersey 5.0% 29 Iowa $111, Montana 4.9% 30 Oklahoma $107, North Dakota 4.9% 31 Nevada $100, Arkansas 4.9% 32 Kansas $98, Indiana 4.9% 33 Utah $82, Iowa 4.9% 34 Arkansas $80, Oklahoma 4.8% 35 District of Columbia $76, Kansas 4.8% 36 Mississippi $76, Vermont 4.8% 37 Nebraska $68, Nebraska 4.8% 38 New Mexico $61, Missouri 4.7% 39 Delaware $54, Kentucky 4.7% 40 New Hampshire $51, Alabama 4.7% 41 Hawaii $50, New York 4.6% 42 West Virginia $49, Pennsylvania 4.6% 43 Idaho $43, Illinois 4.3% 44 Maine $43, Michigan 4.2% 45 Rhode Island $41, Ohio 4.2% 46 Alaska $34, Mississippi 4.2% 47 South Dakota $29, Louisiana 4.1% 48 Montana $27, New Mexico 4.0% 49 Wyoming $23, Alaska 3.9% 50 North Dakota $22, West Virginia 3.6% 51 Vermont $21, Hawaii 3.3% National Average $11,665,595 National Average 5.4% 397
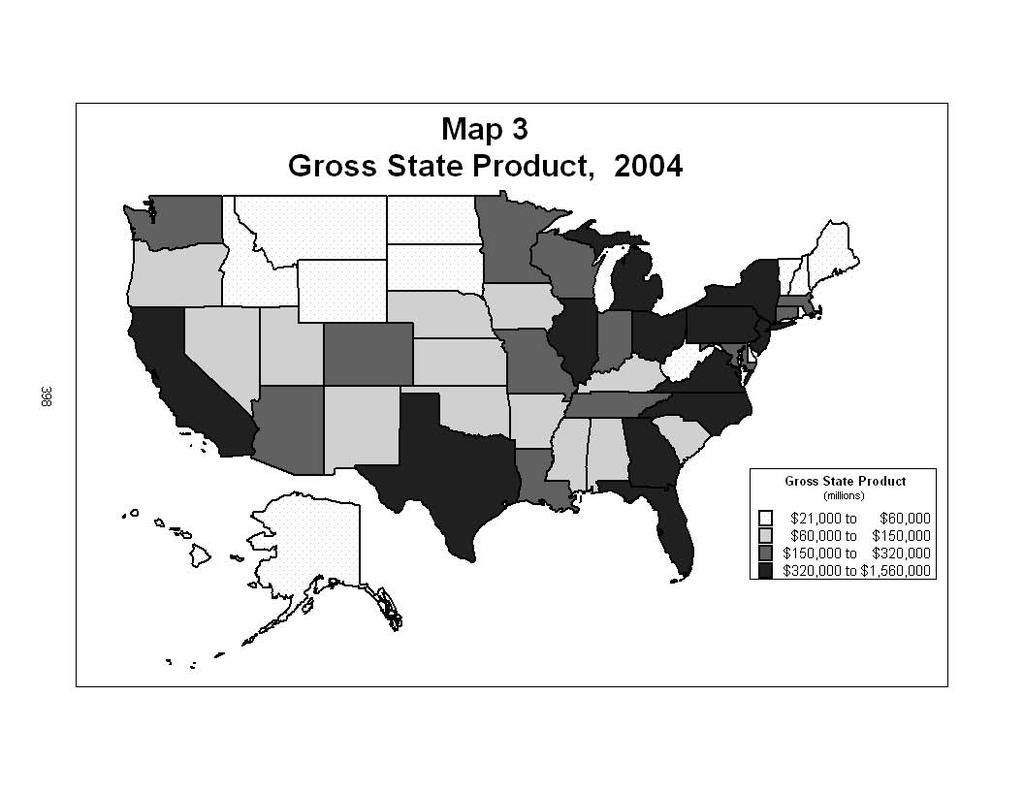
402
403 Table 4 Employed Persons, 2004 Rank State Employed Persons Rank State Average Annual Change, California 16,459,862 1 Nevada 4.0% 2 Texas 10,362,982 2 Arizona 2.9% 3 New York 8,811,784 3 Florida 2.1% 4 Florida 7,997,077 4 Georgia 2.1% 5 Illinois 6,000,140 5 Colorado 2.0% 6 Pennsylvania 5,926,978 6 Idaho 1.9% 7 Ohio 5,523,037 7 Utah 1.9% 8 Michigan 4,719,343 8 New Mexico 1.7% 9 Georgia 4,188,271 9 Washingn 1.7% 10 New Jersey 4,176, Texas 1.7% 11 North Carolina 4,020, California 1.7% 12 Virginia 3,674, New Hampshire 1.6% 13 Massachusetts 3,219, North Carolina 1.4% 14 Washingn 3,032, Wyoming 1.3% 15 Indiana 3,005, Minnesota 1.3% 16 Wisconsin 2,919, South Dakota 1.3% 17 Missouri 2,858, Maine 1.3% 18 Minnesota 2,813, Vermont 1.2% 19 Maryland 2,761, Virginia 1.2% 20 Tennessee 2,751, Delaware 1.2% 21 Arizona 2,636, Montana 1.2% 22 Colorado 2,382, Oregon 1.1% 23 Alabama 2,029, Rhode Island 1.0% 24 Louisiana 1,940, Oklahoma 1.0% 25 South Carolina 1,906, Alaska 1.0% 26 Kentucky 1,870, South Carolina 1.0% 27 Oregon 1,718, New Jersey 1.0% 28 Connecticut 1,709, Nebraska 0.9% 29 Oklahoma 1,627, Tennessee 0.9% 30 Iowa 1,545, New York 0.9% 31 Kansas 1,383, Missouri 0.9% 32 Mississippi 1,248, Louisiana 0.8% 33 Arkansas 1,232, Maryland 0.8% 34 Utah 1,140, Kansas 0.8% 35 Nevada 1,126, Kentucky 0.8% 36 Nebraska 947, Massachusetts 0.7% 37 New Mexico 859, Mississippi 0.7% 38 West Virginia 746, Wisconsin 0.7% 39 New Hampshire 695, Arkansas 0.7% 40 Idaho 669, Hawaii 0.7% 41 Maine 667, Pennsylvania 0.7% 42 Hawaii 595, Alabama 0.6% 43 Rhode Island 533, Ohio 0.5% 44 Montana 461, West Virginia 0.5% 45 South Dakota 413, Michigan 0.5% 46 Delaware 405, North Dakota 0.4% 47 North Dakota 342, Illinois 0.4% 48 Vermont 340, Indiana 0.3% 49 Alaska 307, Connecticut 0.2% 50 District of Columbia 274, Iowa 0.2% 51 Wyoming 270, District of Columbia -0.4% National Total 139,251,000 National Average 1.2% 399
404
405 Table 5 Unemployment Rate, 2004 and 1994 Rank State 2004 Unemployment Rate Rank State 1994 Unemployment Rate 1 District of Columbia 8.2% 1 West Virginia 8.7% 2 Alaska 7.5% 2 California 8.6% 3 Oregon 7.4% 3 District of Columbia 8.0% 4 Michigan 7.1% 4 Alaska 7.5% 5 South Carolina 6.8% 5 Louisiana 7.5% 6 California 6.2% 6 New York 6.9% 7 Illinois 6.2% 7 New Jersey 6.8% 8 Mississippi 6.2% 8 Rhode Island 6.8% 9 Washingn 6.2% 9 Florida 6.7% 10 Ohio 6.1% 10 Mississippi 6.6% 11 Texas 6.1% 11 New Mexico 6.6% 12 New York 5.8% 12 Texas 6.6% 13 Arkansas 5.7% 13 Washingn 6.5% 14 Louisiana 5.7% 14 Maine 6.4% 15 Missouri 5.7% 15 Pennsylvania 6.3% 16 New Mexico 5.7% 16 Massachusetts 6.2% 17 Alabama 5.6% 17 Michigan 6.2% 18 Colorado 5.5% 18 Arizona 6.1% 19 Kansas 5.5% 19 Nevada 6.1% 20 North Carolina 5.5% 20 South Carolina 6.0% 21 Pennsylvania 5.5% 21 Illinois 5.8% 22 Tennessee 5.4% 22 Ohio 5.6% 23 Kentucky 5.3% 23 Oklahoma 5.6% 24 West Virginia 5.3% 24 Connecticut 5.5% 25 Indiana 5.2% 25 Kentucky 5.5% 26 Rhode Island 5.2% 26 Montana 5.5% 27 Utah 5.2% 27 Oregon 5.5% 28 Massachusetts 5.1% 28 Alabama 5.4% 29 Arizona 5.0% 29 Idaho 5.4% 30 Connecticut 4.9% 30 Arkansas 5.3% 31 Wisconsin 4.9% 31 Maryland 5.2% 32 Florida 4.8% 32 Georgia 5.1% 33 Iowa 4.8% 33 Hawaii 5.1% 34 New Jersey 4.8% 34 Tennessee 5.1% 35 Oklahoma 4.8% 35 Wyoming 5.0% 36 Idaho 4.7% 36 Kansas 4.9% 37 Minnesota 4.7% 37 Missouri 4.9% 38 Georgia 4.6% 38 New Hampshire 4.7% 39 Maine 4.6% 39 Virginia 4.7% 40 Montana 4.4% 40 Delaware 4.6% 41 Nevada 4.3% 41 Vermont 4.6% 42 Maryland 4.2% 42 Indiana 4.5% 43 Delaware 4.1% 43 North Carolina 4.4% 44 Wyoming 3.9% 44 Colorado 4.3% 45 Nebraska 3.8% 45 Wisconsin 4.3% 46 New Hampshire 3.8% 46 Minnesota 4.1% 47 Vermont 3.7% 47 Utah 3.9% 48 Virginia 3.7% 48 Iowa 3.8% 49 South Dakota 3.5% 49 North Dakota 3.7% 50 North Dakota 3.4% 50 South Dakota 3.4% 51 Hawaii 3.3% 51 Nebraska 2.6% National Average 5.5% National Average 6.1% 401
406
407 Table 6 Proportion of Population Under Age 18 and Ages 18 64, 2004 Rank State Under Age 18 Rank State Ages Utah 31.0% 1 District of Columbia 68.1% 2 Alaska 28.7% 2 Vermont 65.3% 3 Texas 27.9% 3 Alaska 64.9% 4 Arizona 26.9% 4 Wyoming 64.8% 5 California 26.7% 5 Washingn 64.7% 6 Idaho 26.7% 6 Colorado 64.6% 7 Georgia 26.4% 7 New Hampshire 64.5% 8 New Mexico 25.9% 8 Virginia 64.5% 9 Nevada 25.9% 9 Maine 64.2% 10 Mississippi 25.8% 10 Georgia 64.0% 11 Louisiana 25.8% 11 Tennessee 63.9% 12 Indiana 25.7% 12 Montana 63.9% 13 Colorado 25.6% 13 Massachusetts 63.9% 14 Illinois 25.5% 14 Kentucky 63.8% 15 Maryland 25.1% 15 Minnesota 63.6% 16 Michigan 25.1% 16 Delaware 63.6% 17 Kansas 25.0% 17 Rhode Island 63.5% 18 Nebraska 24.9% 18 Oregon 63.5% 19 North Carolina 24.8% 19 Maryland 63.5% 20 New Jersey 24.8% 20 West Virginia 63.5% 21 South Dakota 24.8% 21 North Dakota 63.4% 22 Arkansas 24.6% 22 Wisconsin 63.3% 23 South Carolina 24.4% 23 New York 63.3% 24 Oklahoma 24.4% 24 South Carolina 63.2% 25 Minnesota 24.3% 25 North Carolina 63.1% 26 Ohio 24.3% 26 Nevada 62.9% 27 Virginia 24.2% 27 Hawaii 62.7% 28 Alabama 24.2% 28 Alabama 62.6% 29 Missouri 24.1% 29 Missouri 62.6% 30 Washingn 24.0% 30 Michigan 62.6% 31 Connecticut 23.9% 31 California 62.6% 32 New York 23.8% 32 Illinois 62.6% 33 Wisconsin 23.7% 33 Connecticut 62.5% 34 Oregon 23.7% 34 Louisiana 62.5% 35 Hawaii 23.7% 35 Ohio 62.4% 36 Kentucky 23.6% 36 Oklahoma 62.4% 37 Tennessee 23.6% 37 Iowa 62.3% 38 New Hampshire 23.5% 38 Texas 62.3% 39 Delaware 23.3% 39 New Jersey 62.3% 40 Wyoming 23.1% 40 New Mexico 62.1% 41 Iowa 23.0% 41 Kansas 62.1% 42 Florida 23.0% 42 Mississippi 62.0% 43 Pennsylvania 22.9% 43 Indiana 62.0% 44 Massachusetts 22.8% 44 Idaho 61.9% 45 Rhode Island 22.6% 45 Nebraska 61.9% 46 Montana 22.5% 46 Pennsylvania 61.8% 47 North Dakota 21.9% 47 Arkansas 61.6% 48 Vermont 21.7% 48 South Dakota 61.0% 49 Maine 21.4% 49 Utah 60.3% 50 West Virginia 21.2% 50 Arizona 60.3% 51 District of Columbia 19.8% 51 Florida 60.2% National Average 25.0% National Average 62.7% 403
408
409
410 Table 7 Proportion of Population Ages 65+ and 75+, 2004 Rank State Age 65+ Rank State Age Florida 16.8% 1 Florida 8.3% 2 West Virginia 15.3% 2 Pennsylvania 8.3% 3 Pennsylvania 15.3% 3 Rhode Island 8.0% 4 North Dakota 14.7% 4 North Dakota 7.9% 5 Iowa 14.7% 5 Iowa 7.8% 6 Maine 14.4% 6 South Dakota 7.4% 7 South Dakota 14.2% 7 West Virginia 7.4% 8 Rhode Island 13.9% 8 Hawaii 7.4% 9 Arkansas 13.8% 9 Connecticut 7.3% 10 Montana 13.7% 10 Maine 7.2% 11 Hawaii 13.6% 11 Massachusetts 7.1% 12 Connecticut 13.5% 12 Nebraska 6.9% 13 Massachusetts 13.3% 13 Ohio 6.8% 14 Ohio 13.3% 14 Kansas 6.7% 15 Missouri 13.3% 15 New Jersey 6.7% 16 Nebraska 13.3% 16 Wisconsin 6.7% 17 Alabama 13.2% 17 New York 6.6% 18 Oklahoma 13.2% 18 Montana 6.5% 19 Delaware 13.1% 19 Missouri 6.5% 20 Vermont 13.0% 20 Oregon 6.5% 21 Wisconsin 13.0% 21 Vermont 6.4% 22 New York 13.0% 22 Arkansas 6.4% 23 Kansas 13.0% 23 Michigan 6.3% 24 New Jersey 12.9% 24 Minnesota 6.2% 25 Oregon 12.8% 25 Delaware 6.2% 26 Arizona 12.7% 26 Indiana 6.2% 27 Kentucky 12.5% 27 Oklahoma 6.1% 28 Tennessee 12.5% 28 Alabama 6.0% 29 South Carolina 12.4% 29 District of Columbia 6.0% 30 Indiana 12.4% 30 New Hampshire 6.0% 31 Michigan 12.3% 31 Illinois 6.0% 32 Mississippi 12.2% 32 Arizona 5.9% 33 District of Columbia 12.1% 33 Kentucky 5.7% 34 North Carolina 12.1% 34 Tennessee 5.6% 35 Wyoming 12.1% 35 South Carolina 5.6% 36 Minnesota 12.1% 36 Washingn 5.6% 37 New Mexico 12.1% 37 North Carolina 5.6% 38 New Hampshire 12.1% 38 Wyoming 5.6% 39 Illinois 12.0% 39 Maryland 5.6% 40 Louisiana 11.7% 40 Mississippi 5.5% 41 Maryland 11.4% 41 Louisiana 5.5% 42 Idaho 11.4% 42 New Mexico 5.4% 43 Virginia 11.4% 43 Idaho 5.4% 44 Washingn 11.3% 44 Virginia 5.3% 45 Nevada 11.2% 45 California 5.2% 46 California 10.7% 46 Nevada 4.6% 47 Texas 9.9% 47 Colorado 4.6% 48 Colorado 9.8% 48 Texas 4.5% 49 Georgia 9.6% 49 Georgia 4.2% 50 Utah 8.7% 50 Utah 4.0% 51 Alaska 6.4% 51 Alaska 2.5% National Average 12.4% National Average 6.1% 406
411
412
413 Table 8 Percent Change in Population, (tal population and under age 18) Rank State Total Population Rank State Under Age 18 1 Nevada 60.3% 1 Nevada 59.7% 2 Arizona 38.5% 2 Arizona 37.6% 3 Colorado 25.9% 3 Georgia 23.8% 4 Georgia 25.3% 4 Colorado 22.5% 5 Florida 24.6% 5 Florida 21.7% 6 Utah 23.8% 6 North Carolina 20.3% 7 Idaho 22.7% 7 Texas 18.6% 8 Texas 22.6% 8 Virginia 12.8% 9 North Carolina 21.0% 9 Maryland 11.0% 10 Delaware 17.2% 10 New Jersey 10.8% 11 Oregon 16.4% 11 California 10.7% 12 Washingn 16.3% 12 Utah 10.2% 13 New Mexico 15.1% 13 Delaware 9.7% 14 New Hampshire 14.7% 14 Idaho 9.3% 15 California 14.6% 15 South Carolina 8.5% 16 South Carolina 14.5% 16 Oregon 8.4% 17 Tennessee 14.3% 17 Indiana 8.4% 18 Virginia 14.1% 18 Tennessee 7.6% 19 Arkansas 12.3% 19 Connecticut 6.7% 20 Minnesota 11.7% 20 Washingn 6.1% 21 Maryland 11.5% 21 Arkansas 5.2% 22 New Jersey 9.9% 22 Illinois 4.8% 23 Alaska 9.1% 23 New Hampshire 4.7% 24 Mississippi 9.0% 24 Massachusetts 3.3% 25 Missouri 9.0% 25 Rhode Island 3.1% 26 Rhode Island 8.8% 26 Alabama 1.8% 27 Indiana 8.6% 27 New York 1.4% 28 Oklahoma 8.5% 28 Missouri 1.1% 29 Kentucky 8.4% 29 Kentucky 1.0% 30 Montana 8.4% 30 Michigan 0.7% 31 Wisconsin 8.1% 31 Minnesota 0.6% 32 Nebraska 7.7% 32 New Mexico 0.3% 33 Illinois 7.7% 33 Alaska -0.1% 34 Hawaii 7.6% 34 Kansas -0.6% 35 Vermont 7.3% 35 Mississippi -0.7% 36 Connecticut 7.2% 36 Nebraska -1.2% 37 Alabama 7.0% 37 Oklahoma -1.3% 38 Wyoming 6.6% 38 Hawaii -1.5% 39 South Dakota 6.6% 39 Pennsylvania -1.9% 40 Kansas 6.5% 40 Ohio -2.4% 41 Maine 6.4% 41 Wisconsin -2.6% 42 Massachusetts 6.4% 42 District of Columbia -4.1% 43 New York 5.9% 43 Louisiana -5.3% 44 Michigan 5.5% 44 Iowa -6.2% 45 Louisiana 4.9% 45 South Dakota -7.4% 46 Iowa 4.4% 46 Maine -7.7% 47 Ohio 3.1% 47 Vermont -8.2% 48 Pennsylvania 3.0% 48 West Virginia -10.1% 49 West Virginia -0.2% 49 Montana -11.3% 50 North Dakota -0.8% 50 Wyoming -14.2% 51 District of Columbia -2.0% 51 North Dakota -18.6% National Average 12.8% National Average 7.9% 409
414
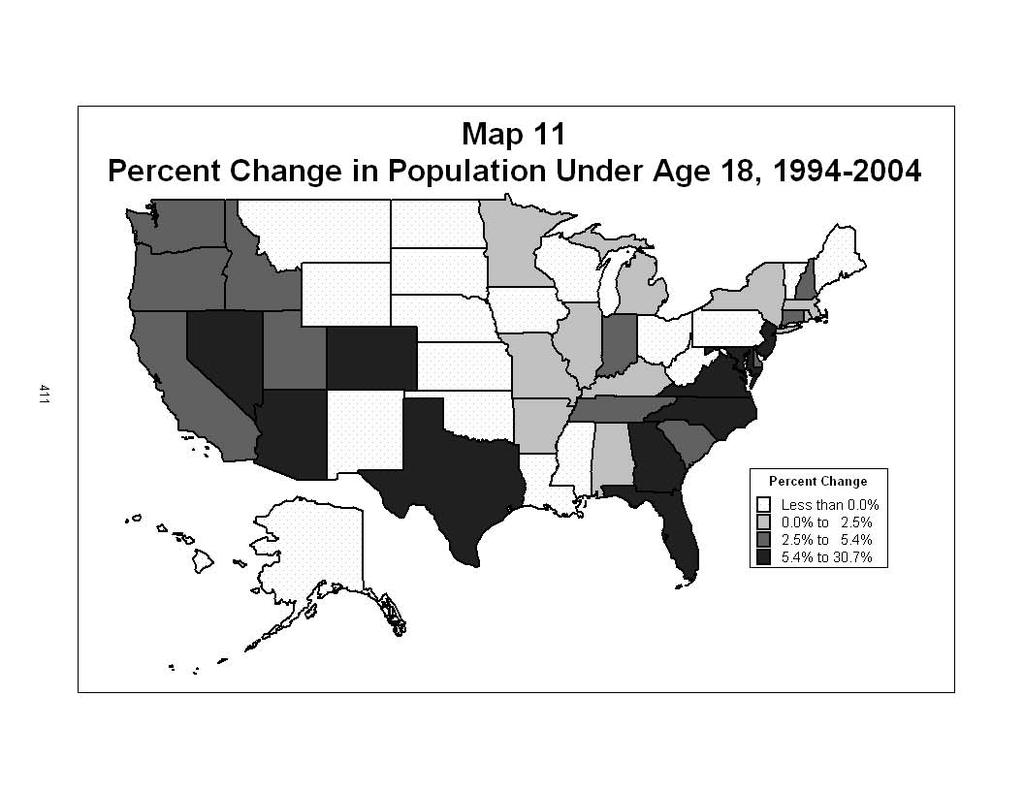
415
416 Table 9 Percent Change in Population, (ages and age 65+) Rank State Ages Rank State Age Nevada 61.0% 1 Nevada 58.1% 2 Arizona 40.6% 2 Alaska 47.9% 3 Utah 32.4% 3 Arizona 30.9% 4 Idaho 29.9% 4 New Mexico 26.4% 5 Florida 29.5% 5 Colorado 22.2% 6 Colorado 27.9% 6 Delaware 22.2% 7 Georgia 26.8% 7 Utah 22.1% 8 Texas 25.3% 8 Idaho 20.9% 9 North Carolina 22.2% 9 Georgia 19.6% 10 Oregon 21.4% 10 South Carolina 19.5% 11 Washingn 21.2% 11 Hawaii 18.6% 12 New Mexico 20.5% 12 Texas 18.4% 13 Delaware 19.2% 13 Wyoming 17.5% 14 New Hampshire 18.6% 14 Virginia 17.0% 15 Minnesota 17.5% 15 North Carolina 16.3% 16 Tennessee 17.3% 16 New Hampshire 15.7% 17 Arkansas 17.1% 17 Vermont 15.6% 18 Montana 16.7% 18 Washingn 13.3% 19 California 16.7% 19 Florida 13.1% 20 South Carolina 16.0% 20 Maryland 13.0% 21 Wyoming 14.6% 21 Tennessee 13.0% 22 South Dakota 14.3% 22 California 12.7% 23 Virginia 14.1% 23 Montana 11.9% 24 Mississippi 14.1% 24 Maine 10.6% 25 Rhode Island 14.0% 25 Oregon 9.1% 26 Oklahoma 13.7% 26 Alabama 8.5% 27 Missouri 13.7% 27 Minnesota 7.7% 28 Wisconsin 13.4% 28 Louisiana 7.6% 29 Nebraska 13.3% 29 Kentucky 7.4% 30 Vermont 12.0% 30 Mississippi 6.7% 31 Kentucky 11.7% 31 Arkansas 6.0% 32 Maryland 11.4% 32 Indiana 5.8% 33 Maine 11.2% 33 Oklahoma 5.4% 34 Kansas 11.1% 34 Wisconsin 5.4% 35 Alaska 10.8% 35 Michigan 5.0% 36 New Jersey 10.8% 36 South Dakota 4.2% 37 Iowa 10.2% 37 New Jersey 4.0% 38 Illinois 10.1% 38 New York 3.6% 39 Indiana 9.2% 39 Missouri 3.4% 40 Hawaii 9.2% 40 Ohio 2.8% 41 Louisiana 9.1% 41 Connecticut 2.2% 42 Massachusetts 9.0% 42 Illinois 2.1% 43 Alabama 8.9% 43 Nebraska 1.6% 44 Connecticut 8.6% 44 West Virginia 0.7% 45 New York 8.2% 45 Kansas 0.4% 46 Michigan 7.7% 46 Massachusetts 0.1% 47 North Dakota 7.0% 47 Iowa -0.1% 48 Pennsylvania 5.9% 48 North Dakota -0.1% 49 Ohio 5.5% 49 Pennsylvania -0.3% 50 West Virginia 3.4% 50 Rhode Island -2.8% 51 District of Columbia 0.7% 51 District of Columbia -12.4% National Average 15.6% National Average 9.3% 412
417
418
419 Table 10 Poverty Rates, 2004 (tal population and under age 18) Rank State Total Population Rank State Under Age 18 1 Mississippi 21.6% 1 District of Columbia 33.9% 2 Louisiana 19.4% 2 Mississippi 31.0% 3 New Mexico 19.3% 3 Louisiana 30.0% 4 District of Columbia 18.9% 4 New Mexico 27.7% 5 West Virginia 17.9% 5 Arkansas 25.9% 6 Arkansas 17.9% 6 Kentucky 25.0% 7 Kentucky 17.4% 7 West Virginia 24.4% 8 Texas 16.6% 8 Alabama 23.3% 9 Alabama 16.1% 9 Texas 22.9% 10 South Carolina 15.7% 10 South Carolina 22.8% 11 Oklahoma 15.3% 11 North Carolina 21.9% 12 North Carolina 15.2% 12 Georgia 21.3% 13 Georgia 14.8% 13 Tennessee 21.1% 14 Idaho 14.5% 14 Rhode Island 21.0% 15 Tennessee 14.5% 15 New York 20.7% 16 New York 14.2% 16 Oklahoma 20.7% 17 Arizona 14.2% 17 Arizona 20.3% 18 Montana 14.2% 18 Idaho 19.6% 19 Oregon 14.1% 19 Montana 19.2% 20 California 13.3% 20 Oregon 19.1% 21 Washingn 13.1% 21 California 18.9% 22 Rhode Island 12.8% 22 Nevada 18.8% 23 Nevada 12.6% 23 Ohio 18.3% 24 Ohio 12.5% 24 Florida 17.7% 25 Maine 12.3% 25 Michigan 17.6% 26 Michigan 12.3% 26 Washingn 17.2% 27 Florida 12.2% 27 Maine 17.1% 28 North Dakota 12.1% 28 Illinois 16.8% 29 Illinois 11.9% 29 Pennsylvania 16.8% 30 Missouri 11.8% 30 Missouri 16.2% 31 Pennsylvania 11.7% 31 North Dakota 15.5% 32 Colorado 11.1% 32 Indiana 14.8% 33 South Dakota 11.0% 33 South Dakota 14.8% 34 Nebraska 11.0% 34 Colorado 14.5% 35 Utah 10.9% 35 Hawaii 14.4% 36 Indiana 10.8% 36 Wyoming 14.0% 37 Wisconsin 10.7% 37 Wisconsin 14.0% 38 Hawaii 10.6% 38 Delaware 13.8% 39 Kansas 10.5% 39 Utah 13.3% 40 Wyoming 10.3% 40 Nebraska 13.1% 41 Delaware 9.9% 41 Virginia 12.9% 42 Iowa 9.9% 42 Massachusetts 12.5% 43 Virginia 9.5% 43 Kansas 12.5% 44 Massachusetts 9.2% 44 Iowa 12.4% 45 Vermont 9.0% 45 New Jersey 11.8% 46 Maryland 8.8% 46 Vermont 11.7% 47 New Jersey 8.5% 47 Maryland 11.4% 48 Minnesota 8.3% 48 Alaska 11.2% 49 Alaska 8.2% 49 Minnesota 10.7% 50 Connecticut 7.6% 50 Connecticut 10.5% 51 New Hampshire 7.6% 51 New Hampshire 9.7% National Average 13.1% National Average 18.4% 415
420
421
422 Table 11 Poverty Rates, 2004 (ages and age 65+) Rank State Ages Rank State Age Mississippi 18.9% 1 Mississippi 15.2% 2 New Mexico 17.2% 2 Louisiana 14.7% 3 West Virginia 17.1% 3 District of Columbia 14.4% 4 Arkansas 15.9% 4 South Carolina 13.3% 5 Louisiana 15.7% 5 Georgia 13.2% 6 Kentucky 15.5% 6 Arkansas 12.8% 7 District of Columbia 15.2% 7 Kentucky 12.6% 8 Oklahoma 14.5% 8 Texas 12.5% 9 Texas 14.4% 9 West Virginia 12.1% 10 Alabama 14.1% 10 Tennessee 12.0% 11 Idaho 13.7% 11 New Mexico 11.9% 12 Oregon 13.7% 12 Alabama 11.9% 13 Montana 13.5% 13 North Carolina 11.6% 14 South Carolina 13.4% 14 New York 11.3% 15 North Carolina 13.3% 15 North Dakota 10.9% 16 Arizona 12.9% 16 Florida 9.7% 17 Tennessee 12.6% 17 Missouri 9.5% 18 Washingn 12.5% 18 Maine 9.5% 19 Georgia 12.3% 19 Oklahoma 9.1% 20 New York 12.3% 20 Montana 8.8% 21 California 11.9% 21 Massachusetts 8.7% 22 Maine 11.3% 22 Virginia 8.6% 23 Ohio 11.2% 23 South Dakota 8.6% 24 North Dakota 11.1% 24 Rhode Island 8.5% 25 Nevada 11.1% 25 Illinois 8.4% 26 Michigan 11.0% 26 Hawaii 8.3% 27 Florida 10.8% 27 New Hampshire 8.3% 28 Nebraska 10.8% 28 Kansas 8.2% 29 Rhode Island 10.7% 29 New Jersey 8.2% 30 Missouri 10.6% 30 Washingn 8.1% 31 Illinois 10.6% 31 Pennsylvania 8.1% 32 Pennsylvania 10.6% 32 Michigan 7.9% 33 Utah 10.5% 33 Vermont 7.8% 34 Colorado 10.3% 34 Iowa 7.8% 35 Kansas 10.2% 35 California 7.8% 36 Wisconsin 10.1% 36 Maryland 7.8% 37 South Dakota 10.0% 37 Nebraska 7.7% 38 Indiana 9.8% 38 Minnesota 7.7% 39 Wyoming 9.7% 39 Ohio 7.6% 40 Hawaii 9.6% 40 Colorado 7.6% 41 Iowa 9.4% 41 Wisconsin 7.6% 42 Delaware 9.0% 42 Arizona 7.5% 43 Vermont 8.4% 43 Indiana 7.3% 44 Virginia 8.3% 44 Idaho 7.2% 45 Massachusetts 8.1% 45 Delaware 7.2% 46 Maryland 7.9% 46 Oregon 6.6% 47 Minnesota 7.6% 47 Connecticut 6.6% 48 Alaska 7.3% 48 Nevada 6.4% 49 New Jersey 7.3% 49 Wyoming 6.1% 50 Connecticut 6.7% 50 Utah 5.4% 51 New Hampshire 6.7% 51 Alaska 3.4% National Average 11.6% National Average 9.4% 418
423
424
425 Table 12 State and Local Revenues, FY 2002 (including federal aid) Rank State Per Capita Rank State Revenues as a % of State Personal Income 1 District of Columbia $12,260 1 Alaska 36.0% 2 Alaska $11,249 2 Wyoming 28.3% 3 Wyoming $8,487 3 District of Columbia 27.1% 4 New York $8,122 4 New Mexico 24.6% 5 Delaware $6,947 5 Mississippi 24.4% 6 Minnesota $6,606 6 North Dakota 24.3% 7 Connecticut $6,593 7 West Virginia 24.1% 8 California $6,478 8 Louisiana 23.6% 9 New Jersey $6,442 9 Maine 23.0% 10 North Dakota $6, Montana 22.9% 11 Vermont $6, New York 22.9% 12 Maine $6, Utah 22.1% 13 Rhode Island $6, Delaware 21.9% 14 Oregon $6, Oregon 21.8% 15 Massachusetts $6, Vermont 21.7% 16 Hawaii $6, Alabama 21.5% 17 Washingn $5, Arkansas 21.4% 18 Wisconsin $5, Iowa 21.2% 19 Maryland $5, Hawaii 21.1% 20 New Mexico $5, Kentucky 20.9% 21 Pennsylvania $5, South Carolina 20.9% 22 Louisiana $5, Wisconsin 20.5% 23 Colorado $5, Rhode Island 20.4% 24 Michigan $5, Minnesota 20.4% 25 Iowa $5, Ohio 20.1% 26 Ohio $5, Oklahoma 20.0% 27 Nebraska $5, Idaho 20.0% 28 Montana $5, California 20.0% 29 West Virginia $5, Nebraska 19.9% 30 Illinois $5, North Carolina 19.6% 31 Kansas $5, Michigan 19.3% 32 Utah $5, Pennsylvania 19.3% 33 Virginia $5, Indiana 19.3% 34 Mississippi $5, South Dakota 19.1% 35 North Carolina $5, Kansas 18.9% 36 Alabama $5, Washingn 18.8% 37 Nevada $5, Missouri 18.5% 38 Indiana $5, Georgia 18.4% 39 Florida $5, Arizona 18.4% 40 Georgia $5, Florida 18.1% 41 Kentucky $5, Tennessee 17.8% 42 Oklahoma $5, Nevada 17.7% 43 South Carolina $5, Texas 17.6% 44 South Dakota $5, Colorado 17.1% 45 Missouri $5, Illinois 17.0% 46 Texas $5, Maryland 16.9% 47 New Hampshire $5, Virginia 16.7% 48 Idaho $4, New Jersey 16.6% 49 Arkansas $4, Massachusetts 15.7% 50 Tennessee $4, Connecticut 15.5% 51 Arizona $4, New Hampshire 15.0% National Average $5,851 National Average 19.3% 421
426 Table 13 State and Local Revenues, FY 2002 (excluding federal aid) Rank State Per Capita Rank State Revenues as a % of State Personal Income 1 Alaska $8,457 1 Alaska 27.0% 2 District of Columbia $7,230 2 Wyoming 20.4% 3 New York $6,232 3 Delaware 18.2% 4 Wyoming $6,109 4 Louisiana 17.7% 5 Delaware $5,757 5 Maine 17.6% 6 Connecticut $5,425 6 New York 17.6% 7 New Jersey $5,399 7 New Mexico 17.5% 8 Minnesota $5,394 8 Utah 17.5% 9 Massachusetts $5,119 9 North Dakota 17.2% 10 California $5, Mississippi 17.0% 11 Maryland $4, West Virginia 17.0% 12 Colorado $4, Hawaii 16.7% 13 Washingn $4, Minnesota 16.7% 14 Wisconsin $4, Iowa 16.7% 15 Hawaii $4, Wisconsin 16.4% 16 Maine $4, District of Columbia 16.0% 17 Rhode Island $4, Nebraska 15.9% 18 Nebraska $4, Ohio 15.9% 19 Pennsylvania $4, Alabama 15.8% 20 Ohio $4, Montana 15.8% 21 Michigan $4, Idaho 15.7% 22 Iowa $4, California 15.7% 23 Nevada $4, South Carolina 15.7% 24 Virginia $4, Vermont 15.6% 25 Vermont $4, Kentucky 15.6% 26 Illinois $4, Indiana 15.5% 27 North Dakota $4, Arkansas 15.5% 28 Louisiana $4, Oregon 15.3% 29 Oregon $4, Nevada 15.2% 30 Florida $4, Michigan 15.2% 31 Utah $4, Washingn 15.1% 32 Kansas $4, Oklahoma 15.1% 33 Indiana $4, North Carolina 15.1% 34 New Mexico $4, Pennsylvania 15.0% 35 Georgia $4, Rhode Island 15.0% 36 North Carolina $4, Florida 15.0% 37 New Hampshire $4, Kansas 14.9% 38 Texas $3, Georgia 14.5% 39 West Virginia $3, Arizona 14.3% 40 Oklahoma $3, Colorado 14.3% 41 Alabama $3, Virginia 14.0% 42 Montana $3, Texas 13.9% 43 Idaho $3, New Jersey 13.9% 44 South Carolina $3, Missouri 13.8% 45 Kentucky $3, Illinois 13.8% 46 Missouri $3, Maryland 13.8% 47 Mississippi $3, South Dakota 13.5% 48 Arizona $3, Massachusetts 13.2% 49 South Dakota $3, Tennessee 12.9% 50 Arkansas $3, Connecticut 12.7% 51 Tennessee $3, New Hampshire 12.0% National Average $4,599 National Average 15.2% 422
427 Table 14 State and Local Taxes, FY 2002 Rank State Per Capita Rank State Taxes as a % of State Personal Income 1 District of Columbia $5,717 1 New York 13.1% 2 New York $4,641 2 Maine 12.9% 3 Connecticut $4,373 3 District of Columbia 12.6% 4 New Jersey $4,037 4 Wyoming 12.1% 5 Massachusetts $3,726 5 Hawaii 12.1% 6 Minnesota $3,673 6 Wisconsin 11.7% 7 Maryland $3,652 7 Minnesota 11.4% 8 Wyoming $3,643 8 Rhode Island 11.2% 9 Maine $3,499 9 Ohio 11.1% 10 California $3, West Virginia 11.1% 11 Hawaii $3, Vermont 11.1% 12 Wisconsin $3, New Mexico 11.1% 13 Rhode Island $3, Louisiana 11.0% 14 Delaware $3, Nebraska 10.8% 15 Illinois $3, Utah 10.6% 16 Alaska $3, Kentucky 10.6% 17 Washingn $3, California 10.6% 18 Vermont $3, Delaware 10.5% 19 Ohio $3, North Dakota 10.5% 20 Colorado $3, Iowa 10.5% 21 Nebraska $3, Arkansas 10.4% 22 Pennsylvania $3, New Jersey 10.4% 23 Michigan $3, Mississippi 10.4% 24 Virginia $3, Arizona 10.4% 25 Nevada $2, Maryland 10.4% 26 Kansas $2, Alaska 10.3% 27 Iowa $2, Kansas 10.3% 28 New Hampshire $2, Connecticut 10.3% 29 Georgia $2, Michigan 10.2% 30 Indiana $2, Illinois 10.2% 31 North Dakota $2, Indiana 10.1% 32 Louisiana $2, Pennsylvania 10.1% 33 North Carolina $2, Washingn 10.1% 34 Texas $2, North Carolina 10.0% 35 Florida $2, Georgia 10.0% 36 Missouri $2, Nevada 10.0% 37 Arizona $2, Idaho 10.0% 38 Kentucky $2, Oklahoma 9.7% 39 New Mexico $2, Missouri 9.6% 40 Utah $2, South Carolina 9.6% 41 West Virginia $2, Massachusetts 9.6% 42 Oregon $2, Montana 9.5% 43 Oklahoma $2, Texas 9.5% 44 Idaho $2, Virginia 9.5% 45 South Dakota $2, Florida 9.4% 46 Arkansas $2, Colorado 9.1% 47 South Carolina $2, Oregon 9.1% 48 Montana $2, South Dakota 9.0% 49 Mississippi $2, Alabama 8.8% 50 Tennessee $2, New Hampshire 8.4% 51 Alabama $2, Tennessee 8.4% National Average $3,143 National Average 10.4% 423
428 Table 15 State and Local Property Taxes, FY 2002 Rank State Per Capita Rank State Taxes as a % of State Personal Income 1 New Jersey $1,871 1 Maine 5.4% 2 Connecticut $1,733 2 New Hampshire 5.1% 3 New Hampshire $1,701 3 New Jersey 4.8% 4 Maine $1,473 4 Vermont 4.6% 5 District of Columbia $1,423 5 Wyoming 4.6% 6 New York $1,401 6 Rhode Island 4.5% 7 Wyoming $1,387 7 Alaska 4.1% 8 Rhode Island $1,368 8 Wisconsin 4.1% 9 Massachusetts $1,360 9 Connecticut 4.1% 10 Vermont $1, Texas 4.0% 11 Alaska $1, New York 3.9% 12 Illinois $1, Illinois 3.9% 13 Wisconsin $1, Montana 3.8% 14 Texas $1, Iowa 3.6% 15 Minnesota $1, Indiana 3.6% 16 Nebraska $1, Nebraska 3.5% 17 Maryland $ Massachusetts 3.5% 18 Iowa $ Florida 3.3% 19 Michigan $ South Dakota 3.3% 20 Indiana $ Michigan 3.3% 21 Washingn $ Ohio 3.3% 22 Florida $ Kansas 3.3% 23 Montana $ North Dakota 3.2% 24 Ohio $ Minnesota 3.2% 25 Kansas $ Oregon 3.2% 26 Colorado $ District of Columbia 3.1% 27 Virginia $ Arizona 3.1% 28 Oregon $ South Carolina 3.1% 29 Pennsylvania $ Washingn 3.0% 30 South Dakota $ Pennsylvania 2.9% 31 California $ Idaho 2.9% 32 North Dakota $ Virginia 2.9% 33 Nevada $ Maryland 2.8% 34 Arizona $ Georgia 2.8% 35 Georgia $ Colorado 2.7% 36 South Carolina $ California 2.7% 37 Idaho $ Nevada 2.6% 38 Missouri $ Mississippi 2.6% 39 North Carolina $ Utah 2.5% 40 Utah $ Missouri 2.5% 41 Tennessee $ North Carolina 2.4% 42 Mississippi $ Tennessee 2.2% 43 West Virginia $ West Virginia 2.2% 44 Hawaii $ Kentucky 2.0% 45 Delaware $ Louisiana 1.8% 46 Kentucky $ Hawaii 1.8% 47 Louisiana $ New Mexico 1.7% 48 Oklahoma $ Oklahoma 1.6% 49 New Mexico $ Arkansas 1.6% 50 Arkansas $ Delaware 1.6% 51 Alabama $ Alabama 1.3% National Average $969 National Average 3.2% 424
429 Table 16 State and Local General Sales Taxes, FY 2002 Rank State Per Capita Rank State Taxes as a % of State Personal Income 1 Washingn $1,522 1 Washingn 4.8% 2 Hawaii $1,306 2 Hawaii 4.6% 3 Wyoming $1,161 3 Louisiana 4.4% 4 Louisiana $1,081 4 Arizona 4.2% 5 Arizona $1,063 5 Arkansas 4.1% 6 Nevada $1,022 6 New Mexico 4.0% 7 Tennessee $1,009 7 Wyoming 3.9% 8 District of Columbia $989 8 Tennessee 3.8% 9 New Mexico $951 9 Mississippi 3.7% 10 Arkansas $ Utah 3.5% 11 Colorado $ Nevada 3.4% 12 Florida $ South Dakota 3.3% 13 California $ Florida 3.1% 14 South Dakota $ Georgia 3.1% 15 Connecticut $ Kansas 3.0% 16 Georgia $ Texas 3.0% 17 New York $ Oklahoma 2.9% 18 Utah $ California 2.8% 19 Kansas $ Missouri 2.7% 20 Texas $ Colorado 2.7% 21 Mississippi $ Alabama 2.7% 22 Michigan $ Nebraska 2.6% 23 Minnesota $ Michigan 2.6% 24 Missouri $ Iowa 2.5% 25 Nebraska $ Wisconsin 2.5% 26 Oklahoma $ New York 2.4% 27 Wisconsin $ Idaho 2.4% 28 New Jersey $ South Carolina 2.4% 29 Iowa $ North Dakota 2.4% 30 Rhode Island $ Maine 2.4% 31 Ohio $ Ohio 2.4% 32 Alabama $ Minnesota 2.3% 33 Maine $ West Virginia 2.3% 34 North Dakota $ Kentucky 2.3% 35 Indiana $ Indiana 2.3% 36 Pennsylvania $ Rhode Island 2.3% 37 Illinois $ District of Columbia 2.2% 38 South Carolina $ North Carolina 2.2% 39 Idaho $ Connecticut 2.1% 40 North Carolina $ Pennsylvania 2.0% 41 Massachusetts $ Illinois 1.8% 42 Kentucky $ New Jersey 1.8% 43 West Virginia $ Virginia 1.5% 44 Maryland $ Massachusetts 1.5% 45 Virginia $ Maryland 1.4% 46 Vermont $ Vermont 1.2% 47 Alaska $ Alaska 0.6% 48 Delaware $0 48 Delaware 0.0% 49 Montana $0 49 Montana 0.0% 50 New Hampshire $0 50 New Hampshire 0.0% 51 Oregon $0 51 Oregon 0.0% National Average $774 National Average 2.6% 425
430 Table 17 State and Local Income Taxes, FY 2002 (including personal and corporate income taxes) Rank State Per Capita Rank State Taxes as a % of State Personal Income 1 District of Columbia $2,055 1 New York 5.2% 2 New York $1,842 2 District of Columbia 4.5% 3 Maryland $1,471 3 Maryland 4.2% 4 Massachusetts $1,361 4 Delaware 4.0% 5 Delaware $1,259 5 Oregon 3.9% 6 Minnesota $1,189 6 Ohio 3.9% 7 Connecticut $1,109 7 Kentucky 3.7% 8 Ohio $1,100 8 Minnesota 3.7% 9 Oregon $1,099 9 North Carolina 3.5% 10 California $1, Massachusetts 3.5% 11 Wisconsin $ Wisconsin 3.4% 12 Virginia $ California 3.4% 13 North Carolina $ Hawaii 3.3% 14 Hawaii $ Maine 3.3% 15 New Jersey $ Utah 3.0% 16 Kentucky $ Virginia 3.0% 17 Maine $ West Virginia 3.0% 18 Pennsylvania $ Georgia 2.9% 19 Michigan $ Michigan 2.9% 20 Georgia $ Indiana 2.9% 21 Colorado $ Pennsylvania 2.9% 22 Rhode Island $ Arkansas 2.8% 23 Indiana $ Idaho 2.8% 24 Missouri $ Oklahoma 2.7% 25 Utah $ Missouri 2.7% 26 Nebraska $ Rhode Island 2.6% 27 Kansas $ Montana 2.6% 28 Vermont $ Connecticut 2.6% 29 Oklahoma $ Nebraska 2.6% 30 Illinois $ Kansas 2.5% 31 West Virginia $ Vermont 2.5% 32 Idaho $ New Mexico 2.5% 33 Iowa $ South Carolina 2.5% 34 Arkansas $ Colorado 2.4% 35 Montana $ Iowa 2.4% 36 South Carolina $ New Jersey 2.4% 37 New Mexico $ Alabama 2.2% 38 Alabama $ Illinois 2.2% 39 Louisiana $ Mississippi 1.9% 40 Arizona $ Louisiana 1.9% 41 Alaska $ Arizona 1.8% 42 Mississippi $ North Dakota 1.5% 43 North Dakota $ Alaska 1.3% 44 New Hampshire $ New Hampshire 1.1% 45 Tennessee $ Tennessee 0.4% 46 Florida $73 46 Florida 0.3% 47 South Dakota $53 47 South Dakota 0.2% 48 Texas $0 48 Texas 0.0% 49 Nevada $0 49 Nevada 0.0% 50 Washingn $0 50 Washingn 0.0% 51 Wyoming $0 51 Wyoming 0.0% National Average $802 National Average 2.7% 426
431 Table 18 State and Local Personal Income Taxes, FY 2002 Rank State Per Capita Rank State Taxes as a % of State Personal Income 1 District of Columbia $1,681 1 New York 4.4% 2 New York $1,577 2 Maryland 4.0% 3 Maryland $1,405 3 District of Columbia 3.7% 4 Massachusetts $1,234 4 Oregon 3.7% 5 Minnesota $1,083 5 Ohio 3.6% 6 Connecticut $1,065 6 Kentucky 3.4% 7 Oregon $1,043 7 Minnesota 3.3% 8 Ohio $1,034 8 North Carolina 3.2% 9 Delaware $947 9 Massachusetts 3.2% 10 California $ Hawaii 3.2% 11 Virginia $ Wisconsin 3.1% 12 Wisconsin $ Maine 3.1% 13 Hawaii $ Delaware 3.0% 14 North Carolina $ California 2.9% 15 Kentucky $ Virginia 2.9% 16 Maine $ Utah 2.8% 17 New Jersey $ Georgia 2.7% 18 Colorado $ Pennsylvania 2.6% 19 Pennsylvania $ Idaho 2.5% 20 Rhode Island $ Rhode Island 2.5% 21 Georgia $ Oklahoma 2.5% 22 Utah $ Arkansas 2.5% 23 Missouri $ Missouri 2.5% 24 Kansas $ Connecticut 2.5% 25 Indiana $ West Virginia 2.5% 26 Nebraska $ Indiana 2.5% 27 Vermont $ Kansas 2.4% 28 Michigan $ Nebraska 2.3% 29 Oklahoma $ South Carolina 2.3% 30 Idaho $ Montana 2.3% 31 Iowa $ Vermont 2.3% 32 Illinois $ Iowa 2.3% 33 Arkansas $ Colorado 2.3% 34 West Virginia $ New Mexico 2.2% 35 South Carolina $ Michigan 2.2% 36 Montana $ New Jersey 2.1% 37 New Mexico $ Alabama 1.9% 38 Alabama $ Illinois 1.8% 39 Louisiana $ Louisiana 1.6% 40 Arizona $ Mississippi 1.6% 41 Mississippi $ Arizona 1.5% 42 North Dakota $ North Dakota 1.2% 43 New Hampshire $56 43 New Hampshire 0.2% 44 Tennessee $25 44 Tennessee 0.1% 45 Texas $0 45 Texas 0.0% 46 Alaska $0 46 Alaska 0.0% 47 Florida $0 47 Florida 0.0% 48 Nevada $0 48 Nevada 0.0% 49 South Dakota $0 49 South Dakota 0.0% 50 Washingn $0 50 Washingn 0.0% 51 Wyoming $0 51 Wyoming 0.0% National Average $705 National Average 2.3% 427
432 Table 19 State and Local Corporate Income Taxes, FY 2002 Rank State Per Capita Rank State Taxes as a % of State Personal Income 1 Alaska $420 1 Alaska 1.3% 2 District of Columbia $374 2 Delaware 1.0% 3 Delaware $312 3 New Hampshire 0.9% 4 New Hampshire $296 4 District of Columbia 0.8% 5 New York $265 5 New York 0.7% 6 Michigan $206 6 Michigan 0.7% 7 California $152 7 West Virginia 0.5% 8 New Jersey $128 8 California 0.5% 9 Massachusetts $127 9 Indiana 0.4% 10 West Virginia $ Illinois 0.3% 11 Indiana $ New Jersey 0.3% 12 Illinois $ Minnesota 0.3% 13 Minnesota $ Massachusetts 0.3% 14 Pennsylvania $97 14 Tennessee 0.3% 15 Tennessee $87 15 Pennsylvania 0.3% 16 Wisconsin $82 16 Mississippi 0.3% 17 North Carolina $80 17 Montana 0.3% 18 North Dakota $79 18 North Dakota 0.3% 19 Montana $75 19 Kentucky 0.3% 20 Kentucky $74 20 North Carolina 0.3% 21 Florida $73 21 Alabama 0.3% 22 Alabama $72 22 Arkansas 0.3% 23 Mississippi $68 23 New Mexico 0.3% 24 New Mexico $67 24 Wisconsin 0.3% 25 Ohio $67 25 Florida 0.3% 26 Georgia $67 26 Arizona 0.2% 27 Maryland $66 27 Louisiana 0.2% 28 Arkansas $65 28 Georgia 0.2% 29 Arizona $64 29 Ohio 0.2% 30 Nebraska $62 30 Idaho 0.2% 31 Vermont $61 31 Maine 0.2% 32 Maine $60 32 Nebraska 0.2% 33 Louisiana $59 33 Vermont 0.2% 34 Idaho $57 34 South Dakota 0.2% 35 Oregon $56 35 Oregon 0.2% 36 South Dakota $53 36 Utah 0.2% 37 Missouri $53 37 Oklahoma 0.2% 38 Oklahoma $50 38 Missouri 0.2% 39 Utah $48 39 Maryland 0.2% 40 Colorado $46 40 South Carolina 0.2% 41 Kansas $45 41 Kansas 0.2% 42 Connecticut $43 42 Hawaii 0.1% 43 Hawaii $43 43 Colorado 0.1% 44 Virginia $42 44 Virginia 0.1% 45 South Carolina $39 45 Iowa 0.1% 46 Iowa $30 46 Connecticut 0.1% 47 Rhode Island $26 47 Rhode Island 0.1% 48 Nevada $0 48 Nevada 0.0% 49 Texas $0 49 Texas 0.0% 50 Washingn $0 50 Washingn 0.0% 51 Wyoming $0 51 Wyoming 0.0% National Average $98 National Average 0.3% 428
433 Table 20 State and Local General Expenditures, FY 2002 (including expenditures federal government) Rank State Per Capita Rank State Expenditures as a % of State Personal Income 1 Alaska $13,175 1 Alaska 42.1% 2 District of Columbia $10,944 2 New Mexico 25.9% 3 New York $8,445 3 Wyoming 25.7% 4 Wyoming $7,719 4 Mississippi 24.5% 5 Connecticut $6,996 5 District of Columbia 24.2% 6 Minnesota $6,952 6 New York 23.8% 7 California $6,817 7 Hawaii 23.6% 8 Hawaii $6,726 8 North Dakota 23.6% 9 Delaware $6,647 9 West Virginia 23.5% 10 Massachusetts $6, South Carolina 23.5% 11 Oregon $6, Oregon 23.2% 12 Washingn $6, Maine 22.7% 13 New Jersey $6, Utah 22.7% 14 Rhode Island $6, Montana 22.6% 15 Wisconsin $6, Alabama 22.3% 16 Vermont $6, Louisiana 22.1% 17 New Mexico $6, Iowa 21.7% 18 Maine $6, Vermont 21.5% 19 North Dakota $6, Minnesota 21.5% 20 Michigan $6, Wisconsin 21.4% 21 Colorado $6, Kentucky 21.3% 22 Pennsylvania $5, Arkansas 21.1% 23 Ohio $5, California 21.0% 24 Iowa $5, Delaware 21.0% 25 Illinois $5, Rhode Island 20.9% 26 Maryland $5, Ohio 20.6% 27 South Carolina $5, Idaho 20.6% 28 Nebraska $5, Michigan 20.3% 29 Montana $5, Oklahoma 20.2% 30 Utah $5, Washingn 20.0% 31 Alabama $5, Nebraska 19.8% 32 Kansas $5, Pennsylvania 19.8% 33 West Virginia $5, North Carolina 19.8% 34 Louisiana $5, Indiana 19.5% 35 Nevada $5, Kansas 19.2% 36 Virginia $5, South Dakota 19.0% 37 Mississippi $5, Tennessee 18.7% 38 North Carolina $5, Georgia 18.7% 39 Indiana $5, Missouri 18.5% 40 Kentucky $5, Nevada 18.3% 41 Georgia $5, Florida 18.2% 42 Florida $5, Arizona 18.2% 43 Oklahoma $5, Illinois 18.1% 44 Texas $5, Texas 18.0% 45 Missouri $5, Colorado 17.7% 46 South Dakota $5, Massachusetts 17.1% 47 Idaho $5, Virginia 16.8% 48 Tennessee $4, Maryland 16.6% 49 New Hampshire $4, Connecticut 16.4% 50 Arkansas $4, New Jersey 16.4% 51 Arizona $4, New Hampshire 14.9% National Average $6,026 National Average 19.9% 429
434 Table 21 State and Local General Expenditures, FY 2002 (excluding expenditures federal government) Rank State Per Capita Rank State Expenditures as a % of State Personal Income 1 Alaska $13,175 1 Alaska 42.1% 2 District of Columbia $10,944 2 New Mexico 25.9% 3 New York $8,414 3 Wyoming 25.7% 4 Wyoming $7,719 4 Mississippi 24.5% 5 Connecticut $6,996 5 District of Columbia 24.2% 6 Minnesota $6,952 6 New York 23.7% 7 California $6,734 7 North Dakota 23.6% 8 Hawaii $6,715 8 Hawaii 23.6% 9 Delaware $6,645 9 West Virginia 23.5% 10 Massachusetts $6, South Carolina 23.5% 11 Oregon $6, Oregon 23.2% 12 Washingn $6, Utah 22.7% 13 New Jersey $6, Maine 22.6% 14 Rhode Island $6, Montana 22.6% 15 Wisconsin $6, Alabama 22.3% 16 Vermont $6, Louisiana 22.1% 17 New Mexico $6, Iowa 21.6% 18 North Dakota $6, Minnesota 21.5% 19 Maine $6, Vermont 21.4% 20 Michigan $6, Wisconsin 21.4% 21 Colorado $6, Kentucky 21.3% 22 Pennsylvania $5, Arkansas 21.1% 23 Ohio $5, Delaware 21.0% 24 Illinois $5, Rhode Island 20.8% 25 Iowa $5, California 20.8% 26 Maryland $5, Ohio 20.6% 27 South Carolina $5, Idaho 20.6% 28 Nebraska $5, Michigan 20.3% 29 Montana $5, Oklahoma 20.1% 30 Utah $5, Washingn 20.0% 31 Alabama $5, Nebraska 19.8% 32 Kansas $5, North Carolina 19.8% 33 West Virginia $5, Pennsylvania 19.7% 34 Louisiana $5, Indiana 19.5% 35 Nevada $5, Kansas 19.2% 36 Virginia $5, South Dakota 19.0% 37 Mississippi $5, Tennessee 18.7% 38 North Carolina $5, Georgia 18.7% 39 Indiana $5, Missouri 18.5% 40 Kentucky $5, Nevada 18.3% 41 Georgia $5, Florida 18.2% 42 Florida $5, Arizona 18.2% 43 Oklahoma $5, Illinois 18.1% 44 Texas $5, Texas 18.0% 45 Missouri $5, Colorado 17.7% 46 South Dakota $5, Massachusetts 17.0% 47 Idaho $5, Virginia 16.8% 48 Tennessee $4, Maryland 16.6% 49 New Hampshire $4, Connecticut 16.4% 50 Arkansas $4, New Jersey 16.3% 51 Arizona $4, New Hampshire 14.9% National Average $6,011 National Average 19.9% 430
435 Table 22 State and Local Education Expenditures, FY 2002 Rank State Per Capita Rank State Expenditures as a % of State Personal Income 1 Alaska $3,287 1 Alaska 10.5% 2 Wyoming $2,559 2 New Mexico 9.5% 3 New York $2,492 3 Utah 9.2% 4 Delaware $2,402 4 Wyoming 8.5% 5 New Jersey $2,395 5 West Virginia 8.4% 6 Vermont $2,369 6 South Carolina 8.3% 7 Michigan $2,365 7 Vermont 8.2% 8 Wisconsin $2,310 8 Iowa 8.1% 9 Connecticut $2,270 9 Mississippi 8.1% 10 New Mexico $2, Montana 8.0% 11 Minnesota $2, North Dakota 8.0% 12 Utah $2, Michigan 7.9% 13 Maryland $2, Wisconsin 7.9% 14 Iowa $2, Arkansas 7.7% 15 Nebraska $2, Nebraska 7.7% 16 California $2, Oklahoma 7.7% 17 Oregon $2, Oregon 7.6% 18 Washingn $2, Delaware 7.6% 19 Texas $2, Alabama 7.5% 20 Massachusetts $2, Texas 7.4% 21 Virginia $2, Idaho 7.3% 22 District of Columbia $2, Indiana 7.3% 23 Ohio $2, Ohio 7.3% 24 North Dakota $2, Louisiana 7.3% 25 Illinois $2, Georgia 7.2% 26 South Carolina $2, Maine 7.1% 27 Rhode Island $2, Kansas 7.1% 28 Georgia $2, New York 7.0% 29 Kansas $2, Minnesota 6.9% 30 Colorado $2, Kentucky 6.8% 31 Indiana $1, North Carolina 6.8% 32 Oklahoma $1, California 6.8% 33 Pennsylvania $1, Missouri 6.7% 34 Montana $1, Rhode Island 6.7% 35 West Virginia $1, South Dakota 6.7% 36 Maine $1, Washingn 6.6% 37 New Hampshire $1, Pennsylvania 6.5% 38 Missouri $1, Virginia 6.5% 39 Alabama $1, Hawaii 6.4% 40 North Carolina $1, Illinois 6.4% 41 Hawaii $1, Maryland 6.3% 42 Idaho $1, Arizona 6.3% 43 South Dakota $1, New Jersey 6.2% 44 Louisiana $1, Tennessee 6.1% 45 Mississippi $1, Colorado 5.9% 46 Arkansas $1, New Hampshire 5.7% 47 Nevada $1, Nevada 5.7% 48 Kentucky $1, Massachusetts 5.4% 49 Tennessee $1, Florida 5.4% 50 Arizona $1, Connecticut 5.3% 51 Florida $1, District of Columbia 4.6% National Average $2,065 National Average 6.8% 431
436 Table 23 State and Local Public Welfare Expenditures, FY 2002 Rank State Per Capita Rank State Expenditures as a % of State Personal Income 1 District of Columbia $2,590 1 District of Columbia 5.7% 2 New York $1,697 2 Alaska 5.2% 3 Alaska $1,615 3 Mississippi 5.2% 4 Rhode Island $1,559 4 Rhode Island 5.1% 5 Minnesota $1,487 5 West Virginia 5.1% 6 Maine $1,381 6 Maine 5.1% 7 Vermont $1,228 7 New York 4.8% 8 West Virginia $1,185 8 Kentucky 4.8% 9 Kentucky $1,178 9 New Mexico 4.7% 10 Pennsylvania $1, Minnesota 4.6% 11 Oregon $1, South Carolina 4.3% 12 Mississippi $1, Vermont 4.3% 13 New Mexico $1, Arkansas 4.2% 14 Tennessee $1, Tennessee 4.2% 15 Ohio $1, Oregon 4.1% 16 South Carolina $1, North Dakota 4.0% 17 North Dakota $1, Pennsylvania 3.9% 18 Wisconsin $1, Ohio 3.8% 19 Washingn $1, Alabama 3.8% 20 California $1, Oklahoma 3.5% 21 Connecticut $1, Missouri 3.5% 22 Nebraska $ Wisconsin 3.5% 23 Michigan $ Nebraska 3.5% 24 Missouri $ North Carolina 3.4% 25 Arkansas $ Iowa 3.4% 26 Alabama $ Michigan 3.3% 27 Hawaii $ Hawaii 3.2% 28 North Carolina $ Washingn 3.2% 29 Oklahoma $ Indiana 3.2% 30 Iowa $ California 3.1% 31 Massachusetts $ Idaho 3.1% 32 Maryland $ Louisiana 3.0% 33 Indiana $ Montana 3.0% 34 Delaware $ South Dakota 3.0% 35 New Hampshire $ Utah 2.8% 36 South Dakota $ Florida 2.6% 37 Illinois $ Kansas 2.6% 38 Idaho $ Delaware 2.6% 39 New Jersey $ Georgia 2.6% 40 Wyoming $ Wyoming 2.5% 41 Louisiana $ Maryland 2.5% 42 Florida $ Illinois 2.4% 43 Kansas $ New Hampshire 2.4% 44 Montana $ Texas 2.4% 45 Georgia $ Arizona 2.4% 46 Utah $ Connecticut 2.4% 47 Texas $ Massachusetts 2.3% 48 Virginia $ Virginia 2.0% 49 Colorado $ New Jersey 2.0% 50 Arizona $ Colorado 1.8% 51 Nevada $ Nevada 1.7% National Average $971 National Average 3.2% 432
437 Table 24 State and Local Health and Hospital Expenditures, FY 2002 Rank State Per Capita Rank State Expenditures as a % of State Personal Income 1 Wyoming $1,034 1 Alabama 3.7% 2 District of Columbia $983 2 Wyoming 3.4% 3 Alabama $911 3 Mississippi 3.4% 4 Louisiana $809 4 Louisiana 3.3% 5 South Carolina $766 5 South Carolina 3.1% 6 Mississippi $746 6 North Carolina 2.7% 7 North Carolina $732 7 Iowa 2.4% 8 New York $679 8 Oregon 2.2% 9 Washingn $661 9 District of Columbia 2.2% 10 Iowa $ Tennessee 2.1% 11 Oregon $ Washingn 2.1% 12 California $ Georgia 2.0% 13 Tennessee $ New York 1.9% 14 Georgia $ New Mexico 1.9% 15 Connecticut $ Hawaii 1.9% 16 Michigan $ California 1.8% 17 Hawaii $ Idaho 1.8% 18 Massachusetts $ Michigan 1.8% 19 Ohio $ Indiana 1.7% 20 Indiana $ Montana 1.7% 21 Texas $ Ohio 1.7% 22 Kansas $ Texas 1.6% 23 Colorado $ Kansas 1.6% 24 Idaho $ Florida 1.6% 25 Florida $ Missouri 1.6% 26 New Mexico $ Utah 1.5% 27 Virginia $ Arkansas 1.5% 28 Missouri $ Oklahoma 1.4% 29 Nevada $ Nevada 1.4% 30 Pennsylvania $ Kentucky 1.4% 31 Montana $ Maine 1.4% 32 Illinois $ Pennsylvania 1.4% 33 Alaska $ Virginia 1.4% 34 Delaware $ Colorado 1.3% 35 Minnesota $ Alaska 1.3% 36 Maine $ Wisconsin 1.3% 37 Wisconsin $ Connecticut 1.3% 38 Oklahoma $ Delaware 1.3% 39 Utah $ Illinois 1.3% 40 Kentucky $ Massachusetts 1.3% 41 Nebraska $ West Virginia 1.2% 42 Arkansas $ Nebraska 1.2% 43 New Jersey $ Minnesota 1.2% 44 West Virginia $ Rhode Island 0.9% 45 Rhode Island $ Arizona 0.9% 46 Maryland $ South Dakota 0.8% 47 South Dakota $ New Jersey 0.8% 48 Arizona $ Maryland 0.8% 49 North Dakota $ North Dakota 0.6% 50 New Hampshire $ Vermont 0.5% 51 Vermont $ New Hampshire 0.4% National Average $508 National Average 1.7% 433
438 Table 25 State and Local Highway Expenditures, FY 2002 Rank State Per Capita Rank State Expenditures as a % of State Personal Income 1 Alaska $1,429 1 Alaska 4.6% 2 Wyoming $956 2 Wyoming 3.2% 3 South Dakota $763 3 South Dakota 2.8% 4 North Dakota $727 4 North Dakota 2.8% 5 Colorado $630 5 New Mexico 2.6% 6 New Mexico $616 6 West Virginia 2.5% 7 Iowa $600 7 Montana 2.4% 8 Montana $596 8 Iowa 2.2% 9 Vermont $588 9 Arkansas 2.1% 10 Nevada $ Vermont 2.0% 11 West Virginia $ Nevada 2.0% 12 Delaware $ Mississippi 2.0% 13 Kansas $ Kansas 2.0% 14 Wisconsin $ Kentucky 1.9% 15 Nebraska $ Wisconsin 1.9% 16 Minnesota $ Nebraska 1.9% 17 Massachusetts $ Idaho 1.9% 18 Arkansas $ Colorado 1.9% 19 Kentucky $ Delaware 1.8% 20 Maine $ Utah 1.8% 21 Idaho $ Maine 1.8% 22 Illinois $ Oklahoma 1.7% 23 Oklahoma $ Minnesota 1.6% 24 Utah $ Missouri 1.6% 25 Missouri $ Alabama 1.5% 26 Mississippi $ South Carolina 1.5% 27 Pennsylvania $ Pennsylvania 1.4% 28 Virginia $ Florida 1.4% 29 Florida $ Illinois 1.4% 30 New Hampshire $ Louisiana 1.4% 31 Washingn $ Arizona 1.4% 32 Alabama $ North Carolina 1.3% 33 New York $ Virginia 1.3% 34 South Carolina $ Massachusetts 1.3% 35 North Carolina $ Ohio 1.3% 36 Ohio $ Washingn 1.2% 37 Connecticut $ Georgia 1.2% 38 Arizona $ Texas 1.2% 39 Texas $ Indiana 1.2% 40 New Jersey $ Oregon 1.2% 41 Georgia $ Hawaii 1.2% 42 Louisiana $ New Hampshire 1.2% 43 Maryland $ Tennessee 1.1% 44 Oregon $ Michigan 1.1% 45 Hawaii $ New York 1.0% 46 Indiana $ Rhode Island 1.0% 47 California $ California 1.0% 48 Michigan $ Maryland 1.0% 49 Rhode Island $ New Jersey 0.9% 50 Tennessee $ Connecticut 0.8% 51 District of Columbia $ District of Columbia 0.3% National Average $401 National Average 1.3% 434
439 Table 26 State and Local Public Safety Expenditures, FY 2002 Rank State Per Capita Rank State Expenditures as a % of State Personal Income 1 District of Columbia $1,340 1 District of Columbia 3.0% 2 Alaska $871 2 Alaska 2.8% 3 California $778 3 Nevada 2.5% 4 New York $760 4 California 2.4% 5 Nevada $744 5 New Mexico 2.2% 6 Delaware $636 6 Oregon 2.2% 7 Rhode Island $627 7 Arizona 2.2% 8 Oregon $617 8 New York 2.1% 9 Florida $610 9 Florida 2.1% 10 New Jersey $ Rhode Island 2.1% 11 Maryland $ Delaware 2.0% 12 Wyoming $ Wisconsin 2.0% 13 Wisconsin $ Wyoming 1.9% 14 Connecticut $ Louisiana 1.9% 15 Massachusetts $ Idaho 1.8% 16 Arizona $ Utah 1.8% 17 Colorado $ Ohio 1.8% 18 Washingn $ Georgia 1.7% 19 Illinois $ Washingn 1.7% 20 New Mexico $ Maryland 1.7% 21 Michigan $ Michigan 1.7% 22 Ohio $ Oklahoma 1.7% 23 Virginia $ Illinois 1.7% 24 Georgia $ Mississippi 1.6% 25 Louisiana $ Texas 1.6% 26 Texas $ Colorado 1.6% 27 Pennsylvania $ Arkansas 1.6% 28 Hawaii $ Montana 1.6% 29 Idaho $ South Carolina 1.6% 30 Utah $ Hawaii 1.6% 31 Minnesota $ New Jersey 1.6% 32 Oklahoma $ Missouri 1.5% 33 Missouri $ Kentucky 1.5% 34 North Carolina $ North Carolina 1.5% 35 Nebraska $ Virginia 1.5% 36 Kansas $ Pennsylvania 1.5% 37 Montana $ Nebraska 1.4% 38 South Carolina $ Massachusetts 1.4% 39 Kentucky $ Kansas 1.4% 40 Tennessee $ Tennessee 1.4% 41 Indiana $ Alabama 1.4% 42 New Hampshire $ Indiana 1.4% 43 Vermont $ Minnesota 1.3% 44 Arkansas $ Connecticut 1.3% 45 Mississippi $ Vermont 1.3% 46 Maine $ Maine 1.3% 47 Alabama $ Iowa 1.3% 48 Iowa $ South Dakota 1.2% 49 South Dakota $ West Virginia 1.2% 50 North Dakota $ North Dakota 1.2% 51 West Virginia $ New Hampshire 1.1% National Average $545 National Average 1.8% 435
440 Table 27 State and Local Environmental Expenditures, FY 2002 Rank State Per Capita Rank State Expenditures as a % of State Personal Income 1 District of Columbia $987 1 Alaska 2.2% 2 Alaska $692 2 District of Columbia 2.2% 3 Wyoming $637 3 Wyoming 2.1% 4 Hawaii $552 4 Hawaii 1.9% 5 Washingn $493 5 North Dakota 1.8% 6 North Dakota $473 6 Idaho 1.7% 7 Florida $468 7 Montana 1.6% 8 Minnesota $439 8 Florida 1.6% 9 California $436 9 Utah 1.6% 10 Wisconsin $ Washingn 1.5% 11 New Jersey $ Wisconsin 1.5% 12 Oregon $ Oregon 1.5% 13 Idaho $ New Mexico 1.4% 14 Illinois $ Arizona 1.4% 15 Montana $ South Dakota 1.4% 16 Colorado $ Minnesota 1.4% 17 Maryland $ California 1.3% 18 Utah $ Louisiana 1.3% 19 Delaware $ Alabama 1.3% 20 South Dakota $ Iowa 1.3% 21 New York $ Illinois 1.3% 22 Nevada $ Nevada 1.2% 23 Michigan $ Maine 1.2% 24 Arizona $ Michigan 1.2% 25 Iowa $ Kentucky 1.2% 26 New Mexico $ Georgia 1.2% 27 Georgia $ Delaware 1.2% 28 Connecticut $ Colorado 1.2% 29 Maine $ Arkansas 1.2% 30 Louisiana $ Indiana 1.1% 31 Nebraska $ North Carolina 1.1% 32 Alabama $ West Virginia 1.1% 33 Indiana $ Nebraska 1.1% 34 North Carolina $ Maryland 1.1% 35 Ohio $ Ohio 1.1% 36 Virginia $ New Jersey 1.1% 37 Kentucky $ New York 1.0% 38 Vermont $ Oklahoma 1.0% 39 Pennsylvania $ Mississippi 1.0% 40 Rhode Island $ Vermont 1.0% 41 Massachusetts $ South Carolina 1.0% 42 Arkansas $ Pennsylvania 0.9% 43 Oklahoma $ Texas 0.9% 44 Texas $ Virginia 0.9% 45 West Virginia $ Kansas 0.9% 46 Kansas $ Rhode Island 0.9% 47 Tennessee $ Tennessee 0.9% 48 South Carolina $ Missouri 0.8% 49 Missouri $ Connecticut 0.8% 50 Mississippi $ Massachusetts 0.7% 51 New Hampshire $ New Hampshire 0.6% National Average $356 National Average 1.2% 436
441 Table 28 State and Local Interest on General Debt, FY 2002 Rank State Per Capita Rank State Expenditures as a % of State Personal Income 1 Alaska $667 1 Alaska 2.1% 2 Massachusetts $505 2 Hawaii 1.6% 3 Hawaii $464 3 Kentucky 1.5% 4 New York $435 4 Massachusetts 1.3% 5 District of Columbia $418 5 Delaware 1.3% 6 Connecticut $413 6 New York 1.2% 7 Delaware $405 7 South Carolina 1.1% 8 Kentucky $364 8 Pennsylvania 1.1% 9 Pennsylvania $328 9 West Virginia 1.1% 10 New Hampshire $ Nevada 1.1% 11 Illinois $ Rhode Island 1.0% 12 Nevada $ Connecticut 1.0% 13 Rhode Island $ Illinois 1.0% 14 Minnesota $ Louisiana 1.0% 15 South Carolina $ New Hampshire 1.0% 16 Colorado $ Montana 0.9% 17 New Jersey $ Maine 0.9% 18 Wisconsin $ District of Columbia 0.9% 19 Vermont $ Vermont 0.9% 20 Wyoming $ Wisconsin 0.9% 21 Washingn $ North Dakota 0.9% 22 Maine $ Minnesota 0.9% 23 Maryland $ Florida 0.9% 24 Florida $ New Mexico 0.9% 25 California $ Wyoming 0.9% 26 West Virginia $ South Dakota 0.8% 27 Michigan $ Ohio 0.8% 28 North Dakota $ Colorado 0.8% 29 Ohio $ Kansas 0.8% 30 Louisiana $ Texas 0.8% 31 Virginia $ Michigan 0.8% 32 Kansas $ Washingn 0.8% 33 Montana $ Mississippi 0.8% 34 Texas $ Arizona 0.8% 35 South Dakota $ California 0.8% 36 Oregon $ Utah 0.8% 37 New Mexico $ Oregon 0.7% 38 Arizona $ Alabama 0.7% 39 Indiana $ Virginia 0.7% 40 Utah $ Maryland 0.7% 41 Alabama $ New Jersey 0.7% 42 Missouri $ Indiana 0.7% 43 Mississippi $ Arkansas 0.7% 44 North Carolina $ Missouri 0.7% 45 Tennessee $ Idaho 0.6% 46 Idaho $ Tennessee 0.6% 47 Arkansas $ North Carolina 0.6% 48 Oklahoma $ Oklahoma 0.6% 49 Nebraska $ Nebraska 0.5% 50 Georgia $ Iowa 0.5% 51 Iowa $ Georgia 0.5% National Average $262 National Average 0.9% 437
442 Table 29 State and Local Debt Outstanding, FY 2002 Rank State Per Capita Rank State Debt Per $1,000 of State Personal Income 1 Alaska $13,491 1 Alaska $431 2 New York $10,199 2 New York $287 3 Massachusetts $10,187 3 Kentucky $268 4 District of Columbia $9,627 4 Massachusetts $262 5 Connecticut $8,028 5 Nevada $245 6 Washingn $7,509 6 Hawaii $241 7 Nevada $7,274 7 Washingn $235 8 Rhode Island $6,871 8 Utah $234 9 Delaware $6,864 9 Rhode Island $ Hawaii $6, South Carolina $ Pennsylvania $6, Pennsylvania $ New Jersey $6, Delaware $ Kentucky $6, District of Columbia $ Illinois $6, Illinois $ Minnesota $6, Minnesota $ Colorado $6, New Mexico $ California $5, West Virginia $ Utah $5, Texas $ New Hampshire $5, Arizona $ Wisconsin $5, Wisconsin $ South Carolina $5, Louisiana $ Texas $5, Oregon $ Florida $5, Florida $ Michigan $5, Connecticut $ Oregon $5, Colorado $ Vermont $5, California $ Arizona $4, Michigan $ Maine $4, Vermont $ Virginia $4, Maine $ Wyoming $4, Montana $ Maryland $4, North Dakota $ Louisiana $4, New Jersey $ New Mexico $4, Alabama $ Kansas $4, New Hampshire $ North Dakota $4, South Dakota $ Nebraska $4, Kansas $ South Dakota $4, Nebraska $ Ohio $4, Wyoming $ West Virginia $4, Mississippi $ Montana $4, Ohio $ Missouri $4, Missouri $ Alabama $4, Virginia $ North Carolina $4, North Carolina $ Georgia $4, Indiana $ Indiana $3, Georgia $ Tennessee $3, Arkansas $ Oklahoma $3, Oklahoma $ Mississippi $3, Tennessee $ Iowa $3, Maryland $ Arkansas $3, Idaho $ Idaho $2, Iowa $119 National Average $5,839 National Average $
443 Table 30 State Fiscal Capacity and Effort, FY 1999* Rank State Tax Capacity Index Rank State Tax Effort Index 1 Nevada District of Columbia Connecticut New York District of Columbia Connecticut Delaware Rhode Island Hawaii Maine Massachusetts Wisconsin New Hampshire Minnesota New Jersey New Jersey California West Virginia Wyoming Pennsylvania Washingn Massachusetts Alaska Maryland Minnesota Michigan Oregon Ohio New York Vermont Colorado Illinois Illinois Kansas Maryland Mississippi Florida New Mexico Virginia Louisiana Michigan Oklahoma Vermont Idaho Arizona Kentucky Georgia California Nebraska Washingn North Carolina Colorado Iowa Hawaii North Dakota Utah South Dakota Georgia Wisconsin Nebraska Indiana Virginia Montana Indiana Ohio Iowa Missouri Missouri Kansas North Carolina Maine North Dakota Pennsylvania Arkansas Tennessee Texas Rhode Island South Carolina Texas Delaware Utah Alaska New Mexico Arizona South Carolina Florida Kentucky Wyoming Idaho Alabama Louisiana Montana Alabama Oregon Arkansas South Dakota Oklahoma Tennessee Mississippi Nevada West Virginia New Hampshire 76 National Average 100 National Average 100 *An explanation of tax capacity and tax effort indexes can be found on page 414 of this handbook. 439
444 Sources and Explanations ECONOMIC INDICATORS Personal Income and Per Capita Income Personal income represents income from all sources (government and nongovernment). It consists of wage and salary disbursements, other labor income, propriers' income, rental income of persons, personal dividend income, personal interest income, and transfer payments less personal contributions for social insurance. Per capita income equals tal state personal income divided by a state's population estimate from the Bureau of the Census. Sources: U.S. Department of Commerce, Bureau of Economic Analysis (BEA), Regional Economic Information System. Web site is Personal income data are also published by the U.S. Bureau of Economic Analysis in its Survey of Current Business. Median Household Income Data for 2004 were collected from the Current Population Survey (CPS) Annual Social and Economic Supplement (ASEC) conducted by the Bureau of the Census. The survey samples about 100,000 households nationwide. Income estimates are based on money income before taxes and do not include capital gains and noncash benefits, such as food stamps. Sources: Sources: U.S. Department of Commerce, Economics and Statistics Administration, Bureau of the Census, Income, Poverty, and Health Insurance Coverage in the United States: 2004, Current Population Reports, Consumer Income, Series P60, No. 229, U.S. Government Printing Office, Washingn, DC, (1994 and 2004 data). Gross State Product Gross state product (GSP) is the "market value of the goods and services attributable labor and property located in a state. It is the state counterpart of the nation's gross domestic product" (Survey of Current Business, December 1991, page 43). The Bureau of Economic Analysis (BEA) prepares GSP estimates on an industry-by-industry basis. Source: U.S. Department of Commerce, Bureau of Economic Analysis
445 Jobs (the number of part-time and full-time positions) Job data represent the number of full- and part-time positions on an industry-by-industry basis. This is not the number of persons employed. Many people have more than one job, so the number of positions will exceed the number of employed persons. The data include employers covered by unemployment insurance, military personnel, agricultural employees, and selfemployed persons. Source: U.S. Department of Commerce, Bureau of Economic Analysis, Regional Economic Information System. Employed Persons and Unemployment Rates The number of employed persons and unemployment rates are derived from the CPS, a nationwide monthly survey of about 60,000 households conducted by the Bureau of the Census for the Bureau of Labor Statistics (BLS). In addition, the Current Employment Statistics (CES) survey provides information from a sample of 390,000 establishments on nonfarm wage and salary employment and other related information. Unemployed persons are people age 16 and older, excluding the military, who do not have jobs, have actively looked for work in the prior four weeks, and are available for work. The number of employed persons and unemployment rates are by state of residence. Because of larger sample sizes, in most cases, estimates of employed persons and unemployment rates for high-population states have less probability of error than do those for low-population states. Source: U.S. Department of Labor, Bureau of Labor Statistics, Local Area Unemployment Statistics database. DEMOGRAPHICS AND POVERTY RATES Population by Age and Sex The population data are annual estimates based on decennial census data. Source: U.S. Department. of Commerce, Bureau of the Census. (1994 data). (2004 data). 441
446 Poverty Rates by Age and Sex The poverty rate represents the percentage of persons in the United States below the poverty threshold level. The poverty rate is based on money income thresholds that increase with family size and is greater for persons under age 65 than for persons age 65 and older. The poverty definition is based on pre-tax money income only, excluding capital gains, and does not include the value of noncash benefits, such as food stamps. These poverty statistics exclude persons living in institutions (such as jails), armed forces personnel living on military bases, and unrelated individuals under 15 years of age. Poverty thresholds are updated every year reflect changes in the Consumer Price Index (CPI-U). The official poverty rate for the United States is based on the Current Population Survey Annual Social and Economic Supplement (CPS ASEC). However, we now report poverty rates by age and sex from the Census Bureau s American Community Survey (ACS) because the sample size is adequate produce annual estimates on poverty rates by age and sex for each state. Source: U.S. Department of Commerce, Bureau of the Census, 2004 American Community Survey Summary Tables, Table P114 (Poverty Status in the Past 12 Months by Sex by Age). PERCENTAGE DISTRIBUTION OF HOUSEHOLD INCOME BY AGE OF HOUSEHOLDER Data on the distribution of household income by age of householder now come from the Census Bureau s American Community Survey (ACS) because the sample size is adequate produce annual estimates on household income by age of householder for each state. Source: U.S. Department of Commerce, Bureau of the Census, Census 2004 American Community Survey Summary Tables, Table P072, Age of Householder by Household Income in the Past 12 Months (in 2004 adjusted inflation-adjusted dollars). FISCAL AND TAX RATE DATA State and Local Revenues and Expenditures and Debt Outstanding The U.S. Bureau of the Census conducts annual surveys of state and local government finances on revenues, expenditures, debt, and assets. The data presented in this book cover major revenue and expenditure sources. For expenditure programs, such as Medicaid, figures are not reported separately and therefore are not shown separately in the handbook. In the expenditure table, payments the federal 442
447 government consist of refunds of overpayments of categorical aid or supplemental payments the federal government increase the basic cash grants individuals. Long-term debt outstanding represents debt payable more than one year after the date of issue. It includes general-obligation bonds that are guaranteed by the taxing power of governments, as well as nonguaranteed indebtedness, such as industrial revenue debt. Short-term debt outstanding represents interest-bearing debt payable within one year from the date of issue, such as bond anticipation notes and tax anticipation notes. As for revenues, the handbook describes only general fund revenues; it does not include special revenue funds, such as utility and liquor sre revenues. Sources: U.S. Department of Commerce, Bureau of the Census. (1992 data) (2002 data) State and Local Tax Rates Tax rates were obtained from a survey of various state and local tax officials as well as annual tax rate data reported by the Federation of Tax Administrars (FTA). Property Tax Relief Programs Circuit breakers, homestead exemptions, homestead credits, and deferral property tax relief programs are described as follows: Circuit breakers: Circuit breaker programs are tax credits or homestead exemptions that increase as income decreases. The program in most cases is targeted low- and moderateincome homeowners and renters. Circuit breakers usually relieve the property tax burden by setting income thresholds (usually some percentage of income) that property taxes cannot exceed. Homeowners or renters whose property taxes are above the threshold receive a rebate of some or all of their property taxes. Homestead programs: Homestead exemptions are reductions in the amount of assessed property value subject taxation, and homestead credits are tax credits for property taxes owed. Unlike circuit breakers, they do not benefit renters. In addition, although income may be a criterion for eligibility, benefits are not related income. 443
448 Deferral programs: Property tax deferral programs allow elderly and/or disabled homeowners defer payment of all or a portion of their property taxes until the sale of the property or death. The deferred property taxes plus interest are a lien against the value of the home. Source: David Baer, AARP, State Programs and Practices for Reducing Residential Property Taxes, May html and survey of state and local tax officials. Tax Capacity and Tax Effort Indexes Tax capacity represents the amount of revenue each state would raise if it applied a national average set of tax rates 27 commonly used tax bases. Since the average rate is applied for each state, a high tax capacity index means that a state has a higher aggregate tax base for a given tax and will receive more revenue than the national average. A state with a high tax capacity likely has a relatively healthier economy and will probably not be under as much pressure raise tax rates, expand its tax base, or reduce its expenditures compared with states having relatively low tax capacities. Table 30 provides per capita tax capacity indexes for each state. These are derived by dividing each state s per capita tax capacity by the per capita tax capacity average for all states. The average is defined as 100. A state per capita tax capacity index of 110 means a state s per capita revenue-raising capacity is 10 percent above the national average. A low tax capacity index may suggest a relatively narrow tax base (e.g., no taxation of services) and/or a weak economic base. Tax effort represents the ratio of a state's actual tax collections its tax capacity. High tax effort states tend have higher tax rates compared the national average. Tax effort is another tax burden measure, like state taxes as a percentage of state personal income. Tax effort indexes, similar tax capacity indexes, are derived by dividing the state's tax effort by the average tax effort for all states. The interpretation of tax effort indexes is similar the interpretation of tax capacity indexes. For example, an index of 110 means the state's tax effort is 10 percent above the national average. One application of tax capacity and tax effort indexes can be shown using the state of Alabama as an example. For 1999, Alabama had a per capita tax capacity index of 82 and a tax effort index of 82. The per capita tax capacity index of 82 suggests that Alabama's tax base was 18 percent lower than the national average for the combined tal of all 27 commonly used tax bases. 444
449 When a state such as Alabama has a low per capita tax capacity index because of a narrow tax base, it may have raise tax rates above the national average in order raise revenue amounts comparable those of other states. However, Alabama had an overall tax effort of only 82, suggesting that its tax rates also were low compared the national average. The low capacity and low tax effort resulted in lower per capita revenue in Alabama compared with other states. Source: Robert Tannenwald and Nicholas Turner, Interstate Fiscal Disparity in State Fiscal Year 1999, State Tax Notes, pages PUERTO RICO Most of the data from Puer Rico come from the U.S. Department of Commerce, Bureau of the Census, the Puer Rico Department of the Treasury, and the Puer Rico Planning Board, Area of Economic and Social Planning, Bureau of Economic Analysis, as shown below. Per Capita Income Source: Puer Rico s Department of the Treasury, Commonwealth of Puer Rico: Comprehensive Annual Financial Report, Fiscal Year Ended June 30, 2001 (1993 data). Source: Puer Rico s Department of the Treasury, Commonwealth of Puer Rico: Comprehensive Annual Financial Report, Fiscal Year Ended June 30, 2004 (2003 data). Median Household Income and Poverty Rate by Age and Sex Source: U.S. Department of Commerce, Economics and Statistics Administration, Bureau of the Census, 1990 Census of Population Social and Economic Characteristics, Puer Rico, CP-2-53, U.S. Government Printing Office, Washingn, DC (1989 data). Source: U.S. Department of Commerce, Bureau of the Census, Census 2000 Summary File 3 (SF 3), _SF3_U&_program=DEC&_lang=en (1999 data). Employment, Unemployment Rate, and Gross Product Data Sources: U.S. Department of Labor, Bureau of Labor Statistics, Local Area Unemployment Statistics database for employment and unemployment data; Puer Rico Planning Board for gross product data (found in Government Development Bank for Puer Rico, Puer Rico in Figures 2001 and 2003) and population (found in Puer Rico s Department of the Treasury, Commonwealth of Puer Rico: Comprehensive Annual Financial Report, Fiscal Year Ended June 30, 2001 and June 30, 2003). 445
450 Population by Age and Sex Sources: Source for 1990 data is U.S. Department of Commerce, Bureau of the Census, Economics and Statistics Administration, 1990 Census of Population, General Population Characteristics, CP-1-53, Ocber Source for 2000 data is U.S. Department of Commerce, Bureau of the Census, Census 2000 Summary File 1 (SF 1), _lang=en&_ts= Percentage Distribution of Household Income by Age of Householder Source: U.S. Department of Commerce, Bureau of the Census, Census 2000 Summary File 3 (SF 3). General Revenue and Expenditure Data Source: Puer Rico s Department of the Treasury, Commonwealth of Puer Rico: Comprehensive Annual Financial Report, Fiscal Year Ended June 30, 2001 (1994 data). Source: Puer Rico s Department of the Treasury, Commonwealth of Puer Rico: Comprehensive Annual Financial Report, Fiscal Year Ended June 30, 2004 (2004 data). Tax Data Sources: Income tax data came from the 2004 income tax booklet and instructions from Puer Rico s Department of the Treasury. Other tax data came from Dr. Fernando Lugo Camacho with the Government Development Bank for Puer Rico. VIRGIN ISLANDS Most of the data came from the Virgin Island s Department of Economic Development and Agriculture, U.S. Bureau of Economic Research, and the U.S. Bureau of the Census. Per Capita Income Source: U.S. Department of Commerce, Bureau of the Census, 1990 Census of Population Social and Economic Characteristics, Virgin Islands of the United States, 1990 CP-2-55, U.S. Government Printing Office, Washingn, DC (1989 data). Source: U.S. Department of Commerce, Bureau of the Census, U.S. Virgin Islands Summary File (1999 data), 446
451 Median Household Income and Poverty Rate Source: U.S. Department of Commerce, Bureau of the Census, 1990 Census of Population Social and Economic Characteristics, Virgin Islands of the United States, 1990 CP-2-55, U.S. Government Printing Office, Washingn, DC (1989 data). Source: U.S. Department of Commerce, Bureau of the Census, U.S. Virgin Islands Summary File (1999 data), DEC_2000_SF3_U&_program=DEC&_lang=en. Employment, Unemployment Rate, and Gross Product Data Source: United States Virgin Island s Bureau of Economic Research, Office of the Governor, U.S. Virgin Islands Annual Economic Indicars, Population by Age and Sex Source: U.S. Department of Commerce, Bureau of the Census, Economics and Statistics Administration, 1990 Census of Population, General Population Characteristics, CP-1-55, September 1992 (1990 data). Source: U.S. Department of Commerce, Bureau of the Census, U.S. Virgin Islands Summary File, ds_name=dec_2000 _SF3_U&_program=DEC&_lang=en (2000 data). Percentage Distribution of Household Income by Age of Householder Source: U.S. Department of Commerce, Bureau of the Census, U.S. Virgin Islands Summary File, _SF3_U&_program=DEC&_lang=en (1999 data). Revenue Data Source: United States Virgin Islands, Office of the Governor, Office of Management and Budget, Executive Budget, Tax Data Sources: U.S. Internal Revenue Service (income tax data) and the Virgin Islands Bureau of Internal Revenue (miscellaneous tax data). 447
452
State Handbook of Economic, Demographic, and Fiscal Indicators Arizona. by David Baer PUBLIC POLICY INSTITUTE AARP
 State Handbook of Economic, Demographic, and Fiscal Indicars 2008 Arizona by David Baer PUBLIC POLICY INSTITUTE AARP Introduction The State Handbook of Economic, Demographic, and Fiscal Indicars 2008 represents
State Handbook of Economic, Demographic, and Fiscal Indicators Georgia. by David Baer PUBLIC POLICY INSTITUTE AARP
 State Handbook of Economic, Demographic, and Fiscal Indicars 2006 Georgia by David Baer PUBLIC POLICY INSTITUTE AARP Introduction The State Handbook of Economic, Demographic, and Fiscal Indicars 2006 represents
State Handbook of Economic, Demographic, and Fiscal Indicators Mississippi. by David Baer PUBLIC POLICY INSTITUTE AARP
 State Handbook of Economic, Demographic, and Fiscal Indicars 2008 by David Baer PUBLIC POLICY INSTITUTE AARP Introduction The State Handbook of Economic, Demographic, and Fiscal Indicars 2008 represents
State Handbook of Economic, Demographic, and Fiscal Indicators Alabama. by David Baer PUBLIC POLICY INSTITUTE AARP
 State Handbook of Economic, Demographic, and Fiscal Indicars 2008 by David Baer PUBLIC POLICY INSTITUTE AARP Introduction The State Handbook of Economic, Demographic, and Fiscal Indicars 2008 represents
State Handbook of Economic, Demographic, and Fiscal Indicators Washington. by David Baer PUBLIC POLICY INSTITUTE AARP
 State Handbook of Economic, Demographic, and Fiscal Indicars 2008 Washingn by David Baer PUBLIC POLICY INSTITUTE AARP Introduction The State Handbook of Economic, Demographic, and Fiscal Indicars 2008
State Handbook of Economic, Demographic, and Fiscal Indicators Massachusetts. by David Baer PUBLIC POLICY INSTITUTE AARP
 State Handbook of Economic, Demographic, and Fiscal Indicars 2008 Massachusetts by David Baer PUBLIC POLICY INSTITUTE AARP Introduction The State Handbook of Economic, Demographic, and Fiscal Indicars
State Handbook of Economic, Demographic, and Fiscal Indicators Oklahoma. by David Baer PUBLIC POLICY INSTITUTE AARP
 State Handbook of Economic, Demographic, and Fiscal Indicars 2008 Oklahoma by David Baer PUBLIC POLICY INSTITUTE AARP Introduction The State Handbook of Economic, Demographic, and Fiscal Indicars 2008
District of Columbia
 State Handbook of Economic, Demographic, and Fiscal Indicars 2008 District of Columbia by David Baer PUBLIC POLICY INSTITUTE AARP Introduction The State Handbook of Economic, Demographic, and Fiscal Indicars
State Handbook of Economic, Demographic, and Fiscal Indicators South Carolina. by David Baer PUBLIC POLICY INSTITUTE AARP
 State Handbook of Economic, Demographic, and Fiscal Indicars 2006 South Carolina by David Baer PUBLIC POLICY INSTITUTE AARP Introduction The State Handbook of Economic, Demographic, and Fiscal Indicars
State Handbook of Economic, Demographic, and Fiscal Indicators New York. by David Baer PUBLIC POLICY INSTITUTE AARP
 State Handbook of Economic, Demographic, and Fiscal Indicators 2006 New York by David Baer PUBLIC POLICY INSTITUTE AARP Introduction The State Handbook of Economic, Demographic, and Fiscal Indicators 2006
State Handbook of Economic, Demographic, and Fiscal Indicators New Mexico. by David Baer PUBLIC POLICY INSTITUTE AARP
 State Handbook of Economic, Demographic, and Fiscal Indicars 2006 New Mexico by David Baer PUBLIC POLICY INSTITUTE AARP Introduction The State Handbook of Economic, Demographic, and Fiscal Indicars 2006
State Handbook of Economic, Demographic, and Fiscal Indicators New York. by David Baer PUBLIC POLICY INSTITUTE AARP
 State Handbook of Economic, Demographic, and Fiscal Indicators 2008 New York by David Baer PUBLIC POLICY INSTITUTE AARP Introduction The State Handbook of Economic, Demographic, and Fiscal Indicators 2008
State Handbook of Economic, Demographic, and Fiscal Indicators New Jersey. by David Baer PUBLIC POLICY INSTITUTE AARP
 State Handbook of Economic, Demographic, and Fiscal Indicators 2008 New Jersey by David Baer PUBLIC POLICY INSTITUTE AARP Introduction The State Handbook of Economic, Demographic, and Fiscal Indicators
State Handbook of Economic, Demographic, and Fiscal Indicators New Mexico. by David Baer PUBLIC POLICY INSTITUTE AARP
 State Handbook of Economic, Demographic, and Fiscal Indicars 2008 New Mexico by David Baer PUBLIC POLICY INSTITUTE AARP Introduction The State Handbook of Economic, Demographic, and Fiscal Indicars 2008
State Handbook of Economic, Demographic, and Fiscal Indicators North Carolina. by David Baer PUBLIC POLICY INSTITUTE AARP
 State Handbook of Economic, Demographic, and Fiscal Indicars 2003 North Carolina by David Baer PUBLIC POLICY INSTITUTE AARP Introduction The State Handbook of Economic, Demographic, and Fiscal Indicars
State Handbook of Economic, Demographic, and Fiscal Indicators Rhode Island. by David Baer PUBLIC POLICY INSTITUTE AARP
 State Handbook of Economic, Demographic, and Fiscal Indicars 2003 Rhode Island by David Baer PUBLIC POLICY INSTITUTE AARP Introduction The State Handbook of Economic, Demographic, and Fiscal Indicars 2003
State Handbook of Economic, Demographic, and Fiscal Indicators New Mexico. by David Baer PUBLIC POLICY INSTITUTE AARP
 State Handbook of Economic, Demographic, and Fiscal Indicars 2003 New Mexico by David Baer PUBLIC POLICY INSTITUTE AARP Introduction The State Handbook of Economic, Demographic, and Fiscal Indicars 2003
State Handbook of Economic, Demographic, and Fiscal Indicators United States. by David Baer PUBLIC POLICY INSTITUTE AARP
 State Handbook of Economic, Demographic, and Fiscal Indicars 2003 United States by David Baer PUBLIC POLICY INSTITUTE AARP Introduction The State Handbook of Economic, Demographic, and Fiscal Indicars
State Handbook of Economic, Demographic, and Fiscal Indicators South Carolina. by David Baer PUBLIC POLICY INSTITUTE AARP
 State Handbook of Economic, Demographic, and Fiscal Indicators 2003 South Carolina by David Baer PUBLIC POLICY INSTITUTE AARP Introduction The State Handbook of Economic, Demographic, and Fiscal Indicators
State and Local Property Tax Burdens in 2005
 and Local Property Tax Burdens in 2005 #2007-09 May 2007 by David Baer AARP Public Policy Institute The AARP Public Policy Institute, formed in 1985, is part of the Policy and Strategy Group at AARP. One
Credit Where Credit is (Over) Due
 Due") Credit Where Credit is (Over) Due Four State Tax Policies Could Lessen the Effect that State Tax Systems Have in Exacerbating Poverty September 2010 1616 P Street NW Washington, DC 20036 (202) 299-1066
Credit Where Credit is (Over) Due Four State Tax Policies Could Lessen the Effect that State Tax Systems Have in Exacerbating Poverty September 2010 1616 P Street NW Washington, DC 20036 (202) 299-1066
Version 1.0. Last Edit: May 14, 2017
 2017 US STATE TAX UPDATE Presented by Advicent Solutions Version 1.0. Last Edit: May 14, 2017 1 STATE INCOME TAXES - 2017 Alabama Alaska Arizona Arkansas California Colorado Connecticut Delaware District
State Tax Preferences for Elderly Taxpayers
 State Tax Preferences for Elderly Taxpayers March 2015 State governments provide a wide array of tax breaks for their elderly residents. Almost every state that levies an income tax now allows some form
State Tax Relief for the Poor
 State Tax Relief for the Poor David S. Liebschutz and Steven D. Gold T his paper summarizes highlights of the book State Tax Relief for the Poor by David S. Liebschutz, associate director of the Center
Estimating Tax Savings from Homestead Exemptions and Property Tax Credits
 Estimating Tax Savings from Homestead Exemptions and Property Tax Credits Working Paper WP15AL1 Adam H. Langley Lincoln Institute of Land Policy April 2015 The findings and conclusions of this Working
State Treatment of Social Security Treatment of Pension Income Other Income Tax Breaks Property Tax Breaks
 State-By-State Tax Breaks for Seniors, 2016 State Treatment of Social Security Treatment of Pension Income Other Income Tax Breaks Property Tax Breaks AL Payments from defined benefit private plans are
Total state and local business taxes
 Total state and local business taxes State-by-state estimates for fiscal year 2016 August 2017 Executive summary This study presents detailed state-by-state estimates of the state and local taxes paid
State Individual Income Tax Rates for Retirement Income as of January 31, 2015 Presented by Timothy Weller
 State Individual Income Tax Rates for as of January 31, 2015 Presented by Timothy Weller State Low High Low High Alabama 2.0 5.0 $500 $3,000 Social security, as well as military, civil service, state/local
Tax Rates and Tax Burdens in the District of Columbia - A Nationwide Comparison
 Government of the District of Columbia Natwar M. Gandhi Chief Financial Officer Tax Rates and Tax Burdens in the District of Columbia - A Nationwide Comparison 2010 Issued September 2011 Tax Rates and
A RIPEC Report on Rhode Island s State and Local Tax System March 25, 2008
 A RIPEC Report on Rhode Island s State and Local Tax System March 25, 2008 Compiled as a public service by the Rhode Island Public Expenditure Council A RIPEC Report on Rhode Island s State and Local Tax
Total state and local business taxes
 Total state and local business taxes State-by-state estimates for fiscal year 2017 November 2018 Executive summary This study presents detailed state-by-state estimates of the state and local taxes paid
Property Tax, State and Local Taxes and the New Jersey Constitution ******* Supplemental Slides
 Property Tax, State and Local Taxes and the New Jersey Constitution ******* Supplemental Slides Joint Committee on Constitutional Reform and Citizens Property Tax Constitutional Convention August 2006
HEA 1001 More than Property Tax Relief September 12, 2008
 HEA 1001 More than Property Tax Relief September 12, 2008 1 HEA 1001 More Than Property Tax Relief Expansion of Circuit Breaker Tax Credits Creates a financial interdependency of all local schools and
Indiana s Property Tax, 2008
 Purdue Cooperative Extension Service On Local Government Indiana s Property Tax, 2008 Larry DeBoer Department of Agricultural Economics Purdue University February 1, 2008 For more information DeBoer s
Tax Breaks for Elderly Taxpayers in the States in 2016
 AL Payments from defined benefit private plans are exempt; most public systems are exempt; military and US Civil service are exempt Special Homestead ion for 65+ +25.2% +2.4% AK No PIT Homestead ion for
Property Tax Relief in New England
 Property Tax Relief in New England January 23, 2015 Adam H. Langley Senior Research Analyst Lincoln Institute of Land Policy www.lincolninst.edu Property Tax as a % of Personal Income OK AL IN UT SD MS
Chapter D State and Local Governments
 Chapter D State and Local Governments State and Local Governments contains detailed information on the taxes, revenues, and expenditures of states and localities. The public finances of these two levels
State Tax Treatment of Social Security, Pension Income
 State Tax Treatment of Social Security, Pension Income The following chart Provides a general overview of how states treat income from Social Security and pensions for the 2016 tax year unless otherwise
FY16 REVENUES. FY 15 Adopted Taxes. General Fund $ $ $ Voter Approved Debt Service $37.30 $36.90 $37.50
 FY16 REVENUES Overview County services are funded with a variety of revenue sources. These sources include the following: property taxes, miscellaneous taxes and assessments, federal and state grants,
Tassistance program. In fiscal year 1998, it represented 18.2 percent of all food stamp
 CHARACTERISTICS OF FOOD STAMP HOUSEHOLDS: FISCAL YEAR 1998 (Advance Report) United States Department of Agriculture Office of Analysis, Nutrition, and Evaluation Food and Nutrition Service July 1999 he
Tassistance program. In fiscal year 1999, it 20.1 percent of all food stamp households. Over
 CHARACTERISTICS OF FOOD STAMP HOUSEHOLDS: FISCAL YEAR 1999 (Advance Report) UNITED STATES DEPARTMENT OF AGRICULTURE OFFICE OF ANALYSIS, NUTRITION, AND EVALUATION FOOD AND NUTRITION SERVICE JULY 2000 he
Property Tax System Overview. Prepared for the Property Tax Working Group
 Property Tax System Overview Prepared for the Property Tax Working Group Property Tax Research 9/27/2010 Introduction Property tax in Minnesota is an ad valorem tax. This means that property is taxed
Total state and local business taxes
 Total state and local business taxes State-by-state estimates for fiscal year 2014 October 2015 Executive summary This report presents detailed state-by-state estimates of the state and local taxes paid
Introduction. Evaluation of Utah s Tax System
 Article from Policy Perspectives (http://www.imakenews.com/cppa/e_article000962970.cfm?x=b6gdd3k,b30dnqvw,w) November 28, 2007 An Evaluation of Utah s Tax System and a Comparison of Eight Intermountain
FY15 REVENUES. FY 14 Adopted Taxes. General Fund $ $ $753.50
 BROWARD COUNTY BUDGET-IN-BRIEF FY15 REVENUES Overview County services are funded with a variety of revenue sources. These sources include the following: property taxes, miscellaneous taxes and assessments,
1995 Minnesota Tax Incidence Study
 1995 Minnesota Tax Incidence Study Who pays Minnesota s household and business taxes? March 1995 MINNESOTA Department of Revenue Tax Research Division MINNESOTA Department of Revenue March 1, 1995 To
Colorado Legislative Council Staff
 Colorado Legislative Council Staff Room 029 State Capitol, Denver, CO 80203-1784 (303) 866-3521 FAX: 866-3855 TDD: 866-3472 www.colorado.gov/lcs E-mail: lcs.ga@state.co.us M E M O R A N D U M November
A Legislative Guide to Washington State Property Taxes
 A Legislative Guide to Washington State Property Taxes - 2007 - TABLE OF CONTENTS Subject Page Introduction...1 How Much Money Does the Property Tax Generate and How is it Spent?...2 What Property is Taxable?...4
2017 NEW TAX LAW BOOKLET UPDATE MARCH 2017
 2017 NEW TAX LAW BOOKLET UPDATE MARCH 2017 SUMMARY FOR 2017 NEW TAX LAW Publication Date: March 2017 Field of Studies: Level: Taxes Basic Cpe Hours: 3 Prerequisites: Advanced Preparation: None None Type
A NEW APPROACH. FTA Revenue Estimation & Tax Research Conference Portland, Maine September 16, 2008
 A NEW APPROACH FTA Revenue Estimation & Tax Research Conference Portland, Maine September 16, 2008 $38 billion in 2005, more than combined NYS & NYC PIT of $34 billion In FY 05, NYS ranked #2 in state
Property taxes are the only major revenue source for which the Illinois state and local tax burden
 CHAPTER SEVEN ILLINOIS PROPERTY TAXES Property taxes are the only major revenue source for which the Illinois state and local tax burden exceeds the national average indicating a fundamental imbalance
HAWAII INCOME PATTERNS
 HAWAII INCOME PATTERNS INDIVIDUALS - 1994 DEPARTMENT OF TAXATION - STATE OF HAWAII STATE OF HAWAII Benjamin J. Cayetano, Governor DEPARTMENT OF TAXATION Ray K. Kamikawa, Director Susan K. Inouye, Deputy
State Individual Income Tax Rates and Brackets for 2018
 FISCAL FACT No. 576 March 2018 State Individual Income Tax Rates and Brackets for 2018 Morgan Scarboro Policy Analyst Key Findings: Individual income taxes are a major source of state government revenue,
H 7245 S T A T E O F R H O D E I S L A N D
 ======== LC0001 ======== 01 -- H S T A T E O F R H O D E I S L A N D IN GENERAL ASSEMBLY JANUARY SESSION, A.D. 01 A N A C T RELATING TO TAXATION -- PERSONAL INCOME TAX Introduced By: Representatives Guthrie,
Property Tax Deferral: A Proposal to Help Massachusetts Seniors
 Property Tax Deferral: A Proposal to Help Massachusetts Seniors Alicia H. Munnell and Abigail N. Walters Center for Retirement Research at Boston College Economic Perspectives on State and Local Taxes
P roperty taxes are the only
 CHAPTER FOUR ILLINOIS PROPERTY TAXES The Total Illinois Property Tax Burden W hile property taxes have declined as a share of taxes nationwide, the share of state and local tax revenue derived from the
Individual Retirement Accounts and 401(k) Plans: Early Withdrawals and Required Distributions
 Plans: Early Withdrawals and Required Distributions") Order Code RL31770 Individual Retirement Accounts and 401(k) Plans: Early Withdrawals and Required Distributions Updated October 27, 2008 Patrick Purcell Specialist in Income Security Domestic Social Policy
Order Code RL31770 Individual Retirement Accounts and 401(k) Plans: Early Withdrawals and Required Distributions Updated October 27, 2008 Patrick Purcell Specialist in Income Security Domestic Social Policy
An Analysis of the Fiscal Relationship between the United States Federal Government and Puerto Rico. Neil A. R. Allison J.
 An Analysis of the Fiscal Relationship between the United States Federal Government and Puerto Rico Neil A. R. Allison J. Tomas Hexner December 10, 2004 I. Purpose and Principal Findings A. General Findings
Withholding of Income Taxes and the Making Work Pay Tax Credit
 Withholding of Income Taxes and the Making Work Pay Tax Credit John J. Topoleski Analyst in Income Security January 30, 2013 CRS Report for Congress Prepared for Members and Committees of Congress Congressional
State Income Tax Tables
 ALABAMA 1 st $1,000... 2% Next 5,000... 4% Over 6,000... 5% ALASKA... 0% ARIZONA 1 1 st $10,000... 2.87% Next 15,000... 3.2% Next 25,000... 3.74% Next 100,000... 4.72% Over 150,000... 5.04% ARKANSAS 1
Arizona s Tax System. Presentation to Arizona Economic Forum Kevin McCarthy June 21, 2002 ATRA
 Arizona s Tax System Presentation to Arizona Economic Forum Kevin McCarthy June 21, 2002 FY 1980 Gas/Use Fuel 5% Corporate Income 4% VLT 3% All Other 5% Property 32% Tax Individual Income 13% Collections
SOURCES OF INCOME FOR OLDER PERSONS IN 2003
 SOURCES OF INCOME FOR OLDER PERSONS IN 2003 Social Security, pensions and personal savings, and earnings constitute three of the four pillars of retirement income security (the fourth being health insurance).
Estimating the Number of People in Poverty for the Program Access Index: The American Community Survey vs. the Current Population Survey.
 Background Estimating the Number of People in Poverty for the Program Access Index: The American Community Survey vs. the Current Population Survey August 2006 The Program Access Index (PAI) is one of
Vermont Tax Study. Volume II Case Studies. October 5, Prepared in accordance with Act 215, Sec. 271a of the 2006 Legislative Session
 Volume II Case Studies October 5, 2007 Prepared in accordance with Act 215, Sec. 271a of the 2006 Legislative Session PREPARED BY Prepared in accordance with Act 215, Sec. 271a of the 2006 Legislative
Put in place to assist the unemployed or underemployed.
 By:Erin Sollund The federal government Put in place to assist the unemployed or underemployed. Medicaid, The Women, Infants, and Children (WIC) Program, and Aid to Families with Dependent Children (AFDC)
Property Taxes: A West Virginia Primer
 Property Taxes: A West Virginia Primer Aims of this Primer Property taxes provide revenue for the important public structures, services, and programs that enhance the quality of life for the people of
State Social Security Income Pension Income State computation not based on federal. Social Security benefits excluded from taxable income.
 State Tax Treatment of Social Security, Pension Income The following CCH analysisi provides a general overview of how states treat income from Social Security and pensions for the 2013 tax year unless
2017 Fingertip Tax Guide
 2017 Fingertip Tax Guide INCOME TAXES 2017 If Taxable Income Is: 1 Married Filing Jointly Estates and Trusts Single $0 $18,650 $0 + 10% $0 $18,650 $75,900 $1,865 + 15% $18,650 $75,900 $153,100 $10,452.50
EAST GREENBUSH CENTRAL SCHOOL DISTRICT School Taxes Questions and Answers
 EAST GREENBUSH CENTRAL SCHOOL DISTRICT 2016-2017 School Taxes Questions and Answers When should I expect my tax bill in the mail? Your tax bill will be mailed on September 7, 2016. When is the tax collection
OVERVIEW OF THE FEDERAL TAX SYSTEM AS IN EFFECT FOR 2015
 OVERVIEW OF THE FEDERAL TAX SYSTEM AS IN EFFECT FOR 2015 Prepared by the Staff of the JOINT COMMITTEE ON TAXATION March 30, 2015 JCX-70-15 CONTENTS Page INTRODUCTION... 1 I. SUMMARY OF PRESENT-LAW FEDERAL
Sources of Income for Older Persons, 2006
 Fact Sheet Sources of for Older Persons, 2006 AARP Public Policy Institute Older persons with low income depend heavily on Social Security. Over the past 11 years, earnings have become a more important
The Distribution of Federal Taxes, Jeffrey Rohaly
 www.taxpolicycenter.org The Distribution of Federal Taxes, 2008 11 Jeffrey Rohaly Overall, the federal tax system is highly progressive. On average, households with higher incomes pay taxes that are a
Hopkins Public Schools #270. December 5, 2017 Presented by John Toop Director of Business Services
 Hopkins Public Schools #270 Public Hearing for Taxes Payable in 2018 December 5, 2017 Presented by John Toop Director of Business Services Tax Hearing Presentation State Law Requires Public Meeting: Between
Administration of Arkansas Property Tax
 FSCDC16 Administration of Arkansas Property Tax Wayne Miller Extension Economist - Agricultural Economics and Community Development John Zimpel Research, Development and Technical Support, Arkansas Assessment
OVERVIEW OF THE FEDERAL TAX SYSTEM AS IN EFFECT FOR 2013
 OVERVIEW OF THE FEDERAL TAX SYSTEM AS IN EFFECT FOR 2013 Prepared by the Staff of the JOINT COMMITTEE ON TAXATION January 8, 2013 JCX-2-13 CONTENTS Page INTRODUCTION... 1 I. SUMMARY OF PRESENT-LAW FEDERAL
STATE AND LOCAL TAXES A Comparison Across States
 STATE AND LOCAL TAXES A Comparison Across States INDEPENDENT FISCAL OFFICE FEBRUARY 2018 Methodology This report uses data from the U.S. Census Bureau, the Internal Revenue Service (IRS), the U.S. Bureau
What Are Taxes? Chapter 14 Section Main Menu
 What Are Taxes? How are taxes used to fund government programs? What are three types of tax structures? What are the characteristics of a good tax? Who bears the burden of a tax? Funding Government Programs
Household Income for States: 2010 and 2011
 Household Income for States: 2010 and 2011 American Community Survey Briefs By Amanda Noss Issued September 2012 ACSBR/11-02 INTRODUCTION Estimates from the 2010 American Community Survey (ACS) and the
Virginia Has Improved The Tax Treatment of Low-Income Families, And an EITC Modeled on The Federal EITC Would Go Further.
 Introduction 820 First Street, NE, Suite 510, Washington, DC 20002 Tel: 202-408-1080 Fax: 202-408-1056 center@cbpp.org http://www.cbpp.org Virginia Has Improved The Tax Treatment of Low-Income Families,
NEVADA TAX REVENUE COMPARED TO THE UNITED STATES
 Page 1 EXECUTIVE SUMMARY Applied Analysis was retained by the Las Vegas Convention and Visitors Authority (the LVCVA ) to review and analyze the economic impacts associated with its various operations
Department of Legislative Services
 Department of Legislative Services Maryland General Assembly 2008 Session SB 618 FISCAL AND POLICY NOTE Senate Bill 618 Budget and Taxation (Senator Jones, et al.) Property Tax - Homeowners' Property Tax
STATE TAX ROUNDUP TAX YEAR 30 APR 2019
 018 STATE TAX ROUNDUP 30 APR 2019 TAX SEASON IS UPON US, and throughout the country, millions of people are combing through tax documents looking for any break they can find. Fortunately for NARFE members,
State Options for Replacing Local Property Taxes
 Office of Legislative Services Background Report State Options for Replacing Local es OLS Background Report No. 127 Prepared By: Revenue, Finance and Appropriations Date Prepared: New Jersey State Legislature
PROPERTY TAXES IN PERSPECTIVE. By David H. Bradley
 820 First Street, NE, Suite 510, Washington, DC 20002 Tel: 202-408-1080 Fax: 202-408-1056 center@cbpp.org www.cbpp.org March 17, 2005 PROPERTY TAXES IN PERSPECTIVE By David H. Bradley Summary Some observers
Economic Stimulus Payment Guide for Benefit Recipients
 Economic Stimulus Payment Guide for Benefit Recipients Even if you are not otherwise required to file a tax return, you may still be eligible for an economic stimulus payment from the federal government.?
State Tax Rates and 1996 Collections
 Sinc e 193 7 TAX FOUNDATION SPECIAL February 1998 No. 75 State Tax Rates and 1996 Collections By Scott Moody Economist Tax Foundation State tax and fee collections grew by 4.9 percent between 1995 and
David L. Sjoquist. Andrew Young School of Policy Studies Georgia State University. Trinity Presbyterian Church May 13, 2010
 Georgia s Taxes David L. Sjoquist Fiscal Research Center Andrew Young School of Policy Studies Georgia State University Trinity Presbyterian Church May 13, 2010 State General Fund Revenue, 2009 Tax Revenue
Maintaining Health and Long-Term Care: A Survey on Addressing the Revenue Shortfall in California
 Maintaining Health and Long-Term Care: A Survey on Addressing the Revenue Shortfall in California Data Collected by Woelfel Research, Inc. Report Prepared by Rachelle Cummins Copyright 2002 AARP Knowledge
EBRI Databook on Employee Benefits Chapter 6: Employment-Based Retirement Plan Participation
 EBRI Databook on Employee Benefits Chapter 6: Employment-Based Retirement Plan Participation UPDATED July 2014 This chapter looks at the percentage of American workers who work for an employer who sponsors
Current Population Survey (CPS)
") Current Population Survey (CPS) 1 Background The Current Population Survey (CPS), sponsored jointly by the U.S. Census Bureau and the U.S. Bureau of Labor Statistics (BLS), is the primary source of labor
Current Population Survey (CPS) 1 Background The Current Population Survey (CPS), sponsored jointly by the U.S. Census Bureau and the U.S. Bureau of Labor Statistics (BLS), is the primary source of labor
14-1: How Taxes Work NOTES
 14-1: How Taxes Work NOTES Learning Target 1. I will demonstrate my understanding of the different types of taxes and what tax revenue is used for. Government Revenue Tax: a mandatory payment to a local,
WikiLeaks Document Release
 WikiLeaks Document Release February 2, 2009 Congressional Research Service Report RS21071 Medicaid Expenditures, FY2003 and FY2004 Karen Tritz, Domestic Social Policy Division January 17, 2006 Abstract.
Wisconsin Budget Toolkit
 Wisconsin Budget Toolkit INTRODUCTION Updated January 2016 Countless times a day, you are affected by state budget decisions. When you turn on the water, send your child to school, turn on a light, or
PROPERTY ASSESSMENT AND TAXATION
 AUTHORITY The City and Borough of Juneau s authorization to levy a property tax is provided under Alaska State Statute Section 29.45. Under this section, the State requires the Assessor to assess property
Dual-eligible beneficiaries S E C T I O N
 Dual-eligible beneficiaries S E C T I O N Chart 4-1. Dual-eligible beneficiaries account for a disproportionate share of Medicare spending, 2010 Percent of FFS beneficiaries Dual eligible 19% Percent
How Public Education Benefits from the Federal Income Tax Deduction for State and Local Taxes and Other Special Tax Provisions
 How Public Education Benefits from the Federal Income Tax Deduction for State and Local Taxes and Other Special Tax Provisions A Background Paper from the Center on Education Policy Introduction Discussions
OVERVIEW OF THE FEDERAL TAX SYSTEM AS IN EFFECT FOR 2014
 OVERVIEW OF THE FEDERAL TAX SYSTEM AS IN EFFECT FOR 2014 Prepared by the Staff of the JOINT COMMITTEE ON TAXATION March 28, 2014 JCX-25-14 CONTENTS Page INTRODUCTION... 1 I. SUMMARY OF PRESENT-LAW FEDERAL
This publication is a slight revision of four news releases recently made available to Oregon newspapers.
 Understanding Oregon's Four 1986 Tax Initiatives This publication is a slight revision of four news releases recently made available to Oregon newspapers. Part 1. How Does the Current System Work? Part
Into the Black: A Survey of Virginia Voters on State Service Cuts and Tax Changes
 Into the Black: A Survey of Virginia Voters on State Service Cuts and Tax Changes March 2004 Into the Black: A Survey of Virginia Voters on State Service Cuts and Tax Changes Data Collected by Woelfel
Louisiana Family Assistance Rebate Program
 Louisiana Family Assistance Rebate Program Overview The Louisiana Family Assistance Rebate Program is designed to ensure that tbe average Louisiana family and individual receives a net benefit under the