The Multi-Generational Labor Force: Perceptions of Jobs among Millennials, Gen-Xers, and Boomers
|
|
|
- Ethel Harvey
- 6 years ago
- Views:
Transcription
1 The Multi-Generational Labor Force: Perceptions of Jobs among Millennials, Gen-Xers, and Boomers Sarah C. Kerman and Teresa A. Keenan AARP Research January
2 Table of Contents Page 3: Background Page 5: Key Insights Page 8: Employment Status Page 11: Reasons to Work Page 19: Best Possible Job Page 27: Job Satisfaction Page 32: Benefits- Availability and Participation Page 35: Summary Page 38: Appendix 2

3 Background 3
4 Background To better understand the multi-generational labor force (Millennials ages 18-34, Gen-Xers ages 35-54, and Baby Boomers ages 55-69), a national, online survey was conducted among 1,797 adults currently working or looking for work. Topics included: Reasons to work (or look for work if not currently working) Characteristics of best possible job Satisfaction levels with current job Methodology: Age-and-gender quotas were used during data collection and the final sample was weighted to match the labor force s population distribution using the 2016 Current Population Survey March (ASEC) Supplement The survey was administered by Phi Power Communications, Inc. ( PhiPower ) and was fielded from August 19 through August 29,
5 Key Insights 5
6 Key Insights To better understand the multi-generational labor force (Millennials ages 18-34, Gen-Xers ages 35-54, and Baby Boomers ages 55-69), AARP conducted a national online survey of 1,797 adults who are currently working or looking for work. The survey explored the reasons adults work and the job characteristics they most value. While differences exist, the survey also found similarities across generations. This suggests that employers have opportunities to address common needs in order to build age-diverse teams. Similarities include: When thinking about what is most important to their best possible job, over seven-in-ten Millennials, Gen-Xers and Boomers identify good pay as one of their top priorities. Additionally, a substantial portion (at least four-in-ten) of each generation cite a good work-life balance, paid time off, a flexible schedule and a friendly work environment among their most important characteristics. When asked about reasons they are working (or looking for work), Millennials, Gen-Xers and Boomers are most likely to report earning money for everyday expenses as a major reason. Majorities of each generation also cite long-term security as a major reason to work. Similarities between Millennials and Gen-Xers: Millennials and Gen-Xers are similarly likely to say supporting family (Millennials: 54%, Gen-Xers: 57%) and paying off debt (Millennials: 46%, Gen-Xers: 49%) are major reasons for them to work. Similarities between Gen-Xers and Boomers: Around half of Gen-Xers and Boomers say health insurance is a major reason for them to work. Accordingly, these generations are particularly likely to identify a health plan as one of the most important characteristics of their best possible job (Gen-Xers: 49%, Boomers: 47%). 6
7 Key Insights, continued Majorities of each generation are interested in work-related training: While interest is greatest among the youngest members of the labor force, a majority of adults across generations are interested in work-related education and training opportunities. A clear majority (71%) of adults in the labor force are interested in training to keep skills and knowledge up to date, with 78% of Millennials, 70% of Gen-Xers, and 61% of Boomers extremely or very interested. Notably, 58% of Boomers are extremely or very interested in training to learn new skills to advance in their career, and 51% are extremely or very interested in training for a completely different type of job. Differences include: Boomers, as a group, are the most satisfied in their current jobs. The survey finds that 65% are either extremely or very satisfied with their current job, compared to 57% of both Millennials and Gen-Xers. Millennials are more likely to be engaged in a job search. The survey finds that 35% of employed Millennials are currently looking for a new job, and of those not currently looking, almost a quarter (24%) are likely to begin a job search in the next year. The job-seeking behavior among the youngest members of the labor force may be related to their relative likelihood to prioritize career advancement opportunities. Not surprisingly, life stages may help explain some differences across generations. For example, Millennials, who may be facing first-time expenses such as a car or home, are more likely than other generations to say saving for a large expense is a major reason to work. And, Gen-Xers and Boomers are more likely than Millennials to consider a health plan and retirement plan among the most important characteristics of their best possible job. Boomers and Millennials are more likely than Gen-Xers to be employed part-time, with 23% of Boomers and 25% of Millennials working part-time, compared to 15% of Gen-Xers. 7
8 Employment Status 8
9 Employment Status Employed full-time Employed part-time Not working but looking for work 100% 90% 80% 70% 60% 50% 40% 30% 20% 10% 17% 20% 20% 25% 83% 63% 55% 80% 14% 16% 15% 23% 86% 71% 61% 84% The survey was fielded among those who work full-time or part-time, and those not working but looking for work. At least eight-in-ten of those surveyed are currently employed across all generations. Among these segments, Gen-Xers are the most likely to be employed on a full-time basis. 0% Total (n=1,797) Millennials (n=634) Gen-Xers (n=782) Boomers (n=381) Q50. Which of the following best describes your current employment status? *Base sizes shown throughout the report are weighted base sizes. 9
10 Job Seeking Current A quarter of those employed are currently looking for a new job. Millennials are most likely to be looking, followed by Gen-Xers. Future Of those employed and not currently looking for a new job, 12% are extremely or very likely to begin looking in the next year. Millennials are by far the most likely to report this. 35% 25% 23% 24% 12% 12% 9% 5% Total (n=1,497) Millennials (n=507) Gen-Xers (n=671) Q080. Are you currently looking for a new job? Boomers (n=320) Total (n=1,124) Millennials (n=327) Gen-Xers (n=515) Q090. How likely are you to begin actively looking for a new job in the next year? Boomers (n=281) 10
11 Reasons to Work 11
12 Reasons to Work Respondents were presented with a list of 16 statements and were asked if each is a major reason, minor reason or not at all a reason they are working (or looking for work if unemployed): To earn money for everyday expenses (e.g., food, clothing, transportation, housing) To pay down or pay off debt (e.g., student loan, mortgage, or credit card debt) To support family members To pay for health care costs for myself or family members To have and maintain health insurance coverage To have a retirement plan (such as a 401(k) or pension) To save for a large expense (e.g., house, school, car) To pay for experiences or things I enjoy (e.g., restaurants, recreational vehicles, vacations) To save for a rainy day For camaraderie with work colleagues To advance in my career To continue learning To have a chance to use my skills and talents To have a chance to do something worthwhile To feel respected For long-term security Q100. The following may or may not be reasons you are [if employed: working right now/if not but seeking a job: looking for a job right now]. For each item, please indicate if it is a MAJOR REASON, MINOR REASON, or NOT AT ALL A REASON you are working/looking for a job.] 12
13 Major Reasons to Work Roughly eight-in-ten respondents say earning money for everyday expenses is a major reason they are working (or looking for work if unemployed) leading the other reasons by a notable margin. Everyday expenses Long-term security Support family Pay for experiences/things I enjoy 52% 50% 60% 79% Long-term security, supporting family members, and paying for experiences or things I enjoy follow, with at least half citing these as major reasons. Pay off debt Health insurance Save for large expense 46% 45% 45% Health care costs of self/family 45% Retirement plan 43% Use skills / talents 42% *Top 10 major reasons for the total sample shown on this chart 13

14 Top 3 Major Reasons to Work, by Generation Across all generations, earning money for everyday expenses is the most commonly cited major reason to work. This suggests that providing for basic needs is a major motivation for Millennials, Gen-Xers and Boomers alike. For Gen-Xers and Boomers, long-term security is the second most commonly cited major reason to work. Long-term security is also a major motivation for a majority of Millennials. Saving for a large expense, supporting family, and health insurance rank in the top three reasons most commonly cited by Millennials, Gen-Xers and Boomers, respectively, perhaps reflecting varying priorities at different life stages. Millennials (n=634) Gen-Xers (n=782) Boomers (n=381) Everyday expenses 77% Everyday expenses 82% Everyday expenses 76% Save for large expense 59% Long-term security 63% Long-term security 58% Experiences/things 57% Support family 57% 49% Health insurance * Long-term security (56%) and supporting family members (54%) follow paying for experiences/things I enjoy. * Paying off debt (49%), paying for experiences/ things I enjoy (49%), a retirement plan (48%) and health insurance (48%) follow supporting family. *Health care costs (45%) and paying for experiences/things I enjoy (43%) follow health insurance. 14
15 Similarities Across Generations Across all generations, earning money for everyday expenses is the most commonly cited major reason to work. Long-term security also ranks highly for all. Millennials, Gen-Xers and Boomers are about equally likely to say paying for health care costs is a major reason for them to work. Additionally, about four-in-ten of each generation say using their skills and talents is a major reason. 82% 77% 76% Top 10 Major Reasons to Work Millennials (n=634) Gen-Xers (n=782) Boomers (n=381) 63% 58% 56% 57% 54% 39% 57% 49% 49% 48% 49% 46% 43% 40% 41% 59% 41% 46% 45% 43% 48% 44% 41% 42% 40% 37% 28% Everyday expenses Long-term security Support family Experiences/ things Pay off debt Health insurance Save for large expense Health care costs Retirement plan Use skills/talents *Top 10 major reasons for the total sample shown on this chart 15
16 Millennial Differentiators Millennials are more likely than other generations to cite saving for a large expense, paying for experiences/things I enjoy and career advancement as major reasons to work. Although at somewhat lower levels, and hence not pictured below, they are also more likely to cite to continue learning (38%) and to feel respected (29%) as major reasons. Similar to Gen-Xers, Millennials are more likely than Boomers to report supporting family as a major reason to work reflective of different life stages. 82% 77% 76% Top 10 Major Reasons to Work Millennials (n=634) Gen-Xers (n=782) Boomers (n=381) 59% 41% 28% 63% 57% 56% 58% 49% 43% 57% 54% 39% 49% 46% 46% 40% 30% 46% 43% 45% 43% 38% 36% 41% 48% 49% 15% Everyday expenses Save for large expense Experiences/ things Long-term security Support family Advance career Pay off debt Health care costs Do something worthwhile Health insurance *Top 10 major reasons for Millennials shown on this chart 16

17 Gen-X Differentiators While majorities of each generation cite everyday expenses and long-term security as major reasons to work, Gen-Xers stand out somewhat in this regard. Although similar to Millennials, Gen-Xers are more likely than Boomers to report supporting family and paying off debt as major reasons to work. On the other hand, Gen-Xers are more likely than Millennials to cite health insurance as a major reason to work. Generation-X also emerges as the generation most likely to cite a retirement plan as a major reason. 82% 77% 76% Top 10 Major Reasons to Work Millennials (n=634) Gen-Xers (n=782) Boomers (n=381) 63% 56% 58% 57% 57% 54% 49% 49% 46% 48% 48% 43% 39% 40% 41% 41% 37% 49% 46% 43% 45% 44% 40% 42% 44% 39% 40% Everyday expenses Long-term security Support family Pay off debt Experiences/ things Retirement plan Health insurance Health care costs Use skills/talents Save for rainy day *Top 10 major reasons for Gen-Xers shown on this chart 17

18 Boomer Differentiators Boomers, along with Gen-Xers, are more likely than Millennials to say health insurance is a major reason for them to work. Boomers are less likely than the other generations to report certain financial obligations as major reasons to work, specifically: supporting family and saving for a large expense (28%, not pictured below). Additionally, while two-in-five Boomers cite paying off debt as a major reason, they are less likely than Gen-X to report this. Life stages may help explain these differences. Although over two-in-five Boomers consider paying for experiences/things I enjoy a major reason for them to work, Millennials are significantly more likely to regard this as a major reason. 82% 77% 76% Top 10 Major Reasons to Work Millennials (n=634) Gen-Xers (n=782) Boomers (n=381) 63% 56% 58% 41% 48% 49% 46% 43% 45% 57% 57% 54% 49% 48% 49% 44% 46% 43% 44% 40% 42% 41% 40% 37% 39% 40% 39% Everyday expenses Long-term security Health insurance Health care costs Experiences/ things Use skills/talents Retirement plan Pay off debt Save for rainy day Support family *Top 10 major reasons for Boomers shown on this chart 18
19 Best Possible Job 19
20 Best Possible Job Respondents were asked to think about the best possible job for them, and to select up to seven of the following 22 job characteristics that they would consider the most important for that job: Pays well Provides me with opportunities to advance in my career Offers a flexible schedule/flexible hours Values and respects my ideas and opinions Allows me to work from home or remotely from anywhere Provides recognition or reward for work effort Provides an opportunity for part-time work Provides a good work-life balance Has a retirement plan (such as a 401(k) or pension) Provides opportunities to learn new things Has paid time off (e.g., paid vacation, paid sick days) Gives me a chance to use my skills and talents Provides a health plan or medical insurance Offers variety and challenges me Has a short commute Allows me to do what I ve always wanted to do Provides people my age with opportunities Has professional development/training opportunities Provides people of all races and ethnicities with opportunities Gives me a chance to do something worthwhile Has a friendly work environment Provides me with independence Q105. Now, please think about what would be the BEST POSSIBLE JOB FOR YOU. Thinking about that, please choose the seven (7) job characteristics that you would consider the most important for that job... 20
21 Characteristics of Best Possible Job Top Attractions of Best Possible Job (% of respondents who ranked item in the top 7) About three-quarters of respondents identify good pay as one of the most important characteristics of their best possible job. As expected, this characteristic is by far the most often cited. After pay, respondents are most likely to cite good work-life balance (50%) as one of the most important characteristics. Other top attractions are paid time off, a flexible schedule, a health plan, a friendly work environment and a retirement plan, with at least two-in-five respondents citing them. Pays well Good work-life balance 50% Paid time off 47% Flexible schedule 45% Provides health plan/medical insurance 44% Friendly work environment 43% Retirement plan 40% Short commute 36% Chance to use skills/talents 34% 77% Provides independence 30% *Top 10 most selected job characteristics for the total sample shown on this chart 21

22 Top 4 Characteristics of Best Possible Job, by Generation Across all generations, work-life balance and paid time off are two of the top four most commonly cited characteristics, with over four-in-ten Millennials, Gen-Xers and Boomers identifying them as essential to their best possible job. While a flexible schedule is among the top four most cited characteristics for Millennials, a health plan falls in the top four for Gen-Xers and Boomers. Millennials (n=634) Gen-Xers (n=782) Boomers (n=381) Pays well 76% Pays well 80% Pays well 74% Work-life balance 50% Work-life balance 51% Health plan 47% Flexible schedule 46% Paid time off 49% Paid time off 45% Paid time off 44% Work-life balance Health plan 49% 45% *A friendly work environment (43%) immediately follows paid time off. *A retirement plan (46%) follows a health plan. *A friendly work environment (44%) and flexible schedule (44%) immediately follow work-life balance. 22
23 Similarities Across Generations As expected, pays well is the most commonly identified characteristic across all generations. Good worklife balance and paid time off also rank highly for all. Similar proportions of Millennials, Gen-Xers and Boomers are attracted by a flexible schedule and a friendly work environment, with at least two-in-five of each generation citing these characteristics as essential to their best possible job. Additionally, around three-in-ten of each generation say independence is one of the most important job characteristics. 80% 76% 74% Characteristics of Best Possible Job Millennials (n=634) Gen-Xers (n=782) Boomers (n=381) 50% 51% 49% 45% 44% 45% 46% 44% 44% 37% 49% 47% 43% 42% 44% 46% 41% 42% 38% 38% 32% 31% 32% 33% 31% 29% 31% Pays well Good work-life balance Paid time off Flexible schedule/hours Health plan/medical insurance Friendly work environment Retirement plan Short commute Chance to use skills/talents Independence *Top 10 most selected job characteristics for the total sample shown on this chart 23
.")
24 Millennial Differentiators Millennials are more likely than the other generations to cite career advancement opportunities as one of the most important characteristics of their best possible job. Similarly, although at somewhat lower levels and hence not pictured below, Millennials are also more likely than their counterparts to prioritize professional development/training opportunities (24%). Millennials are the generation least likely to cite a health plan, retirement plan, and short commute although over three-in-ten still consider these aspects among the most important. 80% 76% 74% Characteristics of Best Possible Job Millennials (n=634) Gen-Xers (n=782) Boomers (n=381) 50% 51% 49% 45% 46% 44% 44% 44% 45% 43% 42% 44% 37% 49% 47% 35% 46% 38% 41% 42% 38% 32% 33% 32% 31% 21% 11% Pays well Good work-life balance Flexible schedule/hours Paid time off Friendly work environment Health plan/medical insurance Career advancement Chance to use skills/talents Retirement plan Short commute *Top 10 most selected job characteristics for Millennials shown on this chart 24

25 Gen-X Differentiators While good pay is by far the leading characteristic for all generations, Gen-Xers stand out somewhat on that dimension. Along with Boomers, Gen-Xers are more likely than Millennials to say a health plan and a retirement plan are among the most important aspects of their best possible job. They also are more likely than Millennials to value a short commute. 80% 76% 74% Characteristics of Best Possible Job Millennials (n=634) Gen-Xers (n=782) Boomers (n=381) 50% 51% 49% 49% 45% 44% 45% 47% 37% 32% 46% 41% 46% 44% 44% 43% 42% 44% 42% 38% 38% 31% 32% 33% 31% 29% 31% Pays well Good work-life balance Paid time off Health plan/medical insurance Retirement plan Flexible schedule/hours Friendly work environment Short commute Chance to use skills/talents Independence *Top 10 most selected job characteristics for Gen-Xers shown on this chart 25
26 Boomer Differentiators Along with Gen-Xers, Boomers are more likely than Millennials to include a health plan, short commute and retirement plan among the most important characteristics of their best possible job. Although at somewhat lower levels, and hence not pictured below, a job that provides people my age with opportunities (27%) and provides an opportunity for part-time work (24%) is more likely to be important to Boomers than the other two generations. 80% 76% 74% Characteristics of Best Possible Job Millennials (n=634) Gen-Xers (n=782) Boomers (n=381) 49% 49% 50% 51% 47% 44% 45% 45% 46% 43% 42% 44% 44% 44% 37% 46% 42% 41% 38% 38% 31% 32% 32% 33% 31% 29% 31% Pays well Health plan/medical insurance Paid time off Good work-life balance Friendly work environment Flexible schedule/hours Short commute Retirement plan Chance to use skills/talents Independence *Top 10 most selected job characteristics for Boomers shown on this chart 26
27 Job Satisfaction 27
28 Satisfaction with Current Job Extremely/Very Satisfied Somewhat Satisfied Not Very/Not at All Satisfied 9% 10% 9% 7% 33% 33% 34% 28% Approximately three-in-five workers are extremely or very satisfied with their job. Boomers, as a group, are the most satisfied. 59% 57% 57% 65% Dissatisfaction seems relatively low, with less than one-in-ten (9%) rating their dissatisfaction in the bottom two categories. However, a third of those working are only somewhat satisfied. Those working full-time are more likely to be satisfied than part-timers (63% vs. 45%, respectively) (not shown). Total (n=1,497) Millennials (n=507) Gen-Xers (n=671) Boomers (n=320) Q110. Now, please switch gears back to your CURRENT JOB. Overall, how satisfied are you with your current job? (Base = employed) 28
29 Satisfaction with Characteristics of Current Job Respondents were presented with the seven characteristics they selected as most important to their best possible job, and were asked to rate how satisfied they were with their current job on each of those dimensions: Pay Opportunities to advance in my career Flexibility in schedule/hours The extent to which my ideas and opinions are valued and respected Opportunity to work from home or remotely from anywhere The recognition or reward for work effort Opportunity for part-time work Work-life balance Retirement plan (such as a 401(k) or pension) Opportunities to learn new things Paid time off Opportunities to use my skills and talents Health plan or medical insurance The variety and level of challenge Commute The extent to which my job allows me to do what I ve always wanted to do The opportunities for people my age Professional development/ training opportunities The opportunities for people of all races and ethnicities The chance to do something worthwhile Friendliness of the work environment Level of independence Q115. How satisfied are you with the following aspects of your current job? (Base: employed; asked for items ranked in top-7 in Q105, when considering best possible job. ) (Ns vary) 29
30 Satisfaction with Characteristics of Current Job Respondents were asked to report how satisfied they are with their current job when it comes to the job characteristics they previously identified as the most important to them. There are relatively high levels of satisfaction when it comes to the friendliness of the work environment, the opportunities to use skills and talents, the commute, the level of independence and the flexibility in schedule, with roughly seven-in-ten being extremely/very satisfied. Roughly three-in-five workers are extremely/very satisfied when it comes to work-life balance, a retirement plan, paid time off and a health plan/medical insurance. However, at least 35% are only somewhat satisfied or less. Slightly less than half (47%) are extremely/ very satisfied with their current pay, rendering it the number one shortcoming. Extremely/Very Satisfied Friendliness of the work environment (n=625) Opportunities to use skills/talents (n=530) Commute (n=530) Level of independence (n=454) Flexibility in schedule/hours (n=658) Work-life balance (n=753) Retirement plan (n=634) Paid time off (n=724) Health plan/medical insurance (n=669) Pay (n=1,149) 47% 58% 57% 61% 65% 71% 71% 69% 72% 72% * Satisfaction with the ten characteristics that were most often selected as important to respondents best possible job shown here. (Base: employed; asked for items ranked in top-7 in Q105, when considering best possible job. ) 30
31 Satisfaction by Generation For all three generations, only around half of workers say they are extremely or very satisfied with their pay. When it comes to many of the other job characteristics, Boomers tend to be the group most satisfied; whereas, in general, Millennials tend to be least satisfied. 80% 74% 75% 66% 68% 69% 65% 74% 76% 78% 73% 59% Satisfaction (Extremely/Very Satisfied) Millennials Gen-Xers Boomers 74% 73% 69% 71% 66% 67% 61% 63% 60% 61% 57% 57% 52% 54% 50% 49% 49% 46% Friendliness of the work environment Opportunities to use my skills and talents Commute Level of independence Flexibility in schedule/hours Work-life balance Retirement plan Paid time off Health plan/medical insurance Pay *Satisfaction with the ten characteristics that were most often selected as important to respondents best possible job shown here. (Base: employed; asked for items ranked in top-7 in Q105, when considering best possible job. ) 31
32 Benefits - Availability and Participation 32
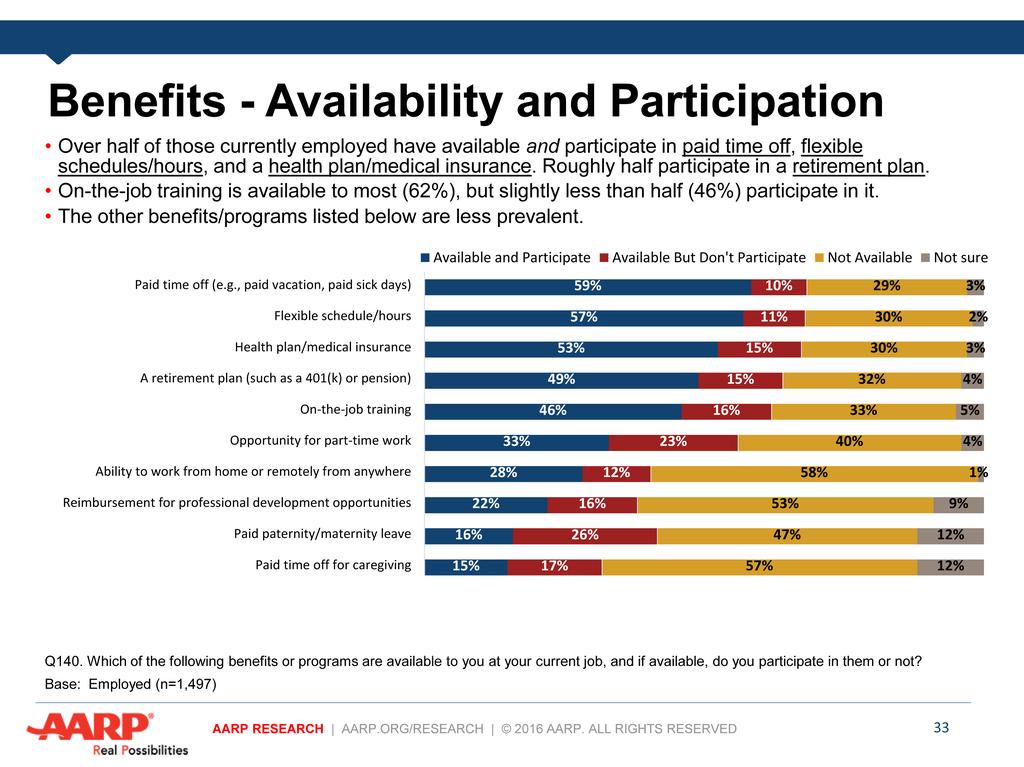

33
34 Benefits by Generation Gen-Xers and Boomers are more likely than Millennials to report that they have available and participate in paid time off, health plans and retirement plans, whereas the youngest generation stands out when it comes to using flexible schedules/hours. Available and Participate Millennials (n=507) Gen-Xers (n=671) Boomers (n=320) Paid time off Flexible schedule/hours Health plan/medical insurance A retirement plan On-the-job training Opportunity for part-time work Ability to work from home or remotely from anywhere Reimbursement for professional development opportunities Paid paternity/maternity leave Paid time off for caregiving 7% 8% 15% 14% 20% 20% 21% 21% 29% 26% 30% 25% 27% 49% 65% 61% 63% 55% 51% 45% 57% 56% 40% 57% 49% 49% 45% 43% 38% 35% 34
35 Summary 35
36 Summary: Reasons to Work Respondents were asked about reasons they are working (or looking for work if unemployed). Across all generations, earning money for everyday expenses is the most commonly cited major reason to work (Millennials: 77%, Gen-Xers: 82%, Boomers: 76%). This suggests that providing for basic needs is a major motivation for Millennials, Gen-Xers and Boomers alike. Majorities of each generation also cite long-term security as a major reason to work (Millennials: 56%, Gen-Xers: 63%, Boomers: 58%). Other topics likely to resonate with each generation: Millennials: At least half of Millennials say saving for a large expense (59%), paying for experiences/things I enjoy (57%), and supporting family (54%) are major reasons for them to work. This is followed by career advancement (46%) and paying off debt (46%). In fact, Millennials are more likely than the other generations to report saving for a large expense, paying for experiences/things I enjoy and career advancement as major reasons. Gen-Xers: Over half of Gen-Xers say supporting family (57%) is a major reason for them to work. This is followed by paying off debt (49%), paying for experiences/things I enjoy (49%), a retirement plan (48%) and health insurance (48%). Notably, Gen-Xers are more likely than the other groups to report a retirement plan as a major reason. Millennials and Gen-Xers are similarly likely to say supporting family (Millennials: 54%, Gen-Xers: 57%) and paying off debt (Millennials: 46%, Gen-Xers: 49%) are major reasons for them to work. Boomers: After everyday expenses and long-term security, health insurance (49%), health care costs (45%) and paying for experiences/things I enjoy (43%) are the most commonly cited major reasons to work among Boomers. Gen-Xers (48%) and Boomers (49%) are more likely than Millennials (41%) to say health insurance is a major reason for them to work. 36
37 Summary: Best Possible Job When asked what is most important to their best possible job, respondents are most likely to cite pay (77%), followed by good work-life balance (50%), paid time off (47%), a flexible schedule (45%), a health plan (44%), a friendly work environment (43%) and a retirement plan (40%). Work-life balance (Millennials: 50%, Gen-Xers: 51%, Boomers: 45%), paid time off (44%, 49%, 45%), a flexible schedule (46%, 44%, 44%) and a friendly work environment (43%, 42%, 44%) are likely to resonate with a substantial portion of each generation. Other characteristics likely to resonate with each generation for their best possible job : Millennials: Millennials are more likely than the other generations to say career advancement (35%) is one of the most important characteristics of their best possible job. Gen-Xers: At least two-in-five Gen-Xers consider a health plan (49%) and a retirement plan (46%) among the most important characteristics of their best possible job. Boomers: At least two-in-five Boomers consider a health plan (47%), short commute (42%) and a retirement plan (41%) among the most important characteristics of their best possible job. Gen-Xers and Boomers are more likely than Millennials to prioritize a health plan, retirement plan and short commute (although still over three-in-ten Millennials consider these to be among the most important characteristics of their best possible job). 37
38 Appendix 38
39 Job Security Secure (8-10) Middle (4-7) Insecure (1-3) 6% 5% 6% 6% 38% 39% 41% 31% Somewhat more than half of those employed (56%) feel secure in their jobs. Still, over four-in-ten (44%) report moderate (38%) to low (6%) levels of security. 56% 56% 53% 63% Boomers (63%) are more likely than Gen-Xers (53%) to feel secure, with Millennials (56%) falling between these two generations. Total (n= 1,497) Millennials (n=507) Gen-Xers (n=671) Boomers (n=320) Q145. How much job security do you currently feel you have? Please use a scale of 1 to 10, with 1 being not at all secure and 10 being totally secure. (Base: employed) 39
40 Type of Pay Hourly Salary and no overtime Piecemeal Other 3% 1% 2% 9% 6% 10% 21% 27% 32% 6% 10% 28% Around seven-in-ten (72%) Millennial respondents are paid on an hourly basis, whereas 57% of Gen-Xers and 56% of Boomers are paid that way. 62% 72% 57% 56% Around three-in-ten Gen-Xers (32%) and Boomers (28%) are on salary compared to 21% of Millennials. Total (n=1,497) Millennials (n=507) Gen-Xers (n=671) Boomers (n=320) Q150. How are you paid in your current job? (Base: employed) 40
41 Number of Employees at Current Company/Organization 1,000 or more % 16% 12% 18% 20% 25% 16% 15% A majority of those in each generation work for a company with at least 50 employees 12% 14% 13% 6% 20% 22% 19% 20% 26% 25% 25% 29% Total (n=1,497) Millennials (n=507) Gen-Xers (n=671) Boomers (n=320) Q160. Including yourself, approximately how many people work for the company or organization you work for? (Base: employed) 41
42 White vs. Blue Collar White collar Blue collar Something else 9% 9% 8% 12% 34% 39% 33% 30% While about half of those in each generation see themselves as white collar, Millennials are significantly more likely than Boomers to report being blue collar workers. 52% 47% 55% 54% Total (n=1,497) Millennials (n=507) Gen-Xers (n=671) Boomers (n=320) Q170. Would you say your current job is a white collar job, a blue collar job, or something else? (Base: employed) 42
43 Importance of Staying Current with Technology Among the Employed Approximately three-fifths of those working say staying current with technology is extremely or very important for their job. Millennials (65%), followed by Gen-Xers (60%), particularly see the importance. Among the Unemployed Looking at those who are not employed but seeking work, between almost half and slightly over two-thirds (45-69%) of each generation feel it will be extremely or very important to stay current with technology. Extremely/very important Somewhat important Not important Extremely/very important Somewhat important Not important 16% 13% 15% 24% 8% 7% 10% 5% 23% 20% 24% 27% 30% 34% 15% 46% 59% 65% 60% 49% 57% 53% 69% 45% Total (n=1,497) Millennials (n=507) Gen-Xers (n=671) Boomers (n=320) Q120. How important is it for you to stay current with technology for your job? (Base: employed) Total (n=300) Millennials (n=128) Gen-Xers (n=111) Boomers (n=61) Q125. Now, thinking about the types of jobs you are looking for, how important is it for you to stay current with technology for those jobs? (Base: Not working but looking) 43
44 Interest in Work-Related Education and Training Extremely/very interested Somewhat interested Not interested 6% 11% 10% 21% 21% 23% 24% 25% About two-thirds (66%) of respondents are extremely or very interested in participating in workrelated education or training opportunities if cost were not a consideration. Almost three-quarters (73%) of Millennials, and two-thirds (66%) of Gen-Xers say they are interested. 66% 73% 66% 54% Boomers are least likely to express interest (54%), although a majority still report interest in participating. Total (n=1,797) Millennials (n=634) Gen-Xers (n=782) Boomers (n=381) Q130. Overall, how interested would you be in participating in work-related education or training opportunities if cost were not a consideration? 44

45 Interest in Different Types of Education/Training Interest is greatest for training that helps you learn new skills necessary to advance and keep your skills up-to-date. Millennials, followed by Gen-Xers, are most likely to be interested in these opportunities. Not as many are interested in education/training for an entirely new type of job, especially among Boomers. But, notably, approximately half of Boomers are still interested in training for a new field of work. Extremely/Very Interested Total (n=1,797) Millennials (n=634) Gen-Xers (n=782) Boomers (n=381) 79% 78% 72% 73% 71% 70% 69% 61% 62% 61% 58% 51% Training that would allow you to learn new skills and knowledge necessary to advance your career Training that would allow you to keep your skills and knowledge up-to-date Training that would allow you to learn new skills and knowledge necessary to get an entirely different type of job Q135_A-C. To what extent would you be personally interested in the following types of work-related education or training opportunities if cost were not a consideration? 45
46 Employed with Company vs. Self-Employed I work for a company or organization I am self-employed 14% 86% 7% 93% 16% 20% 84% 81% All generations primarily work for a company or organization, but Boomers (20%) and Gen-Xers (16%) are more likely than Millennials (7%) to be selfemployed. Total (n=1,497) Millennials (n=507) Gen-Xers (n=671) Boomers (n=320) Q070. Do you work for a company or organization, or are you self-employed? (Base = employed) 46
Preparing for Retirement: The Lost Generation Comes of Age
 Preparing for Retirement: The Lost Generation Comes of Age About the Study T. Rowe Price engaged Brightwork Partners to conduct a national study of 3,022 adults aged 18 and older who have never retired
Boomers at Midlife. The AARP Life Stage Study. Wave 2
 Boomers at Midlife 2003 The AARP Life Stage Study Wave 2 Boomers at Midlife: The AARP Life Stage Study Wave 2, 2003 Carol Keegan, Ph.D. Project Manager, Knowledge Management, AARP 202-434-6286 Sonya Gross
THE VALUE OF EXPERIENCE: AARP MULTICULTURAL WORK & JOBS STUDY CHARTBOOK FOR TOTAL RESPONDENTS
 THE VALUE OF EXPERIENCE: AARP MULTICULTURAL WORK & JOBS STUDY CHARTBOOK FOR TOTAL RESPONDENTS July 2018 AARP.ORG/RESEARCH 2018 AARP ALL RIGHTS RESERVED DOI: https://doi.org/10.26419/res.00177.003 AARP
How next wave independent workers are preparing for self-employment:
 Climbing the corporate ladder is no longer the American dream. Over the last few years a significant mindset shift has taken place, and with it has emerged a workforce which values flexibility over stability.
T. Rowe Price 2015 FAMILY FINANCIAL TRADE-OFFS SURVEY
 T. Rowe Price 2015 FAMILY FINANCIAL TRADE-OFFS SURVEY Contents Perceptions About Saving for Retirement & College Education Respondent College Experience Family Financial Profile Saving for College Paying
10th Annual Transamerica Retirement Survey Full-Time & Part-Time Workers
 10th Annual Transamerica Retirement Survey Full-Time & Part-Time Workers Transamerica Center for Retirement Studies Table of Contents PAGE Objectives 4 Methodology 5 Terminology 6 Profile of Respondents
Millennials and Work: The Non-Prime Experience. May 2017
 Millennials and Work: The Non- Experience May 2017 Introduction The broad discussion in many circles about the plight of the non-prime consumer often uses assumptions about how these consumers think, what
Bank of the West 2018 Millennial Study Results
 Bank of the West 2018 Millennial Study Results July 2018 Table of Contents Executive Summary 3 Key Findings 5 The Millennial Mindset The American Dream 6 Homeownership 9 Relationship with Debt 17 Investing
Scottrade Financial Behavior Study. Scottrade Financial Behavior Study 1
 2016 Scottrade Financial Behavior Study Scottrade Financial Behavior Study 1 Scottrade Financial Behavior Study Scottrade, Inc. commissioned a survey of investors to explore their attitudes and behaviors
MILLENNIALS AND RETIREMENT Surprising Insights on America s Youngest Workers
 MILLENNIALS AND RETIREMENT Surprising Insights on America s Youngest Workers Millennials Outperforming Older Generations in Retirement Readiness Eighteen years ago, as the first Millennials began to trickle
Reflections in the Mirror: Defined contribution plan participants
 Reflections in the Mirror: Defined contribution plan participants offer their perspectives and perceptions around retirement savings 2014 FINDINGS OF NATIONAL PLAN PARTICIPANT SURVEY Non-FDIC Insured May
Lessons learned in higher education
 Lessons learned in higher education Voya Retirement Research Institute Study focuses on retirement and financial realities for college and university employees Our nation s colleges and universities represent
The Financial Capability of Young Adults A Generational View
 FINRA Foundation Financial Capability Insights March 2014 Author: Gary R. Mottola, Ph.D. This brief was produced in consultation with the United States Department of the Treasury and in support of the
Financial Literacy: Prosperity Begins with Knowledge
 Financial Literacy: Prosperity Begins with Knowledge Contents Executive Summary 3 Introduction 4 U.S. Consumer Banking Behavior and Attitudes 5 Perceptions of Financial Literacy and Programs 12 The Value
Millennials in Insurance. white paper
 Millennials in Insurance white paper 2018 Millennials often get a bad rap. Whether they re accused of recklessly spending their paychecks on trendy avocado toast brunches instead of buying a home, or fiddling
Segmentation Survey. Results of Quantitative Research
 Segmentation Survey Results of Quantitative Research August 2016 1 Methodology KRC Research conducted a 20-minute online survey of 1,000 adults age 25 and over who are not unemployed or retired. The survey
2016 Retirement preparedness survey findings
 2016 Retirement preparedness survey findings RETIREMENT PERSPECTIVES Key Themes Saving for retirement is getting progressively harder for each generation. More than half of pre-retirees expect to have
Alaskans Views of Arctic Offshore Energy Development. Analysis of a Statewide Survey
 Alaskans Views of Arctic Offshore Energy Development Analysis of a Statewide Survey Background On October 13th the Natural Resources Defense Council and the League of Conservation Voters (NRDC/LCV) released
Employee Benefits for a Multi-Generational Workforce
 Employee Benefits for a Multi-Generational Workforce There s an unusual phenomenon occurring in today s workforce. Three distinct generations Baby Boomers, Gen-Xers and Millennials are working alongside
Uncertain Futures: 7 Myths about Millennials and Investing
 Uncertain Futures: 7 Myths about and Investing October 2018 What s Inside: Financial Goals 1 Barriers to Investing 2 Investing Confidence 4 View of Financial Professionals 4 Asset and Cost Assumptions
Snapshot of LGBT Older Workers Ages 45+
 THE 2017 AARP MULTICULTURAL WORK AND JOBS STUDY Snapshot of LGBT Older Workers Approximately three-quarters (76%) of LGBT older workers ages 45+ work full time. An additional 19 percent work less than
Greenstone ASIA Senior Workplace Survey
 Greenstone ASIA Senior Workplace Survey Full Data Report Greenstone ASIA Workplace SCREENING Qa1. How old are you?, 83.3 Generation 16.7, Question: How old are you? The vast majority (83.3) of respondents
2014 Wells Fargo Middle-Class Retirement Study
 2014 Wells Fargo Middle-Class Retirement Study Table of contents Overview 1 Key findings 2 Background and methodology 8 Overview Consistent with findings from previous surveys, middle-class Americans continue
Introduction. Salesforce Research 2017 Connected Investor Report / 2
 Introduction To explore how Americans manage their money, choose and communicate with financial advisors as well as measure consumer sentiment and trust in financial institutions Salesforce conducted its
The 2011 Consumer Financial Literacy Survey Final Report
 The 2011 Consumer Financial Literacy Survey Final Report Prepared For: The National Foundation for Credit Counseling March 2011 Prepared By: Harris Interactive Inc. Public Relations Research 1 Summary
About This Report. Millennials Ages Generation Xers Ages Baby Boomers Ages Salesforce Research
 About This Report To explore current attitudes and methods in how Americans today communicate and manage their investments with financial advisors, Salesforce Research conducted its 2015 Wealth Management
The State of Employee Benefits: Findings From the 2018 Health and Workplace Benefits Survey
 January 10, 2019 No. 470 The State of Employee Benefits: Findings From the 2018 Health and Workplace Benefits Survey By Lisa Greenwald, Greenwald & Associates, and Paul Fronstin, Ph.D., Employee Benefit
RETIREMENT EDUCATION. The Correlation Between Retirement Readiness and Employer Involvement
 RETIREMENT EDUCATION The Correlation Between Retirement Readiness and Employer Involvement Employer-Provided Retirement Education a Win-Win for Employers and Employees Americans workplace retirement plans
17 th Annual Transamerica Retirement Survey Influences of Generation on Retirement Readiness
 1 th Annual Transamerica Retirement Survey Influences of Generation on Retirement Readiness December 016 TCRS 1-6 Transamerica Institute, 016 Table of Contents Welcome to the 1 th Annual Transamerica Retirement
Sixth Annual Nationwide TCHS Consumers Healthcare Survey: Stressed Out: Americans and Healthcare
 Sixth Annual Nationwide TCHS Consumers Healthcare Survey: Stressed Out: Americans and Healthcare October 2018 Table of Contents About the Transamerica Center for Health Studies Page 3 About the Survey
Raddon Research Insights. The High-Income Market: Trends and Behaviors, 2016
 The High-Income Market: Trends and Behaviors, 2016 Contents Introduction 1 Profile of the High-Income Consumer 2 Product Usage: Loans and Deposits 10 Investments 17 Retirement 28 Conclusions 34 Strategies
FINANCIAL LITERACY AND RETIREMENT PREPAREDNESS
 PRUDENTIAL INVESTMENTS» MUTUAL FUNDS FINANCIAL LITERACY AND RETIREMENT PREPAREDNESS WHITE PAPER STUDY FINDINGS Key Themes Financial literacy continues to pose a serious challenge to achieving retirement
16 th Annual Transamerica Retirement Survey Influences of Generation on Retirement Readiness
 6 th Annual Transamerica Retirement Survey Influences of Generation on Retirement Readiness August 0 TCRS 0--0 Transamerica Institute, 0 Welcome to the 6 th Annual Transamerica Retirement Survey Welcome
Understanding and Achieving Participant Financial Wellness
 Understanding and Achieving Participant Financial Wellness Insights from our research From August 25, 2017 to January 31, 2018, the companies of OneAmerica fielded an online survey to retirement plan participants
California Dreaming or California Struggling?
 California Dreaming or California Struggling? 2017 Findings from the AARP study of California Adults Ages 36-70 in the Workforce #CADreamingOrStruggling https://doi.org/10.26419/res.00163.001 SURVEY METHODOLOGY
Aging and Retirement. Financial Priorities, Behaviors and Influence on Retirement
 Aging and Retirement Financial Priorities, Behaviors and Influence on Retirement October 2018 2 Whether a Millennial, part of the Generation or somewhere in between, there are financial challenges to be
AMERICA AT HOME SURVEY American Attitudes on Homeownership, the Home-Buying Process, and the Impact of Student Loan Debt
 AMERICA AT HOME SURVEY 2017 American Attitudes on Homeownership, the Home-Buying Process, and the Impact of Student Loan Debt 1 Objective and Methodology Objective The purpose of the survey was to understand
Impact Investing: At a Tipping Point?
 Impact Investing: At a Tipping Point? This 2018 briefing provides data gathered from a survey of affluent and high-net-worth people who give to charity to understand their interest in, knowledge of and
Look who s not talking!
 Look who s not talking! Consumers surprisingly mum on retirement planning 26025Z REV 11-17 4350 Westown Parkway West Des Moines, IA 50266 www.northamericancompany.com 1 We need to talk. All consumers do.
The Value of Experience: Age Discrimination Against Older Workers Persists
 The Value of Experience: Age Discrimination Against Older Workers Persists Rebecca Perron Sr. Research Advisor Presented by AARP Research AARP.ORG/RESEARCH https://doi.org/10.26419/res.00177.002 2018 AARP.
TOP FINDINGS FROM THE
 TOP FINDINGS FROM THE 2018 Fidelity Investments New Year Financial Resolutions Study A FEW WORDS ABOUT THE STUDY The Fidelity Investments New Year Financial Resolutions Study was designed to explore attitudes
Transamerica Small Business Retirement Survey
 Transamerica Small Business Retirement Survey Summary of Findings October 16, 2003 Table of Contents Background and Objectives 3 Methodology 4 Key Findings 2003 8 Key Trends - 1998 to 2003 18 Detailed
September TD Bank Checking Experience Index 2015
 September 2015 TD Bank Checking Experience Index 2015 Overview TD Bank s 3 rd Checking Experience Index - better understanding consumers checking account experiences, behaviors and attitudes. Methodology
Financial Perspectives on Aging and Retirement Across the Generations
 Financial Perspectives on Aging and Retirement Across the Generations GREENWALD & ASSOCIATES October 2018 Table of Contents Executive Summary 2 Background and Methodology 3 Key Findings 5 Retrospectives
What Do Millennials Expect From Financial Advisors?
 What Do Millennials Expect From Financial Advisors? INTRODUCTION As a financial advisor, do you have the correct processes and systems in place to attract, retain and serve Millennials? As you will see
Combatting ageism to improve access to employment. Jemma Mouland February 2019
 Combatting ageism to improve access to employment Jemma Mouland February 2019 Centre for Ageing Better We work for a society where everybody enjoys a good later life An independent charitable foundation
FINANCIAL WELLNESS: A PRIORITY FOR FINANCIAL SERVICES. January 18, 2018
 FINANCIAL WELLNESS: A PRIORITY FOR FINANCIAL SERVICES January 18, 2018 Boston Research Technologies conducted an online survey with a national sample of 1,242 employees who responded between September
12 Trends Influencing the Future of Workplace Benefits
 12 Trends Influencing the Future of Workplace Benefits E M P LOYE E S U RV E Y OV E RV I E W 2 The 2018 Aflac WorkForces Report is the eighth annual study examining benefits trends and attitudes. The study
Retirement and Investment Webinar Series
 Retirement and Investment Webinar Series September 30, 2015 Retirement and Investment Great Expectations: Retirement Perceptions Don t Always Meet Reality Grace Lattyak Rob Reiskytl Heather Tredup Retirement
17 th Annual Transamerica Retirement Survey Influences of Gender on Retirement Readiness
 1 th Annual Transamerica Retirement Survey Influences of Gender on Retirement Readiness December 2016 TCRS 1335-1216 Transamerica Institute, 2016 Welcome to the 1 th Annual Transamerica Retirement Survey
GENERATING INTEREST: COLLEGE DEBT S TOLL ON AMERICAN WORKERS
 GENERATING INTEREST: COLLEGE DEBT S TOLL ON AMERICAN WORKERS NEW DATA SHOWS STUDENT LOANS ARE LIMITING SKILL DEVELOPMENT AND IMPACTING CAREER DECISIONS What s the impact of educational debt? The data show
Retirement Solutions. Engaging the Next Generations in Retirement Savings
 www.calamos.com Retirement Solutions Engaging the Next Generations in Retirement Savings Improving Retirement Readiness for the Next Generations by Applying Behavioral Finance & Thoughtful Plan Design
consumer VOICE Survey 2015 Investor Insights on the Financial Advice Industry
 consumer VOICE Survey 2015 Investor Insights on the Financial Advice Industry NOVEMBER 2015 over VIEW There is currently much discussion regarding the financial advice industry in Canada, including what
Healthcare and Health Insurance Choices: How Consumers Decide
 Healthcare and Health Insurance Choices: How Consumers Decide CONSUMER SURVEY FALL 2016 Despite the growing importance of healthcare consumerism, relatively little is known about consumer attitudes and
Life Insurance Association of Singapore Survey Results. 10 November 2006
 Life Insurance Association of Singapore Survey Results 10 November 2006 1 Research Objectives To ascertain : The general population s understanding of life insurance The general population s perception
DISPOSABLE INCOME INDEX
 DISPOSABLE INCOME INDEX Q1 2018 A commissioned report for Scottish Friendly CREDIT CARD 1234 5678 9876 5432 JOHN SMITH Executive summary The Scottish Friendly Disposable Income Index uses new survey data
INTRODUCTION. Sincerely, Beth Finkel State Director, AARP New York
 INTRODUCTION This year Generation X turned 50! AARP New York is the state s leading advocate for the 50-plus with over 2.5 million members, including 750,000 in New York City. We believe now is the time
Majority of Millennials Are Happy Despite Financial Anxiety, Wells Fargo Study Finds
 Contact: Amy Hyland Jones 704-383-4995 Amy.hylandjones@wellsfargo.com Peter Greenley 415-222-0102 Peter.Greenley@wellsfargo.com Majority of Millennials Are Happy Despite Financial Anxiety, Wells Fargo
Consumer Choices About Physicians, Health Plans, and Hospitals
 Consumer Choices About Physicians, Health Plans, and Hospitals Prepared by Harris Interactive October 17, 2013 1 Methodology Representative survey of 1,005 US consumers age 27 and over* 15-minute online
Lost in Translation. Retirement lessons learned by the Sandwich generations are not getting passed on. Lost in Translation 27102D PRT 02-18
 Lost in Translation Retirement lessons learned by the Sandwich generations are not getting passed on. Page 1 Retirement planning has not been a topic of conversation between parents and kids Lost in Translation
Hong Kong Talent Trends What s on the minds of the professional workforce
 Hong Kong Talent Trends 2014 What s on the minds of the professional workforce Introduction For career-minded people in Hong Kong, these are interesting times, we are in an era of unprecedented transparency.
IV. EXPECTATIONS FOR THE FUTURE
 IV. EXPECTATIONS FOR THE FUTURE Young adults in Massachusetts widely view their future in positive terms. Those who are doing well financially now generally see that continuing. Those doing less well express
The Demographics of Wealth
 Demographics and the Future of American Families The Demographics of Wealth May 13, 2015 William R. Emmons Bryan J. Noeth Center for Household Financial Stability Federal Reserve Bank of St. Louis William.R.Emmons@stls.frb.org
Detailed Results 9TH ANNUAL PARENTS, KIDS & MONEY SURVEY
 Detailed Results 9TH ANNUAL PARENTS, KIDS & MONEY SURVEY Contents Household Finances..3 Household Debt 19 Savings..28 Emergency Fund..32 Retirement Savings..36 Parental Knowledge, Attitudes and Behavior.....42
2017 Planning & Progress Study
 The Northwestern Mutual Life Insurance Company Milwaukee, WI 2017 Planning & Progress Study Longevity Northwestern Mutual is the marketing name for The Northwestern Mutual Life Insurance Company (NM),
Socially Responsible Investing Survey. September 2018
 Socially Responsible Investing Survey September 2018 1 Research Method Socially responsible investments investments that aim to promote environmental stewardship, consumer protection, human rights, and
2015 Life + Money Survey: What Americans Think About Most
 Brought to you by 2015 Life + Money Survey: What Americans Think About Most v What Do Americans Think About Most? GOBankingRates surveyed 5,003 U.S. adults, asking, What do you think about most? The following
UBS Investor Watch. Analyzing investor sentiment and behavior 4Q is the new. What is old? a b
 UBS Investor Watch Analyzing investor sentiment and behavior 4Q 2013 60 80 is the new What is old? a b Retirement does not equal old As people are living longer, the definition of old is changing. Investors
STABILITY AMID CHANGE Benefits in State and Local Government. Insights from MetLife s 14th Annual. U.S. Employee Benefit Trends Study
 STABILITY AMID CHANGE Benefits in State and Local Government Insights from MetLife s 14th Annual U.S. Employee Benefit Trends Study 14th Annual U.S. Employee Benefit Trends Study PEACE OF MIND IN TIMES
AHP SALARY REPORT C A N A D A,
 AHP SALARY REPORT CANADA, 2018 TABLE OF CONTENTS EXECUTIVE SUMMARY... 3 INTRODUCTION... 4 METHODOLOGY... 4 RESPONDENT PROFILE... 5 ANNUAL SALARY... 10 COMPENSATION AND BENEFITS... 18 EMPLOYEE PERCEPTIONS...
2017 AARP Foundation Taxpayer Satisfaction Survey Report
 2017 AARP Foundation Taxpayer Satisfaction Survey Report Lona Choi-Allum & Melissa Brown June 2017 1 About AARP Foundation AARP Foundation is working to win back opportunity for struggling Americans 50+
European Social Reality
 Social Reality EUBAMETER Romanian citizens appear to live in a more negative social reality than citizens on average. They are considerably less happy, more dissatisfied with various aspects of their daily
Millennial Saving & Investing Habits. What Today s Financial Advisors Need to Know About the Next Generation of Investors
 Millennial Saving & Investing Habits What Today s Financial Advisors Need to Know About the Next Generation of Investors The Findings The millennial generation can often be a mystery. Many industries are
Voices of 50+ New Hampshire: Dreams & Challenges
 2011 Voices of 50+ New Hampshire: Dreams & Challenges Executive Summary AARP has a strong commitment to help improve the lives of the 50+ population. As part of the Association s continuous communication
The current and future you
 The current and future you What you can learn from those at other life stages What advice could the future you give the current you? A 2015 Forbes Insights and Northwestern Mutual survey was designed to
Voices of 50+ Hispanics in New York: Dreams & Challenges
 2011 Voices of 50+ Hispanics in New York: Dreams & Challenges Executive Summary AARP has a strong commitment to help improve the lives of the 50+ population. As part of the Association s continuous communication
Opinion Poll. Small Businesses Support Paid Family Leave Programs. March 30, 2017
 Opinion Poll Small Businesses Support Paid Family Leave Programs March 30, 2017 Small Business Majority 1101 14 th Street, NW, Suite 950 Washington, DC 20005 (202) 828-8357 www.smallbusinessmajority.org
Retirement Needs and Preferences of Younger Public Workers Pew survey shows priorities center on savings portability, benefit guarantees
 A brief from May 2017 Retirement Needs and Preferences of Younger Public Workers Pew survey shows priorities center on savings portability, benefit guarantees Overview After the Great Recession took a
17 th Annual Transamerica Retirement Survey Influences of Educational Attainment on Retirement Readiness
 th Annual Transamerica Retirement Survey Influences of Educational Attainment on Retirement Readiness December 0 TCRS - Transamerica Institute, 0 Welcome to the th Annual Transamerica Retirement Survey
Trends in Financial Literacy
 College of Saint Benedict and Saint John's University DigitalCommons@CSB/SJU Celebrating Scholarship & Creativity Day Experiential Learning & Community Engagement 4-27-2017 Trends in Financial Literacy
BIGGEST RELOCATION CHALLENGES DOMESTIC U.S. RELOCATION
 BIGGEST RELOCATION CHALLENGES DOMESTIC U.S. RELOCATION What keeps relocation managers up at night? During a turbulent period that included, for example, a real estate recession, the European financial
2/3 81% 67% Millennials and money. Key insights. Millennials are optimistic despite a challenging start to adulthood
 2/3 Proportion of Millennials who believe they will achieve a greater standard of living than their parents 81% Percentage of Millennials who believe they need to pay off their debts before they can begin
Financial Realities: Generational Advice. July 2010
 Financial Realities: Generational Advice July 2010 Objectives and Methodology Objectives: 1. To provide insight into Americans propensity to give advice against the backdrop of economic uncertainty. 2.
Saving and Investing Among High Income African-American and White Americans
 The Ariel Mutual Funds/Charles Schwab & Co., Inc. Black Investor Survey: Saving and Investing Among High Income African-American and Americans June 2002 1 Prepared for Ariel Mutual Funds and Charles Schwab
Client Experience With Investment Call Centers 2011 Investment Call Center Satisfaction Survey
 Client Experience With Investment Call Centers 2011 Investment Call Center Satisfaction Survey Jim S Miller President, Prime Performance www.primeperformance.net *FREE VERSION* Table of Contents Page 2
Boomer Expectations for Retirement. How Attitudes about Retirement Savings and Income Impact Overall Retirement Strategies
 Boomer Expectations for Retirement How Attitudes about Retirement Savings and Income Impact Overall Retirement Strategies April 2011 Overview January 1, 2011 marked a turning point in the retirement industry,
Public Says a Secure Job Is the Ticket to the Middle Class
 1 Public Says a Secure Job Is the Ticket to the Middle Class By Wendy Wang Americans believe that having a secure job is by far the most important requirement for being in the middle class, easily trumping
THE ASSOCIATED PRESS POLL CONDUCTED BY IPSOS-PUBLIC AFFAIRS RELEASE DATE: AUGUST 19, 2004 PROJECT # REGISTERED VOTERS/PARTY IDENTIFICATION
 1101 Connecticut Avenue NW, Suite 200 Washington, DC 20036 (202) 463-7300 Interview dates: Interviews: 1,001 adults Margin of error: +3.1 THE ASSOCIATED PRESS POLL CONDUCTED BY IPSOS-PUBLIC AFFAIRS RELEASE
Mind, Body, and Wallet
 R Guardian in sync Market Insights Mind, Body, and Wallet Financial Stress Impacts the Emotional and Physical Well-Being of Working Americans Source for all statistics cited is : Fourth Annual, 2016 Life
SALARY GUIDE 2015 EDITION
 SALARY GUIDE 2015 EDITION TABLE OF CONTENTS About the Guide The Lay of the Land Salary by the Numbers Motivators and Incentives Job and Salary Satisfaction About Health ecareers 3 4 5 9 10 12 Health ecareers
RETIREMENT SAVINGS: PRIORITIES, STRATEGIES, AND BARRIERS
 RETIREMENT SAVINGS: PRIORITIES, STRATEGIES, AND BARRIERS A Survey for the AARP / Ad Council Saving for Retirement Campaign January 2019 DOI: https://doi.org/10.26419/res.00272.001 Table of Contents Introduction
time use across the life course
 issue brief 18 issue brief 18 time use across the life course Tay K. McNamara introduction It is important to understand how various activities fit together for both workers and non-workers throughout
Pueblo Community College and 2010 Colorado Community College System (CCCS) Climate Surveys. Office of Institutional Research.
 Climate Surveys. Office of Institutional Research.") Office of Institutional Research Pueblo Community College 2008 and 2010 Colorado Community College System (CCCS) Climate Surveys Prepared by Dr. Patricia Diawara, Director of Institutional Research, Planning,
Office of Institutional Research Pueblo Community College 2008 and 2010 Colorado Community College System (CCCS) Climate Surveys Prepared by Dr. Patricia Diawara, Director of Institutional Research, Planning,
Questions and Answers about OLDER WORKERS: A Sloan Work and Family Research Network Fact Sheet
 Questions and Answers about OLDER WORKERS: A Sloan Work and Family Research Network Fact Sheet Introduction The Sloan Work and Family Research Network has prepared Fact Sheets that provide statistical
2018 Planning & Progress Study
 The Northwestern Mutual Life Insurance Company Milwaukee, WI 2018 Planning & Progress Study Advisors: Key to Financial Clarity Northwestern Mutual is the marketing name for The Northwestern Mutual Life
Preparing for Their Future
 Preparing for Their Future AL Look at tthe Financial i lstate t of and Sponsored by The American Savings Education Council and AARP/Divided We Fail Conducted by Mathew Greenwald & Associates Presentation
2017 Compensation and Benefits Survey - Final Report
 2017 Compensation and Benefits Survey - Final Report Prepared For: Alberta Professional Planners Institute Prepared By: Bramm Research Inc. Better Information. Better Solutions www.brammresearch.com May
2018 U.S. TRUST INSIGHTS ON WEALTH AND WORTH
 2018 U.S. TRUST INSIGHTS ON WEALTH AND WORTH Detailed Findings FOR MEDIA INQUIRIES, CONTACT: JULIA EHRENFELD U.S. TRUST MEDIA RELATIONS 646.855.3267 JULIA.EHRENFELD@BANKOFAMERICA.COM Go Paperless! Please
Voices of 50+ New York:
 2011 Voices of 50+ New York: Dreams & Challenges Executive Summary AARP has a strong commitment to help improve the lives of the 50+ population. As part of the Association s continuous communication with
THE HOME BUYERS OF TOMORROW. September 8, 2016 Azad Amir-Ghassemi Research Analyst
 THE HOME BUYERS OF TOMORROW September 8, 2016 Azad Amir-Ghassemi Research Analyst METHODOLOGY Online Only Survey conducted from January 2016- February 2016 1871 respondents: 633 Emerging Millennials (18-25);