Comprehensive Annual Financial Report
|
|
|
- Rebecca Rogers
- 6 years ago
- Views:
Transcription
1 SANTA CLARA VALLEY TRANSPORTATION AUTHORITY Comprehensive Annual Financial Report FISCAL YEAR 2015 For Fiscal Year Ended June 30, 2015 Santa Clara County, California


2 Newly reconstructed Eastridge Transit Center opened in May 2015 Football fans heading to Levi s Stadium in the City of Santa Clara Architectural steel canopy shades the Berryessa BART Station photog. Noah Berger, MTC Structural steel rising up from the Milpitas BART Station Overnight crews constructing the Mountain View Light Rail Double Track Project to open in December 2015 VTA s wrapped bus joined two local rallies for APTA s nationwide Stand Up for Transportation Day - a day of advocacy to urge Congress to pass a long-term federal funding bill. VTA opened its new Innovation Center at River Oaks headquarters in February 2015 as a space where VTA teams and companies can develop, test, and showcase new transportation technology.
3 SANTA CLARA VALLEY TRANSPORTATION AUTHORITY SAN JOSE, CALIFORNIA Comprehensive Annual Financial Report (CAFR) For Fiscal Year Ended June 30, 2015 Prepared by: Finance and Budget Division
4 THIS PAGE IS INTENTIONALLY LEFT BLANK
5 SANTA CLARA VALLEY TRANSPORTATION AUTHORITY Comprehensive Annual Financial Report For the Year Ended June 30, 2015 Table of Contents Page INTRODUCTION: Letter of Transmittal Board of Directors Organizational Chart Principal Officials Service Area Map FINANCIAL SECTION: Independent Auditor s Report Management s Discussion and Analysis (Required Supplementary Information) Basic Financial Statements: Government-wide Financial Statements: Statement of Net Position Statement of Activities Fund Financial Statements: Proprietary Funds: Statement of Fund Net Position Statement of Revenues, Expenses and Changes in Fund Net Position Statement of Cash Flows Governmental Funds: Balance Sheet Statement of Revenues, Expenditures and Changes in Fund Balances Fiduciary Funds: Statement of Fiduciary Net Position Statement of Changes in Fiduciary Net Position Notes to the Basic Financial Statements i
6 SANTA CLARA VALLEY TRANSPORTATION AUTHORITY Comprehensive Annual Financial Report For the Year Ended June 30, 2015 Table of Contents (continued) Page Required Supplementary Information (other than MD&A): Schedule of Changes in Net Pension Liability and Related Ratios ATU Pension Plan Schedule of Plan Contributions - ATU Pension Plan Schedule of Changes in Net Pension Liability and Related Ratios CalPERS Plan Schedule of Plan Contributions CalPERS Plan Schedule of Funding Progress Retirees Other Post Employment Benefits Trust (OPEB Trust) Budgetary Comparison Schedule Congestion Management Program Special Revenue Fund Note to Required Supplementary Information Budgetary Basis of Accounting Supplementary Information - Combining and Individual Fund Statements and Schedules: Enterprise Funds: Comparative Schedule of Fund Net Position Comparative Schedule of Revenues, Expenses, and Changes in Fund Net Position Comparative Schedule of Cash Flows Budgetary Comparison Schedule VTA Transit Fund Fiduciary Funds: Combining Statement of Fiduciary Net Position ATU Pension, OPEB and Medical Funds Combining Statement of Changes in Fiduciary Net Position ATU Pension, OPEB and Medical Funds Combining Statement of Fiduciary Assets and Liabilities Agency Fund Combining Statement of Changes in Fiduciary Assets and Liabilities Agency Funds STATISTICAL SECTION (Unaudited): Financial Trends: Changes in Net Position Net Position by Component Fund Balances and Changes in Fund Balances, Governmental Funds Current Ratio Operating Revenues and Operating Expenses Non-operating Assistance and Interest Income Targeted Operating Reserves Revenue Capacity: Revenue Base and Revenue Rates Overlapping Revenue Principal Sales Tax Payers by Segments ii
7 SANTA CLARA VALLEY TRANSPORTATION AUTHORITY Comprehensive Annual Financial Report For the Year Ended June 30, 2015 Table of Contents (continued) Page Debt Capacity: Total Outstanding Debt by Type Ratios of Outstanding Debt Direct and Overlapping Debt and Debt Limitation Pledged Revenue Coverage Half-Cent Sales Tax Revenue Bonds Pledged Revenue Coverage Measure A Half-cent Sales Tax Revenue Bonds Projected Pledged Revenue Coverage Demographic and Economic Information: Population Trends Income and Unemployment Rates Wage and Salary Employment by Industry (Annual Average) Silicon Valley Major Employers Operating Information: Operating Indicators Farebox Recovery Ratio Revenue Miles Passenger Miles Selected Statistical Data System Data Employees Capital Assets iii
8 THIS PAGE IS INTENTIONALLY LEFT BLANK
9
10 THIS PAGE IS INTENTIONALLY LEFT BLANK
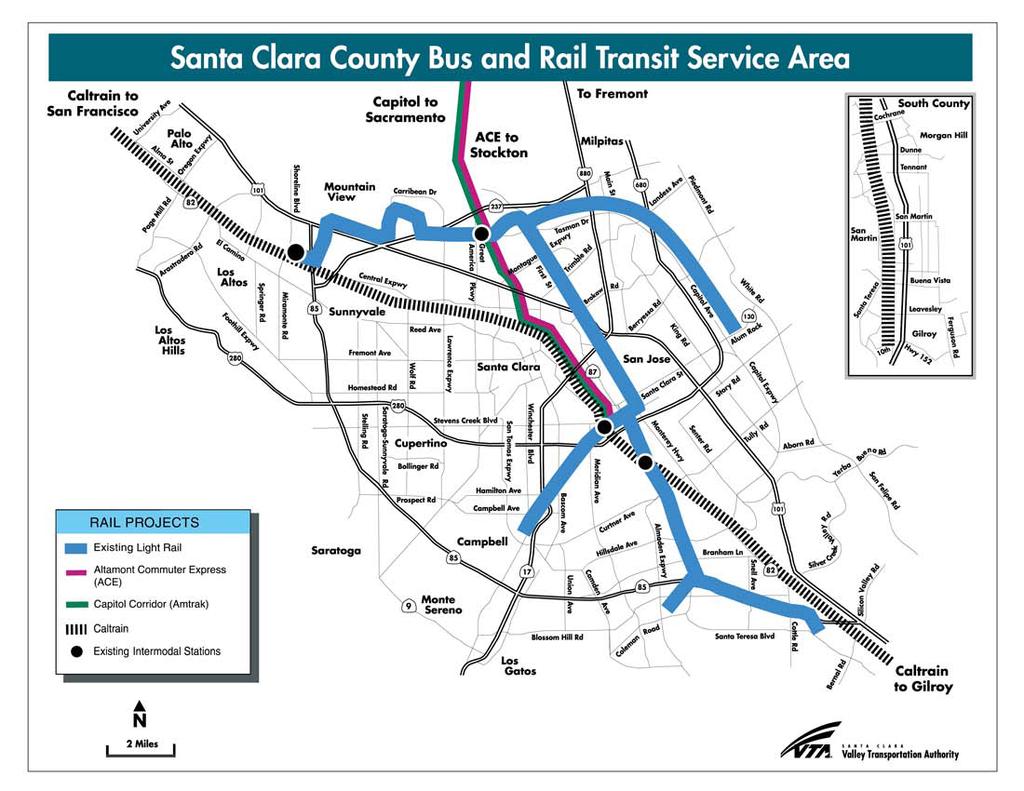
11 SECTION 1 - INTRODUCTION LETTER OF TRANSMITTAL BOARD OF DIRECTORS ORGANIZATIONAL CHART PRINCIPAL OFFICIALS SERVICE AREA MAP
12 THIS PAGE IS INTENTIONALLY LEFT BLANK
13 LETTER OF TRANSMITTAL
14 THIS PAGE IS INTENTIONALLY LEFT BLANK
15 October 26, 2015 Board of Directors Santa Clara Valley Transportation Authority Subject: Comprehensive Annual Financial Report It is a pleasure to submit to you the Comprehensive Annual Financial Report (CAFR) of the Santa Clara Valley Transportation Authority (VTA) for the year ended June 30, The CAFR was prepared in accordance with the guidelines recommended by the Government Finance Officers Association of the United States and Canada (GFOA). VTA Management assumes responsibility for the accuracy and completeness of the data and the clarity of the presentation, including all disclosures. To the best of our knowledge, the enclosed report is presented in conformity with Generally Accepted Accounting Principles (GAAP), and is complete and reliable in all material respects. Vavrinek, Trine, Day & Company LLP, a firm of licensed Certified Public Accountants, has audited the financial statements. The goal of the audit is to obtain a reasonable assurance that the financial statements are free of material misstatements. Vavrinek, Trine, Day & Company LLP concluded, based on the audit, that there was a reasonable basis for rendering an unmodified opinion on the financial statements for the fiscal year ended June 30, 2015, and that the financial statements are fairly stated in conformity with GAAP. The independent auditor s report is presented as the first component of the financial section of this report. In addition, Vavrinek, Trine, Day & Company LLP also conducts the federally mandated Single Audit designed to meet requirements of federal grantor agencies. The standards governing the Single Audit require the independent auditor to report on the fair presentation of the financial statements, the agency s internal controls over compliance, and certain federal compliance requirements.
16 Generally Accepted Accounting Principles require that management provide a narrative introduction, overview, and analysis to accompany the basic financial statements in the form of Management s Discussion and Analysis (MD&A). This letter of transmittal is designed to complement the MD&A and should be read in conjunction with it. The VTA s MD&A can be found immediately following the Independent Auditor s Report. PROFILE OF THE GOVERNMENT VTA is an independent special district and political subdivision of the State of California. VTA was created in 1972 and was known as the Santa Clara County Transit District (District). The District served Santa Clara County (County) which is situated in the southern portion of the San Francisco Bay Area and is bordered by the counties of Alameda, San Mateo, Santa Cruz, San Benito, Merced, and Stanislaus. In 1976, Santa Clara County voters approved a half-cent Measure A sales tax proposal to fund the District. In 1995, the District merged with the County s congestion management agency and operated under the governance of its own Board of Directors. On January 1, 2000, VTA s name was officially changed to the Santa Clara Valley Transportation Authority. Today, VTA provides bus, light rail, and paratransit services, as well as participates as a funding partner in regional rail service including Caltrain, Capitol Corridor, and the Altamont Corridor Express. As the County s congestion management agency, VTA is responsible for countywide transportation planning, including congestion management, design and construction of specific highway, pedestrian, and bicycle improvement projects, as well as promotion of transit oriented development. VTA continually builds partnerships to deliver transportation solutions that meet the evolving mobility needs of Santa Clara County. VTA is governed by a 12 member Board of Directors (the Board or the Board of Directors) consisting of elected officials appointed by the jurisdictions they represent. Five members of the Board and one alternate are appointed by the San Jose City Council. One member of the Board and one alternate are appointed from among the city councils of the cities of Los Altos, Mountain View, Palo Alto, and the Town of Los Altos Hills. One Board member and one alternate are appointed from among the city councils of the cities of Campbell, Cupertino, Monte Sereno, Saratoga, and the Town of Los Gatos. One Board member and one alternate are also appointed from among the city councils of the cities of Gilroy and Morgan Hill. Two members of the Board and one alternate are appointed from among the city councils of the cities of Milpitas, Santa Clara, and Sunnyvale. The final two seats on the Board and one alternate are appointed by the Santa Clara County Board of Supervisors. The allocation of Board representation is generally based on population. A chart depicting the 1-2
17 current membership of the Board and the jurisdictions they represent is located on page 1-11 of this report. ECONOMIC ENVIRONMENT The information presented in the financial statements is better understood when considered with a broader perspective of the specific environment in which the government entity operates. The County of Santa Clara is located at the southern end of the San Francisco Bay and encompasses an area of approximately 1,300 square miles. The County s population of nearly 1.9 million is one of the largest in the state, and the largest of the nine Bay Area counties. 1 Its population constitutes about one fourth of the Bay Area s total population. According to San Jose Mercury Newspaper s analysis of the statistics released by state labor officials, Santa Clara County s pace of job growth is the strongest the region has enjoyed in at least 14 years. Santa Clara County has the highest median household income in the nation, at $93, The northwest portion of the County, known as Silicon Valley, is home to many leading computer and electronic companies. With varied and relatively stable employers such as Google, Cisco, Hewlett-Packard, Yahoo, ebay, and Apple among others, Santa Clara County has enjoyed diverse employment and revenue base. A strong employment gain points to an economy that is returning to full expansion mode. 3 Job gains occurred in professional and business services, leisure and hospitality, and health care. According to the US Department of Labor report in June 2015, the national unemployment rate dropped to 5.3% and the number of unemployed persons was 8.3 million 4, compared to prior year s statistics during the same period, when unemployment rate was 6.1% and the number of unemployed persons was 9.5 million. With steady job gains and growth in consumer income, sales of homes, cars, and other products and services are climbing. 5 In June 2015, the County s unemployment rate dropped to 4.0% from 5.2% the prior year, and the state s unemployment dropped to 6.2% from 7.4% the prior year. 6 The tightening labor and housing markets continue to push home prices upward. The County continues to see surge in the construction of higher density multi-family housing units, many of which 1 Population Demographics for Santa Clara County in 2014 and San Jose Mercury News, Santa Clara County has the highest median household income in the nation, but wealth gap widens. August Kiplinger s Economic Outlook, May 29, Bureau of Labor Statistics News Release. July 2, News Tribune. US Economy Not as Bad in 1 st Quarter. June 24, Homefacts. Unemployment Rate Report. June
18 were designed with utilization of public transit in mind. 7 A spot check of the fastest-growing metro areas nationwide shows that Santa Clara County is expanding its job totals at a much faster yearly pace than other metro regions in the country. 8 The long-term employment picture in Santa Clara County remains bright because of the strong technology sector. The 2016 State balanced budget feeds a more positive financial condition which lessens the risk of outright program cuts or revenue losses that have contributed to local deficits in the past. Slowly but surely, the state is eliminating the budgetary debts and continues to maintain a healthier rainy day fund which will give the state fiscal capacity during budget shortfalls and challenging times. Overall, the California economic outlook continues to be positive with forecast anticipating stronger growth in the state in the coming years. Among the industries making California the leader in business are health care, consumer staples, specialty pharmaceuticals, energy and biotech. 9 Consistent with the State s improved financial condition, the Transportation Development Act (TDA) revenue increased by $5.1 million in FY On the other hand, State Transportation Assistance (STA) revenue declined by $1.4 million as prices for diesel, along with gasoline and crude oil, continue to reflect significant cuts. Both revenue sources are state programs that provide funds to operate bus and rail systems in California. During FY 2015, job growth and surge in wages and salaries fueled higher consumer and business spending. This condition helped increase VTA s revenue base affecting its largest revenue sources for operations and capital activity, 1976 Half-Cent Sales Tax and 2000 Measure A Sales Tax. Both sales tax revenues are dependent upon taxable sales activity in the county. For FY 2015, the 1976 Half-Cent Sales Tax and the 2000 Measure A Sales Tax revenue grew 6.86% and 7.17%, respectively. ENTERPRISE NET POSITION OVERVIEW VTA s enterprise funds report the activities of its transit operations, 1996 Measure B Transportation Improvement Program, 2000 Measure A Transit Improvement Program, BART Operating, Express Lanes, and Joint Development Program. Governmental Accounting Standard Board (GASB) Statement 68 requires employers to record a Net Pension Liability representing the amount owed by employers to employees for 7 The Santa Clara County Real Estate Market Trends Report, August San Jose Mercury News, Santa Clara County Job Boom Strongest in More than a Decade. March 9, Winkler, Matthew A. Bloomberg View. Best State for Business? Yes, California. March 12,
19 benefits provided through a defined benefit pension plan. This resulted in a negative adjustment to unrestricted net position of $189 million. Despite this adjustment, Enterprise Funds net position increased by $241 million to $4 billion. This consists mainly of VTA Transit Fund of $2 billion, Measure B Transit Fund of $2.5 million, Express Lanes Fund of $2 million, Measure A Fund of $1.8 billion, BART Operating Fund of $135 million, and Joint Development of $28.4 million. Total FY 2015 Net Position amounted to $4 billion as provided below (in thousands): Net Investment in Capital Assets $ 2,950,181 Restricted: 2000 Measure A projects $ 550,650 SWAP/lease collateral 77,381 BART Operating 135,416 Debt Service 49,009 Retention 8, Measure B projects 1, ,834 Unrestricted: Debt reduction $ 134,173 Operating reserve 62,937 Sales tax stabilization 35,000 Local share of capital projects 88,433 Inventory and prepaid expenses 24,469 Irrevocable transfer made to OPEB trust fund 20,650 Joint Development 26,366 Express Lanes 1,991 Unrestricted before GASB 68 adjustment 394,019 GASB 68 adjustment* (188,994) 205,025 Total Net Position $ 3,978,040 *This is shown as reduction of the Unrestricted Net Position. The purpose is to set aside amount owed by VTA to employees for benefits provided through a defined benefit pension plan. This consists of $86.18 million and $ million for CALPERS and ATU, respectively. SIGNIFICANT FINANCIAL POLICIES Long-Range Planning VTA, in its role as the Congestion Management Agency (CMA) for Santa Clara County, is responsible for preparing and updating the Valley Transportation Plan (VTP). This document identifies long-term programs, projects, and policies that VTA plans to pursue over the next 25 years. It considers all travel modes and addresses the links between transportation and land use planning, air quality, energy use, and community livability. VTA annually updates and incorporates the VTA Financial Forecasting Model as part of its long-range planning process. As a transit operator, VTA prepares the Short Range Transit Plan (SRTP) every two years. The SRTP is used as documentation to support projects included in the Regional 1-5
20 Transportation Plan prepared by Metropolitan Transportation Commission (MTC) and activities contained in the county s long-range transportation plan. Biennial Budget and Budgetary Controls The State of California and the VTA Administrative Code require that VTA management recommend and Board of Directors adopt an operating budget at the fund level and a capital budget on a project basis. The General Manager may reallocate appropriations between budget types and budget units within each fund up to the limits of each fund s annual appropriation. Any net increase in authorized appropriations to any fund (including any allocation from reserves) requires an affirmative vote of at least eight Directors. Capital appropriations, which are not expended during the fiscal year, are carried over to successive fiscal years until the projects are completed or otherwise terminated. Funds with appropriated budget are categorized as follows: Proprietary Funds VTA Transit 1996 Measure B Transit* 2000 Measure A Transit Joint Development Express Lanes BART Operating Governmental Funds Congestion Management Program Congestion Management and Highway Program 1996 Measure B Program* *No additional appropriation in recent adopted budget as program is nearing its completion. Internal Control VTA management is responsible for establishing and maintaining an internal control system designed to ensure that its assets are protected from loss, theft, or misuse and to ensure that adequate accounting data is compiled to allow for the preparation of financial statements in conformity with Generally Accepted Accounting Principles (GAAP). The internal control system is designed to provide reasonable, but not absolute, assurance that these objectives are met. The concept of reasonable assurance recognizes that the costs of control should not exceed benefits likely to be derived from its implementation. The valuation of costs and benefits requires estimates and judgments by management. VTA s management believes its internal controls are adequate. Basis of Accounting VTA s accounting records are maintained using the system of fund accounting. All proprietary and fiduciary funds are accounted for using accrual basis of accounting and the economic resources exchange measurement focus. Under the accrual basis, revenues are 1-6
21 recorded when they are earned and expenses are recorded as soon as the goods or services are received, regardless of when the related cash flows take place. Governmental funds are reported using the current financial resources measurement focus and the modified accrual basis of accounting. Under this method, revenues are recognized when measurable and available. Reserves A summary of VTA Transit Reserves established by the Board of Directors is provided below. The negative adjustment in the beginning net position due to GASB 68 implementation may reduce a combination of these reserves. Reserve Balance as of June 30, 2015 (in millions) Remarks Operating Reserve $ The operating reserve goal is 15% of the subsequent year s final operating budget in the VTA Transit Enterprise Fund. These funds are to remain unappropriated for any operating or capital use except to meet emergency needs that cannot be funded from any other source. The purpose of this reserve is to ensure that sufficient funds are always available in the event of either unanticipated revenue shortfalls or unavoidable expenditure needs. The detailed calculation and information on the operating reserve is shown on page 3-8. Sales Tax Stabilization $35 This reserve serves to mitigate the impact of sales tax receipt volatility on service levels and the operating budget. VTA Transit Sales Tax Stabilization reserve is at its current ceiling. Debt Reduction $ This reserve may be used to reduce long-term liabilities or provide funding for approved transit-related capital improvements and replacement of capital assets. This reserve is used to fund local portion of the VTA Transit capital program in order to keep assets in a state of good repair. Financial Stability Policy The following activities serve as guidance in the prioritization of VTA operating expenses. This is necessary when there are budget reductions to keep spending consistent with available revenues, and when increases in operating revenues permit VTA to add resources to its transit-related activities. 1. Preservation of the level of fixed route transit service and paratransit service provided to VTA riders to the extent possible. This includes developing a service plan that is in 1-7
22 accordance with VTA s Transit Sustainability Policy and service design guidelines and in the best interest of the public. 2. Direct support for the provision of transit service, i.e., only those core operating, management and administrative functions that are necessary and essential to providing the existing level of transit service, both in terms of the types of functions required and level of resources needed to support service. This is measured against industry standards and best practices with consideration of efficiencies achieved by reducing layers of management. 3. Support for Regional Partnerships (e.g., Caltrain, ACE, Dumbarton Express, etc.) provided by VTA in consideration of other partners contributions. 4. Activities that clearly contribute to increasing and diversifying VTA s operating funding (e.g., fare programs, joint development, advertising, and other opportunities for earned income). 5. Activities that provide information to riders, employees, stakeholders and the public (e.g. VTA Ambassador Program). 6. Activities that would prudently and strategically expand VTA transit service, when sustainable revenues are available to support the service growth (e.g. VTA s recent expansion of bus and light rail service to Levi s Stadium). MAJOR INITIATIVE VTA s BART Silicon Valley Project The VTA s BART Silicon Valley Project is a 16-mile extension of the existing BART system to San Jose, Milpitas, and Santa Clara, which will be delivered through a phased approach. The first phase, the Silicon Valley Berryessa Extension (SVBX), is a 10-mile, twostation extension, beginning in Fremont south of the future BART Warm Springs Station and proceeding on the former Union Pacific Railroad right-of-way through Milpitas, the location of the first station, and then to the Berryessa area of north San Jose, at the second station. The cost of the SVBX Project is approximately $2.4 billion, which includes $900 million in federal assistance, $387.5 million in state and other local funding, and $1.134 billion from Measure A sales tax. In March 2012, VTA received a $900 million grant commitment from the FTA for the project, along with the first $100 million allocation, as provided for in the Full Funding Grant Agreement (FFGA). The FFGA is a multi-year contractual agreement that formally defines the project scope, cost, and schedule, and establishes the terms of the federal financial assistance. Execution of the FFGA allowed the commencement of construction of the 10-mile, two-station BART extension. As of August 2015, $392 million of the grant funding has been expended and received. The most recent federal award 1-8
23 occurred in September 2015 in the amount of $150 million. To date, a total of $552.6 million Federal Section 5309 New Starts funding for the project has been awarded. In August 2014, VTA received the Traffic Congestion Relief Program (TCRP) funds in the amount of $39 million which constitutes the final installment of the State of California s $649 million TCRP allocation plan adopted by the California Transportation Commission (CTC) in As of August 2015, remaining unexpended amount from this allocation is $29 million. The first major design and construction contract, valued at $772 million for the line, track, systems, and stations, was awarded in December 2011 to Design Builder Skanska-Shimmick- Herzog, a Joint Venture. Construction of the 10-mile, two-station project is planned for 2012 to late Construction continues at future station areas and major intersections that the BART system will cross. In October 2014, VTA issued the Notice-To-Proceed to McCarthy Building Companies, Inc., for the design and construction of the parking garages in Milpitas and Berryessa Stations. The contracts for the construction of Milpitas and Berryessa station campus areas and roadways were also awarded in February 2015 and August 2015, respectively. The project scope includes BART vehicles, VTA feeder buses, double-track grade-separated guideway, traction power substations, high voltage substations, a communication system, passenger drop-off facilities, surface and structured parking facilities, bus transit centers, a pedestrian bridge, real estate acquisition, drainage improvements, environmental mitigation, financing, startup and revenue testing, and other elements necessary for project delivery. The project also includes facility additions to the existing BART Hayward Yard for maintenance of BART vehicles. VTA continues project development activities for the second 6-mile phase of the project that is expected to include a 5.1 mile-long subway tunnel through downtown San Jose, and ending at grade in Santa Clara near the Caltrain Station. Construction on the second phase of the project will commence as additional funding is secured. AWARDS AND ACKNOWLEDGEMENTS The Government Finance Officers Association of the United States and Canada (GFOA) awarded a Certificate of Achievement for Excellence in Financial Reporting to VTA for its FY 2014 Comprehensive Annual Financial Report. This is the 19 th consecutive year that VTA achieved this prestigious award. 1-9

24 In order to receive the award, a government agency must publish an easily readable and efficiently organized Comprehensive Annual Financial Report. This report must satisfy both the accounting principles generally accepted in the United States of America and the applicable legal requirements. A Certificate of Achievement is valid for a period of one year only. We believe that our current comprehensive annual financial report continues to meet the Certificate of Achievement Program s requirements, and we are submitting it to the GFOA to determine its eligibility for another certificate. The preparation of this CAFR required a concerted team effort throughout VTA, including staff from Accounting, Disbursements, Revenue Services, Contracts and Purchasing, Risk Management, Budget and Analysis, Investment Services, Retirement Services, and Finance departments. The Copy Center, Creative Services, Office of the Board Secretary, and Marketing departments also made significant contributions to the form, content, and production of the report. The team members demonstrated a commendable degree of personal dedication and determination in producing this document. In addition, recognition is given to Vavrinek, Trine, Day & Company LLP, for their contribution, as well as all other VTA staff for responding positively and promptly to the request for information that occurs with each annual audit. Nuria I. Fernandez General Manager/CEO Raj Srinath Chief Financial Officer 1-10
25 2 015 VTA BOARD OF DIRECTORS VTA is an independent special district governed by its own Board of Directors. The VTA Board of Directors consists of elected governing board officials from the cities within Santa Clara County as well as the County of Santa Clara. Board members are appointed by the jurisdictions they represent, and all jurisdictions within the county have representation on the Board. The Board consists of 12 voting members, 6 alternates, and 3 ex-officio members, and membership is roughly based on population as follows: Group 1 (San Jose) Group 2 (Northwest) Group 3 (West Valley) 5 Members, 1 Alternate 1 Member, 1 Alternate from the Cities of Los Altos, Mountain View, Palo Alto, and the Town of Los Altos Hills 1 Member, 1 Alternate from the Cities of Campbell, Cupertino, Monte Sereno, Saratoga, and the Town of Los Gatos Group 4 (South County) 1 Member, 1 Alternate from the Cities of Gilroy and Morgan Hill Group 5 (Northeast) Group 6 (County of Santa Clara) Ex-Officio 2 Members, 1 Alternate from the Cities of Milpitas, Santa Clara, and Sunnyvale 2 Members, 1 Alternate from the Santa Clara County Board of Supervisors Santa Clara County's 3 representatives to the Metropolitan Transportation Commission (MTC): 1 Member representing the County of Santa Clara, 1 Member representing the Cities of Santa Clara County, and 1 Member representing the City of San Jose. (Note: MTC commissioners serve as an Ex-Officio Member only when not serving as a regular or alternate member of the VTA Board of Directors.) The Board of Directors generally meets on the first Thursday of each month. Perry Woodward, Chairperson Cindy Chavez, Vice Chairperson As of June 30, 2015 GROUP 1 City of San Jose GROUP 2 City of Los Altos Town of Los Altos Hills City of Mountain View City of Palo Alto Magdalena Carrasco Rose Herrera Ash Kalra Johnny Khamis Sam Liccardo* Raul Peralez, Alternate Jeannie Bruins, Alternate Rich Larsen GROUP 4 City of Gilroy City of Morgan Hill GROUP 5 City of Milpitas City of Santa Clara Citty of Sunnyvale GROUP 6 County of Santa Clara Perry Woodward Larry Carr, Alternate Jose Esteves Jamie Matthews, Alternate David Whittum Cindy Chavez Ken Yeager David Cortese,* Alternate GROUP 3 City of Campbell City of Cupertino Town of Los Gatos City of Monte Sereno City of Saratoga Jason Baker* Howard Miller, Alternate Ex-Officio** Metropolitan Transportation Commission (MTC) Commissioners Representing Santa Clara County, Cities of Santa Clara County, and City of San Jose None * These individuals serve on the MTC. ** There are no Ex-Officio Board Members for 2015 as the MTC representatives from Santa Clara County, Cities of Santa Clara County and City of San Jose are also VTA Board Members or Alternate VTA Board Members. 1-11
26 VTA BOARD OF DIRECTORS STAN DING COMMITTEES 1. Administration and Finance Committee (A & F) reviews and recommends policies pertaining to the general administration and financial management of VTA, including administrative policies and procedures, legislative affairs, human resources, financing, and fiscal issues Governance & Audit Committee reviews and recommends policy decisions required to fulfill the Board s oversight responsibilities for: (1) the integrity of VTA financial statements, (2) compliance with legal and regulatory requirements, and (3) assuring an effective system of internal management and financial controls. It reviews and recommends policy decisions pertaining to Board and organizational goal setting and prioritization, strategic initiative framework development, budget development, and Board and committee processes. It also oversees the activities of the auditor general, the internal audit function, and the public accounting firm that conducts VTA's financial audit. Congestion Management Program and Planning Committee (CMPP) reviews and recommends policies related to the Congestion Management Agency and the countywide transportation plan, including the integration of transportation, land-use and air-quality planning. Transit Planning and Operations Committee (TP & O) reviews and recommends policies related to transit planning, transit capital improvement projects, transit operations, and marketing. Silicon Valley Rapid Transit (SVRT) Program Working Committee reviews the ongoing program activities and recommends policy decisions pertaining to the program activities of the Silicon Valley Rapid Transit Project, which brings the BART regional heavy rail system 16 miles from Alameda County to the Santa Clara County cities of Milpitas, San Jose, and Santa Clara. VTA BOARD OF DIRECTORS ADVI SORY COMMITTEES Committee for Transit Accessibility (CTA) provides advice to the VTA Board and staff on bus and rail system accessibility issues, as well as on paratransit service. Many of these issues are related to VTA's efforts to comply with the federal Americans with Disabilities Act (ADA). It consists of 21 voting members comprised of individuals from the disabled community and representatives from human services agencies, as well as two ex-officio, non-voting members, one each representing VTA's paratransit broker and the VTA Board of Directors. Citizens Advisory Committee (CAC) / 2000 Measure A Citizens Watchdog Committee (CWC) is a 17 voting member committee representing the residents of Santa Clara County, as well as specified community stakeholder groups, including business and labor, with an interest in transportation. The CAC advises the Board and VTA administration on issues impacting the communities and organizations they represent. It also serves as the independent Citizens Watchdog Committee for the 2000 Measure A Transit Improvement Program, and as the 2008 Measure D ballot-specified advisory body that reviews and comments on VTA's comprehensive transit program as part of the countrywide transportation plan. Bicycle and Pedestrian Advisory Committee (BPAC) consists of 16 voting members comprised of one member appointed by each of the 15 cities within Santa Clara County and one member appointed by the County of Santa Clara. In addition, the Silicon Valley Bicycle Coalition appoints one ex-officio, non-voting representative. The BPAC advises the VTA Board of Directors on planning and funding issues related to bicycle and pedestrian mobility and access. The BPAC also serves as the bicycle and pedestrian advisory committee for the County of Santa Clara. 1-12
27 4. 5. Technical Advisory Committee (TAC) is a 16 voting member committee comprised of one staff member (usually a public works, planning, or community development director) from each of the 15 cities within the county and the County of Santa Clara. In addition, the California Department of Transportation (Caltrans), Metropolitan Transportation Commission (MTC), and Santa Clara Valley Water District appoint one non-voting representative each to the TAC. The TAC provides in-depth analysis, technical expertise and timely recommendations regarding transportation projects, programs, funding, and other policy matters, while giving voice to and reconciling local and regional perspectives. Policy Advisory Committee (PAC) is a 16 voting member committee comprised of one city council member from each of the 15 cities within Santa Clara County and one member from the Santa Clara County Board of Supervisors. The PAC ensures that all local jurisdictions have an opportunity to participate in the development of VTA's policies. VTA BOARD OF DIRECTORS POLICY ADVISORY BOARDS These Policy Advisory Boards (PAB) ensure the local jurisdictions affected by major transportation improvement projects are involved in the planning, design, and construction. Membership for each PAB varies. There are currently five active PABs: Diridon Station Joint Powers Policy Advisory Board Downtown East Valley Policy Advisory Board El Camino Real Rapid Transit Policy Advisory Board Silicon Valley Rapid Transit Corridor and BART Warm Springs Extension Policy Advisory Board Vasona Light Rail Project Policy Advisory Board 1-13
28 Santa Clara Valley Transportation Authority As of June 30, 2015 Board of Directors General Counsel General Counsel Auditor General (Contracted Function) Auditor General General Manager/CEO Chief of Staff Director of Government Affairs Director of Planning & Program Development Director of Engineering & Transportation Infrastructure Development Chief Financial Officer Chief Operating Officer Director of Business Services Director of System Safety & Security Principal Officials as of June 30, 2015 General Manager/CEO... Nuria I. Fernandez General Counsel...Robert Fabela Auditor General (Contracted Function)...McGladrey LLP Chief of Staff...Inez P. Evans Director of Government Affairs... James Lawson Director of Planning & Program Development...John Ristow Director of Engineering & Transportation Infrastructure Development...Carolyn Gonot Chief Financial Officer...Raj Srinath Chief Operating Officer... Michael Hursh Director of Business Services (Interim)...Inez P. Evans Director of System Safety & Security... Steve Keller 1-14
29 1-15
30 THIS PAGE IS INTENTIONALLY LEFT BLANK
31 SECTION 2 FINANCIAL SECTION INDEPENDENT AUDITOR S REPORT MANAGEMENT S DISCUSSION AND ANALYSIS (Required Supplementary Information) BASIC FINANCIAL STATEMENTS: Government-wide Financial Statements Statement of Net Position Statement of Activities Fund Financial Statements: Proprietary Funds: : Statement of Fund Net Position Statement of Revenues, Expenses and Changes in Fund Net Position Statement of Cash Flows Governmental Funds: Balance Sheet Statement of Revenues, Expenses and Changes in Fund Balances Fiduciary Funds: Statement of Fiduciary Net Position Statement of Changes in Fiduciary Net Position Retiree Trust Funds NOTES TO THE BASIC FINANCIAL STATEMENTS Required Supplementary Information (other than MD&A): Schedule of Changes in Net Pension Liability and Related Ratios ATU Pension Plan Schedule of Plan Contributions ATU Pension Plan Schedule of Changes in Net Pension Liability and Related Ratios CalPERS Plan Schedule of Plan Contributions CalPERS Plan Schedule of Funding Progress Retirees Other Post Employment Benefits Trust Budgetary Comparison Schedule Congestion Management Program Special Revenue Fund Note to Required Supplementary Information Budgetary Basis of Accounting Supplementary Information Combining and Individual Fund Statements and Schedules: Enterprise Funds: Comparative Schedule of Fund Net Position Comparative Schedule of Revenues, Expenses and Changes in Fund Net Position Comparative Schedule of Cash Flows Budgetary Comparison Schedule Fiduciary Funds: Combining Statement of Fiduciary Net Position ATU Pension, OPEB, and Medical Funds Combining Statement of Changes in Fiduciary Net Position ATU Pension, OPEB, and Medical Funds Combining Statement of Fiduciary Assets and Liabilities Agency Funds Combining Statement of Changes in Fiduciary Assets and Liabilities Agency Funds
32 THIS PAGE IS INTENTIONALLY LEFT BLANK
33 INDEPENDENT AUDITOR S REPORT
34 THIS PAGE IS INTENTIONALLY LEFT BLANK
35 The Board of Directors Santa Clara Valley Transportation Authority San Jose, California Report on the Financial Statements INDEPENDENT AUDITOR S REPORT We have audited the accompanying financial statements of the business-type activities, governmental activities, each major fund, and the aggregate remaining fund information of the Santa Clara Valley Transportation Authority (VTA), as of and for the year ended June 30, 2015, and the related notes to the financial statements, which collectively comprise the VTA's basic financial statements as listed in the table of contents. Management's Responsibility for the Financial Statements Management is responsible for the preparation and fair presentation of these financial statements in accordance with accounting principles generally accepted in the United States of America; this includes the design, implementation, and maintenance of internal control relevant to the preparation and fair presentation of financial statements that are free from material misstatement, whether due to fraud or error. Auditor's Responsibility Our responsibility is to express opinions on these financial statements based on our audit. We conducted our audit in accordance with auditing standards generally accepted in the United States of America and the standards applicable to financial audits contained in Government Auditing Standards issued by the Comptroller General of the United States. Those standards require that we plan and perform the audit to obtain reasonable assurance about whether the financial statements are free from material misstatement. An audit involves performing procedures to obtain audit evidence about the amounts and disclosures in the financial statements. The procedures selected depend on the auditor's judgment, including the assessment of the risks of material misstatement of the financial statements, whether due to fraud or error. In making those risk assessments, the auditor considers internal control relevant to the entity's preparation and fair presentation of the financial statements in order to design audit procedures that are appropriate in the circumstances, but not for the purpose of expressing an opinion on the effectiveness of the entity's internal control. Accordingly, we express no such opinion. An audit also includes evaluating the appropriateness of accounting policies used and the reasonableness of significant accounting estimates made by management, as well as evaluating the overall presentation of the financial statements. We believe that the audit evidence we have obtained is sufficient and appropriate to provide a basis for our audit opinions. 260 Sheridan Avenue, Suite 440, Palo Alto, CA Tel: Fax: F R E S N O L A G U N A P A L O A L T O P L E A S A N T O N R A N C H O C U C A M O N G A R I V E R S I D E S A C R A M E N T O 2-1
36 Opinions In our opinion, the financial statements referred to above present fairly, in all material respects, the respective financial position of the business-type activities, governmental activities, each major fund, and the aggregate remaining fund information of the VTA, as of June 30, 2015, and the respective changes in financial position and, where applicable, cash flows thereof for the year then ended in accordance with accounting principles generally accepted in the United States of America. Emphasis of Matter As described in Note 2-q to the financial statements, VTA adopted Governmental Accounting Standards Board (GASB) Statements No. 68, Accounting and Financial Reporting for Pensions an amendment of GASB Statement No. 27, and No. 71, Pension Transition for Contributions Made Subsequent to the Measurement Date an amendment of GASB Statement No. 68, effective July 1, Our opinion is not modified with respect to this matter. Other Matters Required Supplementary Information Accounting principles generally accepted in the United States of America require that the management's discussion and analysis, pension plans schedules of changes in net pension liability, pension plans schedules of employer contributions, budgetary comparison information, and schedule of funding progress for other postemployment benefits, as listed in the table of contents, be presented to supplement the basic financial statements. Such information, although not a part of the basic financial statements, is required by the Governmental Accounting Standards Board who considers it to be an essential part of financial reporting for placing the basic financial statements in an appropriate operational, economic, or historical context. We have applied certain limited procedures to the required supplementary information in accordance with auditing standards generally accepted in the United States of America, which consisted of inquiries of management about the methods of preparing the information and comparing the information for consistency with management's responses to our inquiries, the basic financial statements, and other knowledge we obtained during our audit of the basic financial statements. We do not express an opinion or provide any assurance on the information because the limited procedures do not provide us with sufficient evidence to express an opinion or provide any assurance. Other Information Our audit was conducted for the purpose of forming opinions on the financial statements that collectively comprise the VTA's basic financial statements. The enterprise and fiduciary fund supplementary information, the introductory and statistical sections are presented for purposes of additional analysis and are not a required part of the basic financial statements. The enterprise and fiduciary funds supplementary information as listed in the table of contents is the responsibility of management and was derived from and relates directly to the underlying accounting and other records used to prepare the basic financial statements. Such information has been subjected to the auditing procedures applied in the audit of the basic financial statements and certain additional procedures, including comparing and reconciling such information directly to the underlying accounting and other records used to prepare the basic financial statements or to the basic financial statements themselves, and other additional procedures in accordance with auditing standards generally accepted in the United States of America. In our opinion, the supplementary information is fairly stated, in all material respects, in relation to the basic financial statements as a whole for the year ended June 30,
37 We also previously audited, in accordance with auditing standards generally accepted in the United States of America, the basic financial statements of VTA as of and for the year ended June 30, 2014 (not presented herein), and have issued our report thereon dated October 20, 2014, which contained unmodified opinions on the respective financial statements of the business-type activities, the governmental activities, each major fund, and the aggregate remaining fund information. The enterprise fund supplementary information as of and for the year ended June 30, 2014 is presented for purposes of additional analysis and is not a required part of the basic financial statements. Such information is the responsibility of management and was derived from and relates directly to the underlying accounting and other records used to prepare the June 30, 2014 financial statements. The enterprise fund supplementary information as of and for the year ended June 30, 2014 have been subjected to the auditing procedures applied in the audit of the 2014 basic financial statements and certain additional procedures, including comparing and reconciling such information directly to the underlying accounting and other records used to prepare those financial statements or to those financial statements themselves, and other additional procedures in accordance with auditing standards generally accepted in the United States of America. In our opinion, the enterprise fund supplementary information is fairly stated in all material respects in relation to the basic financial statements as a whole for the year ended June 30, The introductory and statistical sections have not been subjected to the auditing procedures applied in the audit of the basic financial statements, and accordingly, we do not express an opinion or provide any assurance on them. Other Reporting Required by Government Auditing Standards In accordance with Government Auditing Standards, we have also issued our report dated October 25, 2015, on our consideration of the VTA's internal control over financial reporting and on our tests of its compliance with certain provisions of laws, regulations, contracts, and grant agreements and other matters. The purpose of that report is to describe the scope of our testing of internal control over financial reporting and compliance and the results of that testing, and not to provide an opinion on internal control over financial reporting or on compliance. That report is an integral part of an audit performed in accordance with Government Auditing Standards in considering the VTA's internal control over financial reporting and compliance. Palo Alto, California October 25,
38 THIS PAGE IS INTENTIONALLY LEFT BLANK
39 MANAGEMENT S DISCUSSION AND ANALYSIS (Required Supplementary Information)
40 THIS PAGE IS INTENTIONALLY LEFT BLANK
41 Management s Discussion and Analysis Management s Discussion and Analysis (MD&A) provides a narrative overview and analysis of the financial activities of VTA for FY To obtain a complete understanding of VTA s financial condition, this document should be read in conjunction with the accompanying Transmittal Letter and Basic Financial Statements. Financial Highlights As of June 30, 2015, VTA s net position amounted to approximately $4 billion. Of this amount, approximately $2.9 billion consisted of net investment in capital assets which is associated with VTA s capital program. Enterprise Funds operating revenues mainly from passenger fares were $43.1 million, an increase of $634 thousand or 1.5% from FY As of June 30, 2015, VTA had total outstanding bonds in the amount of $1.2 billion. In FY 2015, VTA issued $89.98 million (par value) of 2015 Series A and B Measure A Sales Tax bonds to refund the 2007 Measure A Series A bonds maturing on April 1, 2018 or later. Prior to the beginning net position adjustment resulting from the GASB 68 implementation, VTA Transit Fund net position increased $57.3 million to $2.1 billion. To comply with GASB 68, the beginning Net Position was restated to reflect a reduction of $189 million ($86.18 million for CalPERS, and $ million for ATU). This represents the amount owed by VTA to employees for benefits provided through a defined benefit pension plan that is attributed to employees past period of service. The three board-designated reserves; i.e., Transit Operating Reserve, Debt Reduction Reserve, and Sales Tax Stabilization Reserve were $62.9 million, $134.2 million, and $35 million, respectively. Any of these reserves may be reduced by the negative adjustment in the net position of $189 million resulting from the GASB 68 implementation as described earlier. VTA Measure A Fund net position in FY 2015 added $307.5 million to a total of $1.8 billion. This amount is restricted for the Measure A Transit Improvement Program per the Measure A Ballot. The 1976 Sales Tax revenue, reflecting an improvement in taxable sales activity in the County, increased $12.8 million, or 6.9% from FY 2014 level to $199.2 million in FY The 2000 Measure A Sales Tax revenue increased $13.4 million or 7.2% to $199.7 million in FY Federal, state, and local operating assistance were $13.9 million or 9.3 % lower in FY 2015 due to lesser Federal Maintenance Assistance Grant and State Transit Assistance revenues of $17.5 million and $1.4 million, respectively. This was offset in part by a net increase of $
42 million in the Transportation Development Act (TDA) revenue, and other operating assistance. Capital grants increased by $83.5 million from the FY 2014 level, due to an increase in grant-funded activities related to Silicon Valley Berryessa Extension (SVBX), traction power substation, procurement of vehicles, and Santa Clara/Alum Rock Bus Rapid Transit. As of June 30, 2015, the net position of Express Lanes and Joint Development funds amounted to $2 million and $28.4 million, respectively. The Express Lanes Fund recorded toll collection from SR 237/I-880 Express Connector. The Joint Development Fund reported property rental revenues and other proceeds generated from VTA s Joint Development Program. In FY 2015, BART operating fund s net position was $135 million. The BART Operating Sales Tax increased by $2.7 million or 6.14%, to $47.5 million in FY Overview of the Financial Statements VTA s basic financial statements have three components: 1) government-wide financial statements, 2) fund financial statements, and 3) notes to the basic financial statements. In addition to the basic financial statements, this report also includes required and other supplementary information. 1. Government-wide Financial Statements The Government-wide Financial Statements provide a top-level view of VTA s financial picture in a format resembling that of a privatesector company. The Statement of Net Position presents information on all of VTA s assets and liabilities including deferred inflow and outflow of resources, with the difference between the two reported as net position. Over time, an increase or decrease in net position may serve as an indicator of whether VTA s financial position is improving or deteriorating. The Statement of Activities presents information reflecting changes in VTA s net position during the most recent fiscal year. All changes in net position are reported as soon as the underlying event giving rise to the change occurs, regardless of the timing of related cash flows. Thus, revenues and expenses are reported in this statement for some items that will result in cash flows only in future fiscal periods (e.g., uncollected taxes and earned but unused vacation leave). The government-wide statements distinguish functions of VTA that are principally supported by sales tax and intergovernmental revenues. The VTA business-type activity is transit, 2-5
43 which includes bus/light rail operations, joint development, express lanes, BART operating, and capital project activity. Although the transit operation s primary function is intended to recover its costs through charges for services (business-type activities), the recovery is not significant. The governmental activities of VTA consist of congestion management and highway programs, which include planning, programming, and construction of highway projects. 2. Fund Financial Statements. A fund is a grouping of related accounts that is used to maintain control over resources that have been segregated for specific activities or objectives. VTA, like local and state governments, uses fund accounting to ensure and demonstrate compliance with finance-related legal requirements. All VTA funds can be divided into three categories: governmental funds, proprietary funds (i.e., enterprise funds and internal service funds), and fiduciary funds. Governmental funds - Governmental funds are used to account for essentially the same functions reported as governmental activities in the government-wide financial statements. However, unlike the government-wide financial statements, governmental fund financial statements focus on near-term inflows and outflows of spendable resources, as well as on balances of spendable resources available at the end of the fiscal year. Such information may be useful in evaluating a government s near-term financial requirements. VTA maintains three major governmental funds to account for the financial activities of VTA s Congestion Management Program, the Congestion Management and Highway Program, and the 1996 Measure B Highway Program. Proprietary funds - VTA maintains two types of proprietary funds: enterprise funds and internal service funds. The enterprise funds are used to report the same function presented as business-type activities in the government-wide financial statements. The internal service funds are used to account for activities that provide services to other funds, departments or to other governments on a cost-reimbursement basis. General Liability, Workers Compensation, and Compensated Absences are accounted for in the internal service funds. VTA uses the enterprise funds to account for its transit operation and capital activities, the 1996 Measure B Transit projects, the 2000 Measure A capital and operating activities, BART Operating, Joint Development Program, and Express Lanes Program. The enterprise funds and the internal service fund provide the same type of information as the government-wide financial statements within the business-type activities, only in more detail. 2-6
44 Fiduciary funds - Fiduciary funds are used to account for resources held for the benefit of parties outside VTA. Fiduciary funds are not reflected in the government-wide financial statements because the resources of those funds are not available to support VTA s own programs. The accounting used for fiduciary funds is much like that used for proprietary funds. The activities of the VTA Amalgamated Transit Union (ATU) Pension Plan, the ATU Spousal Medical and Retiree Vision and Dental Funds and the Retirees Other Post Employment Benefits (OPEB) Trust are reported in the retiree trust funds. Pension trust funds are used to account for assets held by VTA as a trustee for individuals and other organizations, such as ATU. Senate Bill 83 Vehicle Registration Fee (SB 83 VRF), the Bay Area Air Quality Management District (BAAQMD), and the 1996 Measure B Ancillary, which includes the Pavement Management and Bicycle programs, are accounted for in an agency fund, a fund that accounts for assets held solely in a custodial capacity. 3. Notes to the Financial Statements. The notes provide additional information that is essential to a full understanding of the data provided in the government-wide and fund financial statements. The notes to the financial statements can be found on pages 2-33 through 2-90 of this report. In addition to the basic financial statements and notes, Required Supplementary Information is presented as required by GASB. The required supplementary information shows Net Pension Liabilities and Pension Contributions pertaining to ATU and CalPERS, VTA s funding progress relative to Other Post Employment Benefits as well as the Congestion Management Program Budgetary Schedule. Required supplementary information can be found on pages 2-91 through 2-97 of this report. Other supplementary information such as the combining statements and other individual schedules found immediately following the required supplementary information present individual fund statements and schedules for the Enterprise and Fiduciary Funds. Other supplementary information can be found on pages 2-98 through of this report. 4. Government-wide Financial Analysis. The Government-Wide Statement of Net Position and the Statement of Activities report a $429.9 million increase in net position. The Business-Type activities were the major source of the growth as the Government-type activities net position decreased by $521 thousand. The increase in the business-type net 2-7
45 position was due primarily to sales tax receipts, TDA, and capital grants related to VTA s BART Silicon Valley Extension Project. The BART Operating sales tax total collection for the fiscal year was $47.5 million. During FY 2015, VTA enterprise funds acquired or built total capital assets of approximately $562.2 million (see Note 6). These capital assets were funded by a variety of sources such as federal and state grants, bond proceeds as well as local Measure A sales tax revenues. Santa Clara Valley Transportation Authority Condensed Schedule of Net Position FY 2015 and FY 2014 (In thousands) Business -Type Activity Government Activities Total Asset: Current and other Assets $ 1,495,830 $ 1,600,886 $ 20,918 $ 19,141 $ 1,516,748 $ 1,620,027 Capital assets, net 4,100,080 3,605, ,100,080 3,605,213 Total assets 5,595,910 5,206,099 20,918 19,141 5,616,828 5,225,240 Deferred outflow of resources 127,922 87, ,922 87,918 Liabilities: Current Liabilities 283, ,696 19,419 17, , ,817 Long-term liabilities outstanding 1,446,584 1,279, ,446,584 1,279,813 Total liabilities 1,729,766 1,556,509 19,419 17,121 1,749,185 1,573,630 Deferred inflow of resources 23,199 8, ,199 8,051 Net Position: Net Investment In Capital Assets 2,950,181 2,613, ,950,181 2,613,290 Restricted 822, ,608 1,499 2, , ,628 Unrestricted 197, , , ,559 Total Net Position $ 3,970,867 $ 3,729,457 $ 1,499 $ 2,020 $ 3,972,366 $ 3,731,477 The largest portion of VTA s net position (approximately 74%) reflects its investment in capital assets (e.g., land, buildings, infrastructure, machinery, and equipment), less any related outstanding debt used to acquire those assets. VTA uses these capital assets to provide services to its customers. Consequently, these assets are not available for future spending. Although VTA s investment in its capital assets is reported net of related debt, it should be noted that the resources needed to repay this debt must be provided from other sources since the capital assets themselves cannot reasonably be used to liquidate these liabilities. The restricted net position represents mainly the funds set aside for the Measure A and B Transit Improvement Programs, BART operating, debt service collateral with the bond trustees, and SWAP/Lease collateral. The unrestricted categories include funds set aside by Board policies and for funding of local share of capital projects; inventory and prepaid expenses; VTA transit operating reserve, debt reduction, express lanes and joint development program funds, sales tax stabilization, irrevocable transfer made to the OPEB Trust, and a deficit in compensated absences. The irrevocable transfer made to OPEB Trust, although 2-8
46 unrestricted, is earmarked for OPEB Trust Fund s future operating needs. The unrestricted net position is generally available for appropriation with Board approval. The details of net position categories are shown on page 2-40, Note 2(j). Governmental Accounting Standards Board (GASB) Statement 68, issued in June 2012 and effective for the year-end reporting June 30, 2015, requires public employees to comply with new accounting and professional reporting standards. Under this standard, employers that participate in a defined benefit pension plan, administered as a trust or equivalent arrangement, are required to record the net pension liability, pension contributions, and deferred outflows/inflows of resources related to pensions in their financial statements. To comply with the standard, VTA showed a reduction in the Beginning Net Position of $189 million and established a Net Pension Liability of $196.7 million. Net Pension Liability is the amount owed by VTA to its employees for benefits provided through a defined benefit pension plan. This consists of $74.2 million for CalPERS and $122.5 million for ATU. Business-Type Activities Despite the negative adjustment in the Beginning Net Position of $189 million due to the GASB 68 implementation, the total net position of $4 billion was up by $241 million in FY The current fiscal year reported favorable changes affecting net program expenses and general revenues. Net program expenses (total expenses minus program revenues) decreased by $112 million in FY 2015, mainly due to the decrease in total expenses and increase in program revenues of $42 million and $70 million, respectively. There was a $31.4 million decrease in capital expenses on behalf of, and contributions to other agencies as a result of a decline in capital activities relating to projects which generate assets that will ultimately be owned by other entities (such as Hayward Maintenance Center and Right-of-Way, as well as Mission/Warren/Freight Rail Relocation). Other decreases in expenses include $9 million drop in casualty/liability reserves; $11.9 million reduction in interest expense, and $5.4 million decline in other non-operating expenses. Actuarial report as of June 30, 2015 disclosed that the level of general liability provision as of FY 2015 was adequate. This was different from the previous year when increase adjustment to the general liability reserves was made based on actuarial estimate. The decrease in interest expense is a result of increased capitalized interest. Other non-operating expenses were less this year largely due to the completion of the project studies relating to new rail corridor and light rail operations analysis conducted by consultants. In the program revenue categories, charges for services were up $634 thousand due to increases in passenger fares collected ($736 thousand), as well as ACE shuttle and other operating revenues ($55 thousand). These increases were offset partially by a decrease in toll and advertising revenues of $157 thousand. The slight decrease in toll revenues of $65 2-9
47 thousand was attributed primarily to less solo-driver customers being tolled. This was a result of increased HOV only hours restriction when no solo drivers can use the express lanes. Furthermore, analysis shows that there was higher usage of clean air vehicles with eligible carpool decal using the lanes. Advertising revenues also experienced a decline due to expiration of contract in December 2014 and subsequent renegotiation of a lower minimum monthly guarantee by the vendor. Operating Assistance grants decreased by $13.9 million due to the decline in Federal Preventive Maintenance Assistance Grant, STA and Transportation for Clean Air Act Shuttle Program revenues of $17.5 million, $1.4 million, and 268 thousand, respectively. This was offset partially by an increase of $5.1 million in Transportation Development Act (TDA) and net increase of $162 thousand in other federal and state operating assistance grants relating to Job Access Reverse Commute, and Employment Training Panel. Capital grants grew $83.5 million as a result of increased activities mainly in the grant-funded Silicon Valley Berryessa Extension (SVBX), Traction Power Substation, procurement of buses, and the Alum Rock/ Santa Clara Bus Rapid Transit. The upswing in sales taxes of $28.9 million and other income of $13.7 million, offset by a slight decrease in investment income of $441 thousand, resulted in a $42 million improvement in total general revenues. Other income during the year included the proceeds from sale of Capitol Avenue Park-and-Ride lot and West San Carlos properties. The decrease in investment income was largely due to lower mark-to-market gains as a result of modestly higher interest rates. 2-10
48 SANTA CLARA VALLEY TRANSPORTATION AUTHORITY Condensed Schedule of Activities FY2015 and FY 2014 (In thousands) Business-Type Activities Governmental Activities Total Expenses: Operations, support services, and CMP program $ 407,618 $ 392,042 $ 8,071 $ 7,544 $ 415,689 $ 399,586 Caltrain subsidy & capital expense, on behalf of, and contribution to other agencies 69, , , ,243 Altamont Commuter Express subsidy 3,097 3, ,097 3,019 Interest expense 15,204 27, ,204 27,088 Other non-operating expenses 5,734 11, ,734 11,096 Claims and change in future claim estimates 8,881 17, ,881 17,947 Contribution to agencies Capital outlay on behalf of other agencies ,127 36,184 20,127 36,184 Total expenses 510, ,435 28,366 43, , ,231 Program revenues: Charges for services 43,054 42,420 2,526 2,519 45,580 44,939 Operating grants 134, ,669 2,096 2, , ,093 Capital grants 277, ,899 22,964 38, , ,888 Total program revenues 455, ,988 27,586 43, , ,920 Net program revenues (expenses) (55,098) (167,447) (780) 136 (55,878) (167,311) General revenues: Sales tax revenue 446, , , ,486 Investment income 9,420 9, ,429 9,884 Federal subsidy for Build America Bonds 8,715 8, ,715 8,755 Other Income 20,993 7, ,243 7,604 Total general revenues 485, , , ,729 Change in net position 430, ,980 (521) , ,418 Net position, beginning of year 3,729,457 3,453,477 2,020 1,582 3,731,477 3,455,059 Adjustment to Net Position due to GASB 68 Implementation (188,994) (188,994) - Net position, beginning of year (as restated) 3,540,463 3,453,477 2,020 1,582 3,542,483 3,455,059 Net position, end of year $ 3,970,867 $ 3,729,457 $ 1,499 $ 2,020 $ 3,972,366 $ 3,731,477 Governmental Activities The net position of governmental activities decreased $521 thousand, with an ending balance of $1.5 million; all in the Special Revenue Fund. Major elements of changes in fund balance were as follows: In the Congestion Management and Highway Program (CMHP) Capital Projects Funds, total grant revenues and capital expenditures were $22.8 million. In FY 2015, CMHP reported a decrease in grant revenues as a result of waning activities on projects which were completed (US101 Improvements I-280 to Yerba Buena, and US101 Widening Monterey Rd Rt129) or nearing completion (SR152/156 Improvements, I880/I280 Improvements-Stevens Creek, and US101/Capitol Expressway/Yerba Buena Interchange). Measure B Highway Program showed capital grant revenue of $203 thousand with the same amount of capital expenditures. The decrease in Measure B Highway Program activities is due to the program s winding down to completion. 2-11
49 In the Congestion Management Program (CMP) Special Revenue Fund, total revenue sources were $4.9 million, a decrease of $364 thousand from the $5.2 million in FY The decline is primarily due to the decrease in Surface Transportation Program grant. Total expenditures were $5.4 million, an increase of $595 thousand from FY This is due to expenses incurred relating to professional consultant costs for monitoring and conformance, training guidelines and deployment of iteam (a model for partnering with Caltrans with efforts focus on local assistance, project delivery, and traffic engineering/innovative transportation solutions). The change in fund balance was a decrease of $521 thousand. CMP projects were funded from member assessments and various federal, state, and local grants. Financial Analysis of VTA s Funds VTA uses funds to account for its various activities. This is to ensure and demonstrate compliance with finance-related legal requirements. Enterprise Funds VTA s enterprise funds report the activities of its transit operations, 1996 Measure B Transportation Improvement Program, 2000 Measure A Transit Improvement Program, BART Operating, Express Lanes Program, and the Joint Development Program. Comparison of Enterprise Funds Revenue FY 2015 and FY 2014 (In thousands) Change Favorable/(Unfavorable) Enterprise Funds Revenue Amount Percent Charges for services $ 43,054 $ 42,420 $ % Operating grants 134, ,669 (13,873) (9.33%) Capital grants 277, ,899 83, % 1976 half-cent sales tax 199, ,431 12, % 2000 Measure A half-cent sales tax 199, ,302 13, % BART Operating Sales Tax 47,500 44,753 2, % Investment earnings 9,118 9,555 (437) (4.57%) Federal subsidy for Build America Bonds 8,715 8,755 (40) (0.46%) Other income 20,371 6,835 13, % Total $ 939,849 $ 827,619 $ 112, % Charges for Services In the VTA Transit and Express Lanes funds, charges for services which were derived from bus farebox receipts, light rail ticket sales, toll fees, sale of monthly passes (including EcoPass, tokens, and convention passes), and advertising income were, $43 million in FY The $634 thousand or 1.5% rise from FY 2014 was primarily due to growth in eco pass and passenger fare revenues. The Levi s Stadium activities contributed to the increase in ridership. During FY 2015, toll revenues collected from the express lane were approximately 2-12
50 $1.2 million, a decrease of $65 thousand from FY The decrease in toll revenues was attributed to increased restriction in the HOV only hours and more usage of clean air vehicles with eligible carpool decal using the lane. Operating Grants VTA Transit Operating grants include Transportation Development Act (TDA), State Transit Assistance (STA), Federal Section 5307 Urbanized Formula Program Grants, state vehicle license fees (AB434), and Federal Section 5311 Formula Grants for Other than Urbanized Areas. In FY 2015, total operating grants decreased $14 million or 9.3% from the FY 2014 level. This is primarily due to the lesser Federal Preventive Maintenance Assistance grant revenue ($17.5 million) and State Transit Assistance (STA) revenue of $1.4 million. This was offset in part by an increase in Transportation Development (TDA) revenue of $5.1 million and net increase in other operating assistance grants of $162 thousand relating mainly to Employment Training Panel and Job Access Reverse Commute. TDA funds are derived from a quarter-cent sales tax levied by the state on taxable transactions occurring in the Santa Clara County. The Metropolitan Transportation Commission (MTC) retains a portion of these funds for administration and approximately 94.5% is returned to the source county (i.e. Santa Clara). After sales tax derived from local measures, TDA revenue is VTA s second largest source of revenue for operations. For FY 2015, the actual TDA receipts were $94.6 million. This is a $5.1 million or 5.7% rise over the prior fiscal year as the taxable sales activity in the county expanded in FY STA funds are derived from state sales tax on diesel fuel. STA apportionments are made to regional transportation planning agencies (Metropolitan Transportation Commission in the San Francisco Bay Area Region) based on a formula that allocates 50% of the funds according to population and 50% according to the transit operator s qualified revenues in the region from the prior fiscal year. In FY 2015, VTA received $13.9 million compared to the $15.3 million in FY The lesser STA apportionment received was attributed to the cut in diesel price during FY Federal Section 5307 allows eligible recipients to claim capital grant funds for maintenance costs and other projects such as routine bus replacements. Grant applicants may apply for FTA grants in an amount up to 80% of annual vehicle maintenance costs. The funds are reflected in the financial statements as Federal Operating Assistance. VTA considers a large portion of its bus maintenance costs for revenue and non-revenue vehicles as eligible expenses. For FY 2015, total grant revenues under this program were $24.1 million, a $17.5 million reduction from prior year. In the past, VTA s practice was to use 100% of available Section 5307 funds for preventive maintenance to offset loss of Sales Tax Revenues and STA funding. Starting in FY 2012, VTA 2-13
51 began to discontinue this practice with the goal of gradually reaching historic levels of preventive maintenance funding (35% for operating-related purposes and 65% in support of capital replacement). Capital Grants Capital grants include Federal Sections 5307 and 5309, other federal passthrough, various State transit-related capital grants, capital contribution from local agencies, and reimbursements received by VTA for capital expenses undertaken on behalf of other agencies. These were reported under the VTA Transit, Measure B Transit, and 2000 Measure A funds. Total capital grants increased $83.5 million or 43.1% to $277.4 million. This is primarily due to surge of activities in the federal and state funded Silicon Valley Berryessa Extension (SVBX), and Traction Power Substation, procurement of buses, and the Alum Rock/Santa Clara Bus Rapid Transit. The 1976 Half-Cent Sales Tax Revenues The 1976 Sales Tax is VTA s single largest source of revenue for operations under the VTA Transit Fund. The State Board of Equalization (SBOE) collects the 1976 Sales Tax for VTA. The 1976 Sales Tax Revenues pay the operating expenses and capital expenditures, where state or federal capital assistance programs require that the recipient of assistance contribute locally-derived revenues. For FY 2015, total sales tax revenues were $199.2 million, a $12.8 million or 6.9% growth compared to the prior fiscal year s sales tax revenue Measure A Half-Cent Sales Tax Revenues The 2000 Measure A Half-Cent Sales Tax is collected by the SBOE for VTA in the same manner as the 1976 Measure B Sales Tax. The 2000 Measure A Sales Tax revenues are reported in the 2000 Measure A fund and restricted for projects and operational activities included in the 2000 Measure A ballot. The collection of this tax occurred after the expiration of the 1996 Half-Cent Measure B Sales Tax on March 31, For FY 2015, total sales tax revenues were $199.7 million, a $13.4 million or 7.2% growth compared to the prior fiscal year s sales tax revenue. BART Operating In November 2008, county residents passed 1/8-cent sales tax to fund the operating and maintenance costs of the BART Extension. Collection of the tax which will be for a period not to exceed 30 years, took effect on July 1, In FY 2015, total sales tax revenue under the BART Operating Fund was $47.5 million. Investment Earnings The investment earnings are derived from three primary sources: short, mid, and long-term investment portfolios. Investment earnings were primarily recorded under 2000 Measure A Fund. Pursuant to VTA s adopted investment policy and California Government Code, 100% of surplus assets are invested in domestic fixed income investments. 2-14
52 The decrease in investment income of $437 thousand in FY 2015 was largely due to lower markto-market gains as a result of modestly higher interest rates. Federal Subsidy for Build America Bonds (BABs) In FY 2011, VTA issued 2010 Measure A Sales Tax Bonds which are taxable to the bond holders and recorded under 2000 Measure A Fund. The bonds were issued under the federal BABs program which provides a 35% interest cost subsidy to VTA. In compliance with Governmental Accounting Standards Board (GASB), VTA recognizes the BABs subsidy as an income item in its financial statements. In FY 2015, 2000 Measure A Fund reported BABs subsidy of $8.7 million, less by $40 thousand from the previous year as a result of the federal sequestration order. Other income - In FY 2015, total other income was $20 million. Of this amount, $17 million was derived from the sales proceeds of Capitol Avenue Park-and-Ride lot and West San Carlos properties. The remaining includes permit fees, property rental revenue, sale of plans, parking citations and other non-operating income. Comparison of Enterprise Funds Expenses FY 2015 and FY 2014 (In thousands) Change Favorable/(Unfavorable) Enterprise Funds Expenses Amount Percent Operations and support services $ 416,459 $ 409,406 $ (7,053) (1.72%) Caltrain and ACE subsidy 11,487 10,310 (1,177) (11.42%) Capital contributions to/or expenses on-behalf of other agencies 61,445 93,952 32, % Interest expense and other bond charges 15,204 27,088 11, % Other non-operating expenses 5,734 11,096 5, % Total $ 510,329 $ 551,852 $ 41, % Operations and Support Services Operations and support services expenses are incurred for bus and light rail operations, services and support programs in VTA Transit Fund. These expenses include labor, support services, contracted services, insurance, purchased transportation and other overhead costs related to bus and light rail operations. For FY 2015, operations and support services expense was $7 million or 1.7% higher compared to that of FY Labor and benefit costs increased by $6 million or 2.14% in FY 2015 as a result of an increase in labor rates and service hours (primarily a result of Levi s Stadium events and activities). Depreciation grew by $6.2 million as a result of depreciation on equipment, building improvement, and vehicles 2-15
53 which were capitalized in These increases were partly offset by a drop in the costs of materials and supplies, insurance, and leases and rentals. The reduction in general liability insurance was a result of actuarial determination that the level of general liability insurance provision in FY 2015 was adequate. This is different from the previous year when general liability insurance was increased by $6.4 million based on actuarial estimate. Caltrain and Altamont Commuter Express (ACE) Subsidy Caltrain is a commuter rail service, provided by the Peninsula Corridor Joint Powers Board (PCJPB), which consists of 3 member agencies: VTA, San Mateo County Transit District (SamTrans) and City and County of San Francisco. VTA contributes a portion of Caltrain operating and maintenance costs for commuter train service from Santa Clara County to San Francisco. Operating subsidy to Caltrain under the VTA Transit Fund was $8.4 million in FY 2015, $1.1 million higher than the $7.3 million contributed in FY The ACE is administered by and funded under a cooperative agreement among VTA, the Alameda County Congestion Management Agency and the San Joaquin Regional Rail Commission (SJRRC). VTA s subsidy to ACE commuter rail service under the VTA Transit Fund totaled $3.1 million in FY 2015; $78 thousand more than the contribution in FY The annual subsidy was based on the joint powers agreement with these agencies. Capital Contributions to/or Expenses on Behalf of Other Agencies As part of its capital program, VTA makes capital contribution to or undertakes capital projects jointly with other agencies. As the ownership of these capital assets does not rest with VTA, these capital expenses are reported as non-operating expenses on its financial statements. In FY 2015, total capital contributions to/or on behalf of other agencies were $61.4 million ($13.5 million in VTA Transit Fund, and $47.9 million in 2000 Measure A Fund), or $32.5 million lesser compared to the preceding year s level. This is largely due to decline in capital activities relating to projects such as Hayward Maintenance Center and Right-of-Way, as well as Mission/Warren/Freight Rail Relocation. Interest Expense and other Bond Charges Interest expense and other bond charges were $15.2 million; $11.9 million less compared to prior year, due to more interest expense being capitalized in FY 2015 in the 2000 Measure A Fund. As the 2010 taxable bonds were drawn down, the percentage of capitalized interest proportionately increased. Other Non-Operating Expenses Other non-operating expenses were $5.4 million less in FY 2015 largely due to completion of the project studies relating to new rail corridor and light rail operations analysis conducted by consultants. 2-16
 be reflected on the financial statements.")
, less the amount of the plan s fiduciary net position.")
54 Restatement of Net Position, Beginning of Year To comply with GASB 68, the beginning net position was reduced by $189 million. This consists of $86 million for CalPERS and $103 million for ATU. GASB 68 requires that the liability of employers to employees for defined benefit pension (net pension liability) be reflected on the financial statements. Net pension liability is measured as the portion of the present value of projected benefit pension payments to current active and inactive employees that is attributed to their past period of service (Total Pension Liability), less the amount of the plan s fiduciary net position. BART Operating Sales Tax 5% Revenue by Sources Enterprise Funds 2000 Measure A half-cent sales tax 21% Other income 2% Charges for services 5% Operating grants 14% Investment earnings 1% Caltrain and ACE subsidy 2% Expenses by Categories Enterprise Funds Capital contributions to/or expenses on-behalf of other agencies 12% Interest expense and other bond charges 3% Other nonoperating expenses 1% Capital grants 30% Federal subsidy for Build America Bonds 1% 1976 half-cent sales tax 21% Operations and support services 82% Internal Service Funds VTA maintains Internal Service Funds to account for the activities related to Workers Compensation, General Liability, and Compensated Absences programs. The costs of these activities are accounted for in these funds and then charged to other VTA funds. As of June 30, 2015, the total deficit for this fund category, entirely from the Compensated Absences program, was $7.2 million and is funded by VTA Transit s FY 2016 operating budget. Governmental Funds The focus of VTA s governmental funds is to provide information on near-term inflows, outflows, and balances of expendable resources. Such information is useful in assessing VTA s financing requirements. VTA maintains two governmental fund types Special Revenue Fund and Capital Projects Fund. Special Revenue Fund This fund accounts for the activities of the Congestion Management Program. The table that follows shows the details of changes in fund balance between the current and prior fiscal year: 2-17
55 Comparison of Special Revenue Fund FY 2015 and FY 2014 (In thousands) Change Favorable/(Unfavorable) Special Revenue Fund Amount Percent Member agency assessment revenue $ 2,407 $ 2,407 $ % Federal grant revenues 1,371 1,728 (357) (20.66%) State and local operating assistance grants % Other revenues (29) (10.39%) Administrative fees % Investment earnings 9 23 (14) (60.87%) Total Revenues 4,881 5,245 (364) (6.94%) Salaries and benefits (3,989) (4,355) % Professional services (1,225) (359) (866) (241.23%) Contribution to agencies (168) (68) (100) (147.06%) Material and Services (19) (25) % Miscellaneous (1) - (1) (100.00%) Total Expenses (5,402) (4,807) (595) (12.38%) Change in fund balances (521) 438 (959) (218.95%) Fund balances, beginning of year 2,020 1, % Fund balances, end of year $ 1,499 $ 2,020 $ (521) (25.79%) Total fund revenues under Congestion Management Program, which primarily include member assessments and grants, were $4.9 million in FY 2015, a decline of $364 thousand from the preceding year, due primarily to a decrease in Surface Transportation Program grant revenue. Total expenditures were $5.4 million, an increase of $595 thousand from FY This is due to expenses incurred relating to professional consultant costs for monitoring and conformance, training guidelines and deployment of iteam (a model for partnering with Caltrans with efforts focus on local assistance, project delivery, and traffic engineering/innovative transportation solutions). The ending fund balance was $1.5 million. Capital Projects Fund This fund accounts for VTA s two major capital programs Congestion Management and Highway Program and Measure B Highway Program. The following table shows the details of changes in fund balance between the current and prior fiscal years: 2-18
 (41.10%) VTA labor and overhead costs (2,837) (2,805) (32) (1.14%) Capital expenditures on behalf of other agencies (20,127) (36,184) 16,057 44.")

56 Comparison of Capital Project Funds FY 2015 and FY 2014 (In thousands) Change Favorable/(Unfavorable) Capital Projects Funds Amount Percent Federal, State, and local capital grant revenues $ 22,964 $ 38,989 $ (16,025) (41.10%) VTA labor and overhead costs (2,837) (2,805) (32) (1.14%) Capital expenditures on behalf of other agencies (20,127) (36,184) 16, % Change in fund balances $ - $ - $ - For FY 2015, total revenues were $23 million which represent the total amount expended on the projects and end up being billed to other governmental agencies. This consists of $22.8 million in Congestion Management and Highway Program, and $203 thousand in Measure B Highway Fund. The VTA labor and overhead costs primarily from Congestion Management and Highway Program were $32 thousand lower in FY Capital expenditures on behalf of other agencies were $20 million in FY 2015, a $16 million drop caused by lesser project activities, largely attributed to completed projects in FY 2015 (US101 Improvements I-280 to Yerba Buena, and US101 Widening Monterey Rd Rt129) or those nearing completion (SR152/156 Improvements, I880/I280 Improvements-Stevens Creek, and US101/Capitol Expressway/Yerba Buena Interchange). Revenue by Sources Governmental Funds Charges for services 9.1% Expenditures by Categories Governmental Funds Salaries and benefits 24.1% Other 8.4% Capital grants 82.5% Contribution to agencies 71.5% Materials, services, and others 4.4% 2-19
57 Capital Assets and Debt Administration Capital assets VTA s investment in capital assets is entirely in its business-type activity since VTA has no capital assets invested in the governmental activities. As of June 30, 2015 investment in capital assets net of accumulated depreciation, amounts to $4.1 billion. This investment in capital assets includes Land and Right-of-Way, Buildings, Improvements, Equipment & Furniture, Vehicles, the Caltrain-Gilroy Extension, Light Rail Tracks/Electrification, Leasehold Improvements, and Other Operating Equipment. During FY 2015, VTA expended $562.2 million on acquisition and construction of capital assets. Capital Assets (Net of Accumulated Depreciation) (In thousands) Land and Right-of-way $ 1,124,646 $ 1,126,373 Construction in Progress 2,177,750 1,728,066 Buildings & Improvements Equipment & Fixtures 265, ,841 Vehicles 333, ,708 Caltrain-Gilroy Extension 29,080 30,390 Light Rail Tracks/Electrification 156, ,373 Other Operating Equipment 7,705 10,689 Leasehold Improvements 6,331 6,773 Total $ 4,100,080 $ 3,605,213 Additional information on VTA s capital assets can be found in Note 6 Capital Assets. Long-term debt At year end, VTA has $1.2 billion bonds outstanding. For FY 2015, the total debt payment made was approximately $36.43 million while the total amortization of the bond premium was $6.1 million. VTA refunded the $100.7 million of 2007 Measure A bonds in FY Outstanding Debt Proprietary Funds (In thousands) Sr. Lien Sales Tax Revenue Bonds (1976 Tax) $ 199,054 $ 210,535 Sr. Lien Sales Tax Revenue Bonds (2000 Tax) 961, ,255 Total $ 1,160,765 $ 1,193,
58 More information on these transactions is included in Note 7g Long-Term Debt and Liabilities. For Senior Lien Sales Tax Revenue Bonds secured by 1976 sales tax revenues, VTA maintains uninsured ratings of AAA from Standard & Poor s (S&P), AA rating from Fitch, and a Aa2 rating from Moody s. For Sales Tax Revenue Bonds secured by 2000 Measure A sales tax revenues, VTA maintains uninsured ratings of Aa2 from Moody s and AA+ from S&P. Each of the two liens listed above has a separate series of 2007 bonds and each series has a bond insurance policy issued by Ambac Assurance Corporation insuring the timely payment of debt service. Since the credit ratings for Ambac Assurance Corporation are currently lower than ratings for the VTA s bond liens, 2007 bonds bear the rating of the respective sales tax bond liens as listed above. Additional information on VTA s long-term debt can be found in Note 7 Long-term Liabilities. Requests for Information Please address all questions or requests for additional information to the Fiscal Resources Division, Attention: Chief Financial Officer, Santa Clara Valley Transportation Authority, 3331 North First Street, Building C, Second Floor, San Jose, CA
59 BASIC FINANCIAL STATEMENTS
60 THIS PAGE IS INTENTIONALLY LEFT BLANK
61 SANTA CLARA VALLEY TRANSPORTATION AUTHORITY Statement of Net Position June 30, 2015 (In thousands) Business-Type Activities Governmental Activities Total ASSETS Cash and investments $ 352,764 $ - $ 352,764 Receivables, net 3,221-3,221 Internal balances 294 (294) - Due from other agencies 77,764-77,764 Inventories 22,070-22,070 Other current assets 2,399-2,399 Net OPEB asset 20,650-20,650 Restricted assets: Cash and investments 869,421 14, ,929 Due from other agencies 143,046 6, ,744 Other current assets Capital and other assets: Intangible Assets 3,966-3,966 Capital assets - nondepreciable 3,302,396-3,302,396 Capital assets - depreciable, net of accumulated depreciation 797, ,684 Total assets 5,595,910 20,918 5,616,828 DEFERRED OUTFLOW OF RESOURCES Accumulated decrease in fair value of hedging derivative, deferred amount on refunding, & deferred outflow of resources-pension related 127, ,922 LIABILITIES Accounts payable and accrued expenses 16,450-16,450 Deposits Accrued payroll and related liabilities 8,529-8,529 Bond interest and other fee payable Unearned revenues 3,201-3,201 Other accrued expenses Liabilities payable from restricted assets: Accounts payable and accrued expenses 104,543 3, ,321 Bond interest and other fee payable 11,683-11,683 Unearned revenues 8,010-8,010 Due to other agencies 77,677 15,641 93,318 Long-term liabilities: Derivative instruments 83,451-83,451 Due within one year 52,181-52,181 Due in more than one year 1,363,133-1,363,133 Total liabilities 1,729,766 19,419 1,749,185 DEFERRED INFLOW OF RESOURCES Deferred inflow-pension related 18,864-18,864 Deferred amount on refunding 4,335-4,335 23,199-23,199 NET POSITION Net investment in capital assets 2,950,181-2,950,181 Restricted: SWAP/lease collateral 77,381-77,381 Debt Service 49,009-49,009 Retention 8,700-8, Measure A projects 550, , Measure B projects 1,678-1,678 BART Operating 135, ,416 Congestion management program - 1,499 1,499 Unrestricted (Note 2j) 197, ,852 Total Net Position $ 3,970,867 $ 1,499 $ 3,972,366 See Accompanying Notes to Basic Financial Statements 2-22
62 SANTA CLARA VALLEY TRANSPORTATION AUTHORITY Statement of Activities For the Year ended June 30, 2015 (In thousands) Business-Type Governmental Activities Activities Total Transit Congestion Management EXPENSES: Operations, support services, and CMP program $ 407,618 $ 8,071 $ 415,689 Caltrain subsidy & capital expenses on behalf of, and contribution to other agencies 69,835-69,835 Altamont Commuter Express subsidy 3,097-3,097 Interest expense 15,204-15,204 Other non-operating expenses 5,734-5,734 Claims and change in future claim estimates 8,881-8,881 Contribution to agencies Capital outlay on behalf of other agencies - 20,127 20,127 Total expenses 510,369 28, ,735 PROGRAM REVENUES: Charges for services 43,054 2,526 45,580 Operating grants 134,796 2, ,892 Capital grants 277,421 22, ,385 Total program revenues 455,271 27, ,857 Net program revenues (expenses) (55,098) (780) (55,878) GENERAL REVENUES: Sales tax revenue 446, ,374 Investment income 9, ,429 Federal subsidy for Build America Bonds 8,715-8,715 Other income 20, ,243 Total general revenues 485, ,761 Change in Net Position 430,404 (521) 429,883 NET POSITION, BEGINNING OF YEAR 3,729,457 2,020 3,731,477 Adjustment due to GASB 68 implementation (188,994) - (188,994) NET POSITION, BEGINNING OF YEAR, (AS RESTATED) 3,540,463 2,020 3,542,483 NET POSITION, END OF YEAR $ 3,970,867 $ 1,499 $ 3,972,366 See Accompanying Notes to Basic Financial Statements 2-23
63 SANTA CLARA VALLEY TRANSPORTATION AUTHORITY Statement of Fund Net Position Proprietary Funds June 30, 2015 (In thousands) ASSETS Current assets: VTA Transit Measure B Transit Express Lanes Enterprise Funds 2000 Measure A BART Operating Joint Development Total Enterprise Cash and cash equivalents $ 3,090 $ - $ 297 $ - $ - $ 373 $ 3,760 $ 683 Investments 268,590-1, , ,234 50,087 Receivables, net 3, ,221 - Due from other agencies 77, ,764 - Inventories 22, ,070 - Other current assets 2, ,399 - Restricted assets: Cash and cash equivalents - 2,326-28,343 9,376-40,045 - Cash and cash equivalents with fiscal agent 1, , ,831 - Investments 30, , , ,545 - Due from other funds , ,373 - Due from other agencies ,954 9, ,046 - Other current assets TOTAL CURRENT ASSETS 409,196 2,351 2, , ,438 28,211 1,428,523 50,770 Noncurrent assets: Net OPEB Asset 20, ,650 - Intangible Assets , ,966 - Capital assets - Non-depreciable: Land and right of way 1,124, ,124,646 - Construction in progress 83, ,093, ,177,750 - Capital assets - Depreciable: Caltrain - Gilroy extension 43, ,072 - Buildings, improvements, furniture, and fixtures 548, ,139 - Vehicles 566, ,821 - Light-rail tracks and electrification 415, ,905 - Leasehold Improvements 9, ,686 - Others 47, ,156 - Less accumulated depreciation (833,095) (833,095) - Net capital assets 2,005, ,093, ,100,080 - TOTAL NONCURRENT ASSETS 2,026, ,097, ,124,696 - TOTAL ASSETS 2,435,639 3,157 2,103 2,948, ,438 28,450 5,553,219 50,770 DEFERRED OUTFLOW OF RESOURCES Accumulated decrease in fair value of hedging derivative 15, , ,451 - Deferred Amount on Refunding 10, , ,201 - Deferred outflow of resources-pension related 29, ,270 - TOTAL DEFERRED OUTFLOW OF RESOURCES 55, , ,922 - TOTAL ASSETS AND DEFERRED OUTFLOW OF RESOURCES 2,490,677 3,157 2,103 3,021, ,438 28,450 5,681,141 50,770 (continued on next page) Internal Service Fund See Accompanying Notes to Basic Financial Statements 2-24
64 SANTA CLARA VALLEY TRANSPORTATION AUTHORITY Statement of Fund Net Position (continued ) Proprietary Funds June 30, 2015 (In thousands) VTA Transit Measure B Transit Express Lanes Enterprise Funds 2000 Measure A BART Operating Joint Development Total Enterprise LIABILITIES Current liabilities: Current portion of long-term debt 14, ,310 - Accounts payable and accrued expenses 16, , Deposits Accrued payroll and related liabilities 8, ,529 - Bond interest and other fee payable Unearned revenues 3, ,201 - Other accrued expenses Claims liability ,259 Compensated absences ,647 Liabilities payable from restricted assets: Current portion of long-term debt , ,965 - Accounts payable and accrued expenses , ,543 - Bond interest and other fee payable , ,683 - Unearned revenues , ,010 - Due to other funds 8, ,079 - Due to other agencies 12, , ,677 - TOTAL CURRENT LIABILITIES 63, , ,262 10,999 Non-current liabilities: Long-term debt, excluding current portion 184, , ,119,490 - Derivative instruments 15, , ,451 - Claims liability ,053 Compensated absences ,891 Net Pension Liability 196, ,699 - TOTAL NON-CURRENT LIABILITIES 396, ,003, ,399,640 46,944 TOTAL LIABILITIES 460, ,218, ,679,902 57,943 DEFERRED INFLOW OF RESOURCES Deferred Inflow-Pension Related 18, ,864 - Deferred Amount on Refunding , ,335 - Total Deferred Inflow of Resources 18, , ,199 - TOTAL LIABILITIES AND DEFERRED INFLOW OF RESOURCES 479, ,223, ,703,101 57,943 NET POSITION Net Investment in Capital Assets 1,817, ,131, ,950,181 - Restricted: BART Operating , ,416 - SWAP/lease collateral 17, , ,381 - Debt service 1, , ,009 - Retention , , Measure A projects , , Measure B projects - 1, ,678 - Unrestricted (Note 2j) 174,907-1, , ,025 (7,173) TOTAL NET POSITION $ 2,011,521 $ 2,484 $ 1,991 $ 1,798,262 $ 135,416 $ 28,366 $ 3,978,040 $ (7,173) Reconciliation of the Statement of Fund Net Position to the Statement of Net Position: Net Position of Enterprise Funds $ 3,978,040 Net Position of Internal Service Fund, which benefits Business-type Activities (7,173) Net Position (Page 2-22) $ 3,970,867 Internal Service Fund See Accompanying Notes to Basic Financial Statements 2-25
65 SANTA CLARA VALLEY TRANSPORTATION AUTHORITY Statement of Revenues, Expenses and Changes in Fund Net Position Proprietary Funds For the Year ended June 30, 2015 (In thousands) Enterprise Funds VTA Transit Measure B Transit Express Lanes 2000 Measure A BART Operating Joint Development Total Internal Service Fund OPERATING REVENUES: Passenger fares $ 39,108 $ - $ - $ - $ - $ - $ 39,108 $ - Toll revenues collected - - 1, ,157 - Advertising and other 2, ,789 - Charges for services ,278 Total Operating Revenues 41,897-1, ,054 14,278 OPERATING EXPENSES: Labor cost 286, ,689 - Materials and supplies 32, ,407 - Services 27, ,883 - Utilities 8, ,316 - Casualty and liability 5, ,238 - Purchased transportation 19, ,241 - Leases and rentals Miscellaneous 1, ,735 5,437 Depreciation expense and amortization 65, ,677 - Costs allocated to capital and other programs (32,441) (32,441) - Claims and change in future claims estimates ,882 Total Operating Expense 415, ,459 14,319 Operating Income/(Loss) (373,487) (106) (96) (373,405) (41) NON-OPERATING REVENUES (EXPENSES): Sales tax revenue 199, ,653 47, ,374 - Measure A operating assistance 36, (36,850) Federal operating assistance and other grants 24, ,553 - Federal subsidy for Build America Bonds , ,715 - State and local operating assistance grants 110, ,243 - Caltrain subsidy (8,390) (8,390) - Capital expense on behalf of, and contribution to other agencies (13,547) - - (47,898) - - (61,445) - Altamont Commuter Express subsidy (3,097) (3,097) - Investment earnings 2, , , Interest expense (7,965) - - (7,239) - - (15,204) - Measure A repayment obligations 9, (9,688) Other income 19, , Other expense (2,514) - - (3,220) - - (5,734) - Total Non-operating Revenues (Expenses) 366, ,410 48,452 1, , Income (loss) before capital contributions and transfers (6,967) ,410 48,346 1, , Capital grants and contributions 49, , ,421 - Transfer in/(out) 15,147 (4) - (30,118) - 14, Change in net position 57, ,498 48,346 15, , Net Position, beginning of year 2,143,199 2,409 1,690 1,490,764 87,070 12,382 3,737,514 (8,057) Adjustment to Net Position due to GASB 68 Implementation (188,994) (188,994) - Net position, beginning of year, (as restated) 1,954,205 2,409 1,690 1,490,764 87,070 12,382 3,548,520 (8,057) Net Position, end of year $ 2,011,521 $ 2,484 $ 1,991 $ 1,798,262 $ 135,416 $ 28,366 $ 3,978,040 $ (7,173) Reconciliation of the Statement of Revenues, Expenses & Changes in Fund Net Position to the Statement of Activities: Change in net position of the Enterprise Funds $ 429,520 Change in net position of the Internal Service Fund, which benefits Business-type Activities 884 Change in net position of Business-type Activities (Page 2-23) $ 430,404 See Accompanying Notes to Basic Financial Statements 2-26
66 SANTA CLARA VALLEY TRANSPORTATION AUTHORITY Statement of Cash Flows Proprietary Funds For the Year Ended June 30, 2015 (In thousands) VTA Transit Measure B Transit Express Lanes 2000 Measure A BART Operating Joint Development Total Enterprise Funds Internal Service Fund CASH FLOWS FROM OPERATING ACTIVITIES Cash received from passenger fares $ 40,212 $ - $ - $ - $ - $ - $ 40,212 $ - Cash received from Tolls - - 1, ,186 - Cash received from advertising 2, ,973 - Cash paid to employees (255,977) - (872) (256,849) - Cash paid to suppliers (82,312) - (1) - (106) (96) (82,515) - Cash paid for purchased transportation (19,241) (19,241) - Cash received from contributions ,278 Payments made to beneficiaries (9,749) Payments made to third party contractors (4,146) Other non-operating receipts/(payments) 1, , , Net cash provided by/(used in) operating activities (312,799) ,698 (104) 335 (287,522) 728 CASH FLOWS FROM NONCAPITAL FINANCING ACTIVITIES Operating grants received 150, , ,034 - Sales tax received 197, , ,349 - Measure A operating assistance 36, (36,904) Measure A repayment obligations 9, (9,688) Caltrain subsidy (8,390) (8,390) - Altamont Commuter Express subsidy (3,097) (3,097) - Capital contributions to other agencies (13,547) - - (48,298) - - (61,845) - Transfer in 15, ,975 30,122 - Transfer out (30,118) - - (30,118) - Net cash provided by/(used in) non-capital financing activities 383, ,312 46,797 14, ,055 - CASH FLOWS FROM CAPITAL AND RELATED FINANCING ACTIVITIES Payment of long-term debt (10,705) - - (126,425) - - (137,130) - Proceeds from issuance of long-term debt , ,980 - Premium on issuance of long-term bonds , ,035 - Issuance and other cost Proceeds from sale of properties 16, ,732 - Advance (to)/from other governments (30,551) (1,715) - 9, (23,102) - Interest and other fees paid on long-term debt (7,742) - - (21,417) - - (29,159) - Acquisition and construction of capital assets (102,217) (72) - (459,101) - (15) (561,405) - Capital contribution from other governments 51, , ,775 - Net cash provided by/(used in) capital and related financing activities (82,929) (1,707) - (166,194) - (15) (250,845) - CASH FLOWS FROM INVESTING ACTIVITIES Proceeds from sale of investments 1,133,424-6,007 1,926, ,075 49,880 3,433, ,248 Purchase of investments (1,136,228) - (6,134) (2,022,251) (361,808) (64,969) (3,591,390) (176,254) Interest income received 1, ,832 1, , Net cash provided by/(used in) investment activities (900) - (109) (90,354) (42,730) (14,941) (149,034) (9,689) NET INCREASE/( DECREASE) IN CASH AND CASH EQUIVALENTS (12,657) (1,707) 239 (159,538) 3, (169,346) (8,961) CASH AND CASH EQUIVALENTS, BEGINNING OF YEAR 17,224 4, ,235 5, ,982 9,644 CASH AND CASH EQUIVALENTS, END OF YEAR $ 4,567 $ 2,326 $ 297 $ 95,697 $ 9,376 $ 373 $ 112,636 $ 683 See Accompanying Notes to Basic Financial Statements 2-27
67 SANTA CLARA VALLEY TRANSPORTATION AUTHORITY Statement of Cash Flows (Continued) Proprietary Funds For the Year Ended June 30, 2015 (In thousands) VTA Transit Measure B Transit Express Lanes 2000 Measure A BART Operating Joint Development Total Enterprise Funds RECONCILIATION OF OPERATING INCOME (LOSS) TO NET CASH PROVIDED BY/(USED IN) OPERATING ACTIVITIES: Operating income/(loss) $ (373,487) $ - $ 284 $ - $ (106) $ (96) $ (373,405) $ (41) Adjustments to reconcile operating income (loss) to net cash used in operating activities: Depreciation 65, ,677 - Changes in operating assets and liabilities: Other current assets (1,213) (1,213) - Receivables Due from other agencies Inventories (1,876) (1,876) - Accounts payable (2,982) (2,982) - Other accrued liabilities (1,804) (1,804) 424 Deposits from others Unearned revenue 1, ,229 - Other non operating receipts/(payments) 1, , , Net cash provided by/(used in) operating activities $ (312,799) $ - $ 348 $ 24,698 $ (104) $ 335 $ (287,522) $ 728 Reconciliation of cash and cash equivalents to the Statement of Fund Net Position: Unrestricted: Cash and cash equivalents $ 3,090 $ - $ 297 $ - $ - $ 373 $ 3,760 $ 683 Restricted: Cash and cash equivalents - 2,326-28,343 9,376-40,045 - Cash and cash equivalents with fiscal agent 1, , ,831 - $ 4,567 $ 2,326 $ 297 $ 95,697 $ 9,376 $ 373 $ 112,636 $ 683 NONCASH ACTIVITIES: Increase/(Decrease) in fair value of investments $ (98) $ - $ (1) $ (265) $ (51) $ (12) $ (427) $ (14) Noncash capital contributions 2, , ,354 - Amortization expense of Caltrain Access Fee (881) - - (881) - Total non-cash activities $ 2,321 $ - $ (1) $ 91,789 $ (51) $ (12) $ 94,046 $ (14) Internal Service Fund See Accompanying Notes to Basic Financial Statements 2-28
68 SANTA CLARA VALLEY TRANSPORTATION AUTHORITY Balance Sheet Governmental Funds June 30, 2015 (In thousands) Special Revenue Fund Congestion Management Program Capital Projects Funds Congestion Management Measure B & Highway Highway Program Program Total Governmental Funds ASSETS Restricted assets: Cash and cash equivalents $ 5 $ 6,736 $ 5,105 $ 11,846 Cash with fiscal agent - 1,705-1,705 Investments Due from other agencies 919 5,779-6,698 Other current asset TOTAL ASSETS $ 1,887 $ 14,220 $ 5,105 $ 21,212 LIABILITIES Liabilities payable from restricted assets: Accounts payable $ 91 $ 3,667 $ 20 $ 3,778 Due to other funds Due to other agencies ,265 5,079 15,641 TOTAL LIABILITIES ,220 5,105 19,713 FUND BALANCES Restricted for congestion management program 1, ,499 TOTAL LIABILITIES AND FUND BALANCES $ 1,887 $ 14,220 $ 5,105 $ 21,212 See Accompanying Notes to Basic Financial Statements 2-29
69 SANTA CLARA VALLEY TRANSPORTATION AUTHORITY Statement of Revenues, Expenditures and Changes in Fund Balances Governmental Funds For the Year ended June 30, 2015 (In thousands) Special Revenue Fund Capital Projects Funds Congestion Congestion Management Measure B Total Management & Highway Highway Governmental Program Program Program Funds REVENUES: Assessment to member agencies $ 2,407 $ - $ - $ 2,407 Federal grant revenues 1, ,371 Administrative fees State and local operating assistance grants Federal capital grant revenues - 3,770-3,770 State and local capital grant revenues - 18, ,194 Other revenues Investment earnings TOTAL REVENUES 4,881 22, ,845 EXPENDITURES: Congestion Management: VTA labor and overhead costs 3,989 2,837-6,826 Professional services 1, ,225 Material and services Miscellaneous Contribution to agencies Capital expenditures on behalf of other agencies - 19, ,127 TOTAL EXPENDITURES 5,402 22, ,366 NET CHANGE IN FUND BALANCES (521) - - (521) FUND BALANCES, BEGINNING OF YEAR 2, ,020 FUND BALANCES, END OF YEAR $ 1,499 $ - $ - $ 1,499 See Accompanying Notes to Basic Financial Statements 2-30
70 SANTA CLARA VALLEY TRANSPORTATION AUTHORITY Statement of Fiduciary Net Position Fiduciary Funds June 30, 2015 (In thousands) ATU Pension, ATU Medical & OPEB Trust Funds ASSETS Restricted assets: Cash and Cash Equivalents 1,734 Agency Funds $ $ 7,073 Corporate Bond 146,629 - U.S. Government Securities 22,488 - U.S. Agency notes 87,506 - Equity Based 115,852 - Mutual Funds 402,002 - Money Market Funds 9,191 - Investment Pool ,821 Receivables 2,200 - Prepaid Expenses Due from other agencies 12 - TOTAL ASSETS $ 788,105 $ 27,894 LIABILITIES Liabilities payable from restricted assets: - - Accounts payable $ 994 $ 188 Program payable - 27,706 TOTAL LIABILITIES 994 $ 27,894 NET POSITION Restricted for: ATU Pension benefits 489,194 Retiree medical benefits 275,427 ATU Retiree spousal medical benefits 13,219 ATU Retiree dental and vision benefits 9,271 TOTAL NET POSITION $ 787,111 See Accompanying Notes to Basic Financial Statements 2-31
71 SANTA CLARA VALLEY TRANSPORTATION AGENCY Statement of Changes in Fiduciary Net Position For the Year ended June 30, 2015 (In thousands) ATU Pension, ATU Medical & OPEB Trust Funds ADDITIONS Employer Contributions $ 39,547 Investment earnings: Investment income 39,029 Net depreciation in the fair value of investments (5,734) Investment expense (2,612) Net investment income 30,683 TOTAL ADDITIONS 70,230 DEDUCTIONS Benefit payments 45,695 Administrative expenses 410 TOTAL DEDUCTIONS 46,105 CHANGE IN NET POSITION 24,125 Net Position, Beginning of year 762,986 Net Position, End of year $ 787,111 See Accompanying Notes to Basic Financial Statements 2-32
72 THIS PAGE IS INTENTIONALLY LEFT BLANK
73 NOTES TO THE BASIC FINANCIAL STATEMENTS
74 THIS PAGE IS INTENTIONALLY LEFT BLANK
75 NOTE 1 THE FINANCIAL REPORTING ENTITY Santa Clara Valley Transportation Authority (VTA), which was established in 1972, develops, maintains, and operates a public mass transit system for the benefit of the residents of the County of Santa Clara (County), California (State). VTA s governing board consists of two members of the County Board of Supervisors, five City Council members from the City of San Jose, and five City Council members selected from among the remaining incorporated cities in the County. The accompanying basic financial statements also include the financial activities of the Santa Clara Valley Transportation Authority Amalgamated Transit Union (ATU) Pension Plan and the Other Post Employment Benefit Plan (the Plans) in the Trust Funds. The financial activities of the Plans are included in the basic financial statements because they exclusively serve the employees of VTA. Due to the fact that the Plans are fiscally dependent on VTA, they are considered trust funds by VTA. The Santa Clara Valley Transportation Authority Congestion Management Program (CMP) was created in 1990 in response to Proposition 111. The CMP is not legally separate from VTA. The CMP is responsible for the development and implementation of the Valley Transportation Plan (VTP), the long-range transportation and land use plan for the County, and for preparing and implementing the state-mandated CMP. It is also responsible for the programming and oversight of discretionary federal, state, and local funds, and for serving as the program manager for certain countywide grant funds, including the Transportation Fund for Clean Air (TFCA) and 1996 Measure B Transportation Improvement Program s (MBTIP) Ancillary Program. Annual contributions from 17 member agencies are based on a formula adopted by the VTA Board of Directors. The contribution formula considers each member agency s share of Proposition 111, state gas tax monies, as well as employment within the County. The CMP is included as a major governmental fund in the accompanying basic financial statements. NOTE 2 SUMMARY OF SIGNIFICANT ACCOUNTING POLICIES (a) Basis of Presentation Government-wide Financial Statements - The Statement of Net Position and Statement of Activities display information about VTA as a whole. These statements include the financial activities of the overall government, except for fiduciary activities. Eliminations have been made to minimize the double counting of internal activities. These statements distinguish between the business-type and governmental activities of VTA. Business-type activities, which normally rely to a significant extent 2-33
76 on fees charged to external parties, are reported separately from governmental activities, which normally are supported by taxes and inter-governmental revenues. The statement of activities presents a comparison between direct expenses and program revenues for the business-type and governmental activities. Direct expenses are those that are specifically associated with a program or function and; are, therefore, clearly identifiable to a particular function. Program revenues include: 1) charges paid by the recipients of goods or services offered by the programs and 2) grants and contributions that are restricted to meeting the operational or capital requirements of a particular program. Revenues that are not classified as program revenues, including all taxes, are presented as general revenues. Fund Financial Statements - The fund financial statements provide information about VTA s funds, including fiduciary funds. Separate statements for each fund category proprietary, governmental, and fiduciary are presented. The emphasis of fund financial statements is on the major governmental and the enterprise funds, each displayed in separate columns. The Proprietary Funds are used to account for activities for which a fee is charged to external or internal users for good or services. VTA reports the following Enterprise Funds: The VTA Transit Fund is used accounts for the transit operations of VTA. The primary sources of funding for transit operations are the TDA, one-half cent sales tax, farebox collections, and federal/state grants. The Measure B Transit Fund is used to account for sales tax collected from all the 1996 Measure B Transit Improvement Program. The Measure A Fund is used to account for the 2000 Measure A Transit Improvement Program funded through one-half cent sales tax as approved in an election by voters of County of Santa Clara requiring that sales tax revenues be expended on projects included in the scope of 2000 Measure A. The BART Operating Fund is used to account for the 1/8-cent sales tax approved in an election by voters of County of Santa Clara requiring that sales tax revenues be expended on operations, maintenance, improvement and future capital needs of the 16.1 mile VTA s BART Silicon Valley Extension. The Express Lanes Fund is used to account for operations of the 237/880 Express Lanes. The primary source of funding for the operations is toll revenues. The Joint Development Fund is used to set aside the proceeds generated from VTA s Joint Development Program, whose mission is to maximize the 2-34
77 economic value of the agency s real estate assets through site-appropriate development. The aggregated funds may be appropriated for the continued operation and development of VTA through formal action by the VTA Board of Directors. Additionally, VTA reports the following Internal Service Funds: The Internal Service Funds are used to account for compensated absences and risk management activities of VTA, which are managed through a combination of purchased insurance and self-insurance. The Governmental Funds are used to account for VTA s general governmental activities where the proceeds of specific revenue sources are legally restricted to expenditures for specific purposes and for the acquisition of capital assets or construction of major capital projects (other than those financed by the Enterprise Funds). The Congestion Management Program Special Revenue Fund is used to account for the congestion management planning, programming, and development services for Santa Clara County. Major sources of revenue for this fund are member agency assessments, and federal and state grants. The Congestion Management and Highway Program Capital Projects Fund is used to account for the acquisition of capital assets and construction of highway projects administered on behalf of State and other local governments (other than those accounted for in the Measure B Highway Program Capital Projects Fund). The Measure B Highway Program Capital Projects Fund is used to account for acquisition of capital assets or construction of Measure B Highway projects. The Fiduciary Funds are used to account for assets held by VTA as a trustee or as an agent for others and which assets cannot be used to support its own programs. This includes VTA s trust and agency funds as follows: VTA Trust Funds include retiree funds namely VTA/ATU Pension Plan, Other Post-Employment Benefits Trust (OPEB), and ATU Spousal Medical and Retiree Dental/Vision Plan. VTA Agency Funds include: Bay Area Air Quality Management District (BAAQMD) which accounts for the activities that relate to the Transportation Fund for Clean Air (TFCA) program. 2-35
78 Senate Bill (SB) 83 Vehicle Registration Fund (VRF) was established to administer the vehicle registration fee collected under SB 83 and approved by voters in Measure B Ancillary Program was established to administer the 1996 Measure B funds. (b) Basis of Accounting The government-wide, business-type funds, and fiduciary funds financial statements are reported using the accrual basis of accounting and the economic resources exchange measurement focus. Revenues are recorded when earned and expenses are recorded at the time liabilities are incurred, regardless of when the related cash flows take place. Non-exchange transactions in which VTA gives (or receives) value without directly receiving (or giving) equal value in exchange, include sales tax and grants. Revenues from sales tax are recognized when the underlying transactions take place. Therefore, recorded sales taxes include an accrual for amounts collected by the State Board of Equalization but not remitted to VTA at the end of the fiscal year. Revenues from grants are recognized in the fiscal year in which all eligibility requirements have been satisfied. Eligibility requirements for the purchase of rightof-way are considered met once the acquisition has settled. Fiduciary funds are also reported using accrual basis of accounting and the economic resources exchange measurement focus. Agency funds have no measurement focus. VTA s operating revenues are generated directly from its transit operations and consist principally of passenger fares. Operating expenses for the transit operations include all costs related to providing transit services. These costs include labor, fringe benefits, materials, supplies, services, utilities, leases and rentals, purchased transportation, and depreciation on capital assets. All other revenue and expenses not meeting these definitions are reported as non-operating revenues and expenses. Governmental funds are reported using the current financial resources measurement focus and the modified accrual basis of accounting. Under this method, revenues are recognized when measurable and available. Interest earnings, certain state and federal grants, and charges for services are accrued if their receipts occur within 180 days after the end of the accounting period so as to be both measurable and available. Expenditures are generally recorded when a liability is incurred, as under accrual accounting. (c) Cash and Investments VTA contracts with money management firms to manage most of its investment portfolio. VTA s investment program manager has oversight responsibility for 2-36
79 investments managed by these firms. The securities are held by a third-party custodial bank. Purchases and sales of securities are reflected on the trade date. Investment income is recognized as earned. The remaining cash balances in certain VTA funds are invested in the Local Agency Investment Fund (LAIF). Unless there are specific legal or contractual requirements for specific allocations, income earned or losses arising from investments are allocated on a monthly basis to the appropriate fund(s) based on their average daily balances. The balance available for withdrawal is based on the accounting records maintained by LAIF using an amortized cost basis. The fair value of VTA s investment in the pool is reported in the accompanying financial statements at amounts based on VTA s pro rata share of the fair value provided by LAIF for the entire LAIF portfolio (in relation to the amortized cost of that portfolio). Cash and cash equivalents include cash on hand, demand deposits, and short-term investments, which are readily convertible to known amounts of cash. Restricted and unrestricted cash, and cash equivalents and cash and investments with fiscal agents are considered to be cash and cash equivalents for purposes of the accompanying statement of cash flows. Access to cash and investments with fiscal agents is similar to that of a demand deposit account and, therefore, investments are considered to be cash equivalents. VTA has reported its investments at fair value based on quoted market information, from its fiscal agent for actively managed accounts and from management firms for commingled accounts. The fair value of VTA s investments commingled in LAIF state pool is based on VTA s cash positions in the commingled accounts as of the end of the fiscal year. (d) (e) Inventories Inventories are valued at cost using the weighted average method, which approximates market. They are charged to expense at the time individual items are withdrawn from inventory (consumption method). Inventory consists primarily of parts and supplies relating to the maintenance of transportation vehicles and facilities. Restricted Assets Restricted assets consist of monies and other resources, the use of which are legally restricted for capital and operating, as well as debt service and funds swap/lease collateral. 2-37
80 (f) (g) Bond Discounts, Premiums, and Bond Refunding Gains/Losses Bond refunding gains/losses for the government-wide statement of net position and the enterprise funds are reported as deferred inflow/outflow of resources and amortized on a straight line basis over a period equal to the term of the related bond. The discounts and premiums are amortized using the effective interest rate method. Government-wide and enterprise fund bond discounts and premiums are presented as a reduction and addition, respectively, of the face amount of bonds payable. Capital Assets It is VTA s policy that assets with a value of $5,000 or more, and a useful life beyond one year are capitalized, and included in the capital asset accounting system and depreciated over their estimated useful lives. Property, facilities, and equipment are stated at historical cost. Normal maintenance and repair costs are charged to operations as incurred. Improvements are capitalized and depreciated over the remaining useful lives of the related assets. Depreciation is computed using the straight-line method over estimated useful lives as follows: Asset being Depreciated Buildings, improvements, furniture, and fixtures Vehicles (excluding light-rail vehicles) Light-rail tracks, electrification, and light-rail vehicles Leasehold improvements Other operating equipment Useful Life 5 to 50 years 5 to 12 years 25 to 45 years 10 to 35 years 5 to 10 years Depreciation on such assets is included in the accompanying statement of activities and enterprise statement of revenues, expenses, and changes in fund net position. Interest is capitalized on construction in progress. Accordingly, interest that is capitalized is the total interest cost from the date of the borrowing until the specified asset is ready for its intended use. In the current year, VTA capitalized total interest expense and other bond charges of $36.3 million relating to the Measure A Transit Improvement Projects. (h) Vacation and Sick Leave Benefits It is the policy of VTA to permit employees to accumulate unused vacation and sick leave benefits up to the limit designated in the various collective bargaining agreements. As vacation and sick leave are used during the year, they are reported as expenses. Additionally, there is an amount charged each month to accrue the 2-38
81 estimated increase in unused vacation and sick leave. The balance reflecting the yearend value of unused vacation and sick leave is reported in the Internal Service Fund. (i) (j) Self-Insurance VTA retains $3 million in self-insurance for general liability and completely selfinsures workers compensation claims. Estimated losses on claims other than workers compensation claims are charged to expense in the period the loss is determinable. Estimated losses for workers compensation claims are charged to expense as a percentage of labor in each accounting period. The costs incurred for workers compensation and general liability (including estimates for claims incurred but not yet reported) are reported in the Internal Service Fund based on an actuarial determination of the present value of estimated future cash payments (see Notes 14 and 16). Net Position The government-wide and proprietary funds financial statements utilize a net position presentation. Net Position is categorized as net investment in capital assets, restricted, and unrestricted. Net Investment in Capital Assets - This category groups all capital assets, including infrastructure, into one component of net position. Accumulated depreciation and the outstanding balances of debt that are attributable to the acquisition, construction, or improvement of these assets reduce the balance in this category. The Statement of Fund Net Position as of June 30, 2015, on pages 2-24 and 2-25 reports that enterprise fund net position invested in capital assets (net of related debt) is $3 billion. Restricted Net Position - This category consists of debt service collateral, SWAP/lease collateral, amounts restricted for Measure B Transit, 2000 Measure A capital programs, BART Operating, retention, and Congestion Management Program. The Statement of Fund Net Position on pages 2-24 and 2-25 reports that enterprise fund restricted net position amount to $823 million as of June 30, 2015, of which $667 million and $135 million are restricted by enabling legislation for the 2000 Measure A Sales Tax and BART Operating Sales Tax programs, respectively. The 2000 Measure A half-cent sales tax was approved by Santa Clara County voters to fund certain transportation-related projects. The BART 2-39
82 Operating 1/8-cent sales tax is dedicated to the operation, maintenance, improvement, and future capital needs of the BART Silicon Valley Extension. When both restricted and unrestricted net positions are available, unrestricted resources are used only after the restricted resources are depleted. Unrestricted Net Position The remaining unrestricted net position, although not legally restricted, have been earmarked for future capital and operating needs, as well as for other purposes in accordance with Board directives. Unrestricted Net Position earmarks within proprietary funds consist of the following (in thousands): Proprietary Funds Joint Total Internal VTA Transit Fund Express Lanes Fund Development Fund Enterprise Funds Service Fund Local share of capital projects $ 86,672 $ - $ 1,761 $ 88,433 $ - Debt reduction 134, ,173 - Express Lane - 1,991-1,991 - Joint Development ,366 26,366 - Irrevocable transfer made to OPEB trust fund 20, ,650 - Sales Tax stabilization 35, ,000 - Operating reserve 62, ,937 - Inventory and prepaid expenses 24, ,469 - Workers' Compensation, General Liability & Compensated Absences (7,173) GASB 68 Adjustment* (188,994) - - (188,994) - Total $ 174,907 $ 1,991 $ 28,127 $ 205,025 $ (7,173) * Represents amount owed by VTA for benefits provided through a defined benefit pension plan. This consists of $86.18 million for CalPERS and $ million for ATU. (k) (l) Cost Allocated to Capital and Other Programs On the Statement of Revenues, Expenses, and Changes in Fund Net Position, the VTA Transit Fund reports $32.4 million as costs allocated to capital and other programs. This amount represents a credit for direct and indirect labor and associated fringe benefits, reproduction and mileage costs, and other costs that were capitalized as construction in progress. Estimates VTA s management has made a number of estimates and assumptions relating to the reporting of assets and liabilities, revenues, expenses, and the disclosure of contingent liabilities to prepare the basic financial statements in conformity with GAAP. Actual results could differ from those estimates. 2-40
83 (m) Fund Balance - Governmental Funds The Congestion Management Program Fund balance is classified as restricted. These are amounts that can be spent only for specific purposes because of enabling legislation or constraints that are externally imposed by creditors, grantors, contributors, or the laws or regulations of other governments. (n) (o) (p) Spending Order Policy When expenses are incurred for purposes for which both restricted and unrestricted fund balances are available, VTA considers restricted funds to have been spent first. Intangible Assets These refer to the $10 million payment made to Union Pacific Rail Road in January 2005 for Caltrain right-of-way access right. This asset is amortized for 15 years. Transfers In/(Out) The Transfers represent the interfund transactions between funds. During FY 2015, transfers consist mainly of the following: i. Transfer from VTA Transit to Joint Development Fund of $15 million resulting from the sale of West San Carlos and Capitol Avenue Park-and-Ride lot properties, and ii. Transfer of assets from 2000 Measure A Fund to VTA Transit Fund in the amount of $30.1 million for capitalized Bus Rapid Transit articulated buses. (q) (r) Restatement of Net Position, Beginning of Year The beginning of the year net position was restated as a result of GASB Statement No. 68 implementation. The Statement requires the liability of employers to employees for defined benefit pensions (net pension liability) to be measured as the portion of the present value of projected benefit pension payments to current active and inactive employees that is attributed to their past period of service (total pension liability), less the amount of the pension plans fiduciary net position. The total negative adjustment to beginning net position was $189 million ($86 million for CalPERS and $103 million for ATU). Future Accounting Pronouncements GASB Statements 74 and 75: Other Post-Employment Benefit (OPEB) Reporting In June 2015, GASB issued Statement Nos. 74 and 75: OPEB Reporting. These are revisions to Statements 43 and 45 that would make OPEB accounting and financial reporting consistent with the pension standards in Statements 67 and 68. The primary 2-41
84 objective is to establish a consistent set of standards for all post-employment benefits, providing more transparent reporting of the liability and more useful information about the liability and costs of benefits. GASB Statements 74 and 75 are effective for fiscal years ending June 30, 2017, and June 30, 2018, respectively. NOTE 3 - CASH AND INVESTMENTS Total cash and investments as of June 30, 2015, are reported in the accompanying basic financial statements as follows (in thousands): Enterprise Funds Internal Service Funds Governmental Funds Retiree Trust Funds Agency Funds Total Unrestricted: Cash and Cash Equivalents $ 3,760 $ 683 $ - $ - $ - $ 4,443 Investment 298,234 50, ,321 Total unrestricted 301,994 50, ,764 Restricted: Cash and Cash Equivalents 40,045-11,846 1,734 7,073 60,698 Cash and Cash Equivalents with Fiscal Agents 68,831-1, ,536 Investments 760, ,035 20,821 1,566,358 Total restricted 869,421-14, ,769 27,894 1,697,592 Total Cash and Investments $ 1,171,415 $ 50,770 $ 14,508 $ 785,769 $ 27,894 $ 2,050,356 As of June 30, 2015 total cash and investments among all funds consisted of the following (in thousands): Cash & Cash Equivalents $ 65,141 Cash & Cash Equivalents with Fiscal Agents 70,536 Investments 1,914,679 Total $ 2,050,356 Cash and Cash Equivalents VTA maintains checking accounts for its operations (including Joint Development, Express Lanes, and Internal Service Fund), the Congestion Management and Highway Programs (CM&HP), and the Measure B Transportation Improvement Program (Measure B account). 2-42
85 These checking accounts earn interest based on the bank s monthly sweep average repurchase agreement rate. At June 30, 2015, the carrying amounts of these cash balances are shown below (in thousands): Operation Account $ 50,974 CM&HP Account 6,736 Measure B Account 7,431 Total Deposits $ 65,141 Investments Government code requires that the primary objective of the trustee is to safeguard the principal, secondarily meet the liquidity needs of the depositors, and then achieve a reasonable return on the funds under the trustee s control. Furthermore, the intent of the government code is to minimize risk of loss on held investments from: 1. Interest rate risk 2. Credit risk 3. Custodial credit risk 4. Concentration of credit risk Specific restrictions of investment are noted below: VTA s investment policies (VTA Investment of Unrestricted and Restricted Funds, ATU, and Retirees Other Post-Employment Benefits Trust Fund) conform to state statutes, and provide written investment guidance regarding the types of investments that may be made and amounts, which may be invested in any one financial institution or amounts which may be invested in any one long-term instrument. VTA s permissible investments include U.S. treasury obligations, obligations of federal agencies and U.S. government sponsored enterprises, state of California obligations, local agency obligations, bonds issued by VTA except BABs, bankers acceptances, commercial paper, repurchase and reverse repurchase agreements, medium-term corporate notes, insured savings/money market accounts, negotiable certificates of deposit, mortgage and asset-back obligations, mutual funds, State of California s local agency agreements, and qualified structured investment. Asset allocations for ATU Pension Plan, ATU Spousal Medical Plan, and Retirees OPEB are all included investments in bonds, equity securities, agency notes, mutual and money market funds, investment pool, and cash. VTA s portfolio includes asset-backed securities, which are invested and managed by money managers and structured notes which are invested indirectly through LAIF. At June 30, 2015, investment in LAIF is $50 million. LAIF is voluntarily commingled within the state of California Pooled Money Investment Account (PMIA), whose balance at 2-43
86 June 30, 2015, was approximately $69.6 billion. If cash reserves of the state of California are exhausted, then the participation by the State s General Fund in the PMIA is zero. There is no correlation between the state s general fund cash reserves and VTA s funds on deposit in the LAIF. None of this amount was invested in derivative instruments. PMIA is not a Securities and Exchange Commission (SEC) registered pool, but it is required to invest in accordance with the guidelines established by the California Government Code. The average life of the investments in PMIA on June 30, 2015, was 239 days. The value of the pool shares in investment earnings are paid quarterly based on the average daily balance. Withdrawals from LAIF are completed on a dollar for dollar basis. Interest Rate Risk Interest rate risk is the risk that changes in market interest rates may adversely affect the fair value of an investment. The longer the maturity of an investment the greater the sensitivity of its fair value to changes in market interest rates. Of VTA s (Operation Funds and Plan Trust Funds) $1.91 billion in investments, 12.7% of the investments have a maturity of less than 1 year. Only 7.8% of the remainder has a maturity of more than 10 years. Per VTA s investment policy, long-term securities of more than five years are limited to 40% of the portfolio. Credit Risk Credit risk is the risk that an issuer of an investment will not fulfill its obligation to the holder of the investment. This is measured by the assignment of a rating by a nationally recognized statistical rating organization. Per its investment policy, VTA is permitted to hold investments in commercial paper rated A-1 by Standard & Poor s Corporation or P-1 by Moody s Commercial Paper Record. Negotiable certificate of deposit must have long-term ratings of A or better by two national rating agencies. Purchases of mortgage and asset-back obligations do not exceed 20% of VTA s portfolio. In addition, VTA is permitted to invest in the state s Local Agency Investment Fund, money market, and mutual funds that are non-rated. The table on page 2-46 shows the credit quality of VTA s investments as of June 30, Custodial Credit Risk Deposits For deposits, custodial credit risk is the risk that in the event of a bank failure, VTA s deposits may not be returned to it. In accordance with VTA s requirements, all of its deposits are either insured by the Federal Deposit Insurance Corporation (FDIC) or collateralized with pledged securities held in the trust department of the financial institutions. VTA does not have a specific policy with respect to deposits custodial credit risk. California Law requires banks and savings and loan institutions to pledge government securities with a market value of 110% of VTA s cash on deposit or first trust deed mortgage notes with a value of 150% of the deposit as collateral for these deposits. At June 30, 2015, VTA deposits were collateralized by securities held by the financial institutions, which was not in VTA s name. 2-44
87 Custodial Credit Risk Investments The custodial credit risk for investments is the risk that, in the event of a failure of the counterparty (e.g. broker-dealer) to a transaction, VTA may not be able to recover the value of its investments or collateral securities that are in the possession of another party. VTA s Investment Policy limits its exposure to custodial credit risk by requiring that all securities owned by VTA are kept in safekeeping with perfected interest in the name of VTA by a third-party bank trust department, acting as agent for VTA under the terms of a custody agreement executed between the bank and VTA. As of June 30, 2015, VTA did not participate in reverse securities lending that would result in any possible risk in this area. Concentration of Credit Risk Concentration of credit risk is the risk that the failure of any one issuer would place an undue financial burden on VTA. Investments issued by or explicitly guaranteed by the U.S. Government and investments in mutual funds, external investment pools, and other pooled investments are exempt from this requirement, as they are normally diversified themselves. VTA s investments in U.S. Government or Agency investments at year end are 35.9%. There is no limitation on amounts invested in these types of issues per VTA s policy. At June 30, 2015, VTA had $283 million representing 14.8% of VTA s portfolio invested in debt securities issued by the US Government Agencies. At June 30, 2015, VTA had $140.5 million, $73.4 million, and $25 million representing 7.3%, 3.8%, and 1.3% of VTA s portfolio invested in debt securities issued by the Federal National Mortgage Association (FNMA), Federal Home Loan Mortgage Corporation (FHLM), and Federal Farms Credits (FHR), respectively. Of the 27.1% of the portfolio invested in equities, no investment in a single issuer exceeds 5%. Certain investments, such as obligations that are backed by the full faith and credit of the United States Treasury are not subject to credit ratings. The following schedule indicates the maturity of investments at June 30, 2015 (in thousands): 2-45
88 Investment Type Maturity Less than 1 Year 2-5 Years 6-10 Years Over 10 Years Market Value Corporate Bonds - Commingled 1 $ 100,409 $ 388,182 $ 9,795 $ 510 $ 498,896 Corporate Bonds - Pension Plan 2,260 27,327 30,681 34,571 94,839 Corporate Bonds - OPEB Trust 1,681 17,075 19,427 13,607 51,790 US Government Agency Bonds Commingled 22, ,967 17, ,473 Pension Plan ,329 52,262 OPEB Trust ,001 32,043 35,243 US Treasury Commingled 36, ,669 28, ,114 Pension Plan 6,422 1, ,660 OPEB Trust 8,009 6, ,830 Subtotal 178, , , ,060 1,332,107 Money Market Funds - Commingled 5, ,528 Money Market Funds - Pension 6, ,151 Money Market Funds - OPEB Trust 3, ,040 Cash with Fiscal Agents - Commerical Paper/CD 67, ,319 TOTAL INVESTMENTS with Money Managers 260, , , ,060 1,414,145 LAIF 50, ,000 Subtotal $ 310,460 $ 913,331 $ 109,294 $ 131,060 1,464,145 Equity-Based Investments 517,853 Retention Fund at Escrow Agents (Deposits) 3,217 Cash Deposits 1 65,141 TOTAL $ 2,050,356 1 $387,000 in Retirees, ATU, ATU Spousal Medical Plan are included in these line items. The following is a summary of the credit quality distribution for investments with credit exposure as a percentage of total investments as rated by Standard and Poor's: Fair Value (In Thousands) Percentages of Portfolios Not Applicable $ 650, % US Treasuries 403, % B+ 2, % BB 5, % BB+ 8, % BBB 31, % BBB- 16, % BBB+ 59, % A-1 57, % A-1+ 67, % A 97, % A- 117, % A+ 49, % AA 28, % AA- 21, % AA+ 332, % AAA 100, % TOTAL $ 2,050, % 2-46
89 As of June 30, 2015, the Retiree Trust Funds restricted investments consisted of the following (in thousands): ATU Pension Plan Investments $ 487,537 ATU Spousal Medical Investments 22,490 Retirees Medical Trust 274,008 Total $ 784,035 NOTE 4 INTERFUND TRANSACTIONS The composition of interfund balances as of June 30, 2015, is as follows (in thousands): Due from other funds Due to other funds Amount VTA Transit Fund Congestion Management & Highway Program Fund $ VTA Transit Fund Measure B Highway Program Fund 6 1 Measure B Transit VTA Transit Fund 25 2 Measure A VTA Transit Fund 8,054 3 $ 8,373 1 Represents mainly labor cost 2 Drawdown made for Measure B to close out a grant 3 Represents preventive maintenance to be transferred to Measure A upon receipt, and true up of sales tax relating to Measure A operating assistance. NOTE 5 DUE FROM AND DUE TO OTHER AGENCIES Due from other agencies as of June 30, 2015, consisted of the following (in thousands): Business-Type Activities Fiduciary- Type Activities Governmental Activities Congestion DUE FROM OTHER AGENCIES Enterprise Funds Fiduciary Funds Congestion Management Program Management & Highway Program Total Federal Government $ 85,526 $ - $ - $ 1,910 $ 87,436 State Government 120, , ,288 Cities and other local agencies 14, ,796 $ 220,810 $ 12 $ 919 $ 5,779 $ 227,
90 Due from other agencies as of June 30, 2015, is reported in the accompanying generalpurpose financial statements as follows (in thousands): Business-Type Activities Fiduciary- Type Activities Governmental Activities Congestion ASSETS Enterprise Funds Fiduciary Funds Congestion Management Program Management & Highway Program Total Current Assets (Unrestricted) $ 77,764 $ - $ - $ - $ 77,764 Current Assets (Restricted) 143, , ,756 $ 220,810 $ 12 $ 919 $ 5,779 $ 227,520 Due to other agencies as of June 30, 2015, consisted of the following (in thousands): Business-Type Activities Governmental Activities DUE TO OTHER AGENCIES Enterprise Funds Congestion Management Program Congestion Management & Highway Program Measure B Highway Program Total State Government $ 56,580 $ - $ 29 $ - $ 56,609 County of Santa Clara 7, ,926 5,079 21,035 City of Milpitas City of San Jose City of Sunnyvale - - 1,739-1,739 City of Fremont Misc. - Outreach 4, ,289 SCVWD 8, ,999 Misc.- Others Total $ 77,677 $ 297 $ 10,265 $ 5,079 $ 93,318 Due to other agencies as of June 30, 2015, is reported in the accompanying basic financial statements as follows (in thousands): LIABILITIES Business-Type Activities Enterprise Funds Congestion Management Program Governmental Activities Congestion Management & Highway Program Measure B Highway Program Liabilities payable from restricted assets $ 77,677 $ 297 $ 10,265 $ 5,079 $ 93,318 Total 2-48
91 NOTE 6 CAPITAL ASSETS Capital asset changes for VTA s business-type activities for the year ended June 30, 2015, were as follows (in thousands): July 1, 2014 Additions Retirements Transfers June 30, 2015 Capital assets, not being depreciated Land and right-of-way $ 1,126,373 $ - $ (1,727) $ - $ 1,124,646 Construction in progress 1,728, ,859 - (112,175) 2,177,750 Total capital assets, not being depreciated 2,854, ,859 (1,727) (112,175) 3,302,396 Capital assets, being depreciated Caltrain - Gilroy extension 43, ,072 Buildings improvements, furniture and fixtures 516, (316) 31, ,139 Vehicles 488,229 - (605) 79, ,821 Light-rail tracks and electrification 415, ,905 Leasehold improvement 9, ,686 Other operating equipment 46, ,066 47,156 Total capital assets, being depreciated 1,519, (921) 112,175 1,630,779 Accumulated Depreciation Caltrain - Gilroy extension (12,682) (1,310) - - (13,992) Buildings, improvements, furniture and fixtures (258,343) (24,921) (282,948) Vehicles (214,521) (19,722) (233,638) Light-rail tracks and electrification (244,532) (15,179) - - (259,711) Leasehold improvement (2,913) (442) - - (3,355) Other operating equipment (35,373) (4,078) - - (39,451) Total accumulated depreciation (768,364) (65,652) (833,095) Total capital assets, being depreciated, net 750,774 (65,265) - 112, ,684 Total capital assets, net $ 3,605,213 $ 496,594 $ (1,727) $ - $ 4,100,080 Construction in Progress (CIP) includes capitalized costs and right-of-way acquisitions associated with the following projects as of June 30, 2015, (in thousands): Bus Program 74,123 Commuter Rail Program 2,072 Information Systems Technology 23,424 Light Rail - Way, Power & Signal 20,240 Light Rail Program 169,954 Operating Facilities & Equipment 14,023 Passenger Facilities 1,975 Revenue Vehicles & Equipment 20,702 Silicon Valley Rapid Transit 1,846,902 Vasona Corridor Projects 3,886 Others 449 Total 2,177,
92 Additional information regarding projects in progress as of June 30, 2015, is as follows (in thousands): Information Regarding Capital Projects: Costs Total Board approved capital budget $ 4,464,814 Capital expenses settling to CIP (2,177,750) Capital expenses settling to capital assets (112,175) Capital expenses settling to expense (745,119) Remaining capital budget available $ 1,429,770 Anticipated funding sources are as follows: Federal, state, and other local assistance $ 631,887 Local contributions 797,883 Total funding sources $ 1,429,770 VTA has outstanding commitments of about $741.3 million as of June 30, 2015, related to the above capital projects. NOTE 7 - LONG-TERM DEBT & LIABILITIES Long-term debt as of June 30, 2015, consisted of the following (in thousands): Secured by VTA's 1976 Measure A 1/2 Cent Sales Tax: 2007 Series A Refunding ($14,060 plus unamortized premium of $167) $ 14, Series A-C Refunding 146, Series A ($35,800 plus unamortized premium of $2,702) 38,502 Sales tax revenue bonds secured by VTA'S 2000 Measure A 1/2-cent sales tax: 2007 Series A ($6,210 plus unamortized premium of $103) 6, Series A-D Measure A Refunding 235, Series A-B Refunding ($601,175 plus unamortized premium of $8,333) 609, Series A-B Refunding ($89,980 plus unamortized premium of $20,035) 110,015 Total Long Term Debt 1,160,765 Less: Current portion of long-term debt (41,275) Long term debt, excluding current portion $ 1,119,490 (a) Sales Tax Revenue Bonds, secured by 1976 ½ cent sales tax revenues $26.3 million of 2007 Series A Sales Tax Revenue Refunding Bonds (2007 Bonds) were issued, at a true interest cost of 3.97%, to refund and completely pay off a portion of the 1997 Series A Sales Tax Revenue Bonds, maturing in series on each June 1st from Proceeds of the 2007 Bonds were deposited into an escrow account held by a Trustee, and were used to pay the principal and accrued 2-50
93 interest on the refunded bonds on the redemption date of June 1, 2007; therefore, there are no refunded bonds outstanding and no funds remaining in escrow. The 2007 Bonds have a final maturity of June 1, Bonds maturing on or before June 1, 2017, are not subject to redemption prior to their respective stated maturities. The 2007 Bonds maturing on or after June 1, 2018, are subject to redemption prior to their stated maturities any time on or after June 1, $168.6 million of 2008 Series A-C Sales Tax Revenue Refunding Bonds (2008 VTA Bonds) were issued to implement a current refunding and completely pay off the 2005 Sales Tax Revenue Refunding Bonds originally issued to finance the retirement of a portion of 2001 Bonds. There is no escrow fund nor are there 2005 Sales Tax Revenue Refunding Bonds outstanding. The 2008 VTA Bonds were issued as variable rate demand bonds and bear interest at a weekly rate, which is determined by the Remarketing Agent to be the rate necessary to remarket the 2008 VTA Bonds at par value. The maturities of the 2008 VTA Bonds extend to June 1, 2026, and are subject to optional and mandatory redemption and optional and mandatory tender for purchase before maturity. Concurrent with the issuance and sale of the 2008 VTA Bonds, VTA transferred interest rate swap agreements (originally entered into concurrent with the issuance of the retired 2005 Sales Tax Revenue Refunding Bonds). Pursuant to the terms of the swap agreements, VTA pays interest at a fixed rate of 3.145% to the counterparties to the swaps. In return, the counterparties pay VTA interest based on a formula (lower of 1 Month LIBOR 1 or a rate equal to the greater of 63.5% of 1 Month LIBOR, or 55.5% of 1 Month LIBOR plus 0.44%). The outstanding principal on the 2008 VTA Bonds is used as the basis on which the interest payments are calculated. Under certain circumstances, the agreements are subject to termination before maturity of the 2008 VTA Bonds. $47.5 million of 2011 Series A Sales Tax Revenue Refunding Bonds (2011 Bonds) were issued, at a true interest cost of 2.73%, to refund the 1998 Series A Sales Tax Revenue Bonds and the 2000 Series A Sales Tax Revenue Bonds (collectively, the Refunded Bonds ), maturing in series on each June 1st from The Refunded Bonds were variable rate bonds, which were issued through the California Transit Finance Authority. The bonds were refunded in order to reduce bank and interest rate risk associated with variable rate demand bonds. Proceeds of the 2011 Bonds were deposited into an escrow account held by a Trustee, and were used to pay the principal and accrued interest on the refunded bonds on the redemption date of 1 London Inter Bank Offering Rate (LIBOR) is a daily reference rate based on the interest rate at which banks offer to lend unsecured funds to other banks in the London wholesale (interbank) money market. 2-51
94 October 5, There are no 1998 Series A Sales Tax Revenue Bonds or 2000 Series A Sales Tax Revenue Bonds outstanding, and no funds remaining in escrow Series A Bonds maturing on or before June 1, 2021, are not subject to redemption prior to their respective stated maturities. The 2011 Bonds maturing on or after June 1, 2022, are subject to redemption prior to their stated maturities any time on or after June 1, (b) Sales Tax Revenue Bonds, secured by 2000 Measure A ½-cent sales tax revenues $120.1 million of 2007 Measure A Series A Sales Tax Revenue Refunding Bonds (2007 Measure A Bonds) were issued, at a true interest cost of 4.6%, to current refund Series F and G of the 2006 Measure A Sales Tax Revenue Bonds, none of which remain outstanding. Proceeds of the 2007 Measure A Bonds were deposited into an escrow account held by a Trustee, and were used to fully pay the principal and accrued interest on the refunded bonds on the redemption date of November 6, There is no open escrow or refunded bonds outstanding. Maturities for the 2007 Measure A Bonds originally extended to April 1, Measure A Bonds maturing on or before April 1, 2017, are not subject to redemption prior to their respective stated maturities Measure A Bonds maturing on or after April 1, 2018 are subject to redemption any time on or after April 1, In February 2015, VTA refunded the Measure A 2007 Series A bonds that mature on and after April 1, 2018, by issuing the 2015 Measure A Series A and Series B bonds (see below). Following the refunding and subsequent payment of the bonds maturing on April 1, 2015, the only 2007 Measure A bonds outstanding are those maturing on April 1, 2016 and $236.7 million of 2008 Series A-D Measure A Sales Tax Revenue Refunding Bonds (2008 Measure A Bonds) were issued to current refund Series A-D of the 2006 Measure A Sales Tax Revenue Bonds, none of which remain outstanding. The 2008 Measure A Bonds were issued as variable rate demand bonds and bear interest at a weekly rate, which is determined by the Remarketing Agent to be the rate necessary to remarket the 2008 Measure A Bonds at par value. The maturities of the 2008 Measure A Bonds extend to April 1, 2036, and are subject to optional and mandatory redemption and optional and mandatory tender for purchase before maturity. Concurrent with the issuance and sale of the 2008 Measure A Bonds, four interest rate swap agreements (originally entered into concurrent with the issuance of the Series A-D of the 2006 Measure A Sales Tax Revenue Bonds, none of which remain outstanding) were reassigned to the 2008 Measure A Bonds. Pursuant to the terms of the swap agreements, VTA pays interest at a fixed rate of 3.765% to the counterparties to the swaps. In return, the counterparties pay VTA a variable rate of 2-52
95 interest equal to 65% of three-month LIBOR. The outstanding principal is used as the basis on which the interest payments are calculated. Under certain circumstances, the agreements are subject to termination before maturity of the 2008 Measure A Bonds. $645.9 million of 2010 Measure A Bonds were issued, at a true interest cost of 3.54%, to fund certain Measure A transit capital improvement projects, most notably the BART Extension to Berryessa. The bonds were issued as a combination of taxable, Build America Bonds (Series A), and traditional tax-exempt bonds (Series B). VTA receives the federal subsidy of 35% on its interest cost for Build America Bonds. Both are fixed interest bonds. The bonds have a final maturity date of April 2, The 2010 Measure A Bonds, Series A (taxable Build America Bonds) are subject to mandatory and optional redemption provisions prior to their stated maturity dates. The 2010 Measure A Bonds Series B (tax-exempt) are not subject to redemption prior to their maturity date. $89.98 million of 2015 Measure A Series A-B were issued to current refund the 2007 Measure A Series A bonds maturing on April 1, 2018, or later. The refunding was done in order to take advantage of the lower interest cost of the refunding bonds. The refunding bonds were issued at an all-in true interest cost of 2.92%. The economic gain, which is calculated by comparing the present value of the original issue debt service to the present value of the refunded issue debt service, is $14.5 million. (c) Interest Rate Swaps VTA has seven interest rate swap agreements outstanding as of year-end. Three require that VTA pay fixed interest rates and receive variable interest at the lower of: 1)1 month LIBOR or, 2) a rate equal to f 63.5% of 1 month LIBOR or 55.5% of 1 month LIBOR plus 0.44%, whichever is greater. Four agreements require that VTA pay fixed interest rates and receive interest at 65% of three-month LIBOR. 2-53
96 (d) Summary The terms, fair values, and credit ratings of the outstanding swaps as of June 30, 2015 were as follows (dollars in thousands): Associated Bonds Current Notional Effective Date Fixed Rate Paid Variable Received Fair Value* Termination Date Counterparty Credit Rating CR 2008A $ 58,595 7/7/2005 ED 3.145% Cal-E VR $ (6,016) 6/1/2026 Aa2,AAA,NR 2008B 43,865 7/7/2005 ED 3.145% Cal-E VR (4,505) 6/1/2026 A1/A/A+ 2008C 43,865 7/7/2005 ED 3.145% Cal-E VR (4,505) 6/1/2026 A3,A-,A MA 2008A 85,875 8/10/ % 65% 3Mo LIBOR (24,910) 4/1/2036 A1/A/A+ MA 2008B 50,000 8/10/ % 65% 3Mo LIBOR (14,505) 4/1/2036 A1,A,A+ MA 2008C 50,000 8/10/ % 65% 3Mo LIBOR (14,505) 4/1/2036 Aa2,AAA,NR MA 2008D 50,000 8/10/ % 65% 3Mo LIBOR (14,505) 4/1/2036 A3,A-,A Total $ 382,200 $ (83,451) CR Moody s, Standard and Poor s and Fitch, respectively. ED Amended June 26, 2008 to reflect on-market fixed rate to be paid of 3.145%. VR Lower of 1 month LIBOR; or a rate equal to 63.5% of 1 month LIBOR or 55.5% of 1 month LIBOR plus 0.44%, whichever is greater. NR - No rating for Fitch *This represents the fair value of the base amount without the accrued interest of $2.5 million. Objective of the Swaps: The objective of the swaps is to hedge VTA s exposure to variable rate risk by synthetically fixing its interest costs at rates anticipated to be less than what VTA otherwise would have paid to issue fixed rate debt in the tax-exempt municipal bond market. Fair Values: At June 30, 2015, the swaps had a negative fair value of $83 million. This is because interest rates have declined since the execution of the swaps. Because the coupons on VTA s variable rate bonds adjust to changing interest rates, the bonds do not have corresponding fair value increases or decreases. The fair values of the interest rate swaps were estimated using the zero-coupon method. In accordance with GASB 53, the swaps were tested and determined to be effective derivative instruments using regression analysis and therefore were recorded as deferred outflow of resources in the assets section and as a derivative instrument liability in the liability section of the statement of net position. Credit Risks: It is VTA s policy to enter into derivative agreements only with highly rated counterparties. Although VTA s counterparties have experienced declines in their ratings since inception of the swaps, their S&P and Moody s ratings remain at investment grade levels. All payments due from counterparties continue to be made on time and are current as of June 30, When the swaps have a positive market value, VTA manages any credit risk (associated with termination of swaps) by requiring counterparties to post collateral based on certain events. VTA is entitled to 2-54
97 collateral in an amount up to 100% of the swap s fair value as identified in the following table: Swap Amount of Collateral Required Rating Threshold for Collateral Requirement CR Rating Threshold for 100% Collateral 2008A $ 5,000,000 A3/A- Baa1/BBB+ 2008B 7,000,000 A2/A A3/A- 2008C 5,000,000 A3/A- Baa1/BBB+ MA2008A 7,000,000 A2/A A3/A- MA2008B 7,000,000 A2/A A3/A- MA2008C 5,000,000 A3/A- Baa1/BBB+ MA2008D 5,000,000 A3/A- Baa1/BBB+ CR Moody s and Standard and Poor s, respectively Collateral generally consists of cash, U.S. Government securities, and U.S. Agency securities, held by a third party custodian. VTA enters into derivative agreements with multiple counterparties to limit concentration of credit risk. Currently, VTA has interest rate swaps with four different counterparties and no counterparty accounts for more than 35% of outstanding notional. VTA monitors counterparty credit risk on an ongoing basis. Basis Risk: The variable rate debt hedged by VTA's interest rate swaps are variable rate demand obligation (VRDO) bonds that are remarketed weekly. VTA is exposed to basis risk because the variable rate receipts from the swap are based on a rate or index other than the interest rates VTA pays on the VRDO bonds. VTA is exposed to basis risk to the extent that variable payments on the hedged obligations are not offset by the variable receipts from the swap. On June 30, 2015, the weighted average interest rates of the variable rate debt associated with the 2008 VTA VRDO Bonds was 0.055%. The interest rate for variable rate payments received from the counterparties pursuant to the swaps was 0.187%. The weighted average interest rates of the variable rate debt associated with the 2008 Measure A VRDO Bonds was 0.055%, and the interest rate for variable rate payments received from the counterparties pursuant to the swaps was 0.182%. Interest Rate Risk: Interest payments on VTA s variable rate debt will typically increase as interest rates increase. VTA believes it has significantly reduced interest rate risk by entering into pay-fixed, receive floating interest rate swaps. As interest rates increase, variable rate debt interest payments increase and net swap payments decrease. As interest rates decrease, variable rate debt interest payments decrease and net swap payments increase. 2-55
98 Rollover Risk: Rollover risk is the risk that a hedging derivative instrument associated with a hedgeable items does not extend to the maturity of that hedgeable item. All of VTA s swap agreements have maturities equal to the term of the bonds. Termination Risk: VTA has the right to terminate any swap at its option at any time. In addition, each counterparty may terminate a swap if VTA fails to perform under the terms of the contract. Furthermore, the terms of the agreements provide for Additional Termination Events in the event that the ratings of either the counterparty or the unenhanced long-term revenue bonds ratings of VTA are downgraded below Baa3 by Moody s or BBB- by S & P. An additional termination event, if it occurs, could cause a substantial termination payment to be owed by VTA. As of the end of the period, VTA s unenhanced long-term revenue bond rating is Aa2 by Moody s and AAA by S&P (AA+ for Measure A secured bonds). Tax Risk: As with other forms of variable rate exposure and the relationship between the taxable and tax-exempt markets, VTA is exposed to tax risk should tax-exempt interest rates on variable rate debt issued in conjunction with the swaps rise faster than taxable interest rates received by the swap counterparties, due particularly to reduced federal or state income tax rates, over the term of the swaps. Foreign Currency Risk: All of VTA s swaps are denominated in US Dollars and therefore VTA is not exposed to foreign currency risk. Commitments: All of the swap agreements contain provisions that require collateral posting by VTA at specific fair value amounts based on VTA s unenhanced long term credit ratings during times when the swaps are in liability positions (negative fair value). For swaps associated with long-term variable rate bonds secured by VTA s 1976 Sales Tax Revenues, VTA is required to post the full collateralization of the fair value of the transactions should VTA s credit rating fall below A or A2 for one of the swaps and below A- or A3 for two of the swaps. For the swaps associated with longterm variable rate bond secured by 2000 Measure A Sales Tax Revenues, VTA is required to post the full collateralization of the fair value of the transaction should the long-term unenhanced rating fall below A or A2 for two swaps, and below A- or A3 for the other two swaps. In addition, each credit support annex requires collateral posting at various rating levels and threshold amounts. Collateral generally consists of cash, U.S. Government securities and U.S. Agency securities. As of June 30, 2015, VTA had $8.7 million of cash collateral posted with one counterparty, related to a swap associated with the long-term variable rate bonds secured by 2000 Measure A Sales Tax Revenues. 2-56
99 (e) Swap Payments and Associated Debt Using rates as of June 30, 2015, debt service requirements on VTA s swap-related variable rate debt and net swap payments are as follows. As rates vary, variable rate bond interest payments and net swap payments will vary (dollars in thousands). Year Ending June 30 Principal Total Remarketing Interest Total Interest Rate Swap-Net Total Debt Service Total 2016 $ 10,165 $ 151 $ 12,754 $ 23, , ,452 23, , ,142 23, , ,823 23, , ,493 23, , , , , ,717 60, , , , , ,673 63,968 $ 382,200 $ 2,268 $ 191,580 $ 576,048 Long-Term Debt Obligation Summary Interest Rates on all outstanding fixed-rate obligations range from 3.00% %. Interest on the variable rate debt is reset weekly based upon market conditions. Projected principal and interest obligations as of June 30, 2015, are as follows: (Dollars in thousands) Principal Interest Total Year ending June 30: 2016 $ 41,275 $ 53,194 $ 94, ,980 51,458 94, ,875 49,599 94, ,485 47,646 94, ,580 45,529 94, , , , , , , ,880 49, , ,330 2,023 71,353 1,129,425 $ 613,872 $ 1,743,297 Unamortized bond premium 31,340 Total debt 1,160,765 Less current portion (41,275) Long-term portion of debt $ 1,119,
100 (f) Restrictions and Limitations There are a number of restrictions and limitations contained in the various bond indentures. VTA s management believes that VTA has complied with all applicable restrictions and limitations. (g) Long Term Liabilities (Dollars in thousands) July 1, 2014 Additions Reductions June 30, 2015 Amounts Due Within One Year Sales Tax Revenue Bonds Secured by 1976 ½ Cent Sales Tax 2007 Series A $ 16,420 $ - $ 2,360 $ 14,060 $ 2, Series A-C 150,895-4, ,325 10, Series A 39,575-3,775 35,800 2,130 Sales Tax Revenue Bonds Secured by 2000 Measure A ½ Cent Sales Tax 2007 Series A 109, ,545 6,210 3, Series A-D 235, , Series A-B 624,055-22, ,175 23, Series A-B - 89,980-89,980 - Total Outstanding Debt 1,176,575 89, ,130 1,129,425 41,275 Plus (less) premiums/discounts 17,216 20,274 6,150 31,340 - Outstanding Debt, Net 1,193, , ,280 1,160,765 41,275 Derivative Instruments Liability 76,104 8, ,451 - Claims Liability: General Liability 11,461 3,183 2,765 11,879 1,465 Worker s Compensation 18,506 7,098 7,171 18,433 1,794 Compensated Absences 27,459 4,036 3,957 27,538 7,647 Total Long-Term Liabilities $ 1,327,321 $ 132,710 $ 157,965 $ 1,302,066 $ 52,181 VTA s Transit Fund reports a deferred amount on refunding in the amount of $10.7 million related to the 2007 and 2008 bonds as a deferred outflow of resources. The Measure A Fund reflects deferred amounts on bond refunding related to the 2015 bond of $4.5 million as deferred outflow of resources, and 2007/2008 bonds of $4.3 million as deferred inflow of resources. NOTE 8 SALES TAX REVENUES Sales tax revenue represents sales tax receipts from the California State Board of Equalization, which, under voter-approved 1976 and 2000 Sales Tax Measures, collects a half-cent for each taxable sales dollar spent in the County. These amounts are available to fund both operations and capital expenses except that portion which is to be used to repay long-term debt as described in Note 7. In November 2008, county residents passed a 1/8- cent sales tax to fund the operating and maintenance costs of the BART Extension. The amount of the 1976 Sales Tax, 2000 Measure A Sales Tax, and BART Operating Sales Tax 2-58
101 recognized during FY 2015 was $199.2 million, $199.7 million, $47.5 million, respectively, totaling $446.4 million. NOTE 9 VTA PROGRAMS FUNDED THROUGH LOCAL SALES TAX MEASURES Measure B Transportation Improvement Program (MBTIP) In November 1996, the voters of Santa Clara County approved Measure A - an advisory measure listing program of transportation improvements for the County. Also approved on the same ballot, Measure B authorized the County Board of Supervisors to collect a nineyear half-cent sales tax for general County purposes. The tax was identified as a funding source for Measure A projects. Collection of the tax began in April 1997; however, use of the revenue was delayed pending the outcome of litigation challenging the legality of the sales tax. In August 1998, the California courts upheld the tax allowing the Measure A transportation program to move forward. Amendment 20 to the Master Agreement was executed in June 2007 to formalize the process for winding down the Measure B Program. That amendment included the following significant terms: VTA was paid the value of all approved 1996 Measure B project budgets, less the funds already paid by County to VTA, and the net remaining Measure B funding for Fund Swap Projects and Ancillary Programs administered by VTA. A lump sum amount of approximately $4.0 million was also paid to VTA by the County to cover the closeout effort associated with incomplete projects. In March 2010, $10.23 million was transferred to Congestion Management and Highway Program (CMHP) from the Measure B Highway and the Measure B Ancillary programs for $7.23 million and $3 million, respectively. The purpose is for CMHP to administer the landscaping phase of Measure B highway projects as well as the availment of various Measure B swap funds. During the current fiscal year, VTA paid approximately $363 thousand for current year costs for the program, as follows: $123 thousand of Measure B fund for transit projects in the Enterprise Fund; $203 thousand of Measure B fund for highway projects in the Measure B Highway Capital Projects Fund; and $37 thousand for the Ancillary Program (Measure B & Fund Swap Projects, Pavement and Bikeways). 2-59
102 2000 Measure A Program The Santa Clara Valley Transportation Authority 2000 Measure A Program (the Measure A Program) was created in response to the Measure A ballot approved by the voters of Santa Clara County on November 7, The Measure A Program is responsible for a number of key capital transit projects, including the connection of rapid transit to San Jose, increased bus and light rail service and providing for related operating expenses. The Measure A Program is funded by the half-cent sales tax to be imposed for a period of 30 years and took effect upon expiration of the current County of Santa Clara 1996 Measure B half-cent sales tax on March 31, The Measure A Program consists of those projects and increased operations included in the 2000 Measure A ballot, as noted below: Extend San Francisco Bay Area Rapid Transit District service ( BART ) from Fremont through Milpitas to Downtown San Jose and the Santa Clara Caltrain Station (the Silicon Valley Rapid Transit Project or SVRT ); Provide connections from the San Jose International Airport to BART, Caltrain commuter rail service ( Caltrain ) and VTA s light rail system; Extend VTA s light rail system from Downtown San Jose to the East Valley portion of Santa Clara County ( DTEV Extension ); Purchase low floor light rail vehicles to better serve the disabled, senior and other segments of the ridership; Improve Caltrain by extending the system s double track to Gilroy and providing funds to electrify the system; Increase Caltrain service; Construct a new Palo Alto Intermodal Transit Center; Improve bus service in major bus corridors; Upgrade the Altamont Commuter Express ( ACE ) services; Improve the Highway 17 express bus service; Connect Caltrain with the Dumbarton Rail Corridor (serving Alameda and San Mateo County); Purchase zero emission buses and construct service facilities; Provide funds to develop new light rail corridors; Fund operating and maintenance costs associated with increased bus, rail, and paratransit service. The following activities have either been completed or are in progress, funded by a combination of Tax revenues, state and federal grants, bond proceeds, and other locally obtained funds. To date, Measure A efforts have: Completed the purchase of low floor light rail vehicles; 2-60
103 Completed the Zero Emission Bus demonstration project; Reached a Project Agreement between the City of San Jose and VTA establishing a project description and vision statement for Bus Rapid Transit (BRT) in the Alum Rock/Santa Clara corridor. An environmental document was completed and approved in Major utility relocations are complete and construction is now expected to be completed in summer A contract to procure buses has been awarded in February 2013 and buses arrived in December Service is anticipated to begin in mid On the El Camino Real Transit Improvement Project, environmental scoping process took place in February and March A Project Study Report was approved by Caltrans in February Federal Transit Administration (FTA) has approved the project for Small Starts review to compete for a discretionary grant. Scheduled year of completion is On the Stevens Creek/West San Carlos Corridor, conceptual engineering has begun. The project has created early conceptual design for the corridor and is developing the traffic and ridership projections. Anticipated year of completion is 2019; Received $900 million grant commitment from the FTA for the Silicon Valley Berryessa Extension (SVBX) Project in March All major municipal and utility master agreements required for SVBX have been executed. Remaining third-party agreements are forecast to be in place to support SVBX implementation. Full Notice to Proceed was granted to Design-Build contractor in April To date, contractor has achieved Ready For Construction status on 97% of total drawings accomplishing the following: completed the Capitol Avenue North bridge roadway, Dixon Landing Road northern portion bridge deck and abutment, invert under the Montague Expressway bridge deck, and the Hostetter trench invert and walls of Hostetter Road. In December 2012, the project received $50 million in State Transportation Improvement Program (STIP) funding to help expand and improve BART s Hayward Maintenance complex to accommodate the operation of the Berryessa Extension. In August 2014 design-build contract was awarded for the parking garages in Milpitas and Berryessa stations. VTA issued the Notice-to-Proceed for this effort in October The contracts for the construction of Milpitas and Berryessa Stations campus areas and roadways were also awarded in February 2015 and August 2015, respectively; Received Traffic Congestion Relief Program (TCRP) funds as reimbursements for the preliminary engineering and construction phase on the VTA s BART Silicon Valley Extension. In August 2014, BART Silicon Valley Project received the final TCRP installment from the state in the amount of $39 million. This fund is designated for construction of a 10-mile segment of the project as of August 2015, remaining unexpended amount from this allocation is $29 million; Relocated and constructed utilities in the freight rail corridor in Fremont and Milpitas. The Berryessa Creek crossing, Abel Street Seismic Retrofit, and Railroad Relocation contracts are complete. On the Mission Boulevard/Warren Avenue Pacific Railroad 2-61
104 Relocation Construction contract, construction of the Union Pacific Rail Road (UPRR) Bridge on Mission Blvd. is complete. The Agua Fria, Toroges and Agua Caliente Creek Improvement contract is complete. The Kato Road Grade Separation contractor fully re-opened Kato Road in April Following the completion of the Joint Powers Agreement between Santa Clara County, Santa Clara Valley Water District (SCVWD), and VTA, the Montague Expressway Reconstruction Project is underway. Review of the final design was completed. Work is proceeding on the right-of-way acquisition. Construction is anticipated to begin in late 2015; Started preparation of Environmental Impact Statement for the Capitol Expressway Light Rail Extension to Eastridge. The construction of the pedestrian improvements (sidewalk and landscaping) was completed in the spring Construction of the new loop road and pump station is complete and was opened to traffic in July Construction of the new transit center is complete; Completed the Light Rail Systems Analysis, which was adopted by the VTA Board in May The Systems Analysis provides an evaluation of infrastructure and operational shortcomings of the existing light rail system as well as improvement plan for immediate action. The recommended projects for the Systems Analysis began planning, design and construction in fall Major track work for the Santa Clara Pocket Track was completed early August Construction of Mountain View Phase I (Double Track to SR 85) is substantially complete. Construction of Mountain View Phase II (Double Track from SR 85 to Whisman Station) has started in April A recommended operating plan is in progress. Service is expected to begin at the same time as the BART Silicon Valley Extension; Final design to incorporate stakeholder comments occurred in early 2015 for the Santa Clara Caltrain Station Pedestrian Underpass Extension. This project will provide an extended pedestrian tunnel under the UPRR tracks to Brokaw Road at the Santa Clara Station; Completed safety improvements to eight Joint Powers Board (JPB) crossings from Sunnyvale to Palo Alto for the Caltrain Safety Improvements JPB Crossings project. Design for approximately 15 crossings along the UPRR segment started in January Construction on the 15 crossings along the Union Pacific Railroad (UPRR) segment is currently on hold pending decision on budget; Completed construction for the Blossom Hill Pedestrian Grade Separation in September 2012; Completed Caltrain Service upgrades project for improvements to the Santa Clara Station in This allowed ACE trains to stop at the station. An agreement was reached which culminated in a Memorandum of Understanding of project stakeholders, including the CA High Speed Rail Agency, Metropolitan Transportation Commission, Peninsula Joint Powers Board, San Francisco, San Francisco County Transportation Authority, San Jose, Santa Clara Valley 2-62
105 Transportation Authority, San Mateo County Transportation Authority, and Transbay Joint Powers Authority. The Caltrain Modernization Program will electrify and upgrade the performance, operating efficiency, capacity, safety, and reliability of Caltrain s commuter rail service. The environmental process for the Peninsula Corridor Electrification project (electrification and new electric trains) was completed in January Request for Proposal for the Design-Build Electrification contract was released in February 2015 and award is expected to occur in late SVRT Measure B Sales Tax Ordinance At the election held on November 4, 2008, the voters passed VTA Measure B supporting the tax that would be dedicated to the operation, maintenance, improvement, and future capital needs of the 16.1 mile Santa Clara Bay Area Rapid Transit (BART) extension. The BART extension includes stations in Milpitas, San Jose, and Santa Clara, connecting with Caltrain from Gilroy to San Francisco. The project also includes facility addition to the existing Hayward Yard to provide fleet management operation for revenue vehicles. In December 2011, the Board of Directors approved the Measure B retail transaction and use tax ordinance which imposes a tax for the privilege of selling tangible personal property upon a retailer in Santa Clara County, at the rate of one-eighth of one percent on the gross receipts of the retailer. Collection of the tax took effect on July 1, 2012, for a period not to exceed 30 years. This ordinance is also known as the Santa Clara Valley Transportation Authority BART Operating and Maintenance Transactions and Use Tax Ordinance. NOTE 10 FEDERAL, STATE, AND LOCAL ASSISTANCE VTA is dependent upon the receipt of funds from several sources to meet its operating, maintenance, and capital requirements. The receipt of such revenues is controlled by federal, state, and local laws, the provisions of various grant contracts and regulatory approvals and, in some instances, is dependent on the availability of grant funds and the availability of local matching funds. A summary of the various governmental funding sources is as follows: (a) Federal Grants Federal grants are approved principally by the Federal Transit Administration (FTA) and the Federal Highway Administration (FHWA). Federal grants for the year ended June 30, 2015, are summarized as follows (in thousands): 2-63
106 Enterprise Funds Special Revenue Fund Capital Projects Funds Operating Assistance Grants: FTA Section 9 (49 USC 5307) $ 24,133 $ - $ - Job Access Reverse Commute Fed Grant Section Federal Technical Studies - 1,371 - Total Operating Assistance Grants 24,553 1,371 - Capital Grants: FTA Section 3 (49 USC 5309) 154, FTA Section 9 (49USC 5307) 11, Pass-through Capital Grants 585-3,770 Total Capital Grants 166,714-3,770 Total operating assistance & capital grants $ 191,267 $ 1,371 $ 3,770 FTA Section 9 operating assistance represents Bus and Rail preventive maintenance (49 USC 5307). Bus maintenance consists of North Maintenance, Chaboya Maintenance, and Cerone Maintenance, and Overhaul and Repair. These maintenance facilities are responsible for the timely and reliable preventive maintenance, running repair, heavy repair, engine rebuilding, other maintenance services, inspections, and servicing of various VTA s bus fleets. Rail maintenance consists of Light Rail Vehicle (LRV) maintenance and Way, Power, and Signal (WPS) maintenance. LRV maintenance is responsible for the timely and reliable preventive maintenance, inspections, repair, and servicing of VTA s LRV fleet. WPS maintenance is responsible for timely and reliable preventive maintenance of right of way, rail system power, track, signals, wayside communications, stations, transit center and bus stop facilities, related equipment park and ride lot maintenance, and evaluation of rail maintenance efficiency. The Job Access and Reverse Commute was authorized in Section 5316 of the Transportation Equity Act of the 21 st Century (TEA-21). This program, administered by the FTA, is intended to implement a variety of transportation services that will connect welfare recipients to employment and other job-related activities and opportunities. The Section 5311 program is the FTA non-urbanized area formula grant. The program provides funding for public transportation projects serving areas outside of an urban boundary with a population of 50,000 or less. Funds may be used for capital, operating, planning, or technical assistance projects. Federal technical studies grant under the Special Revenue Fund represents interagency agreement with the Metropolitan Transportation Commission (MTC) for 2-64
107 purpose of conducting specific planning and programming activities to assist MTC in meeting the requirements of federal legislation and related State and regional planning and programming policies and guidelines. FTA Section 3 capital grants represent the transit capital investment program (49 U.S.C. 5309), which provides capital assistance for three primary activities: New and replacement of buses and facilities Modernization of existing rail systems, and New fixed guideway systems In March 2012, FTA awarded VTA a full funding grant agreement (FFGA) for the SVBX project with a maximum federal New Starts financial contribution of $900 million. The FFGA is being amended through yearly increment of New Starts fund up to SVBX project scope includes 40 BART revenue vehicles, miles of double-track grade separated electrified third-rail guideway, traction power substations, high voltage substations, communication system, passenger drop-off facilities, parking spaces real estate acquisition, utility relocation, drainage improvements, environmental mitigation, financing, startup and revenue testing, and other elements necessary for project delivery. The project includes facility additions to the existing BART Hayward Yard located in the city of Hayward approximately 14 miles north of Santa Clara County for maintenance of BART vehicles. FTA Section 9 grants represent the federal program (49 U.S.C. 5307), which makes federal resources available to urbanized areas and to Governors for transit capital and operating assistance in urbanized areas and for transportation-related planning. This includes funds for transit enhancements and Congestion Mitigation and Air Quality (CMAQ) award for transportation projects or programs that will contribute to the attainment or maintenance of the National Ambient Air Quality Standards (NAAQS) for ozone and carbon monoxide. The pass-through federal grants under the Enterprise Funds include Demonstration Projects. These projects are provided as part of the transportation appropriation acts. Grade separations, widening and demolition of bridges, new crossing configurations are examples of projects funded with Demonstration funds. The pass-through federal grants under the Capital Project Funds represent fund agreements covering highway projects with various government agencies of the State of California. 2-65
108 (b) State and Local Grants and Assistance State and local grants for the year ended June 30, 2015, are summarized as follows (in thousands): Business-type Activities Governmental Activities Enterprise Funds Congestion Management Program Capital Projects Funds Operating assistance grants: Transportation Development Act $ 94,640 $ - $ - State Transit Assistance 13, State Operating Assistance Grants AB 434 1, Total operating assistance grants 110, Capital grants: Traffic Congestion Relief Program 27, PTA/STIP PTMISEA 66, Highway-Railroad Crossing Safety Account 1, Proposition 1B Fund 3, Congestion Management & Highway Program-State Grants ,765 Congestion Management & Highway Program-Measure A Swap Program - - 4,482 Other Local Grants: Measure B Highway Santa Clara County (Measure B Program) (Note 9) Santa Clara County (Fund Swap Program) (Note 9) Various cities, counties and others 10, Total Capital Grants 110,707-19,194 Total State and Local Grants $ 220,950 $ 725 $ 19,194 Transportation Development Act (TDA) funds represent VTA s share of the 0.25% sales tax collected in the County. State Transit Assistance (STA) represents funds received pursuant to the STA Program, whereby, a portion of diesel fuel sales tax revenues is appropriated by the State Legislature to the State Transportation Planning and Development Account for certain transit and energy-related purposes. STA funds are allocated throughout the state on the basis of population and operating revenues. State Operating Assistance Grants represent Employment Training Panel (ETP) program funds under the Enterprise Fund. These funds are available through AB 118 that are specifically geared to California businesses whose products or services include development of high performance/low emission vehicle technologies; mass transit fleet and clean vehicle conversion; or other sectors related to green technologies. Grant receipts from the California Department of Transportation for 2-66
109 project planning, programming and monitoring activities related to development of the Regional Transportation Improvement Program are reported under the Congestion Management Program. AB 434 fees represent funds received from the Bay Area Air Quality Management District. These funds are used for shuttle services and projects promoting clean air in the South Bay. The Traffic Congestion Relief Program (TCRP) provides funds for projects throughout the state of California to reduce traffic congestion, provide for safe and efficient movement of goods, and provide system connectivity. TCRP is being implemented by the California Transportation Commission (CTC), in consultation with State Department of Transportation. The purpose of the Public Transportation Account (PTA) is to provide a source of funds for transportation planning, mass transportation, Intercity Rail programs, and State Transportation Improvement Program (STIP) Transit projects, as provided by Section of the Public Utilities Code. Public Transportation Modernization Improvement and Service Enhancement Act (PTMISEA) Grant is part of a comprehensive voter-approved bond investment package designed to help advance important goals and policies, including protecting the environment and public health, conserving energy, reducing congestion, and providing alternative mobility and access choices for Californians. The projects approved by the Department of Transportation included building pedestrian overcrossings, updating ticket vending machines, constructing bus rapid transit, substation rehabilitation, and procurement of vehicles and equipment. PTMISEA activities are presented in the following table (in thousands): From Inception To 6/30/2015 June 30, 2015 Cumulative Balance Proceeds received $ 30,100 $ 180,268 Total expenditures paid and accrued (66,704) (130,532) Current year unused proceeds (36,604) 49,736 Prior year unused proceeds 90,222 - Total proceeds available 53,618 49,736 Interest earned 757 4,639 Total proceeds available plus interest earned $ 54,375 $ 54,375 Highway-Railroad Crossing Safety Account or HRCSA was created by Proposition 1B, the Highway Safety, Traffic Reduction, Air Quality, and Port Security Bond of 2006 to provide funding for the completion of high-priority grade separation and 2-67
110 railroad crossing safety improvements. The account is being administered by the California Transportation Commission (CTC). Proposition 1B Fund provides funding under the California Transit Security Grant Program and is administered by the California Emergency Management Agency. Capital Projects revenues consist of state and local grant revenues pertaining to Congestion Management and Highway Program (CMHP) of $19 million and Measure B Highway Program of $0.2 million. Of the CMHP state grants, $14 million represents Corridor Mobility Improvement Account (CMIA) grant. The scope of this grant includes performance improvements on the state highway system and major access routes to the state highway system. Santa Clara County Measure B Program includes both transit and highway projects. Santa Clara County Fund Swap is Measure B revenue received by VTA for local projects in exchange for federal and/or State grant funds. These funds are programmed for certain 1996 Measure B Transportation Improvement Program (MBTIP) Projects. Additional information on the 1996 MBTIP can be found in Note 9. Various cities, counties and other agencies contribute revenue to light rail projects and Silicon Valley Rapid Transit Corridor for project enhancements. NOTE 11 SANTA CLARA VALLEY TRANSPORTATION AUTHORITY AMALGAMATED TRANSIT UNION (ATU) PENSION PLAN (a) Plan Description and Benefits Provided All ATU represented employees are covered by the Plan, which is a noncontributory single-employer defined benefit pension plan. The Plan provides retirement, disability, and death benefits based on the employees years of service, age, and final compensation. Employees with 10 or more years of service are entitled to full annual pension benefits beginning at normal retirement age of 65. Employees with less than 10 years of service are entitled to an annual benefit at age 65 provided the Pension Board approves of such benefit. Employees with 15 or more years of service are entitled to full annual pension benefits beginning at age 55. The Plan permits early retirement if an employee becomes disabled after 10 or more years of service, and deferred vested retirement upon employee termination after 10 or more years of service, with benefits 2-68
111 payable at age 65. Employees may elect to receive their benefits in the form of a joint or survivor annuity. These benefit provisions and all other requirements are established by California statute and the labor agreement with the ATU. Benefit terms do not provide for annual cost-of-living adjustment subsequent to retirement date. Separately issued audited GAAP basis financial statements of the Plan are available and can be obtained from Santa Clara Valley Transportation Authority, Finance and Budget, 3331 North First Street, Building C-2, San Jose, California The membership of the Plan as of June 30, 2015, is as follows: No. of Membership Status Members Retirees and beneficiaries currently receiving benefits 1,282 Terminated vested members not yet receiving benefits 130 Active Members 1,541 Total 2,953 (b) Basis of Accounting Contributions are recognized as revenue when due, pursuant to formal commitments, as well as statutory or contractual requirements. Benefits (distributions to participants) and refunds of prior contributions are recognized when due and payable in accordance with the terms of the Plan. Investments are reported at fair value. Securities traded on a national or international exchange are valued at the last reported sales price on the last business day of the fiscal year at current exchange rates. Purchases and sales of securities are reflected on the trade date and investment income is recognized as earned. (c) Contribution Requirements For FY 2015, the actuarially-determined contribution was $25.6 million. As the Plan elected to use June 30, 2015 as its initial measurement date, employer contributions for FY 2015 will have an impact on the changes in the Plan s Net Position as of the end of the reporting year. The contribution requirements are established by the Board based on actuarially determined rate recommended by an independent actuary. The rate is the estimated amount necessary to finance the cost of the benefits earned by employees during the year with an additional amount to finance the unfunded accrued liability. 2-69
112 (d) Changes in Net Pension Liability The Plan s net pension liability was $122.5 million as of June 30, The following table shows the changes in net pension liability recognized over the measurement period. Total Pension Liability (a) Increase/(Decrease) Plan Fiduciary Net Position (b) Net Pension Liability/(Asset) (c) = (a) - (b) (Amounts in thousands) Balance at 6/30/14 $ 584,042 $ 481,226 $ 102,816 Changes Recognized for the Measurement Period: Service cost 13,468-13,468 Interest (includes interest on service cost) 43,069-43,069 Differences between expected and actual experience 4,517-4,517 Contributions from the Employer - 25,590 (25,590) Net investment income - 16,094 (16,094) Benefit Payments, including Refunds of Employee Contributions (33,418) (33,418) - Administrative expense - (301) 301 Net changes during FY ,636 7,965 19,671 Balance at 6/30/15 $ 611,678 $ 489,191 $ 122,487 Sensitivity of the Net Pension Liability to Change in Discount Rate: The table below shows the sensitivity of the Net Pension Liability to the discount rate. A one percent decrease in the discount rate increases the Total Pension Liability by approximately 11% and increases the Net Pension Liability by approximately 53%. A one percent increase in the discount rate decreases the Total Pension Liability and Net Pension Liability by approximately 9% and 45%, respectively. Discount rate -1% Discount rate Discount rate + 1% 6.50% 7.50% 8.50% (Amounts in thousands) Total Pension Liability $ 676,684 $ 611,678 $ 556,073 Plan Fiduciary Net Position 489, , ,191 Net Pension Liability $ 187,493 $ 122,487 $ 66,882 Plan Fiduciary Net Position as a Percentage of the Total Pension Liability 72.3% 80.0% 88.0% (e) Actuarial Assumptions The Total Pension Liability (TPL) at the beginning of the measurement year is measured as of a valuation date of January 1, 2014, and projected forward to the beginning of the measurement year of June 30, The TPL at the end of the measurement year, June 30, 2015, is measured as of a valuation date of January 1, 2015, and projected forward to June 30, There were no significant events during the projection period. 2-70
113 A summary of key assumptions is as follows: Actuarial cost method Entry Age - Normal Inflation: 3.25% Salary increases: 3.25% plus merit component based on years of service COLA increases: 0.00% Investment rate of return: 7.50%, net of investment expense Post-retirement Mortality: Sex distinct RP-2000 Combined Healthy Blue Collar Mortality, projected to 2025 using 50% of Scale BB, with ages set back one year for female members. The assumptions used reflect the results of an Experience Study covering the period January 1, 2007 through December 31, (f) Discount Rate The discount rate used to measure the Total Pension Liability was 7.5%. The projection of cash flows used to determine the discount rate assumed that VTA will continue to contribute to the Plan based on an actuarially determined contribution. In determining the long-term expected rate of return, both short-term and long-term market return expectations as well as the expected pension fund cashflows were taken into account. Such cashflows were developed assuming that both members and employers will make this required contribution on time and as scheduled in all future years. Using historical returns of all the funds asset classes, expected geometric returns were calculated over the short-term (first ten years) and the long-term (11-60 years) using a building-block approach. Based on those assumptions, the Plan s Fiduciary Net Position was projected to be available to make all projected future benefit payments of current Plan members until at least The present value of benefit payments not covered by the Plan s Fiduciary Net Position (i.e. payments occurring after 2077) was determined to be de minimis. Therefore, the long-term expected rate of return on Plan investments was applied to all periods of projected benefit payments to determine the Total Pension Liability. The following is the assumed asset allocation and expected rate of return for each major asset class: 2-71
114 Asset Class Long-Term Expected Real Rate of Return Domestic Equity 5.35% International Equity 5.25% Emerging Markets Equity 5.65% Domestic Fixed Income 0.75% Real-Estate 3.90% Cash 0.00% (g) (h) Plan s Fiduciary Net Position This refers to the fair or market value of assets. As of June 30, 2015, the Plan s Fiduciary Net Position amounts to $489 million. Detailed information about the pension plans, fiduciary position is available in a separate financial report. Pension Expense and Deferred Inflows or Outflows of Resources Related to Pensions For the measurement period ending June 30, 2015, VTA incurred pension expense of $25 million. This is the change in the Net Pension Liability plus the changes in deferred amounts plus employer contributions. Amount (In thousands) Service cost $ 13,468 Administrative expenses 301 Interest cost on total pension liability 43,069 Projected return on plan investments (36,770) Recognized differences between expected and actual experience 753 Recognized differences between projected and actual earnings 4,135 Pension expense $ 24,956 As of June 30, 2015, VTA s deferred outflows related to the ATU pensions are as follows: Deferred Outflows of Resources (In thousands) Differences between expected and actual experience $ 3,765 Net difference between projected and actual earnings on pension plan investments 16,540 Total $ 20,
115 Amounts reported as deferred outflows of resources will be recognized in pension expense as follows, in thousands: Fiscal Year Measurement Period Fiscal Years June 30, Deferred Outflows of Resources $ 4, , , , Thereafter Thereafter - NOTE 12 PUBLIC EMPLOYEES RETIREMENT PLAN (a) Plan Description and Benefits Provided All eligible non-atu employees of VTA participate in the California Public Employees' Retirement System (CalPERS). Prior to separation from the County on January 1, 1995, all eligible VTA employees participated in CalPERS through the County. As a result of the separation from the County, certain administrative employees were transferred from the County to VTA. All of those administrative employees service credits earned during the period they worked for the County s transportation agency were transferred to VTA s CalPERS account. The transfer of related assets at a market value totaling approximately $52.3 million was completed by CalPERS in FY CalPERS is an agent multiple-employer defined benefit retirement plan that acts as a common investment and administrative agent for various local and state governmental agencies within California. CalPERS provides retirement, disability, and death benefits based on the employees years of service, age, and final compensation. Employees vest after five years of service and may receive retirement benefits at age 50. These benefit provisions and all other requirements are established by state statute and VTA resolutions. VTA contracts with CalPERS to administer these benefits. The normal retirement benefit is equal to 2% of final compensation for each year of credited services. Based on census data, VTA membership in the Plan as of June 30, 2013 (date of the most recent actuarial valuation), is as follows: 2-73
116 Retirees and beneficiaries receiving benefits 499 Terminated and vested members not yet receiving benefits 341 Active members 604 Total 1,444 Copies of the CalPERS annual financial report may be obtained from the CalPERS Executive Office, 400 P Street, Sacramento, CA (b) Summary of Significant Accounting Policies For purposes of measuring the net pension liability, the following have been determined on the same basis as they are reported by the CalPERS Financial Office: Deferred outflows/inflows of resources related to pensions; Pension expense; Information about the fiduciary net position of the Plan, and Additions to/deductions from the Plan s fiduciary net position. Benefit payments (including refunds of employee contributions) are recognized when currently due and payable in accordance with the benefit terms. Investments are reported at fair value. (c) Contribution Requirements Active members in VTA s CalPERS Plan pay a portion or all (depending on hire date) of the employee contribution to the CalPERS Plan. In FY2015, employees hired prior to January 2012 paid 5 percent toward the required employee share and VTA paid the remaining portion of the employee contribution. Employees hired in or after the first full pay period in January 2012 paid the employee contribution of 7%. Employer s contribution rate from July 1, 2014, through June 30, 2015, was %. The employee contribution requirements of the CalPERS Plan are established by state statute and the employer contribution is established and may be amended by CalPERS. The actuarial methods and assumptions used are those adopted by the CalPERS Board of Administration. For FY 2014, VTA contributed $8.8 million, which is equal to the actuarially-determined contributions. The required contribution for FY 2015 was determined as part of the June 30, 2012, actuarial valuation using the entry age normal cost method with the contributions determined as a percent of pay. VTA s annual pension contribution of $9 million in FY 2015 was deferred as VTA opted for June 30, 2014, to be its measurement date to comply with GASB
117 (d) Net Pension Liability VTA's net pension liability to the CalPERS Plan was $74.2 million as of June 30, 2014 (measurement date). The following table shows the changes in net pension liability recognized over the measurement period. Total Pension Liability (a) Increase (Decrease) Plan Fiduciary Net Position (b) (Amounts in thousands) Net Pension Liability/(Asset) (c) = (a) - (b) Balance at 6/30/13 (valuation date) 1 $ 331,542 $ 236,519 $ 95,023 Changes Recognized for the Measurement Period: Service cost 9,055-9,055 Interest on the Total Pension Liability 24,724 24,724 Contributions from the Employer - 8,845 (8,845) Contributions from Employees - 4,482 (4,482) Net investment income (net of administrative expenses) - 41,263 (41,263) Benefit Payments, including Refunds of Employee Contributions (12,834) (12,834) - Net changes during FY ,945 41,756 (20,811) Balance at 6/30/14 (measurement date) 1 $ 352,487 $ 278,275 $ 74,212 1 The fiduciary net position includes receivables for employee service buybacks, deficiency reserves, fiduciary self-insurance, and OPEB expense. Sensitivity of the Net Pension Liability to Changes in the Discount Rate: The following presents the net pension liability of the Plan as of the measurement date, calculated using the discount rate of 7.5 percent, as well as what the net pension liability would be if it were calculated using a discount rate that is 1 percentage-point lower (6.5 percent) or 1 percentage-point higher (8.5 percent) than the current rate: Discount Rate -1% 6.5% Current Discount Rate 7.5% Discount Rate +1% 8.5% (Amounts in thousands) Plan's Net Pension Liability $ 120,055 $ 74,712 $ 35,981 (e) Actuarial Methods and Assumptions Used to Determine Pension Liability For the measurement period ended June 30, 2014, the total pension liability was determined by rolling forward the June 30, 2013 total pension liability. The June 30, 2013, and the June 30, 2014, total pension liabilities were based on the following actuarial methods and assumptions: 2-75
118 Valuation date June 30, 2013 Asset Valuation method Market value Amortization method Level Percent of Payroll Actuarial cost method Entry Age - Normal Actuarial Assumptions Discount rate 7.50% Inflation 2.75% Salary increases Varies by entry age and service Payroll growth 3.00% Investment rate of return 7.50% Net of Pension Plan Investment and Administrative Expenses; includes Inflation Mortality rate table 1 Post retirement benefit increase Derived using CalPERS' Membership Data for all Funds Contract COLA up to 2.75% until Purchasing Power Protection Allowance Floor on Purchasing Power applies, 2.75% thereafter Protection Allowance Floor on Purchasing Power applies, 2.75% thereafter 1 The mortality table used was developed based on CALPER s specific data. The table includes 20 years of mortality improvements using Society of Actuaries Scale BB. Details of this table are included in the 2014 experience study report. (f) Discount Rate The discount rate used to measure the total pension liability was 7.5 percent. CalPERS concluded, based on the results of the stress test, that the current 7.5 percent discount rate is adequate and the use of the municipal bond rate calculation is not necessary. The long-term expected return on pension plan investments was determined using building-block method in which best-estimate ranges of expected future real rates of return (expected returns, net of pension plan investment expense and inflation) are developed for each major asset class. In determining the long-term expected rate of return, both short-term and long-term market return expectations, as well as the expected pension fund cash flows, were taken into account. Such cash flows were developed assuming that both members and employers will make their required contributions on time and as scheduled in all future years. Using historical returns of all the funds asset classes, expected geometric returns were calculated over the short-term (first 10 years) and the longterm (11-60 years) using building-block approach. Using the expected nominal returns for both short-term and long-term, the present value of benefits was calculated for each fund. 2-76
119 The table below reflects long-term expected real rate of return by asset class. The rate of return was calculated using the capital market assumptions applied to determine the discount rate and asset allocation. These geometric rates of return are net of administrative expenses. Asset Class New Strategic Allocation Real Return Years Real Return Years Global Equity 47.00% 5.25% 5.71% Global Fixed Income 19.00% 0.99% 2.43% Inflation Sensitive 6.00% 0.45% 3.36% Private Equity 12.00% 6.83% 6.95% Real Estate 11.00% 4.50% 5.13% Infrastructure & Forestland 3.00% 4.50% 5.09% Liquidity 2.00% -0.55% -1.05% 1 An expected inflation of 2.5% used for this period 2 An expected inflation of 3% used for this period (g) (h) Pension Plan s Fiduciary Net Position The Plan Fiduciary Net Position includes receivables for employee service buybacks, deficiency reserves, fiduciary self-insurance and OPEB expense. The Plan s Fiduciary Net Position as of June 30, 2014 is $278.3 million. Pension Expense and Deferred Inflows/Outflows of Resources Related to Pensions For the year ended June 30, 2015, VTA incurred a pension expense of $6.9 million for the Plan. Amount (In thousands) Service cost $ 9,055 Interest on the Total Pension Liability 24,724 Employee contributions (4,482) Projected earnings on Pension Plan investments 1 (17,684) Recognized differences between projected and actual earnings on Plan investments (4,716) Pension Expense $ 6,897 1 Net of administrative expenses 2-77
120 As of June 30, 2015, VTA s deferred inflows/outflows of resources related to the CalPERS pensions are as follows, in thousands: Deferred Outflows/ (Inflows) of Resources Net differences between Projected and Actual Earnings on Pension Plan investments $ (18,864) Pension Contributions subsequent to measurement date 8,963 Deferred outflow of resources resulting from contributions, made subsequent to the measurement date will be recognized as a reduction of the net pension liability in the year ended June 30, Amounts reported as deferred inflows of resources related to differences in projected and actual investment savings will be recognized in future pension expense. Schedule is as follows, in thousands: Deferred Fiscal Year Measurement Period Fiscal Years June 30, (Inflows)/Outflows of Resources $ (4,716) (4,716) (4,716) (4,716) Thereafter Thereafter - NOTE 13 ATU SPOUSAL MEDICAL AND VISION/DENTAL FUND VTA administers the ATU Spousal Medical and Retiree Vision and Dental Fund. Both are considered to be employee-funded defined contribution plans. As of June 30, 2015, VTA had net position of approximately $13.2 million for the ATU Spousal Medical Fund and $9.3 million for the Retiree Vision and Dental Fund. The Spousal Medical Fund is a medical insurance benefit for eligible pensioners spouses. Pursuant to a collective bargaining agreement with ATU, represented employees are required to contribute $0.40 per hour to the Spousal Medical Fund. As of June 30, 2015, there were 327 participating spouses who were eligible for benefits from the Spousal Medical Fund. FY 2015 contributions were approximately $1.5 million while benefit payments made by the Fund were approximately $1.6 million and investment earnings were $610 thousand. 2-78
121 The Retiree Vision and Dental Fund is a vision and dental benefit for eligible pensioners. Effective 1999 and pursuant to a collective bargaining agreement, ATU represented employees are required to contribute $0.10 per hour. As of June 30, 2015, there were 978 eligible participants. Contributions for the fiscal year were approximately $372 thousand while benefit payments were approximately $233 thousand. A separate audited GAAP-basis postemployment benefit plan report is not available for ATU Spousal Medical and Vision/Dental Fund. NOTE 14 INTERNAL SERVICE FUND As of June 30, 2015, the assets and liabilities by individual components of the Internal Service Fund by program are as follows (in thousands): Workers' Compensation General Liability Compensated Absence Total Assets $ 18,434 $ 11,972 $ 20,364 $ 50,770 Liabilities 18,434 11,972 27,537 57,943 Net Position $ - $ - $ (7,173) $ (7,173) Workers Compensation and General Liability VTA contracts with third-party administrators to process claims for both Workers Compensation and General Liability programs. VTA s annual contribution to General Liability program is based upon quarterly internal reviews of frequency and severity claims experience. Workers Compensation fund contributions occur each pay period. Internally, the Workers Compensation fund balance is reviewed quarterly to ensure it is appropriate given the claims history. In addition, both funds are evaluated and reconciled based on year-end actuarial valuations. Actuarial Information An actuarial analysis as of June 30, 2015 disclosed that the present values of estimated outstanding losses, at 4% average discount rate using a 60% confidence level, are $18.4 million and $11.9 million for Workers Compensation and General Liability, respectively. Changes in the balance of Workers Compensation and General Liability claims for the two years ended June 30, 2014, and June 30, 2015, are as follows (in thousands): 2-79
122 Workers Compensation General Liability Unpaid claims at June 30, 2013 $ 18,231 $ 5,016 Provision for claims and claims adjustment expense 6,442 2,244 Changes in estimates for provision for future claims (1,796) 9,104 Payment for claims and other adjustments (4,371) (4,903) Unpaid claims at June 30, ,506 11,461 Provision for claims and claims adjustment expense 6,880 2,479 Changes in estimates for provision for future claims (2,767) 334 Payment for claims and other adjustments (4,185) (2,302) Unpaid claims at June 30, 2015 $ 18,434 $ 11,972 Compensated Absences This represents the amount charged each month to accrue the estimated increase in unused vacation and sick leave. This account is adjusted annually to reflect the year-end value of unused vacation and sick leave. Compensated absences are limited to leaves that are attributable to services already rendered and are not contingent on a specific event that is outside the control of the employer and employee. At June 30, 2015, the outstanding balance of compensated absences liability is $27.5 million. NOTE 15 SANTA CLARA VALLEY TRANSPORTATION AUTHORITY OTHER POST EMPLOYMENT BENEFITS (OPEB) TRUST (a) OPEB Trust Description VTA offers postemployment benefits to its employees through the Santa Clara Valley Transportation Authority Other Post Employment Benefit (OPEB) Trust, a single employer defined benefit health plan funded and administered by VTA. Employees who retire directly from VTA are eligible for retiree health benefits if they met certain requirements related to age and service. For ATU retirees, VTA provides an ATU Retiree Health Care Program (the ATU Program), a post-employment benefit, in accordance with the agreement between VTA and the ATU, to all ATU represented employees who retire from VTA on or after attaining the age of 55 with at least 15 years of service, or age 65 with 10 years of service, or upon Board approval age 65 with 5 years of service, or if an employee becomes disabled and has completed at least 10 years of service. ATU retirees can select the Kaiser, United Health Care, or Valley Health Plan retiree health plans. VTA pays the full cost of the employee-only premium, and ATU retirees who are eligible for Medicare are reimbursed for the Medicare Part B premium. ATU employees who retire on or after September 1, 2004, must contribute $25 toward the employee only monthly premium. 2-80
123 Employees who retiree on or after January 1, 2011, pay $35 or the excess above the Kaiser HMO employee only premium. Non-ATU employees who retire directly from VTA with age at least 50 years (Classic members) or 52 years (New members) are also covered under a Retiree Health Care Program (the administrative retiree program) if they retire with at least 5 years of CalPERS service or eight years of service depending on union representation and date of hire. SEIU and TAEA employees who retired before January 2, 2006, pay any premium in excess of the Kaiser employee only rate, those who retired on or after January 2, 2006, pay $25 toward their monthly premium, plus any premium in excess of the Kaiser HMO employee only rate, and those who retired on or after January 1, 2014, pay $50 toward their monthly premium, plus any premium in excess of the Kaiser employee only rate. AFSCME and Non-Represented retirees pay any premium in excess of the CalPERS Kaiser Bay Area employee only rate. Non-Represented retirees who are eligible for Medicare are reimbursed for the Medicare Part B premium. VTA also provides life insurance benefits for all ATU retirees and Executive Management retirees. ATU retirees who retired prior to January 1, 2010, receive $5,000 in life insurance coverage and those who retired on or after January 1, 2010, receive $7,000 in life insurance coverage. Executive Management retirees receive $50,000 in life insurance coverage for the first year of retirement, decreasing by $10,000 each year until its expiration in the sixth year. As of June 30, 2015, the number of retirees and active employees who met the eligibility requirements for the ATU Program and non ATU are as follows: OPEB Eligible ATU Non-ATU Total Retirees ,446 Active 1, ,166 (b) Basis of Accounting Contributions are recognized as revenue when due, pursuant to formal commitments, as well as statutory or contractual requirements. Benefits (distributions to participants) and refunds of prior contributions are recognized when due and payable in accordance with the terms of the Plan. 2-81
124 Investments are reported at fair value. Securities traded on a national or international exchange are valued at the last reported sales price on the last business day of the fiscal year at current exchange rates. Purchases and sales of securities are reflected on the trade date and investment income is recognized as earned. (c) Funding Policy Benefit allowance provisions are established through agreements and memorandums of understanding (MOU) between VTA and unions representing its employees. VTA s contributions to the plans are based on Annual Required Contribution (ARC) as determined by an actuarial valuation study. In FY 2008, VTA established an irrevocable trust to fund the ARC in accordance with the provisions of GASB Statement 45. As of June 30, 2015, VTA had assets of $275.9 million to cover costs of the ATU and Non-ATU Programs. The Plan is presented in these financial statements as the OPEB Trust Fund. Separate financial statements are also prepared for the Trust and can be obtained from Santa Clara Valley Transportation Authority, Finance and Budget, 3331 North First Street, Building C-2, San Jose, California (d) Annual OPEB Cost and Net OPEB Obligations VTA s Annual Plan Cost (Expense) is calculated based on the Annual Required Contribution (ARC) of the employer, an amount actuarially determined in accordance with the parameters of GASB Statement 45. The ARC represents a level of funding that, if paid on an ongoing basis, is projected to cover normal cost each year and amortize any unfunded actuarial liabilities (or funding excess) over a period not to exceed twenty years, using a closed amortization methodology. OPEB activities during FY 2015 are as follows (in thousands): Annual Required Contributions $ 12,000 Interest on Net Plan Asset 1 - Annual Plan Cost (Expense) 12,000 Contributions Made (12,000) Net Plan Assets, Beginning of Year 20,650 Net Plan Assets, End of Year $ 20,650 1 VTA s adjustment to the ARC was offset by interest requiring no adjustment to the current year s ARC. In FY 2013, VTA Transit Fund made a one-time irrevocable transfer of $20.65 million to OPEB Trust Fund. This was included in VTA Transit unrestricted net position earmarked for future operational needs of OPEB Trust Fund. OPEB Trust Fund reflected this as a contribution during FY Plan cost, contribution made, 2-82
125 the percentage of annual cost contributed to the Plan, and the net Plan assets for the years ended June 30, 2013, through 2015 are presented as follows (in thousands): Net OPEB Obligation/Asset Percentage of Annual Fiscal Year Ended Annual OPEB Cost VTA Contribution OPEB Cost Contributed Net OPEB Asset 6/30/15 $ 12,000 $ 12, % $ 20,650 6/30/14 14,100 14, % 20,650 6/30/13 17,315 37, % 20,650 (e) Funding Status and Funding Progress Actuarial valuations of an ongoing plan involve estimates of the value of reported amounts and assumptions about the probability of occurrence of events far into the future. Examples include assumptions about future employment, mortality, and the healthcare cost trend. Amounts determined regarding the funded status of the plan and annual required contributions of the employer are subject to continual revision as actual results are compared with past expectations and new estimates are made about the future. As of July 1, 2014, the most recent actuarial valuation date, the plan was 87.7% funded. The actuarial accrued liability was $297 million and the actuarial value of assets was $260.3 million, resulting in an Unfunded Actuarial Liability (UAL) of $36.7 million. The covered payroll was $162.9 million which resulted in a 22.5% UAL as a percent of covered payroll. The schedule of funding progress is presented on page 2-95, in the required supplementary information following the notes to the financial statements. (f) Actuarial Methods and Assumptions A summary of principal assumptions and methods used by the actuaries to determine VTA s annual required contributions to the Plan is as follows: Description Methods/Assumptions Valuation date July 1, 2014 Actuarial Cost Method Individual Entry Age Amortization Method Level dollar closed Asset valuation method Market value Remaining Amortization Period 14 years Actuarial assumptions: Discount rate 7.00% Payroll growth rate 3.25% Ultimate rate of medical inflation 4.50% 2-83
126 NOTE 16 CLAIMS, COMMITMENTS, AND CONTINGENCIES The VTA is exposed to liability for bodily injury and property damage; physical damage to and loss of its property; and liability for financial loss suffered by employees and others as a result of various risk exposures inherent to public transportation services and congestion management oversight. The VTA self-insures and contracts third party adjustment services for: (a) (b) (c) (d) Third party personal injury, bodily injury, and property damage liability claims up to $3 million per occurrence. Workers Compensation claims through self-insurance. Employment practices liability claims up to $3 million per occurrence. First party property damage with various deductible ranging from $100,000 to $250,000 for rail cars and equipment, buses, and real property. Under General Liability, VTA is self-insured for $3 million. VTA purchases excess liability insurance with an aggregate of $95 million in addition to its primary layer of $2 million. The VTA purchases Public Officials Liability & Employer s Liability Insurance with an annual aggregate of $2 million per occurrence excess of $3 million self-insured retention. The VTA purchases first party property insurance for loss or damage to its property arising out of various risk perils (excluding earthquake) and damage from bus and rail transit collisions, overturn or derailment. Coverage provides stated value/replacement cost per occurrence with various deductibles not exceeding $250,000. Type of Coverage Self-Retention Excess Coverage Workers Compensation Self-Insured None General Liability $ 3,000,000 $ 97,000,000 Property, Boiler & Machinery 100,000 80,000,000 Flood 5, ,000 Light Rail Vehicles (Spare Parts) 250, ,000,000 Buses 150,000 & lower 50,000,000 Non-Revenue Trucks & Equipment Various 50,000,000 Public Officials Liability 3,000,000 2,000,000 Crime 2,500 1,000,000 NOTE 17 LEASES VTA leases various properties for use as transfer facilities, parking lots, information centers, office buildings, and warehouses under lease agreements that expire at various 2-84
127 dates through VTA may renew the leases after their expiration. Some of these agreements were accounted for as operating leases in VTA Transit Fund for approximately $ 312 thousand in FY Other leases were charged to capital project expenditures and were capitalized in FY The future lease payments under non-cancellable lease agreements are as follows (in thousands): Future Lease Years ending June 30, Payments 2016 $ 1, , , Total $ 4,037 NOTE 18 LITIGATION VTA is involved in a litigation matter that, because of the uncertainties of litigation, may possibly have an adverse financial impact beyond VTA s actuarially determined reserves and excess insurance. The case is Baljinder Rai et. al. v. Santa Clara Valley Transportation Authority, U.S. District Court No. CV PSG (Rai v. VTA). In August of 2012, VTA bus operator Baljinder Rai filed a collective action against VTA in Federal Court, alleging various wage and hour violations under the Federal Labor Standards Act (FLSA). Since the filing, over 1,000 operators (both bus and light rail) have joined the lawsuit to claim damages related to VTA s alleged failure to pay with respect to the following categories: 1. Start-end travel time 2. Split-shift travel time 3. Turn-in time 4. Medical examination time 5. Routinely late time 6. Pre-departure time 7. Bulletin time 8. Meeting time 9. Rest periods VTA has denied these allegations and is vigorously defending the case. Parties have jointly requested a bifurcated trial, and the Court has ordered the liabilities portion of the trial to commence on December 14, In the meantime, the parties are actively engaged in discovery while simultaneously exploring the possibilities for settlement. Parties have met 2-85
128 twice in settlement conference that was facilitated by Federal Magistrate Joseph Spero. The next settlement conference before Judge Spero is scheduled for October 19, Although VTA currently believes this case will more likely than not resolve below VTA s actuarially determined reserves and excess insurance, plaintiffs are demanding above that amount and will likely request the same from a jury. A more precise calculation of the possible financial impact of the case is forthcoming. Discovery is scheduled to close on September 30, 2015, and an assessment of VTA s potential liabilities will require additional analyses with the help of experts that VTA has hired to assist with this case. The resultant analyses will further inform VTA s motions for summary judgment and decertification, which are scheduled for October and November, respectively. NOTE 19 CONTRACTED SERVICES PROVIDED BY THE COUNTY OF SANTA CLARA The County provides support services to VTA for protection (Office of the Sheriff), vehicle maintenance, and fuel, and contributions for retiree medical for County public safety staff assigned to VTA. As of June 30, 2015, the support services totaled $5.9 million and are included in Operating Expenses. NOTE 20 JOINT VENTURES (a) Peninsula Corridor Joint Powers Board VTA is a member agency of the Peninsula Corridor Joint Powers Board (PCJPB), along with the San Mateo County Transit District (SamTrans) and the City and County of San Francisco (CCSF). The PCJPB is governed by a separate board composed of nine members, three from each participating agency. The PCJPB was formed in October 1991 to plan, administer, and operate the Peninsula Corridor rail service (Caltrain), which began operating on July 1, Prior to July 1, 1992, such rail service was operated by Caltrans. The net operating costs and administrative expenses of the PCJPB for services provided between San Francisco and San Jose are reimbursed by the member agencies. In FY 2015, VTA, SamTrans, and CCSF were responsible for 40.3%, 41.9%, and 17.8%, respectively, of the member agencies total reimbursement for such expenses. During the year ended June 30, 2015, VTA paid $8.4 million to the PCJPB for operating costs. 2-86
129 SamTrans serves as the managing agency of the PCJPB, providing administrative personnel and facilities. The disbursement of funds received by the PCJPB is controlled by provisions of various grant contracts entered into with the U.S. government, the state, and the member agencies. VTA s agreement with the PCJPB expired in 2001 and continues in full force and effect on a year-to-year basis, until any member provides a one-year s prior written notice of withdrawal. If two or more parties to the agreement withdraw, then the agreement shall terminate at the end of the fiscal year following expiration of the oneyear s notice given by the second party. In that event, the property and funds of the PCJPB would be distributed to the member agencies in accordance with a separate agreement to be entered into between the parties. Summary financial information (not included in VTA s financial statements) for the PCJPB for the years ended June 30, 2014 and 2013 (in thousands), are as follows 1 : PCJPB Financial Information Total assets $1,389,395 $1,347,889 Total liabilities (112,395) (109,551) $1,277,000 $1,238,338 Operating revenues $ 82,145 $ 75,546 Operating expenses (189,212) (167,020) Non-operating revenues, net 34,380 42,091 Capital contributions 111,349 87,385 $ 38,662 $ 38,002 1 Most recent audited financial information available. Complete financial statements for the PCJPB can be obtained from SamTrans at 1250 San Carlos Avenue, San Carlos, California (b) Altamont Commuter Express The Altamont Commuter Express (ACE) is a commuter rail service covering over 85 miles between Stockton and San Jose with stops in Manteca, Tracy, Livermore, Pleasanton, Fremont, Santa Clara, and San Jose. ACE is funded by VTA, the Alameda County Congestion Management Agency, and the San Joaquin Regional Rail Commission which also serves as the managing agency. ACE commenced operations in October 1998, and now provides four daily round trips commuter rail service from San Joaquin County through the Tri-Valley Area of Alameda County to Santa Clara County. In June 2003, VTA entered into a Cooperative Service Agreement with the San Joaquin Regional Rail Commission 2-87
130 (SJRRC) and the Alameda County Transportation Commission (Alameda CTC) for continued VTA funding of Altamont Commuter Express (ACE) commuter rail service. The cooperative agreement replaced the ACE Joint Powers Agreement (JPA) executed by the ACE member agencies VTA, SJRRC, and Alameda CTC. Per the cooperative agreement, VTA s financial subsidy is the amount paid in FY 2003, increased annually by the consumer price index (CPI). During the year ended June 30, 2015, VTA contributed approximately $3.1 million for operating costs. Summary financial information (not included in VTA s financial statements) for the Altamont Commuter Express for the years ended June 30, 2014, and 2013 (in thousands), are as follows 1 : ACE Financial Information Total assets $ 173,945 $ 164,107 Total liabilities (63,076) (60,657) Total net position $ 110,869 $ 103,450 Operating revenues $ 6,885 $ 5,754 Operating expenses (23,688) (25,411) Non-operating revenues, net 12,137 12,841 Capital contributions 12,566 10,989 Transfer in/(out) - (37) Prior Year's restatement (481) - Change in net position $ 7,419 $ 4,136 1 Most recent audited financial information available Complete financial statements for ACE can be obtained from the San Joaquin Regional Rail Commission at 949 East Channel Street, Stockton, California (c) Capitol Corridor Intercity Rail Service VTA is a member agency of the Capitol Corridor Joint Powers Authority, which provides intercity rail service between Sacramento and San Jose. The Capitol Corridor intercity rail service is provided by the Capitol Corridor Joint Powers Board, which is comprised of members of the governing bodies of VTA, the Sacramento Regional Transit District, the Placer County Transportation Planning Agency, the congestion management agencies of Solano and Yolo counties, and the San Francisco Bay Area Rapid Transit District (BART). BART is the managing agency for the Capitol Corridor Service. VTA offers no funds to the operation of this service. Complete financial statements for the Capitol Corridor Service can be obtained from the San Francisco Bay Area Rapid Transit District (BART) at P.O. Box 12688, Oakland, California
131 NOTE 21 OTHER FINANCING TRANSACTIONS (a) Lease/Leaseback In September 1998, VTA simultaneously entered into two transactions to lease 50 UTDC light rail vehicles (the UTDC LRVs ) to statutory trusts formed on behalf of equity investors (the Trusts ) under separate lease agreements (the Lease Agreements ) and simultaneously leased the UTDC LRVs back from the Trusts under separate sublease agreements (the Subleases ) (each, a Lease/Leaseback Transaction ). In September 2011, VTA terminated one of the Lease/Leaseback transactions relating to 21 UTDC LRVs. The remaining Sublease, relating to 29 UTDC LRVs, terminates in 2026, subject to VTA s option to buy-out the remaining Sublease term in 2017 (the Early Buy-out ). During the term of the Sublease, VTA retains ownership of and is obligated to insure and maintain the UTDC LRVs. VTA received approximately $54.2 million, which represented the prepayment of the rental obligations owed by the Trust as Lessee under the Lease Agreement. The equity investor made an equity contribution of approximately $14.4 million of the prepaid Lease Agreement amount and AIG-FP Funding (Cayman) Limited made loans for the balance of prepayment amount. VTA is required to make annual rental payments as Sub lessee pursuant to the Sublease. To provide for the funding of the debt portion of its rental payments under the Sublease and the debt portion of the Early Buy-out, VTA entered into a debt payment agreement with AIG-FP Special Finance (Cayman) Limited ( AIG Special Finance ), whose obligations are guaranteed by American International Group, Inc. ( AIG ). Under the terms of the debt payment agreement, VTA made an aggregate payment of $39.8 million in consideration of AIG Special Finance s agreement to make payments equal to the debt portion of VTA s rental payment under the Sublease and the debt portion of VTA Early Buy-out. VTA is obligated to replace AIG if the credit rating assigned to it by Moody s or Standard & Poor s falls below Baa1/BBB+, respectively. As of June 30, 2015, AIG is rated Baa1/A-. VTA also used $9.7 million of the amounts received from the Trust to purchase US Treasury securities that mature on the dates and in the amounts equal to the equity portion of its rental payments under the Sublease and the equity portion of the Early Buy-out. These US Treasury securities are held by a third party custodian. Additionally, VTA purchased a financial guaranty insurance policy from Financial Security Assurance (now Assured Guaranty Municipal Corp. or AGM ) to guarantee its obligations to pay liquidated damages in the event one or more UTDC LRVs are destroyed or there is an early termination of the Subleases. Within thirty (30) days 2-89
132 after demand by the equity investor, VTA is obligated to replace AGM if its credit rating by Moody s or Standard & Poor s falls below Aa3/AA-. Failure to replace AGM after such demand could cause a termination of the Lease/Leaseback transaction, resulting in the requirement that VTA make an early termination payment. In January 2013, Moody s downgraded AGM to A2. The equity investor has continuously agreed each six months to forbear from requiring VTA to replace AGM, currently through December 31, VTA does not believe that a qualifying replacement surety is available. As of June 30, 2015, the market value of the U.S. Treasury securities held by the custodian was $21.08 million, compared to the scheduled termination value of $24.3 million. VTA reported revenue of $3.2 million from its Lease/Leaseback transaction in FY (b) Sublease Agreement with Utah Transit Authority (UTA) and Sacramento Regional Transit District (RT) In May 2003, the VTA Board approved the execution of sub-lease agreements with the Utah Transit Authority (UTA) and Sacramento Regional Transit District for the sublease of 50 UTDC LRVs for terms of 13 years, with sublease renewal terms of nine years thereafter. The sublease transactions to UTA and RT were recorded as capital leases in FY VTA subtracted $23 million and $10 million in net book value assets from its balance sheet and recognized a loss of $16 million and $7.8 million as special items in FY 2004 and FY 2005, respectively. In September 2013, RT exercised the purchase option of the leased 21 LRVs at $1,000 each in accordance with the sublease agreement entered into by VTA and RT. To date, UTA has not exercised its option to purchase the leased vehicles. NOTE 22 SUBSEQUENT EVENT Federal Funding Grant Agreement Of the $900 million Federal Section 5309 New Starts grant funding commitment from the FTA for the VTA s Silicon Valley Berryessa Extension Project, $552.6 million has been awarded to date. This includes the $150 million grant awarded in September
133 REQUIRED SUPPLEMENTARY INFORMATION (Other than MD&A)
134 THIS PAGE IS INTENTIONALLY LEFT BLANK
135 SANTA CLARA VALLEY TRANSPORTATION AUTHORITY Required Supplementary Information Schedule of Changes in Net Pension Liability and Related Ratios For the Year ended June 30, 2015 Amalgamated Transit Union Pension Plan (Unaudited) (In Thousands) FY 2015 FY 2014 Total Pension Liability Service Cost $ 13,468 $ 12,094 Interest (includes interest on service cost) 43,069 41,417 Difference between expected and actual experience 4,517 - Benefit payments, including refunds of member contributions (33,418) (30,967) Net change in total pension liability 27,636 22,544 Total Pension Liability, beginning 584, ,498 Total Pension Liability,ending 611, ,042 Plan Fiduciary Net Position Contributions - employer 25,590 25,787 Net investment income 16,094 64,139 Benefit payments, including refunds of member contributions (33,418) (30,967) Administrative expense (301) (313) Net change in Plan Fiduciary Net Position 7,965 58,646 Plan Fiduciary Net Position, beginning 481, ,580 Plan Fiduciary Net Position, ending 489, ,226 Net Pension Liability, ending $ 122,487 $ 102,816 Plan Fiduciary Net Position as a percentage of the Total Pension Liability 79.98% 82.40% Covered-employee Payroll $ 115,914 $ 107,880 Net Pension Liability as a percentage of covered-employee payroll % 95.31% Notes to schedule: Change in assumptions: There were no changes in assumptions. Benefit changes: There were no changes in the benefit formula. Information not available prior to FY
136 SANTA CLARA VALLEY TRANSPORTATION AUTHORITY Required Supplementary Information Schedule of Plan Contributions For the Years ending June 30, 2006 to 2015 Amalgamated Transit Union Pension Plan (Unaudited) (In Thousands) Contractually-required Contribution $ 25,590 $ 25,787 $ 24,413 $ 19,148 $ 17,807 $ 17,905 $ 14,843 $ 16,137 $ 14,859 $ 15,277 Contributions in Relation to the Contractually-required contribution 25,590 25,787 24,413 19,148 17,807 17,905 14,843 16,137 14,859 15,277 Contributions Deficiency/(Excess) $ - $ - $ - $ - $ - $ - $ - $ - $ - $ - Covered-employee Payroll $ 115,914 $ 107,880 $ 104,136 $ 104,726 $ 98,741 $ 98,036 $ 99,775 $ 99,408 $ 94,847 $ 89,983 Contributions as a Percentage of Covered-employee Payroll 22.08% 23.90% 23.44% 18.28% 18.03% 18.26% 14.88% 16.23% 15.67% 16.98% Notes to Schedule Valuation Date 1/1/2014 Timing Actuarially-determined contribution rates are calculated based on the actuarial valuation six months prior to the beginning of the fiscal year Actuarial cost method Asset valuation method Amortization method Entry Age - Normal 5-year smoothed market, subject to 80%/120% corridor All unfunded liability charges are amortized over a rolling 20-year period as a level dollar amount Inflation: 3.25% Amortization growth rate: 0.00% Salary increases: 3.25% plus merit component COLA increases: 0.00% Investment rate of return: 7.50%, net of investment expense Post-retirement Mortality: Sex distinct RP-2000 Combined Healthy Blue Collar Mortality, projected to 2025 using 50% of Scale BB, with ages set back one year for female members. No benefit modification during the last ten years. 2-92
137 SANTA CLARA VALLEY TRANSPORTATION AUTHORITY Required Supplementary Information Schedule of Changes in Net Pension Liability and Related Ratios For the Year ended June 30, 2015 California Public Employees Retirement System (CalPERS) (Unaudited) (In Thousands) TOTAL PENSION LIABILITY Service cost $ 9,055 Interest 24,724 Benefit payments, including refunds of employee contributions (12,834) Net Change in Total Pension Liability 20,945 Total Pension Liability - Beginning 331,542 Total Pension Liability - Ending (a) 352,487 PLAN FIDUCIARY NET POSITION Contributions - Employer 8,845 Contributions - Employee 4,482 Net Investment Income 1 41,263 Benefit payments, including refunds of employee contributions (12,834) Net Change in Fiduciary Net Position 41,756 Plan Fiduciary Net Position - Beginning 236,519 Plan Fiduciary Net Position - Ending (b) 278,275 Plan Net Pension Liability - Ending (a) - (b) $ 74,212 Plan Fiduciary Net Position as a Percentage of the Total Pension Liability 78.95% Covered-Employee Payroll $ 54,294 Plan Net Pension Liability as a Percentage of Covered Employee Payroll % 1 Net of administrative expenses Notes to Schedule: Benefit Changes: The figures above do not include any liability impact that may have resulted from plan changes which occurred after June 30, This applies for voluntary benefit changes as well as any offers of Two Years Additional Service Credit. Changes of assumptions: There were no changes in assumptions. Information not available prior to FY
138 SANTA CLARA VALLEY TRANSPORTATION AUTHORITY Required Supplementary Information Schedule of Plan Contributions For the Years ending June 30, 2006 to 2015 California Public Employees Retirement System (CalPERS) (Unaudited) (In Thousands) 2015 a 2014 b Contractually-required Contribution $ 8,965 $ 8,845 $ 7,497 $ 7,159 $ 6,090 $ 6,167 $ 6,507 $ 6,728 $ 5,929 $ 6,501 Contributions in Relation to the Contractually-required Contribution 8,965 8,845 7,497 7,159 6,090 6,167 6,507 6,728 5,929 6,501 Contributions Deficiency/(Excess) $ - $ - $ - $ - $ - $ - $ - $ - $ - $ - Covered-employee Payroll $ 60,386 $ 54,294 $ 52,712 $ 53,950 $ 51,626 $ 53,231 $ 54,589 $ 51,043 $ 49,682 $ 50,302 Contributions as a Percentage of Covered-employee Payroll 14.85% 16.29% 14.22% 13.27% 11.80% 11.59% 11.92% 13.18% 11.93% 12.92% Notes to Schedule: a Based on Payroll records b The actuarial methods and assumptions used to set the actuarially-determined contributions for Fiscal Year 2014 were from the June 30, 2011 public agency valuations. Actuarial cost method Amortization method Asset valuation method Inflation 2.75% Salary increases Entry Age Normal Level Percent of Payroll Actuarial value of assets Varies by entry age and service Payroll growth 3.00% Investment rate of return 7.5% Net of Pension Plan Investment and Administrative expenses; includes inflation. Retirement age The probabilities of Retirement are based on the 2010 CalPERS Experience Study for the period 1997 to Mortality The probabilities of mortality are based on the 2010 CalPERS Experience Study for the period 1997 to Pre-retirement and Post-retirement rates include 5 years of projected mortality improvement using Scale AA published by the Society of Actuaries. 2-94
139 SANTA CLARA VALLEY TRANSPORTATION AUTHORITY Required Supplementary Information Schedule of Funding Progress (1) As of June 30, 2015 Retirees' Other Post Employment Benefits (OPEB) Trust (Unaudited) (In thousands) Actuarial Valuation Date Actuarial Value of Assets Actuarial Accrued Liability (AAL) Unfunded Actuarial Accrued Liability (UAAL) Funded Ratio Covered Payroll $ 87.7% 162,902 UAAL as a Percentage of Covered Payroll 6/30/2014 $ 260,310 $ 296,970 36,660 $ 22.5% 6/30/ , ,233 62, % 152, % 6/30/ , ,560 91, % 142, % (1) The schedule of funding progress presents the most recent actuarial information regarding the OPEB funding progress of the Santa Clara Valley Transportation Authority. 2-95
140 SANTA CLARA VALLEY TRANSPORTATION AUTHORITY Required Supplementary Information Budgetary Comparison Schedule Congestion Management Program Special Revenue Fund For the Year ended June 30, 2015 (In thousands) Original Budget Final Budget Actual Variance Final to Actual Positive/ (Negative) Revenue: Assessments to member agencies $ 2,407 $ 2,407 $ 2,407 $ - Federal grant revenues 1,371 1,371 1,371 - Administrative fees State and local operating assistance grants Other revenues Investment earnings (28) TOTAL REVENUE 4,736 4,736 4, Expenditures: VTA labor and overhead costs 3,922 4,022 3, Services and other: Professional services 1,096 1,463 1, Other services Data processing Miscellaneous Contribution to Other Agencies TOTAL EXPENDITURES 5,074 5,716 5, Change in fund balance, on a budgetary basis $ (338) $ (980) $ (520) $ 460 Revenues and Expenditures not budgeted: Unrealized gain/loss on investments (1) Change in fund balance, on a GAAP basis (521) Fund Balance, Beginning of Year 2,020 Fund Balance, End of Year $ 1,499 See Note accompanying this schedule 2-96
141 Budgetary Basis of Accounting State law requires the adoption of an annual budget, which must be approved by the VTA s Board of Directors. The VTA Board adopts a biennial budget for its Congestion Management Program Special Revenue Fund. The budget for the Special Revenue Fund is prepared on a modified accrual basis but excludes unrealized gains and losses on investments. Budgetary control is maintained at the fund level. The Division Chief must authorize line item reclassification amendments to the budget. Managers are assigned the responsibility for controlling their budgets and monitoring operating expenses. Annual appropriations for the operating budget lapse at the end of the fiscal year to the extent that they have not been expended. The unexpended capital budget at fiscal year- end is carried forward from year to year until the project is completed. 2-97
142 THIS PAGE IS INTENTIONALLY LEFT BLANK
143 SUPPLEMENTARY INFORMATION (Combining and Individual Fund Statements)
144 THIS PAGE IS INTENTIONALLY LEFT BLANK
145 SANTA CLARA VALLEY TRANSPORTATION AUTHORITY Comparative Schedule of Fund Net Position Enterprise Funds June 30, (In thousands) ASSETS Current assets: Cash and cash equivalents $ 3,760 $ 15,741 Investments 298, ,716 Receivables, net 3,221 2,676 Due from other funds Due from other agencies 77,764 85,524 Inventories 22,070 20,195 Other current assets 2,399 1,094 Total current assets 407, ,238 Restricted assets: Cash and cash equivalents 40,045 14,263 Cash and investments with fiscal agent 68, ,977 Investments 760, ,551 Receivables, net Due from other funds 8,373 - Due from other agencies 143, ,009 Other current assets Total restricted current assets 1,021,075 1,151,412 Non-current assets: Net OPEB Asset 20,650 20,650 Intangible Assets 3,966 4,847 Capital Assets Nondepreciable: Land and right-of-way 1,124,646 1,126,373 Construction in progress 2,177,750 1,728,066 Depreciable: Caltrain - Gilroy extension 43,072 43,072 Buildings, improvements, furniture, and fixtures 548, ,184 Vehicles 566, ,229 Light-rail tracks and electrification 415, ,905 Leasehold improvement 9,686 9,686 Other 47,156 46,062 Less: Accumulated depreciation (833,095) (768,364) Net capital assets 4,100,080 3,605,213 Total Assets 5,553,219 5,156,360 DEFERRED OUTFLOW OF RESOURCES Accumulated decrease in fair value of hedging instruments, deferred amount on refunding, & deferred outflow of resources-pension related 127,922 87,918 (Continued) 2-98
146 SANTA CLARA VALLEY TRANSPORTATION AUTHORITY Comparative Schedule of Fund Net Position (Continued) Enterprise Funds June 30, (In thousands) LIABILITIES Current liabilities: Current portion of long-term debt 14,310 10,705 Accounts payable and accrued expenses 16,357 19,325 Deposits Accrued payroll and related liabilities 8,529 7,557 Bond interest and other fee payable Unearned revenues 3,201 1,971 Other accrued liabilities Total current liabilities 43,305 41,201 Liabilities payable from restricted assets: Current portion of long-term debt 26,965 25,775 Accounts payable and accrued expenses 104,543 81,639 Bond interest and other fee payable 11,683 12,123 Unearned revenues 8, Due to other funds 8,079 - Due to other governmental agencies 77, ,521 Total current liabilities payable from restricted assets 236, ,097 Non-current liabilities Long-term debt, excluding current portion 1,119,490 1,157,311 Derivative instruments 83,451 76,104 Net pension liability * 196,699 - Total non-current liabilities 1,399,640 1,233,415 TOTAL LIABILITIES 1,679,902 1,498,713 DEFERRED AMOUNT ON BOND REFUNDING & DEFERRED INFLOWS RELATED TO PENSION 23,199 8,051 NET POSITION $ 3,978,040 $ 3,737,514 *Resulting from GASB 68 implementation. This consists of $ million for ATU and $74.20 million for CalPERS 2-99
147 SANTA CLARA VALLEY TRANSPORTATION AUTHORITY Comparative Schedule of Revenues, Expenses and Changes in Fund Net Position Enterprise Fund For the Years ended June 30, (In thousands) OPERATING REVENUES: Passenger fares $ 39,108 $ 38,372 Toll revenues collected 1,157 1,222 Advertising and other 2,789 2,826 TOTAL OPERATING REVENUES 43,054 42,420 OPERATING EXPENSES: Labor cost 286, ,690 Materials and supplies 32,407 32,806 Services 28,883 28,488 Utilities 8,316 7,585 Casualty and Liability 5,238 13,813 Purchased transportation 19,241 18,493 Leases and rentals 714 1,334 Miscellaneous 1,735 1,616 Depreciation expense 65,677 59,445 Costs allocated to capital and other programs (32,441) (34,864) TOTAL OPERATING EXPENSE 416, ,406 OPERATING LOSS (373,405) (366,986) NON-OPERATING REVENUES (EXPENSES) Sales tax revenue 446, ,486 Federal operating assistance and other grants 24,553 42,230 Federal subsidy for Build America Bonds 8,715 8,755 State and local operating assistance grants 110, ,439 Caltrain subsidy (8,390) (7,291) Capital expenses on behalf of, and contribution to, other agencies (61,445) (93,952) Altamont Commuter Express subsidy (3,097) (3,019) Investment earnings 9,118 9,555 Interest expense (15,204) (27,088) Other income 20,371 6,835 Other expense (5,734) (11,096) NON-OPERATING REVENUE, NET 525, ,854 INCOME (LOSS) BEFORE CONTRIBUTIONS 152,099 81,868 CAPITAL CONTRIBUTIONS 277, ,899 CHANGE IN NET POSITION 429, ,767 NET POSITION, BEGINNING OF YEAR 3,737,514 3,461,747 Adjustment to Net Position due to GASB 68 Implementation (188,994) - NET POSITION, BEGINNING OF YEAR, (AS 3,548,520 3,461,747 NET POSITION, END OF YEAR $ 3,978,040 $ 3,737,
148 SANTA CLARA VALLEY TRANSPORTATION AUTHORITY Comparative Schedule of Cash Flows Enterprise Funds For the Years Ended June 30, (In thousands) CASH FLOWS FROM OPERATING ACTIVITIES Cash received from passenger fares $ 40,212 $ 38,415 Cash received from toll revenues collected 1,186 1,224 Cash received from advertising 2,973 2,847 Cash paid to employees (256,849) (245,592) Cash paid to suppliers (82,515) (81,720) Cash paid for purchased transportation (19,241) (18,493) Other non-operating receipts/(payments) 26,712 2,283 Net cash provided by/(used in) operating activities (287,522) (301,036) CASH FLOWS FROM NONCAPITAL FINANCING ACTIVITIES Operating grants received 197, ,011 Sales tax received 394, ,269 Caltrain subsidy (8,390) (7,291) Altamont Commuter Express subsidy (3,097) (3,019) Capital contribution to other agencies (61,845) (94,320) Transfers in 30,122 - Transfers out (30,118) - Net cash provided by/(used in) non-capital financing activities 518, ,650 CASH FLOWS FROM CAPITAL AND RELATED FINANCING ACTIVITIES Payment of long-term debt (137,130) (35,030) Proceeds from issuance of long-term debt 89,980 - Premium on issuance of long-term bonds 20,035 - Issuance and other cost Proceeds from sale of properties 16,732 - Advance (to)/from other governments (23,102) 19,397 Interest and other fees paid on long-term debt (29,159) (31,266) Acquisition and construction of capital assets (561,405) (342,773) Capital contribution from other governments 372,775 70,299 Net cash provided by/(used in) capital and related financing activities (250,845) (319,280) CASH FLOWS FROM INVESTING ACTIVITIES Proceeds from sale of investments 3,433,451 2,059,115 Purchases of investments (3,591,390) (2,131,066) Interest income received 8,905 5,985 Net cash provided by/(used in) investing activities (149,034) (65,966) NET INCREASE/( DECREASE) IN CASH AND CASH EQUIVALENTS (169,346) (223,632) CASH AND CASH EQUIVALENTS, BEGINNING OF YEAR 281, ,614 CASH AND CASH EQUIVALENTS, END OF YEAR $ 112,636 $ 281,982 (continued on next page) 2-101
149 SANTA CLARA VALLEY TRANSPORTATION AUTHORITY Comparative Schedule of Cash Flows (Continued) Enterprise Funds For the Years Ended June 30, (In thousands) RECONCILIATION OF OPERATING INCOME (LOSS) TO NET CASH PROVIDED BY/(USED IN) OPERATING ACTIVITIES: Operating income/(loss) $ (373,405) $ (366,986) Adjustments to reconcile operating income (loss) to net cash used in operating activities: Depreciation 65,677 59,444 Changes in operating assets and liabilities: Other current assets (1,213) (30) Receivables Due from other governmental agencies 29 2 Inventories (1,876) (986) Accounts payable (2,982) 4,652 Other accrued liabilities (1,804) 934 Deposits from others 52 (413) Unearned revenue 1, Other non operating receipts/(payments) 26,712 2,283 Net cash provided by/(used in) operating activities $ (287,522) $ (301,036) Reconciliation of cash and cash equivalents to the Statement of Fund Net Position: Cash and cash equivalents, end of year: Unrestricted $ 3,760 $ 15,741 Restricted 108, ,241 $ 112,636 $ 281,982 NONCASH ACTIVITIES: Increase/(Decrease) in fair value of investments $ (427) $ 4,693 Noncash capital contributions 95,354 (123,601) Amortization expense of Caltrain Access Fee (881) (882) Total non-cash activities $ 94,046 $ (119,790) 2-102
150 SANTA CLARA VALLEY TRANSPORTATION AUTHORITY Budgetary Comparison Schedule - Enterprise Fund VTA Transit Fund For the year ended June 30, 2015 (In thousands) FY15 Adopted Final Positive Budget Budget Actual (Negative) REVENUES Fares $ 39,905 $ 39,905 $ 39,108 $ (797) /2 Cent Sales Tax 190, , ,221 8,376 Transportation Development Act funds 89,697 89,697 94,640 4,943 Measure A Sales Tax Operating Assistance 35,171 35,171 36,850 1,678 STA 13,600 13,600 13, Federal Operating Grants 38,920 38,920 24,553 (14,368) Less: Transfer for Capital (25,298) (25,298) - 25,298 State Operating Grants 2,635 2,635 1,654 (981) Investment Earnings 1,412 1,412 1, Advertising Income 1,912 1,912 2, Other Income 13,361 13,361 14,535 1,174 Total revenues 402, , ,006 25,845 OPERATING EXPENSES Labor Costs 295, , ,390 5,703 Materials & Supplies 16,491 16,493 19,991 (3,498) Security 9,072 9,632 9, Professional & Special Services 4,540 5,403 4, Other Services 7,373 7,393 7,964 (571) Fuel 17,622 17,005 11,721 5,284 Traction Power 3,539 3,539 3,941 (402) Tires 1,880 1,880 1,914 (34) Utilities 2,727 2,727 2,938 (211) Insurance 5,537 5,637 5, Data Processing 3,477 3,477 3, Office Expense (96) Communications 1,312 1,312 1,435 (123) Employee Related Expense Leases & Rents (80) Miscellaneous (286) Reimbursements (35,348) (35,348) (36,704) 1,357 Total operating expenses 335, , ,716 9,022 OTHER EXPENSES Paratransit 20,800 17,800 17, Caltrain 14,111 8,701 8, Light Rail Shuttles Altamont Commuter Express 4,750 4,750 4, Highway 17 Express (89) Monterey-San Jose Express Service Contribution to Other Agencies 740 8,740 8,929 (189) Debt Service 20,478 20,478 18,376 2,102 Contingencies 2,000 1,321-1,321 Total other expenses 63,198 62,108 58,414 3,694 Total operating and other expenses 398, , ,130 12,716 Change in net position, on a budgetary basis $ 3,315 $ 3,315 $ 41,876 $ 38,561 (continued on next page) NOTE: Totals and subtotals may not be precise due to independent rounding 2-103
151 SANTA CLARA VALLEY TRANSPORTATION AUTHORITY Budgetary Comparison Schedule - Enterprise Fund (continued) VTA Transit Fund For the year ended June 30, 2015 (In thousands) Adopted Final Favorable Budget Budget Actual (Unfavorable) Change in net position, on a budgetary basis $ 3,315 $ 3,315 $ 41,876 $ 38,561 Reconciliation of net income on a budgetary basis to net income on a GAAP Basis: Capital Contributions 49,136 Project Expenditure (4,265) Capital Contributions to Other Agencies (4,618) Bond Principal Payment 10,705 Unrealized Loss on investment (98) Debt Reduction Fund interest earnings 1,047 Other non-operating expense (1,729) Other non-budgetary revenues/(expenses) (1,882) Pension expense related to GASB 68 Implementation 2,701 Transfers for Capital 30,120 Depreciation (65,677) Net change in net position, on a GAAP Basis $ 57,
152 SANTA CLARA VALLEY TRANSPORTATION AUTHORITY Combining Statement of Fiduciary Net Position Retiree Trust Funds June 30, 2015 (In thousands) ATU Pension Trust ASSETS Restricted assets: Cash and cash equivalents 753 OPEB Trust Spousal Medical ATU Medical Trusts Vision/ Medical Total Medical Trusts $ $ 980 $ 1 $ - $ 1 $ 1,734 Investments 487, ,008 13,219 9,271 22, ,035 Receivables 1, ,200 Due from other agencies Other asset Total assets 489, ,922 13,220 9,271 22, ,105 LIABILITIES Restricted liabilities: Accounts payable NET POSITION Restricted for: Pension benefits 489, ,194 Other post-employment benefits - 275, ,427 Spousal medical benefits ,219-13,219 13,219 Retiree dental and vision benefits ,271 9,271 9,271 TOTAL NET POSITION $ 489,194 $ 275,427 $ 13,219 $ 9,271 $ 22,490 $ 787,111 Total 2-105
153 SANTA CLARA VALLEY TRANSPORTATION AGENCY Combining Statement of Changes in Fiduciary Net Position Retiree Trust Funds For the Year ended June 30, 2015 (In thousands) ATU ATU Medical Trusts Pension OPEB Spousal Vision/ Total Trust Trust Medical Dental Medical Trusts Total ADDITIONS Contributions $ 25,590 $ 12,093 $ 1,492 $ 372 $ 1,864 $ 39,547 Investment earnings: Investment income 28,054 10, ,029 Net appreciation/(depreciation) in the fair value of investments (9,622) 2, ,032 (5,734) Investment expense (2,337) (271) (2) (2) (4) (2,612) Net investment income 16,095 13, ,033 30,683 TOTAL ADDITIONS 41,685 25,648 2, ,897 70,230 DEDUCTIONS Benefit payments 33,418 10,433 1, ,844 45,695 Administrative expenses TOTAL DEDUCTIONS 33,716 10,530 1, ,859 46,105 CHANGE IN NET POSITION 7,969 15, ,038 24,125 NET POSITION, BEGINNING OF YEAR 481, ,309 12,737 8,715 21, ,986 NET POSITION, END OF YEAR $ 489,194 $ 275,427 $ 13,219 $ 9,271 $ 22,490 $ 787,
154 SANTA CLARA VALLEY TRANSPORTATION AUTHORITY Combining Statement of Fiduciary Assets and Liabilities Agency Funds June 30, 2015 (In thousands) Measure B BAAQMD SB83 VRF Ancillary Program Agency Program Total Assets Restricted assets: Cash and cash equivalents $ 1,141 $ 5,789 $ 143 $ 7,073 Investments 3,601 17,220-20,821 Total Assets 4,742 23, ,894 Liabilities Liabilities payable from restricted assets: Accounts Payable Program payable 4,742 22, ,706 Total Liabilities Payable from Restricted Assets $ 4,742 $ 23,009 $ 143 $ 27,
155 SANTA CLARA VALLEY TRANSPORTATION AUTHORITY Combining Statement of Changes in Fiduciary Assets and Liabilities Agency Funds June 30, 2015 (In thousands) Balance Balance BAAQMD Program July 1, 2014 Increase Decrease June 30, 2015 Restricted assets: Cash and cash equivalents $ 55 $ 1,086 $ - $ 1,141 Investments 4,867-1,266 3,601 Total restricted assets $ 4,922 $ 1,086 $ 1,266 $ 4,742 Liabilities payable from restricted assets: Accounts Payable $ 4 $ - $ 4 $ - Program payable 4, ,742 Total liabilities payable from restricted assets $ 4,922 $ - $ 180 $ 4,742 SB83 VRF Program Restricted assets: Cash and cash equivalents $ 1,959 $ 3,830 $ - $ 5,789 Investments 18,773-1,553 17,220 Total restricted assets $ 20,732 $ 3,830 $ 1,553 $ 23,009 Liabilities payable from restricted assets: Accounts Payable $ 37 $ 151 $ - $ 188 Program payable 20,695 2,126-22,821 Total liabilities payable from restricted assets $ 20,732 $ 2,277 $ - $ 23,009 Measure B Ancillary Program Restricted assets: Cash and cash equivalents $ 143 $ - $ - $ 143 Total restricted assets $ 143 $ - $ - $ 143 Liabilities payable from restricted assets: Program payable $ 143 $ - $ - $ 143 Total liabilities payable from restricted assets $ 143 $ - $ - $ 143 Total - All Agency Funds Restricted assets: Cash and cash equivalents $ 2,157 $ 4,916 $ - $ 7,073 Investments 23,640-2,819 20,821 Total restricted assets $ 25,797 $ 4,916 $ 2,819 $ 27,894 Liabilities payable from restricted assets: Account Payable $ 41 $ 151 $ 4 $ 188 Program payable 25,756 2, ,706 Total liabilities payable from restricted assets $ 25,797 $ 2,277 $ 180 $ 27,
156 THIS PAGE IS INTENTIONALLY LEFT BLANK
157 SECTION 3 STATISTICAL SECTION FINANCIAL TRENDS: These schedules contain trend information to help the reader understand how VTA s financial performance and financial condition have changed over time: Table 1 Changes in Net Position Table 2 Net Position by Components Table 3 Fund Balances and Changes in Fund Balances, Governmental Funds Table 4 Current Ratio Table 5 Operating Revenues and Operating Expenses Table 6 Non Operating Assistance and Interest Income Table 7 Targeted Operating Reserves REVENUE CAPACITY: These schedules contain information to help the reader assess VTA s most significant local revenue source, the sales tax: Table 8 Revenue Base and Revenue Rates Table 9 Overlapping Revenue Table 10 Principal Sales Tax Payers by Segments DEBT CAPACITY: These schedules present information to help the reader assess the affordability of VTA s current levels of outstanding debt and VTA s ability to issue additional debt in the future: Table 11 Total Outstanding Debt by Type Table 12 Ratios of Outstanding Debt Table 13 Direct and Overlapping Debt and Debt Limitation Table 14 Pledged Revenue Coverage Half-Cent Sales Tax Revenue Bonds Table 15 Pledged Revenue Coverage 2000 Measure A Half-Cent Sales Tax Revenue Bonds Table 16 Projected Pledged Revenue Coverage DEMOGRAPHIC AND ECONOMIC INFORMATION: These schedules offer demographic and economic indicators to help the reader understand the environment within which VTA s financial activities take place: Table 17 Population Trends Table 18 Income and Unemployment Rates Table 19 Wage and Salary Employment by Industry (Annual Average) Table 20 Silicon Valley Major Employers OPERATING INFORMATION: Table 21 Operating Indicators Table 22 Farebox Recovery Ratio Table 23 Revenue Miles Table 24 Passenger Miles Table 25 Selected Statistical Data Table 26 System Data Table 27 Employees Table 28 Capital Assets Source: Unless otherwise indicated, the source of information presented in the Statistical Section is VTA s current or prior years CAFR.
158 THIS PAGE IS INTENTIONALLY LEFT BLANK
159 3-1 Table 1-1 SANTA CLARA VALLEY TRANSPORTATION AUTHORITY Financial Trends - Changes in Net Position Ten Years Ended June 30, 2015 (In thousands) Fiscal Years EXPENSES Business-type activities: Operations and Operating Projects $ 339,857 $ 321,059 $ 344,469 $ 343,973 $ 338,771 $ 343,302 $ 364,723 $375,086 $392,042 $ 407,618 Caltrain Subsidy 14,801 15,237 15,416 15,878 15,878 14,135 10,207 13,700 7,291 8,390 Capital Expenses on behalf of, and contribution to other agencies 27,399 7,272 19,331 42,626 81,714 66,782 80, ,794 93,952 61,445 Altamont Commuter Express Subsidy 2,470 2,542 2,621 2,707 2,707 2,706 2,707 2,939 3,019 3,097 Interest Expense 11,562 13,672 12,214 11,651 20,583 23,536 31,307 31,655 27,088 15,204 Other Expenses 6,972 4,636 3,280 5,446 7,268 15,434 8,059 5,865 11,096 5,734 Benefit Payments 11,538 14,285 10,513 9,826 7,693 8,410 11,419 10,689 $ 17,947 8,881 Total Business-Type Activities Expenses 414, , , , , , , , , ,369 Governmental activities: Operations and operating projects 5,982 6,528 6,450 8,840 7,164 7,196 6,692 7,622 7,544 8,071 Contribution to agencies Capital projects for the benefit of other agencies 80,763 45,806 43,798 26,398 19,402 21,091 19,052 34,245 36,184 20,127 Total governmental activities expenses 86,745 52,334 50,248 35,238 26,566 29,154 25,781 41,892 43,796 28,366 Total primary government expenses $ 501,344 $ 431,037 $ 458,092 $ 467,345 $ 501,180 $ 503,459 $ 534,286 $620,620 $596,231 $ 538,735 PROGRAM REVENUES Business-type activities: Charges for services $ 36,926 $ 37,876 $ 38,053 $ 38,439 $ 38,830 $ 40,014 $ 40,070 $ 41,821 $ 42,420 $ 43,054 Operating grants 114, , , , , , , , , ,796 Capital grants 22, , ,443 82,175 92, , , , , ,421 Total business-type activities program revenues 174, , , , , , , , , ,271 Governmental activities: Charges for services 2,290 2,397 2,475 2,618 2,606 2,520 2,503 2,520 2,519 2,526 Operating grants 850 1,023 2,193 1,496 1,854 2,127 2,110 1,775 2,424 2,096 Capital grants 83,207 48,180 45,109 29,479 22,314 24,051 21,530 37,612 38,989 22,964 Total governmental activities program revenues 86,347 51,600 49,777 33,593 26,774 28,698 26,143 41,907 43,932 27,586 Total primary government revenues $ 260,559 $ 429,906 $ 367,778 $ 269,144 $ 285,132 $ 354,819 $ 322,216 $499,255 $428,920 $ 482,857 NET PROGRAM (EXPENSES)/REVENUES Business-type activities $ (240,387) $ (397) $ (89,843) $ (196,556) $ (216,256) $ (148,184) $ (212,432) ($121,380) ($167,447) $ (55,098) Governmental activities (398) (734) (471) (1,645) 208 (456) (780) Total primary government net program (expenses)/revenues $ (240,785) $ (1,131) $ (90,314) $ (198,201) $ (216,048) $ (148,640) $ (212,070) ($121,365) ($167,311) $ (55,878)
160 3-2 Table 1-2 SANTA CLARA VALLEY TRANSPORTATION AUTHORITY Financial Trends - Changes in Net Position Ten Years Ended June 30, 2015 (In thousands) Fiscal Years GENERAL REVENUES AND OTHER CHANGES IN NET POSITION Business-type activities: Sales tax revenue $ 195,453 $ 325,037 $ 323,575 $ 274,903 $ 279,342 $ 306,456 $ 332,847 $ 395,163 $ 417,486 $ 446,374 Investment income 10,537 27,288 22,511 16,862 7,352 11,039 19, ,861 9,420 Proceeds from sale of land ,300 4,052-16,732 Federal subsidy for Build America Bonds ,848 9,399 9,126 8,755 8,715 Other income 9,158 1,347 3,523 3,385 3,241 6,865 6,007 3,254 7,325 4,261 Special items: Transfer to OPEB Trust - - (101,738) Change in provisions for workers' compensation claims - 23,769 4,662 3,500-5, Total business-type activities 215, , , , , , , , , ,502 Governmental activities: Investment income Other income , Total governmental activities , TOTAL PRIMARY GOVERNMENT 215, , , , , , ,977 $ 412, , ,761 CHANGE IN NET POSITION Business-type activities (25,239) 377, , ,094 73, , , , , ,404 Governmental activities (163) (464) 29 (1,443) (521) Total primary government $ (25,402) $ 376,580 $ 162,719 $ 100,651 $ 73,914 $ 189,042 $ 161,907 $ 290,669 $ 276,418 $ 429,883
161 3-3 TABLE 2 SANTA CLARA VALLEY TRANSPORTATION AUTHORITY Financial Trends - Net Position by Component Ten Years Ended June 30, 2015 (In thousands) Fiscal Years BUSINESS-TYPE ACTIVITIES Net Investment in Capital Assets $ 1,817,396 $ 1,888,879 $ 2,056,769 $ 2,180,768 $ 2,195,790 $ 2,220,118 $ 2,351,676 $ 2,481,805 $ 2,613,290 $ 2,950,181 Restricted 35, , , , , , , , , ,834 Unrestricted 245, , , , , , , , , ,852 Total Business-Type Activities Net Position 2,097,647 2,474,691 2,637,381 2,739,475 2,813,154 3,001,536 3,162,946 3,453,477 3,729,457 3,970,867 GOVERNMENTAL ACTIVITIES Restricted Net Position 1,930 1,466 1, ,444 1,582 2,020 1,499 PRIMARY GOVERNMENT Net investment in Capital Assets 1,817,396 1,888,879 2,056,769 2,180,768 2,195,790 2,220,118 2,351,676 2,481,805 2,613,290 2,950,181 Restricted 37, , , , , , , , , ,333 Unrestricted 245, , , , , , , , , ,852 Total Primary Governmental Net Position $ 2,099,577 $ 2,476,157 $ 2,638,876 $ 2,739,527 $ 2,813,441 $ 3,002,483 $ 3,164,390 $ 3,455,059 $ 3,731,477 $ 3,972,366 ¹ Business-type amount reclassified to match 2010 presentation.
162 3-4 TABLE 3 SANTA CLARA VALLEY TRANSPORTATION AUTHORITY Financial Trends - Fund Balances and Changes in Fund Balances, Governmental Funds Ten Years Ended June 30, 2015 (Modified Accrual Basis of Accounting) (In thousands) REVENUES Member Agency Assessment Revenue $ 2,250 $ 2,329 $ 2,410 $ 2,495 $ 2,495 $ 2,407 $ 2,407 $2,407 $ 2,407 $ 2,407 Federal Technical Studies Operating Assistance Grants , ,235 1,398 1,367 1,014 1,728 1,371 Administrative Fees State and Local Assistance Grants , Federal, State and Local Grant Revenues 83,207 48,180 45,109 29,479 22,314 24,051 21,530 37,612 38,989 22,964 Other Revenues , Investment Earnings Total Revenues 86,582 51,870 50,277 33,795 26,801 29,814 26,278 42,030 44,234 27,845 EXPENDITURES Current: Congestion Management: VTA Labor and Overhead Costs 5,179 5,640 5,680 8,006 6,606 6,814 6,245 7,044 7,160 6,826 Professional Services ,225 Program Expenditures Miscellaneous Contribution to agencies Capital Improvement Projects 80,763 45,806 43,798 26,398 19,402 21,091 19,052 34,245 36,184 20,127 Total Expenditures 86,745 52,334 50,248 35,238 26,566 29,154 25,781 41,892 43,796 28,366 Excess (Deficiency) of Revenues Over Expenditures (163) (464) 29 (1,443) (521) OTHER FINANCING SOURCES (USES): Net Change in Fund Balances $ (163) $ (464) $ 29 $ (1,443) $ 235 $ 660 $ 497 $138 $ 438 $ (521) TOTAL GOVERNMENTAL FUNDS Fiscal Years Restricted Special Revenue Funds 1,930 1,466 1, , ,020 1,499 Total Governmental Funds $ 1,930 $ 1,466 $ 1,495 $ 52 $ 287 $ 947 $ 1,444 $1,582 $ 2,020 $ 1,499

163 TABLE 4 SANTA CLARA VALLEY TRANSPORTATION AUTHORITY Financial Trends Current Ratio Enterprise Funds Ten Years Ended June 30, 2015 The Current Ratio indicates VTA's ability to meet all of its short-term liabilities with liquid assets and is determined by dividing total current assets and restricted assets by all current liabilities and liabilities payable from restricted assets. A Current Ratio of 1 or higher is an indication of financial strength. Current Ratio Current assets exclude 2010 Measure A bond proceeds of $52.6 million. Although bond proceeds are with fiscal agent and categorized as current, these are restricted for 2000 Measure A projects. 3-5

164 TABLE 5 SANTA CLARA VALLEY TRANSPORTATION AUTHORITY Financial Trends Operating Revenues & Operating Expenses VTA Transit Ten Years Ended June 30, 2015 The chart below shows a comparison of operating revenue to expenses. Operating expenses are exclusive of purchased transportation and depreciation to more accurately reflect operating expenses related to direct operating service. Operating Revenue & Operating Expenses ($000's) 350, , , , , ,000 50, Operating Revenues Operating Expenses Operating Revenues and Operating Expenses (In thousands) Operating Revenues $ 36,926 $ 37,876 $ 38,053 $ 38,439 $ 38,830 $ 40,014 $ 39,852 $ 40,772 $ 41,198 $ 41,897 Operating Expenses 274, , , , , , , , , ,
165 TABLE 6 SANTA CLARA VALLEY TRANSPORTATION AUTHORITY Financial Trends Non-Operating Assistance and Interest Income Enterprise Funds Ten Years Ended June 30, 2015 (In thousands) The following chart illustrates trends in selected non-operating revenue sources. Sales tax revenue is the largest non-operating revenue source shown in the following graph. This is the third year of collection for 2008 Measure B 1/8-cent BART Operating Sales Tax revenue and the tenth year of collection for 2000 Measure A 1/2-cent Sales Tax revenue. 250, , , ,000 50,000 0 Non-Operating Assistance & Interest Income ($000's) /2 Cent Sales Tax Revenue /2 Cent Measure A Sales Tax /8 Cent BART Operating Sales Tax State Operating Grants Federal Operating and Other Grants Investment Income Non-Operating Assistance and Interest Income (In thousands) /2 Cent Sales Tax Revenue $ 157,283 $ 163,676 $ 163,038 $ 137,642 $ 140,037 $ 153,601 $ 166,567 $ 176,716 $ 186,431 $ 199, /2 Cent Measure A Sales Tax Revenue ¹ /8 Cent BART Operating Sales Tax Revenue ² State and local Operating Grants 38,170-81, , , , , , ,305-67, ,855-95, ,280-98, ,533 41, , ,302 44, , ,653 47, ,243 Federal Operating and Other Grants 33,565 35,514 22,425 81,488 59,100 42,225 42,286 39,364 42,230 24,553 Investment Income 6,457 11,304 20,370 15,341 5,764 10,067 18, ,555 9,118 1 The collection of VTA's 2000 Measure A Sales Tax started on April 1, The collection of 1/8 cent sales tax for BART Operating started on July 1,
166 TABLE 7 SANTA CLARA VALLEY TRANSPORTATION AUTHORITY Financial Trends Targeted Operating Reserves VTA Transit Fund Ten Years Ended June 30, 2015 The policy adopted by the VTA Board established an operating reserve goal of 15% of final operating budget. To calculate the actual reserve at fiscal year end, total current assets are reduced by total current liabilities (except current portion of long-term debt) to determine current net position. Current Net Position is then reduced by inventory and other current assets to reach a current operating reserve total. $120,000 $100,000 $80,000 $60,000 $40,000 $20,000 $0 Targeted Reserves ($000's) Operating Reserves Target Operating Reserves, June (In thousands) Current Assets, 4 excluding restricted asset $ 113,717 $ 158,291 $ 120,374 $ 103,697 $ 104,933 $ 108,396 $ 106,085 $ 101,726 $ 110,906 $ 124,284 Total Current Liabilities, excluding restricted liability (37,945) (41,602) (44,953) (33,716) (30,950) (33,484) (29,547) (24,329) (29,790) (36,878) Current Net Position $ 75,772 $ 116,689 $ 75,421 $ 69,981 $ 73,983 $ 74,912 $ 76,538 $ 77,397 $ 81,116 $ 87,406 Inventory & Other Current Assets 5 (20,361) (20,234) (20,791) (23,936) (22,126) (20,317) (20,270) (20,373) (21,289) (24,469) Operating Reserves, June 30 $ 55,411 $ 96,455 $ 54,630 $ 46,045 $ 51,857 $ 54,595 $ 56,268 $ 57,024 $ 59,827 $ 62,937 Operating Reserves Target $ 50,081 $ 52,599 $ 54,630 $ 55,760 $ 51,857 $ 54,595 $ 56,268 $ 57,024 $ 59,827 $ 62,937 (15% of Budgeted Expenses) 1 In FY 2010, the operating reserve target is 15% of final operating budget at June 30. In Prior years, it was based on 15% of adopted operating budget. 2 Starting FY 2011, the operating reserve target is based on 15% of subsequent year's operating budget. 3 Starting FY 2012, the current assets balance includes a transfer to the following reserve accounts: local share of capital projects, debt reduction, and sales tax stabilization. 4 Includes transfer to debt reduction fund of $50 M. 5 Starting FY2008, this includes inventory and other current assets; prior years included inventory only. 3-8
167 3-9 TABLE 8 SANTA CLARA VALLEY TRANSPORTATION AUTHORITY Revenue Capacity Revenue Base and Revenue Rates Ten Year Ended June 30, 2015 Fiscal Years Passenger Fares 1 ('000) $ 34,335 $ 35,242 $ 35,830 $ 36,184 $ 36,857 $ 38,106 $ 37,744 $ 38,331 $ 38,372 $ 39,108 Percentage Increase/(Decrease) from Prior Year 7.1 % 2.6 % 1.7 % 1.0 % 1.9 % 3.4 % (0.9)% 1.6% 0.1% 1.9% Revenue Base Number of Passengers 2 39,217,851 41,990,098 43,555,049 45,264,434 41,733,376 41,409,630 42,426,797 43,174,646 43,428,492 43,944,096 Percentage Increase/(Decrease) from Prior Year 5.8 % 7.1 % 3.7 % 3.9 % (7.8)% (0.8)% 2.5 % 1.8% 0.6 % 1.2 % Fare Structure Adult Local Fare $ 1.75 $ 1.75 $ 1.75 $ 1.75 $ 2.00 $ 2.00 $ 2.00 $ 2.00 $ 2.00 $ 2.00 Youth Local Fare Senior/Disabled Local Fare Sales Tax Revenues (In thousands) /2 Cent Sales Tax 3 $ 157,283 $ 163,676 $ 163,038 $ 137,642 $ 140,037 $ 153,601 $ 166,567 $ 176,716 $ 186,431 $ 199, Measure A 1/2 Cent Sales Tax 4 38, , , , , , , , , , /8 Cent BART Operating Sales Tax ⁵ ,914 44,753 47,500 Total Sales Tax Revenue Receipts 6 $ 195,453 $ 325,037 $ 323,575 $ 274,903 $ 279,342 $ 306,456 $ 332,847 $ 395,163 $ 417,486 $ 446,374 Percentage Increase/(Decrease) from Prior Year /2 Cent Sales Tax 8.5 % 4.1 % (0.4)% (15.6)% 1.7 % 9.7 % 8.4 % 6.1% 5.5 % 6.9 % 2000 Measure A 1/2 Cent Sales Tax N/A % (0.5)% (14.5)% 1.5 % 9.7 % 8.8 % 6.2% 5.5 % 7.2 % /8 Cent BART Operating Sales Tax N/A N/A N/A N/A N/A N/A N/A N/A 6.8 % 6.1 % 1 Includes fares for directly operated transit services such as bus, light rail, and shuttle services. 2 Represents system ridership total boarding. Source: VTA Operations Division 3 The 1976 half-cent sales tax was approved by County voters in 1976 to fund VTA's transit operations and transportation improvement. 4 The 2000 Measure A half-cent sales tax was approved by County voters in 2000 to fund specific transportation improvement projects. The collection of this half-cent tax measure started in April The /8 cent Sales Tax was approved by County voters in 2008 to fund BART operating activities. The collection of this 1/8 cent tax measure started in July VTA receives the sales tax based on the total taxable sales activity in the County.
168 TABLE 9 SANTA CLARA VALLEY TRANSPORTATION AUTHORITY Revenue Capacity - Overlapping Revenue Sales Tax Rates Ten Years Ended June 30, 2015 Fiscal Year State City VTA 1 Total % 1.00% 1.00% 8.25% % 1.00% 1.00% 8.25% % 1.00% 1.00% 8.25% % 1.00% 1.00% 9.25% % 1.00% 1.00% 9.25% % 1.00% 1.00% 9.25% % 1.00% 1.00% 8.25% % 1.00% 1.12% 8.75% % 1.00% 1.12% 8.75% % 1.00% 1.12% 8.75% 1 VTA has three specific sales tax measures approved by the voters. The 1976 half-cent sales tax measure was approved by voters in 1976 and does not have a sunset clause. The 2000 Measure A half-cent sales tax was approved in the 2000 General Election and became effective on April 1, The 30-year sales tax measure will sunset on March 31, The /8-cent sales tax was approved by County voters in 2008 to fund BART Operating and maintenance. The collection of this 1/8-cent tax measure started in July There was a partial year collection of 1996 Measure B Sales Tax which expired on March 31, The collection of VTA's 2000 Measure A Sales Tax started on April 1, California state legislature approved a 1% sales tax increase effective July 1, Source: California Board of Equalization 4 The 1% sales tax increase approved by the California state legislature in 2009 expired on July 1, Source: California Board of Equalization. 5 There was a 0.125% increase for Bart Operation and Maintenance tax effective July 1, Due to the approval of Proposition 30, the statewide base sales and use tax rate increased by 0.25% effective January 1, The higher tax rate will apply for four years- January 1, 2013 through December 31, Effective 4/1/2013, there was a 0.125% increase for Retail Transactions and Use tax. Source: California Board of Equalization 3-10
169 TABLE 10 SANTA CLARA VALLEY TRANSPORTATION AUTHORITY Revenue Capacity - Principal Sales Tax Payers by Segments (In millions) Fiscal Year Fiscal Year 2005 Principal Revenue Payers Rank Percentage of Taxable Sales Amount Rank Percentage of Taxable Sales Amount Total all Other Outlets % $ 15, % $ 10,789 Motor Vehicle & Parts Dealers % 3, % 3,460 Food Services & Drinking Places % 3, % 2,344 Gasoline Stations 4 6.8% 2, % 1,743 General Merchandise Stores 5 6.7% 2, % 2,419 Clothing & Clothing Accessories 6 6.1% 2, % 1,306 Bldg. Matrl. & Garden Equip. & Suppl % 1, % 1,643 Electronics & Appliance Stores 8 3.6% 1, % 297 Food & Beverage Stores 9 3.0% 1, % 955 Miscellaneous Store Retailers % % 2,661 Sport Goods, Hobby, Book & Music % % 330 Furniture & Home Furnishing Stores % % 591 Health & Personal Care Stores % % 341 Non-Store Retailers % % - Total 100.0% $ 38, % $ 28,879 ¹ 2015 data not available at printing ² This category is made up of diverse manufacturers and wholesalers, construction contractors, petroleum producer, and a multitude of professional services. Source: State Board of Equalization, Taxable Sales in California (Sales and Use Tax) 3-11
170 TABLE 11 SANTA CLARA VALLEY TRANSPORTATION AUTHORITY Debt Capacity Total Outstanding Debt by Type Ten Years Ended June 30, 2015 (In thousands) Series 1985 A Equipment 1976 Sales 2000 Sales Total Trust Tax Revenue Tax Revenue Outstanding Fiscal Year Certificates 1 Bonds Bonds Debt , , , , , , , , , , , , , , , , , , ,817 1,036,892 1,274, ,399 1,029,105 1,248, ,007 1,021,127 1,230, , ,255 1,193, , ,711 1,160,765 1 $26.5 million redeemed in FY
171 TABLE 12 SANTA CLARA VALLEY TRANSPORTATION AUTHORITY Debt Capacity - Ratios of Outstanding Debt Ten Years Ended June 30, 2015 Fiscal Year Total Outstanding Debt (In thousands) Total County Taxable Sales¹ (In thousands) Total Debt as a % of Taxable Sales Personal Income² (In thousands) Total Debt as a % of Personal Income Santa Clara County Population (In thousands) Total Debt per Capita ,015 31,623, % 96,092, % 1, ,128 33,131, % 103,501, % 1, ,925 33,476, % 104,331, % 1, ,680 29,009, % 96,315, % 1, ,073 28,720, % 103,636, % 1, ,274,709 32,238, % 111,880, % 1, ,248,504 34,698, % 122,259, % 1, ,230,134 37,013, % 130,624, % 1, ,193,791 38,318, % 131,930, % 1, ,160,765 38,701, % 133,250, % 1, Taxable sales data is available through Fiscal Year FY 2015 assumes a 1% increase over the previous year s numbers. 2 Personal income actual is available through Fiscal Year FYs 2014 and 2015 assume a 1% increase over the previous year s numbers. The total outstanding debt is pledged by VTA s sales tax revenues which were approved by Santa Clara County voters as follows: The 1976 ½-cent Sales Tax Measure in 1976; the 2000 Measure A ½-cent Sales Tax in Collection of the 2000 Measure A ½-cent Sales Tax began in April
172 TABLE 13 SANTA CLARA VALLEY TRANSPORTATION AUTHORITY Debt Capacity Direct and Overlapping Debt and Debt Limitation Santa Clara Valley Transportation Authority does not have overlapping debt with other governments. Santa Clara Valley Transportation Authority does not have a legal debt limit. 3-14
173 TABLE 14 SANTA CLARA VALLEY TRANSPORTATION AUTHORITY Debt Capacity Pledged Revenue Coverage 1976 Half-Cent Sales Tax Revenue Bonds Ten Years Ended June 30, 2015 (In thousands) Fiscal Year Available Revenue Annual Debt Service¹ Sales Tax Revenue Principal Interest² Total Coverage ,283 10,955 11,562 22, ,676 10,855 13,672 24, ,038 11,315 12,214 23, ,642 8,890 11,651 20, , ³ 7,025 16, ,050 9,370 6,748 16, ,567 10,215 8,153 18, ,716 10,400 9,194 19, ,431 10,435 9,766 20, ,221 10,705 7,965 18, This schedule includes Junior and Senior Lien debts. ² Interest is exclusive of interest earned from bond proceeds. 3 This does not include regular principal of $2.9 million due for 1985 Equipment Trust Certificates as this debt was redeemed in FY
174 TABLE 15 SANTA CLARA VALLEY TRANSPORTATION AUTHORITY Debt Capacity - Pledged Revenue Coverage Measure A Half-Cent Sales Tax Revenue Bonds Ten Years Ended June 30, 2015 (In thousands) Fiscal Year Available Revenue Annual Debt Service Sales Tax Revenue Principal Interest 1 Total Coverage ,170-17,467 17,467 n/a ,361-15,202 15, ,537-14,943 14, , ,321 13, ,305-14,156 14, ,518 2,430 33,490 35, ,280 2,525 44,337 46, ,533 2,625 44,262 46, ,302 24,595 45,577 70, ,653 25,775 45,086 70, This is exclusive of interest earned from bond proceeds. 2 Bond indenture requires VTA to maintain coverage ratio of at least Collection of the 2000 Measure A Sales Tax began in April
175 TABLE 16 SANTA CLARA VALLEY TRANSPORTATION AUTHORITY Debt Capacity Projected Pledged Revenue Coverage (Proforma and Unaudited) The table below presents a five-year projection of debt service coverage based on estimates of the 1976 Sales Tax Revenues for the five years ending June 30, 2016 through Sales Tax Revenues and Senior Lien Debt Service Coverage Fiscal Years Ending June 30, (Proforma and Unaudited) (In thousands) Fiscal Year Projected Sales Percent Aggregate Projected Ending June 30 Tax Revenue Increase 1* Debt Service 2 Coverage , % $21, , % 21, , % 21, , % 21, , % 21, The table below presents a five-year projection of debt service coverage for the Measure A Bonds, based on estimates of the 2000 Measure A Sales Tax Revenues for the five years ending June 30, 2016 through Measure A Sales Tax Revenues and Debt Service Coverage Fiscal Years Ending June 30, (Proforma and Unaudited) (In thousands) Fiscal Year Projected Sales Percent Aggregate Projected Ending June 30 Tax Revenue Increase 1* Debt Service 4 Coverage , % $73, , % 73, , % 73, , % 73, , % 73, Source: Growth rates provided by outside economists. 2 Includes actual debt service on the 2007 and 2011 Bonds. Debt Service on the 2008 Bonds is calculated based on the rate established pursuant to the 2008 Swap Agreement, 3.145%. 3 Does not include any additional parity debt. 4 Includes actual debt service on the 2007 and 2010 Bonds. Debt Service on the 2008 Bonds is calculated based on the rate established pursuant to the 2008 Swap Agreement, 3.765%. *No assurance is given that actual results will meet the forecasts of VTA in any way. 3-17
176 TABLE 17 SANTA CLARA VALLEY TRANSPORTATION AUTHORITY Demographic and Economic Data Population Trends According to population estimates provided by the State of California, the number of residents in Santa Clara County is increasing gradually on a yearly basis. The County s population increased by approximately 6.06% in 2015 Census compared to the 2010 Census. A historical summary of population in the County and its incorporated cities is provided in the following table: County of Santa Clara Population Campbell 11,863 24,731 26,843 36,048 38,138 39,349 41,857 Cupertino 3,664 18,216 34,297 40,263 50,546 58,302 59,756 Gilroy 7,348 12,665 21,641 31,487 41,464 48,821 53,000 Los Altos 19,696 24,872 25,769 26,303 27,693 28,976 30,036 Los Altos Hills 3,412 6,862 7,421 7,514 7,902 7,922 8,341 Los Gatos 9,036 23,466 26,906 27,357 28,592 29,413 30,505 Milpitas 6,572 27,149 37,820 50,686 62,698 66,790 72,606 Monte Sereno 1,506 3,074 3,434 3,287 3,483 3,341 3,451 Morgan Hill 3,151 6,485 17,060 23,928 33,556 37,882 41,779 Mountain View 30,889 54,206 58,655 67,460 70,708 74,066 77,914 Palo Alto 52,475 55,999 55,225 55,900 58,598 64,403 66,932 San Jose 204, , , , , ,942 1,016,479 Santa Clara 58,880 87,717 87,700 93, , , ,973 Saratoga 14,861 27,199 29,261 28,061 29,843 29,926 30,799 Sunnyvale 51,898 95, , , , , ,028 Unincorporated 162, , , , ,300 89,960 87,182 County Total 1 641,503 1,066,009 1,295,071 1,497,577 1,682,585 1,781,642 1,889,638 California 15,717,204 18,136,045 23,668,145 29,760,021 33,871,648 37,253,956 38,715,000 1 Totals may not be precise due to independent rounding. Source: U.S. Census; State of California, Department of Finance, Demographic Research Unit. 3-18
177 TABLE 18 SANTA CLARA VALLEY TRANSPORTATION AUTHORITY Demographic and Economic Data - Income and Unemployment Rates Ten Years Ended June 30, 2015 Year Santa Clara County Personal Income (In thousands)¹ ² Santa Clara County Per Capita Personal Income ¹ ² Unemployment Rate³ ,092,804 55, % ,501,849 60, % ,331,553 59, % ,315,176 55, % ,636,350 58, % ,880,131 61, % ,259,021 66, % ,624,491 70, % ,930,736 70, % ,250,043 71, % 1 Bureau of Economic Analysis U.S. Department of Commerce. 2 Actual data is available through Years 2014 and 2015 data are preliminary and assume a 1% increase over prior year. 3 California Employment Development Department. Not seasonally adjusted. 3-19
178 TABLE 19 SANTA CLARA VALLEY TRANSPORTATION AUTHORITY Demographic and Economic Data Wage and Salary Employment by Industry (Annual Average) Ten Years Ending June 30, 2014 (In thousands) Civilian Labor Force ¹ Civilian Employment Civilian Unemployment Civilian Unemployment Rate County 5.5% 4.5% 4.7% 5.9% 11.6% 11.2% 10.1% 8.8% 7.2% 5.2% State of California 5.4% 4.9% 5.4% 7.0% 11.6% 12.2% 12.0% 10.6% 8.5% 7.4% Wage and Salary Employment ² Total Farm Agriculture Construction and Mining Manufacturing Transportation & Public Utilities Wholesale Trade Retail Trade Finance, Insurance & Real Services Government Information N/A N/A N/A N/A N/A N/A N/A N/A N/A 66.2 Total ³ Labor force data are based upon place of residence. Employment includes self-employed, unpaid family, workers domestics, and workers involved in labor-management disputes. Data are benchmarked to FY 2014 is the most recent available data. 2 Wage and salary employment is reported by place of work. Data are benchmarked to Totals may not be precise due to independent rounding. Sources: State of California, Employment Development Department Department of Finance, Statistics & Demographic Research. April Technology Job Market Silicon Valley, CA Q
179 TABLE 20 SANTA CLARA VALLEY TRANSPORTATION AUTHORITY Demographic and Economic Data Silicon Valley Major Employers Current Year and Nine Years ago FY 2015 FY 2006 Company Name Nature of Operations Number of Employees Rank Number of Employees Rank Google Inc. Search, advertising and web software 20, , Apple Inc. Computer electronics 19,000 2 County of Santa Clara County government 17, ,279 1 Cisco Systems, Inc. Design,manufactgure & sell networking equipment 14, ,860 2 Stanford University Research university 13, ,000 3 Kaiser Permanente Integrated healthcare delivery plan 12,500 6 Stanford Health Care Health System 9,981 7 University of California Santa Cruz Public University 8,258 8 Oracle Corp. Hardware and software,cloud 7, ,400 7 Safeway, Inc. Grocery retailer Santa Clara Valley Health & Hospital System Public healthcare system 6, Intel Corp. Semiconductor 6, ,878 9 Lockheed Martin Space Systems Co. Aerospace 5, ,780 5 U.S.Postal Service Mail service 5, San Mateo County Government Agency 5, Tesla Motors Inc. Electric Vehicle Designer & Manufacturer 5, Facebook Inc. Online Social Networking Service 5, ebay Inc. E-commerce Company 4, , Department of Veterans Affairs, Palo Alto Government-run Military Veteran Benefit Health Care System System 4, Gilead Sciences Inc. Biotechnology Company 4, Hewlett-Packard Co. Information Technology Company 4, ,000 4 San Jose State University Public University 4, , Linkedin Corp. Business-oriented social networking service 4, Palo Alto Medical Foundation Not-for-profit healthercare organization and multispecialty group practice 4, County of Monterey County government 4, Source: Silicon Valley/San Jose Business Journal. July 1/, 2015 * Estimate provided by the most recent city and county financial reports because the employer did not provide local employment figure. Ranking is based on low end of range. The concentration of Santa Clara County s productivity is derived primarily from numerous hightechnology and bioscience companies. Public-sector employers continue to rank high among the largest employers in Silicon Valley. As depicted in the chart above, as an employer, Santa Clara County itself, continues to have the largest public-sector employee base with 17,879 workers. The table above lists the largest employers in the Silicon Valley, which encompasses the County and surrounding areas. 3-21
180 TABLE 21 SANTA CLARA VALLEY TRANSPORTATION AUTHORITY Operating Information Operating Indicators Ten Years Ended June 30, 2015 BUS Average Weekday Ridership Vehicle Revenue Miles Fiscal Year Total Ridership Scheduled Miles Scheduled Hours Passenger Miles (000 s) Peak Buses Active Buses Bus Fleet ,938,044 99,966 18,499,971 1,346,841 15,678, , ,646, ,123 18,705,711 1,364,903 15,882, , ,103, ,673 18,784,524 1,389,344 16,013, , ,510, ,820 18,500,655 1,379,428 15,800, , ,983, ,575 17,739,605 1,322,661 15,130, , ,395, ,187 16,990,315 1,269,071 14,376, , ,053, ,583 17,099,227 1,191,992 14,374, , ,432, ,161 17,491,993 1,213,571 14,582, , ,475, ,969 17,835,921 1,367,433 14,817, , ,623, ,214 18,435,525 1,427,554 15,247, , LIGHT RAIL 1 Light rail ridership increased in FY 2006 with the opening of the Vasona Light Rail Extension. Source: VTA Operations Division. Average Weekday Ridership Train Revenue Miles Light Rail Fleet Fiscal Year Total Ridership Scheduled Miles Scheduled Hours Passenger Miles (000 s) Peak Cars ,279, ,137 2,129, ,348 1,993,940 41, ,278,460 32,567 2,220, ,816 2,105,819 54, ,451,136 33,043 2,223, ,576 2,112,080 54, ,754,161 34,305 2,216, ,533 2,105,555 58, ,749,882 31,555 2,182, ,095 2,062,832 50, ,014,504 31,871 2,190, ,452 2,055,872 54, ,373,042 32,716 2,209, ,495 2,065,099 55, ,742,292 34,242 2,199, ,134 2,055,418 58, ,952,965 35,102 2,205, ,021 2,057,106 61, ,320,497 34,935 2,232, ,821 2,081,092 60,
181 TABLE 22 SANTA CLARA VALLEY TRANSPORTATION AUTHORITY Operating Information Farebox Recovery Ratio Ten Years Ended June 30, 2015 The farebox recovery ratio is a measure capturing the percentage of system operated expenses recovered by fare revenue. This ratio is calculated by fare revenue generated from directly operated service (motor bus and light rail) divided by expenses for these same services. Operating expenses consist of bus and light rail modal operating expenses reported annually in the National Transit Database. Farebox Recovery Ratio 16.0% 14.0% 13.9% 13.8% 14.1% 14.2% 14.3% 14.5% 13.6% 13.1% 12.3% % % 10.0% 8.0% 6.0% 4.0% 2.0% 0.0% Farebox Recovery Ratio 13.9% 13.8% 14.1% 14.2% 14.3% 14.5% 13.6% 13.1% 12.3% 12.1% Farebox Revenue ('000) 34,335 35,243 35,830 36,184 36,857 38,106 37,744 38,331 38,372 39,108 Operating Expenses ('000) 247, , , , , , , , , ,925 1 Updated with audited NTD data. 2 Based on proforma and unaudited NTD data. 3-23

182 TABLE 23 SANTA CLARA VALLEY TRANSPORTATION AUTHORITY Operating Information Revenue Miles Ten Years Ended June 30, 2015 The following chart shows total vehicle miles in revenue service. Total Miles (000's) 18,000 16,000 14,000 12,000 10,000 8,000 6,000 4,000 2, Bus Light Rail Paratransit 3-24
Comprehensive Annual Financial Report
 SANTA CLARA VALLEY TRANSPORTATION AUTHORITY Comprehensive Annual Financial Report FISCAL YEAR 2016 For Fiscal Year Ended June 30, 2016 Santa Clara County, California VTA served 10,000 football fans during
SANTA CLARA VALLEY TRANSPORTATION AUTHORITY SAN JOSE, CALIFORNIA
 SANTA CLARA VALLEY TRANSPORTATION AUTHORITY SAN JOSE, CALIFORNIA Comprehensive Annual Financial Report (CAFR) For Fiscal Year Ended June 30, 2017 Prepared by: Finance and Budget Division THIS PAGE IS INTENTIONALLY
Items in this PDF version of the FY 2018 and FY 2019 Proposed Budget can be found using one of the following methods:
 Search Instructions Items in this PDF version of the FY 2018 and FY 2019 Proposed Budget can be found using one of the following methods: 1) Hyperlinks in the Table of Contents. 2) Hyperlinks in the Org
SANTA CLARA VALLEY TRANSPORTATION AUTHORITY CONGESTION MANAGEMENT PROGRAM. June 30, 2008
 SANTA CLARA VALLEY TRANSPORTATION AUTHORITY INDEPENDENT AUDITOR S REPORT, FINANCIAL STATEMENTS AND SUPPLEMENTARY INFORMATION June 30, 2008 FOR THE YEAR ENDED JUNE 30, 2008 Table of Contents Executive Summary...i
CHAPTER 9 FINANCIAL CONSIDERATIONS
 CHAPTER 9 FINANCIAL CONSIDERATIONS 9.1 INTRODUCTION This chapter presents anticipated costs, revenues, and funding for the Berryessa Extension Project (BEP) Alternative and the Silicon Valley Rapid Transit
GOVERNANCE AND AUDIT COMMITTEE AGENDA
 GOVERNANCE AND AUDIT COMMITTEE Thursday, November 1, 2018 4:00 PM Conference Room 157 County Government Center 70 West Hedding Street San Jose, CA AGENDA CALL TO ORDER 1. ROLL CALL 2. PUBLIC PRESENTATIONS:
Chapter 9 Financial Considerations. 9.1 Introduction
 9.1 Introduction Chapter 9 This chapter presents anticipated costs, revenues, and funding for the NEPA BART Extension Alternative. A summary of VTA s financial plan for the BART Extension Alternative is
CHAPTER 9 FINANCIAL CONSIDERATIONS
 CHAPTER 9 FINANCIAL CONSIDERATIONS 9.1 INTRODUCTION This chapter presents anticipated costs, revenues, and funding for the BEP and the SVRTP. A summary evaluation of VTA s financial plan for the proposed
Ad Hoc Financial Stability Committee MINUTES
 Ad Hoc Financial Stability Committee Friday, March 9, 2018 MINUTES CALL TO ORDER The Santa Clara Valley Transportation Authority s (VTA s) Ad Hoc Financial Stability Committee ( Committee ) meeting was
BOARD OF DIRECTORS WORKSHOP MEETING MINUTES
 BOARD OF DIRECTORS WORKSHOP MEETING April 25, 2008 MINUTES 1. CALLED TO ORDER The Workshop Meeting of the Santa Clara Valley Transportation Authority s (VTA) Board of Directors was called to order by Chairperson
Adopted Biennial Budget
 Santa Clara Valley Transportation Authority Adopted Biennial Budget Fiscal Years 21 and 211 July 1, 29 June 3, 21 and July 1, 21 June 3, 211 Search Instructions Items in this PDF version of the FY 21 and
CAMPBELL UNION SCHOOL DISTRICT ANNUAL FINANCIAL REPORT FOR THE YEAR ENDED JUNE 30, 2016
 CAMPBELL UNION SCHOOL DISTRICT ANNUAL FINANCIAL REPORT FOR THE YEAR ENDED TABLE OF CONTENTS FINANCIAL SECTION Independent Auditor s Report 2 Management's Discussion and Analysis 5 Basic Financial Statements
City of La Palma Agenda Item No. 6
 City of La Palma Agenda Item No. 6 MEETING DATE: December 20, 2016 TO: FROM: SUBMITTED BY: CITY COUNCIL CITY MANAGER Sea Shelton, Administrative Services Director AGENDA TITLE: Comprehensive Annual Financial
SAN JOAQUIN REGIONAL RAIL COMMISSION MEASURE B PROGRAM FUND
 MEASURE B PROGRAM FUND Independent Auditors Report, Financial Statements, Supplementary Information and Other Reports For the Year Ended June 30, 2015 MEASURE B PROGRAM FUND JUNE 30, 2015 TABLE OF CONTENTS
Santa Clara Valley Transportation Authority
 Santa Clara Valley Transportation Authority Comprehensive Annual Financial Report For Fiscal Year Ended June 30, 2005 1996 Measure B U.S. 101 Widening Highway Project Paratransit services offer alternatives
For the Fiscal Year Ended June 30, 2015
 SANTA CLARA VALLEY TRANSPORTATION AUTHORITY 2000 Measure A Transit Improvement Program [A Fund of the Santa Clara Valley Transportation Authority] Independent Accountant s Report on Compliance Examination
SANTA CLARA VALLEY TRANSPORTATION AUTHORITY FOR FISCAL YEAR ENDED JUNE 30, 2017
 INDEPENDENT AUDITOR S REPORT, MANAGEMENT S DISCUSSION AND ANALYSIS, BASIC FINANCIAL STATEMENTS AND REQUIRED SUPPLEMENTARY INFORMATION FOR FISCAL YEAR ENDED JUNE 30, 2017 WITH COMPARATIVE INFORMATION FOR
FY COMPREHENSIVE ANNUAL FINANCIAL REPORT
 FY 2017-18 COMPREHENSIVE ANNUAL FINANCIAL REPORT COMPREHENSIVE ANNUAL FINANCIAL REPORT FOR THE FISCAL YEAR ENDED JUNE 30, 2018 CITY OF STOCKTON, CALIFORNIA Prepared and Issued by Administrative Services
BUCKEYE ELEMENTARY SCHOOL DISTRICT NO. 33
 BUCKEYE ELEMENTARY SCHOOL DISTRICT NO. 33 Comprehensive Annual Financial Report Fiscal Year Ended June 30, 2016 25555 West Durango Street Buckeye, Arizona 85326 BUCKEYE, ARIZONA COMPREHENSIVE ANNUAL FINANCIAL
COUNTY OF SANTA CLARA. Single Audit Reports. Basic Financial Statements with Federal Compliance Section. For the Fiscal Year Ended June 30, 2014
 COUNTY OF SANTA CLARA Single Audit Reports Basic Financial Statements with Federal Compliance Section For the Fiscal Year Ended COUNTY OF SANTA CLARA Single Audit Reports For the Fiscal Year Ended Table
HEBER-OVERGAARD UNIFIED SCHOOL DISTRICT NO. 6
 HEBER-OVERGAARD UNIFIED SCHOOL DISTRICT NO. 6 Comprehensive Annual Financial Report Fiscal Year Ended June 30, 2012 3375 Buckskin Canyon Road P.O. Box 547 Heber, Arizona 85928 HEBER, ARIZONA COMPREHENSIVE
BOARD OF DIRECTORS' WORKSHOP MEETING. Friday, April 19, :30 AM PLEASE NOTE CHANGE IN MEETING TIME AGENDA
 BOARD OF DIRECTORS' WORKSHOP MEETING Friday, April 19, 2013 8:30 AM PLEASE NOTE CHANGE IN MEETING TIME Board of Supervisors Chambers County Government Center 70 West Hedding Street San Jose, CA 95110 AGENDA
Celebrating 25 Years of Excellence
 Celebrating 25 Years of Excellence Comprehensive Annual Financial Report Fiscal Year Ended June 30, 2017 Chino Hills, California , CALIFORNIA COMPREHENSIVE ANNUAL FINANCIAL REPORT FISCAL YEAR ENDED JUNE
LIBRARY JOINT POWERS AUTHORITY OF SANTA CLARA COUNTY (A Component Unit of the County of Santa Clara, California)
") (A Component Unit of the County of Santa Clara, California) Independent Auditor s Reports, Management s Discussion and Analysis, Basic Financial Statements, and Required Supplementary Information Table
(A Component Unit of the County of Santa Clara, California) Independent Auditor s Reports, Management s Discussion and Analysis, Basic Financial Statements, and Required Supplementary Information Table
FREMONT UNION HIGH SCHOOL DISTRICT ANNUAL FINANCIAL REPORT FOR THE YEAR ENDED JUNE 30, 2016
 FREMONT UNION HIGH SCHOOL DISTRICT ANNUAL FINANCIAL REPORT FOR THE YEAR ENDED TABLE OF CONTENTS FINANCIAL SECTION Independent Auditor s Report 2 Management's Discussion and Analysis 5 Basic Financial
LOS ANGELES COUNTY METROPOLITAN TRANSPORTATION AUTHORITY
 LOS ANGELES COUNTY METROPOLITAN TRANSPORTATION AUTHORITY INDEPENDENT AUDITOR S REPORT ON SCHEDULE OF REVENUES AND EXPENDITURES FOR MEASURE R SPECIAL REVENUE FUND FOR THE YEAR ENDED JUNE 30, 2013 (WITH
SAN JOSE, CALIFORNIA. Comprehensive Annual Financial Report. For Fiscal Year Ended June 30, 2004
 SANTA CLARA VALLEY TRANSPORTATION AUTHORITY SAN JOSE, CALIFORNIA Comprehensive Annual Financial Report For Fiscal Year Ended June 30, 2004 Prepared by: Fiscal Resources Division SANTA CLARA VALLEY TRANSPORTATION
ALHAMBRA ELEMENTARY SCHOOL DISTRICT NO. 68
 ALHAMBRA ELEMENTARY SCHOOL DISTRICT NO. 68 Comprehensive Annual Financial Report Fiscal Year Ended June 30, 2013 4510 North 37 th Avenue Phoenix, Arizona 85019 PHOENIX, ARIZONA COMPREHENSIVE ANNUAL FINANCIAL
SANTA CLARA VALLEY TRANSPORTATION AUTHORITY SAN JOSE, CALIFORNIA. Comprehensive Annual Financial Report. Year Ended June 30, 2002
 SANTA CLARA VALLEY TRANSPORTATION AUTHORITY SAN JOSE, CALIFORNIA Comprehensive Annual Financial Report Year Ended June 30, 2002 Prepared by: Fiscal Resources Division SANTA CLARA VALLEY TRANSPORTATION
BOARD OF DIRECTORS WORKSHOP MEETING. Friday, April 19, :00 AM PLEASE NOTE MEETING LOCATION AGENDA
 BOARD OF DIRECTORS WORKSHOP MEETING Friday, April 19, 2019 9:00 AM PLEASE NOTE MEETING LOCATION VTA Auditorium 3331 North First Street San Jose, CA 95134 AGENDA To help you better understand, follow, and
CITY OF LAKE ELMO, MINNESOTA COMPREHENSIVE ANNUAL FINANCIAL REPORT FOR THE FISCAL YEAR ENDED DECEMBER 31, 2017
 COMPREHENSIVE ANNUAL FINANCIAL REPORT FOR THE FISCAL YEAR ENDED DECEMBER 31, 2017 PREPARED BY: FINANCE DEPARTMENT CITY OF LAKE ELMO, MINNESOTA FINANCIAL STATEMENTS For the Fiscal Year Ended December 31,
City of Bentonville, Arkansas
 Comprehensive Annual Financial Report For the Year Ended December 31, 2016 Prepared by: Denise Land Finance Director Jake Harper Assistant Finance Director Visit our web site at: www.bentonvillear.com
COUNTY OF SANTA CLARA MEASURE B TRANSPORTATION IMPROVEMENT PROGRAM INDEPENDENT AUDITOR S REPORT AND FUND FINANCIAL STATEMENTS
 MEASURE B TRANSPORTATION IMPROVEMENT PROGRAM INDEPENDENT AUDITOR S REPORT AND FUND FINANCIAL STATEMENTS FOR THE YEAR ENDED JUNE 30, 2017 FOR THE YEAR ENDED JUNE 30, 2017 Table of Contents Page Independent
2000 Measure A Transit Improvement Program
 2000 Measure A Transit Improvement Program Citizens Watchdog Committee Report on Fiscal Year 2015 COMPREHENSIVE ANNUAL REPORT The Citizen Watchdog Committee (CWC) provides this report to inform the community
CHICAGO TRANSIT AUTHORITY. FINANCIAL STATEMENTS AND SUPPLEMENTARY INFORMATION December 31, 2010 and 2009 (With Independent Auditors Report Thereon)
") FINANCIAL STATEMENTS AND SUPPLEMENTARY INFORMATION (With Independent Auditors Report Thereon) Chicago, Illinois FINANCIAL STATEMENTS CONTENTS Independent Auditors Report... 1 Management s Discussion and
FINANCIAL STATEMENTS AND SUPPLEMENTARY INFORMATION (With Independent Auditors Report Thereon) Chicago, Illinois FINANCIAL STATEMENTS CONTENTS Independent Auditors Report... 1 Management s Discussion and
CITY OF ATWATER, CALIFORNIA ANNUAL FINANCIAL REPORT FOR THE FISCAL YEAR ENDED JUNE 30, 2016
 CITY OF ATWATER, CALIFORNIA ANNUAL FINANCIAL REPORT FOR THE FISCAL YEAR ENDED JUNE 30, 2016 Prepared by: Finance Department This page intentionally left blank. Basic Financial Statements Table of Contents
2000 Measure A Transit Improvement Program Citizens Watchdog Committee Annual Report On Fiscal Year 2014
 2000 Measure A Transit Improvement Program Citizens Watchdog Committee Annual Report On Fiscal Year 2014 Comprehensive Annual Report The Citizen Watchdog Committee (CWC) provides this report to inform
KANSAS DEPARTMENT OF TRANSPORTATION
 KANSAS DEPARTMENT OF TRANSPORTATION A DEPARTMENT OF THE STATE OF KANSAS COMPREHENSIVE ANNUAL FINANCIAL REPORT FOR THE FISCAL YEAR ENDED JUNE 30, 2017 NOTE: This information is available in alternative
COMPREHENSIVE ANNUAL FINANCIAL REPORT CITY OF ORMOND BEACH, FLORIDA FISCAL YEAR ENDED SEPTEMBER 30, 2018
 City of Ormond Beach Florida Photo by Sam West Comprehensive Annual Financial Report Fiscal Year Ended September 30, 2018 COMPREHENSIVE ANNUAL FINANCIAL REPORT FISCAL YEAR ENDED Prepared by: Finance Department
SUNNYSIDE UNIFIED SCHOOL DISTRICT NO. 12 COMPREHENSIVE ANNUAL FINANCIAL REPORT FOR THE FISCAL YEAR ENDED JUNE 30, 2015
 COMPREHENSIVE ANNUAL FINANCIAL REPORT FOR THE FISCAL YEAR ENDED JUNE 30, 2015 2238 East Ginter Road Tucson, Arizona 85706 TUCSON, ARIZONA COMPREHENSIVE ANNUAL FINANCIAL REPORT FOR THE FISCAL YEAR ENDED
MARIN COUNTY TRANSIT DISTRICT. San Rafael, California A Component Unit of the County of Marin, California COMPREHENSIVE ANNUAL FINANCIAL REPORT
 San Rafael, California A Component Unit of the County of Marin, California COMPREHENSIVE ANNUAL FINANCIAL REPORT For the Years Ended June 30, 2017 and 2016 (A Component Unit of the County of Marin, California)
County of Santa Clara State of California
 County of Santa Clara State of California Comprehensive Annual Financial Report Recommended Budget Fiscal Year Ended June 30, 2014 Fiscal Year 2012 Emily Harrison Director of Finance , CALIFORNIA 70 West
Peninsula Corridor Joint Powers Board San Carlos, California A Joint Exercise of Powers Agreement among:
 Peninsula Corridor Joint Powers Board San Carlos, California A Joint Exercise of Powers Agreement among: City and County of San Francisco San Mateo County Transit District Santa Clara Valley Transportation
CITY OF PORTERVILLE. Transportation and Transit Funds Audited Financial Statements. Years Ended June 30, 2016 and 2015
 CITY OF PORTERVILLE Transportation and Transit Funds Audited Financial Statements Years Ended June 30, 2016 and 2015 THIS PAGE INTENTIONALLY LEFT BLANK CITY OF PORTERVILLE Transportation and Transit Funds
TRANSBAY JOINT POWERS AUTHORITY
 TRANSBAY JOINT POWERS AUTHORITY Independent Auditor s Reports, Management s Discussion and Analysis, Basic Financial Statements and Other Supplementary Information Table of Contents Page(s) Independent
Chapter 6. Transportation Planning and Programming. Chapter 6
 Chapter 6 Planning and ming Chapter 6 73 Chapter 6 Planning and ming VTA prepares a variety of transportation planning and programming documents that impact Santa Clara County s future mobility. Planning
SANTA CLARA COUNTY SCHOOLS' INSURANCE GROUP. FINANCIAL STATEMENTS June 30, 2017 and 2016
 SANTA CLARA COUNTY SCHOOLS' INSURANCE GROUP FINANCIAL STATEMENTS June 30, 2017 and 2016 FINANCIAL STATEMENTS June 30, 2017 and 2016 CONTENTS INDEPENDENT AUDITOR S REPORT... 1 MANAGEMENT'S DISCUSSION AND
EASTERN SIERRA TRANSIT AUTHORITY ANNUAL FINANCIAL REPORT WITH INDEPENDENT AUDITOR S THEREON. June 30, 2016
 EASTERN SIERRA TRANSIT AUTHORITY ANNUAL FINANCIAL REPORT WITH INDEPENDENT AUDITOR S THEREON June 30, 2016 Annual Financial Report For the Year Ended June 30, 2016 TABLE OF CONTENTS FINANCIAL SECTION Independent
CENTRAL CONTRA COSTA TRANSIT AUTHORITY CONCORD, CALIFORNIA BASIC FINANCIAL STATEMENTS WITH INDEPENDENT AUDITOR S REPORT JUNE 30, 2016
 CENTRAL CONTRA COSTA TRANSIT AUTHORITY CONCORD, CALIFORNIA BASIC FINANCIAL STATEMENTS WITH INDEPENDENT AUDITOR S REPORT JUNE 30, 2016 CENTRAL CONTRA COSTA TRANSIT AUTHORITY JUNE 30, 2016 TABLE OF CONTENTS
CENTRAL CONTRA COSTA TRANSIT AUTHORITY CONCORD, CALIFORNIA BASIC FINANCIAL STATEMENTS WITH INDEPENDENT AUDITOR S REPORT JUNE 30, 2015
 CENTRAL CONTRA COSTA TRANSIT AUTHORITY CONCORD, CALIFORNIA BASIC FINANCIAL STATEMENTS WITH INDEPENDENT AUDITOR S REPORT JUNE 30, 2015 CENTRAL CONTRA COSTA TRANSIT AUTHORITY JUNE 30, 2015 TABLE OF CONTENTS
This page intentionally left blank.
 This page intentionally left blank. , CALIFORNIA COMPREHENSIVE ANNUAL FINANCIAL REPORT FOR THE FISCAL YEAR ENDED JUNE 30, 2017 Prepared By Finance Department This page intentionally left blank. COMPREHENSIVE
CHICAGO TRANSIT AUTHORITY CHICAGO, ILLINOIS
 CHICAGO, ILLINOIS FINANCIAL STATEMENTS AND SUPPLEMENTARY INFORMATION Years Ended (With Independent Auditor s Report Thereon) Chicago, Illinois FINANCIAL STATEMENTS Years Ended TABLE OF CONTENTS Independent
TRANSBAY JOINT POWERS AUTHORITY San Francisco, California. Annual Financial Report. For the Year Ended June 30, 2017
 TRANSBAY JOINT POWERS AUTHORITY San Francisco, California Annual Financial Report THIS PAGE INTENTIONALLY LEFT BLANK. Table of Contents Page(s) Independent Auditor's Report... 1-2 Management s Discussion
CITY OF LAKE ELMO, MINNESOTA COMPREHENSIVE ANNUAL FINANCIAL REPORT FOR THE FISCAL YEAR ENDED DECEMBER 31, 2016
 COMPREHENSIVE ANNUAL FINANCIAL REPORT FOR THE FISCAL YEAR ENDED DECEMBER 31, 2016 PREPARED BY: FINANCE DEPARTMENT CITY OF LAKE ELMO, MINNESOTA FINANCIAL STATEMENTS For the Fiscal Year Ended December 31,
LOS GATOS-SARATOGA JOINT UNION HIGH SCHOOL DISTRICT ANNUAL FINANCIAL REPORT FOR THE YEAR ENDED JUNE 30, 2016
 LOS GATOS-SARATOGA JOINT UNION HIGH SCHOOL DISTRICT ANNUAL FINANCIAL REPORT FOR THE YEAR ENDED Recieved 12/09/2016 TABLE OF CONTENTS FINANCIAL SECTION Independent Auditor s Report 2 Management's Discussion
Comprehensive Annual Financial Report
 Santa Clara Valley Transportation Authority Comprehensive Annual Financial Report For Fiscal Year Ended June 30, 2006, Santa Clara County, California Santa Clara Valley Transportation Authority Comprehensive
SANTA CLARA COUNTY CIVIL GRAND JURY REVIEW OF AUDITS AND FINANCIAL REPORTS
 2004-2005 SANTA CLARA COUNTY CIVIL GRAND JURY REVIEW OF AUDITS AND FINANCIAL REPORTS The 2004-2005 Santa Clara County Civil Grand Jury (Grand Jury) examined documents received from local government entities
Analysis of the Alameda County Transportation Expenditure Plan Prepared by Alameda County Transportation Commission
 Analysis of the Alameda County Transportation Expenditure Plan Prepared by Alameda County Transportation Commission Discussion: In 1986, voters approved Measure B, a 1/2 cent sales tax, to fund transportation
City of Union City. Measure B Funds. Union City, California. Financial Statements and Independent Auditors Reports
 Measure B Funds Union City, California Financial Statements and Independent Auditors Reports Comprehensive Annual Financial Report Table of Contents Independent Auditors Report... 1 Financial Statements:
SUBJECT: SEE BELOW DATE: April 13, 2017 ANNUAL PAVEMENT MAINTENANCE STATUS REPORT & FUNDING STRATEGY UPDATE.
 COUNCIL AGENDA: 4/25/17 ITEM: 6.2 TO: HONORABLE MAYOR AND CITY COUNCIL FROM: Toni J. Taber, CMC City Clerk SUBJECT: SEE BELOW DATE: April 13, 2017 SUBJECT: ANNUAL PAVEMENT MAINTENANCE STATUS REPORT & FUNDING
SUNNYSIDE UNIFIED SCHOOL DISTRICT NO. 12 COMPREHENSIVE ANNUAL FINANCIAL REPORT FOR THE FISCAL YEAR ENDED JUNE 30, 2014
 COMPREHENSIVE ANNUAL FINANCIAL REPORT FOR THE FISCAL YEAR ENDED JUNE 30, 2014 2238 East Ginter Road Tucson, Arizona 85706 TUCSON, ARIZONA COMPREHENSIVE ANNUAL FINANCIAL REPORT FOR THE FISCAL YEAR ENDED
TOLLESON UNION HIGH SCHOOL DISTRICT NO. 214
 TOLLESON UNION HIGH SCHOOL DISTRICT NO. 214 Comprehensive Annual Financial Report Fiscal Year Ended June 30, 2017 9801 West Van Buren Street Tolleson, Arizona 85353 TOLLESON, ARIZONA COMPREHENSIVE ANNUAL
BOARD OF DIRECTORS WORKSHOP/SPECIAL MEETING. Friday, April 21, :00 AM PLEASE NOTE MEETING DATE, TIME, AND LOCATION AGENDA
 BOARD OF DIRECTORS WORKSHOP/SPECIAL MEETING Friday, April 21, 2017 9:00 AM PLEASE NOTE MEETING DATE, TIME, AND LOCATION Board of Supervisors Chambers County Government Center 70 West Hedding Street San
The Future Scenarios
 The Future Scenarios Developing the Scenarios Once the policy approach for each scenario was defined, the financial, service, and capital assumptions were developed further and are detailed in three supporting
GAVILAN JOINT COMMUNITY COLLEGE DISTRICT MEASURE E BOND CONSTRUCTION FUND GILROY, CALIFORNIA
 GAVILAN JOINT COMMUNITY COLLEGE DISTRICT MEASURE E BOND CONSTRUCTION FUND GILROY, CALIFORNIA FINANCIAL STATEMENTS WITH INDEPENDENT AUDITOR'S REPORTS YEAR ENDED JUNE 30, 2016 GAVILAN JOINT COMMUNITY COLLEGE
AGENDA Bacciocco Auditorium, 2 nd Floor 1250 San Carlos Avenue, San Carlos CA 94070
 BOARD OF DIRECTORS 2011 SEAN ELSBERND, CHAIR OMAR AHMAD, VICE CHAIR JOSÉ CISNEROS NATHANIEL P. FORD, SR. ASH KALRA LIZ KNISS ARTHUR L. LLOYD ADRIENNE TISSIER KEN YEAGER MICHAEL J. SCANLON EXECUTIVE DIRECTOR
QUEEN CREEK UNIFIED SCHOOL DISTRICT NO. 95
 QUEEN CREEK UNIFIED SCHOOL DISTRICT NO. 95 Comprehensive Annual Financial Report Fiscal Year Ended June 30, 2014 20217 East Chandler Heights Road Queen Creek, Arizona 85142 QUEEN CREEK, ARIZONA COMPREHENSIVE
SANTA CLARA COUNTY CIVIL GRAND JURY EXAMINATION OF AUDITS AND FINANCIAL REPORTS
 2001-2002 SANTA CLARA COUNTY CIVIL GRAND JURY EXAMINATION OF AUDITS AND FINANCIAL REPORTS INTRODUCTION California Penal Code Sections 925 and 925(a) specifically authorize the Civil Grand Jury to examine
BUCKEYE ELEMENTARY SCHOOL DISTRICT NO. 33
 BUCKEYE ELEMENTARY SCHOOL DISTRICT NO. 33 Comprehensive Annual Financial Report Fiscal Year Ended June 30, 2015 25555 West Durango Street Buckeye, Arizona 85326 BUCKEYE, ARIZONA COMPREHENSIVE ANNUAL FINANCIAL
Caltrain Service Preparing for FY2012 Caltrain Benefits Environment, Economy, Quality of Life
 Caltrain Service Preparing for FY2012 Caltrain Benefits Environment, Economy, Quality of Life If traveling via automobile, Caltrain riders would increase regional CO2 emissions by 89,850 metric tons or
CHINLE UNIFIED SCHOOL DISTRICT NO. 24
 CHINLE UNIFIED SCHOOL DISTRICT NO. 24 Comprehensive Annual Financial Report Fiscal Year Ended June 30, 2012 PO Box 587 Chinle, Arizona 86503 CHINLE, ARIZONA COMPREHENSIVE ANNUAL FINANCIAL REPORT FOR THE
SAN JOSE CAPITAL OF SILICON VALLEY
 COUNCIL AGENDA: 6/9/15 ITEM: CITY OF SAN JOSE CAPITAL OF SILICON VALLEY Memorandum TO: HONORABLE MAYOR AND CITY COUNCIL FROM: Kerrie Romanow SUBJECT: SEE BELOW DATE: Approved Date s'mis SUBJECT: ADOPTION
HIGLEY UNIFIED SCHOOL DISTRICT NO. 60
 HIGLEY UNIFIED SCHOOL DISTRICT NO. 60 Comprehensive Annual Financial Report Fiscal Year Ended June 30, 2015 2935 South Recker Road Gilbert Arizona 85295 GILBERT, ARIZONA COMPREHENSIVE ANNUAL FINANCIAL
SUNNYSIDE UNIFIED SCHOOL DISTRICT NO. 12 COMPREHENSIVE ANNUAL FINANCIAL REPORT FOR THE FISCAL YEAR ENDED JUNE 30, 2012
 COMPREHENSIVE ANNUAL FINANCIAL REPORT FOR THE FISCAL YEAR ENDED JUNE 30, 2012 2238 East Ginter Road Tucson, Arizona 85706 TUCSON, ARIZONA COMPREHENSIVE ANNUAL FINANCIAL REPORT FOR THE FISCAL YEAR ENDED
WEST COUNTY WASTEWATER DISTRICT Richmond, CA
 WEST COUNTY WASTEWATER DISTRICT Richmond, CA COMPREHENSIVE ANNUAL FINANCIAL REPORT For the Fiscal Years Ended June 30, 2017 and June 30, 2016 Prepared by: Business Services Department WEST COUNTY WASTEWATER
WEST BAY SANITARY DISTRICT FINANCIAL STATEMENTS AND INDEPENDENT AUDITOR S REPORT JUNE 30, 2015 * * *
 WEST BAY SANITARY DISTRICT FINANCIAL STATEMENTS AND INDEPENDENT AUDITOR S REPORT JUNE 30, 2015 * * * CHAVAN & ASSOCIATES LLP CERTIFIED PUBLIC ACCOUNTANTS 1475 SARATOGA AVE, SUITE 180 SAN JOSE, CA 95129
CITY OF SANTA MONICA, CALIFORNIA Big Blue Bus Fund (An Enterprise Fund of the City of Santa Monica) Financial Statements and Supplementary
 Financial Statements and Supplementary") Financial Statements and Supplementary Information Fiscal Years Ended June 30, 2018 and 2017 (With Independent Auditors Reports Thereon) Fiscal Years Ended June 30, 2018 and 2017 Table of Contents Page
Financial Statements and Supplementary Information Fiscal Years Ended June 30, 2018 and 2017 (With Independent Auditors Reports Thereon) Fiscal Years Ended June 30, 2018 and 2017 Table of Contents Page
TOWNS COUNTY, GEORGIA HIAWASSEE, GEORGIA FINANCIAL STATEMENTS WITH SUPPLEMENTAL MATERIAL FOR THE YEAR ENDED
 HIAWASSEE, GEORGIA FINANCIAL STATEMENTS WITH SUPPLEMENTAL MATERIAL FOR THE YEAR ENDED DECEMBER 31, 2016 FINANCIAL STATEMENTS For the Year Ended December 31, 2016 PAGE INDEPENDENT AUDITOR'S REPORT 1-2 MANAGEMENT'S
Comprehensive Annual Financial Report
 Comprehensive Annual Financial Report Cambrian Commons, Rosemount - Built in 2016 For the Year Ended June 30, 2016 Dakota County Community Development Agency A component unit of Dakota County, Minnesota
SOUTHEASTERN PENNSYLVANIA TRANSPORTATION AUTHORITY. Financial Statements June 30, 2018 and (With Independent Auditors Report Thereon)
") SOUTHEASTERN PENNSYLVANIA TRANSPORTATION AUTHORITY Financial Statements June 30, 2018 and 2017 (With Independent Auditors Report Thereon) SOUTHEASTERN PENNSYLVANIA TRANSPORTATION AUTHORITY YEARS ENDED
SOUTHEASTERN PENNSYLVANIA TRANSPORTATION AUTHORITY Financial Statements June 30, 2018 and 2017 (With Independent Auditors Report Thereon) SOUTHEASTERN PENNSYLVANIA TRANSPORTATION AUTHORITY YEARS ENDED
DEER VALLEY UNIFIED SCHOOL DISTRICT NO. 97
 DEER VALLEY UNIFIED SCHOOL DISTRICT NO. 97 Comprehensive Annual Financial Report Fiscal Year Ended June 30, 2016 20402 North 15 th Avenue Phoenix, Arizona 85027 PHOENIX, ARIZONA COMPREHENSIVE ANNUAL FINANCIAL
Independent Auditors Reports, Basic Financial Statements, Required Supplementary Information, Other Information and Compliance Section
 FIRST 5 CONTRA COSTA CHILDREN AND FAMILIES COMMISSION (a Component Unit of the County of Contra Costa, California) Independent Auditors Reports, Basic Financial Statements, Required Supplementary Information,
DEER VALLEY UNIFIED SCHOOL DISTRICT NO. 97 PHOENIX, ARIZONA COMPREHENSIVE ANNUAL FINANCIAL REPORT FOR THE FISCAL YEAR ENDED JUNE 30, 2014
 PHOENIX, ARIZONA COMPREHENSIVE ANNUAL FINANCIAL REPORT FOR THE FISCAL YEAR ENDED JUNE 30, 2014 Issued by: Fiscal Services Department TABLE OF CONTENTS INTRODUCTORY SECTION Letter of Transmittal ASBO Certificate
CITY OF LAGUNA BEACH, CALIFORNIA. Comprehensive Annual Financial Report. For the Fiscal Year Ended June 30, 2015
 CITY OF LAGUNA BEACH, CALIFORNIA Comprehensive Annual Financial Report For the Fiscal Year Ended June 30, 2015 CITY OF LAGUNA BEACH, CALIFORNIA COMPREHENSIVE ANNUAL FINANCIAL REPORT FOR THE FISCAL YEAR
CHICAGO TRANSIT AUTHORITY. FINANCIAL STATEMENTS AND SUPPLEMENTARY INFORMATION December 31, 2011 and 2010 (With Independent Auditors Report Thereon)
") FINANCIAL STATEMENTS AND SUPPLEMENTARY INFORMATION (With Independent Auditors Report Thereon) Chicago, Illinois FINANCIAL STATEMENTS CONTENTS Independent Auditors Report... 1 Management s Discussion and
FINANCIAL STATEMENTS AND SUPPLEMENTARY INFORMATION (With Independent Auditors Report Thereon) Chicago, Illinois FINANCIAL STATEMENTS CONTENTS Independent Auditors Report... 1 Management s Discussion and
BUCKEYE ELEMENTARY SCHOOL DISTRICT NO. 33
 BUCKEYE ELEMENTARY SCHOOL DISTRICT NO. 33 Comprehensive Annual Financial Report Fiscal Year Ended June 30, 2017 25555 West Durango Street Buckeye, Arizona 85326 BUCKEYE, ARIZONA COMPREHENSIVE ANNUAL FINANCIAL
$15 Minimum Wage. November 15, 2016 Item 3.4. City of San José
 $15 Minimum Wage November 15, 2016 Item 3.4 City of San José Context March 2013 Local minimum wage raised from $8 to $10 (Measure D) Adopted by San Jose voters on November 6, 2012 Will increase to $10.40
Deer Valley Unified School District #97
 Deer Valley Unified School District #97 COMPREHENSIVE ANNUAL FINANCIAL REPORT FOR THE YEAR ENDED JUNE 30, 2011 Deer Valley Unified School District Phoenix, Arizona Prepared by: Fiscal Services Department
SAN BERNARDINO COMMUNITY COLLEGE DISTRICT ANNUAL FINANCIAL REPORT JUNE 30, 2017
 SAN BERNARDINO COMMUNITY COLLEGE DISTRICT ANNUAL FINANCIAL REPORT TABLE OF CONTENTS FINANCIAL SECTION Independent Auditor's Report 2 Management Discussion and Analysis 5 Basic Financial Statements - Primary
MARIPOSA COUNTY TRANSIT FUND, CALIFORNIA
 MARIPOSA COUNTY TRANSIT FUND, CALIFORNIA FINANCIAL STATEMENTS TOGETHER WITH INDEPENDENT AUDITOR S REPORT FOR THE YEAR ENDED JUNE 30, 2015 THIS PAGE INTENTIONALLY LEFT BLANK MARIPOSA COUNTY TRANSIT FUND
INVESTING STRATEGICALLY
 11 INVESTING STRATEGICALLY Federal transportation legislation (Fixing America s Surface Transportation Act FAST Act) requires that the 2040 RTP be based on a financial plan that demonstrates how the program
New Hanover County Airport Authority A Component Unit of New Hanover County. Financial Statements and Compliance Year Ended June 30, 2018
 New Hanover County Airport Authority A Component Unit of New Hanover County Financial Statements and Compliance Year Ended June 30, 2018 Contents Financial section Independent auditors report 1-3 Management
MIRACOSTA COMMUNITY COLLEGE DISTRICT ANNUAL FINANCIAL REPORT JUNE 30, 2016
 MIRACOSTA COMMUNITY COLLEGE DISTRICT ANNUAL FINANCIAL REPORT TABLE OF CONTENTS FINANCIAL SECTION Independent Auditor's Report 2 Management's Discussion and Analysis 5 Basic Financial Statements - Primary
UTILITIES COMMISSION, CITY OF NEW SMYRNA BEACH, FLORIDA
 UTILITIES COMMISSION, CITY OF NEW SMYRNA BEACH, FLORIDA (A COMPONENT UNIT OF THE CITY OF NEW SMYRNA BEACH, FLORIDA) COMPREHENSIVE ANNUAL FINANCIAL REPORT FOR THE FISCAL YEARS ENDED SEPTEMBER 30, 2017 AND
Berks Area Regional Transportation Authority. Financial Statements and Supplementary Information. June 30, 2014 and 2013
 Financial Statements and Supplementary Information Table of Contents Page INDEPENDENT AUDITOR'S REPORT 1 to 3 MANAGEMENT'S DISCUSSION AND ANALYSIS 4 to 14 FINANCIAL STATEMENTS Statement of Net Position
Measure R Oversight Committee Annual Report on FY13 Audits
 metro.net/measurer Measure R Oversight Committee Annual Report on FY13 Audits April 1, 2014 Measure R Independent Taxpayers Oversight Committee of Metro On November 4, 2008, Los Angeles County voters approved
DEER VALLEY UNIFIED SCHOOL DISTRICT NO. 97
 DEER VALLEY UNIFIED SCHOOL DISTRICT NO. 97 Comprehensive Annual Financial Report Fiscal Year Ended June 30, 2012 20402 North 15 th Avenue Phoenix, Arizona 85027 PHOENIX, ARIZONA COMPREHENSIVE ANNUAL FINANCIAL
This page intentionally left blank.
 This page intentionally left blank. Table of Contents Introductory Section Page Letter of Transmittal 1 GFOA Certificate of Achievement 5 Organizational Chart 6 List of Principal City Officials 7 Financial
VILLAGE OF FOREST PARK, ILLINOIS. ANNUAL FINANCIAL REPORT Year Ended April 30, 2013
 ANNUAL FINANCIAL REPORT ANNUAL FINANCIAL REPORT CONTENTS Independent Auditor s Report... 1 REQUIRED SUPPLEMENTARY INFORMATION: Management s Discussion and Analysis... 3 BASIC FINANCIAL STATEMENTS: Government-wide
To: Board of Directors Date: December 21, 2017
 To: Board of Directors Date: December 21, 2017 From: Erick Cheung, Director of Finance Reviewed by: SUBJECT: FY 2017 Financial Audit Summary of Issues: The audit for FY 2017 has been completed and enclosed