WEST COUNTY WASTEWATER DISTRICT Richmond, CA
|
|
|
- Victor Austin
- 5 years ago
- Views:
Transcription
1 WEST COUNTY WASTEWATER DISTRICT Richmond, CA COMPREHENSIVE ANNUAL FINANCIAL REPORT For the Fiscal Years Ended June 30, 2017 and June 30, 2016 Prepared by: Business Services Department
2 WEST COUNTY WASTEWATER DISTRICT COMPREHENSIVE ANNUAL FINANCIAL REPORT FOR THE FISCAL YEARS ENDED JUNE 30, 2017 AND JUNE 30, 2016 TABLE OF CONTENTS Page Number Introductory Section 1-2 Letter of Transmittal 3-6 CSMFO Certificate of Achievement 7 Mission Statement, Vision, and Core Values 8 Principal Officials and Management 9 Organization Chart 10 District Map 11 Financial Section Independent Auditors' Report Management's Discussion and Analysis Basic Financial Statements: Balance Sheets 25 Statements of Revenues, Expenses and Changes in Net Position 26 Statements of Cash Flows Notes to Financial Statements Required Supplementary Information (Unaudited) Schedule of the District s Proportionate Share of the Plan s Net Pension Liability 59 Schedule of the District s Contributions to the Pension Plan 60 Schedule of Funding Progress Other Post-Employment Benefits Plan 61 Statistical Section (Unaudited) Table of Contents 65 Introduction 66 Financial Trends Revenue Capacity Debt Capacity 76 Demographic and Economic Information Operating Information Independent Auditors' Report on Internal Control over Financial Reporting and on Compliance and Other Matters Based on an Audit of Financial Statements Performed in Accordance with Government Auditing Standards
3 INTRODUCTORY SECTION 1
4 2

5 January 24, 2018 To the Honorable Board of Directors and Citizens of the West County Wastewater District: State statures require an annual audit by an independent certified public accountant. This report is published to fulfill that requirement for the year ended June 30, Management assumes full responsibility for the completeness and reliability of the information contained in this report, based upon a comprehensive framework of internal controls that it has established for this purpose. Cost of internal control should not exceed anticipated benefits; therefore, the objective is to provide reasonable, rather than absolute, assurance that the financial statements are free of any material misstatement. The Pun Group, Certified Public Accountants, have issued an unmodified opinion on the West County Wastewater District s (District) financial statements for the year ended June 30, The independent auditor s report is located at the front of the financial section of this report. Management s discussion and analysis (MD&A) immediately follows the independent auditor s report and provides a narrative introduction, overview and analysis of the basic financial statements, complements this letter of transmittal and should be read in conjunction with it. PROFILE OF THE DISTRICT The District (formerly the San Pablo Sanitary District) was organized on December 19, 1921 and reorganized under the Sanitary District Act of In 1978, the District changed its name to West Contra Costa Sanitary District and in 1992 changed again to West County Wastewater District. The District has existed for 96 years for the purpose of protecting and serving the public health of the community through the construction and maintenance of a sewer system. The District is an independent Special District and is not financially responsible for any other governmental entity nor is it a component unit of another governmental entity. The District prepares a Two-Year Comprehensive Operating Budget and Capital Improvement Plan that is approved by the Board of Directors. The District is located in the western section of the County of Contra Costa approximately 28 miles northeast of San Francisco and 12 miles north of Oakland. BOARD MEMBERS: D. Alvarado A. Comeaux L. McNeil S. Stanley H. Wiener BOARD ATTORNEY: A. Cabral INTERIM GENERAL MANAGER: L. Malek-Zadeh 3
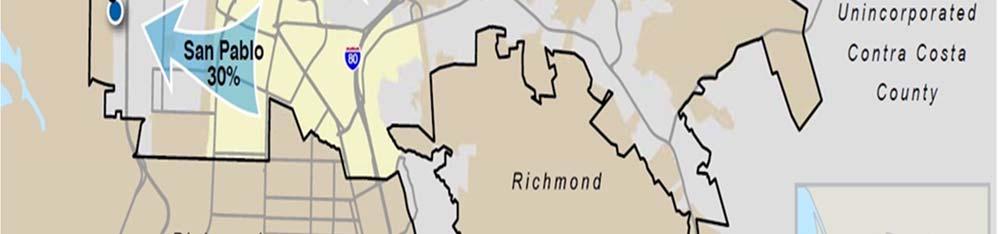
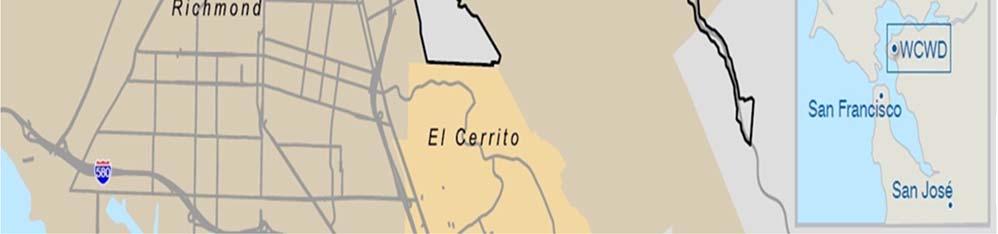
6 The District s service area encompasses 16.9 square miles all within the County of Contra Costa. Roughly 6.8 square miles (or 40% of the total) lie within the boundaries of the City of Richmond, 2.5 square miles (or 15% of the total) lie within the City of San Pablo, 0.4 square miles (or 2% of the total) within the City of Pinole and the remaining 7.2 square miles (or 43% of the total) are in the unincorporated areas of the County of Contra. The District s service area is fairly hilly, typical of the California coastal region. The population of the District is approximately 102,000. The District contains approximately 38,000 parcels. The District is governed by a five-member Board of Directors elected at large for fouryear over-lapping terms. The President is elected by members of the Board, customarily for a one-year term of office. The District s daily functions are administered by a General Manager who serves at the pleasure of the Board of Directors. The District s operation includes sewage collection, treatment and disposal. The District also provides contract services to neighboring communities to maintain various local government facilities. Since February 1977, the District participates in the West County Agency (WCA), a joint powers authority, with the city of Richmond s Municipal Sanitary Sewer District for the purpose of constructing and maintaining effluent and sludge disposal facilities. The U.S. Environmental Protection Agency, the California Regional Water Quality Control Board, the California Health Services Department, as well as other regulatory agencies provide the permits and standards that the District must meet in order to collect, treat, recycle, reuse and dispose of wastewater. LOCAL ECONOMY The real estate market continues to improve with the median home price in San Pablo increasing to approximately $418,800. This had a positive impact on the District s property tax revenues. The District s Board of Directors maintains sound fiscal policies and closely monitors expenses. The District s annual Environmental Quality (Sewer Use) Charge increased to $468 per single family residence for Fiscal Year 2017 and even with this increase, it remains one of the lowest among neighboring Bay Area sanitary sewer providers. LONG TERM PLANNING Environmental Quality (Sewer Use) Charges are the main source of revenue for the District. The District does not fund capital replacement costs through operating revenues. The District has established various reserves as follows: Rate Stabilization, Operating Insurance, Catastrophic Insurance, Capital Improvement, and Replacement Reserves. The District s Board of Directors reviews reserve levels annually to determine whether the levels established provide for the financial security required of a fiscally responsible local government. A portion of annual Environmental Quality (Sewer Use) Charges, connection fees, and all property tax revenues are utilized to fund capital asset additions and replacements. The District completed a 20-year Comprehensive Master Plan in
7 which identified $330.1 million of Capital Improvement Projects needed for aging infrastructures and improvements for treatment of water quality. The District has secured low interest loans from the State Water Resources Control Board to provide funding for some of the projects identified within the 20-year Comprehensive Master Plan. RELEVENT FINANCIAL POLICIES A utility or other enterprise government agency is a self-supporting operation of a commercial nature. The appropriate level of revenues and expenses is largely determined by the demand for service. Depending upon the timing and level of demand for service, the expenses will vary. Accordingly, the District s budgetary controls are established at the levels of total estimated expenses. MAJOR INITIATIVES The District strives to protect public health and San Francisco Bay by providing our communities with wastewater collection and treatment for reuse or disposal in an environmentally responsible, efficient and reliable manner. The District adopted a 20-year District-Wide Master Plan to address its infrastructure needs and has determined that it is necessary to borrow from the California State Water Resources Control Board State Revolving Fund to finance some of the identified projects. The impact of the Master Plan will be felt in District operations, capital program and rates for the next 30 years. AWARDS & ACKNOWLEDGEMENTS In recognition of its outstanding work, the District has received Platinum and Gold awards for the National Association of Clean Water Agencies (NACWA) for 14 consecutive years in recognition of compliance with its National Pollutant Discharge Elimination System (NPDES) permit. The District received the American Public Works Association, Northern California Chapter 2016 Environment Project of the Year for the North Richmond Pump Station Stormwater Diversion Project (an essential partner in the development and construction of an innovative project). The District was recognized in 2017 for exemplary water reuse by the Water Resources Utility of the Future Today (UOTF) recognition program of the partnership of water sector organizations- the National Association of Clean Water Agencies (NACWA), the Water Environment Federation (WEF), the Water Environment & Reuse Foundation (WE&RF), and the WateReuse Association, with input from the U.S. Environmental Protection Agency (EPA). The District received the California Society of Municipal Finance Officers (CSMFO) award for outstanding budgetary reporting for its Fiscal year 2015 and 2016 operating budget. This was the first year that the District applied for and was recognized for its budgetary reporting. In order to receive an award, a government agency must publish an easily readable and efficiently organized budget. 5
8 The District received the California Society of Municipal Finance Officers (CSMFO) award for outstanding financial reporting for its Comprehensive Annual Financial Report (CAFR) for the fiscal year ended June 30, This was the 19 th consecutive year that the District has been recognized for its financial reporting. In order to receive an award, a government agency must publish an easily readable and efficiently organized CAFR. This report must satisfy both generally accepted accounting principles (GAAP) and applicable legal requirements. The award is valid for a period of one year only. This is the first year the District is submitting its Comprehensive Annual Report (CAFR) for the Government Finance Officers Association of the United States and Canada s (GFOA) Certificate of Achievement for Excellence in Financial Reporting. To be awarded a Certificate of Achievement, a governmental unit must publish an easily readable and efficiently organized CAFR. The report must satisfy both generally accepted accounting principles and applicable legal requirements. The District believes that the current CAFR continues to meet the award program requirements and plans to submit this report to the Government Finance Officers Association (GFOA) for consideration for their outstanding financial reporting CAFR award. The preparation of this report would not have been possible without the efficient and dedicated services of the members of the Business Services department. Management wishes to express its appreciation to all staff that assisted and contributed to the preparation of this report, especially the District s Finance Supervisor, Dean Prater. Credit also must be given to the Board of Directors in the planning and implementation of the financial affairs of the District. Respectfully submitted, Lisa Malek-Zadeh Interim General Manager 6

9 The West County Wastewater District received the California Society of Municipal Finance Officers (CSMFO) Outstanding Financial Reporting Award for Fiscal Year Ending June 30, 2016, and was the seventh year of receiving the award. 7
10 WEST COUNTY WASTEWATER DISTRICT Mission Statement, Vision Statement, and Core Values Mission Statement The mission of the West County Wastewater District is to protect public health and San Francisco Bay by providing our communities with wastewater collection and treatment for reuse or disposal in an environmentally responsible, efficient and reliable manner. Vision The Vision Statement of the District creates and drives strategy and tactics identified in the District s Strategic Plan and is reviewed annual. It typically changes more frequently than the Mission Statement, to reflect the direction in which the Board of Directors wants to take the District over a five-year time horizon of the Strategic Plan. Through its Vision Statement, the District seeks to achieve the following: A sustainable fee and rate structure that adequately meets the District s needs. A continued commitment to fiscal responsibility. A continued preventative maintenance focus. Sufficient resources to support both compliance and work efficiency requirements. A strong and stable relationship with employees. A strong and enduring relationship with our General Manager. Supportive of regional partnerships. Supportive of emerging technologies to foster efficient services, and good customer care. A strong community outreach/communications program. Core Values The District s Core Values serve as a guidepost and framework for consistent decision making when the District is faced with options and alternatives. They are intended to be constant over the long term. The District uses the following Core Values for consistent decision making: To be cost efficient, practical and responsible. To support our commitment to maintenance of our plant and collection infrastructure. To support our dedication to be innovative, regional and industry leaders. To be responsive to our customers. To support employee safety, productivity, retention and motivation. To protect public health, the environment and support regulatory compliance. To promote ethical behavior in the conduct of District business. 8

11
12 10


13 WEST COUNTY WASTEWATER DISTRICT District Map 11
14 12
15 FINANCIAL SECTION 13
16 14
17 To the Board of Directors of the West County Wastewater District Richmond, California Report on the Financial Statements INDEPENDENT AUDITORS REPORT We have audited the accompanying financial statements of the West County Wastewater District (District), which comprise of the balance sheets as of June 30, 2017 and 2016, and the related statements of revenues, expenses and changes in net position and cash flows for the years then ended, and the related notes to the financial statements, which collectively comprise the District s basic financial statements. Management s Responsibility for the Financial Statements Management is responsible for the preparation and fair presentation of these financial statements in accordance with accounting principles generally accepted in the United States of America; this includes the design, implementation, and maintenance of internal control relevant to the preparation and fair presentation of financial statements that are free from material misstatement, whether due to fraud or error. Auditors Responsibility Our responsibility is to express an opinion on these financial statements based on our audits. We conducted our audits in accordance with auditing standards generally accepted in the United States of America and the standards applicable to financial audits contained in Government Auditing Standards, issued by the Comptroller General of the United States. Those standards require that we plan and perform the audit to obtain reasonable assurance about whether the financial statements are free from material misstatement. An audit involves performing procedures to obtain audit evidence about the amounts and disclosures in the financial statements. The procedures selected depend on the auditor s judgment, including the assessment of the risks of material misstatement of the financial statements, whether due to fraud or error. In making those risk assessments, the auditor considers internal control relevant to the entity s preparation and fair presentation of the financial statements in order to design audit procedures that are appropriate in the circumstances, but not for the purpose of expressing an opinion on the effectiveness of the entity s internal control. Accordingly, we express no such opinion. An audit also includes evaluating the appropriateness of accounting policies used and the reasonableness of significant accounting estimates made by management, as well as evaluating the overall presentation of the financial statements. We believe that the audit evidence we have obtained is sufficient and appropriate to provide a basis for our audit opinion. Opinion In our opinion, the financial statements referred to above present fairly, in all material respects, the respective financial position of the District as of June 30, 2017 and 2016, and the respective changes in financial position and cash flows for the years then ended in accordance with accounting principles generally accepted in the United States of America North California Blvd., Suite 290, Walnut Creek, California Tel: Fax:
18 To the Board of Directors of the West County Wastewater District Richmond, California Other Matters Required Supplementary Information Accounting principles generally accepted in the United States of America require that the Management s Discussion and Analysis on pages 15 through 20 and the Schedule of the District's Proportionate Share of the Plan s Net Pension Liability, the Schedule of District s Contributions to the Pension Plans, and the Schedule of Funding Progress Other Post-Employment Benefits Plan on pages 57 through 59, respectively, be presented to supplement the basic financial statements. Such information, although not a part of the basic financial statements, is required by the Governmental Accounting Standards Board, who considers it to be an essential part of financial reporting for placing the basic financial statements in an appropriate operational, economic, or historical context. We have applied certain limited procedures to the required supplementary information in accordance with auditing standards generally accepted in the United States of America, which consisted of inquiries of management about the methods of preparing the information and comparing the information for consistency with management s responses to our inquiries, the basic financial statements, and other knowledge we obtained during our audit of the basic financial statements. We do not express an opinion or provide any assurance on the information because the limited procedures do not provide us with sufficient evidence to express an opinion or provide any assurance. Other Information Our audits were conducted for the purpose of forming opinions on the financial statements that collectively comprise the District s basic financial statements as a whole. The introductory and the statistical sections are presented for purposes of additional analysis and are not required parts of the basic financial statements. The introductory and statistical sections have not been subjected to the auditing procedures applied in the audit of the basic financial statements and, accordingly, we do not express an opinion or provide any assurance on them. Other Reporting Required by Government Auditing Standards In accordance with Government Auditing Standards, we have also issued our report dated January 24, 2018, on our consideration of the District s internal control over financial reporting and on our tests of its compliance with certain provisions of laws, regulations, contracts, and grant agreements and other matters. The purpose of that report is to describe the scope of our testing of internal control over financial reporting and compliance and the results of that testing, and not to provide an opinion on internal control over financial reporting or on compliance. That report is an integral part of an audit performed in accordance with Government Auditing Standards in considering the District s internal control over financial reporting and compliance. Walnut Creek, California January 24,
19 WEST COUNTY WASTEWATER DISTRICT Management s Discussion and Analysis For the Fiscal Years Ending June 30, 2017 and June 30, 2016 Management s Discussion and Analysis ( MD&A ) is designed to focus on the current and prior year s activities, resulting changes, and currently known facts. It should be read in conjunction with the District s basic financial statements. The MD&A also provides information regarding the economic factors affecting the District and financial contact information. FINANCIAL HIGHLIGHTS The District had a net position balance of $93.3 million at June 30, Total net position was comprised of unrestricted net assets of $13.9 million and amounts invested in capital assets of $79.4 million. Net position increased by $11.8 million for fiscal year 2017 and $4.1 million for fiscal year The District s total operating revenues for fiscal year 2017 were $20.5 million and total operating expenses were $17.9 million, resulting in net operating income of $2.6 million. This compares to net operating income of $2.1 million for fiscal year 2016 and $560,000 for fiscal year The District s non-operating revenues for fiscal year 2017 were $1.4 million, primarily property taxes and redevelopment allocations. This compares to $1.5 million for fiscal year 2016 and $1.4 million for fiscal year Non-operating expenses for fiscal year 2017 were $109,000, primarily the valuation allowance on the ex-general Manger advance. This compares to no non-operating expense for fiscal year 2016 and $2.3 million for fiscal year 2015, primarily costs for the District-Wide Master Plan. Capital contributions were $7.9 million for fiscal year 2017, comprised of State capital construction grants ($6.9 million) and customer connection fees ($1.0 million). This compares to capital contributions of $0.5 million for fiscal year 2016 and $0.8 million for fiscal year 2015, consisting of customer connection fees. USING THE COMPREHENSIVE ANNUAL FINANCIAL REPORT The comprehensive annual financial report consists of this MD&A, a series of basic financial statements (described below) and notes to those statements. These statements are organized so the reader can understand the District as a financial whole. The statements provide an increasingly detailed look at specific financial activities. The basic financial statements also include notes that explain some of the information in the financial statements and provide more detailed data. BASIC FINANCIAL STATEMENTS The District consists exclusively of one Enterprise (Business) Fund. Enterprise funds utilize the full accrual basis of accounting. The Enterprise method of accounting is similar to accounting utilized by the private sector accounting. Balance Sheet: The Balance Sheet is designed to represent the net available liquid (noncapital) assets, net of liabilities, for the District. Net Position is reported in three broad categories within the Balance Sheet: 17
20 WEST COUNTY WASTEWATER DISTRICT Management s Discussion and Analysis (Continued) For the Fiscal Years Ending June 30, 2017 and June 30, 2016 Net Investment in Capital Assets: This component of Net Position consists of all Capital Assets, reduced by the outstanding balances of any bonds, mortgages, notes or other borrowings that are attributable to the acquisition, construction, or improvement of those assets. Restricted Net Position: This component of Net Position consists of restricted assets; when constraints are placed on the asset by creditors (such as debt covenants), grantors, contributors, laws, regulations, etc. Unrestricted Net Position: Consists of Net Position that do not meet the definition of Net Position Invested in Capital Assets, Net of Related Debt, or Restricted Net Position. Statements of Revenues, Expenses and Changes in Net Position: This statement is similar to an Income Statement and includes Operating Revenues and Expenses, and Non-Operating Revenue and Expenses. The focus of this Statement is the Change in Net Position, which is similar to Net Income or Loss. Statements of Cash Flows: This statement discloses net cash provided by, or used for, operating activities, non-capital financing activities, and from capital and related financing activities. SUMMARY OF THE STATEMENT OF NET POSITION (BALANCE SHEETS) The following table reflects the condensed statement of Net Position for the current and two preceding fiscal years. The District is engaged only in Business-Type Activities. TABLE 1 Balance Sheets % Increase % Increase (Decrease) (Decrease) vs vs Assets: Current Assets $ 27,185,179 $ 15,224,589 $ 21,989, % % Capital Assets 105,000,168 82,570,051 67,561, % 22.21% Other Non-Current Assets 670, , , % 49.56% Total Assets 132,856,068 98,407,088 89,961, % 9.39% Deferred Outflows of Resources 3,189,791 1,103, , % 18.90% Total Assets and Deferred Outflows of Resources $ 136,045,859 $ 99,510,122 $ 90,888, % 9.49% Liabilities: Current Liabilities $ 5,283,078 $ 5,177,218 $ 2,605, % 98.70% Non-Current Liabilities 36,483,938 11,501,875 8,300, % 38.57% Total Liabilities 41,767,016 16,679,093 10,905, % 52.94% Deferred Inflows of Resources 934,787 1,298,626 2,545, % % Net Position: Net Investment in Capital Assets 79,395,085 80,006,751 67,486, % 18.55% Unrestricted 13,948,971 1,525,652 9,950, % % Total Net Position 93,344,056 81,532,403 77,437, % 5.29% Total Liabilities, Deferred Inflows of Resources and Net Position $ 136,045,859 $ 99,510,122 $ 90,888, % 9.49% 18
21 WEST COUNTY WASTEWATER DISTRICT Management s Discussion and Analysis (Continued) For the Fiscal Years Ending June 30, 2017 and June 30, 2016 Major Factors Affecting the Statement of Net Position 97% of current assets consist of cash and equivalents at June 30, Current assets increased by $12.0 million from fiscal year 2016 to 2017, primarily due to loan receipts in excess of capital spending. Current assets decreased by $6.8 million from fiscal year 2015 to 2016, primarily due to capital asset spending. See Table 3 for a discussion of Capital Asset changes and Table 4 for a discussion of loan activity. Deferred outflows of resources increased by $2.1 million from fiscal year 2016 to 2017 and by $0.2 million from fiscal year 2015 to 2016, as a result of GASB 68 Deferred Outflows. This is discussed in the Note 8 to Financial Statements. Current liabilities consist of accounts payable, payroll related liabilities, and the current portion of loans and interest payable. Current liabilities increased $0.1 million from fiscal year 2016 to 2017 and increased $2.6 million from fiscal year 2015 to 2016, primarily due to capital asset spending. Long-term liabilities increased from fiscal year 2016 to 2017 by $25.0 million, primarily due to debt borrowings ($22.3 million) and the increase in net pension liability ($2.7 million). Long-term liabilities increased from fiscal year 2015 to 2016 by $3.2 million, primarily due to debt borrowings. The District had outstanding debt of $25.6 million at June 30, 2017 and $2.6 million at June 30, See Table 4 for a discussion of loan activity. See Table 3 for a discussion of Net Position Invested in Capital Assets changes. Net Position unrestricted increased by $12.4 million from fiscal year 2016 to 2017, due to capital contributions of $7.9 million, the excess of revenue over expense of $3.9 million, and a decrease in net investment in capital assets of $0.6 million. Net Position unrestricted decreased by $8.4 million from fiscal year 2015 to 2016, due to capital asset spending, net of accumulated depreciation, and Change in Net Position for the year. Net Position Invested in Capital Assets Net of related Debt decreased from fiscal year 2016 to 2017 by $600,000 due to loan proceeds and depreciation in excess of capital spending. Net Position Invested in Capital Assets Net of related Debt increased from fiscal year 2015 to 2016 by $12.5 million due to capital spending in excess of loan proceeds and depreciation. SUMMARY OF THE STATEMENT OF REVENUES, EXPENSES AND CHANGES IN NET POSITION Table 2 presents the revenues and expenses for the current and two preceding fiscal years. The District is engaged only in Business-Type Activities. 19
22 WEST COUNTY WASTEWATER DISTRICT Management s Discussion and Analysis (Continued) For the Fiscal Years Ending June 30, 2017 and June 30, 2016 TABLE 2 Statements of Revenues, Expenses, and Changes in Net Position % Increase % Increase (Decrease) (Decrease) vs vs Revenues Operating revenues Sewer use charge $ 19,780,211 $ 17,290,831 $ 15,595, % 10.87% Inspect/permit fees 300, , , % % Contract services 221, , , % -8.68% Other revenue 170, , , % 58.88% Subtotal- Operating revenues 20,472,104 18,062,154 16,461, % 9.72% Non-operating revenues Property taxes 1,057, , , % 8.63% Redevelopment allocation 160, , , % % Rental income 90, , , % 36.59% Investment earnings 61,556 70,451 43, % 61.06% Subtotal- non-operating revenues 1,370,591 1,543,857 1,418, % 8.86% Total revenue 21,842,695 19,606,011 17,879, % 9.66% Expenses Operating expenses 17,859,203 15,963,955 15,902, % 0.39% Non-operating expenses 109,312 2,323, % Total expenses 17,968,515 15,963,955 18,226, % % Increase (decrease) before capital contributions 3,874,180 3,642,056 (346,568) 6.37% % Capital contributions: State capital grants 6,966,498 Connection fees 970, , , % % Change in net position 11,811,653 4,095, , % % Net position, beginning 81,532,403 77,437,169 86,070, % % Prior period adjustments (9,067,651) % Net position, ending $ 93,344,056 $ 81,532,403 $ 77,437, % 5.29% Major Factors Affecting the Statement of Revenue, Expenses and Changes in Net Position: Total operating revenues for fiscal year 2017 were $20.5 million and total operating expenses were $17.9 million, resulting in operating income of $2.6 million. This compares to fiscal year 2016 operating revenues of $18.1 million and total operating expenses of $16.0 million, resulting in operating income of $2.1 million. Sewer Use Charge (Environmental Quality Charge) revenue increased $2.5 million from fiscal year 2016 to 2017 and increased $1.7 million from fiscal year 2015 to 2016 primarily due to the 11% per year rate increase. 20
23 WEST COUNTY WASTEWATER DISTRICT Management s Discussion and Analysis (Continued) For the Fiscal Years Ending June 30, 2017 and June 30, 2016 Operating expenses increased $1.9 million from fiscal year 2016 to 2017, and $60,000 from fiscal year 2015 to 2016, primarily due to increased wages, benefits, and utility costs. Non-operating revenues decreased $174,000 from fiscal year 2016 to 2017 primarily due to decreased rental income as a result of renegotiating a ground lease. Non-operating revenues increased $125,000 from fiscal year 2015 to 2016 primarily due to increased rental income resulting from ground lease rent terms. The District s non-operating expenses of $109,000 for fiscal year 2017 were primarily the valuation allowance on the ex-general Manger advance. This compares to no nonoperating expenses for fiscal year 2016 and $2.3 million for fiscal year 2015, primarily costs for the District-Wide Master Plan. Capital contributions were $7.9 million for fiscal year 2017, comprised of State capital construction grants ($6.9 million) and customer connection fees ($1.0 million). This compares to capital contributions of $0.5 million for fiscal year 2016 and $0.8 million for fiscal year 2015, consisting of customer connection fees. The fiscal year 2015 GASB 68 Prior Period Adjustment of $9.1 million is discussed in Note 8 to the Basic Financial Statements. SUMMARY OF CAPITAL ASSETS Table 3 presents a summary of the District s capital assets as of June 30, 2017, 2016, and More detailed information on capital asset activity is provided in Note 5 to the financial statements. TABLE 3 Summary of Capital Assets % Increase % Increase (Decrease) (Decrease) vs vs Land $ 2,451,806 $ 2,451,806 $ 2,451, % 0.00% Construction in process 41,922,254 18,507,918 2,251, % % Sewerage facilities 121,670, ,346, ,020, % 1.13% Equipment 5,491,401 7,093,874 6,708, % 5.74% Vehicles 2,631,732 2,283,740 2,137, % 6.84% Subtotal 174,167, ,684, ,569, % 13.87% Less accumulated depreciation (69,167,342) (66,114,213) (63,007,995) 4.62% 4.93% Total capital assets, net $ 105,000,168 $ 82,570,051 $ 67,561, % 22.21% Capital Asset Highlights: Capital Assets increased $22.4 million net, from fiscal year 2016 to 2017, due to capital asset additions of $25.5 million, less depreciation expense of $3.1 million. Capital Assets increased $15.0 million net, from fiscal year 2015 to 2016, due to capital asset additions of $18.1 million, less depreciation expense of $3.1 million. Additions for both years were primarily water pollution control plant upgrades and sewer pipe replacements. 21
24 WEST COUNTY WASTEWATER DISTRICT Management s Discussion and Analysis (Continued) For the Fiscal Years Ending June 30, 2017 and June 30, 2016 SUMMARY OF DEBT OUTSTANDING Table 4 presents a summary of the District s loans payable as of June 30, 2017, 2016, More detailed information on loan activity is provided on Note 9 to the basic financial statements. TABLE 4 Debt Outstanding % Increase % Increase (Decrease) (Decrease) vs vs Current portion $ 741,900 $ 2, % Non-current portion 24,863,183 2,560,725 74, % % Loans Payable $ 25,605,083 $ 2,563,300 $ 74, % % Debt Highlights: Loans payable increased $23.0 million net from fiscal year 2016 to 2017 and increase $2.5 million net from fiscal year 2015 to 2016, due to State Water Control Resource loans used to fund capital asset additions. These loans will be repaid using the additional sewer use charge revenue resulting from rate increases. ECONOMIC FACTORS AND NEXT YEAR'S RATES While the District has the ability to raise the sewer service charge to meet its long-term needs, it does so conservatively to minimize the impact on rate payers. The Board of Directors approved 11% annual sewer service charge rate increases for fiscal years beginning July 1, 2015 through June 30, 2020 in order to fund $330 million of maintenance and capital improvement costs identified by the Year District-Wide Master Plan. The District increased its sewer service charge per residence from $381 to $422 (+10.8%) effective July 1, 2015 and to $468 (+10.9%) effective July 1, 2016, with an equivalent increase for commercial and industrial customers. In order to reduce the burden on rate payers in the near term, the District applied for low interest loans and grants from the California State Water Resources Control Board (SRF). The SRF approved $9.4 million of grants and four loans totaling $44.3 million with interest rates or 1.0% or 1.9%. Repayment of these loans is dependent on future rate increases. The District is committed to expending resources needed to treat wastewater to meet the environmental quality required by our permit. The District continues to identify areas to reduce spending and achieve efficiencies through its Strategic Plan and biennial budget process. FINANCIAL CONTACT The individual to be contacted regarding this report is Lisa Malek-Zadeh, Business Services Manager, at (510) , or lmalek-zadeh@wcwd.org. Specific requests may be submitted to: Lisa Malek-Zadeh, Business Services Manager, West County Wastewater District, 2910 Hilltop Drive, Richmond, CA
25 BASIC FINANCIAL STATEMENTS 23
26 This page intentionally left blank 24
27 West County Wastewater District Balance Sheets June 30, 2017 and 2016 ASSETS AND DEFERRED OUTFLOWS OF RESOURCES Current assets: Cash and investments (Note 2) $ 26,348,460 $ 14,692,196 Accrued interest receivable 43,960 23,000 Accounts receivable, net (Note 3) 556, ,137 Materials and supplies inventory 148, ,405 Prepaid items 88,030 94,851 Total current assets 27,185,179 15,224,589 Non-current assets: Note receivable (Note 4) 307, ,500 Net other post-employment benefits asset (Note 7) 363, ,948 Capital assets not being depreciated (Note 5) 44,374,060 20,959,724 Capital assets being depreciated, net (Note 5) 60,626,108 61,610,327 Total non-current assets 105,670,889 83,182,499 Total assets 132,856,068 98,407,088 Deferred outflows of resources: Deferred amounts related to net pension liability (Note 8) 3,189,791 1,103,034 Total deferred outflows of resources 3,189,791 1,103,034 Total assets and deferred outflows of resources $ 136,045,859 $ 99,510,122 LIABILITIES, DEFERRED INFLOWS OF RESOURCES AND NET POSITION Current liabilities: Accounts payable and accrued expenses $ 3,463,895 $ 3,848,093 Accrued salaries and benefits 129, ,875 Accrued interest payable 41,154 15,414 Long-term liabilities due within one year: Compensated absences (Note 6) 906, ,261 Loans payable (Note 9) 741,901 2,575 Total current liabilities 5,283,079 5,177,218 Non-current liabilities: Long-term liabilities due in more than one year: Compensated absences (Note 6) 579, ,707 Loans payable (Note 9) 24,863,182 2,560,725 Net pension liability (Note 8) 11,041,346 8,304,443 Total non-current liabilities 36,483,937 11,501,875 Total liabilities 41,767,016 16,679,093 Deferred inflows of resources Deferred amounts related to net pension liability (Note 8) 934,787 1,298,626 Total deferred inflows of resources 934,787 1,298,626 Net position: Net investment in capital assets (Note 10) 79,395,085 80,006,751 Unrestricted 13,948,971 1,525,652 Total net position 93,344,056 81,532,403 Total liabilities, deferred inflows of resources and net position $ 136,045,859 $ 99,510,122 See accompanying Notes to the Basic Financial Statements 25
28 West County Wastewater District Statements of Revenues, Expenses and Changes in Net Position For the Years Ended June 30, 2017 and Operating revenues: Sewer use charge $ 19,780,211 $ 17,290,831 Inspection/permit fees 300, ,888 Contract services 221, ,737 Other revenue 170, ,698 Total operating revenues 20,472,104 18,062,154 Operating expenses: Sewage collection 3,783,288 3,815,139 Sewage treatment 6,784,087 5,976,699 Administration 3,899,443 2,631,540 Contract services 147, ,421 West County Agency 174, ,541 Total operating expenses before depreciation 14,788,090 12,844,340 Operating income before depreciation 5,684,014 5,217,814 Depreciation expense (3,071,113) (3,119,615) Operating income 2,612,901 2,098,199 Non-operating revenues (expenses): Property taxes 1,057, ,876 Redevelopment allocation 160, ,994 Rental income 90, ,536 Investment earnings 61,556 70,451 Other revenue (expense), net (109,312) - Total non-operating revenues (expenses), net 1,261,279 1,543,857 Net income before capital contributions 3,874,180 3,642,056 Capital contributions: State capital grants 6,966,498 - Connection fees 970, ,178 Total capital contributions 7,937, ,178 Change in net position 11,811,653 4,095,234 Net position: Beginning of year 81,532,403 77,437,169 End of year $ 93,344,056 $ 81,532,403 See accompanying Notes to the Basic Financial Statements 26
29 West County Wastewater District Statements of Cash Flows For the Years Ended June 30, 2017 and Cash flows from operating activities: Cash receipts from customers and others $ 20,258,655 $ 18,496,475 Cash paid to employees for salaries and wages (6,764,638) (5,686,572) Cash paid to vendors and suppliers for materials and services (8,600,209) (5,491,172) Net cash provided by operating activities 4,893,808 7,318,731 Cash flows from non-capital financing activities: Property taxes 1,057, ,876 Redevelopment allocation 160, ,994 Net cash provided by non-capital financing activities 1,218,094 1,119,870 Cash flows from capital and related financing activities: Acquisition and construction of capital assets (25,475,490) (18,112,839) Proceeds from capital contributions 7,937, ,178 Principal paid (83,013) - Proceeds from loan issuance 23,124,796 2,488,331 Net cash provided by (used in) capital and related financing activities 5,503,766 (15,171,330) Cash flows from investing activities: Investment earnings 40,596 60,167 Net cash provided by investing activities 40,596 60,167 Net increase (decrease) in cash and cash investments 11,656,264 (6,672,562) Cash and investments: Beginning of year 14,692,196 21,364,758 End of year $ 26,348,460 $ 14,692,196 See accompanying Notes to the Basic Financial Statements 27
30 West County Wastewater District Statements of Cash Flows (Continued) For the Years Ended June 30, 2017 and 2016 Reconciliation of operating income to net cash provided by operating activities: Operating income $ 2,612,901 $ 2,098,199 Adjustments to reconcile operating income to net cash provided by operating activities: Depreciation 3,071,113 3,119,615 Rental income 90, ,536 Other revenue (expense), net (109,312) - Change in assets (increase) decrease: Accounts receivable, net (297,578) 80,785 Materials and supplies inventory 7,391 14,537 Prepaid items 6,821 7,725 Note receivable 102,500 - Net other post-employment benefits asset (160,773) (202,948) Change in deferred outflows of resources (increase) decrease Deferred amounts related to net pension liability (2,086,757) (175,309) Change in liabilities increase (decrease): Accounts payable and accrued expenses (384,198) 2,367,080 Accrued salaries and benefits (302,000) (155,702) Compensated absences (30,305) (17,537) Net pension liability 2,736,903 1,075,688 Change in deferred inflows of resources increase (decrease) Deferred amounts related to net pension liability (363,839) (1,246,938) Total adjustments 2,280,907 5,220,532 Net cash provided by operating activities $ 4,893,808 $ 7,318,731 See accompanying Notes to the Basic Financial Statements 28
31 West County Wastewater District Notes to the Basic Financial Statements For the Years Ended June 30, 2017 and 2016 Note 1 Reporting Entity and Summary of Significant Accounting Policies The West County Wastewater District (District) is a sanitary district formed December 19, 1921, and operates pursuant to the provision of Section 6400 et. seq. of the State of California Health and Safety Code. The District is governed by an elected five member Board of Directors that exercise the powers allowed by state statues. The District is a stand-alone governmental entity and is not financially responsible for any other governmental unit or agency. The criteria used in determining the scope of the financial reporting entity is based on the provisions of Governmental Accounting Statements No. 61, The Financial Reporting Entity. The District is the primary governmental unit based on the foundation of a separately elected governing board that is elected by the citizens in a general popular election. Component units are legally separate organizations for which the elected officials of the primary government are financially accountable. The District is financially accountable for a component that has substantively the same governing body as the District s governing body, and additionally (1) the primary government and the component unit have a financial benefit or burden relationship or (2) management (below the level of the elected officials) of the primary government have operational responsibility for the activities of the component unit. Basis of Presentation The District s financial statements are prepared in conformity with U.S. GAAP. The Governmental Accounting Standards Board (GASB) is the acknowledged standard setting body for establishing accounting and financial reporting standards followed by governmental entities in the United States. Measurement Focus, Basis of Accounting, and Financial Statement Presentation The Financial Statements are reported using the economic resources measurement focus and the accrual basis of accounting. Revenues are recorded when earned and expenses are recorded when a liability is incurred, regardless of the timing of related cash flows. Grants and similar items are recognized as revenue as all eligibility requirements have been met. Interest associated with the current fiscal period is considered to be susceptible to accrual and so has been recognized as revenue of the current fiscal period. The Financial Statements (i.e., the balance sheets, the statements of revenues, expenses and changes in net position, and statements of cash flows) report information on all of the activities of the primary government. The District accounts for its operations (a) that are financed and operated in a manner similar to private business enterprises where the intent of the governing body is that the costs (expenses, including depreciation) of providing goods or services to the general public on a continuing basis be financed or recovered primarily through user charges; or (b) where the governing body has decided that periodic determination of revenues earned, expenses incurred, and/or net income is appropriate for capital maintenance, public policy, management control, accountability or other purposes. In accordance with U.S. GAAP, the balance sheets report separate sections for Deferred Outflows of Resources, and Deferred Inflows of Resources, when applicable. Deferred Outflows of Resources represent outflows of resources (consumption of net position) that apply to future periods and that, therefore, will not be recognized as an expense until that time. Deferred Inflows of Resources represent inflows of resources (acquisition of net position) that apply to future periods and that, therefore, are not recognized as a revenue until that time. 29
32 West County Wastewater District Notes to the Basic Financial Statements (Continued) For the Years Ended June 30, 2017 and 2016 Note 1 Reporting Entity and Summary of Significant Accounting Policies (Continued) Measurement Focus, Basis of Accounting, and Financial Statement Presentation (Continued) Operating revenues are those revenues that are generated from the primary operations of the District. The District reports a measure of operations by presenting the change in net position from operations as operating income in the statements of revenues, expenses, and changes in net position. Operating activities are defined by the District as all activities other than financing and investing activities (interest expense and investment income), grants and subsidies, property taxes and other transactions of a non-operating nature. Operating expenses are those expenses that are essential to the primary operations of the District. All other expenses are reported as non-operating expenses. Cash and Cash Equivalents Cash and cash equivalents include all highly liquid investments with original maturities of 90 days or less and are carried at cost, which approximates fair value. Investments Investments are reported at fair value. Changes in fair value that occur during a fiscal year are recognized as unrealized gains or losses and reported for that fiscal year. Investment income comprises interest earnings, changes in fair value, and any gains or losses realized upon the liquidation or sale of investments. U.S. GAAP defines fair value, establishes a framework for measuring fair value and establishes disclosures about fair value measurement. Investments, unless otherwise specified, recorded at fair value in the balance sheet, are categorized based upon the level of judgment associated with the inputs used to measure their fair value. Levels of inputs are as follows: Level 1 Inputs are unadjusted, quoted prices for identical assets and liabilities in active markets at the measurement date. Level 2 Inputs, other than quoted prices included in Level 1 that are observable for the asset or liability through corroboration with market data at the measurement date. Level 3 Unobservable inputs that reflect management s best estimate of what market participants would use in pricing the asset or liability at the measurement date. Receivables and Allowance for Doubtful Accounts Customer accounts receivable consist of amounts owed by private individuals and organizations for services rendered in the regular course of business operations. Receivables are shown net of allowances for doubtful accounts. Uncollectable accounts are based on prior experience and management s assessment of the collectability of existing accounts. Materials and Supplies Inventory Inventories consist of expendable supplies and are valued at cost using first-in first-out basis. Prepaid Items Payments made to vendors for services that will benefit periods beyond the fiscal year ended are recorded as prepaid items. 30
33 West County Wastewater District Notes to the Basic Financial Statements (Continued) For the Years Ended June 30, 2017 and 2016 Note 1 Reporting Entity and Summary of Significant Accounting Policies (Continued) Capital Assets Capital assets are valued at historical cost, or estimated historical cost, if actual historical cost was not available. Donated capital assets are valued at their estimated acquisition value on the date donated. The District policy has set the capitalization threshold for reporting capital assets at $5,000, all of which must have an estimated useful life in excess of one year. Depreciation is recorded on a straight-line basis over estimated useful lives of the assets as follows: Sewage collection and treatment facilities Equipment Vehicles years 4-10 years 3-15 years Major outlays for capital assets are capitalized as construction in progress, once constructed, and repairs and maintenance costs are expensed. Capitalized interest of $15,235 and $179 has been included in construction in process for the years ended June 30, 2017 and Compensated Absences The District has a policy whereby an employee can accumulate unused sick leave, compensatory time and vacation leave. Immediately, prior to retirement, employees with a satisfactory record of service who otherwise qualify for retirement may be granted time off from their job duties, with full compensation, for a period of time not to exceed the amount of their accumulated sick leave time, or 60 work days, whichever is shorter. Management estimates that 90% of current employees will work until qualified for retirement and therefore the District has accrued for 90% of accumulated sick leave balances, in addition to the full accrual of accumulated compensatory time and vacation leave. Net Pension Liability For purposes of measuring the net pension liability, deferred outflows of resources and deferred inflows of resources related to pensions, and pension expense, information about the fiduciary net position of the plans and additions to/deductions from the plans fiduciary net position have been determined on the same basis as they are reported by the plans (Note 8). For this purpose, benefit payments (including refunds of employee contributions) are recognized when due and payable in accordance with benefit terms. Investments are reported at fair value. The following timeframes are used for pension reporting: CalPERS June 30, 2017 June 30, 2016 Valuation date June 30, 2015 June 30, 2014 Measurement date June 30, 2016 June 30, 2015 Measurement period July 1, 2015 to June 30, 2016 July 1, 2014 to June 30, 2015 Gains and losses related to changes in total pension liability and fiduciary net position are recognized in pension expense systematically over time. The first amortized amounts are recognized in pension expense for the year the gain or loss occurs. The remaining amounts are categorized as deferred outflows and deferred inflows of resources related to pensions and are to be recognized in future pension expense. The amortization period differs depending on the source of the gain or loss. The difference between projected and actual earnings is amortized straight-line over 5 years. All other amounts are amortized straight-line over the average expected remaining service lives of all members that are provided with benefits (active, inactive, and retired) as of the beginning of the measurement period. 31
34 West County Wastewater District Notes to the Basic Financial Statements (Continued) For the Years Ended June 30, 2017 and 2016 Note 1 Reporting Entity and Summary of Significant Accounting Policies (Continued) Net Position Net position represents the difference between all other elements in the balance sheets and should be displayed in the following three components: Net Investment in Capital Assets This component of net position consists of capital assets, net of accumulated depreciation, reduced by the outstanding balances of debt that are attributable to the acquisition, construction, or improvement of those assets. Restricted This component of net position consists of restricted assets reduced by liabilities and deferred inflows of resources related to those assets. Unrestricted This component of net position is the amount of the assets, deferred outflows of resources, liabilities, and deferred inflows of resources that are not included in the determination of net investment in capital assets or the restricted component of net position. When both restricted and unrestricted resources are available for use, it is the District s policy to use restricted resources first, then unrestricted resources as they are needed. Use of Estimates The preparation of financial statements in conformity with U.S. GAAP requires management to make estimates and assumptions that affect the reported amounts of assets and liabilities and disclosure of the contingent assets and liabilities at the date of the financial statements and the reported amounts of revenue and expenses during the reporting period. Actual results could differ from those estimates. Sewer Use Charge Revenue Sewer use charges determined by the District are included on property tax bills of the County of Contra Costa (County). Sewer use charge revenue is recorded as revenue when received due to the adoption of the alternate method of property tax distribution, known as the Teeter Plan, by the County. The Teeter Plan authorizes the Auditor-Controller of the County to allocate 100% of the service charges billed, but not yet paid or collected to the District. Late payment fees and interest are collected by the County and not remitted to the District. The County remits service charge revenue to the District in three installments each fiscal year as follows: 55% in December, 40% in April and 5% in June. Property Taxes Property taxes are levied on July 1 and are payable in two installments: November 1 and February 1 of each year. Property taxes become delinquent on December 10 and April 10, for the first and second installments, respectively. The lien date is January 1. The County of Contra Costa, California (County) bills and collects property taxes and remits them to the District according to a payment schedule established by the County. The County is permitted by State law to levy properties at 1% of full market value (at time of purchase) and can increase the property tax rate at no more than 2% per year. The District receives a share of this basic tax levy proportionate to what it received during the years Property taxes are recognized in the fiscal year for which the taxes have been levied. The County remits property tax revenues to the District on the same schedule as sewer use charge revenues. 32
35 West County Wastewater District Notes to the Basic Financial Statements (Continued) For the Years Ended June 30, 2017 and 2016 Note 2 Cash and Investments Cash and investments as of June 30 consisted of the following: Description June 30, 2017 June 30, 2016 Cash on hand $ 500 $ 500 Deposits held with financial institutions 2,713,348 2,097,672 Investments 23,634,612 12,594,024 Demand Deposits Total $ 26,348,460 $ 14,692,196 At June 30, 2017 and 2016, the carrying amount of the District s demand deposits was $2,713,348 and $2,097,672, respectively, and the financial institution balance was $2,903,351 and $4,228,131, respectively. The $190,003 and $2,130,459 respective net difference as of June 30, 2017 and 2016 represents outstanding checks, deposits-in-transit and/or other reconciling items. The California Government Code requires California banks and savings and loan associations to secure an entity's deposits by pledging government securities with a value of 110% of an entity's deposits. California law also allows financial institutions to secure entity deposits by pledging first trust deed mortgage notes having a value of 150% of an entity's total deposits. The entity's Treasurer may waive the collateral requirement for deposits which are fully insured up to $250,000 by the FDIC. The collateral for deposits in federal and state chartered banks is held in safekeeping by an authorized agent of depository recognized by the State of California Department of Banking. The collateral for deposits with savings and loan associations is generally held in safekeeping by the Federal Home Loan Bank in San Francisco, California as an agent of depository. These securities are physically held in an undivided pool for all California public agency depositors. Under Government Code Section 53655, the placement of securities by a bank or savings and loan association with an agent of depositor has the effect of perfecting the security interest in the name of the local governmental agency. Accordingly, all collateral held by California agents of depository are considered to be held for, and in the name of, the local government. Custodial Credit Risk The custodial credit risk for deposits is the risk that in the event of the failure of a depository financial institution, a government will not be able to recover deposits or will not be able to recover collateral securities that are in the possession of an outside party. The District s investment policy requires that collateral be held by an independent third party with whom the District has a current custodial agreement. The custodial credit risk for investments is the risk that in the event of the failure of the counterparty to a transaction, a government will not be able to recover the value of investment or collateral securities that are in the possession of an outside party. The District s investment policy requires that all security transactions are conducted on a deliveryversus-payment (DVP) method and that all securities are held by a qualified, third-party custodian, as evidenced by safekeeping receipts. The trust department of the District s bank may act as third-party custodian, provided that the custodian agreement is separate from the banking agreement. With respect to investments, custodial credit risk generally applies only to direct investments in marketable securities. Custodial credit risk does not apply to a local government s indirect investment in securities through the use of mutual funds or government investment pools (such as LAIF). As of June 30, 2017 and 2016, none of the District s deposits and investments was exposed to disclosable custodial credit risk. 33
36 West County Wastewater District Notes to the Basic Financial Statements (Continued) For the Years Ended June 30, 2017 and 2016 Note 2 Cash and Investments (Continued) Investments The District s investments as of June 30, 2017 were as follows: Maturity Measurement Credit June 30, Months or Type of Investments Input Rating Fair Value Less Local Agency Investment Fund (LAIF) Uncategorized N/A $ 23,634,612 $ 23,634,612 Total investments $ 23,634,612 $ 23,634,612 The District s investments as of June 30, 2016 were as follows: Maturity Measurement Credit June 30, Months or Type of Investments Input Rating Fair Value Less Local Agency Investment Fund (LAIF) Uncategorized N/A $ 12,594,024 $ 12,594,024 Total investments $ 12,594,024 $ 12,594,024 Authorized Deposits and Investments The District is legally empowered by statute and resolution to invest in certificates-of-deposit and the California State Investment Pool Local Agency Investment Fund (LAIF). The District s investment policy identifies other investment types that are authorized for the District to invest in under the California Government Code. Investment in State Investment Pool The District is a voluntary participant in LAIF which is regulated by California Government Code Section under the oversight of the Treasurer of the State of California. The fair value of the District s investment in this pool is reported in the accompanying financial statements at amounts based upon the District s pro-rata share of the fair value provided by LAIF for the entire LAIF portfolio (in relation to the amortized cost of that portfolio). The balance available for withdrawal is based on the accounting records maintained by LAIF, which are recorded on an amortized cost basis. The District s investments with LAIF at June 30, 2017 and 2016 included a portion of the pool funds invested in structured notes and asset-backed securities: Structured Notes: debt securities (other than asset-backed securities) whose cash flow characteristics (coupon rate, redemption amount, or stated maturity) depend upon one or more indices and/or that have embedded forwards or options. Asset-Backed Securities: generally mortgage-backed securities that entitle their purchasers to receive a share of the cash flows from a pool of assets such as principal and interest repayments from a pool of mortgages (for example, Collateralized Mortgage Obligations) or credit card receivables. The District had $23,634,612 and $12,594,024 invested in LAIF, which had invested 2.89% and 2.81% of the pooled investment funds as of June 30, 2017 and June 30, 2016, respectively, in structured notes and medium-term assetbacked securities. The LAIF fair value factor of and was used to calculate the fair value of the investments in LAIF as of June 30, 2017 and 2016, respectively. 34
37 West County Wastewater District Notes to the Basic Financial Statements (Continued) For the Years Ended June 30, 2017 and 2016 Note 2 Cash and Investments (Continued) Fair Value Measurement Input The District categorizes its fair value measurement inputs within the fair value hierarchy established by generally accepted accounting principles. The District has presented its measurement inputs as noted in the table above. Credit Risk Credit risk is the risk that an issuer of an investment will not fulfill its obligation to the holder of the investment. This is measured by the assignment of a rating by a nationally recognized statistical rating organization. As of June 30, 2017 and 2016, the District s investment in the LAIF was not rated as noted in the table above. Interest Rate Risk Interest rate risk is the risk that changes in market interest rates will adversely affect the fair value of an investment. Generally, the fair values of investments with longer maturities have greater sensitivity to changes in market interest rates. The District s investment policy follows the Code as it relates to limits on investment maturities as a means of managing exposure to fair value losses arising from increasing interest rates. The District has elected to use the segmented time distribution method of disclosure for the maturities of its investments as related to interest rate risk as noted in the table above. Concentration of Credit Risk The District s investment policy contains no limitations on the amount that can be invested in any one governmental agency or non-governmental issuer beyond that stipulated by the California Government Code. There were no investments in any one governmental or non-governmental issuer that represented 5% or more of the District s total investments except for those in LAIF or non-negotiable certificates-of-deposit. Note 3 Accounts Receivable Accounts receivable as of June 30 consisted of the following: Description June 30, 2017 June 30, 2016 Permits and trucked waste $ 30,822 $ 10,745 Pretreatment inspections 35,326 19,739 Service contracts 39,358 24,247 EBMUD 442, ,744 Other 20,902 68,110 Total accounts receivable 568, ,585 Allowance for doubtful accounts (12,137) (8,448) Total accounts receivable, net $ 556,715 $ 259,137 35
38 West County Wastewater District Notes to the Basic Financial Statements (Continued) For the Years Ended June 30, 2017 and 2016 Note 4 Note Receivable The District and the General Manager amended their employment agreement effective December 31, 2005, which included an executed note receivable of not more than 50% of the cost of a residence, to a maximum of $500,000, for the General Manager to reside within the District s boundaries. Title to the residence shall be taken in the name of the General Manager and, upon close of escrow of a sale of the residence, the District shall first be reimbursed its initial advance and the General Manager shall be reimbursed his initial down payment. The net sale proceeds shall be allocated to the District and the General Manager using the ratio of purchase cost. The total amount advanced by the District as of June 30, 2016 was $409,500. In 2017, the General Manager s contract was terminated. The District reduced the note receivable by $102,500 to $307,000 based on the market-value of the pending sale of the residence. Note 5 Capital Assets Summary changes in capital asset balances for the year ended June 30, 2017 were as follows: Balance Deletions/ Balance Description July 1, 2016 Additions Transfers June 30, 2017 Non-depreciable assets: Land $ 2,451,806 $ - $ - $ 2,451,806 Construction-in-process 18,507,918 25,447,139 (2,032,803) 41,922,254 Total non-depreciable assets 20,959,724 25,447,139 (2,032,803) 44,374,060 Depreciable assets: Sewage collection and treatment facilities 118,346,926 1,570,729 1,753, ,671,006 Equipment 7,093, ,173 (1,771,331) 5,490,716 Vehicles 2,283, ,992-2,631,732 Total depreciable assets 127,724,540 2,086,894 (17,980) 129,793,454 Accumulated depreciation: Sewage collection and treatment facilities (60,370,478) (2,763,788) (9,850) (63,144,116) Equipment (3,912,037) (192,859) 27,830 (4,077,066) Vehicles (1,831,698) (114,466) - (1,946,164) Total accumulated depreciation (66,114,213) (3,071,113) 17,980 (69,167,346) Total depreciable assets, net 61,610,327 (984,219) - 60,626,108 Total capital assets, net $ 82,570,051 $ 24,462,920 $ (2,032,803) $ 105,000,168 36
39 West County Wastewater District Notes to the Basic Financial Statements (Continued) For the Years Ended June 30, 2017 and 2016 Note 5 Capital Assets (Continued) Summary changes in capital asset balances for the year ended June 30, 2016 were as follows: Balance Deletions/ Balance Description July 1, 2015 Additions Transfers June 30, 2016 Non-depreciable assets: Land $ 2,451,806 $ - $ - $ 2,451,806 Construction-in-process 2,251,105 17,902,727 (1,645,914) 18,507,918 Total non-depreciable assets 4,702,911 17,902,727 (1,645,914) 20,959,724 Depreciable assets: Sewage collection and treatment facilities 117,020,239 1,326, ,346,926 Equipment 6,708, ,903-7,093,874 Vehicles 2,137, ,671 (13,397) 2,283,740 Total depreciable assets 125,866,676 1,871,261 (13,397) 127,724,540 Accumulated depreciation: Sewage collection and treatment facilities (57,620,897) (2,749,581) - (60,370,478) Equipment (3,660,050) (251,987) - (3,912,037) Vehicles (1,727,048) (118,047) 13,397 (1,831,698) Total accumulated depreciation (63,007,995) (3,119,615) 13,397 (66,114,213) Total depreciable assets, net 62,858,681 (1,248,354) - 61,610,327 Total capital assets, net $ 67,561,592 $ 16,654,373 $ (1,645,914) $ 82,570,051 Note 6 Compensated Absences Summary changes to compensated absences balances for the year ended June 30, 2017 was as follows: Balance Balance Current Non-current July 1, 2016 Additions Deletions June 30, 2017 Portion Portion $ 1,515,968 $ 894,435 $ (924,740) $ 1,485,663 $ 906,254 $ 579,409 Summary changes to compensated absences balances for the year ended June 30, 2016 was as follows: Balance Balance Current Non-current July 1, 2015 Additions Deletions June 30, 2016 Portion Portion $ 1,533,505 $ 877,526 $ (895,063) $ 1,515,968 $ 879,261 $ 636,707 37
40 West County Wastewater District Notes to the Basic Financial Statements (Continued) For the Years Ended June 30, 2017 and 2016 Note 7 Net Other Post-Employment Benefits Asset Plan Description The District provides Other Post-Employment Benefits (OPEB) to employees who retire from the District and meet certain eligibility requirements. Eligibility is based upon active employee status of the District at the time of retirement, completion of at least five-years employment with the District, having achieved the age of 50 or older, eligibility to retire under CalPERS, and not receiving health care benefits from any other source other than Medicare or workers compensation. The maximum employer s contribution is limited to $1,500, per month, regardless of which coverage the retiree has selected. The contribution requirements of Plan members and the District are established and may be amended by the Board of Directors. Funding Policy The District has requested an actuary to determine the District's Annual Required Contributions (ARC) at least once every three fiscal years. The ARC is calculated in accordance with certain parameters, and includes (1) the Normal Cost for one year, and (2) a component for amortization of the total Unfunded Actuarial Accrued Liability (UAAL) over a period not to exceed 30 years. Annual OPEB Cost and Net OPEB Obligation/(Asset) Summary changes in net other post-employment benefits balances for the years ended June 30 were as follows: Description June 30, 2017 June 30, 2016 Annual OPEB cost: Annual required contribution (ARC) $ 915,000 $ 1,036,000 Total annual OPEB cost 915,000 1,036,000 Contributions made: Contributions made (1,075,773) (1,238,948) Total contributions made (1,075,773) (1,238,948) Total change in net OPEB obligation/(asset) (160,773) (202,948) Net OPEB obligation/(asset): Beginning of year (202,948) - End of year $ (363,721) $ (202,948) 38
41 West County Wastewater District Notes to the Basic Financial Statements (Continued) For the Years Ended June 30, 2017 and 2016 Note 7 Net Other Post-Employment Benefits Obligation (Continued) The District's annual OPEB cost, the amounts contributed to the irrevocable trust, retiree benefit payments, the percentage of annual OPEB cost contributed to the plan, and the net OPEB obligation payable/(asset) for the fiscal years ended June 30, 2017 and the two preceding years are shown in the following table. Three-Year History of Net OPEB Obligation Fiscal Annual Percentage Net OPEB Year OPEB Contributions of Annual OPEB Obligation Ended Cost Made Cost Contributed Payable (Asset) June 30, 2017 $ 915,000 $ 1,075, % $ (363,721) June 30, ,036,000 1,238, % (202,948) June 30, ,007,000 1,172, % - The most recent valuation (dated June 30, 2016) includes an Actuarial Accrued Liability of $9,806,000. Plan assets amounted to $5,219,000. The covered payroll (annual payroll of active employees covered by the plan) for the year ended June 30, 2016 was $5,264,000. The ratio of the funded actuarial accrued liability to annual covered payroll was 87.14%. Actuarial Methods and Assumptions Actuarial valuations involve estimates of the value of reported amounts and assumptions about the probability of events far into the future. Actuarially determined amounts are subject to continual revision as actual results are compared to past expectations and new estimates are made about the future. Calculations are based on the types of benefits provided under the terms of the substantive plan at the time of each valuation and the pattern of sharing of costs between the employer and plan members to that point. Consistent with the long-term perspective of actuarial calculations, actuarial methods and assumptions used include techniques that are designed to reduce short-term volatility in actuarial accrued liabilities for benefits. The following is a summary of the actuarial assumptions and methods: Valuation date June 30, 2016 Actuarial cost method Entry age normal cost method Amortization method Level percent of increasing payroll Remaining amortization period 26 Years as of the valuation date Asset valuation method 30 Year smoothed market Actuarial assumptions: Investment rate of return 6.25% Projected salary increase 3.5% of covered payroll Inflation - discount rate 3.00% Health care trend rate Based on premiums declining 0.5% annually 39
42 West County Wastewater District Notes to the Basic Financial Statements (Continued) For the Years Ended June 30, 2017 and 2016 Note 8 Net Pension Liability and Defined Benefit Pension Plan Changes in the net pension liability and the related deferred outflows and inflows of resources for the year ended June 30, 2017 were as follows: Balance as of Balance as of Type of Account July 1, 2016 Additions Deletions June 30, 2017 Deferred Outflows of Resources: Pension contributions made after the measurement date: CalPERS Miscellaneous Plan $ 978,212 $ 1,145,214 $ (978,212) $ 1,145,214 Adjustment due to differences in proportions: CalPERS Miscellaneous Plan 71, ,346 (137,491) 295,547 Differences between projected and actual earnings on pension plan investments: CalPERS Miscellaneous Plan - 1,722,071-1,722,071 Differences between expected and actual experience: CalPERS Miscellaneous Plan 53,130 - (26,171) 26,959 Total deferred outflows of resources $ 1,103,034 $ 3,228,631 $ (1,141,874) $ 3,189,791 Net Pension Liability: CalPERS Miscellaneous Plan $ 8,304,443 $ 3,715,115 $ (978,212) $ 11,041,346 Deferred Inflows of Resources: Differences between projected and actual earnings on pension plan investments: CalPERS Miscellaneous Plan $ 251,991 $ - $ (251,991) $ - Difference between actual and proportionate share of employer contributions: CalPERS Miscellaneous Plan 411, ,300 (259,898) 518,500 Adjustment due to differences in proportions: CalPERS Miscellaneous Plan 132,869 - (47,453) 85,416 Changes in assumptions: CalPERS Miscellaneous Plan 502,668 - (171,797) 330,871 Total deferred inflows of resources $ 1,298,626 $ 367,300 $ (731,139) $ 934,787 40
43 West County Wastewater District Notes to the Basic Financial Statements (Continued) For the Years Ended June 30, 2017 and 2016 Note 8 Net Pension Liability and Defined Benefit Pension Plan (Continued) Changes in the net pension liability and the related deferred outflows and inflows of resources for the year ended June 30, 2016 were as follows: Balance as of Balance as of Type of Account July 1, 2015 Additions Deletions June 30, 2016 Deferred Outflows of Resources: Pension contributions made after the measurement date: CalPERS Miscellaneous Plan $ 808,084 $ 978,212 $ (808,084) $ 978,212 Difference between actual and proportionate share of employer contributions: CalPERS Miscellaneous Plan 8,119 - (8,119) - Adjustment due to differences in proportions: CalPERS Miscellaneous Plan 111,522 - (39,830) 71,692 Differences between expected and actual experience: CalPERS Miscellaneous Plan - 72,106 (18,976) 53,130 Total deferred outflows of resources $ 927,725 $ 1,050,318 $ (875,009) $ 1,103,034 Net Pension Liability: CalPERS Miscellaneous Plan $ 7,228,755 $ 1,883,772 $ (808,084) $ 8,304,443 Deferred Inflows of Resources: Differences between projected and actual earnings on pension plan investments: CalPERS Miscellaneous Plan $ 2,429,197 $ 6,240 $ (2,183,446) $ 251,991 Difference between actual and proportionate share of employer contributions: CalPERS Miscellaneous Plan 116, ,358 (160,627) 411,098 Adjustment due to differences in proportions: CalPERS Miscellaneous Plan - 180,322 (47,453) 132,869 Changes in assumptions: CalPERS Miscellaneous Plan - 682,192 (179,524) 502,668 Total deferred inflows of resources $ 2,545,564 $ 1,324,112 $ (2,571,050) $ 1,298,626 41
44 West County Wastewater District Notes to the Basic Financial Statements (Continued) For the Years Ended June 30, 2017 and 2016 Note 8 Net Pension Liability and Defined Benefit Pension Plan (Continued) General Information about the Pension Plans The Plans Description Schedule The District has engaged with CalPERS to administer the following pension plans for its employees (members): Plan Description Miscellaneous Plans Classic PEPRA Tier 1 Tier 2 Prior to On or after Hire date January 1, 2013 January 1, 2013 Benefit formula Benefit vesting schedule 5-years or service 5-years or service Benefits payments monthly for life monthly for life Retirement age & up & up Monthly benefits, as a % of eligible compensation 2.0% to 3.0% 1.0% to 2.5% Required member contribution rates 8.000% 6.237% Required employer contribution rates FY % 6.555% Required employer contribution rates FY % 6.237% The District contributes to the California Public Employees Retirement System (CalPERS), a cost-sharing multipleemployer defined benefit pension plan. CalPERS acts as a common investment and administrative agent for participating public entities within the State of California. A full description of the pension plan, benefit provisions, assumptions (for funding, but not accounting purposes), and membership information are listed in the June 30, 2014 Annual Actuarial Valuation Report. This report and CalPERS audited financial statements are publicly available reports that can be obtained at CalPERS website under Forms and Publications. 42
45 West County Wastewater District Notes to the Basic Financial Statements (Continued) For the Years Ended June 30, 2017 and 2016 Note 8 Net Pension Liability and Defined Benefit Pension Plan (Continued) General Information about the Pension Plans (Continued) Members Covered by Benefit Terms At June 30, 2016 (Valuation Date), the following members were covered by the benefit terms: Miscellaneous Plans Classic PEPRA Plan Members Tier 1 Tier 2 Total Active members Transferred and terminated members Retired members and beneficiaries Total plan members At June 30, 2015 (Valuation Date), the following members were covered by the benefit terms: Miscellaneous Plans Classic PEPRA Plan Members Tier 1 Tier 2 Total Active members Transferred and terminated members Retired members and beneficiaries Total plan members Benefits Provided CalPERS provides retirement and disability benefits, annual cost-of-living adjustments, and death benefits to plan members and beneficiaries. A Classic CalPERS Miscellaneous member becomes eligible for service retirement upon attainment of age 55 with at least 5 years of credited service. Public Employees' Pension Reform Act (PEPRA) Miscellaneous members become eligible for service retirement upon attainment of age 62 with at least 5 years of service. The service retirement benefit is a monthly allowance equal to the product of the benefit factor, years of service, and final compensation. The final compensation is the monthly average of the member's highest 36 full-time equivalent monthly pay. Retirement benefits for Classic Miscellaneous members are calculated as a percentage of their plan based the average final 36 months compensation. Retirement benefits for PEPRA Miscellaneous members are calculated as a percentage of their plan based the average final 36 months compensation. 43
46 West County Wastewater District Notes to the Basic Financial Statements (Continued) For the Years Ended June 30, 2017 and 2016 Note 8 Net Pension Liability and Defined Benefit Pension Plan (Continued) General Information about the Pension Plans (Continued) Benefits Provided (Continued) Participant members are eligible for non-industrial disability retirement if they become disabled and have at least 5 years of credited service. There is no special age requirement. The standard non-industrial disability retirement benefit is a monthly allowance equal to 1.8% of final compensation, multiplied by service. Industrial disability benefits are not offered to miscellaneous employees. A member's beneficiary may receive the basic death benefit if the member dies while actively employed. The member must be actively employed with the District to be eligible for this benefit. A member's survivor who is eligible for any other pre-retirement death benefit may choose to receive that death benefit instead of this basic death benefit. The basic death benefit is a lump sum in the amount of the members accumulated contributions, where interest is currently credited at 7.5 percent per year, plus a lump sum in the amount of one month's salary for each completed year of current service, up to a maximum of six months' salary. For purposes of this benefit, one month's salary is defined as the member's average monthly full-time rate of compensation during the 12 months preceding death. Upon the death of a retiree, a one-time lump sum payment of $500 will be made to the retiree's designated survivor(s), or to the retiree's estate. Benefit terms provide for annual cost-of-living adjustments to each member s retirement allowance. Beginning the second calendar year after the year of retirement, retirement and survivor allowances will be annually adjusted on a compound basis by 3%. Contributions Section 20814(c) of the California Public Employees Retirement Law (PERL) requires that the employer contribution rates for all public employers will be determined on an annual basis by the actuary and shall be effective on the July 1 following notice of a change in the rate. The total plan contributions are determined through CalPERS annual actuarial valuation process. The public agency cost-sharing plans covered by the Miscellaneous risk pool, the Plan s actuarially determined rate is based on the estimated amount necessary to pay the Plan s allocated share of the risk pool s costs of benefits earned by employees during the year, and any unfunded accrued liability. The employer is required to contribute the difference between the actuarially determined rate and the contribution rate of members. For the measurement period ending June 30, 2016 and 2015 (Measurement Dates), the active member contribution rate for the Classic Miscellaneous Plan and the PEPRA Miscellaneous Plan are based above in the Plans Description schedule. Contributions for the year ended June 30, 2017 were as follows: Miscellaneous Plans Classic PEPRA Contribution Type Tier 1 Tier 2 Total Contributions employer $ 1,084,720 $ 60,494 $ 1,145,214 Contributions members 402,090 60, ,268 Total contributions $ 1,486,810 $ 120,672 $ 1,607,482 44
47 West County Wastewater District Notes to the Basic Financial Statements (Continued) For the Years Ended June 30, 2017 and 2016 Note 8 Net Pension Liability and Defined Benefit Pension Plan (Continued) General Information about the Pension Plans (Continued) Contributions (Continued) Contributions for the year ended June 30, 2016 were as follows: Miscellaneous Plans Classic PEPRA Contribution Type Tier 1 Tier 2 Total Contributions employer $ 938,447 $ 39,765 $ 978,212 Contributions members 373,907 39, ,755 Total contributions $ 1,312,354 $ 79,613 $ 1,391,967 Net Pension Liability, Pension Expenses, Deferred Outflows of Resources and Deferred Inflows of Resources Related to Pension Plans Actuarial Methods and Assumptions Used to Determine the Total Pension Liability For the measurement periods ending June 30, 2016 and 2015 (Measurement Dates), the total pension liability was determined by rolling forward the June 30, 2015 and 2015 total pension liabilities. The June 30, 2016 and 2015 total pension liabilities were based on the following actuarial methods and assumptions: Actuarial Cost Method Entry Age Normal in accordance with the requirement of GASB Statement No. 68 Actuarial Assumptions: Discount Rate Inflation Salary Increases M ortality Rate Table 7.65% 2.75% Varies by Entry Age and Service Derived using CalPERS Membership Data for all Post Retirement Benefit Increase Contract COLA up to 2.75% until Purchasing Power Protection Allowance Floor on Purchasing Power applies, 2.75% thereafter All other actuarial assumptions used in the June 30, 2016 and 2015 Valuations were based on the results of an actuarial experience study for the period from 1997 to 2011, including updates to salary increase, mortality and retirement rates. The Experience Study report can be obtained at CalPERS website under Forms and Publications. Discount Rate The discount rate used to measure the total pension liability was 7.65 percent. The long-term expected rate of return on the pension plan investments was determined in which best-estimate ranges of expected future real rates are developed for each major asset class. In determining the long-term expected rate of return, both short-term and longterm market return expectations as well as the expected pension fund cash flows were considered. Such cash flows were developed assuming that both members and employers will make their required contributions on time and as scheduled in all future years. 45
48 West County Wastewater District Notes to the Basic Financial Statements (Continued) For the Years Ended June 30, 2017 and 2016 Note 8 Net Pension Liability and Defined Benefit Pension Plan (Continued) Net Pension Liability, Pension Expenses, Deferred Outflows of Resources and Deferred Inflows of Resources Related to Pension Plans (Continued) Discount Rate (Continued) The long-term expected rate of return on pension plan investments was determined using a building-block method in which best-estimate ranges of expected future real rates of return (expected returns, net of pension plan investment expense and inflation) are developed for each major asset class. The table below reflects long-term expected real rate of return by asset class. The rate of return was calculated using the capital market assumptions applied to determine the discount rate and asset allocation. These geometric rates of return are net of administrative expenses. Investment Type New Strategic Allocation Real Return Years Real Return Years Global Equity 51.00% 5.25% 5.71% Global Fixed Income 20.00% 0.99% 2.43% Inflation Sensitive 6.00% 0.45% 3.36% Private Equity 10.00% 6.83% 6.95% Real Estate 10.00% 4.50% 5.13% Infrastructure and Forestland 2.00% 4.50% 5.09% Liquidity 1.00% -0.55% -1.05% % 1 An expected inflation rate-of-return of 2.5% is used for years An expected inflation rate-of-return of 3.0% is used for years
49 West County Wastewater District Notes to the Basic Financial Statements (Continued) For the Years Ended June 30, 2017 and 2016 Note 8 Net Pension Liability and Defined Benefit Pension Plan (Continued) Sensitivity of the District s Proportionate Share of the Net Pension Liability to Changes in the Discount Rate The following presents the District s proportionate share of the net pension liability of the Plan as of the measurement date, calculated using the discount rate of 7.65%, as well as what the District s proportionate share of the net pension liability would be if it were calculated using a discount rate that is 1 percentage-point lower (6.65%) or 1 percentage-point higher (8.65%) than the current rate for the June 30, 2016 Valuation Date as follows: Plan's Net Pension Liability/(Asset) Current Discount Rate Discount Rate -1% Discount Rate +1% Plan Type 6.65% 7.65% 8.65% CalPERS Miscellaneous Plan $ 17,392,292 $ 11,041,346 $ 5,792,604 The following presents the District s proportionate share of the net pension liability of the Plan as of the measurement date, calculated using the discount rate of 7.65%, as well as what the District s proportionate share of the net pension liability would be if it were calculated using a discount rate that is 1 percentage-point lower (6.65%) or 1 percentage-point higher (8.65%) than the current rate for the June 30, 2015 Valuation Date as follows: Plan's Net Pension Liability/(Asset) Current Discount Rate Discount Rate -1% Discount Rate +1% Plan Type 6.65% 7.65% 8.65% CalPERS Miscellaneous Plan $ 14,441,629 $ 8,304,443 $ 3,237,483 Pension Plan Fiduciary Net Position Detail information about the plan s fiduciary net position is available in the separately issued CalPERS financial report and can be obtained from CalPERS website under Forms and Publications. 47
50 West County Wastewater District Notes to the Basic Financial Statements (Continued) For the Years Ended June 30, 2017 and 2016 Note 8 Net Pension Liability and Defined Benefit Pension Plan (Continued) Net Pension Liability, Pension Expenses, Deferred Outflows of Resources and Deferred Inflows of Resources Related to Pension Plans (Continued) Proportionate Share of Net Pension Liability and Pension Expense The following table shows the plan s proportionate share of the risk pool collective net pension liability over the measurement period for the Miscellaneous Plan for the fiscal year ended June 30, 2017: Plan Total Plan Fiduciary Change in Plan Net Plan Type and Balance Descriptions Pension Liability Net Position Pension Liability CalPERS Miscellaneous Plan: Balance as of June 30, 2015 (Measurement Date) $ 45,064,509 $ 36,760,066 $ 8,304,443 Balance as of June 30, 2016 (Measurement Date) $ 47,172,929 $ 36,131,583 $ 11,041,346 Change in Plan Net Pension Liability $ 2,108,420 $ (628,483) $ 2,736,903 The following table shows the plan s proportionate share of the risk pool collective net pension liability over the measurement period for the Miscellaneous Plan for the fiscal year ended June 30, 2016: Plan Total Plan Fiduciary Change in Plan Net Plan Type and Balance Descriptions Pension Liability Net Position Pension Liability CalPERS Miscellaneous Plan: Balance as of June 30, 2014 (Measurement Date) $ 42,594,116 $ 35,365,361 $ 7,228,755 Balance as of June 30, 2015 (Measurement Date) $ 45,064,509 $ 36,760,066 $ 8,304,443 Change in Plan Net Pension Liability $ 2,470,393 $ 1,394,705 $ 1,075,688 48
51 West County Wastewater District Notes to the Basic Financial Statements (Continued) For the Years Ended June 30, 2017 and 2016 Note 8 Net Pension Liability and Defined Benefit Pension Plan (Continued) Net Pension Liability, Pension Expenses, Deferred Outflows of Resources and Deferred Inflows of Resources Related to Pension Plans (Continued) Proportionate Share of Net Pension Liability and Pension Expense (Continued) The following is the approach established by the plan actuary to allocate the net pension liability and pension expense to the individual employers within the risk pool. (1) In determining a cost-sharing plan s proportionate share, total amounts of liabilities and assets are first calculated for the risk pool as a whole on the valuation date (June 30, 2015 and 2014). The risk pool s fiduciary net position ( FNP ) subtracted from its total pension liability (TPL) determines the net pension liability (NPL) at the valuation date. (2) Using standard actuarial roll forward methods, the risk pool TPL is then computed at the measurement date (June 30, 2016 and 2015). Risk pool FNP at the measurement date is then subtracted from this number to compute the NPL for the risk pool at the measurement date. For purposes of FNP in this step and any later reference thereto, the risk pool s FNP at the measurement date denotes the aggregate risk pool s FNP at June 30, 2016 less the sum of all additional side fund (or unfunded liability) contributions made by all employers during the measurement period (2016 fiscal year and the 2015 fiscal year). (3) The individual plan s TPL, FNP and NPL are also calculated at the valuation date. (4) Two ratios are created by dividing the plan s individual TPL and FNP as of the valuation date from (3) by the amounts in step (1), the risk pool s total TPL and FNP, respectively. (5) The plan s TPL as of the Measurement Date is equal to the risk pool TPL generated in (2) multiplied by the TPL ratio generated in (4). The plan s FNP as of the Measurement Date is equal to the FNP generated in (2) multiplied by the FNP ratio generated in (4) plus any additional side fund (or unfunded liability) contributions made by the employer on behalf of the plan during the measurement period. (6) The plan s NPL at the Measurement Date is the difference between the TPL and FNP calculated in (5). 49
52 West County Wastewater District Notes to the Basic Financial Statements (Continued) For the Years Ended June 30, 2017 and 2016 Note 8 Net Pension Liability and Defined Benefit Pension Plan (Continued) Net Pension Liability, Pension Expenses, Deferred Outflows of Resources and Deferred Inflows of Resources Related to Pension Plans (Continued) Proportionate Share of Net Pension Liability and Pension Expense (Continued) The District s proportionate share of the net pension liability for the June 30, 2016 measurement date was as follows: Percentage S hare of Risk Pool Fiscal Year Fiscal Year Change Ending Ending Increase/ June 30, 2017 June 30, 2016 (Decrease) Measurement Date June 30, 2016 June 30, 2015 Percentage of Risk Pool Net Pension Liability % % % Percentage of Plan (PERF C) Net Pension Liability % % % The District s proportionate share of the net pension liability for the June 30, 2015 measurement date was as follows: Percentage S hare of Risk Pool Fiscal Year Fiscal Year Change Ending Ending Increase/ June 30, 2016 June 30, 2015 (Decrease) Measurement Date June 30, 2015 June 30, 2014 Percentage of Risk Pool Net Pension Liability % % % Percentage of Plan (PERF C) Net Pension Liability % % % For the years ended June 30, 2017 and 2016, the District recognized pension expense in the amounts of $1,431,520 and $1,454,984 respectively, for the CalPERS Miscellaneous Plan. The amortization period differs depending on the source of the gain or loss. The difference between projected and actual earnings is amortized over 5-years straight line. All other amounts are amortized straight-line over the average expected remaining service lives of all members that are provided with benefits (active, inactive and retired) as of the beginning of the measurement period. 50
53 West County Wastewater District Notes to the Basic Financial Statements (Continued) For the Years Ended June 30, 2017 and 2016 Note 8 Net Pension Liability and Defined Benefit Pension Plan (Continued) Net Pension Liability, Pension Expenses, Deferred Outflows of Resources and Deferred Inflows of Resources Related to Pension Plans (Continued) Proportionate Share of Net Pension Liability and Pension Expense (Continued) The expected average remaining service lifetime (EARSL) for PERF C for the measurement date ending June 30, 2016 is 3.7 years, which was obtained by dividing the total service years of 475,689 (the sum of remaining service lifetimes of the active employees) by 127,009 (the total number of participants: active, inactive, and retired) in PERF C. Inactive employees and retirees have remaining service lifetimes equal to 0. Total future service is based on the members probability of decrementing due to an event other than receiving a cash refund. The expected average remaining service lifetime (EARSL) for PERF C for the measurement date ending June 30, 2015 is 3.8 years, which was obtained by dividing the total service years of 460,700 (the sum of remaining service lifetimes of the active employees) by 122,789 (the total number of participants: active, inactive, and retired) in PERF C. Inactive employees and retirees have remaining service lifetimes equal to 0. Total future service is based on the members probability of decrementing due to an event other than receiving a cash refund. Deferred Outflows of Resources and Deferred Inflows of Resources At June 30, 2017, the District reported deferred outflows of resources and deferred inflows of resources related to pensions from the following sources: Deferred Outflows Deferred Inflows Account Description of Resources of Resources Pension contributions made after the measurement date $ 1,145,214 $ - Difference between actual and proportionate share of employer contributions - 518,500 Adjustment due to differences in proportions 295,547 85,416 Differences between expected and actual experience 26,959 - Differences between projected and actual earnings on pension plan investments 1,722,071 - Changes in assumptions - 330,871 Total Deferred Outflows/(Inflows) of Resources $ 3,189,791 $ 934,787 The District will recognize $1,145,214 reported as deferred outflows of resources related to pensions resulting from the District s contributions subsequent to the measurement date as a reduction of the net pension liability in the fiscal year ended June 30, 2018, as noted above. Amortization of Deferred Outflows of Resources and Deferred Inflows of Resources Other remaining amounts reported as deferred outflows of resources and deferred inflows of resources related to pensions will be amortized to pension expense in future periods as follows: 51
54 West County Wastewater District Notes to the Basic Financial Statements (Continued) For the Years Ended June 30, 2017 and 2016 Note 8 Net Pension Liability and Defined Benefit Pension Plan (Continued) Net Pension Liability, Pension Expenses, Deferred Outflows of Resources and Deferred Inflows of Resources Related to Pension Plans (Continued) Deferred Amortization Period Outflows/(Inflows Fiscal Year Ended June 30 of Resources Deferred Outflows of Resources and Deferred Inflows of Resources 2018 $ (87,357) 2019 (21,528) , ,032 Total $ 1,109,790 At June 30, 2016, the District reported deferred outflows of resources and deferred inflows of resources related to pensions from the following sources: Deferred Outflows Deferred Inflows Account Description of Resources of Resources Pension contributions made after the measurement date $ 978,212 $ - Difference between actual and proportionate share of employer contributions - 411,098 Adjustment due to differences in proportions 71, ,869 Differences between expected and actual experience 53,130 - Differences between projected and actual earnings on pension plan investments - 251,991 Changes in assumptions - 502,668 Total Deferred Outflows/(Inflows) of Resources $ 1,103,034 $ 1,298,626 The District will recognize $978,212 reported as deferred outflows of resources related to pensions resulting from the District s contributions subsequent to the measurement date as a reduction of the net pension liability in the fiscal year ended June 30, 2017, as noted above. Amortization of Deferred Outflows of Resources and Deferred Inflows of Resources Other remaining amounts reported as deferred outflows of resources and deferred inflows of resources related to pensions will be amortized to pension expense in future periods as follows: Amortization Period Fiscal Year Ended June 30 Deferred Outflows/(Inflows of Resources 2017 $ (520,168) 2018 (520,403) 2019 (455,342) ,109 Total $ (1,173,804) 52
55 West County Wastewater District Notes to the Basic Financial Statements (Continued) For the Years Ended June 30, 2017 and 2016 Note 9 Loans Payable Summary changes in long-term debt balances for the years ended June 30, 2017 were as follows: Amount Amount Balance Balance Due Within Due In More Than Description July 1, 2016 Additions Deletions June 30, 2017 One Year One Year Loans payable: SRF Loan Phase I, Segment 1 $ 61,959 $ 1,441,655 $ (83,013) $ 1,420,601 $ 62,784 $ 1,357,817 SRF Loan Phase I, Segment 2 267,134 2, , ,510 SRF Loan Phase I, Segment 3 474,567 8,486,934-8,961,501-8,961,501 SRF Loan Recycled Water Upgrades 1,759,640 13,193,831-14,953, ,117 14,274,354 Total loans payable $ 2,563,300 $ 23,124,796 $ (83,013) $ 25,605,083 $ 741,901 $ 24,863,182 Summary changes in long-term debt balances for the years ended June 30, 2016 were as follows: Amount Amount Balance Balance Due Within Due In More Than Description July 1, 2015 Additions Deletions June 30, 2016 One Year One Year Loans payable: SRF Loan Phase I, Segment 1 $ 54,050 $ 7,909 $ - $ 61,959 $ 2,575 $ 59,384 SRF Loan Phase I, Segment 2 20, , , ,134 SRF Loan Phase I, Segment 3-474, , ,567 SRF Loan Recycled Water Upgrades - 1,759,640-1,759,640-1,759,640 Total loans payable $ 74,969 $ 2,488,331 $ - $ 2,563,300 $ 2,575 $ 2,560,725 SRF Loan Payable Wastewater Facility and Collection System Rehabilitation Project Phase I, Segment 1 In 2015, the District entered into an agreement with the California State Water Resources Control Board (SWRCB) for a 20-year State Revolving Fund (SRF) loan in an amount not-to-exceed $1,654,505 with an interest rate of 1.90% per annum for capital projects. As of June 30, 2017, eligible costs for reimbursement were $1,420,601 and accrued as a long-term debt liability on the financial statements. Principal and interest payments are due and payable on June 30 th each year as follows: Fiscal Year Principal Interest Total 2018 $ 62,784 $ 26,991 $ 89, ,976 25,799 89, ,192 24,583 89, ,431 23,344 89, ,693 22,082 89, ,253 90, , ,605 55, , ,667 16, ,100 Total $ 1,420,601 $ 285,124 $ 1,705,725 53
56 West County Wastewater District Notes to the Basic Financial Statements (Continued) For the Years Ended June 30, 2017 and 2016 Note 9 Loans Payable (Continued) SRF Loan Payable - Wastewater Facility and Collection System Rehabilitation Project Phase I, Segment 2 In 2015, the District entered into an agreement with the California State Water Resources Control Board (SWRCB) for a 20-year State Revolving Fund (SRF) loan in an amount not-to-exceed $2,881,758 with an interest rate of 1.90% per annum for capital projects. As of June 30, 2017, eligible costs for reimbursement were $269,510 and accrued as a long-term debt liability on the financial statements. Fiscal Year Principal Interest Total 2018 $ - $ - $ ,203 5,121 16, ,416 4,908 16, ,633 4,691 16, ,854 4,470 16, ,733 18,887 81, ,925 12,695 81, ,727 5,893 81, , ,324 Total $ 269,510 $ 56,970 $ 326,480 SRF Loan Payable - Wastewater Facility and Collection System Rehabilitation Project Phase I, Segment 3 In fiscal year 2015, the District entered into an agreement with the California State Water Resources Control Board (SWRCB) for a 20-year State Revolving Fund (SRF) loan in an amount not-to-exceed $14,593,521 with an interest rate of 1.90% per annum for capital projects. As of June 30, 2017, eligible costs for reimbursement were $8,961,501 and accrued as a long-term debt liability on the financial statements. Fiscal Year Principal Interest Total 2018 $ - $ - $ , , , , , , , , , , , , ,085, ,925 2,713, ,291, ,083 2,713, ,517, ,927 2,713, ,660 10, ,781 Total $ 8,961,501 $ 1,894,121 $ 10,855,622 54
57 West County Wastewater District Notes to the Basic Financial Statements (Continued) For the Years Ended June 30, 2017 and 2016 Note 9 Loans Payable (Continued) SRF Loan Payable Recycled Water Reliability Upgrades In fiscal year 2015, the District entered into an agreement with the California State Water Resources Control Board (SWRCB) for a 20-year State Revolving Fund (SRF) loan in an amount not-to-exceed $30,457,093 with an interest rate of 1.00% per annum for capital projects. As of June 30, 2017, eligible costs for reimbursement were $14,953,471 and accrued as a long-term debt liability on the financial statements. Fiscal Year Principal Interest Total 2018 $ 679,117 $ 149,534 $ 828, , , , , , , , , , , , , ,640, ,370 4,143, ,826, ,649 4,143, ,021, ,452 4,143,255 Total $ 14,953,471 $ 1,619,549 $ 16,573,020 Note 10 Net Investment in Capital Assets Net investment in capital assets consisted of the following as of June 30: Description June 30, 2017 June 30, 2016 Net investment in capital assets: Capital assets not being depreciated $ 44,374,060 $ 20,959,724 Capital assets, net being depreciated 60,626,108 61,610,327 Loans payable current (741,901) (2,575) Loans payable non-current (24,863,182) (2,560,725) Total net investment in capital assets $ 79,395,085 $ 80,006,751 Note 11 Deferred Compensation Savings Plan For the benefit of its employees, the District participates in IRC No. 457 Deferred Compensation Programs. The purpose of these Programs are to provide deferred compensation for public employees that elect to participate in the Program. Generally, eligible employees may defer receipt of a portion of their salary until termination, retirement, death or unforeseeable emergency. Until the funds are paid or otherwise made available to the employee, the employee is not obligated to report the deferred salary for income tax purposes. Federal law requires deferred compensation assets to be held in trust for the exclusive benefit of the participants. The District is in compliance with this legislation. Therefore, these assets are not the legal property of the District, and are not subject to claims of the District s general creditors. 55
58 West County Wastewater District Notes to the Basic Financial Statements (Continued) For the Years Ended June 30, 2017 and 2016 Note 11 Deferred Compensation Savings Plan (Continued) The District has implemented GASB Statement No. 32, Accounting and Financial Reporting for Internal Revenue Code Section 457 Deferred Compensation Plans. Since the District has little administrative involvement and does not perform the investing function for this plan, the assets and related liabilities are not shown on the balance sheet. Note 12 Risk Management The District participates in a joint venture under a joint power agreement (JPA) with the California Sanitation Risk Management Authority (CSRMA). The relationship between the District and CSRMA is such that CSRMA is not a component unit of the District for financial reporting purposes. CSRMA arranges for and provides workers compensation, property, liability, errors, and omissions insurance for its member governmental entities. A board consisting of representatives from its member entities governs the CSRMA. The board controls the operations of the CSRMA including selection of management and approval of operating budgets, independent of any influence by the member agency beyond their representation on the board. Each member agency pays a premium commensurate with the level of coverage requested and shares surpluses and deficits proportionate to their participation in the CSRMA. CSRMA has budgeting and financial reporting requirements independent of member units and its financial statements are not presented in these financial statements; however, fund transactions between CSRMA and the District are included in these statements. Audited financial statements are available from the respective entity. In addition to the primary insurance types provided for through CSRMA listed above, the District also maintains commercial fidelity bonds, public employee dishonesty and public official bonds, to protect against employee theft or defalcation. Settled claims for CSRMA or the District s commercial fidelity bonds have not exceeded coverage in any of the past three fiscal years. Note 13 Commitments and Contingencies West County Agency A Joint Venture The West County Agency (Agency) operates under a joint exercise of powers agreement between the District, the City of Richmond and the Richmond Municipal Sewer District. The Agency is a joint-venture, which is legally separate from its participants and is governed by a Board of Directors appointed by and from the governing boards of its member agencies. The Board of Directors establishes the Agency s operating budget, which sets the contributions required from each of the member agencies and exercises the other powers specified in the joint exercise of powers agreement. Expenses consist of pipeline and outfall operations and maintenance costs. Agency assets are held separately from the District s assets, and the Agency does not hold any significant assets or liabilities at this time. As of June 30, 2017 and 2016, the Agency has an unrestricted net position (deficit) of ($2,780) and $43,964. For more detail, the financial statements of the Agency are available at the District s office. Grant Awards Grant funds received by the District are subject to audit by the grantor agencies. Such audits could lead to requests for reimbursements to the grantor agencies for expenditures disallowed under terms of the grant. Management of the District believes that such disallowances, if any, would not be significant. Litigation In the ordinary course of operations, the District is subject to claims and litigation from outside parties. After consultation with legal counsel, the District believes the ultimate outcome of such matters, if any, will not materially affect its financial condition. 56
59 REQUIRED SUPPLEMENTARY INFORMATION 57
60 This page intentionally left blank 58
61 West County Wastewater District Required Supplementary Information (Unaudited) Schedule of the District's Proportionate Share of the Plan's Net Pension Liability For the Year Ended June 30, 2017 Last Ten Fiscal Years California Public Employees' Retirement System (CalPERS) Miscellaneous Plan Measurement Date: June 30, June 30, June 30, District's Proportion of the Net Pension Liability % % % District's Proportionate Share of the Net Pension Liability $ 11,041,346 $ 8,304,443 $ 7,228,755 District's Covered-Employee Payroll $ 5,722,480 $ 5,320,757 $ 4,275,865 District's Proportionate Share of the Net Pension Liability as a Percentage of Covered-Employee Payroll % % % Plan's Fiduciary Net Position as a Percentage of the Plan's Total Pension Liability 74.06% 78.40% 83.03% 1 Historical information is presented only for measurement periods for which GASB No. 68 is applicable. 59
62 West County Wastewater District Required Supplementary Information (Unaudited) Schedule of the District's Contributions to the Pension Plan For the Year Ended June 30, 2017 Last Ten Fiscal Years California Public Employees' Retirement System (CalPERS) Miscellaneous Plan Fiscal Year: Actuarially Determined Contribution 2 $ 1,145,214 $ 978,212 $ 808,084 $ 809,429 Contribution in Relation to the Actuarially Determined Contribution 2 (1,145,214) (978,212) (808,084) (809,429) Contribution Deficiency (Excess) $ - $ - $ - $ - District''s Covered-Employee Payroll $ 5,941,774 $ 5,722,480 $ 5,320,757 $ 4,275,865 Contributions as a Percentage of Covered- Employee Payroll 19.27% 17.09% 15.19% 18.93% 1 Historical information is presented only for measurement periods for which GASB No. 68 is applicable. 2 Employers are assumed to make contributions equal to the actuarially determined contributions (which is the actuarially determined contribution). However, some employers may choose to make additional contributions towards their side-fund or their unfunded liability. Employer contributions for such plan exceed the actuarial determined contributions. CalPERS has determined that employer obligations referred to as side-funds are not considered separately financed specific liabilities. 3 Covered-Employee Payroll represented above is based on pensionable earnings provided by the employer. However, GASB No. 68 defines covered-employee payroll as the total payroll of employees that are provided pensions through the pension plan. Accordingly, if pensionable earnings are different than total earnings for covered-employees, the employer should display in the disclosure footnotes the payroll based on total earnings for the covered group and recalculate the required payroll-related ratios. Notes to the Schedule: Change in Benefit Terms: The figures above do not include any liability impact that may have resulted from plan changes which occurred after June 30, 2013 as they have minimal cost impact. This applies for voluntary benefit changes as well as any offers of Two Years Additional Service Credit (a.k.a. Golden Handshakes). 60
63 West County Wastewater District Required Supplementary Information (Unaudited) Schedule of Funding Progress Other Post-Employment Benefits Plan For the Years Ended June 30, 2017 and 2016 Unfunded UAAL as a Actuarial Actuarial Actuarial Percentage Actuarial Value of Accrued Accrued Funded Covered of Covered Valuation Plan Assets Liability Liability (UAAL) Ratio Payroll Payroll Date (a) (b) (b-a) (a/b) (c) ((b-a)/c) June 30, 2016 $ 5,219,000 $ 9,806,000 $ 4,587, % $ 5,264, % June 30, 2013 $ 2,495,000 $ 9,614,000 $ 7,119, % $ 4,121, % January 1, 2011 $ 601,100 $ 6,962,700 $ 6,361, % $ 4,521, % January 1, 2008 $ - $ 6,747,000 $ 6,747, % $ 3,900, % Notes to the Schedule: Funding progress is presented for the years that an actuarial study has been prepared since the effective date of GASB Statement 45. Actuarial review and analysis of the post-employment benefits liability and funding status is performed every three years or annually, if there are significant changes in the plan. 61
64 This page intentionally left blank 62
65 STATISTICAL INFORMATION 63
66 This page intentionally left blank 64
67 WEST COUNTY WASTEWATER DISTRICT STATISTICAL SECTION (Unaudited) TABLE OF CONTENTS Page Number Introduction 66 Financial Trends Changes in Net Position and Statement of Net Position Revenues by Type Operating Expenses by Function 71 Revenue Capacity Major Revenue Base and Rates 72 Principal Revenue Sources 73 Property Tax Information 74 Schedule of Capacity Charges 75 Debt Capacity Debt Capacity and Loan Repayment Schedule 76 Demographic and Economic Information District Population, Income and Unemployment 77 Charts of Population Served and Unemployment Rate 78 Charts of Total Personal Income and Per Capita Personal Income 79 Principal Employers 80 Full Time Equivalent Employees 81 Operating Information Engineering Permits Completed 82 Collection System Activity 82 Treatment Plant Activity 83 Facility Capacity Data 83 Sources: Unless otherwise noted, the source of the information is the comprehensive annual financial reports for each year. 65
68 WEST COUNTY WASTEWATER DISTRICT STATISTICAL SECTION - INTRODUCTION This section of the District s comprehensive annual financial report presents detailed information as a context for understanding what the information in the financial statements, note disclosures and required supplementary information says about the District s overall financial health Financial Trends These schedules contain trend information to help the reader understand how the District s financial position has changed over time. Revenue Capacity These schedules contain trend information to help the reader assess the District s most significant revenue sources. Debt Capacity This schedule contains trend information to help the reader assess the District s debt burden and its ability to issue additional debt in the future. Demographic & Economic Information These schedules offer demographic and economic indicators to help the reader understand the environment within which the District s financial activities take place. Operating Information These schedules contain trend information about the District s operations and resources to help the reader in using the District s financial report to understand and assess its economic condition. 66
69 FINANCIAL TRENDS WEST COUNTY WASTEWATER DISTRICT CHANGES IN NET POSITION AND STATEMENT OF NET POSITION Last Ten Fiscal Years Change in Net Position Operating Revenues: Sewer use charge $ 19,780,211 $ 17,290,831 $ 15,650,703 $ 14,038,949 $ 13,854,746 Inspection/permit fees 300, , , , ,166 Contract services 221, , , , ,075 Other revenue 170, ,698 25,302 24, ,429 Total operating revenue 20,472,104 18,062,154 16,321,820 14,572,231 14,789,416 - Operating Expenses: Sewage collection 3,783,288 3,815,139 3,768,123 3,639,837 3,372,341 Sewage treatment 6,784,087 5,976,699 5,704,464 5,208,478 6,798,874 Administration 3,899,443 2,631,540 2,740,638 2,868,589 2,935,722 Contract services 147, , , , ,623 West County Agency 174, , , , ,391 Depreciation 3,071,113 3,119,615 3,222,967 2,940,249 2,921,783 Total operating expenses 17,859,203 15,963,955 15,847,543 15,060,697 16,675,734 Operating Income (Loss) 2,612,901 2,098, ,277 (488,466) (1,886,318) Non-Operating Revenue (Expenses): Property taxes 1,057, , , , ,228 Redevelopment allocation 160, , , ,307 23,864 Rental income 90, , , , ,448 Investment earnings 61,556 70,451 43,743 34,712 30,257 Other revenue (expense), net (109,312) (2,275,124) Total non-operating revenues (expenses) 1,261,279 1,543,857 (856,885) 1,286, ,797 Net income before capital contributions 3,874,180 3,642,056 (382,608) 797,699 (927,521) State capital grants 6,966,498 Connection fees 970, , , , ,916 Contributed sewer lines Total capital contributions 7,937, , , , ,916 CHANGE IN NET POSITION 11,811,653 4,095, ,925 1,000,177 (759,605) Beginning of year 81,532,403 77,437,169 86,070,895 85,070,718 85,830,323 Prior period adjustments (9,067,651) Net Position - End of year $ 93,344,056 $ 81,532,403 $ 77,437,169 $ 86,070,895 $ 85,070,718 Balance Sheet Invested in Capital Assets $ 79,395,085 $ 80,006,751 $ 67,486,623 $ 70,302,862 $ 69,404,267 Unrestricted 13,948,971 1,525,652 9,950,546 15,768,033 15,666,451 Total Net Position $ 93,344,056 $ 81,532,403 $ 77,437,169 $ 86,070,895 $ 85,070,718 Source: West County Wastewater District Audited Financial Statements Continued on page 68 67
70 FINANCIAL TRENDS (CONTINUED) WEST COUNTY WASTEWATER DISTRICT CHANGES IN NET POSITION AND STATEMENT OF NET POSITION Last Ten Fiscal Years (continued) Change in Net Position Operating Revenues: Sewer use charge $ 12,239,921 $ 12,182,304 $ 9,762,875 8,518,032 8,021,917 Inspection/permit fees 45,645 46, , , ,516 Contract services 332, , , , ,319 Other revenue 45,097 64, , ,122 2,317 Total operating revenue 12,662,700 12,632,862 10,158,799 9,106,844 8,333,069 Operating Expenses: Sewage collection 2,908,773 3,176,367 2,847,920 2,655,270 2,498,797 Sewage treatment 5,712,477 5,940,831 6,023,821 5,131,650 5,126,766 Administration 2,554,171 2,515,705 2,713,479 2,062,106 1,840,392 Contract services 287, ,973 55,756 69,787 67,415 West County Agency 105, ,273 91, , ,760 Depreciation 2,735,155 2,856,717 2,814,261 2,747,202 2,694,193 Total operating expenses 14,303,594 14,877,866 14,546,322 12,791,380 12,350,323 Operating Income (Loss) (1,640,894) (2,245,004) (4,387,523) (3,684,536) (4,017,254) Non-Operating Revenue (Expenses): Property taxes 737, , , , ,153 Redevelopment allocation 70,857 Rental income 199, , ,448 1,052,082 1,052,159 Investment earnings 49,106 64, ,733 89,169 87,576 Other revenue (expense), net (256,871) (108,804) 286, ,315 Total non-operating revenues (expenses) 800,968 1,037,313 1,497,628 1,599,085 2,374,203 Net income before capital contributions (839,926) (1,207,691) (2,889,895) (2,085,451) (1,643,051) State capital grants Connection fees 192,636 1,068, , , ,289 Contributed sewer lines 541, ,000 1,458,000 Total capital contributions 192,636 1,068, , ,492 1,735,289 CHANGE IN NET POSITION (647,290) (138,764) (1,930,355) (1,840,959) 92,238 Beginning of year 86,477,613 86,616,377 88,546,732 90,387,691 90,295,453 Prior period adjustments Net Position - End of year $ 85,830,323 $ 86,477,613 $ 86,616,377 $ 88,546,732 $ 90,387,691 Balance Sheet Invested in Capital Assets $ 69,725,812 $ 69,663,380 $ 68,847,559 $ 67,628,792 $68,067,208 Unrestricted 16,104,511 16,814,233 17,768,818 20,917,940 22,320,483 Total Net Position $ 85,830,323 $ 86,477,613 $ 86,616,377 $ 88,546,732 $ 90,387,691 Source: West County Wastewater District Audited Financial Statements Continued from page 67 68


71 WEST COUNTY WASTEWATER DISTRICT REVENUES BY TYPE Last Ten Fiscal Years Combined Revenues (in millions) Source: West County Wastewater District Audited Financial Statements 69
72 WEST COUNTY WASTEWATER DISTRICT REVENUES BY TYPE Last Ten Fiscal Years OPERATING REVENUES FYE June 30 Sewer Use Charge Inspection/ Permit fees Contract Services Other Revenue Total Operating ,021, , ,319 2,317 8,333, ,518, , , ,122 9,106, ,762, , , ,759 10,158, ,182,304 46, ,517 64,979 12,632, ,239,921 45, ,037 45,097 12,662, ,854, , , ,429 14,789, ,038, , ,961 24,182 14,572, ,650, , ,339 25,302 16,321, ,290, , , ,698 18,062, ,780, , , ,067 20,472,104 Source: West County Wastewater District Audited Financial Statements NON-OPERATING REVENUES FYE June 30 Property Taxes Investment Earnings Rental Income Other Total Non- Operating ,153 87,576 1,052, ,315 2,374, ,834 89,169 1,052,082 1,599, , , , ,370 1,497, ,524 64, ,948-1,146, ,759 49, ,974-1,057, ,092 30, , , ,446 34, ,007 1,286, ,115,669 43, ,827 1,418, ,119,870 70, ,536 1,543, ,218,094 61,556 90,941 1,370,591 70


73 WEST COUNTY WASTEWATER DISTRICT OPERATING EXPENSES BY FUNCTION Last Ten Fiscal Years Source: West County Wastewater District Audited Financial Statements OPERATING EXPENSES FYE June 30 Sewage Collection Sewage Treatment Administration Service Contracts WCA Depreciation Total ,498,797 5,126,766 1,840,392 67, ,760 2,694,193 12,350, ,655,270 5,131,650 2,062,106 69, ,365 2,747,202 12,791, ,847,920 6,023,821 2,713,479 55,756 91,085 2,814,261 14,546, ,176,367 5,940,831 2,515, , ,273 2,856,717 14,877, ,908,773 5,712,477 2,554, , ,041 2,735,155 14,303, ,372,341 6,798,874 2,935, , ,391 2,921,783 16,675, ,639,837 5,208,478 2,868, , ,670 2,940,249 15,060, ,768,123 5,704,464 2,740, , ,463 3,222,967 15,847, ,815,139 5,976,699 2,631, , ,541 3,119,615 15,963, ,783,288 6,784,087 3,899, , ,212 3,071,113 17,859,203 Source: West County Wastewater District Audited Financial Statements 71
74 REVENUE CAPACITY WEST COUNTY WASTEWATER DISTRICT MAJOR REVENUE BASE AND RATES Last Ten Fiscal Years ANNUAL SEWER SERVICE (ENVIORNMENTAL QUALITY) CHARGE (Single dwelling) $500 $468 $400 $422 $381 $347 $300 $304 $279 $256 $226 $200 $180 $190 $100 $ Source: West County Wastewater District Audited Financial Statements Note: All residential accounts pay a flat sewer service charge per household. Charges for commercial users consist of an annual rate based upon measured volume of water usage. $5,000 $4,000 CONNECTION FEE (Single dwelling) $4,407 $3,000 $2,000 $2,357 $2,431 $2,547 $2,613 $2,778 $2,853 $2,853 $2,993 $3,070 $1,000 $ Source: West County Wastewater District Audited Financial Statements Note: New customers who are connected to the wastewater system are charged a connection fee. 72
75 WEST COUNTY WASTEWATER DISTRICT PRINCIPAL REVENUE SOURCES Current and Ten Years Ago FYE 6/30/17 FYE 6/30/07 Customer Type of Business Sewer Use Charge Rank % of SUC Sewer Use Charge Rank % of SUC East Bay MUD Industrial 1,790, % 635, % Guardian & KW Hilltop LLC Multi-family residential 412, % Chevron Refinery Industrial 284, % Richmond Essex LP Multi-family residential 176, % 73, % Menlo Westridge Afford Partners Multi-family residential 163, % FF Hills LP Multi-family residential 139, % Steadfast Hilltop Commons LP Multi-family residential 132, % 55, % Contra Costa County Public Agency 124, % Pacific Mobile IV LP Mobile Home Park 102, % US REIF Sierra Ridge CA LP Multi-family residential 98, % Hilltop Bayview Multi-family residential 171, % Berlex Laboratories, Inc. Light Industry 74, % West Contra Costa Hospital Hospital 53, % Hilltop Mall Commercial/Restaurants 52, % Quality Carriers, Inc. Light Industry 43, % The Summit at Hilltop- Prime Richmond Housing Multi-family residential 40, % Richmond Tides Owner Multi-family residential 34, % Total 3,424, % 1,234, % Source: West County Wastewater District Audited Financial Statements FYE 6/30/17 FYE 6/30/07 Sewer Use Charge Customer Type Sewer Revenue % of Total Sewer Revenue % of Total Residential $ 15,176,741 77% $ 5,639,461 73% Commercial 2,546,284 13% 1,259,825 16% Industrial 2,057,186 10% 786,254 10% Total $ 19,780, % $ 7,685, % Source: West County Wastewater District Audited Financial Statements 73
76 WEST COUNTY WASTEWATER DISTRICT PROPERTY TAX INFORMATION Last Ten Fiscal Years Assessed Valuation of Taxable Property within the District FYE June 30 County Secured County Unsecured Total % Change ,796,654, ,438,391 7,991,092, ,814,586, ,885,599 8,009,472, % ,190,398, ,496,264 6,382,894, % ,555,576, ,169,554 6,750,746, % ,135,176, ,644,475 6,367,821, % ,967,088, ,265,098 6,146,353, % ,747,353, ,879,011 6,932,232, % ,355,374, ,228,652 7,559,603, % ,907,856, ,944,749 8,107,801, % ,484,774, ,601,420 8,682,376, % Source: Contra Costa County Auditor-Controller "Certificate of Assessed Valuations" Property Tax and Sewer Service Charge Fees Collected FYE June 30 Property Tax Sewer Service Charges ,153 8,021, ,834 8,518, ,077 9,762, ,524 12,182, ,759 12,239, ,092 13,854, ,446 14,038, ,115,669 15,650, ,119,870 17,290, ,218,094 19,780,211 Source: West County Wastewater District Audited Financial Statements Note: In FY 2010, Proposition 1A shifted a portion of the District property tax revenues to the State. In FY 2011, a settlement by Contra Costa County with Chevron reduced property tax revenue. 74
77 WEST COUNTY WASTEWATER DISTRICT SCHEDULE OF CAPACITY CHARGES FY 2017 FY 2016 Beginning Balance July 1-677,564 Capacity charge fee revenue received during the year: Connection fees 175,260 82,111 Flow zone fees 50,206 33,237 45, Toll zone Capacity charge revenue for the FY 271, ,893 Interest earned on investments 2,039 Capacity construction project cost incurred during the year: Market Street sewer replacement Project 14CS204 (1) (146,216) (795,495) Church Lane to Road 20 sewer replacement Project 14CS214 (2) (125,529) Ending Balance - - (1) Total cost of Project 14CS204 was $941,711 as of 6/30/16. (2) Total cost of Project 14CS214 was $239,318 as of 6/30/17. 75
78 WEST COUNTY WASTEWATER DISTRICT DEBT CAPACITY AND LOAN REPAYMENT SCHEDULE Ten Fiscal Years Debt capacity The District s ability to borrow is dependent upon the capacity to increase sewer usage fees to pay for the proposed debt. The District is committed to balancing the costs of operations, maintenance, and environmental compliance with the goal of minimizing the burden on ratepayers. The District has no current legal debt limit and there is no maximum allowable amount of debt that the District may borrow. During fiscal year 2015, the District applied for and was granted approval for four California State Water Resources Control Board (SRF) loans to finance capital improvement projects: Repayment Dates Loan Interest Agreement # Start End Rate Loan Available Loan Amount /6/2017 5/6/ % 1,654,505 1,420, /11/2019 4/11/ % 2,881, , /30/2018 8/30/ % 14,593,521 8,961, (1) 6/3/2018 6/3/ % 30,457,093 14,953,471 Total as of 6/30/17 49,586,877 25,605,083 Repayment Schedule (2): Principal Interest Total FYE 6/30/18 741, , ,426 FYE 6/30/19 1,133, ,931 1,477,531 FYE 6/30/20 1,148, ,566 1,477,531 FYE 6/30/21 1,164, ,971 1,477,531 FYE 6/30/22 1,180, ,141 1,477,531 FYE 6/30/23 1,196, ,044 1,477,501 FYE 6/30/24 1,212, ,765 1,477,531 FYE 6/30/25 1,229, ,211 1,477,531 FYE 6/30/26 1,246, ,407 1,477,531 FYE 6/30/27 1,263, ,349 1,477,531 Thereafter 14,087,816 1,156,828 15,244,643 Total 25,605,083 3,855,738 29,460,821 (1) Loan Available amount is before grants awarded under Proposition 1 of $5,356,330 and Proposition 13 of $4,000,000. As of June 30, 2017, grant proceed of $6,966,498 were received. (2) This is a tentative payment schedule. The final payment schedule will be provided by the SRF after all disbursements are paid and project construction is complete. The District incurs the costs of the projects and submits claims for reimbursement to the SRF. To pay for these loans, the District passed resolutions to increase sewer use fees by 11% each year for the five years 7/1/15 through 6/30/20. District rates will remain below the average for Bay Area special districts. 76
79 WEST COUNTY WASTEWATER DISTRICT DEMOGRAPHIC AND ECONOMIC INFORMATION Ten Fiscal Years District Population, Income and Unemployment District Per Capita Average County Contra Costa Population Fiscal District Total Personal Personal Unemployment County as % of Year Population Income (A) Income Rate (B) Population County ,398 7,199,409,852 57, % 1,048, % ,236 7,101,276,754 56, % 1,061, % ,096 6,938,449,640 55, % 1,049, % ,597 5,492,228,784 56, % 1,059, % ,296 5,740,526,109 59, % 1,069, % ,998 6,077,955,966 62, % 1,083, % ,724 6,104,627,626 61, % 1,097, % ,511 6,388,349,816 64, % 1,111, % ,481 6,932,319,943 67, % 1,123, % ,650 7,270,101,341 70, % 1,139, % Sources: * Population: State of California, Department of Finance, Demographic Research Unit, including adjustments, as of January 2017, based upon the approximate percentage of total population served in each of the following areas: through Fiscal Year San Pablo 100%, Pinole 18%, Richmond 28% and unincorporated Contra Costa County 35%; effective Fiscal Year 2011 San Pablo 100%, Pinole 8%, Richmond 31% and unincorporated Contra Costa County 21%. * Total Personal Income: State of California, Department of Finance, Demographic Research Unit, including adjustments, as of January 2017 * Unemployment Rate: State of California, Employment Development Department, as of June 2017 Notes: (A) Data calculated by multiplying District population by Per Capita Personal Income (B) Data presented for Contra Costa County data not available at the District level. 77

80 WEST COUNTY WASTEWATER DISTRICT DEMOGRAPHIC AND ECONOMIC INFORMATION Ten Fiscal Years Population Served Unemployment Rate 78


 Per Capita")
81 WEST COUNTY WASTEWATER DISTRICT DEMOGRAPHIC AND ECONOMIC INFORMATION Ten Fiscal Years Total Personal Income (in billions) Per Capita Personal Income 79
WEST 30, June. Prepared by:
 WEST COUNTY WASTEWATER DISTRICT Richmond, CA COMPREHENSIVE ANNUAL FINANCIAL REPORT For the Fiscal Yearr Ended June 30, 2016 Prepared by: Business Services Department WEST COUNTY WASTEWATER DISTRICT COMPREHENSIVE
Diablo Water District
 Diablo Water District Oakley, California Annual Financiall Report For the Years Endedd June 30, 2016 and 2015 For the Year Ended June 30, 2016 BOARD OF DIRECTORS Howard Hobbs Kenneth L. Crockett Enrico
BROWARD COUNTY, FLORIDA WATER AND WASTEWATER FUND A Major Fund of Broward County, Florida
 BROWARD COUNTY, FLORIDA WATER AND WASTEWATER FUND A Major Fund of Broward County, Florida Financial Statements For the Years Ended BROWARD COUNTY, FLORIDA WATER AND WASTEWATER FUND FINANCIAL STATEMENTS
Our Mission Statement
 Our Mission Statement The is a public agency whose goal is the protection of the Chino Groundwater Basin in order to guarantee that current and future water needs will be met. The Basin is protected by
METROPOLITAN SEWER DISTRICT OF GREATER CINCINNATI HAMILTON COUNTY TABLE OF CONTENTS. Independent Auditor s Report... 1
 METROPOLITAN SEWER DISTRICT OF GREATER CINCINNATI TABLE OF CONTENTS TITLE PAGE Independent Auditor s Report... 1 Prepared by Management: Management s Discussion and Analysis... 5 Basic Financial Statements:
Tehachapi Valley Recreation and Park District Annual Financial Report
 Tehachapi Valley Recreation and Park District Tehacha api, California Annual Financiall Report For the Year Ended June 30, 2017 Annual Financial Report Table of Contents Table of Contents... i FINANCIAL
Comprehensive Annual Financial Report Year Ended June 30, 2018
 Comprehensive Annual Financial Report Year Ended June 30, 2018 Indio, California Comprehensive Annual Financial Report For the Year Ended June 30, 2018 Prepared by: Administration and Finance Department
Ramona Municipal Water District Financial Statements June 30, 2016
 Ramona Municipal Water District Financial Statements INDEX TO FINANCIAL STATEMENTS Independent Auditor s Report... 2 Management s Discussion and Analysis... 5 Statement of Net Position... 12 Statement
SONOMA VALLEY COUNTY SANITATION DISTRICT (A Component Unit of the County of Sonoma) Independent Auditor s Reports, Management s Discussion and
 Independent Auditor s Reports, Management s Discussion and") . SONOMA VALLEY COUNTY SANITATION DISTRICT (A Component Unit of the County of Sonoma) Independent Auditor s Reports, Management s Discussion and Analysis and Basic Financial Statements For the Fiscal Year
. SONOMA VALLEY COUNTY SANITATION DISTRICT (A Component Unit of the County of Sonoma) Independent Auditor s Reports, Management s Discussion and Analysis and Basic Financial Statements For the Fiscal Year
WEST BAY SANITARY DISTRICT FINANCIAL STATEMENTS AND INDEPENDENT AUDITOR S REPORT JUNE 30, 2015 * * *
 WEST BAY SANITARY DISTRICT FINANCIAL STATEMENTS AND INDEPENDENT AUDITOR S REPORT JUNE 30, 2015 * * * CHAVAN & ASSOCIATES LLP CERTIFIED PUBLIC ACCOUNTANTS 1475 SARATOGA AVE, SUITE 180 SAN JOSE, CA 95129
CITY OF ALTURAS ALTURAS, CALIFORNIA BASIC FINANCIAL STATEMENTS
 CITY OF ALTURAS ALTURAS, CALIFORNIA BASIC FINANCIAL STATEMENTS JUNE 30, 2016 TABLE OF CONTENTS PAGE Independent Auditors Report 1-2 Management s Discussion and Analysis 3-10 Basic Financial Statements:
Greater New Haven Water Pollution Control Authority. Financial Report June 30, 2016 and 2015
 Greater New Haven Water Pollution Control Authority Financial Report June 30, 2016 and 2015 Contents Financial Section Independent auditor s report 1-2 Management s Discussion and Analysis - unaudited
COMPREHENSIVE ANNUAL FINANCIAL REPORT OF THE EAST CEDAR CREEK FRESH WATER SUPPLY DISTRICT
 COMPREHENSIVE ANNUAL FINANCIAL REPORT OF THE EAST CEDAR CREEK FRESH WATER SUPPLY DISTRICT FOR FISCAL YEAR ENDED March 31, 2018 General Manager Bill Goheen COMPREHENSIVE ANNUAL FINANCIAL REPORT FOR THE
MADISON METROPOLITAN SEWERAGE DISTRICT Madison, Wisconsin. FINANCIAL STATEMENTS December 31, 2015 and 2014
 MADISON METROPOLITAN SEWERAGE DISTRICT Madison, Wisconsin FINANCIAL STATEMENTS TABLE OF CONTENTS PAGE INDEPENDENT AUDITOR S REPORT... 1 MANAGEMENT S DISCUSSION AND ANALYSIS... 3 BASIC FINANCIAL STATEMENTS
Dunthorpe-Riverdale Service District No. 1 A Component Unit of Multnomah County, Oregon. Financial Statements and Reports of Independent Auditors
 Dunthorpe-Riverdale Service District No. 1 A Component Unit of Multnomah County, Oregon Financial Statements and Reports of Independent Auditors For the Fiscal Years Ended June 30, 2017 and 2016 Prepared
Shasta Tehama Trinity Joint Community College District Redding, California
 Shasta Tehama Trinity Joint Community College District Redding, California FINANCIAL STATEMENTS AND SUPPLEMENTARY INFORMATION WITH INDEPENDENT AUDITORS REPORTS June 30, 2016 TABLE OF CONTENTS June 30,
CITY OF HERCULES, CALIFORNIA ANNUAL FINANCIAL REPORT YEAR ENDED JUNE 30, 2017
 , CALIFORNIA ANNUAL FINANCIAL REPORT YEAR ENDED WEALTH ADVISORY OUTSOURCING AUDIT, TAX, AND CONSULTING THIS PAGE INTENTIONALLY LEFT BLANK TABLE OF CONTENTS YEAR ENDED FINANCIAL SECTION Independent Auditors
Basic Financial Statements
 2018 Basic Financial Statements For the Fiscal Year Ended June 30, 2018 San Diego, CA 4705 9/18 San Diego Association of Governments San Diego, California Basic Financial Statements and Independent Auditor
DIABLO WATER DISTRICT ANNUAL FINANCIAL REPORT WITH INDEPENDENT AUDITOR'S REPORT FOR THE FISCAL YEARS ENDED JUNE 30, 2018 AND 2017
 ANNUAL FINANCIAL REPORT WITH INDEPENDENT AUDITOR'S REPORT FOR THE FISCAL YEARS ENDED MANN, URRUTIA, NELSON, CPAS & ASSOCIATES, LLP 1760 CREEKSIDE OAKS DRIVE, SUITE 160 SACRAMENTO, CALIFORNIA 95833 For
Marina Coast Water District Marina, California
 Marina Coast Water District Marina, California Comprehensive Annual Financial Report For The Fiscal Year Ended June 30, 2015 11 Reservation Road, Marina California 93933 Marina Coast Water District Marina,
Ypsilanti Community Utilities Authority. Years Ended August 31, 2016 and Comprehensive Annual Financial Report
 Ypsilanti Community Utilities Authority Years Ended August 31, 2016 and 2015 Comprehensive Annual Financial Report This page intentionally left blank. Table of Contents Page Introductory Section Letter
SAN BERNARDINO COMMUNITY COLLEGE DISTRICT ANNUAL FINANCIAL REPORT JUNE 30, 2017
 SAN BERNARDINO COMMUNITY COLLEGE DISTRICT ANNUAL FINANCIAL REPORT TABLE OF CONTENTS FINANCIAL SECTION Independent Auditor's Report 2 Management Discussion and Analysis 5 Basic Financial Statements - Primary
BROWARD COUNTY, FLORIDA WATER AND WASTEWATER FUND A Major Fund of Broward County, Florida
 BROWARD COUNTY, FLORIDA WATER AND WASTEWATER FUND A Major Fund of Broward County, Florida Financial Statements For the Years Ended September 30, 2013 and 2012 BROWARD COUNTY, FLORIDA WATER AND WASTEWATER
(This page intentionally left blank.)
") (This page intentionally left blank.) ANNUAL FINANCIAL REPORT of the For the Year Ended (This page intentionally left blank.) TABLE OF CONTENTS FINANCIAL SECTION Independent Auditor s Report 1 Management
(This page intentionally left blank.) ANNUAL FINANCIAL REPORT of the For the Year Ended (This page intentionally left blank.) TABLE OF CONTENTS FINANCIAL SECTION Independent Auditor s Report 1 Management
Village of Bolingbrook, Illinois
 Village of Bolingbrook, Illinois Annual Financial Report 0 Table of Contents PAGE INDEPENDENT AUDITOR S REPORT 1-3 BASIC FINANCIAL STATEMENTS Government-Wide Financial Statements Statement of Net Position
PLUM CREEK LIBRARY SYSTEM AUDITED FINANCIAL STATEMENTS AND SUPPLEMENTARY INFORMATION JUNE 30, 2015
 AUDITED FINANCIAL STATEMENTS AND SUPPLEMENTARY INFORMATION JUNE 30, 2015 Conway, Deuth & Schmiesing, PLLP Certified Public Accountants Willmar, Minnesota This page intentionally left blank TABLE OF CONTENTS
BODEGA BAY PUBLIC UTILITY DISTRICT BODEGA BAY, CALIFORNIA BASIC FINANCIAL STATEMENTS
 BODEGA BAY PUBLIC UTILITY DISTRICT BODEGA BAY, CALIFORNIA BASIC FINANCIAL STATEMENTS JUNE 30, 2016 TABLE OF CONTENTS PAGE FINANCIAL SECTION: Independent Auditors Report 1-2 Management s Discussion and
Village of Allouez) Wisconsin ANNUAL FINANCIAL REPORT. December 31, Schenck
 Wisconsin ANNUAL FINANCIAL REPORT. December 31, Schenck") Village of Allouez) Wisconsin ANNUAL FINANCIAL REPORT December 31, 2017 Schenck DECEMBER 31, 2017 Table of Contents INDEPENDENT AUDITORS' REPORT BASIC FINANCIAL STATEMENTS Government-wide Financial Statements
Village of Allouez) Wisconsin ANNUAL FINANCIAL REPORT December 31, 2017 Schenck DECEMBER 31, 2017 Table of Contents INDEPENDENT AUDITORS' REPORT BASIC FINANCIAL STATEMENTS Government-wide Financial Statements
DETROIT TRANSPORTATION CORPORATION
 FINANCIAL REPORT JUNE 30, 2017 Contents Page No. Independent Auditor s Report... 1 Management Discussion & Analysis... 3 Basic Financial Statements: Statement of Net Position... 9 Statement of Revenues,
Joshua Basin Water District. Annual Financial Report
 Annual Financial Report Board of Directors as of June 30, 2018 Elected/ Current Name Title Appointed Term Mickey Luckman President Elected 12/16-12/20 Robert Johnson Vice President Elected 12/16-12/20
RICHARDSON BAY SANITARY DISTRICT FINANCIAL STATEMENTS FOR THE YEARS ENDED JUNE 30, 2017 AND 2016
 FINANCIAL STATEMENTS FOR THE YEARS ENDED JUNE 30, 2017 AND 2016 FINANCIAL STATEMENTS AND INDEPENDENT AUDITORS' REPORT FOR THE YEARS ENDED JUNE 30, 2017 AND 2016 TABLE OF CONTENTS Page Independent Auditors'
RUNNING SPRINGS WATER DISTRICT ANNUAL FINANCIAL REPORT. Years Ended June 30, 2018 and 2017
 RUNNING SPRINGS WATER DISTRICT ANNUAL FINANCIAL REPORT Years Ended June 30, 2018 and 2017 Running Springs Water District Annual Financial Report Years Ended June 30, 2018 and 2017 I. INTRODUCTORY SECTION
INDEPENDENT AUDITOR S REPORT
 INDEPENDENT AUDITOR S REPORT To the Board of Directors Novato Fire Protection District Novato, California Report on Financial Statements We have audited the accompanying financial statements of the governmental
Southwestern Community College District
 Southwestern Community College District Chula Vista, California Basic Financial Statements, Single Audit, State Compliance and Other Supplementary Information with Independent Auditors Reports Table of
MIDWAY CITY SANITARY DISTRICT FINANCIAL STATEMENTS WITH REPORT ON AUDIT BY INDEPENDENT CERTIFIED PUBLIC ACCOUNTANTS FOR THE YEAR ENDED JUNE 30, 2016
 FINANCIAL STATEMENTS WITH REPORT ON AUDIT BY INDEPENDENT CERTIFIED PUBLIC ACCOUNTANTS FOR THE YEAR ENDED JUNE 30, 2016 TABLE OF CONTENTS For the year ended Page Number Independent Auditors Report 1-2 Management
Eagle River Water and Sanitation District Vail, Colorado. Financial Statements December 31, 2014
 Vail, Colorado Financial Statements Financial Statements Table of Contents Page INDEPENDENT AUDITOR S REPORT Management s Discussion and Analysis A1 A2 B1 B8 Basic Financial Statements: Statement of Net
City of Chicago Department of Water Management Sewer Fund Comprehensive Annual Financial Report For the Year Ended December 31, 2012
 City of Chicago Department of Water Management Sewer Fund Comprehensive Annual Financial Report For the Year Ended December 31, 2012 Rahm Emanuel, Mayor Lois Scott, Chief Financial Officer Amer Ahmad,
Marin Municipal Water District
 Marin Municipal Water District Corte Madera, California Basic Financial Statements And Independent Auditors Report For the years ended June 30, 2012 and 2011 Basic Financial Statements Table of Contents
ENGLEWOOD WATER DISTRICT FINANCIAL STATEMENTS AND SUPPLEMENTARY INFORMATION YEARS ENDED SEPTEMBER 30, 2017 AND 2016
 FINANCIAL STATEMENTS AND SUPPLEMENTARY INFORMATION YEARS ENDED TABLE OF CONTENTS YEARS ENDED INDEPENDENT AUDITORS REPORT 1 MANAGEMENT S DISCUSSION AND ANALYSIS 4 BASIC FINANCIAL STATEMENTS STATEMENTS OF
Tecumseh Public Schools Tecumseh, Michigan FINANCIAL STATEMENTS. June 30, 2018
 Tecumseh, Michigan FINANCIAL STATEMENTS TABLE OF CONTENTS Page INDEPENDENT AUDITOR S REPORT MANAGEMENT S DISCUSSION AND ANALYSIS i-ii iii-viii BASIC FINANCIAL STATEMENTS District-wide Financial Statements
MADISON METROPOLITAN SEWERAGE DISTRICT Madison, Wisconsin. FINANCIAL STATEMENTS December 31, 2016 and 2015
 MADISON METROPOLITAN SEWERAGE DISTRICT Madison, Wisconsin FINANCIAL STATEMENTS TABLE OF CONTENTS PAGE INDEPENDENT AUDITORS REPORT... 1 MANAGEMENT S DISCUSSION AND ANALYSIS... 3 BASIC FINANCIAL STATEMENTS
Des Moines Metropolitan Wastewater Reclamation Authority. Financial Report June 30, 2016
 Des Moines Metropolitan Wastewater Reclamation Authority Financial Report June 30, 2016 Contents Independent auditor s report 1-2 Management s discussion and analysis 3-6 Basic financial statements Statements
PLUM CREEK LIBRARY SYSTEM AUDITED FINANCIAL STATEMENTS AND SUPPLEMENTARY INFORMATION JUNE 30, 2016
 AUDITED FINANCIAL STATEMENTS AND SUPPLEMENTARY INFORMATION JUNE 30, 2016 Conway, Deuth & Schmiesing, PLLP Certified Public Accountants Willmar, Minnesota This page intentionally left blank TABLE OF CONTENTS
Basic Financial Statements and Report of Independent Certified Public Accountants City of Dallas, Texas Dallas Water Utilities (An Enterprise Fund of
 Basic Financial Statements and Report of Independent Certified Public Accountants City of Dallas, Texas September 30, 2016 FINANCIAL STATEMENTS For Fiscal Year Ended September 30, 2016 TABLE OF CONTENTS
FINANCIAL STATEMENTS September 30, 2017 and 2016
 FINANCIAL STATEMENTS CHILDREN'S BOARD OF HILLSBOROUGH COUNTY Tampa, Florida FINANCIAL STATEMENTS CONTENTS INDEPENDENT AUDITOR S REPORT... 1-2 MANAGEMENT S DISCUSSION AND ANALYSIS... 3-11 BASIC FINANCIAL
PLUM CREEK LIBRARY SYSTEM AUDITED FINANCIAL STATEMENTS AND SUPPLEMENTARY INFORMATION JUNE 30, 2017
 AUDITED FINANCIAL STATEMENTS AND SUPPLEMENTARY INFORMATION JUNE 30, 2017 Conway, Deuth & Schmiesing, PLLP Certified Public Accountants & Consultants Willmar, Minnesota This page intentionally left blank
Independent Auditor s Report
 Independent Auditor s Report To the City Council City of Hyattsville, Maryland We have audited the accompanying financial statements of the governmental activities, each major fund, and the aggregate remaining
Town of Ogunquit, Maine
 Audited Financial Statements and Other Financial Information Town of Ogunquit, Maine June 30, 2017 Proven Expertise and Integrity CONTENTS PAGE INDEPENDENT AUDITORS' REPORT 1-3 MANAGEMENT S DISCUSSION
Audited Financial Statements West Virginia Water Development Authority Year Ended June 30, 2017 Certified Public Accountants
 Audited Financial Statements West Virginia Water Development Authority Year Ended June 30, 2017 Certified Public Accountants Audited Financial Statements WEST VIRGINIA WATER DEVELOPMENT AUTHORITY Year
City of Del Rey Oaks. Annual Financial Report June 30, Chavan & Associates, LLP Certified Public Accountants
 City of Del Rey Oaks Annual Financial Report Chavan & Associates, LLP Certified Public Accountants www.cnallp.com Page Intentionally Left Blank Annual Financial Report For the year ended TABLE OF CONTENTS
AMADOR COUNTY UNIFIED SCHOOL DISTRICT. FINANCIAL STATEMENTS June 30, 2018
 FINANCIAL STATEMENTS June 30, 2018 FINANCIAL STATEMENTS WITH SUPPLEMENTARY INFORMATION For the Year Ended June 30, 2018 CONTENTS INDEPENDENT AUDITOR'S REPORT... 1 MANAGEMENT'S DISCUSSION AND ANALYSIS...
MONROE COUNTY WATER AUTHORITY (A Discretely Presented Component Unit of the County of Monroe, New York)
") MONROE COUNTY WATER AUTHORITY (A Discretely Presented Component Unit of the County of Monroe, New York) Financial Statements as of December 31, 2017 Together with Independent Auditor s Report MONROE COUNTY
MONROE COUNTY WATER AUTHORITY (A Discretely Presented Component Unit of the County of Monroe, New York) Financial Statements as of December 31, 2017 Together with Independent Auditor s Report MONROE COUNTY
MUSTANG SPECIAL UTILITY DISTRICT
 MUSTANG SPECIAL UTILITY DISTRICT of Denton County, Texas COMPREHENSIVE ANNUAL FINANCIAL REPORT FOR THE FISCAL YEAR ENDED SEPTEMBER 30, 2016 General Manager Chris Boyd Finance Director Patty Parks MUSTANG
PLUM CREEK LIBRARY SYSTEM AUDITED FINANCIAL STATEMENTS AND SUPPLEMENTARY INFORMATION JUNE 30, 2018
 AUDITED FINANCIAL STATEMENTS AND SUPPLEMENTARY INFORMATION JUNE 30, 2018 Conway, Deuth & Schmiesing, PLLP Certified Public Accountants & Consultants Willmar, Minnesota This page intentionally left blank
Eagle River Water and Sanitation District Vail, Colorado. Financial Statements December 31, 2013
 Vail, Colorado Financial Statements Financial Statements Table of Contents Page INDEPENDENT AUDITOR S REPORT Management s Discussion and Analysis A1 A2 B1 B8 Basic Financial Statements: Statement of Net
CITY OF AVENAL CALIFORNIA
 CALIFORNIA FINANCIAL STATEMENTS FOR THE YEAR ENDED JUNE 30, 2014 JUNE 30, 2014 TABLE OF CONTENTS INDEPENDENT AUDITOR S REPORT...1 BASIC FINANCIAL STATEMENTS: Government-Wide Financial Statements: Statement
CITY OF CLARKSVILLE, TENNESSEE
 GAS, WATER AND Wastewater DEPARTMENTS AUDITED FINANCIAL STATEMENTS AND OTHER INFORMATION JUNE 30, 2018 AND 2017 JUNE 30, 2018 AND 2017 TABLE OF CONTENTS Financial Section Independent Auditor s Report 1
NORTHPORT SCHOOL DEPARTMENT
 NORTHPORT SCHOOL DEPARTMENT NORTHPORT, MAINE FINANCIAL AUDIT REPORT NORTHPORT SCHOOL DEPARTMENT NORTHPORT, MAINE TABLE OF CONTENTS FINANCIAL SECTION EXHIBITS Independent Auditors Report Management Discussion
Marina Coast Water District Marina, California
 Marina Coast Water District Marina, California Comprehensive Annual Financial Report For The Fiscal Years Ended June 30, 2014 and 2013 11 Reservation Road, Marina California 93933 Marina Coast Water District
CABOT WATERWORKS FINANCIAL STATEMENTS AND SUPPLEMENTARY INFORMATION. For the Years Ended December 31,2017 and 2016
 FINANCIAL STATEMENTS AND SUPPLEMENTARY INFORMATION For the Years Ended December 31,2017 and 2016 CONTENTS Financial Statements: Page Number Independent Auditors' Report... 1-3 Management's Discussion and
Capitol Area Development Authority. Financial Statements (With Supplementary Information) and Independent Auditor's Report. June 30, 2016 and 2015
 and Independent Auditor's Report. June 30, 2016 and 2015") Financial Statements (With Supplementary Information) and Independent Auditor's Report Table of Contents Page Board of Directors 2 Independent Auditor's Report 3 Management's Discussion and Analysis (Unaudited)
Financial Statements (With Supplementary Information) and Independent Auditor's Report Table of Contents Page Board of Directors 2 Independent Auditor's Report 3 Management's Discussion and Analysis (Unaudited)
CITY OF ECORSE, MICHIGAN. Year Ended June 30, Financial Statements
 Year Ended June 30, 2015 Financial Statements This page intentionally left blank. Table of Contents Financial Section Page Independent Auditors Report 1 Management s Discussion and Analysis 6 Basic Financial
MIDWAY CITY SANITARY DISTRICT FINANCIAL STATEMENTS WITH REPORT ON AUDIT BY INDEPENDENT CERTIFIED PUBLIC ACCOUNTANTS FOR THE YEAR ENDED JUNE 30, 2017
 FINANCIAL STATEMENTS WITH REPORT ON AUDIT BY INDEPENDENT CERTIFIED PUBLIC ACCOUNTANTS FOR THE YEAR ENDED JUNE 30, 2017 TABLE OF CONTENTS For the year ended Page Number Independent Auditors Report 1-2 Management
Accounting & Consulting Group, LLP. Certified Public Accountants
 Accounting & Consulting Group, LLP Certified Public Accountants STATE OF NEW MEXICO CITY OF EUNICE HOUSING AUTHORITY A COMPONENT UNIT OF THE CITY OF EUNICE, NEW MEXICO ANNUAL FINANCIAL REPORT FOR THE
MILLBRAE SCHOOL DISTRICT COUNTY OF SAN MATEO MILLBRAE, CALIFORNIA AUDIT REPORT. June 30, 2014
 MILLBRAE SCHOOL DISTRICT COUNTY OF SAN MATEO MILLBRAE, CALIFORNIA AUDIT REPORT June 30, 2014 CHAVAN & ASSOCIATES, LLP CERTIFIED PUBLIC ACCOUNTANTS 1475 SARATOGA AVE., SUITE 180 SAN JOSE, CA 95129 Received
KEWAUNEE COUNTY, WISCONSIN ANNUAL FINANCIAL REPORT DECEMBER 31, 2015
 ANNUAL FINANCIAL REPORT DECEMBER 31, 2015 December 31, 2015 Table of Contents Page No. INDEPENDENT AUDITORS' REPORT BASIC FINANCIAL STATEMENTS Government-wide Financial Statements Statement of Net Position
JACKSON TOWNSHIP MUNICIPAL UTILITIES AUTHORITY (A Component Unit of the Township of Jackson, County of Ocean, State of New Jersey)
") (A Component Unit of the Township of Jackson, County of Ocean, State of New Jersey) Financial Statements and Supplementary Data (With Independent Auditor's Report thereon) (A Component Unit of the Township
(A Component Unit of the Township of Jackson, County of Ocean, State of New Jersey) Financial Statements and Supplementary Data (With Independent Auditor's Report thereon) (A Component Unit of the Township
SONOMA VALLEY COUNTY SANITATION DISTRICT (A Component Unit of the County of Sonoma)
") SONOMA VALLEY COUNTY SANITATION DISTRICT (A Component Unit of the County of Sonoma) Independent Auditors' Report, Management's Discussion and Analysis and Basic Financial Statements For the Fiscal Year
SONOMA VALLEY COUNTY SANITATION DISTRICT (A Component Unit of the County of Sonoma) Independent Auditors' Report, Management's Discussion and Analysis and Basic Financial Statements For the Fiscal Year
CHEROKEE COUNTY WATER AND SEWERAGE AUTHORITY CHEROKEE COUNTY, GEORGIA FINANCIAL STATEMENTS FOR THE FISCAL YEAR ENDED AUGUST 31, 2016
 CHEROKEE COUNTY WATER AND SEWERAGE AUTHORITY CHEROKEE COUNTY, GEORGIA FINANCIAL STATEMENTS FOR THE FISCAL YEAR ENDED AUGUST 31, 2016 TOGETHER WITH INDEPENDENT AUDITORS REPORTS FINANCIAL STATEMENTS AUGUST
 WEST VIRGINIA WATER DEVELOPMENT AUTHORITY FINANCIAL REPORT June 30, 2018 CONTENTS Page INDEPENDENT AUDITOR S REPORT...1 MANAGEMENT S DISCUSSION AND ANALYSIS...3 BASIC FINANCIAL STATEMENTS: Statement of
CITY OF HEMPHILL, TEXAS ANNUAL FINANCIAL REPORT FOR THE YEAR ENDED JUNE 30, 2015
 ANNUAL FINANCIAL REPORT FOR THE YEAR ENDED JUNE 30, 2015 Annual Financial Report For the Year Ended June 30, 2015 Table of Contents Page FINANCIAL SECTION Independent Auditor s Report... 1-3 Management
TOWN OF PLAINFIELD, CONNECTICUT
 FINANCIAL REPORT JUNE 30, 2009 McGladrey & Pullen, LLP is a member firm of RSM International, an affiliation of separate and independent legal entities. COMPREHENSIVE ANNUAL FINANCIAL REPORT TABLE OF
City of Arvin. Arvin, California. Independent Auditors Report and Basic Financial Statements
 Arvin, California Independent Auditors Report and Basic Financial Statements Basic Financial Statements Table of Contents FINANCIAL SECTION Page Independent Auditors Report... 1 Basic Financial Statements:
PLACER MOSQUITO AND VECTOR CONTROL DISTRICT
 INDEPENDENT AUDITORS REPORTS, MANAGEMENT S DISCUSSION AND ANALYSIS, BASIC FINANCIAL STATEMENTS AND REQUIRED SUPPLEMENTARY INFORMATION FOR THE FISCAL YEAR ENDED JUNE 30, 2017 Table of Contents Page(s) Independent
MILLBRAE SCHOOL DISTRICT COUNTY OF SAN MATEO MILLBRAE, CALIFORNIA AUDIT REPORT. June 30, 2013
 MILLBRAE SCHOOL DISTRICT COUNTY OF SAN MATEO MILLBRAE, CALIFORNIA AUDIT REPORT June 30, 2013 CHAVAN &ASSOCIATES, LLP CERTIFIED PUBLIC ACCOUNTANTS 1475 SARATOGA AVE., SUITE 180 SAN JOSE, CA 95129 This Page
CITY OF BARRE, VERMONT AUDIT REPORT AND REPORTS ON COMPLIANCE AND INTERNAL CONTROL JUNE 30, 2017
 AUDIT REPORT AND REPORTS ON COMPLIANCE AND INTERNAL CONTROL AUDIT REPORT TABLE OF CONTENTS Page # Independent Auditor s Report 1-4 Basic Financial Statements: Statement of Net Position Exhibit A 5 Statement
RIVIERA BEACH COMMUNITY REDEVELOPMENT AGENCY (A Component Unit of the City of Riviera Beach, Florida)
") RIVIERA BEACH COMMUNITY REDEVELOPMENT AGENCY Audited Financial Statements Fiscal year ended September 30, 2017 HCT Certified Public Accountants & Consultants, LLC 3816 Hollywood Boulevard, Suite 203 Hollywood,
RIVIERA BEACH COMMUNITY REDEVELOPMENT AGENCY Audited Financial Statements Fiscal year ended September 30, 2017 HCT Certified Public Accountants & Consultants, LLC 3816 Hollywood Boulevard, Suite 203 Hollywood,
West Virginia Water Development Authority
 Audited Financial Statements West Virginia Water Development Authority Year Ended June 30, 2017 Certified Public Accountants Audited Financial Statements Year Ended June 30, 2017 TABLE OF CONTENTS Page
CITY OF SHELTON, CONNECTICUT ANNUAL FINANCIAL REPORT. June 30, 2017
 ANNUAL FINANCIAL REPORT June 30, 2017 TABLE OF CONTENTS Page Number FINANCIAL SECTION Independent Auditor s Report 1-2 Management s Discussion and Analysis 3a-3g Basic Financial Statements: Government-Wide
SONOMA RESOURCE CONSERVATION DISTRICT
 SONOMA RESOURCE CONSERVATION DISTRICT FINANCIAL STATEMENTS FOR THE YEARS ENDED JUNE 30, 2017 AND 2016 TABLE OF CONTENTS INDEPENDENT AUDITOR S REPORT 1-2 MANAGEMENT S DISCUSSION AND ANALYSIS 3-9 FINANCIAL
NIAGARA FALLS WATER BOARD Basic Financial Statements, Supplementary Information and Independent Auditors Report December 31, 2017 and 2016
 Basic Financial Statements, Supplementary Information and Independent Auditors Report December 31, 2017 and 2016 Table of Contents Independent Auditors Report 1-3 Management s Discussion and Analysis 4-10
Belding Area Schools. Financial Statements With Supplemental Information June 30, 2018
 Financial Statements With Supplemental Information Contents Independent Auditor s Report 1-2 Management s Discussion and Analysis 3-9 Basic Financial Statements Government - Wide Financial Statements:
City of Tombstone, Arizona Financial Statements. Year Ended June 30, 2016
 City of Tombstone, Arizona Financial Statements Year Ended June 30, 2016 CONTENTS Page INDEPENDENT AUDITOR S REPORT 1 MANAGEMENT S DISCUSSION AND ANALYSIS (MD&A) (Required Supplementary Information) 5
CENTRAL UNION HIGH SCHOOL DISTRICT COUNTY OF IMPERIAL EL CENTRO, CALIFORNIA AUDIT REPORT JUNE 30, 2017
 COUNTY OF IMPERIAL EL CENTRO, CALIFORNIA AUDIT REPORT JUNE 30, 2017 Wilkinson Hadley King & Co. LLP CPA's and Advisors 218 W. Douglas Ave. El Cajon, California Introductory Section Central Union High School
JEFFERSON UNION HIGH SCHOOL DISTRICT COUNTY OF SAN MATEO DALY CITY, CALIFORNIA AUDITED FINANCIAL STATEMENTS FOR THE YEAR ENDED JUNE 30, 2017
 COUNTY OF SAN MATEO DALY CITY, CALIFORNIA AUDITED FINANCIAL STATEMENTS FOR THE YEAR ENDED AUDITED FINANCIAL STATEMENTS TABLE OF CONTENTS Page No. INDEPENDENT AUDITOR S REPORT... 1-3 MANAGEMENT'S DISCUSSION
City of Chicago Department of Water Management Water Fund Comprehensive Annual Financial Report For the Years Ended December 31, 2016 and 2015
 City of Chicago Department of Water Management Water Fund Comprehensive Annual Financial Report For the Years Ended December 31, 2016 and 2015 Rahm Emanuel, Mayor Carole L. Brown, Chief Financial Officer
STATE OF NEW MEXICO EL VALLE DE LOS RANCHOS WATER & SANITATION DISTRICT ANNUAL FINANCIAL REPORT JUNE 30, 2016
 STATE OF NEW MEXICO EL VALLE DE LOS RANCHOS WATER & SANITATION DISTRICT ANNUAL FINANCIAL REPORT JUNE 30, 2016 (This page intentionally left blank.) INTRODUCTORY SECTION (This page intentionally left blank.)
The following document was not prepared by the Office of the State Auditor, but was prepared by and submitted to the Office of the State Auditor by a
 The following document was not prepared by the Office of the State Auditor, but was prepared by and submitted to the Office of the State Auditor by a private CPA firm. The document was placed on this web
PENNSAUKEN SEWERAGE AUTHORITY REPORT OF AUDIT WITH SUPPLEMENTARY INFORMATION
 PENNSAUKEN SEWERAGE AUTHORITY REPORT OF AUDIT WITH SUPPLEMENTARY INFORMATION FOR THE YEARS ENDED DECEMBER 31, 2015 AND 2014 36000 PENNSAUKEN SEWERAGE AUTHORITY Table of Contents For the Years Ended December
WISCONSIN INDIANHEAD TECHNICAL COLLEGE
 WISCONSIN INDIANHEAD TECHNICAL COLLEGE Annual Audited Financial Statements for fiscal year ended June 30, 2012 Wisconsin Indianhead Technical College District Shell Lake, WI Financial Statements With
DEDHAM-WESTWOOD WATER DISTRICT Financial Statements For the Year Ended December 31, 2017 (With Independent Auditors Report Thereon)
") DEDHAM-WESTWOOD WATER DISTRICT Financial Statements For the Year Ended December 31, 2017 (With Independent Auditors Report Thereon) Dedham-Westwood Water District TABLE OF CONTENTS PAGE INDEPENDENT AUDITORS
DEDHAM-WESTWOOD WATER DISTRICT Financial Statements For the Year Ended December 31, 2017 (With Independent Auditors Report Thereon) Dedham-Westwood Water District TABLE OF CONTENTS PAGE INDEPENDENT AUDITORS
RANCHO SANTIAGO COMMUNITY COLLEGE DISTRICT ANNUAL FINANCIAL REPORT JUNE 30, 2013
 RANCHO SANTIAGO COMMUNITY COLLEGE DISTRICT ANNUAL FINANCIAL REPORT JUNE 30, 2013 TABLE OF CONTENTS JUNE 30, 2013 FINANCIAL SECTION Independent Auditors' Report 2 Management's Discussion and Analysis 4
WISCONSIN INDIANHEAD TECHNICAL COLLEGE
 WISCONSIN INDIANHEAD TECHNICAL COLLEGE Annual Audited Financial Statements for fiscal year ending, June 30, 2017 Wisconsin Indianhead Technical College District Shell Lake, WI Financial Statements With
COLUSA COUNTY LOCAL TRANSPORTATION COMMISSION, CALIFORNIA
 COLUSA COUNTY LOCAL TRANSPORTATION COMMISSION, CALIFORNIA FINANCIAL STATEMENTS TOGETHER WITH INDEPENDENT AUDITOR S REPORT FOR THE YEAR ENDED JUNE 30, 2016 THIS PAGE INTENTIONALLY LEFT BLANK Annual Financial
TEMPLETON COMMUNITY SERVICES DISTRICT FINANCIAL STATEMENTS JUNE 30, 2018
 TEMPLETON COMMUNITY SERVICES DISTRICT FINANCIAL STATEMENTS L & C Leaf & Cole, LLP Certified Public Accountants FINANCIAL STATEMENTS TABLE OF CONTENTS Independent Auditor s Report 1-2 Management s Discussion
TOWN OF YARMOUTH, MAINE. Annual Financial Report. For the year ended June 30, 2017
 Annual Financial Report For the year ended June 30, 2017 Annual Financial Report Year ended June 30, 2017 Table of Contents Statement Page Independent Auditor's Report 1-3 Management s Discussion and Analysis
SALT CREEK RURAL PARK DISTRICT PALATINE, ILLINOIS ANNUAL FINANCIAL REPORT FOR THE FISCAL YEAR ENDED APRIL 30, 2017
 PALATINE, ILLINOIS ANNUAL FINANCIAL REPORT FOR THE FISCAL YEAR ENDED APRIL 30, 2017 TABLE OF CONTENTS APRIL 30, 2017 Exhibit Page Independent Auditor's Report 1 Required Supplementary Information Management
CITY OF FLORENCE, ALABAMA ELECTRICITY, GAS, AND WATER AND WASTEWATER DEPARTMENTS. FINANCIAL STATEMENTS JUNE 30, 2007 and 2006
 ELECTRICITY, GAS, AND WATER AND WASTEWATER DEPARTMENTS FINANCIAL STATEMENTS JUNE 30, 2007 and 2006 ELECTRICITY, GAS, AND WATER AND WASTEWATER DEPARTMENTS TABLE OF CONTENTS Independent Auditors Report 1
VANDERBILT AREA SCHOOL ANNUAL FINANCIAL REPORT YEAR ENDED JUNE 30, 2016
 VANDERBILT AREA SCHOOL ANNUAL FINANCIAL REPORT YEAR ENDED JUNE 30, 2016 TABLE OF CONTENTS Independent Auditor's Report 1 Management's Discussion and Analysis 4 BASIC FINANCIAL STATEMENTS District-wide
VILLAGE OF WEST BARABOO, WISCONSIN FINANCIAL STATEMENTS WITH INDEPENDENT AUDITOR'S REPORT. Year Ended December 31, 2011
 FINANCIAL STATEMENTS WITH INDEPENDENT AUDITOR'S REPORT Year Ended December 31, 2011 Johnson Block & Company, Inc. Certified Public Accountants 1315 Bad Axe Court; P.O. Box 271 Viroqua, Wisconsin 54665