|
|
|
- Della Farmer
- 5 years ago
- Views:
Transcription


1


2


3
4
5
6
7
8
9
10
11


12
13


14
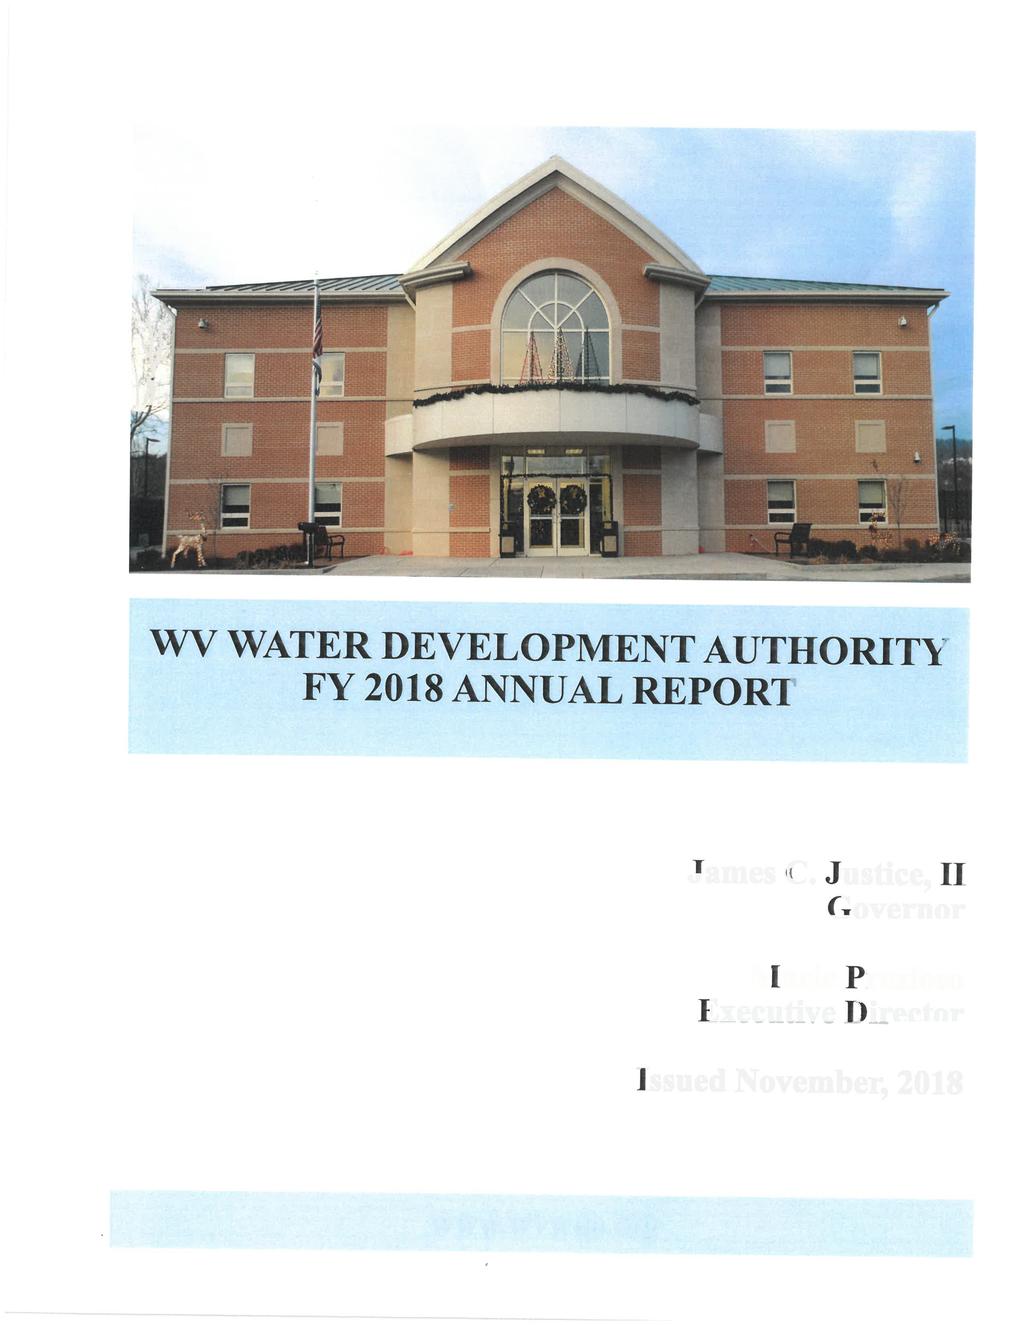
15 WEST VIRGINIA WATER DEVELOPMENT AUTHORITY FINANCIAL REPORT June 30, 2018
16 CONTENTS Page INDEPENDENT AUDITOR S REPORT...1 MANAGEMENT S DISCUSSION AND ANALYSIS...3 BASIC FINANCIAL STATEMENTS: Statement of Net Position...8 Statement of Revenues, Expenses, and Changes in Fund Net Position...10 Statement of Cash Flows...11 Notes to Financial Statements...13 REQUIRED SUPPLEMENTARY INFORMATION: Schedule of the Proportionate Share of the Net Pension Liability...40 Schedule of Contributions to the PERS...41 Schedule of the Proportionate Share of the Net OPEB Liability...42 Schedule of Contributions to OPEB...43 Notes to Required Supplementary Information...44 INDEPENDENT AUDITOR S REPORT ON INTERNAL CONTROL OVER FINANCIAL REPORTING AND ON COMPLIANCE AND OTHER MATTERS BASED ON AN AUDIT OF FINANCIAL STATEMENTS PERFORMED IN ACCORDANCE WITH GOVERNMENT AUDITING STANDARDS...46
17 INDEPENDENT AUDITOR S REPORT To the Board of Directors West Virginia Water Development Authority Charleston, West Virginia Report on the Financial Statements We have audited the accompanying financial statements of the West Virginia Water Development Authority (the Authority), a component unit of the State of West Virginia, as of and for the year ended June 30, 2018, and the related notes to the financial statements, which collectively comprise the Authority s basic financial statements as listed in the table of contents. Management s Responsibility for the Financial Statements Management is responsible for the preparation and fair presentation of these financial statements in accordance with accounting principles generally accepted in the United States of America; this includes the design, implementation, and maintenance of internal control relevant to the preparation and fair presentation of financial statements that are free from material misstatement, whether due to fraud or error. Auditor s Responsibility Our responsibility is to express an opinion on these financial statements based on our audit. We conducted our audit in accordance with auditing standards generally accepted in the United States of America and the standards applicable to financial audits contained in Government Auditing Standards, issued by the Comptroller General of the United States. Those standards require that we plan and perform the audit to obtain reasonable assurance about whether the financial statements are free from material misstatement. An audit involves performing procedures to obtain audit evidence about the amounts and disclosures in the financial statements. The procedures selected depend on the auditor s judgment, including the assessment of the risks of material misstatement of the financial statements, whether due to fraud or error. In making those risk assessments, the auditor considers internal control relevant to the entity s preparation and fair presentation of the financial statements in order to design audit procedures that are appropriate in the circumstances, but not for the purpose of expressing an opinion on the effectiveness of the entity s internal control. Accordingly, we express no such opinion. An audit also includes evaluating the appropriateness of accounting policies used and the reasonableness of significant accounting estimates made by management, as well as evaluating the overall presentation of the financial statements. We believe that the audit evidence we have obtained is sufficient and appropriate to provide a basis for our audit opinion. Opinion In our opinion, the financial statements referred to above present fairly, in all material respects, the financial position of the Authority, as of June 30, 2018, and the changes in financial position and cash flows for the year then ended in accordance with accounting principles generally accepted in the United States of America. Your Success is Our Focus 300 Chase Tower, 707 Virginia Street, East Charleston, WV Fax:
18 Other Matters Required Supplementary Information Accounting principles generally accepted in the United States of America require that the management s discussion and analysis on pages 3 through 7, the schedule of the proportionate share of the net pension liability, the schedule of contributions to the PERS, the schedule of the proportionate share of the net OPEB liability, and the schedule of contributions to the RHBT on pages 40 through 45 be presented to supplement the basic financial statements. Such information, although not a part of the basic financial statements, is required by the Governmental Accounting Standards Board, who considers it to be an essential part of financial reporting for placing the basic financial statements in an appropriate operational, economic, or historical context. We have applied certain limited procedures to the required supplementary information in accordance with auditing standards generally accepted in the United States of America, which consisted of inquiries of management about the methods of preparing the information and comparing the information for consistency with management s responses to our inquiries, the basic financial statements, and other knowledge we obtained during our audit of the basic financial statements. We do not express an opinion or provide any assurance on the information because the limited procedures do not provide us with sufficient evidence to express an opinion or provide any assurance. Other Reporting Required by Government Auditing Standards In accordance with Government Auditing Standards, we have also issued our report dated October 9, 2018, on our consideration of the Authority s internal control over financial reporting and on our tests of its compliance with certain provisions of laws, regulations, contracts, and grant agreements and other matters. The purpose of that report is to describe the scope of our testing of internal control over financial reporting and compliance and the results of that testing, and not to provide an opinion on internal control over financial reporting or on compliance. That report is an integral part of an audit performed in accordance with Government Auditing Standards in considering the Authority s internal control over financial reporting and compliance. Charleston, West Virginia October 9, 2018 CERTIFIED PUBLIC ACCOUNTANTS 2
19 WEST VIRGINIA WATER DEVELOPMENT AUTHORITY MANAGEMENT S DISCUSSION AND ANALYSIS (Unaudited) INTRODUCTION The West Virginia Water Development Authority (the Authority ) was established in 1972 by the West Virginia Legislature as a governmental instrumentality of the State of West Virginia (the State ) a body corporate and is considered a component unit of the State for financial reporting purposes. The Authority commenced operations in 1974 and is authorized to serve as a revenue bond bank that provides financial assistance to municipalities, public service districts and other political subdivisions to meet the requirements of State and federal water pollution control and safe drinking water laws, thereby helping to protect the health of the State s citizens, improving drinking water quality, upgrading infrastructure to attract economic development and protecting the environment. The Authority operates under the supervision of the West Virginia Water Development Board, which is comprised of seven members. The Authority, also serves as fiduciary agent for two other programs which are reported separately. The Authority is self-supporting and does not receive State appropriations for operating expenses or bond programs. The Authority maintains a variety of programs to provide long-term, short-term and private-activity financing at favorable interest rates for design, construction and/or acquisition of wastewater and/or water systems. Generally, the Authority s programs are funded with proceeds from water development bonds issued by the Authority. Moneys in the various programs are loaned to municipalities, public service districts and other political subdivisions through the purchase of revenue bonds or notes issued by these local governmental agencies. The loans are repaid from the revenues of the wastewater and/or water systems or other permanent financing. Because the Authority s bonds are considered a moral obligation of the State, the aggregate principal amount of bonds and/or notes issued by the Authority may not exceed $500 million outstanding at any time; provided that before the Authority issues bonds or notes in excess of $440 million, the Legislature must pass a resolution authorizing this action. The Authority s long-term planning is accomplished within the confines of its authorized borrowing limit. Additionally, the Authority has used and will use other available resources to fund loans and issue bonds when a significant identifiable need arises. This discussion and analysis of the Authority s financial activities for the year ended June 30, 2018, is designed to assist the reader in focusing on significant financial issues and activities of the Authority and to identify significant changes in financial position. We encourage readers to consider the information presented here in conjunction with the Authority s financial statements, which begin on page 8. USING THIS REPORT This report consists of a series of financial statements. The Statement of Net Position and Statement of Revenues, Expenses, and Changes in Fund Net Position report the Authority s net position and the annual changes in net position. The Authority s net position, which is the difference between assets and deferred outflows of resources, and liabilities and deferred inflows of resources, is one way to measure the Authority s financial health or financial position. FINANCIAL HIGHLIGHTS Total assets of the Authority decreased $5.2 million or 2%. Deferred outflows of resources decreased by $768 thousand or 9%. There was a decrease in total liabilities of $9 million or 5%. Deferred inflows of resources increased $711 thousand. Total net position increased $2.6 million or approximately 4%. (Continued) 3
20 WEST VIRGINIA WATER DEVELOPMENT AUTHORITY MANAGEMENT S DISCUSSION AND ANALYSIS (Unaudited) FINANCIAL HIGHLIGHTS (Continued) Total revenues decreased $328 thousand or approximately 3%. This was primarily due to a decrease in charges for services of $658 thousand offset by an increase in interest and investment revenue of $318 thousand, as well as an increase in other revenue of $12 thousand. Total expenses decreased $1.4 million or 12%. This was primarily the combined result of a $760 thousand decrease in interest expense and a $605 thousand decrease in operating expenses. THE AUTHORITY AS A WHOLE The analysis below focuses on Net Position (Table 1) and Changes in Net Position (Table 2): Table 1 Net Position Increase WDA WDA (Decrease) Assets Current assets $ 39,904,500 $ 36,934,798 $ 2,969,702 Non current assets 202,941, ,126,678 (8,185,526) Total assets $ 242,845,652 $ 248,061,476 $ (5,215,824) Deferred outflows of resources Deferred loss on bond refundings $ 7,974,054 $ 8,617,780 $ (643,726) Deferred outflows of resources from OPEB amounts 17,523-17,523 Deferred outflows of resources from pension amounts 77, ,002 (141,828) Total deferred outflows of resources $ 8,068,751 $ 8,836,782 $ (768,031) Liabilities Current liabilities $ 11,096,791 $ 10,675,004 $ 421,787 Other accrued benefits - 225,778 (225,778) Net OPEB Liability 158, ,520 Net Pension Liability 164, ,905 (200,635) Assets held on behalf of others - 206,000 (206,000) Long-term debt outstanding 171,084, ,309,407 (9,224,442) Total liabilities $ 182,504,546 $ 191,781,094 $ (9,276,548) Deferred inflows of resources Deferred gain on refunding $ 596,143 $ - $ 596,143 Deferred inflows of resources from OPEB amounts 60,769-60,769 Deferred inflows of resources from pension amounts 91,488 37,887 53,601 Total deferred inflows of resources $ 748,400 $ 37,887 $ 710,513 Net position Net investment in capital assets $ 4,559,902 $ 5,411,424 $ (851,522) Restricted 23,892,386 26,298,886 (2,406,500) Unrestricted 39,209,169 33,368,967 5,840,202 Total net position $ 67,661,457 $ 65,079,277 $ 2,582,180 (Continued) 4
21 WEST VIRGINIA WATER DEVELOPMENT AUTHORITY MANAGEMENT S DISCUSSION AND ANALYSIS (Unaudited) THE AUTHORITY AS A WHOLE (Continued) Total assets decreased $5.2 million or 2%. Decreases to assets were the result of the use of assets to fund interest expense of $7.2 million on bonds payable, scheduled principal payments on bonds payable of $8.4 million, and general and administrative expenses of $1.4 million. The decrease to assets were substantially offset by operating revenues including revenues from interest on revenue bonds receivable reflected in the financial statements as charges for services of $11.8 million and interest on investments of $590 thousand. During the year, the Authority disbursed $260 thousand in loans from unrestricted resources available to the authority. Deferred Outflows of Resources decreased by $768 thousand which was the result of current year amortizations of loss on refundings in the amount of $644 thousand, and a reduction of the deferred outflow of resources for pension expense and pension contributions in the amount of $142 thousand, which is explained further in Note 11. An increase in the deferred outflow of resources for OPEB in the amount of $18 thousand offset these decreases due to the implementation of GASB 75, Accounting and Financial Reporting for Poseemployment Benefits Other Than Pensions which is explained further in Note 12. Total liabilities decreased approximately $9 million or approximately 5%. The majority of the decrease was in revenue bonds payable, which are presented on the balance sheet net of unamortized premiums. Deferred Inflows of Resources increased $711 thousand due to a $596 thousand gain on refundings from the Loan Program IV bond refunding, a $54 thousand increase due to current year pension activity and an additional deferred inflow of resources from OPEB of $61 thousand due to the implementation of GASB 75, Accounting and Financial Reporting for Postemployment Benefits Other than Pensions. Unrestricted net position increased $5.8 million, primarily explained by the combined result of $3.5 million net income in unrestricted accounts, a transfer of $2.7 million from restricted to unrestricted funds, and a $465 thousand transfer from the restricted portion of revenue bonds receivable in the four loan programs to current assets. Offsetting these increases was a decrease in revenue bonds receivable of $209 thousand and a transfer from restricted liabilities of $599 thousand for the current portion of revenue bonds. Restricted net position decreased $2.4 million primarily due to the transfer of $465 thousand from the restricted portion of revenue bonds receivable to current assets, the transfer of $564 thousand from the restricted portion of supplemental bonds receivable to current assets, and the transfer of $2.7 million from restricted to unrestricted funds, offset by the transfer of $599 thousand for the current portion of revenue bonds payable and the gain of $604 thousand for the refunding of the Series 2005 A-IV bonds and Series 2005 B-IV bonds. (Continued) 5
22 WEST VIRGINIA WATER DEVELOPMENT AUTHORITY MANAGEMENT S DISCUSSION AND ANALYSIS (Unaudited) THE AUTHORITY AS A WHOLE (Continued) Table 2 Changes in Net Position Increase WDA WDA (Decrease) Revenues: Operating revenues: Charges for services $ 11,795,545 $ 12,453,415 $ (657,870) Other 238, ,361 11,559 Total operating revenues 12,034,465 12,680,776 (646,311) Nonoperating revenues: Interest and investment revenue, net of arbitrage 590, , ,368 Total revenues 12,624,915 12,952,858 (327,943) Expenses: Operating expenses 2,813,226 3,417,997 (604,771) Nonoperating expenses: Interest expense 7,235,194 7,995,300 (760,106) Total expenses 10,048,420 11,413,297 (1,364,877) Change in net position 2,576,495 1,539,561 1,036,934 Beginning net position 65,079,277 63,539,716 1,539,561 Cumulative effect of change in accounting principal, Beginning net position Restated 5,685-5,685 Ending net position $ 67,661,457 $ 65,079,277 $ 2,582,180 Charges for services decreased $658 thousand. This is primarily due to closing only three loans during the current year and to lower interest rates on loans already in the portfolio. Other increased $12 thousand primarily due to an increase in administrative fees as well as an increase in miscellaneous income. Interest and investment revenue, net of arbitrage increased $318 thousand due to higher short term interest rates available to the Authority from period to period on comparable increased asset balances, as well as adding longer term investments to the portfolio with higher interest rates. Operating expenses decreased $605 thousand from the prior year. The decrease in operating expense is primarily due to reductions in contractual and professional services of $109 thousand, computer services of $27 thousand, telecommunications expense of $24 thousand, legal expense of $64 thousand, and depreciation expense of $96 thousand. (Continued) 6
23 WEST VIRGINIA WATER DEVELOPMENT AUTHORITY MANAGEMENT S DISCUSSION AND ANALYSIS (Unaudited) DEBT ADMINISTRATION As a financing entity, the business of the Authority is debt issuance and administration, including servicing. By statute, the maximum amount of bonds the Authority is authorized to have outstanding includes debt issued for the Authority and by the Authority on behalf of the West Virginia Infrastructure and Jobs Development Council. While the redemption of bonds is economically prudent because of the resulting debt service savings, any reduction in the liability for long-term debt enables the Authority to manage debt capacity for future needs as well as for new programs. The Authority, therefore, continues to monitor its long-term outstanding debt for prepayment and refunding opportunities for debt service savings. At year end, the Authority had $170 million in revenue and refunding bonds outstanding versus $180 million in the prior year, a decrease of approximately 6%. As of June 30, 2018, the 2012 Series A-I and B-I, 2012 Series A-II and B-II, 2013 Series A-II, 2016 Series A- II, and 2012 Series A-III and B-III had a Moody s rating of A1 and a Fitch rating of A+. As of June 30, 2018, the 2018 Series A-IV, had a Standard & Poor s rating of AA-. The Authority s underlying rating of AA- from Standard & Poor s reflects the State s moral obligation, which is one full category below the State s A rating. Ultimately, rating strength is provided by the Authority s pledge to maintain a debt service reserve fund equal to the maximum annual debt service on all outstanding bonds and servicing of underlying loans. If the amount in the reserve funds falls below the required maximum annual debt service level, the Governor, on notification by the Authority, may request the State s Legislature to appropriate the necessary funds to replenish the reserve to its required level. The State s Legislature, however, is not legally required to make such appropriation. The Authority, as well as its underwriters and bond counsel, continue to monitor the status of its bond insurers. The 2012 Series, 2013 Series, and 2016 Series of refunding bonds were issued without an insurance policy. ECONOMIC FACTORS THAT MAY AFFECT THE AUTHORITY There are several unknown factors that may affect the Authority, including changes in existing Federal or State legislation, additional responsibilities for new environmental or drinking water demands, and market conditions that could affect the viability of future revenue bond issues and impact investment earnings. Additionally, the Authority invests funds not required for immediate disbursement as permitted by: statute, its bond resolutions and its Investment Guidelines, Procedures and Controls. CONTACTING THE AUTHORITY S MANAGEMENT This financial report is designed to provide a general overview of the Authority s finances and to show the Authority s accountability for the money it receives as well as its ability to pay debt service. If you have questions about this report or need additional information, contact the Executive Director or Chief Financial Officer, West Virginia Water Development Authority, 1009 Bullitt Street, Charleston, West Virginia 25301, call ; or visit the Authority s website ( 7
24 WEST VIRGINIA WATER DEVELOPMENT AUTHORITY STATEMENT OF NET POSITION June 30, 2018 ASSETS CURRENT ASSETS Cash and cash equivalents $ 28,273,645 Receivables: Revenue bonds, net of unamortized discount of $43,329 7,932,753 Supplemental revenue bonds 563,871 Interest 2,870,121 Administrative fees 1,668 Due from other agencies 258,783 Total unrestricted current assets 39,900,841 Restricted current assets: Prepaid insurance 3,659 Total current assets 39,904,500 NONCURRENT ASSETS Revenue bonds 9,205,119 Investments 1,200,000 Capital assets, net 4,559,902 Total unrestricted noncurrent assets 14,965,021 Restricted assets: Cash and cash equivalents 10,466,293 Investments 3,468,743 Receivables: Revenue bonds, net of unamortized discount of $836, ,718,654 Supplemental revenue bonds 4,241,909 Prepaid insurance 80,532 Total restricted noncurrent assets 187,976,131 Total assets $ 242,845,652 DEFERRED OUTFLOWS OF RESOURCES Deferred loss on bond refundings $ 7,974,054 Deferred outflows of resources from OPEB amounts 17,523 Deferred outflows of resources from pension amounts 77,174 Total deferred outflows of resources $ 8,068,751 (Continued) 8
25 WEST VIRGINIA WATER DEVELOPMENT AUTHORITY STATEMENT OF NET POSITION (Continued) June 30, 2018 LIABILITIES CURRENT LIABILITIES Accounts payable $ 10,143 Current portion of revenue bonds payable, including unamortized net premium of $712,093 9,681,094 Accrued interest payable 1,405,554 Total current liabilities 11,096,791 NONCURRENT LIABILITIES Accrued employee benefits 50,014 Net OPEB liability 158,520 Net pension liability 164,270 Liabilities payable from restricted assets: Noncurrent portion of revenue bonds payable, including unamortized net premium of $9,892, ,034,951 Total noncurrent liabilities 171,407,755 Total liabilities $ 182,504,546 DEFERRED INFLOWS OF RESOURCES Deferred gain on refunding $ 596,143 Deferred inflows of resources from OPEB amounts 60,769 Deferred inflows of resources from pension amounts 91,488 Total deferred inflows of resources $ 748,400 NET POSITION Restricted $ 23,892,386 Unrestricted 39,209,169 Net investment in capital assets 4,559,902 Total net position $ 67,661,457 The accompanying notes are an integral part of these financial statements. 9
26 WEST VIRGINIA WATER DEVELOPMENT AUTHORITY STATEMENT OF REVENUES, EXPENSES, AND CHANGES IN FUND NET POSITION Year Ended June 30, 2018 OPERATING REVENUES Charges for services $ 11,795,545 Miscellaneous 238,920 Total operating revenues 12,034,465 OPERATING EXPENSES Depreciation and amortization 997,543 General and administrative 1,398,842 Bond issuance costs 416,841 Total operating expenses 2,813,226 Operating income 9,221,239 NONOPERATING REVENUES (EXPENSES) Interest and investment revenue 590,450 Interest expense (7,235,194) Total nonoperating expenses (6,644,744) CHANGE IN NET POSITION 2,576,495 Total net position, beginning of year 65,079,277 Cumulative effect of change in accounting principle 5,685 Total net position, beginning of year, as restated 65,084,962 Total net position, end of year $ 67,661,457 The accompanying notes are an integral part of these financial statements. 10
27 WEST VIRGINIA WATER DEVELOPMENT AUTHORITY STATEMENT OF CASH FLOWS Year Ended June 30, 2018 OPERATING ACTIVITIES Receipts of principal on bonds receivable $ 8,125,545 Receipts of interest on bonds receivable 12,095,261 Receipts of administrative fees on bonds receivable 238,922 Receipts of reimbursements from other agencies 861,650 Disbursements from issuance of bonds receivable (263,052) Disbursements of general and administrative expense (1,406,668) Disbursements on behalf of employees (571,693) Disbursements on behalf of other agencies (919,336) Net cash provided by operating activities 18,160,629 CAPITAL AND RELATED FINANCING ACTIVITIES Acquisition of capital assets (139,269) NONCAPITAL FINANCING ACTIVITIES Proceeds from sale of revenue bonds 42,048,469 Principal paid on revenue and refunding bonds (49,195,000) Interest paid on revenue and refunding bonds (7,381,670) Net cash used in noncapital financing activities (14,528,201) INVESTING ACTIVITIES Proceeds from sale of investments 27,562 Investment earnings 514,655 Net cash used in investing activities 542,217 Net increase in cash and cash equivalents 4,035,376 CASH AND CASH EQUIVALENTS, beginning 34,704,562 CASH AND CASH EQUIVALENTS, ending $ 38,739,938 Reconciliation of operating income to net cash provided by operating activities: Operating income $ 9,221,239 Adjustments to reconcile operating income to net cash provided by operating activities Depreciation and amortization expense 997,543 Pension expense 52,159 OPEB expense 9,191 OPEB contribution support (9,995) Changes in operating accounts: Due from other agencies (63,371) Prepaid insurance (85,400) Supplemental revenue bonds receivable 563,870 Revenue bonds receivable 7,249,277 Accrued interest receivable 349,063 (Continued) 11
28 WEST VIRGINIA WATER DEVELOPMENT AUTHORITY STATEMENT OF CASH FLOWS (Continued) Year Ended June 30, 2018 Adminstrative fees receivable 2 Accounts payable (63,483) Accrued employee benefits 15,423 Deferred outflows of resources due to pension contributions (57,366) Deferred outflows of resources due to OPEB contributions (17,523) Net cash provided by operating activities $ 18,160,629 The accompanying notes are an integral part of these financial statements. 12
29 WEST VIRGINIA WATER DEVELOPMENT AUTHORITY NOTES TO FINANCIAL STATEMENTS June 30, 2018 Note 1. Reporting Entity The West Virginia Water Development Authority (the Authority) is a governmental instrumentality of the State of West Virginia (the State) and a body corporate, created under the provisions of Chapter 22C, Article 1 of the Code of West Virginia, 1931, as amended, and known as the West Virginia Water Development Act. The Authority s mission is to provide West Virginia communities effective financial assistance for development of wastewater, water and economic infrastructure that will improve health, protect the streams of the State, improve drinking water quality and encourage economic growth. This is accomplished by administering and managing the West Virginia Water Development Revenue Bond Programs, serving as the State-designated fiduciary of the West Virginia Infrastructure Fund, managing the Bureau for Public Health s Drinking Water Treatment Revolving Fund, administering the Department of Environmental Protection s Clean Water State Revolving Fund, and being an active member of the West Virginia Infrastructure and Jobs Development Council. The Authority s Water Development Revenue Bond Programs are funded with proceeds of water development bonds issued by the Authority. Moneys in the programs are loaned to municipalities, public service districts and other political subdivisions through the purchase by the Authority of revenue bonds or notes issued by those entities, who repay the loans from the revenues of the systems or other permanent financing. The Authority receives no appropriations from the State; however, as the State is able to impose its will over the Authority, the Authority is considered a component unit of the State. In evaluating how to define the Authority for financial reporting purposes, management has considered all potential component units. The decision to include a potential component unit in the reporting entity is made by applying the criteria set forth in accounting principles generally accepted (GAAP) in the United States of America for governments. GAAP defines component units as those entities which are legally separate governmental organizations for which the appointed members of the Authority are financially accountable or other organizations for which the nature and significance of their relationship with the Authority are such that exclusion would cause the Authority s financial statements to be misleading. Because no such organizations exist which meet the above criteria, the Authority has no component units. Note 2. Significant Accounting Policies Basis of presentation The Authority is accounted for as a proprietary fund special purpose government engaged in business type activities. In accordance with GAAP, the financial statements are prepared on the accrual basis of accounting, using the flow of economic resources measurement focus. Under this basis of accounting, revenues are recognized when earned and expenses are recognized when incurred. The Authority is included in the State s financial statements as a discretely presented component unit proprietary fund and business type activity. There may be differences between the amounts reported in these financial statements and the financial statements of the State as a result of major fund determination. (Continued) 13
30 WEST VIRGINIA WATER DEVELOPMENT AUTHORITY NOTES TO FINANCIAL STATEMENTS June 30, 2018 Note 2. Significant Accounting Policies (Continued) Cash and cash equivalents Cash and cash equivalents include deposits with the West Virginia Treasure s office and investments with original maturities of less than ninety days and are carried at amortized costs. Allowance for uncollectible loans and service charges The Authority established an allowance for uncollectible revolving loans and service charges based on the estimated age of revolving loans and service charges and their anticipated collectability. The Authority has not established an allowance for uncollectible loans in the Water Development Revenue Bond Programs because of remedies available to it in the loan agreements that exist between the Authority and the various entities. Investments Investments are carried at fair value which is based upon quoted market prices. Gains and losses are reported as a component of investment income. Restricted assets Proceeds of revenue bonds, as well as certain resources set aside for their repayment, are classified as restricted assets on the balance sheet because their use is limited by bond covenants. When both restricted and unrestricted resources are available for use, it is generally the Authority s policy to use restricted resources first, and then unrestricted resources as they are needed. Capital assets Capital assets are stated at cost. Depreciation and amortization are computed using the straight-line method over an estimated economic useful life. The table below details the capital asset categories and related economic useful lives for assets in excess of $1,000 with useful lives in excess of 1 year. Furniture and equipment Building Building improvements Intangible assets 5 years 40 years 10 years 5 years Accrued employee benefits In accordance with State policy, the Authority permits employees to accumulate earned but unused vacation benefits. A liability for vacation pay is accrued when earned. Bond Premiums, Discounts, and Issuance Costs Bond premiums and discounts are amortized using the straight-line method over the varying terms of the bonds issued. The straight-line method is not in accordance with GAAP, but the difference in amortization using the straight-line method, versus the effective interest method which is in accordance with GAAP, is not material to the financial statements as a whole. Bond issuance costs are expensed as incurred. (Continued) 14
31 WEST VIRGINIA WATER DEVELOPMENT AUTHORITY NOTES TO FINANCIAL STATEMENTS June 30, 2018 Note 2. Significant Accounting Policies (Continued) Arbitrage rebate payable The United States Internal Revenue Code of 1986, as amended (the Code ), prescribes restrictions applicable to the Authority as issuer of Water Development Revenue and Refunding Bonds. Among those include restrictions on earnings on the bond proceeds. The Code requires payment to the federal government of investment earnings on certain bond proceeds in excess of the amount that would have been earned if the proceeds were invested at a rate equal to the yield on the bonds. As of June 30, 2018, the Authority is not liable to the federal government as a result of arbitrage. Deferred outflows of resources / deferred inflows of resources The statement of net position reports a separate financial statement element called deferred outflows of resources. This financial statement element represents a consumption of net position that applies to a future period and so will not be recognized as an outflow of resources (expense) until that time. The Authority reports losses on bond refunding as deferred outflows of resources and deferred outflows of resources related to pensions and OPEB. The statement of net position reports a separate financial statement element called deferred inflows of resources. This financial statement element represents an acquisition of net position that applies to a future period and so will not be recognized as an inflow of resources (revenue) until that time. The Authority reports gains on bond refundings as deferred inflows of resources and deferred inflows of resources related to pensions and OPEB. Pension For purposes of measuring the net pension liability, deferred outflows of resources and deferred inflows of resources related to pensions, and pension expense, information about the fiduciary net position of the West Virginia Public Employees Retirement System (PERS) and additions to/deductions from PERS fiduciary net position have been determined on the same basis as they are reported by PERS. For this purpose, benefit payments (including refunds of employee contributions) are recognized when due and payable in accordance with the benefit terms. Investments of the PERS are reported at fair value. Postemployment benefits other than pensions (OPEB) For purposes of measuring the net OPEB liability, deferred outflows of resources and deferred inflows of resources related to OPEB, and OPEB expense, information about the fiduciary net position of the West Virginia Retiree Health Benefit Trust OPEB Plan (RHBT) and additions to/deductions from RHBT's fiduciary net position have been determined on the same basis as they are reported by RHBT. For this purpose, RHBT recognizes benefit payments when due and payable in accordance with the benefit terms. Investments are reported at fair value, except for certain pooled investments, money market investments and participating interest-earning investment contracts that have a maturity at the time of purchase of one year or less, which are reported at amortized cost. (Continued) 15
32 WEST VIRGINIA WATER DEVELOPMENT AUTHORITY NOTES TO FINANCIAL STATEMENTS June 30, 2018 Note 2. Significant Accounting Policies (Continued) Net position Net position is presented as unrestricted, restricted, or as the net investment in capital assets. The net investment in capital assets consists of all capital assets, less accumulated depreciation. Restricted net position represents assets restricted for the repayment of bond proceeds, by bond covenants, or for retirement of other long term obligations. All remaining net position is considered unrestricted. When an expense is incurred for purposes for which both restricted and unrestricted net position is available, restricted resources are applied first. Note 3. Cumulative Effect of Adoption of Accounting Principle Effective July 1, 2017, the Authority adopted the provisions of Governmental Accounting Standards Board (GASB) Statement No. 75, Accounting and Financial Reporting for Postemployment Benefits other than Pensions. The Authority determined that it was not practical to restate all periods presented and has recorded the cumulative effect of the increase to beginning net position of implementing this change of $5,685 as of July 1, 2017, which is the net OPEB liability of $233,334 less deferred outflows of resources related to OPEB contributions of $13,241 as of that date and the June 30, 2017 liability of $225,778 for postemployment benefits reported in accordance with GASB Statement No. 45, which is superseded by GASB Statement No. 75. The Authority further determined that it was not practical to determine the amounts of all deferred inflows of resources and deferred outflows of resources related to OPEB as of July 1, 2017 and these amounts are not reported. Note 4. Deposit and Investment Risk Disclosures The General Revenue Bond Resolutions and the Authority s investment guidelines authorize the Authority to invest all bond proceeds in obligations of the United States and certain of its agencies, certificates of deposit, public housing bonds, direct and general obligations of states which are rated in either of the two highest categories by Standard & Poor s Corporation, advance-refunded municipal bonds and repurchase agreements relating to certain securities. Investments are managed by the financial institutions serving as trustees for the Authority. Interest rate risk As of June 30, 2018, the Authority had the following investments (which include certain cash equivalents) and maturities: Maturities (in Years) Carrying Type Value Less Than U.S. Treasury $ 4,668,743 $ - $ 4,668,743 $ - Money markets 38,654,980 38,654, $ 43,323,723 $ 38,654,980 $ 4,668,743 $ - (Continued) 16
33 WEST VIRGINIA WATER DEVELOPMENT AUTHORITY NOTES TO FINANCIAL STATEMENTS June 30, 2018 Note 4. Deposit and Investment Risk Disclosures (Continued) Interest rate risk (Continued) As a means of limiting its exposure to fair value losses arising from rising interest rates, the Authority s investment guidelines limit the maturities of investments not matched to a specific debt or obligation of the Authority to five years or less, unless otherwise approved by the Board. Investments matched to obligations of the Authority would include investments of capital and special reserve funds for each of the Authority s outstanding bond issues in Loan Programs I, II and III. The General Revenue Bond Resolutions for Loan Programs I, II, III and IV require that, while the bonds are outstanding, there be on deposit in the capital and special reserve funds an amount equal to the maximum amount of principal installments and interest coming due during the current or any succeeding year. The General Revenue Bond Resolution for Loan Program IV permits this requirement to be met, and it has been met, with the deposit of a Reserve Fund Credit Facility into the reserve fund. There are, therefore, no investments of capital and special reserve funds for Loan Program IV. The Authority has both the intent and the ability to hold long-term securities until final maturity and thus is limited in its exposure to interest rate risk on these long-term obligations. Concentration of credit risk As of June 30, 2018, the Authority had investment balances with the following issuers which are greater than or equal to 5 percent of the investment balance: Percentage of Type Issuer Investments Money Markets Federated Prime Cash Obligations 89% The Authority s investment guidelines manage concentration of credit risk by limiting its investment activity so that at any time its total investment portfolio will not exceed the percentage limits as to the permitted investments as follows: (a) (b) (c) (d) (e) (f) (g) (h) (i) (j) (k) Permitted Investments Direct Federal Obligations Federally Guaranteed Obligations Federal Agency Obligations Money Markets Repurchase Agreements/Investment Contracts Time Deposits/Certificates of Deposit Demand Deposits Corporate Obligations Other State/Local Obligations West Virginia Obligations Housing Bonds - Secured by Annual Contributions Contracts (Continued) 17 Maximum % of Portfolio 100% 100% 90% 90% 90% 90% 30% 15% 15% 15% 5%
34 WEST VIRGINIA WATER DEVELOPMENT AUTHORITY NOTES TO FINANCIAL STATEMENTS June 30, 2018 Note 4. Deposit and Investment Risk Disclosures (Continued) Concentration of credit risk (Continued) With the exception of money markets, repurchase agreements/investment contracts, time deposits/certificates of deposit and demand deposits, investments that comprise more than 15% of the investment portfolio must be direct federal, federal agency or federally guaranteed obligations. All other investments listed above that comprise more than 15% of the investment portfolio must be either provided by an institution with a rating of at least A/A by Moody s and/or Standard and Poor s, invested in a money market fund rated AAAm or AAAm-G or better by Standard and Poor s, secured by obligations of the United States, or not exceed the insurance limits established by the FDIC unless adequate collateral is provided. Credit Risk The following table provides information on the credit ratings of the Authority s short-term investments as of June 30, 2018: Security Type Fitch Moody's Standard & Poors Fair Value Money Markets AAAmmf Aaa-mf AAAm $ 38,654,980 Credit risk with investment of bond proceeds is managed by the limitation on investment of those proceeds in the following types of debt securities in accordance with the Authority s investment guidelines and the authorizing General Revenue Bond Resolution: Government obligations, obligations of certain federal agencies, either representing the full faith and credit of the United States of America or which are rated Aaa-mf by Moody s and AAAm by Standard and Poor s, certain types of commercial paper, advance-refunded municipal bonds, certain general obligations of the State of West Virginia or any other state, or other forms of investments approved in writing by the applicable bond insurer, if any. Accordingly, the credit risk with the investment of cash assets other than bond proceeds, known as other revenues, is managed by the limitation on investment of other revenues in the following types of debt securities in accordance with the Authority s investment guidelines: direct obligations of or obligations guaranteed by the United States of America, the State of West Virginia or any other state, provided that obligations of other states meet certain requirements, obligations of certain federal agencies, certain types of indebtedness of public agencies or municipalities, corporate indebtedness meeting certain requirements or any other debt security investment permitted with bond proceeds. (Continued) 18
35 WEST VIRGINIA WATER DEVELOPMENT AUTHORITY NOTES TO FINANCIAL STATEMENTS June 30, 2018 Note 4. Deposit and Investment Risk Disclosures (Continued) Custodial credit risk For an investment, custodial credit risk is the risk that, in the event of the failure of the counterparty, the Authority will not be able to recover the value of its investments or collateral securities that are in the possession of an outside party. Cash consisted of the following at June 30, 2018: Operating cash on hand $ - Cash on deposit with State Treasurer 84,958 Total $ 84,958 The Authority has no securities that are subject to foreign currency risk. A reconciliation of the amounts disclosed as cash and investments included in this Note to cash and cash equivalents, restricted cash and cash equivalents, and investments in the Statement of Net Assets as of June 30, 2018, is as follows: Deposits: Cash and cash equivalents as reported on the Statement of Net Position $ 28,273,645 Add: restricted cash and cash equivalents 10,466,293 Less: cash equivalents and restricted cash equivalents disclosed as investments (38,654,980) Total cash as disclosed in this Note $ 84,958 Investments: Investments as reported on the Statement of Net Position $ 1,200,000 Add: restricted investments 3,468,743 Add: cash equivalents and restricted cash equivalents disclosed as investments 38,654,980 Total investments as disclosed in this Note $ 43,323,723 Note 5. Investments Measured at Fair Value The Authority measures the investments listed below at fair value for financial reporting purposes. GAAP defines fair value as the price that would be received to sell an asset or paid to transfer a liability in an orderly transaction between market participants at the measurement date. Fair value is a marketbased measurement, not an entity-specific measurement. The Authority categorizes fair value measurements within the fair value hierarchy established by GAAP. The fair value hierarchy categorizes the inputs to valuation techniques used to measure fair value into three levels as follows: (Continued) 19
36 WEST VIRGINIA WATER DEVELOPMENT AUTHORITY NOTES TO FINANCIAL STATEMENTS June 30, 2018 Note 5. Investments Measured at Fair Value (Continued) Level 1 inputs - Quoted prices (unadjusted) for identical assets or liabilities in active markets that a government can access at the measurement date. Level 2 inputs - Other than quoted prices included within Level 1, these are inputs that are observable for an asset or liability, either directly or indirectly. Level 3 inputs - Unobservable inputs for an asset or liability. The fair value hierarchy gives the highest priority to Level 1 inputs and the lowest priority to Level 3 inputs. U.S. Treasury investments are valued using the last reported sales prices quoted in active markets that can be accessed at the measurement date. The table below summaries the recurring fair value measurements of the investments in accordance with the fair value hierarchy levels as of June 30, Investment Type Level 1 Level 2 Level 3 Total U.S. Treasury $ 4,668,743 $ - $ - $ 4,668,743 Note 6. Due From Other Agencies Certain agencies of the State were indebted to the Authority at June 30, 2018, in connection with services performed by the Authority on behalf of the agencies. Amounts due the Authority at June 30, 2018 are as follows: West Virginia Infrastructure and Jobs Development Council, net $ 210,485 Department of Environmental Protection Clean Water State Revolving Fund 16,371 Bureau for Public Health Drinking Water Treatment Revolving Fund 31,927 $ 258,783 Note 7. Revenue Bonds Receivable As of June 30, 2018, the face value of revenue bonds of municipalities, public service districts and other political subdivisions purchased with proceeds from Water Development Revenue Bonds was $178,104,311. Management s intentions are to hold such bonds until maturity; therefore, management believes the face amount of the bonds is fully collectible. Although not required, the Authority purchased supplemental bonds of municipalities and public service districts using other available funds. As of June 30, 2018, the face value of supplemental bonds was $9,205,
37 WEST VIRGINIA WATER DEVELOPMENT AUTHORITY NOTES TO FINANCIAL STATEMENTS June 30, 2018 Note 8. Capital Assets Capital asset activity for the year ended June 30, 2018, was as follows: Beginning Balance Additions Disposals Ending Balance Capital assets not being depreciated: Land $ 514,684 $ - $ - $ 514,684 Construction work in progress - 11,510-11,510 Total capital assets not being depreciated 514,684 11, ,194 Capital assets, being depreciated: Furniture and equipment 6,850, ,761-6,977,934 Building 4,100, ,100,298 Total capital assets, being depreciated 10,950, ,761-11,078,232 Less accumulated depreciation for: Furniture and equipment 5,547, ,286-6,436,247 Building 505, , ,277 Total accumulated depreciation 6,053, ,793-7,044,524 Total capital assets, net $ 5,411,424 $ (851,522) $ - $ 4,559,902 Note 9. Debt Refundings On February 28, 2018, the Authority currently refunded two series of previously outstanding Loan Program IV bonds. Series 2018 A-IV, issued for $31,520,000, with interest rates ranging from 2.5% to 5.0%, was used to refund $31,575,000 of the remaining balance of the Authority s outstanding Series 2005 A-IV revenue bonds, with interest rates ranging from 4.375% to 5.0% and $1,510,000 of the Authority s outstanding Series 2005 B-IV revenue bonds with interest rates originally ranging from 4.75% to 5.125%. The proceeds of $34,087,469 (including net original issue premium of $2,567,469) were used to pay $362,889 in underwriting fees and other issuance costs relating to the refunding bond issue and to purchase United States Treasury obligations. Those securities were deposited in an irrevocable trust to provide for redemption of the bonds. The refunding resulted in a difference between the reacquisition price and the net carrying amount of the refunded debt of ($542,749). This difference is being charged to interest expense through fiscal year The Authority completed the refunding to reduce its total debt service payments over the next 27 years by $7,351,148 and to obtain an economic gain (difference between the present values of the old and new debt service payments) of $4,899,316. (Continued) 21
38 WEST VIRGINIA WATER DEVELOPMENT AUTHORITY NOTES TO FINANCIAL STATEMENTS June 30, 2018 Note 9. Debt Refundings (Continued) Series 2018 B-IV, a private placement, issued for $7,961,000, with an interest rate of 3.5%, was used to refund $ 7,675,000 of the remaining balance of the Authority s outstanding Series 2005 B-IV revenue bonds, with interest rates originally ranging from 4.750% to 5.125%. The proceeds of 7,961,000 were used to pay $139,352 in issuance costs relating to the refunding bond issue and to purchase United States Treasury obligations. The refunding resulted in a difference between the reacquisition price and the net carrying amount of the refunded debt of ($61,268). This difference is being charged to interest expense through fiscal year The Authority completed the refunding to reduce its total debt service payments over the next 18 years by $883,403 and to obtain an economic gain (difference between the present values of the old and new debt service payments) of $663,851. Note 10. Revenue Bonds Payable The following is a summary of the Authority s bond transactions for the year ended June 30, 2018: Revenue bonds payable at June 30, 2017 $ 179,825,000 Bonds issued during the year ended June 30, ,481,000 Bonds retired during the year ended June 30, 2018 (8,435,000) Bonds refunded during the year ended June 30, 2018 (40,760,000) Revenue bonds payable at June 30, 2018 $ 170,111,000 Revenue and refunding bonds outstanding at June 30, 2018, were as follows: Series Final Maturity Interest Rates % Balance 2012 AI 11/1/ $ 1,720, B-I 11/1/ ,170, A-II 11/1/ ,410, B-II 11/1/ ,875, A-III 7/1/ ,275, B-III 7/1/ ,670, A-II 11/1/ ,795, A-II 11/1/ ,715, A-IV 11/1/ ,520, B-IV 11/1/ ,961,000 $ 170,111,000 (Continued) 22
39 WEST VIRGINIA WATER DEVELOPMENT AUTHORITY NOTES TO FINANCIAL STATEMENTS June 30, 2018 Note 10. Revenue Bonds Payable (Continued) Loan Program I includes Series 2012 A-I and 2012 B-I Water Development Revenue Refunding Bonds. Loan Program II includes Series 2012 A-II, 2012 B-II, 2013 A-II, and 2016 A-II Water Development Revenue Refunding Bonds. Loan Program III includes Series 2012 A-III and 2012 B-III Water Development Revenue Refunding Bonds. Loan Program IV includes Series 2018 A-IV and 2018 B-IV Water Development Revenue Bonds. Total future maturities of bond principal and interest on Authority indebtedness at June 30, 2018, are as follows: Loan Program I Principal Interest Total 11/01/18 $ 1,635,000 $ 476,363 $ 2,111,363 11/01/19 1,240, ,225 1,657,225 11/01/20 1,295, ,475 1,657,475 11/01/21 1,345, ,375 1,653,375 11/01/22 1,400, ,850 1,655,850 6,915,000 1,820,288 8,735,288 11/01/23-11/01/26 5,975, ,212 6,440,212 $ 12,890,000 $ 2,285,500 $ 15,175,500 Loan Program II Principal Interest Total 11/01/18 $ 5,100,000 $ 3,784,150 $ 8,884,150 11/01/19 5,225,000 3,623,175 8,848,175 11/01/20 5,420,000 3,432,475 8,852,475 11/01/21 5,605,000 3,218,075 8,823,075 11/01/22 5,850,000 2,973,300 8,823,300 27,200,000 17,031,175 44,231,175 11/01/23-11/01/27 30,110,000 11,027,575 41,137,575 11/01/28-11/01/32 23,905,000 5,073,100 28,978,100 11/01/33-11/01/37 10,265,000 1,574,900 11,839,900 11/01/38-11/01/39 3,315, ,500 3,440,500 67,595,000 17,801,075 85,396,075 $ 94,795,000 $ 34,832,250 $ 129,627,250 (Continued) 23
40 WEST VIRGINIA WATER DEVELOPMENT AUTHORITY NOTES TO FINANCIAL STATEMENTS June 30, 2018 Note 10. Revenue Bonds Payable (Continued) Loan Program III Principal Interest Total 11/01/18 $ 700,000 $ 799,756 $ 1,499,756 11/01/19 720, ,981 1,493,981 11/01/20 745, ,356 1,492,356 11/01/21 775, ,731 1,494,731 11/01/22 810, ,932 1,500,932 3,750,000 3,731,756 7,481,756 11/01/23-11/01/27 4,435,000 3,043,141 7,478,141 11/01/28-11/01/32 5,205,000 2,244,700 7,449,700 11/01/33-11/01/37 6,205,000 1,225,656 7,430,656 11/01/38-11/01/40 3,350, ,563 3,506,563 19,195,000 6,670,060 25,865,060 $ 22,945,000 $ 10,401,816 $ 33,346,816 Loan Program IV Principal Interest Total 11/01/18 $ 1,534,000 $ 1,616,596 $ 3,150,596 11/01/19 1,053,000 1,575,936 2,628,936 11/01/20 1,084,000 1,538,489 2,622,489 11/01/21 1,126,000 1,496,039 2,622,039 11/01/22 1,169,000 1,447,951 2,616,951 5,966,000 7,675,011 13,641,011 11/01/23-11/01/27 6,327,000 6,491,756 12,818,756 11/01/28-11/01/32 7,396,000 4,981,536 12,377,536 11/01/33-11/01/37 8,052,000 3,150,864 11,202,864 11/01/38-11/01/42 8,075,000 1,428,581 9,503,581 11/01/43-11/01/44 3,665, ,035 3,799,035 33,515,000 16,186,772 49,701,772 $ 39,481,000 $ 23,861,783 $ 63,342,783 (Continued) 24
41 WEST VIRGINIA WATER DEVELOPMENT AUTHORITY NOTES TO FINANCIAL STATEMENTS June 30, 2018 Note 10. Revenue Bonds Payable (Continued) Loan Program IV (Continued) Total all loan programs $170,111,000 Add: unamortized net premium 10,605,045 Total all programs, net 180,716,045 Less: current portion of revenue bonds payable 9,681,094 Noncurrent portion of revenue bonds payable $171,034,951 The Authority has defeased certain revenue bonds by placing the proceeds of new bonds in irrevocable trusts to provide for all future debt service payments on the refunded bonds. Accordingly, the trust accounts assets and the liabilities for the defeased bonds are not included in the Authority s financial statements. At June 30, 2018, there are $1,115,000 in defeased bonds outstanding. The proceeds from the Authority s Revenue Bond Program provide financial assistance to municipalities, public service districts and other public subdivisions to meet the requirements of state and federal water pollution control and safe drinking water laws. All bonds are considered a moral obligation of the state of West Virginia. All assets of the Authority except capital assets have been pledged to fulfill the commitments of the bonds over the life of the debt. Principal and interest paid on bonds payable for the year ended June 30, 2018, was $8,435,000 and $7,381,670, respectively, and principal payments and interest received on pledged notes receivable were $8,125,545 and $12,095,261, respectively, at June 30, Note 11. Pension Plan Plan Description The Authority contributes to the PERS, a cost-sharing multiple-employer defined benefit pension plan administered by the West Virginia Consolidated Public Retirement Board (CPRB). PERS covers substantially all employees of the State and its component units, as well as employees of participating non-state governmental entities who are not participants of another state or municipal system. Benefits under PERS include retirement, death and disability benefits, and have been established and may be amended by action of the State Legislature. The CPRB issues a publicly available financial report that includes financial statements for PERS that may be obtained at (Continued) 25
42 WEST VIRGINIA WATER DEVELOPMENT AUTHORITY NOTES TO FINANCIAL STATEMENTS June 30, 2018 Note 11. Pension Plan (Continued) Benefits Provided PERS provides retirement benefits as well as death and disability benefits. For employees hired prior to July 1, 2015, qualification for normal retirement is age 60 with five years of service or at least age 55 with age and service equal to 80 or greater. A member may retire with the pension reduced actuarially if the member is at least age 55 and has at least 10 years of contributory service, or at any age with 30 years of contributory service. For all employees hired July 1, 2015 and later, qualification for normal retirement is age 62 with 10 years of service. A member hired after July 1, 2015 may retire with the pension reduced actuarially if the member is between ages 60 and 62 with at least ten years of contributory service, between ages 57 and 62 with at least twenty years of contributory service, or between ages 55 and 62 with at least thirty years of contributory service. The straight-life annuity retirement benefit is equivalent to 2% of average salary multiplied by years of service. For employees hired prior to July 1, 2015, average salary is the average of the highest annual compensation during any period of three consecutive years within the last fifteen years of earnings. For all employees hired July 1, 2015 and later, average salary is the average of the five consecutive highest annual earnings out of the last fifteen years of earnings. For employees hired prior to July 1, 2015, terminated members with at least five years of contributory service who do not withdraw their accumulated contributions may elect to receive their retirement annuity beginning at age 62. For all employees hired July 1, 2015 and later, this age increases to 64 with at least ten years of contributory service, or age 63 with at least twenty years of contributory service. Contributions Although contributions are not actuarially determined, actuarial valuations are performed to assist the Legislature in establishing appropriate contribution rates. Members hired prior to July contribute 4.5% of annual earnings. All members hired July 1, 2015 and later contribute 6% of annual earnings. Current funding policy requires employer contributions of 11.0%, 12.0%, and 13.5% for the years ended June 30, 2018, 2017, and 2016, respectively. During the years ended June 30, 2018, 2017, and 2016, the Authority s contributions to PERS required and made were approximately $57,366, $63,388, and $74,720, respectively. Pension Liabilities, Pension Expense, and Deferred Outflows of Resources and Deferred Inflows of Resources Related to Pensions At June 30, 2018, the Authority reported a liability of $164,270 for its proportionate share of the net pension liability. The net pension liability reported at June 30, 2018 was measured as of June 30, 2017, and the total pension liability used to calculate the net pension liability was determined by an actuarial valuation as of July 1, 2016, rolled forward to the measurement date of June 30, The Authority s proportion of the net pension liability was based on the Authority s share of contributions to the pension plan relative to the contributions of all employers participating in PERS for the year ended June 30, At June 30, 2017, the Authority s proportion was percent, which was a decrease of percent from its proportion measured as of June 30, (Continued) 26
43 WEST VIRGINIA WATER DEVELOPMENT AUTHORITY NOTES TO FINANCIAL STATEMENTS June 30, 2018 Note 11. Pension Plan (Continued) For the year ended June 30, 2018, the Authority recognized pension expense of $52,159. At June 30, 2018, the Authority reported deferred outflows of resources and deferred inflows of resources related to pensions from the following sources: Deferred Deferred Outflows of Inflows of Resources Resources Net difference between projected and actual earnings on pension plan investments $ - $ 39,937 Changes in assumptions - 8,520 Changes in proportion and differences between the Authority s contributions and proportionate share of contributions 5,189 42,668 Differences between expected and actual experience 14, The Authority s contributions made subsequent to the measurement date of June 30, ,366 - Total $ 77,174 $ 91,488 The amount of $57,366 reported as deferred outflows of resources related to pensions resulting from the Authority s contributions subsequent to the measurement date will be recognized as a reduction of the net pension liability in the year ended June 30, Other amounts reported as deferred outflows of resources and deferred inflows of resources related to pensions will be recognized in pension expense as follows: Year ending June 30, Actuarial Assumptions 2019 $ (26,432) 2020 (445) 2021 (10,307) 2022 (34,496) The total pension liability in the June 30, 2017 actuarial valuation was determined using the following actuarial assumptions, applied to all periods in the measurement: Inflation Salary increases Investment rate of return 3.0 percent percent, average, including inflation 7.5 percent, net of pension plan investment expense Mortality rates were based on 100% of RP-2000 Non-Annuitant, Scale AA fully generational for active employees, 110% of the RP-2000 Non-Annuitant, Scale AA fully generational for healthy males, 101% of RP-2000 Non-Annuitant Scale AA fully generational for healthy females, 96% of RP-2000 Disabled Annuitant, Scale AA fully generational for disabled males, and 107% of RP-2000 Disabled Annuitant, Scale AA fully generational for disabled females. (Continued) 27
44 WEST VIRGINIA WATER DEVELOPMENT AUTHORITY NOTES TO FINANCIAL STATEMENTS June 30, 2018 Note 11. Pension Plan (Continued) An experience study, which was based on the years 2009 through 2014, was completed prior to the 2015 actuarial valuation. The long-term expected rate of return on pension plan investments was determined using a buildingblock method in which best-estimate ranges of expected future real rates of return (expected returns, net of pension plan investment expense and inflation) are developed for each major asset class. These ranges are combined to produce the long-term expected rate of return by weighting the expected future real rates of return by the target asset allocation percentage and by adding expected inflation. The target allocation and best estimates of arithmetic real rates of return for each major asset class are summarized in the following table: Asset Class Target Allocation Long-term Expected Rate of Return Weighted Average Expected Real Rate of Return US equity 27.5% 7.0% 1.92% International equity 27.5% 7.7% 2.12% Core fixed income 7.5% 2.7% 0.20% High yield fixed income 7.5% 5.5% 0.41% Real estate 10.0% 7.0% 0.70% Private equity 10.0% 9.4% 0.94% Hedge funds 10.0% 4.7% 0.47% Total % 6.76% Inflation (CPI) 1.90% 8.66% Discount Rate The discount rate used to measure the total pension liability was 7.5 percent. The projection of cash flows used to determine the discount rate assumed that employee contributions will be made at the current contribution rate and that contributions from employers will continue to be made at statutorily required rates, which are determined annually based on actuarial valuations. Based on those assumptions, the pension plan s fiduciary net position was projected to be available to make all projected future benefit payments of current active and inactive employees. Therefore, the long-term expected rate of return on pension plan investments was applied to all periods of projected benefit payments to determine the total pension liability. Although discount rates are subject to change between measurement dates, there were no changes in the discount rate in the current period. Sensitivity of the Authority s Proportionate Share of the Net Pension Liability to Changes in the Discount Rate (Continued) 28
45 WEST VIRGINIA WATER DEVELOPMENT AUTHORITY NOTES TO FINANCIAL STATEMENTS June 30, 2018 Note 11. Pension Plan (Continued) The following presents the Authority s proportionate share of the net pension liability calculated using the discount rate of 7.5 percent, as well as what the Authority s proportionate share of the net pension liability would be if it were calculated using a discount rate that is one-percentage-point lower or onepercentage-point higher than the current rate: Discount Rate 1% Decrease Current Discount 1% Increase (6.5%) Rate (7.5%) (8.5%) Authority s proportionate share of the net pension liability $ 454,771 $ 164,270 $ 81,347 Note 12. Other Postemployment Benefits Plan description The West Virginia Other Postemployment Benefit Plan (the OPEB Plan) is a cost-sharing, multipleemployer, defined benefit other post-employment benefit plan and covers the retirees of State agencies, colleges and universities, county boards of education, and other government entities as set forth in the West Virginia Code Section 5-16D-2 (the Code). The financial activities of the OPEB Plan are accounted for in the West Virginia Retiree Health Benefit Trust Fund (RHBT), a fiduciary fund of the State of West Virginia. The OPEB Plan is administered by a combination of the West Virginia Public Employees Insurance Agency (PEIA) and the RHBT staff. OPEB Plan benefits are established and revised by PEIA and the RHBT management with approval of their Finance Board. The PEIA issues a publically available financial report of the RHBT that can be obtained at or by writing to the West Virginia Public Employees Insurance Agency, th Street, SE Suite 2, Charleston, WV Benefits provided Authority employees who retire are eligible for PEIA health and life benefits, provided they meet the minimum eligibility requirements of the PERS or meet certain other eligibility requirements of other CPRB sponsored retirement plans. RHBT provides medical and prescription drug insurance and life insurance benefits to those qualified participants. Life insurance is provided through a vendor and is fully funded by member contributions. The medical and prescription drug insurance is provided through two options; Self-Insured Preferred Provider Benefit Plan - primarily for non-medicare-eligible retirees and spouses or External Managed Care Organizations - primarily for Medicare-eligible retirees and spouses. The RHBT Medicare-eligible retired employees and their Medicare-eligible dependents receive medical and drug coverage from a Medicare Advantage Plan. Under this arrangement, the vendor assumes the financial risk of providing comprehensive medical and drug coverage with limited copayments. Non-Medicare retirees continue enrollment in PEIA's Preferred Provider Benefit or the Managed Care Option. The RHBT collects employer contributions for Managed Care Organization (MCO) participants and remits capitation payments to the MCO. Survivors of retirees have the option of purchasing the medical and prescription drug coverage. (Continued) 29
46 WEST VIRGINIA WATER DEVELOPMENT AUTHORITY NOTES TO FINANCIAL STATEMENTS June 30, 2018 Note 12. Other Postemployment Benefits (Continued) Eligible participants hired after June 30, 2010, will be required to fully fund premium contributions upon retirement. The Plan is a closed plan to new entrants. Contributions West Virginia Code section 5-16D-6 assigns to the PEIA Finance Board the authority to establish and amend contribution requirements of the plan members and the participating employers. Participating employers are required by statute to contribute at a rate assessed each year by the RHBT. The annual contractually required rate is the same for all participating employers. Employer contributions represent what the employer was billed during the respective year for their portion of the pay as you go premiums, commonly referred to as paygo, retiree leave conversion billings, and other matters, including billing adjustments. The annual contractually required per active policyholder per month rates for State nongeneral funded agencies and other participating employers effective June 30, 2018, 2017, and 2016, respectively, were: /1/17 6/30/17 7/1/17-12/31/17 Paygo Premium $ 177 $ 135 $ 196 $ 163 Contributions to the OPEB plan from the Authority were $17,523, $8,604, and $19,152 for the years ended June 30, 2018, 2017, and 2016, respectively. Members retired before July 1, 1997, pay retiree healthcare contributions at the highest sponsor subsidized rate, regardless of their actual years of service. Members retired between July 1, 1997 and June 30, 2010, pay a subsidized rate depending on the member's years of service. Members hired on or after July 1, 2010, pay retiree healthcare contributions with no sponsor provided implicit or explicit subsidy. Retiree leave conversion contributions from the employer depend on the retiree's date of hire and years of service at retirement as described below: Members hired before July 1, 1988, may convert accrued sick or leave days into 100% of the required retiree healthcare contribution. Members hired from July 1, 1988, to June 30, 2001, may convert accrued sick or leave days into 50% of the required retiree healthcare contribution. The conversion rate is two days of unused sick and annual leave days per month for single healthcare coverage and three days of unused sick and annual leave days per month for family healthcare coverage. Contributions by Nonemployer Contributing Entities in Special Funding Situations (Continued) 30
47 WEST VIRGINIA WATER DEVELOPMENT AUTHORITY NOTES TO FINANCIAL STATEMENTS June 30, 2018 Note 12. Other Postemployment Benefits (Continued) The State of West Virginia is a nonemployer contributing entity that provides funding through SB 419, effective July 1, 2012, amended by West Virginia Code The State provides a supplemental pre-funding source dedicating $30 million annually to the RHBT Fund from annual collections of the Personal Income Tax Fund and dedicated for payment of the unfunded liability of the RHBT. The $30 million transferred pursuant to this Code shall be transferred until the Governor certifies to the Legislature that an independent actuarial study has determined that the unfunded liability of RHBT has been provided for in its entirety or July 1, 2037, whichever date is later. This funding is to the advantage of all RHBT contributing employers. The State is a nonemployer contributing entity that provides funding through West Virginia State Code 11B The Financial Stability Fund is a plan to transfer an annual amount of $5 million to the RHBT from special revenue funds to be used to lower retiree premiums, to help reduce benefit cuts, to help reduce premium increases or any combination thereof. The $5 million transferred pursuant to this Code shall be transferred annually into the RHBT through June 30, This funding is to the advantage of all RHBT contributing employers. The State is a nonemployer contributing entity that provides funding through SB 469 which was passed February 10, 2012, granting OPEB liability relief to the 55 County Boards of Education effective July 1, The public school support plan (PSSP) is a basic foundation allowance program that provides funding to the local school boards for "any amount of the employer's annual required contribution allocated and billed to the county boards for employees who are employed as professional employees, employees who are employed as service personnel and employees who are employed as professional student support personnel", within the limits authorized by the State Code. This special funding under the school aid formula subsidizes employer contributions of the county boards of education. OPEB Liabilities, OPEB Expense, and Deferred Outflows of Resources and Deferred Inflows of Resources Related to OPEB At June 30, 2018, the Authority reported a liability for its proportionate share of the RHBT net OPEB liability that reflected a reduction for State OPEB support provided to the Authority. The amount recognized by the Authority as its proportionate share of the net OPEB liability, the related State support, and the total portion of the net OPEB liability that was associated with the Authority was as follows: Authority s proportionate share of the net OPEB liability $ 158,520 State s special funding proportionate share of the net OPEB liability associated with the Authority. 32,560 Total portion of net OPEB liability associated with the Authority $ 191,080 The net OPEB liability was measured as of June 30, 2017, and the total OPEB liability used to calculate the net OPEB liability was determined by an actuarial valuation as of June 30, The Authority s proportion of the net OPEB liability was based on its proportionate share of employer and nonemployer contributions to the OPEB Plan for the fiscal year ended on the measurement date. At June 30, 2017, the Authority s proportion was percent, which is a decrease of percent from its proportion measured as of June 30, (Continued) 31
48 WEST VIRGINIA WATER DEVELOPMENT AUTHORITY NOTES TO FINANCIAL STATEMENTS June 30, 2018 Note 12. Other Postemployment Benefits (Continued) For the year ended June 30, 2018, the Authority recognized OPEB expense of $9,191 and for support provided by the State under special funding situations revenue of $9,995. At June 30, 2018, the Authority reported deferred outflows of resources and deferred inflows of resources related to OPEB from the following sources: Deferred Outflows of Resources Deferred Inflows of Resources Differences between expected and actual experience $ - $ 531 Net difference between projected and actual earnings on OPEB plan investments - 2,530 Changes in proportion and differences between Authority s contributions and proportionate share of contributions - 57,708 Authority s contributions subsequent to the measurement date of June 30, ,523 - Total $ 17,523 $ 60,769 The amount of $17,523 reported as deferred outflows of resources related to OPEB resulting from Authority s contributions subsequent to the measurement date will be recognized as a reduction of the net OPEB liability in the year ended June 30, Other amounts reported as deferred outflows of resources and deferred inflows of resources related to OPEB will be recognized in OPEB expense as follows: Year ending June 30: 2019 ($16,314) 2020 (16,314) 2021 (16,314) 2022 (11,827) Actuarial assumptions The total OPEB liability was determined by an actuarial valuation as of June 30, 2016, rolled forward to June 30, 2017 using the following actuarial assumptions, applied to all periods included in the measurement, unless otherwise specified: Inflation 2.75% Salary increases Dependent upon pension system ranging from 3.00% to 6.50%, including inflation Investment rate of return 7.15%, net of OPEB plan investment expense, including inflation (Continued) 32
49 WEST VIRGINIA WATER DEVELOPMENT AUTHORITY NOTES TO FINANCIAL STATEMENTS June 30, 2018 Note 12. Other Postemployment Benefits (Continued) Healthcare cost trend rates Actuarial cost method Amortization method Actual trend used for fiscal year For fiscal years on and after 2018, trend starts at 8.50% and 9.75% for pre and post-medicare, respectively, and gradually decreases to an ultimate trend of 4.50%. Excess trend rate of 0.14% and 0.29% for pre and post- Medicare, respectively, is added to healthcare trend rates pertaining to per capita claims costs beginning in 2020 to account for the Excise Tax Entry Age Normal Cost Method Level percentage of payroll over a 21 year closed period Remaining amortization period 21 years closed as of June 30, 2016 Mortality rates were based on the RP-2000 Healthy Annuitant Mortality Table projected with Scale AA on a fully generational basis for PERS and Teachers Retirement System (TRS). RP-2000 Healthy Annuitant Mortality Table projected to 2025 with scale BB for West Virginia Death, Disability, and Retirement Fund (Troopers A) and West Virginia State Police Retirement System (Troopers B). Pre- Retirement: RP-2000 Non-Annuitant Mortality Table projected with Scale AA on a fully generational basis for PERS and TRS. RP-2000 Non-Annuitant Mortality Table projected to 2020 with Scale BB for Troopers A and B. The actuarial assumptions used in the June 30, 2016 valuation were based on the results of an actuarial experience study for the period July 1, June 30, The long-term expected rate of return of 7.15% on OPEB plan investments was determined by a combination of an expected long-term rate of return of 7.50% for long-term assets invested with the West Virginia Investment Management Board (WVIMB) and an expected short-term rate of return of 3.0% for assets invested with the WVBTI. Long-term pre-funding assets are invested with the WVIMB. The strategic asset allocation consists of 55% equity, 15% fixed income, 10% private equity, 10% hedge fund and 10% real estate invested. Short-term assets used to pay current year benefits and expenses are invested with the WVBTI. The long-term rate of return on OPEB plan investments were determined using a building block method in which estimates of expected future real rates of return (expected returns, net of OPEB plan investment expense and inflation) was developed for each major asset class. These ranges were combined to produce the long-term expected rate of return by weighting the expected future real rates of return by the target asset allocation percentages and by adding expected inflation. Best estimates of long-term geometric rates are summarized in the following table: (Continued) 33
50 WEST VIRGINIA WATER DEVELOPMENT AUTHORITY NOTES TO FINANCIAL STATEMENTS June 30, 2018 Note 12. Other Postemployment Benefits (Continued) Asset Class Long-Term Expected Real Rate of Return Discount rate Large Cap Domestic 17.0% Non-Large Cap Domestic 22.0% International Qualified 24.6% International Non-Qualified 24.3% International Equity 26.2% Short-Term Fixed 0.5% Total Return Fixed Income 6.7% Core Fixed Income 0.1% Hedge Fund 5.7% Private Equity 19.6% Real Estate 8.3% Opportunistic Income 4.8% Cash 0.0% The discount rate used to measure the total OPEB liability was 7.15%. The projection of cash flows used to determine the discount rate assumed that RHBT contributions would be made at rates equal to the actuarially determined contribution rates, in accordance with prefunding and investment policies. Future pre-funding assumptions include a $30 million annual contribution from the State through Based on those assumptions, and that the Plan is expected to be fully funded by fiscal year ended June 30, 2036, the OPEB plan's fiduciary net position was projected to be available to make all projected future benefit payments of current plan members. Therefore, the long-term expected rate of return on OPEB plan investments was applied to all periods of projected benefit payments to determine the total OPEB liability. Discount rates are subject to change between measurement dates. The discount rate used to measure the total OPEB liability at June 30, 2016 is a 0.45% increase from the June 30, 2015 valuation. Other key assumptions The projection assumes that the capped subsidy aggregate contribution limit of $150 million for 2017 would increase by $10 million per year on and after Additionally, the per member subsidy is projected to increase by at least 3.0% per year but no more than the healthcare trend inflation assumption such that the product of the projected subsidy and projected members is less than the projected aggregated capped costs; and the member's share of plan costs is expected remain stable as a percentage of total costs following the year that the program is fully funded. After 2035, the program is projected to be fully funded and the sponsor is assumed to contribute the residual portion of normal cost and operational expenses needed to maintain a funded ratio of 100% in future years. In addition, after 2035, the member's share of total plan costs is assumed to remain stable at approximately 61% of total plan costs. These assumptions produced per member annual capped subsidy increases of 3.0% per year from 2018 to 2023 and 4.5% per year after (Continued) 34
51 WEST VIRGINIA WATER DEVELOPMENT AUTHORITY NOTES TO FINANCIAL STATEMENTS June 30, 2018 Note 12. Other Postemployment Benefits (Continued) Members hired on or after July 1, 2010, are required to pay 100% of expected cost of coverage, resulting in no implicit or explicit employer cost. Consequently, these members are excluded from the actuarial valuation. Sensitivity of the Authority s proportionate share of the net OPEB liability to changes in the discount rate. The following presents the Authority s proportionate share of the net OPEB liability calculated using the current discount rate, as well as what the Authority s proportionate share of the net OPEB liability would be if it were calculated using a discount rate that is 1-percentage point lower or 1-percentagepoint higher than the current rate: 1% Decrease (6.15%) Current Discount Rate (7.15%) 1% Increase (8.15%) Authority s proportionate share of the net OPEB liability $ 184,578 $ 158,520 $ 136,858 Sensitivity of the Authority s proportionate share of net OPEB liability to changes in the healthcare cost trend rates. The following presents the Authority s proportionate share of the net OPEB liability, as well as what the Authority s proportionate share of the net OPEB liability would be if it were calculated using healthcare cost trend rates that are 1-percentage-point lower or 1-percentage point higher than the current rates: 1% Decrease Current Healthcare Cost Trend Rates 1% Increase Authority s proportionate share of the net OPEB liability $ 133,159 $ 158,520 $ 189,538 35
52 WEST VIRGINIA WATER DEVELOPMENT AUTHORITY NOTES TO FINANCIAL STATEMENTS June 30, 2018 Note 13. General and Administrative Expenses General and administrative expenses for the year ended June 30, 2018, are as follows: Personal services $ 557,898 Legal 62,579 Professional 219,720 Trustee 36,006 Employee benefits 62,247 Public employees insurance 60,288 Unemployment Compensation 7,632 Office supplies/printing 54,462 Advertising 5,375 Repairs and maintenance 47,647 Travel 7,051 Utilities 32,425 Telecommunications 31,242 Payroll taxes 14,486 Computer supplies/services 154,287 Janitorial 25,296 Miscellaneous 1,638 Rental 6,517 Administrative 2,790 Insurance 6,877 Training and development 2,379 $ 1,398,842 Note 14. Risk Management The Authority is exposed to various risks of loss related to torts; theft of, damage to, and destruction of assets; errors and omissions; injuries to and illnesses of employees; and natural disasters. The Authority has obtained coverage for job-related injuries of employees and health coverage for its employees from a commercial insurance provider and the WVPEIA, respectively. In exchange for the payment of premiums to the commercial insurance provider and WVPEIA, the Authority has transferred its risk related to job-related injuries and health coverage for employees. The Authority participates in the West Virginia Board of Risk and Insurance Management to obtain coverage for general liability, property damage, business interruption, errors and omissions, and natural disasters. Coverage is offered in exchange for an annual premium. There were no changes in coverage or claims in excess of coverage for the year ended June 30,
53 WEST VIRGINIA WATER DEVELOPMENT AUTHORITY NOTES TO FINANCIAL STATEMENTS June 30, 2018 Note 15. New Accounting Pronouncements The Governmental Accounting Standards Board (GASB) has issued the following Statements which are not yet effective. The GASB issued Statement No. 83, Certain Asset Retirement Obligations in November This Statement establishes criteria for determining the timing and pattern of recognition of a liability and a corresponding deferred outflow of resources for asset retirement obligations. The requirements of this Statement are effective for periods beginning after June 15, The GASB issued Statement No. 84, Fiduciary Activities in January This Statement establishes standards of accounting and financial reporting for fiduciary activities. The requirements of this Statement are effective for periods beginning after December 15, The GASB issued Statement No. 87, Leases in June This Statement establishes standards of accounting and financial reporting for leases by lessees and lessors. The requirements of this Statement are effective for periods beginning after December 15, Management has not determined the effects these new GASB Statements may have on prospective financial statements. Note 16. Uncertainty The Authority has cooperated with a State of West Virginia legislative oversight commission request for information related to certain administrative expenses for the period July 1, 2011 to March 17, No information regarding the status of this matter has been communicated to management. Consequently, management cannot determine the effect, if any, of this inquiry on the Authority s financial position. Although an amount cannot presently be estimated, due to the uncertainty with regard to this matter, it is at least reasonably possible that an effect on the Authority s financial position could occur in the near term. Note 17. Segment Information The presentation of segment information for the Authority, which follows, and conforms with GAAP is comprised of the following segments: Loan Program I includes Series 2012 A-I and 2012 B-I Water Development Revenue Refunding Bonds. Loan Program II includes Series 2016 A-II Water Development Revenue Refunding Bonds, 2012 A- II, 2012 B-II, and 2013 A-II Water Development Revenue Refunding Bonds. Loan Program III includes Series 2012 A-III and 2012 B-III Water Development Revenue Refunding Bonds. Loan Program IV includes Series 2018 A-IV and 2018 B-IV Water Development Revenue Bonds. (Continued) 37
54 WEST VIRGINIA WATER DEVELOPMENT AUTHORITY NOTES TO FINANCIAL STATEMENTS June 30, 2018 Note 17. Segement Information (Continued) ASSETS Loan Program I Loan Program II Loan Program III Current - unrestricted $ 3,470,533 $ 8,219,930 $ 684,722 Noncurrent - unrestricted Restricted - current and noncurrent 14,916, ,747,210 24,472,896 Capital assets, net Total assets $ 18,386,615 $ 111,967,140 $ 25,157,618 DEFERRED OUTFLOWS OF RESOURCES Deferred outflows of resources related to pension and OPEB $ - $ - $ - Deferred loss on bond refundings 2,101,203 5,544, ,122 Total deferred outflows $ 2,101,203 $ 5,544,729 $ 328,122 LIABILITIES Current $ 1,903,879 $ 6,161,835 $ 1,117,213 Long-term 12,585,471 95,597,757 22,465,360 Total liabilities $ 14,489,350 $ 101,759,592 $ 23,582,573 DEFERRED INFLOWS Deferred inflows of resources related to pension and OPEB $ - $ - $ - Deferred gain on refunding $ - $ - $ - NET POSITION Restricted $ 4,431,814 $ 13,694,182 $ 2,335,658 Unrestricted 1,566,654 2,058,095 (432,491) Investment in capital assets Total net position $ 5,998,468 $ 15,752,277 $ 1,903,167 OPERATING REVENUE Charges for services and miscellaneous revenue $ 1,263,117 $ 6,568,164 $ 1,478,320 OPERATING EXPENSES Depreciation and amortization $ - $ - $ - General and administrative Bond issuance cost Allocation of general and administrative 643,925 4,434,971 1,027,845 OPERATING INCOME $ 619,192 $ 2,133,193 $ 450,475 NONOPERATING REVENUES (EXPENSES): Interest and investment revenue $ 20,774 $ 104,329 $ 37,098 Interest expense (598,586) (3,848,962) (816,763) Transfers (net) 169,255 3,084,566 (1,724,498) Change in net position 210,635 1,473,126 (2,053,688) Beginning net position 5,787,833 14,279,151 3,956,855 Ending net position $ 5,998,468 $ 15,752,277 $ 1,903,167 Net cash provided by (used in): Operating activites $ 2,100,862 $ 9,105,333 $ (782,056) Capital and related financing activities Noncapital financing activities (2,109,775) (9,173,476) (1,498,406) Investing activities 23, ,280 36,418 Beginning cash and cash equivalents 1,143,173 6,473,760 5,080,082 Ending cash and cash equivalents $ 1,157,892 $ 6,520,897 $ 2,836,038 (Continued) 38
55 WEST VIRGINIA WATER DEVELOPMENT AUTHORITY NOTES TO FINANCIAL STATEMENTS June 30, 2018 Note 17. Segement Information (Continued) ASSETS Loan Program IV Supplemental Total Current - unrestricted $ 25,871 $ 27,499,785 $ 39,900,841 Noncurrent - unrestricted - 10,405,119 10,405,119 Restricted - current and noncurrent 40,601,692 4,241, ,979,790 Capital assets - net - 4,559,902 4,559,902 Total assets $ 40,627,563 $ 46,706,716 $ 242,845,652 DEFERRED OUTFLOWS OF RESOURCES Deferred outflows of resources related to pension and OPEB $ - $ 94,697 $ 94,697 Deferred loss on bond refundings - - 7,974,054 Total deferred outflows $ - $ 94,697 $ 8,068,751 LIABILITIES Current $ 1,903,721 $ 10,143 $ 11,096,791 Long-term 40,386, , ,407,755 Total liabilities $ 42,290,084 $ 382,947 $ 182,504,546 DEFERRED INFLOWS Deferred inflows of resources related to pension and OPEB $ - $ 152,257 $ 152,257 Deferred gain on refunding 596, ,143 $ 596,143 $ 152,257 $ 748,400 NET POSITION Restricted $ (380,814) $ 3,811,546 $ 23,892,386 Unrestricted (1,877,850) 37,894,761 39,209,169 Investment in capital assets - 4,559,902 4,559,902 Total net position $ (2,258,664) $ 46,266,209 $ 67,661,457 OPERATING REVENUE Charges for services and miscellaneous revenue $ 2,130,822 $ 594,042 $ 12,034,465 OPERATING EXPENSES Depreciation and amortization $ 6,752 $ 990,791 $ 997,543 General and administrative - 1,398,842 1,398,842 Bond issuance cost 416, ,841 Allocation of general and administrative 1,854,278 (7,961,019) - OPERATING INCOME $ (147,049) $ 6,165,428 $ 9,221,239 NONOPERATING REVENUES (EXPENSES): Interest and investment revenue $ 6,484 $ 421,765 $ 590,450 Interest expense (1,970,883) - (7,235,194) Transfers (net) 294,619 (1,823,942) - Change in net position (1,816,829) 4,763,251 2,576,495 Beginning net position (441,835) 41,502,958 65,084,962 Ending net position $ (2,258,664) $ 46,266,209 $ 67,661,457 Net cash provided by (used in): Operating activites $ 1,742,326 $ 5,994,164 $ 18,160,629 Capital and related financing activities - (139,269) (139,269) Noncapital financing activities (1,746,544) - (14,528,201) Investing activities 6, , ,217 Beginning cash and cash equivalents 54,592 21,952,955 34,704,562 Ending cash and cash equivalents $ 57,018 $ 28,168,093 $ 38,739,938 39
56 REQUIRED SUPPLEMENTARY INFORMATION
57 THE WEST VIRGINIA WATER DEVELOPMENT AUTHORITY SCHEDULE OF THE PROPORTIONATE SHARE OF THE NET PENSION LIABILITY Public Employees Retirement System Plan Year Ended June 30, Authority's proportion (percentage) of the net pension liability % % % % Authority's proportionate share of the net pension liability $ 164,270 $ 364,905 $ 241,080 $ 151,290 Authority's covered payroll $ 530,764 $ 553,481 $ 587,420 $ 507,753 Authority's proportionate share of the net pension liability as a percentage of its covered payroll % % % % Plan fiduciary net position as a percentage of the total pension liability 93.67% 86.11% 91.29% 93.98% Note: All amounts presented are as of the measurement date, which is one year prior to the fiscal year end date. See Independent Auditor's Report and accompanying Notes to Required Supplementary Information. 40
58 THE WEST VIRGINIA WATER DEVELOPMENT AUTHORITY SCHEDULE OF CONTRIBUTIONS TO THE PERS Year Ended June 30, Statutorily required contribution $ 57,366 $ 63,388 $ 74,720 $ 81,986 $ 72,599 $ 62,525 Contributions in relation to the statutorily required contribution $ (57,366) $ (63,388) $ (74,720) $ (81,986) $ (72,599) $ (62,525) Contribution deficiency (excess) $ - $ - $ - $ - $ - $ - Authority's covered payroll $ 530,152 $ 530,764 $ 553,481 $ 587,420 $ 507,753 $ 463,946 Contributions as a percentage of covered payroll 11.00% 12.00% 13.50% 14.00% 14.30% 13.48% See Independent Auditor's Report and accompanying Notes to Required Supplementary Information. 41
59 THE WEST VIRGINIA WATER DEVELOPMENT AUTHORITY SCHEDULE OF THE PROPORTIONATE SHARE OF THE NET OPEB LIABILITY Public Employees Retirement Insurance Plan Year Ended June 30, 2018 Authority's proportion (percentage) of the net OPEB liability % Authority's proportionate share of the net OPEB liability $ 158,520 State's proportionate share of the net OPEB liability associated with the Authority 32,560 Total proportionate share of the net OPEB liability associated with the Authority $ 191,080 Authority's covered payroll $ 214,103 Authority's proportionate share of the net OPEB liability as a percentage of its covered payroll % Plan fiduciary net position as a percentage of the total OPEB liability 25.10% Note: All amounts presented are as of the measurement date, which is one year prior to the fiscal year end date. See Independent Auditor's Report and accompanying Notes to Required Supplementary Information. 42
60 THE WEST VIRGINIA WATER DEVELOPMENT AUTHORITY SCHEDULE OF CONTRIBUTIONS TO OPEB Year Ended June 30, Statutorily required contribution $ 17,523 $ 8,604 $ 19,152 Contributions in relation to the statutorily required contribution $ (17,523) $ (8,604) $ (19,152) Contribution deficiency (excess) $ - $ - $ - Authority's covered payroll $ 111,957 $ 214,103 $ 247,855 Contributions as a percentage of covered payroll 15.65% 4.02% 7.73% See Independent Auditor's Report and accompanying Notes to Required Supplementary Information. 43
61 WEST VIRGINIA WATER DEVELOPMENT AUTHORITY NOTES TO REQUIRED SUPPLEMENTARY INFORMATION Note 1. Trend Information Presented The accompanying schedules of the Authority s proportionate share of the net pension liability and contributions to PERS are required supplementary information to be presented for 10 years. However, until a full 10 year trend is compiled, information is presented in the schedules for those years for which information is available. Note 2. OPEB Changes in Assumptions Below are changes in the assumptions between the 2016 and 2015 valuations: Certain economic and behavioral assumptions are unique to healthcare benefits. These assumptions include the healthcare trend, per capita claims costs, the likelihood that a member selects healthcare coverage and the likelihood that a retiree selects one-person, two person or family coverage. These assumptions were updated based on a recent experience study performed by the RHBT actuaries using five-year experience data through June 30, The updated per capita claims costs were also based on recent claims, enrollment and premium information as of the valuation date. For the June 30, 2016 valuation, the retiree healthcare participation assumption for each retirement plan is slightly higher than the previous assumption used in the June 30, 2015 OPEB valuation. More members who were covered as actives will be assumed to participate as retirees. The 2016 and 2015 valuations include consideration of the $30 million annual appropriations under Senate Bill 419, through July 1, 2037, or if earlier, the year the benefit obligation is fully funded. Additionally, the presentation of covered payroll was changed for the June 30, 2015, actuarial valuation. Participating employees hired before July 1, 2010, pay retiree premiums that are subsidized based on years of service at retirement. Participating employees hired on or after July 1, 2010, are required to fully fund premium contributions upon retirement. Consequently, beginning June 30, 2015, actuarial valuation covered payroll represents only the payroll for those OPEB eligible participating employees that were hired before July 1, 2010, allowing a better representation of the UAAL as a percentage of covered payroll, whereas, for the prior years, covered payroll is in total for all participating employees. Note 3. Pension Plan Amendments The PERS was amended to make changes which apply to new employees hired July 1, 2015 and later as follows: For employees hired prior to July 1, 2015, qualification for normal retirement is age 60 with five years of service or at least age 55 with age and service equal to 80 or greater. A member may retire with the pension reduced actuarially if the member is at least age 55 and has at least 10 years of contributory service, or at any age with 30 years of contributory service. For employees hired July 1, 2015 and later, qualification for normal retirement is 62 with 10 years of service. A member hired after July 1, 2015 may retire with the pension reduced actuarially if the member is between ages 60 and 62 with at least ten years of contributory service, between ages 57 and 62 with at least twenty years of contributory service, or between ages 55 and 62 with at least thirty years of contributory service. (Continued) 44
62 WEST VIRGINIA WATER DEVELOPMENT AUTHORITY NOTES TO REQUIRED SUPPLEMENTARY INFORMATION Note 3. Pension Plan Amendments The straight life annuity retirement benefit is equivalent to 2% of average salary multiplied by years of service. For employees hired prior to July 1, 2015, average salary is the average of the three consecutive highest annual earnings out of the last fifteen years of earnings. For all employees hired July 1, 2015 and later average salary is the average of the five consecutive highest annual earnings out of the last fifteen years of earnings. For employees hired prior to July 1, 2015, terminated members with at least five years of contributory service who do not withdraw their accumulated contributions may elect to receive their retirement annuity beginning at age 62. For all employees hired July 1, 2015 and later, this age increases to 64 with at least ten years of contributory service, or age 63 with at least twenty years of contributory service. For all employees hired prior to July 1, 2015, employees are required to contribute 4.5% of annual earnings. All employees hired July 1, 2015 and later, are required to contribute 6% of annual earnings. Note 4. Pension Plan Assumptions An experience study, which was based on the years 2009 through 2014, was completed prior to the 2015 actuarial valuation. As a result, several assumptions were changed for the actuarial valuations as follows: Projected salary increases: State % % Nonstate % % Inflation rate 3.0% (2016); 1.9% (2015) 2.2% Mortality rates Active-RP Non-Annuitant Healthy males 1983 GAM tables, Scale AA fully generational Healthy females 1971 GAM Healthy males - 110% of RP- Disabled males 1971 GAM 2000 Non-Annuitant, Scale AA Disabled females - Revenue fully generational ruling Non-Annuitant, Scale AA Healthy females - 101% of RP Non-Annuitant, Scale AA fully generational Disabled males 96% of RP-2000 Disabled Annuitant, Scale AA fully generational Disabled females -107% of RP-2000 Disabled Annuitant, Scale AA fully generational Withdrawal rates State % 1-26% Non-state % % Disability rates % 0 -.8% 45
63 INDEPENDENT AUDITOR S REPORT ON INTERNAL CONTROL OVER FINANCIAL REPORTING AND ON COMPLIANCE AND OTHER MATTERS BASED ON AN AUDIT OF FINANCIAL STATEMENTS PERFORMED IN ACCORDANCE WITH GOVERNMENT AUDITING STANDARDS To the Board of Directors West Virginia Water Development Authority Charleston, West Virginia We have audited in accordance with the auditing standards generally accepted in the United States of America and the standards applicable to financial audits contained in Government Auditing Standards issued by the Comptroller General of the United States, the financial statements of the West Virginia Water Development Authority (the Authority), as of and for the year ended June 30, 2018, and the related notes to the financial statements which collectively comprise the Authority s basic financial statements, and have issued our report thereon dated October 9, Internal Control over Financial Reporting In planning and performing our audit of the financial statements, we considered the Authority s internal control over financial reporting (internal control) to determine the audit procedures that are appropriate in the circumstances for the purpose of expressing our opinion on the financial statements, but not for the purpose of expressing an opinion on the effectiveness of the Authority s internal control. Accordingly, we do not express an opinion on the effectiveness of the Authority s internal control. A deficiency in internal control exists when the design or operation of a control does not allow management or employees, in the normal course of performing their assigned functions, to prevent, or detect and correct misstatements on a timely basis. A material weakness is a deficiency, or a combination of deficiencies, in internal control such that there is a reasonable possibility that a material misstatement of the Authority s financial statements will not be prevented, or detected and corrected on a timely basis. A significant deficiency is a deficiency, or a combination of deficiencies, in internal control that is less severe than a material weakness, yet important enough to merit attention by those charged with governance. Our consideration of internal control was for the limited purpose described in the first paragraph of this section and was not designed to identify all deficiencies in internal control that might be material weaknesses or significant deficiencies. Given these limitations, during our audit we did not identify any deficiencies in internal control that we consider to be material weaknesses. However, material weaknesses may exist that have not been identified. Your Success is Our Focus 300 Chase Tower, 707 Virginia Street, East Charleston, WV Fax:
64 Compliance and Other Matters As part of obtaining reasonable assurance about whether the Authority s financial statements are free from material misstatement, we performed tests of its compliance with certain provisions of laws, regulations, contracts, and grant agreements, noncompliance with which could have a direct and material effect on the determination of financial statement amounts. However, providing an opinion on compliance with those provisions was not an objective of our audit, and accordingly, we do not express such an opinion. The results of our tests disclosed no instances of noncompliance or other matters that are required to be reported under Government Auditing Standards. Purpose of this Report The purpose of this report is solely to describe the scope of our testing of internal control and compliance and the results of that testing, and not to provide an opinion on the effectiveness of the entity s internal control or on compliance. This report is an integral part of an audit performed in accordance with Government Auditing Standards in considering the entity s internal control and compliance. Accordingly, this communication is not suitable for any other purpose. CERTIFIED PUBLIC ACCOUNTANTS Charleston, West Virginia October 9,


65
66 WEST VIRGINIA DRINKING WATER TREATMENT REVOLVING FUND FINANCIAL REPORT Year Ended June 30, 2018
67 CONTENTS INDEPENDENT AUDITOR S REPORT...1 MANAGEMENT S DISCUSSION AND ANALYSIS (UNAUDITED)...4 FINANCIAL STATEMENTS Statement of Net Position...9 Statement of Revenues, Expenses, and Changes in Fund Net Position...10 Statement of Cash Flows...11 Notes to Financial Statements...12 ACCOMPANYING INFORMATION Schedules of Administrative Fees Activity...20 Schedule of Expenditures of Federal Awards...21 INDEPENDENT AUDITOR S REPORT ON INTERNAL CONTROL OVER FINANCIAL REPORTING AND ON COMPLIANCE AND OTHER MATTERS BASED ON AN AUDIT OF FINANCIAL STATEMENTS PERFORMED IN ACCORDANCE WITH GOVERNMENT AUDITING STANDARDS INDEPENDENT AUDITOR S REPORT ON COMPLIANCE FOR EACH MAJOR FEDERAL PROGRAM AND ON INTERNAL CONTROL OVER COMPLIANCE REQUIRED BY THE UNIFORM GUIDANCE SCHEDULE OF FINDINGS AND QUESTIONED COSTS...26 Page
68 INDEPENDENT AUDITOR S REPORT To the West Virginia Bureau for Public Health and the West Virginia Water Development Authority Charleston, West Virginia Report on the Financial Statements We have audited the accompanying financial statements of the West Virginia Drinking Water Treatment Revolving Fund (the Fund), as of and for the year ended June 30, 2018, and the related notes to the financial statements, which collectively comprise the Fund s basic financial statements as listed in the table of contents. Management s Responsibility for the Financial Statements Management is responsible for the preparation and fair presentation of these financial statements in accordance with accounting principles generally accepted in the United States of America; this includes the design, implementation, and maintenance of internal control relevant to the preparation and fair presentation of financial statements that are free from material misstatement, whether due to fraud or error. Auditor s Responsibility Our responsibility is to express an opinion on these financial statements based on our audit. We conducted our audit in accordance with auditing standards generally accepted in the United States of America and the standards applicable to financial audits contained in Government Auditing Standards, issued by the Comptroller General of the United States. Those standards require that we plan and perform the audit to obtain reasonable assurance about whether the financial statements are free from material misstatement. An audit involves performing procedures to obtain audit evidence about the amounts and disclosures in the financial statements. The procedures selected depend on the auditor s judgment, including the assessment of the risks of material misstatement of the financial statements, whether due to fraud or error. In making those risk assessments, the auditor considers internal control relevant to the entity s preparation and fair presentation of the financial statements in order to design audit procedures that are appropriate in the circumstances, but not for the purpose of expressing an opinion on the effectiveness of the entity s internal control. Accordingly, we express no such opinion. An audit also includes evaluating the appropriateness of accounting policies used and the reasonableness of significant accounting estimates made by management, as well as evaluating the overall presentation of the financial statements. We believe that the audit evidence we have obtained is sufficient and appropriate to provide a basis for our audit opinion. Your Success is Our Focus 300 Chase Tower, 707 Virginia Street, East Charleston, WV Fax:
69 Opinion In our opinion, the financial statements referred to above present fairly, in all material respects, the financial position of the West Virginia Drinking Water Treatment Revolving Fund, as of June 30, 2018, and the changes in financial position, and cash flows for the year then ended in accordance with accounting principles generally accepted in the United States of America. Emphasis of Matter As discussed in Note 2, the financial statements present only the West Virginia Drinking Water Treatment Revolving Fund and do not purport to, and do not present fairly the financial position of the State of West Virginia as of June 30, 2018, the changes in financial position, or, where applicable, cash flows for the year then ended in accordance with accounting principles generally accepted in the United States of America. Our opinion is not modified with respect to this matter. Other Matters Required Supplementary Information Accounting principles generally accepted in the United States of America require that the management s discussion and analysis on pages 4 through 8 be presented to supplement the basic financial statements. Such information, although not a part of the basic financial statements, is required by the Governmental Accounting Standards Board, who considers it to be an essential part of financial reporting for placing the basic financial statements in an appropriate operational, economic, or historical context. We have applied certain limited procedures to the required supplementary information in accordance with auditing standards generally accepted in the United States of America, which consisted of inquiries of management about the methods of preparing the information and comparing the information for consistency with management s responses to our inquiries, the basic financial statements, and other knowledge we obtained during our audit of the basic financial statements. We do not express an opinion or provide any assurance on the information because the limited procedures do not provide us with sufficient evidence to express an opinion or provide any assurance. Other Information Our audit was conducted for the purpose of forming an opinion on the financial statements that comprise the Fund s basic financial statements. The accompanying information on page 20 is presented for purposes of additional analysis and is not a required part of the basic financial statements. The schedule of expenditures of federal awards on page 21 is presented for purposes of additional analysis as required by Title 2 U.S. Code of Federal Regulations (CFR) Part 200, Uniform Administrative Requirements, Cost Principles, and Audit Requirements for Federal Awards, and is also not a required part of the basic financial statements. The accompanying information and the schedule of expenditures of federal awards are the responsibility of management and were derived from and relate directly to the underlying accounting and other records used to prepare the basic financial statements. Such information has been subjected to the auditing procedures applied in the audit of the basic financial statements and certain additional procedures, including comparing and reconciling such information directly to the underlying accounting and other records used to prepare the basic financial statements or to the basic financial statements themselves, and other additional procedures in accordance with auditing standards generally accepted in the United States of America. In our opinion, the accompanying information and the schedule of expenditures of federal awards are fairly stated in all material respects in relation to the basic financial statements as a whole. 2
70 Other Reporting Required by Government Auditing Standards In accordance with Government Auditing Standards, we have also issued our report dated October 10, 2018, on our consideration of the Fund s internal control over financial reporting and on our tests of its compliance with certain provisions of laws, regulations, contracts, and grant agreements and other matters. The purpose of that report is to describe the scope of our testing of internal control over financial reporting and compliance and the results of that testing, and not to provide an opinion on internal control over financial reporting or on compliance. That report is an integral part of an audit performed in accordance with Government Auditing Standards in considering the Fund s internal control over financial reporting and compliance. CERTIFIED PUBLIC ACCOUNTANTS Charleston, West Virginia October 10,
71 WEST VIRGINIA DRINKING WATER TREATMENT REVOLVING FUND MANAGEMENT S DISCUSSION AND ANALYSIS (Unaudited) INTRODUCTION Our discussion and analysis of the West Virginia Drinking Water Treatment Revolving Fund s (the Fund ) financial performance provides an overview of the Fund s financial activities for the fiscal year ended June 30, Please read it in conjunction with the Fund s financial statements, which begin on page 9. FINANCIAL HIGHLIGHTS Under the former American Recovery and Reinvestment Act (ARRA), the Drinking Water Treatment Revolving Fund was awarded $19.5 million, of which $19.25 million was to be distributed through the drinking water revolving loan program. Under the ARRA program at least 50% of the $19,250,000 was required to be provided in the form of principal forgiveness loans (an approved loan type whereby the loan recipient is not required to repay the loan). The Fund closed fourteen (14) projects receiving ARRA funding over the life of the program. $18.95 million of the $19.25 million was provided in the form of principal forgiveness loans. The ARRA principal forgiveness loans are written off quarterly according to their respective debt service schedules. A total of $13.2 million in ARRA principal forgiveness loans have been written off against the existing allowance for principal forgiveness since the inception of the program. The United States Environmental Protection Agency (the EPA ) authorized the Fund to issue principal forgiveness loans. These loans, which are issued to certain local government agencies or other eligible water providers will be forgiven on the 30th day of June in the fiscal year coinciding with the disbursement or on the last day of the month in which the last disbursement is made. These loans are deemed no longer outstanding after the last loan disbursement is forgiven. Therefore, it is the Fund s policy to maintain an allowance for principal forgiveness loans, equal to the amount of the disbursement, until the last disbursement is made. Consistent with the prior year, a large operating expense, loss on forgivable loans, was incurred due to the provisions of the EPA principal forgiveness loans. Total principal forgiveness loans disbursed during the fiscal year totaled $654 thousand. The Fund s change in net position, therefore, consists of total revenues, less operating expenses and capital grants and contributions. The Fund s assets increased by $4,963,555 or about 3%. This is largely due to an increase in the investment of funds available for projects. The Fund s liabilities increased $28,853. This is largely the result of an increase in legal fees related to project review. The Fund s net position increased by $4,934,702 or approximately 3%. The Fund s revenues increased by $282,006 or approximately 18%. This is primarily due to an increase in administrative fees of $48,421, as well as an increase in investment earnings and interest on loans of $177,776 and $55,809 respectively. Capital grant and contribution awards from the EPA and the State of West Virginia (the State ) continue to provide the necessary resources to the Fund to carry out its mission. Federal and state awards for the Fund are described in footnote 5 in the accompanying financial statements. Capital grants and contributions received from the EPA and the State decreased by $3,774,306 from the prior year. Nine (9) new loans were closed during the current year. Also, there are eleven (11) additional loans that are still under construction that were closed in prior years, eight (8) of which are substantially complete but still have a remaining loan balance. (Continued) 4
72 WEST VIRGINIA DRINKING WATER TREATMENT REVOLVING FUND MANAGEMENT S DISCUSSION AND ANALYSIS (Unaudited) USING THIS REPORT This report consists of a series of financial statements. The Statement of Net Position and the Statement of Revenues, Expenses, and Changes in Fund Net Position report the Fund s net position and changes in them. The Fund s net position, which is the difference between assets and liabilities, is one way to measure the Fund s financial health or financial position. Over time, increases or decreases in the Fund s net position is one indicator of whether its financial health is improving or deteriorating. THE FUND AS A WHOLE Assets of the Fund increased $4,963,555 or about 3%. The Fund has $37,651 in liabilities as of the current fiscal year and $8,798 in liabilities in the prior fiscal year ended June 30. The increase in assets approximates the increase in the Fund s net position. Our analysis that follows focuses on the net position (Table 1) and changes in net position (Table 2) of the Fund s activities. Table 1 Statement of Net Position Assets Current Assets $ 36,903,367 $ 31,105,443 Loans Receivable, less current maturities, net 131,283, ,117,380 Total assets $ 168,186,378 $ 163,222,823 Liabilities Current Liabilities $ 37,651 $ 8,798 Net position Restricted $ 168,148,727 $ 163,214,025 (Continued) 5
73 WEST VIRGINIA DRINKING WATER TREATMENT REVOLVING FUND MANAGEMENT S DISCUSSION AND ANALYSIS (Unaudited) THE FUND AS A WHOLE (Continued) Table 2 Statement of Revenues, Expenses, and Changes in Fund Position Revenues: Operating revenues: Administrative fees $ 709,399 $ 660,978 Interest on loans 754, ,254 Total operating revenues 1,463,462 1,359,232 Investment earnings 373, ,369 Total revenues 1,836,607 1,554,601 Operating expenses (738,999) (759,673) Income (loss) before capital grants and contributions 1,097, ,928 Capital grants and contributions 3,837,094 7,611,400 Increase in net position $ 4,934,702 $ 8,406,328 Most of the increase in the Fund s assets and net position is attributable to both the capital grants and contributions received in the current year from the EPA in the amount of $2,188,894 and the State match through the West Virginia Infrastructure and Jobs Development Council in the amount of $1,648,200 totaling $3,837,094. Of the $2,188,894 received from the EPA in the current year, $171,358 was disbursed with an agreed 100% loan forgiveness feature. 100% of the EPA amount was for eligible costs reviewed and approved by the Fund and was disbursed as loans to local governmental agencies to assist in drinking water infrastructure projects and is included on the balance sheet in Loans Receivable. Of the $1,648,200 received from the State during the current year in matching funds, $660,944 was disbursed during the year. In addition, $1,913,524 in cumulative investment earnings on current and previous State match amounts have been committed to drinking water infrastructure projects but have not yet been expended. These moneys are invested with the West Virginia Board of Treasury Investments and are included on the balance sheet as Cash Equivalents. The Fund s liabilities are attributable to the last two quarter s of administrative expenses that were payable at the end of the fiscal year. Capital grant income from the EPA is recognized after the Fund has reviewed and approved supporting invoices for disbursements of loan proceeds to local governmental agencies and the federal portion of those disbursements has been received by the Fund. Capital grant income from the EPA decreased $3,760,106 from the prior year. The sources of funding for loans to local governmental agencies, besides the capital grant income from the EPA, and the State match, include revolving loan repayments, and investment earnings, both of which have increased $788,880 from prior year. Nine (9) loans closed during the current year, totaling $17,678,449. One (1) loan closed in the second quarter, and eight (8) closed in the fourth quarter. (Continued) 6
74 WEST VIRGINIA DRINKING WATER TREATMENT REVOLVING FUND MANAGEMENT S DISCUSSION AND ANALYSIS (Unaudited) THE FUND AS A WHOLE (Continued) Total revenues, including operating revenues and investment earnings totaled $1,836,607. This was an increase of $282,006 from prior year. This was attributed to an increase in administrative fees of $48,421 over the prior year, an increase in investment earnings of $177,776, and an increase in interest on loans of $55,809. The nine loans that closed in the current year totaled $17,678,449. The amounts disbursed for these loans totaled $920,545 of which $54,398 represented federal funds, $16,426 represented state match, and $849,721 represented proceeds from loan repayment. The amount disbursed during the current year for loans closed in prior years totaled $6,197,745 of which $2,134,496 represented federal funds with $171,358 of those funds having principal forgiveness features, $644,518 represented State match with $51,742 of those funds having principal forgiveness features, and $3,418,731 represented proceeds from loan repayments with $430,874 having principal forgiveness features. The sum of all disbursements for the years ended June 30, 2018 and 2017 was $7,118,290 and $16,264,179, respectively. COMMITMENTS AND PENDING APPLICATION FOR EPA GRANT As of June 30, 2018, the Fund had outstanding binding commitments to loan to qualified recipients of $633,704 and a $3,269,574 grant awarded by the EPA but not yet disbursed for approved drinking water infrastructure projects. Funding for approved projects will come from resources currently available to the Fund such as loan repayments as well as federal capital grants and State matches to be paid to the Fund in future periods. As of the year ended June 30, 2018 the Fund has $26,775,073 in cash equivalents available for these projects. Additionally, the Fund has $380,520 of cash equivalents from user fees obtained from a State Settlement with the West Virginia American Water Company in These funds will be used for future drinking water infrastructure projects. The West Virginia Bureau for Public Health submitted an application to the EPA for a grant for the Fund for the fiscal year 2019 grant period. The application was approved in August 2018, and resulted in an award from the EPA of $11,107,000. The $2,221,400 State match has been committed to the Fund in order to secure the federal funds. The total of $13,328,400, awarded to the Fund, will be used to provide no-interest or lowinterest traditional or principal forgiveness featured loans to assist in financing approved drinking water infrastructure projects. The 2018 EPA Capitalization Grant awarded for fiscal year 2019 contained a provision which requires that not less than twenty (20) percent be provided to eligible water system loan recipients in the form of grants, negative interest, or principal forgiveness. Furthermore, in a state in which such an emergency declaration has been issued, the recipient may use more than twenty (20) percent of the funds made available for capitalization grants to provide additional subsidy to eligible recipients. The principal forgiveness will be provided to the loan recipients as a separate loan agreement. The principal forgiveness requirement is expected to remain a grant condition in the near future. While this provision will not directly enhance the Fund, the plan is that it will assist in meeting the Fund s goal of providing safe drinking water infrastructure to West Virginia residents. (Continued) 7
75 WEST VIRGINIA DRINKING WATER TREATMENT REVOLVING FUND MANAGEMENT S DISCUSSION AND ANALYSIS (Unaudited) CONTACTING THE FUND S MANAGEMENT This financial report is designed to provide a general overview of the Fund s finances and to show the Fund s accountability for the money it receives. The Fund is administered by the West Virginia Water Development Authority on behalf of the West Virginia Bureau for Public Health. If you have questions about this report or need additional information, contact the Executive Director or the Chief Financial Officer of the West Virginia Water Development Authority, 1009 Bullitt Street, Charleston, West Virginia 25301; call or visit the Authority s website ( 8
76 WEST VIRGINIA DRINKING WATER TREATMENT REVOLVING FUND STATEMENT OF NET POSITION June 30, 2018 ASSETS CURRENT ASSETS Cash and cash equivalents (Note 3) $ 27,155,593 Administrative fees receivable 60,878 Accrued interest receivable 70,167 Current maturities of loans receivable (Note 4) 9,616,729 Total current assets 36,903,367 LOANS RECEIVABLE, less current maturities (net of principal forgiveness of $7,753,848) (Note 4) 131,283,011 Total assets $ 168,186,378 LIABILITIES CURRENT LIABILITIES Accounts payable, related party $ 37,651 NET POSITION Net position, restricted $ 168,148,727 The Notes to the Financial Statements are an integral part of these statements. 9
77 WEST VIRGINIA DRINKING WATER TREATMENT REVOLVING FUND STATEMENT OF REVENUES, EXPENSES, AND CHANGES IN FUND NET POSITION Year Ended June 30, 2018 OPERATING REVENUES Administrative fees $ 709,399 Interest on loans 754,063 1,463,462 OPERATING EXPENSE Administrative expense 85,025 Grant expense - principal forgiveness 653, ,999 Operating income 724,463 NONOPERATING REVENUES Investment income 373,145 Income before capital grants and contributions 1,097,608 CAPITAL GRANTS AND CONTRIBUTIONS U.S. Environmental Protection Agency (Note 5) 2,188,894 State of West Virginia (Note 5) 1,648,200 3,837,094 Increase in net position 4,934,702 NET POSITION, beginning 163,214,025 NET POSITION, ending $ 168,148,727 The Notes to the Financial Statements are an integral part of these statements. 10
78 WEST VIRGINIA DRINKING WATER TREATMENT REVOLVING FUND STATEMENT OF CASH FLOWS Year Ended June 30, 2018 OPERATING ACTIVITIES Cash payments for: Loans originated $ (7,118,290) Administrative expenses (56,172) Cash reciepts from: Principal repayments 6,797,783 Administrative fees 706,757 Interest on loans 746,059 Net cash and cash equivalents used in operating activities 1,076,137 CAPITAL AND FINANCING ACTIVITIES Capital grants and contributions received: U.S. Environmental Protection Agency 2,188,894 State of West Virginia, Infrastructure and Jobs Development Council 1,648,200 Net cash provided by capital and related financing activites 3,837,094 INVESTING ACTIVITIES Investment income 373,145 Net decrease in cash and cash equivalents 5,286,376 CASH AND CASH EQUIVALENTS, beginning 21,869,217 CASH AND CASH EQUIVALENTS, ending $ 27,155,593 Reconciliation of operating income to net cash and cash equivalents used in operating activities: Operating income $ 724,463 Adjustments to reconcile operatingincome to net cash and cash equivalents used in operating activities: Increase in loans receivable 333,467 Increase in administrative fees receivable (2,642) Decrease in accrued interest receivable (8,004) Decrease in accounts payable, related party 28,853 Net cash and cash equivalents used in operating activities $ 1,076,137 SUPPLEMENTAL DISCLOSURE OF NONCASH ACTIVITIES New loans originated with principal forgiveness features $ 653,974 The Notes to the Financial Statements are an integral part of these statements. 11
79 WEST VIRGINIA DRINKING WATER TREATMENT REVOLVING FUND NOTES TO FINANCIAL STATEMENTS June 30, 2018 Note 1. Description of the Fund The West Virginia Drinking Water Treatment Revolving Fund (the Fund ) was established pursuant to the Safe Drinking Water Act (the Act ) by the State of West Virginia (the State), as amended, and is administered by the West Virginia Water Development Authority (the Authority) on behalf of the Bureau for Public Health. The purpose of the Act was to establish and implement a State-operated perpetual revolving loan fund to provide no-interest or low-interest rate loans to local governmental agencies and other eligible water providers to assist in financing drinking water infrastructure projects, including but not limited to, design, treatment, distribution, transmission, storage and extensions; and remain in perpetuity by recirculating the principal repayments and interest earned from the loans. The Fund s programs are designed to provide financial assistance in the form of nointerest, low-interest, and forgivable loans to eligible local governmental agencies and other eligible water providers in the State in accordance with the Act. Such loan programs provide long-term financing to cover all or a portion of the cost of qualifying projects. The Fund has received capital grants and contributions from the United States Environmental Protection Agency (the EPA ), and the State, which is required to provide an additional twenty percent of the federal award as matching funds in order to qualify for funding. As of June 30, 2018 Congress has authorized the EPA to award $202,256,782 in capitalization grants to the State, of which $152,022,901 is allocated to the fund. The state is required to contribute $36,537,757 in matching funds to the Fund, which are provided through the West Virginia Infrastructure and Jobs Development Council. The 2018 Capitalization Grant State Match of $2,221,400 has been deposited in the Fund in July These financial statements present the loan activity of the Fund and do not include the activity in any set-aside accounts required by the EPA grants. Note 2. Significant Accounting Policies Basis of presentation The Fund is accounted for as a proprietary fund special purpose government engaged in business type activities. In accordance with accounting principles generally accepted in the United States of America, these financial statements are prepared on the accrual basis of accounting, using the flow of economic resources measurement focus. Under this basis of accounting, revenues are recognized when earned and expenses are recognized when incurred. The Fund is a component of the State and as such is included in the State s financial statements as a proprietary fund and business type activity blended component using the accrual basis of accounting. Because of the Fund s presentation in these financial statements as a special purpose government engaged in business type activities, there may be differences between the presentation of amounts reported in these financial statements and the financial statements of the State as a result of major fund determination. Use of estimates The preparation of financial statements in conformity with accounting principles generally accepted in the United States of America requires management to make certain estimates and assumptions that affect the amounts reported in the financial statements and accompanying notes. Actual results could differ from management s estimates. (Continued) 12
80 WEST VIRGINIA DRINKING WATER TREATMENT REVOLVING FUND NOTES TO FINANCIAL STATEMENTS June 30, 2018 Note 2. Significant Accounting Policies (Continued) Cash and cash equivalents Cash and cash equivalents include investments with the West Virginia Board of Treasury Investments ( BTI ) and are recorded at amortized cost which approximates fair value. The State Treasurer deposits cash with the BTI at the direction of the Authority, and deposits are not separately identifiable as to specific types of securities. Such funds are available to the Fund daily. Loans receivable The State operates the Fund as a perpetual revolving loan program, whereby loans made to local governmental agencies or other eligible water providers are funded by a federal capitalization grant, including amounts awarded under the former American Recovery and Reinvestment Act of 2009 (ARRA), and the State matching amount and/or repayments from existing loans. Loan funds are disbursed to the local governmental agencies or other eligible water providers as costs are incurred on approved projects. Interest, if applicable, is not paid during construction but begins accruing three months before the date that local governmental agencies or other eligible water providers begin repayment; and the payment schedule is adjusted for actual amounts disbursed and interest accrued on those disbursements. The loans are secured by a lien on the revenues of the local governmental agencies or other eligible water providers water systems and by debt service reserve funds held by the West Virginia Municipal Bond Commission. According to the terms as set forth in the ARRA, management believes that it is probable that certain of the local government agencies will fulfill specific ARRA program requirements allowing for principal forgiveness, and as such a 100% principal forgiveness valuation has been made for certain of these program loans through the year ended June 30, The Fund also issues loans eligible for principal forgiveness from funds provided under EPA grants received by the Fund. These loans, which are issued to certain local government agencies or other eligible water providers will be forgiven on the 30 th day of June in the fiscal year coinciding with the disbursement. These loans, which are secured by principal only bonds issued by the loan recipient, and held in the name of the Authority and the West Virginia Bureau for Public Health on behalf of the Fund, are to be deemed no longer outstanding after the last loan disbursement is forgiven. Therefore, it is the Fund s policy to maintain an allowance for principal forgiveness loans, equal to the amount of the disbursement, until the last disbursement is made to the recipient and the loan can be removed from the outstanding loans list. As of June 30, 2018, with the exception of forgivable loans, no provision for uncollectible accounts has been made because management believes that the loans will be repaid according to the loan terms. There are no principal or interest payments in default. Administrative fees Administrative fees are a percentage of the outstanding loan balance and are recognized as income when fees are earned over the life of the loan. Administrative fees are collected over the life of the loan concurrently with principle reduction payments by local governmental agencies or other eligible water providers at terms set forth in the applicable loan agreements. (Continued) 13
81 WEST VIRGINIA DRINKING WATER TREATMENT REVOLVING FUND NOTES TO FINANCIAL STATEMENTS June 30, 2018 Note 2. Significant Accounting Policies (Continued) Capital grants and contributions Amounts received from the EPA and the State for the continued capitalization of the Fund are recorded at cost as capital grants and contributions, when the funds are received. Net position Net position is reported as restricted. Restricted net position is the result of constraints placed on its use which have been imposed by the grantor agency and by law through enabling legislation. Operating revenues and expenses Operating revenues and expenses for proprietary funds are those that result from providing services and producing and delivering goods and/or services. It also includes all revenue and expenses not related to capital and related financing, noncapital financing or investing activities. Note 3. Cash and Cash Equivalents The Authority, as administrative agent for the Fund, adopted investment guidelines for the Fund. Those guidelines require all investment funds to be invested in accordance with the Act and applicable federal guidelines related to the Fund. In accordance with the Act, the Fund, which is comprised of moneys appropriated to the Fund by the Legislature, moneys allocated to the State by the federal government expressly for the purpose of establishing and maintaining a drinking water treatment revolving fund, all receipts from loans made from the Fund, all income from the investment of moneys held in the Fund, and all other sums designated for deposit to the Fund from any source, public or private is to be continued in the Office of the State Treasurer. The State Treasurer has statutory responsibility for the daily cash management activities of the State s agencies, departments, boards and commissions and transfers funds to the BTI for investment in accordance with West Virginia Code, policies set by the BTI and by provisions of bond indentures and trust agreements when applicable. The Fund s cash balances are invested by the BTI in the BTI s West Virginia Money Market Pool or deposited with the State Treasurer. Credit risk - Credit risk is the risk that an issuer or other counterparty to an investment will not fulfill its obligations. The WV Money Market pool has been rated AAAm by Standard & Poor s. A fund rated AAAm has extremely strong capacity to maintain principal stability and to limit exposure to principal losses due to credit, market, and/or liquidity risks. AAAm is the highest principal stability fund rating assigned by Standard & Poor s. The BTI itself has not been rated for credit risk by any organization. (Continued) 14
82 WEST VIRGINIA DRINKING WATER TREATMENT REVOLVING FUND NOTES TO FINANCIAL STATEMENTS June 30, 2018 Note 3. Cash and Cash Equivalents (Continued) The BTI limits the exposure to credit risk in the WV Money Market Pool by requiring all long-term corporate debt be rated A+ or higher by Standard & Poor s (or its equivalent) and short-term corporate debt be rated at A-1 or higher by Standard & Poor s (or its equivalent). The pool must have at least 15% of its assets in U.S. Treasury obligations or obligations guaranteed as to repayment of interest and principal by the United States of America. The following table provides information on the credit ratings of the WV Money Market Pool s investments (in thousands): Credit Rating Security Type Moody s S&P Carrying Value Percent of Pool Assets Commercial paper P-1 A-1+ $ 473, % P-1 P-2 A-1 A-1 1,351,128 44, Corporate bonds and notes P-1 A-1 18, U.S. Treasury notes * Aaa AA+ 90, U.S. Treasury bills * P-1 A , Negotiable certificates of deposit P-1 A , P-1 A-1 458, Money market funds Aaa AAAm 143, Repurchase agreements (underlying securities): U.S. agency bonds and notes Aaa AA+ 227, $3,264, % *U.S. Treasury issues are explicitly guaranteed by the United States government and are not considered to have credit risk. Concentration of credit risk - Concentration of credit risk is the risk of loss attributed to the magnitude of a pool s investment in a single corporate issuer. The BTI investment policy prohibits the West Virginia Money Market Pool from investing more than 5% of their assets in any one corporate name or one corporate issue. Custodial credit risk - Custodial credit risk for investments is the risk that, in the event of the failure of the counterparty to a transaction, the BTI will not be able to recover the value of investment or collateral securities that are in the possession of an outside party. Repurchase agreements are required to be collateralized by at least 102% of their value, and the collateral is held in the name of the BTI. The BTI or its agent does not release cash or securities until the counterparty delivers its side of the transaction. (Continued) 15
83 WEST VIRGINIA DRINKING WATER TREATMENT REVOLVING FUND NOTES TO FINANCIAL STATEMENTS June 30, 2018 Note 3. Cash and Cash Equivalents (Continued) Interest rate risk - Interest rate risk is the risk that changes in interest rates will adversely affect the fair value of an investment. The West Virginia Money Market Pool is subject to interest rate risk. The overall weighted average maturity of the investments of the West Virginia Money Market Pool cannot exceed 60 days. Maximum maturity of individual securities cannot exceed 397 days from date of purchase, except for government floating rate notes, which can be up to 762 days. The following table provides information on the weighted average maturities for the various asset types in the WV Money Market Pool: Security Type Carrying Value (In Thousands) WAM (Days) Repurchase agreements $ 227,800 3 U.S. Treasury notes 90, U.S. Treasury bills 252, Commercial paper 1,868, Negotiable certificates of deposit 663, Corporate bonds and notes 18, Money market funds 143,067 3 $ 3,264, Foreign Currency risk - Foreign currency risk is the risk that changes in exchange rates will adversely affect the fair value of an investment or a deposit. The West Virginia Money Market Pool does not hold interests in foreign currency or interests valued in foreign currency. Note 4. Loans Receivable As of June 30, 2018, loans receivable consisted of loans to local governmental agencies (LGA s) or other eligible water providers for qualifying projects which comply with the Act. The Fund issued $653,974 in loans whose principal was forgiven during the year ended June 2018 in accordance with funding covenants provided by the EPA. Accordingly a valuation account for expected principal forgiveness has been recorded as of June 30, 2018 for the total allotment of anticipated qualifying principal forgiveness loans. During the year, the Fund disbursed $6,464,316 of loans which are required to be repaid in accordance with the loan agreements. (Continued) 16
84 WEST VIRGINIA DRINKING WATER TREATMENT REVOLVING FUND NOTES TO FINANCIAL STATEMENTS June 30, 2018 Note 4. Loans Receivable (Continued) Loans receivable consisted of the following at June 30, 2018: Loans without principal forgiveness features $ 140,899,740 ARRA loans 5,946,435 EPA principal forgiveness loans 1,807,413 Total loans outstanding 148,653,588 Less: Allowance for expected principal forgiveness 7,753,848 Current maturities 9,616,729 Total loans receivable, net of current maturities and principal forgiveness $ 131,283,011 Non-principal forgiveness loans mature at various intervals through June 2048, ARRA and EPA principal forgiveness loans will be forgiven over various periods through June The scheduled principal payments on principal forgiveness loans maturing in subsequent years and annual principal forgiveness in future years are as follows at June 30: 2019 $ 9,616, ,906, ,923, ,463, ,337,810 Thereafter 122,200,534 Less loans closed but not disbursed 18,795,294 Less current maturities 9,616,729 Less allowance for principal forgiveness programs 7,753,848 Total loans receivable, net of current maturities and principal forgiveness $ 131,283,011 17
85 WEST VIRGINIA DRINKING WATER TREATMENT REVOLVING FUND NOTES TO FINANCIAL STATEMENTS June 30, 2018 Note 5. Capital Grants and Contributions The Fund is awarded grants from the EPA as authorized by the Act and the State provides matching funds from the West Virginia Infrastructure and Jobs Development Council s Infrastructure Fund. Funds drawn are recorded as capital grants and contributions from the EPA and the State. As of June 30, 2018, the cumulative amounts awarded to the Fund from the EPA and the contributed matching funds from the State were as follows: Effective Award Date EPA Grant State Match 9/11/1998 $ 9,076,449 $ 2,511,760 6/11/ ,965,142 2,917,020 12/10/2001 5,352,330 1,551,400 11/9/2002 5,374,479 1,557,820 10/23/2003 5,556,225 1,610,500 6/16/2005 5,522,829 1,600,820 12/1/2005 5,729,139 1,660,620 12/4/2006 5,716,995 1,657,100 12/19/2007 5,678,217 1,645,860 11/7/2008 6,089,460 1,645,800 6/15/2009* 15,350,000-8/3/2009* 3,900,000-10/1/2009 5,620,740 1,629,200 7/29/2010 7,345,036 1,629,200 9/22/2010 9,466,950 2,714,600 9/15/2011 6,394,920 1,883,600 1/20/ ,000-9/5/2012 6,224,032 1,801,257 7/1/2013 5,810,490 1,684,200 7/1/2014 6,701,750 1,769,000 7/1/2015 6,590,250 1,757,400 6/27/2016 5,949,000 1,662,400 8/1/2017 5,458,468 1,648,200 $152,022,901 $36,537,757 *Funds did not require a State match. (Continued) 18
86 WEST VIRGINIA DRINKING WATER TREATMENT REVOLVING FUND NOTES TO FINANCIAL STATEMENTS June 30, 2018 Note 5. Capital Grants and Contributions (Continued) The following represents the amounts of EPA grants and State matching funds received by the Fund through June 30, 2018: Cumulative Through Federal State Total Capital Grants and Contributions June 30, 2018 $148,753,327 $36,537,757 $185,291,084 Note 6. Commitments The Fund has established a list of local governmental agencies that have formally been recommended by the West Virginia Infrastructure and Jobs Development Council and approved by the Bureau for Public Health to participate in future lending activities consistent with the guidelines of the Act. The following is a list of outstanding commitments as of June 30, 2018: Amount Committed Local Governmental Agency Commitment Date by the Fund Town of Oceana 2/26/2018 $ 450,000 Lashmeet PSD 5/30/ ,704 Total $ 633,704 The Fund has awarded amounts not yet disbursed of approximately $18,795,294 for projects previously approved and in various stages of completion. Note 7. Risk Management The Fund is exposed to various risks of loss related to torts and errors and omissions. Through its participation in the West Virginia Board of Risk and Insurance Management, the Fund obtained coverage for general liability, business interruptions, and errors and omissions. Such coverage is provided in exchange for an annual premium. There were no changes in coverage or claims in excess of coverage for the year ended June 30, Note 8. Transactions with State of West Virginia Agencies The Authority pays for and is reimbursed for certain administrative expenses (including salaries and legal expenses) on behalf of the Fund. As of June 30, 2018, the Fund had incurred and recognized $85,025 in administrative expenses of which $37,651 remained payable to the Authority at June 30,
87 ACCOMPANYING INFORMATION
88 WEST VIRGINIA DRINKING WATER TREATMENT REVOLVING FUND. SCHEDULES OF ADMINISTRATIVE FEES ACTIVITY June 30, 2018 SCHEDULE OF ASSETS AND FUND NET POSITION ASSETS Cash and cash equivalents $ 5,989,260 Administrative fees receivable 60,878 Total assets $ 6,050,138 LIABILITIES Accounts payable, related party $ 37,651 RESTRICTED FUND NET POSITION $ 6,012,487 SCHEDULE OF ADMINISTRATIVE FEES ACTIVITY IN FUND NET POSITION REVENUES Administrative fees $ 709,399 Interest on investments 86,237 Total revenues 795,636 EXPENSES Administrative expense 85,025 Net income 710,611 RESTRICTED FUND NET POSITION - ADMINISTRATIVE FEES, beginning 5,301,876 RESTRICTED FUND NET POSITION - ADMINISTRATIVE FEES, ending $ 6,012,487 SCHEDULE OF CASH FLOWS NET INCOME $ 710,611 Adjustments to reconcile net income to net cash provided by administrative fees activity: Increase in administrative fees receivable (2,642) Increase in accounts payable, related party 28,853 NET CASH PROVIDED BY ADMINISTRATIVE FEES ACTIVITY 736,822 CASH AND CASH EQUIVALENTS, ending 5,252,438 CASH AND CASH EQUIVALENTS, beginning $ 5,989,260 See Independent Auditor's Report. 20
89 WEST VIRGINIA DRINKING WATER TREATMENT REVOLVING FUND SCHEDULE OF EXPENDITURES OF FEDERAL AWARDS Year Ended June 30, 2018 U.S. Environmental Protection Agency CFDA # Expenditures Capitalization Grants for Drinking Water State Revolving Funds $ 2,188,894¹ ¹ This amount was passed through to non federal entities under a loan program. Note 1. Basis of Presentation The above schedule of expenditures of federal awards includes the federal award activity of the West Virginia Drinking Water Treatment Revolving Loan Fund (the Fund) under programs of the federal government for the year ended June 30, The information in this schedule is presented in accordance with the requirements of Title 2 U.S. Code of Federal Regulations (CFR) Part 200, Uniform Administrative Requirements, Cost Principles, and Audit Requirement for Federal Awards (Uniform Guidance). Because the Schedule presents only a selected portion of the operations of the Fund, it is not intended to and does not present the financial position, changes in fund net position or cash flows of the Fund. Note 2. Summary of Significant Accounting Policies Expenditures reported on the Schedule are reported on the accrual basis of accounting. Such expenditures are recognized following the cost principles contained in the Uniform Guidance, wherein certain types of expenditures are not allowable or are limited as to reimbursement. Note 3. Indirect Cost Rate The Fund has elected not to use the 10-percent de minimis indirect cost rate allowed under the Uniform Guidance. See Independent Auditor s Report. 21
90 INDEPENDENT AUDITOR S REPORT ON INTERNAL CONTROL OVER FINANCIAL REPORTING AND ON COMPLIANCE AND OTHER MATTERS BASED ON AN AUDIT OF FINANCIAL STATEMENTS PERFORMED IN ACCORDANCE WITH GOVERNMENT AUDITING STANDARDS To the West Virginia Bureau for Public Health and the West Virginia Water Development Authority Charleston, West Virginia We have audited, in accordance with the auditing standards generally accepted in the United States of America and the standards applicable to financial audits contained in Government Auditing Standards issued by the Comptroller General of the United States, the financial statements of the West Virginia Drinking Water Treatment Revolving Fund (the Fund), as of and for the year ended June 30, 2018, and the related notes to the financial statements, which collectively comprise the Fund s basic financial statements, and have issued our report thereon dated October 10, Internal Control over Financial Reporting In planning and performing our audit of the financial statements, we considered the Fund s internal control over financial reporting (internal control) to determine the audit procedures that are appropriate in the circumstances for the purpose of expressing our opinion on the financial statements, but not for the purpose of expressing an opinion on the effectiveness of the Fund s internal control. Accordingly, we do not express an opinion on the effectiveness of the Fund s internal control. A deficiency in internal control exists when the design or operation of a control does not allow management or employees, in the normal course of performing their assigned functions, to prevent, or detect and correct misstatements on a timely basis. A material weakness is a deficiency, or a combination of deficiencies, in internal control, such that there is a reasonable possibility that a material misstatement of the Fund s financial statements will not be prevented, or detected and corrected on a timely basis. A significant deficiency is a deficiency, or a combination of deficiencies, in internal control that is less severe than a material weakness, yet important enough to merit attention by those charged with governance. Our consideration of internal control was for the limited purpose described in the first paragraph of this section and was not designed to identify all deficiencies in internal control that might be material weaknesses or significant deficiencies. Given these limitations, during our audit we did not identify any deficiencies in internal control that we consider to be material weaknesses. However, material weaknesses may exist that have not been identified. Compliance and Other Matters As part of obtaining reasonable assurance about whether the Fund s financial statements are free from material misstatement, we performed tests of its compliance with certain provisions of laws, regulations, contracts, and grant agreements, noncompliance with which could have a direct and material effect on the determination of financial statement amounts. However, providing an opinion on compliance with those provisions was not an objective of our audit, and accordingly, we do not express such an opinion. The results of our tests disclosed no instances of noncompliance or other matters that are required to be reported under Government Auditing Standards. Your Success is Our Focus 300 Chase Tower, 707 Virginia Street, East Charleston, WV Fax:
91 Purpose of this Report The purpose of this report is solely to describe the scope of our testing of internal control and compliance and the results of that testing, and not to provide an opinion on the effectiveness of the entity s internal control or on compliance. This report is an integral part of an audit preformed in accordance with Government Auditing Standards in considering the entity s internal control and compliance. Accordingly, this communication in not suitable for any other purpose. CERTIFIED PUBLIC ACCOUNTANTS Charleston, West Virginia October 10,
92 INDEPENDENT AUDITOR S REPORT ON COMPLIANCE FOR EACH MAJOR FEDERAL PROGRAM AND ON INTERNAL CONTROL OVER COMPLIANCE REQUIRED BY THE UNIFORM GUIDANCE To the West Virginia Bureau for Public Health and the West Virginia Water Development Authority Charleston, West Virginia Report on Compliance for Each Major Federal Program We have audited the West Virginia Drinking Water Treatment Revolving Fund s (the Fund) compliance with the types of compliance requirements described in the OMB Compliance Supplement that could have a direct and material effect on the Fund s major federal program for the year ended June 30, The Fund s major federal program is identified in the summary of auditor s results section of the accompanying schedule of findings and questioned costs. Management s Responsibility Management is responsible for compliance with federal statutes, regulations, the terms and conditions of its federal awards applicable to its federal program. Auditor s Responsibility Our responsibility is to express an opinion on compliance for the Fund s major federal program based on our audit of the types of compliance requirements referred to above. We conducted our audit of compliance in accordance with auditing standards generally accepted in the United States of America; the standards applicable to financial audits contained in Government Auditing Standards, issued by the Comptroller General of the United States; and the audit requirements of Title 2 U.S. Code of Federal Regulations Part 200, Uniform Administrative Requirements, Cost Principles, and Audit Requirements for Federal Awards (Uniform Guidance). Those standards and the Uniform Guidance require that we plan and perform the audit to obtain reasonable assurance about whether noncompliance with the types of compliance requirements referred to above that could have a direct and material effect on a major federal program occurred. An audit includes examining, on a test basis, evidence about the Fund s compliance with those requirements and performing such other procedures as we considered necessary in the circumstances. We believe that our audit provides a reasonable basis for our opinion on compliance for each major federal program. However, our audit does not provide a legal determination of the Fund s compliance. Opinion on Each Major Federal Program In our opinion, the Fund complied, in all material respects, with the types of compliance requirements referred to above that could have a direct and material effect on its major federal program for the year ended June 30, Your Success is Our Focus 300 Chase Tower, 707 Virginia Street, East Charleston, WV Fax:
93 Report on Internal Control Over Compliance Management of the Fund is responsible for establishing and maintaining effective internal control over compliance with the types of compliance requirements referred to above. In planning and performing our audit of compliance, we considered the Fund s internal control over compliance with the types of requirements that could have a direct and material effect on the major federal program to determine the auditing procedures that are appropriate in the circumstances for the purpose of expressing our opinion on compliance for the major federal program and to test and report on internal control over compliance in accordance with the Uniform Guidance, but not for the purpose of expressing an opinion on the effectiveness of internal control over compliance. Accordingly, we do not express an opinion on the effectiveness of the Fund s internal control over compliance. A deficiency in internal control over compliance exists when the design or operation of a control over compliance does not allow management or employees, in the normal course of performing their assigned functions, to prevent, or detect and correct, noncompliance with a type of compliance requirement of a federal program on a timely basis. A material weakness in internal control over compliance is a deficiency, or combination of deficiencies, in internal control over compliance, such that there is a reasonable possibility that material noncompliance with a type of compliance requirement of a federal program will not be prevented, or detected and corrected, on a timely basis. A significant deficiency in internal control over compliance is a deficiency or a combination of deficiencies, in internal control over compliance with a type of compliance requirement of a federal program that is less severe than a material weakness in internal control over compliance, yet important enough to merit attention by those charged with governance. Our consideration of internal control over compliance was for the limited purpose described in the first paragraph of this section and was not designed to identify all deficiencies in internal control over compliance that might be material weaknesses or significant deficiencies. We did not identify any deficiencies in internal control over compliance that we consider to be material weaknesses, however, material weaknesses may exist that have not been identified. The purpose of this report on internal control over compliance is solely to describe the scope of our testing of internal control over compliance and the results of that testing based on the requirements of the Uniform Guidance. Accordingly, this report is not suitable for any other purpose. CERTIFIED PUBLIC ACCOUNTANTS Charleston, West Virginia October 10,
94 WEST VIRGINIA DRINKING WATER TREATMENT REVOLVING FUND SCHEDULE OF FINDINGS AND QUESTIONED COSTS Year Ended June 30, 2018 Section I - Summary of Auditor s Results Financial Statements Type of report the auditor issued on whether the financial statements audited were prepared in accordance with GAAP: Unmodified Internal control over financial reporting: Material weakness(es) identified? Yes X No Significant deficiency(ies) identified? Yes X None reported Noncompliance material to financial statements noted? Yes X No Federal Awards Internal control over major programs: Material weakness(es) identified? Yes X No Significant deficiency(ies) identified? Yes X None reported Type of auditor s report issued on compliance for major federal programs: Unmodified Any audit findings disclosed that are required to be reported in accordance with 2 CFR (a)? Yes X No Identification of major programs: CFDA Number Name of Federal Program or Cluster Capitalization Grants for Drinking Water State Revolving Funds 26
95 WEST VIRGINIA DRINKING WATER TREATMENT REVOLVING FUND SCHEDULE OF FINDINGS AND QUESTIONED COSTS Year Ended June 30, 2018 Section I - Summary of Auditors Results (Continued) Dollar threshold used to distinguish between type A and type B programs: $ 750,000 Auditee qualified as low-risk auditee? X Yes No Section II - Financial Statement Findings No findings were identified that are required to be reported under this section. Section III - Federal Award Findings and Questioned Costs No findings were identified that are required to be reported under this section. 27


96
97 WEST VIRGINIA INFRASTRUCTURE AND JOBS DEVELOPMENT COUNCIL FINANCIAL REPORT Year Ended June 30, 2018
98 CONTENTS Page INDEPENDENT AUDITOR S REPORT...1 MANAGEMENT S DISCUSSION AND ANALYSIS...3 BASIC FINANCIAL STATEMENTS: Statement of Net Position...11 Statement of Activities...12 Balance Sheet - Governmental Fund...13 Statement of Revenues, Expenditures, and Changes in Fund Balance - Governmental Fund...14 Statement of Net Position - Proprietary Fund...15 Statement of Revenues, Expenses, and Changes in Fund Net Position - Proprietary Fund...16 Statement of Cash Flows - Proprietary Fund...17 Notes to Financial Statements...18 REQUIRED SUPPLEMENTARY INFORMATION: Schedule of the Proportionate Share of the Net Pension Liability...46 Schedule of Contributions to the PERS...47 Schedule of the Proportionate Share of the Net OPEB Liability...48 Schedule of Contributions to the RHBT...49 Notes to Required Supplementary Information...50 INDEPENDENT AUDITOR S REPORT ON INTERNAL CONTROL OVER FINANCIAL REPORTING AND ON COMPLIANCE AND OTHER MATTERS BASED ON AN AUDIT OF FINANCIAL STATEMENTS PERFORMED IN ACCORDANCE WITH GOVERNMENT AUDITING STANDARDS... 52
99 INDEPENDENT AUDITOR S REPORT To the Board of Directors West Virginia Infrastructure and Jobs Development Council Charleston, West Virginia Report on the Financial Statements We have audited the accompanying financial statements of the governmental activities, the business-type activities, and each major fund of the West Virginia Infrastructure and Jobs Development Council (the Council), as of and for the year ended June 30, 2018, and the related notes to the financial statements, which collectively comprise the Council s basic financial statements as listed in the table of contents. Management s Responsibility for the Financial Statements Management is responsible for the preparation and fair presentation of these financial statements in accordance with accounting principles generally accepted in the United States of America; this includes the design, implementation, and maintenance of internal control relevant to the preparation and fair presentation of financial statements that are free from material misstatement, whether due to fraud or error. Auditor s Responsibility Our responsibility is to express opinions on these financial statements based on our audit. We conducted our audit in accordance with auditing standards generally accepted in the United States of America and the standards applicable to financial audits contained in Government Auditing Standards, issued by the Comptroller General of the United States. Those standards require that we plan and perform the audit to obtain reasonable assurance about whether the financial statements are free from material misstatement. An audit involves performing procedures to obtain audit evidence about the amounts and disclosures in the financial statements. The procedures selected depend on the auditor s judgment, including the assessment of the risks of material misstatement of the financial statements, whether due to fraud or error. In making those risk assessments, the auditor considers internal control relevant to the entity s preparation and fair presentation of the financial statements in order to design audit procedures that are appropriate in the circumstances, but not for the purpose of expressing an opinion on the effectiveness of the entity s internal control. Accordingly, we express no such opinion. An audit also includes evaluating the appropriateness of accounting policies used and the reasonableness of significant accounting estimates made by management, as well as evaluating the overall presentation of the financial statements. We believe that the audit evidence we have obtained is sufficient and appropriate to provide a basis for our audit opinions. Your Success is Our Focus 300 Chase Tower, 707 Virginia Street, East Charleston, WV Fax:
100 Opinions In our opinion, the financial statements referred to above present fairly, in all material respects, the respective financial position of the governmental activities, the business-type activities, and each major fund of the Council, as of June 30, 2018, and the respective changes in financial position, and where applicable, cash flows thereof for the year then ended in accordance with accounting principles generally accepted in the United States of America. Emphasis of Matter As discussed in Note 1, the financial statements present only the Council, and do not purport to, and do not present fairly the financial position of the State of West Virginia as of June 30, 2018, the changes in its financial position, or, where applicable, its cash flows for the year then ended in conformity with accounting principles generally accepted in the United States of America. Our opinion is not modified with respect to this matter. Other Matters Required Supplementary Information Accounting principles generally accepted in the United States of America require that the management s discussion and analysis on pages 3 through 10, the schedule of the proportionate share of the net pension liability, the schedule of contributions to the PERS, the schedule of the proportionate share of the net OPEB liability, and the schedule of contributions to the RHBT on pages 46 through 51, be presented to supplement the basic financial statements. Such information, although not a part of the basic financial statements, is required by the Governmental Accounting Standards Board, who considers it to be an essential part of financial reporting for placing the basic financial statements in an appropriate operational, economic, or historical context. We have applied certain limited procedures to the required supplementary information in accordance with auditing standards generally accepted in the United States of America, which consisted of inquiries of management about the methods of preparing the information and comparing the information for consistency with management s responses to our inquiries, the basic financial statements, and other knowledge we obtained during our audit of the basic financial statements. We do not express an opinion or provide any assurance on the information because the limited procedures do not provide us with sufficient evidence to express an opinion or provide any assurance. Other Reporting Required by Government Auditing Standards In accordance with Government Auditing Standards, we have also issued our report dated October 9, 2018, on our consideration of the Council s internal control over financial reporting and on our tests of its compliance with certain provisions of laws, regulations, contracts, and grant agreements and other matters. The purpose of that report is to describe the scope of our testing of internal control over financial reporting and compliance and the results of that testing, and not to provide an opinion on internal control over financial reporting or on compliance. That report is an integral part of an audit performed in accordance with Government Auditing Standards in considering the Council s internal control over financial reporting and compliance. Charleston, West Virginia October 9, 2018 CERTIFIED PUBLIC ACCOUNTANTS 2
101 WEST VIRGINIA INFRASTRUCTURE AND JOBS DEVELOPMENT COUNCIL MANAGEMENT S DISCUSSION AND ANALYSIS (Unaudited) INTRODUCTION Our discussion and analysis of the West Virginia Infrastructure and Jobs Development Council s (the Council ) financial performance provides an overview of the Council s financial activities for the fiscal year ended June 30, Please read it in conjunction with the Council s financial statements, which begin on page 11. USING THIS REPORT This report consists of a series of fund level and government-wide financial statements. The Statement of Net Position and Statement of Activities report the net position and activities of the Council as a whole. The Governmental Fund s Balance Sheet and the Statement of Revenues, Expenditures, and Changes in Fund Balance report the Council s governmental fund balance and the respective changes in it. The Statement of Net Position and the Statement of Revenues, Expenses and Changes in Fund Net Position - Proprietary Fund present the proprietary fund net position and the respective changes in net position. The Council s net position and the Council s fund balance represent ways to measure the Council s financial health or financial position. Over time, increases or decreases in the Council s net position and fund balance are indicators of whether its financial health is improving or deteriorating. FINANCIAL HIGHLIGHTS Business Type Activities: Total assets increased $7.47 million from $ million to $ million Deferred outflows of resources decreased $142 thousand from $1.162 million to $1.020 million Total liabilities decreased $7 million from $188 million to $181 million Deferred inflows of resources increased $32 thousand from $18 thousand to $50 thousand Net position increased $14 million from $615 million to $629 million Governmental Activities: Total assets decreased $99 from the previous year Deferred outflows of resources decreased $659 thousand from $6.152 million to $5.493 million Total liabilities decreased $13 million from $187 million to $174 million The deficiency in net position decreased $13 million from ($181) million to ($168) million Government Wide: Total assets increased $7.47 million from $ million to $ million Deferred outflows of resources decreased $802 thousand from $7.315 million to $6.513 million Total liabilities decreased $20 million from $375 million to $355 million Deferred inflows of resources increased $32 thousand from the prior year Net position increased by $27 million from $434 million to $461 million Other Highlights: 15 water and waste water project and economic development loans were closed for the year ended June 30, 2018 on behalf of the Council 25 water and wastewater grants were closed for the year ended June 30, 2018 on behalf of the Council (Continued) 3
102 WEST VIRGINIA INFRASTRUCTURE AND JOBS DEVELOPMENT COUNCIL MANAGEMENT S DISCUSSION AND ANALYSIS (Unaudited) FINANCIAL ANALYSIS OF THE COUNCIL AS A WHOLE Our analysis below focuses on the Net Position (Table 1) and Changes in Net Position (Table 2) of the Council: Table 1 Net Position Business Type Activities Governmental Type Activities Business Type Activities Governmental Type Activities ASSETS Cash equivalents $ 143,343,746 $ 24 $ 140,837,696 $ 123 Investments 95,922, ,331,825 - Assets held by others ,000 - Loans receivable, net 568,197, ,071,974 - Other 2,489,085-2,035,602 - Total assets $ 809,952,959 $ 24 $ 802,483,097 $ 123 DEFERRED OUTFLOWS OF RESOURCES Deferred outflows of resources from pensions $ 33,088 $ - $ 97,796 $ - Deferred outflows of resources from OPEB 3, Deferred loss on refunding 983,593 5,493,428 1,064,683 6,152,420 Total deferred outflows $ 1,020,026 $ 5,493,428 $ 1,162,479 $ 6,152,420 LIABILITIES Bond payable, net $ 178,395,141 $ 173,097,918 $ 185,290,226 $ 186,190,638 Net pension liability 55, ,377 - Net OPEB liability 50, Other 2,936, ,690 2,999, ,081 Total liabilities $ 181,437,392 $ 173,813,608 $ 188,468,436 $ 186,965,719 DEFERRED INFLOWS OF RESOURCES Deferred inflows of resources from pensions $ 30,952 $ - $ 18,520 $ - Deferred inflows of resources from OPEB 19, Total deferred inflows of resources $ 50,295 $ - $ 18,520 $ - NET POSITION Restricted $ 621,723,250 $ 24 $ 593,751,485 $ 123 Unrestricted (deficit) 7,762,048 (168,320,180) 21,407,135 (180,813,299) Total net position $ 629,485,298 $ (168,320,156) $ 615,158,620 $ (180,813,176) (Continued) 4
103 WEST VIRGINIA INFRASTRUCTURE AND JOBS DEVELOPMENT COUNCIL MANAGEMENT S DISCUSSION AND ANALYSIS (Unaudited) FINANCIAL ANALYSIS OF THE COUNCIL AS A WHOLE (Continued) Business Type Activities Table 2 Changes in Net Position Governmental Business Type Type Activities Activities Governmental Type Activities Revenues Program revenues Charges for services $ 3,344,075 $ - $ 3,095,301 $ - General revenues Miscellaneous revenues 5,732-2,005 - Intergovernmental 46,000,000 19,338,488 26,000,000 22,055,613 Investment earnings 2,598,700 72,455 1,016,289 33,148 Total general revenues 48,604,432 19,410,943 27,018,294 22,088,761 Total revenues 51,948,507 19,410,943 30,113,595 22,088,761 Expenses General & administrative 802, ,790 - Interest on long-term debt 6,744,292 6,884,193 8,339,703 8,019,096 Bond issue costs ,713 Infrastructure & economic development 20,285,164-15,917,162 - Loss on uncollectible loans 9,753, ,000 - Transfers (in) out (33,730) 33,730 (224,710) 224,710 Total expenses 37,551,769 6,917,923 25,378,945 8,452,519 Changes in net position 14,396,738 12,493,020 4,734,650 13,636,242 Beginning net position (deficit) 615,158,620 (180,813,176) 610,423,970 (194,449,418) Cumulative effect of change in accounting principle (70,060) Beginning Net Position, restated 615,088, Ending net position (deficit) $ 629,485,298 $ (168,320,156) $ 615,158,620 $ (180,813,176) (Continued) 5
104 WEST VIRGINIA INFRASTRUCTURE AND JOBS DEVELOPMENT COUNCIL MANAGEMENT S DISCUSSION AND ANALYSIS (Unaudited) FINANCIAL ANALYSIS OF THE COUNCIL AS A WHOLE (Continued) Cash equivalents, which include short-term, highly liquid investments with original maturities of 90 days or less, increased $2.5 million, from $140.8 million last year to $143.3 million at the end of the current year. The increase in cash was primarily the result of an increase in investment earnings of $1.6 million, interest on loans, principal repayments of loans, receipt of $46 million in Excess Lottery funds, and a transfer of $5.4 million from investments to cash equivalents. Offsetting these increases were expenses for loans and grants totaling $49 million, as well as contributions of the State Matching fund for the federally sponsored Drinking Water Treatment Revolving Fund and Clean Water State Revolving Fund, principal and interest payments on outstanding bonds payable, and general and administrative expenses. Investments decreased $4 million due to transferring $5.4 million to cash equivalents offset by investment earnings. Assets held by others decreased $206 thousand due to the sale of the Winterburn property by the West Virginia Water Development Authority on behalf of the Infrastructure Jobs and Development Council. Loans receivable increased $9 million. This increase was primarily the combined effect of disbursements of new and prior year loan funds to projects of approximately $40 million, less repayments of principal on loans of approximately $21 million, offset by an increase in the allowance for uncollectible loans of $7 million for two economic development loans that have forgivable features. Deferred outflows of resources decreased $801 thousand which was the result of current year amortizations of loss on refundings in the amount of $740 thousand, and a decrease in the deferred outflow of resources for pension expense and pension contributions in the amount of $65 thousand. This was offset by an increase in the deferred outflow of resources for OPEB expense and OPEB contributions in the amount of $3 thousand due to the implementation of GASB 75, Accounting and Financial Reporting for Postemployment Benefits Other than Pensions which is explained further in Notes 5 and 12. Total liabilities decreased $20 million primarily due to a net decrease in bonds payable from the previous year. Bonds payable increased by current year accretion of $3 million and decreased by $21 million due to current year principal repayments. Deferred inflows of resources increased by $32 thousand due to the current year pension activity and the addition of the deferred inflows from OPEB due to the implementation of GASB 75, Accounting and Financial Reporting for Postemployment Benefits Other Than Pensions. Restrictions of net position are the result of constraints placed on the use of net position which have been imposed externally through debt covenants and by law through enabling legislation. Restricted net position increased approximately $28 million during the current year. That increase can be explained primarily as follows: mineral severance tax revenue of $19.3 million, excess lottery funds of $6 million to pay debt service on the Chesapeake Bay bonds, and a transfer from the unrestricted funds of $42.5 million for loan disbursements. Offsetting the increases were disbursements of $33 million of principal and interest expense related to revenue and general obligation bonds and grant disbursements of $9.5 million. Transfers from restricted accounts included interest earnings on accounts funded with residual mineral severance tax revenue and earnings on accounts funded with State appropriations of excess (Continued) 6
105 WEST VIRGINIA INFRASTRUCTURE AND JOBS DEVELOPMENT COUNCIL MANAGEMENT S DISCUSSION AND ANALYSIS (Unaudited) FINANCIAL ANALYSIS OF THE COUNCIL AS A WHOLE (Continued) lottery revenue and earnings on debt service reserve funds. As provided by enabling legislation, the earnings on those restricted accounts were transferred to the unrestricted revenue account and various rebate accounts and were used, in part, to pay operating expenses of the Council. Unrestricted Net Position for business type activities as of June 30, 2018 is $7.8 million, a decrease from the prior year of approximately $13.6 million. This is due to the receipt of excess lottery revenue of $40 million offset by an internal transfer within the business type activities to restricted funds of $42.5 million, payment of general and administrative expenses of $802 thousand, and $10.8 million for the State Match of the federally sponsored Drinking Water Treatment Revolving Fund and the Clean Water State Revolving Fund. Fund Balance/Government-wide Net Position The only activity reported in the governmental fund relates to future payments of the General Obligation Bonds which mature through fiscal year See Note 9 in the Notes to the Financial Statements for further detail. Although the governmental fund reports a deficit, an amount not to exceed $22.25 million of intergovernmental revenue is statutorily provided every year by the State of West Virginia from excess mineral severance tax in order to pay the debt service for the General Obligation Bonds. The total government - wide net position as of June 30, 2018, is $461 million. Charges for services consist of interest earnings on loans to projects which increased during the current year by $249 thousand. Loans receivable had a net increase of $9 million during the current year and loans that are repaying have a nominal interest rate. Intergovernmental activity consists of $19.3 million mineral severance tax revenue and $46 million excess lottery revenue, both appropriated from the State. The mineral severance tax revenue was received from the State s general fund into the Debt Service Fund to pay the general obligation bonds debt service payments required in fiscal year Excess lottery revenue represents the amount in the State s lottery fund in the State Treasury appropriated by the Legislature to the Council for loans, grants and other funding assistance, as well as payment of debt service on the 2014 Series bonds, issued to provide grants for the Chesapeake Bay and Greenbrier Watershed projects. Investment earnings consist of earnings on excess lottery revenue and earnings on repayments of principal and interest on loans to projects. Investment earnings also include earnings on committed but not yet disbursed excess lottery proceeds and earnings on mineral severance tax revenue that is invested prior to payment of debt service on the general obligation bonds. Subsequent to the payment of debt service, any residual mineral severance tax revenue is transferred to the business type activity fund and then invested accordingly. Investment earnings increased $1.6 million from the prior year. Interest rates for the money market accounts increased during the fiscal year and a diversified portfolio consisting of US Treasury Notes and corporate bonds resulted in higher earnings. Interest on long-term debt decreased approximately $2.7 million. The decrease is the result of lower interest rates obtained from several bond refundings in recent years. (Continued) 7
106 WEST VIRGINIA INFRASTRUCTURE AND JOBS DEVELOPMENT COUNCIL MANAGEMENT S DISCUSSION AND ANALYSIS (Unaudited) FINANCIAL ANALYSIS OF THE COUNCIL AS A WHOLE (Continued) Infrastructure and economic development activity consists of grants paid to projects, binding commitments as well as the contributions for the required State match for the federally sponsored Drinking Water Treatment Revolving Fund and the Clean Water State Revolving Fund. The current year disbursement of State Matching funds was approximately $10.7 million consisting of $1.6 million allocated to the Drinking Water Treatment Revolving Fund and $9.1 million was allocated to the Clean Water State Revolving Fund, of which $5 million is applicable to fiscal year As of year-end, the Council has 15 binding commitments. These include 6 loans and 9 grants for which the funds are committed and not disbursed as described in Note 16 to the financial statements. Loss on uncollectible loans increased $9.2 million due to an allowance for two Economic Development loans that have forgivable features and it is more likely than not that certain crietria will be met in future years to permit the write off of those two loans. BUDGETARY HIGHLIGHTS West Virginia Code a (Section 18a) created within the State s lottery fund in the State Treasury an excess lottery revenue fund from which moneys are disbursed in specific allocations to various State accounts, including the Council. Section 18a and related subsections of the West Virginia Code provide for certain deposits to accounts available to the Council for debt service payments and to fund water, wastewater, and economic development projects. Deposits for debt service payments are to be made during each fiscal year in the amount of $6 million. For the year ended June 30, 2018, deposits of $40 million were made for water, wastewater, and economic development projects, with no more than 20% of the funds deposited to be spent on grants. For the year ended June 30, 2019, $40 million is to be deposited for projects and includes the stipulation that no more than 20% of the funds deposited may be spend for grants. Section 18a also includes language establishing the priority of deposits for these purposes and prescribes the timing of the deposits. In accordance to Senate Bill 1013, $46 million was appropriated to the West Virginia Infrastructure Council during fiscal year 2018 with the first $6 million to be used for debt service on the Series 2014 bonds that were issued for the Chesapeake Bay and Greenbrier Watershed projects and the remaining $40 million to be used for water, wastewater and economic development projects around the state. DEBT ADMINISTRATION The Infrastructure General Obligation Bonds and Refunding Bonds constitute a direct and general obligation of the State, and the full faith and credit of the State is pledged to secure the payment of the principal and interest on such bonds. The debt service on such general obligation bonds is paid from the dedication of mineral severance taxes in the State s general fund. The West Virginia Water Development Authority (the Authority) is authorized to issue, on behalf of the Council, infrastructure and refunding bonds, which do not constitute a debt or pledge of the faith and credit of the State, for the purpose of providing funds to enable the Council to finance the acquisition or construction of water, wastewater and infrastructure projects. The debt service on such infrastructure bonds are paid from repayments of principal and interest on a set of defined loans previously made by the Authority on behalf of the Council. (Continued) 8
107 WEST VIRGINIA INFRASTRUCTURE AND JOBS DEVELOPMENT COUNCIL MANAGEMENT S DISCUSSION AND ANALYSIS (Unaudited) DEBT ADMINISTRATION (Continued) At year-end, $323 million (prior to amortization) in general obligation, revenue and refunding bonds issued for the benefit of the Council were outstanding versus $341 million in the prior year, a decrease of 5% resulting from scheduled principal payments and the offset by current year accreted interest on capital appreciation bonds. For more information on long-term debt, please refer to Note 9 of the financial statements. As of June 30, 2018, the State of West Virginia, Infrastructure General Obligation Bonds Series 1996A had a Standard & Poor s rating of AA-. The State of West Virginia Infrastructure General Obligation Refunding Bonds Series 2011A, Series 2015A, Series 2015B and Series 2017 had a Standard & Poor s rating of AA-. The bond insurer, National Public Finance Guarantee Corporation, had a rating by Standard & Poor s of A. As of June 30, 2018, the West Virginia Water Development Authority, Infrastructure Revenue Refunding Bonds Series 2012A and Series 2016A had a Moody s rating of A1 and a Fitch rating of A+. As of June 30, 2018, the West Virginia Water Development Authority, Infrastructure Excess Lottery Revenue Bonds Series 2014A had a rating by Standard & Poor s of AAA. The ratings, or lack thereof, of the bond insurers did not result in any event of default and does not affect the fixed interest rates paid on its bonds issued on its behalf by the Authority. Any downward revision or withdrawal of any such rating could have an adverse effect on the secondary market price of the bonds issued on its behalf by the Authority. The outstanding revenue bonds, except for Series 2011 which was issued with a rating of AA, by Standard & Poor s, were originally issued with a rating of AAA by Standard & Poor s on the understanding that the standard insurance policy purchased guaranteed the timely payment of principal and interest on the bonds. There is no assurance that a particular rating will continue for any given period of time or that it will not be lowered or withdrawn entirely if, in the judgment of Standard & Poor s, circumstances so warrant. The Authority s (and thereby, the Council s bonds) underlying rating of AA- from Standard & Poor s reflects the State s moral obligation, which is one full category below the State s A rating. Ultimately, rating strength is provided by the pledge to maintain a debt service reserve fund equal to the maximum annual debt service on all outstanding bonds and servicing of underlying loans. If the amount in the reserve funds falls below the required maximum annual debt service level, the Governor, on notification by the Authority, may request the State s Legislature to appropriate the necessary funds to replenish the reserve to its required level. The State s Legislature, however, is not legally required to make such appropriation. The Council continues to monitor the status of the bond insurers and is considering options for issuance of future bonds without an insurance policy. FACTORS WHICH MAY AFFECT THE COUNCIL Currently known facts, decisions or conditions that are expected to have a significant effect on financial position or results of operations (revenues, expenses, and other changes in fund balance and net position) include several factors. (Continued) 9
108 WEST VIRGINIA INFRASTRUCTURE AND JOBS DEVELOPMENT COUNCIL MANAGEMENT S DISCUSSION AND ANALYSIS (Unaudited) FACTORS WHICH MAY AFFECT THE COUNCIL (Continued) The Legislature appropriated to the Council $46 million for fiscal year 2019 from the excess lottery revenue fund. This amount is contingent on revenue collected from state video lottery operations meeting expected projections; therefore, the Council may receive up to $40 million to provide additional loans, grants and other funding assistance and an additional $6 million restricted for debt service on bonds issued to fund Chesapeake Bay and Greenbrier Watershed projects. There are several other factors which are unknown that may affect the Council. These factors include changes in existing legislation and regulations, amounts collected in the excess lottery fund, market conditions that could impact investment income or affect the viability of issuing additional revenue bonds, and economic conditions that may affect the repayment of Council loans. Due to the uncertainty on the future repayment of these loans, as well as other economic development project loans, the Council maintains a reserve for uncollectible economic development project loans to recognize current events. CONTACTING THE COUNCIL S MANAGEMENT This financial report is designed to provide a general overview of the Council s finances and to show the Council s accountability for the money it receives. If you have questions about this report or need additional financial information, contact the Executive Director or Chief Financial Officer, West Virginia Water Development Authority, 1009 Bullitt Street, Charleston, West Virginia (Phone: ) or the Executive Director, West Virginia Infrastructure and Jobs Development Council, 1009 Bullitt Street, Charleston, West Virginia (Phone: ). 10
109 WEST VIRGINIA INFRASTRUCTURE AND JOBS DEVELOPMENT COUNCIL STATEMENT OF NET POSITION Year Ended June 30, 2018 Governmental Business Type Activities Activities Total ASSETS Cash equivalents (Note 7) $ 24 $ 143,343,746 $ 143,343,770 Investments (Notes 7 and 8) - 95,922,505 95,922,505 Accrued interest receivable - 2,471,844 2,471,844 Loans receivable, net of allowances of $23,663, ,197, ,197,623 Miscellaneous receivable - 17,241 17,241 Total assets $ 24 $ 809,952,959 $ 809,952,983 DEFERRED OUTFLOWS OF RESOURCES Losses on bond refundings $ 5,493,428 $ 983,593 $ 6,477,021 Deferred outflows of resources from OPEB (Note 12) - 3,345 3,345 Deferred outflows of resources from pensions (Note 11) - 33,088 33,088 $ 5,493,428 $ 1,020,026 $ 6,513,454 LIABILITIES Accounts payable $ - $ 10,929 $ 10,929 Due to other State of West Virginia agencies (Note 10) - 210, ,486 Accrued interest payable 715,690 2,714,800 3,430,490 Net OPEB liability (Note 12) - 50,460 50,460 Net pension liability (Note 11) - 55,576 55,576 General obligation bonds (Note 9) Due within one year, net of unamortized premium of $1,593,873 18,073,873-18,073,873 Due after one year, net of unamortized premium of $11,234, ,024, ,024,045 Revenue bonds (Note 9) Due within one year, net of unamortized premium of $835,085-6,350,085 6,350,085 Due after one year, net of unamortized premium of $14,765, ,045, ,045,056 Total liabilities $ 173,813,608 $ 181,437,392 $ 355,251,000 DEFERRED INFLOWS OF RESOURCES Deferrend inflows of resources from OPEB (Note 12) $ - $ 19,343 $ 19,343 Deferrend inflows of resources from pensions (Note 11) - 30,952 30,952 NET POSITION $ - $ 50,295 $ 50,295 Net position: Restricted (Note 15) $ 24 $ 621,723,250 $ 621,723,274 Unrestricted (deficit) (168,320,180) 7,762,048 (160,558,132) Total net position $ (168,320,156) $ 629,485,298 $ 461,165,142 The accompanying notes are an integral part of these financial statements. 11
110 WEST VIRGINIA INFRASTRUCTURE AND JOBS DEVELOPMENT COUNCIL STATEMENT OF ACTIVITIES Year Ended June 30, 2018 Net (Expenses) Revenue and Changes in Net Position Program Governmental Business-Type Functions/Programs Expenses Revenue Activities Activities Total Governmental activities: Interest and bond issuance costs on long-term debt $ 6,884,193 $ - $ (6,884,193) $ - $ (6,884,193) Business-type activities: Infrastructure and jobs development 37,585,499 3,344,075 - (34,241,424) (34,241,424) Total primary government $ 44,469,692 $ 3,344,075 $ (6,884,193) $ (34,241,424) $ (41,125,617) General revenues: Intergovernmental (Note 10) $ 19,338,488 $ 46,000,000 $ 65,338,488 Other - 5,732 5,732 Investment earnings 72,455 2,598,700 2,671,155 Transfers in (out) (33,730) 33,730 - Total general revenues and transfers 19,377,213 48,638,162 68,015,375 Change in net position 12,493,020 14,396,738 26,889,758 Net position, beginning of year (180,813,176) 615,158, ,345,444 Cumulative effect of change in accounting principle (Note 5) - (70,060) (70,060) Net position, beginning of year as restated (180,813,176) 615,088, ,275,384 Net position, end of year $ (168,320,156) $ 629,485,298 $ 461,165,142 The accompanying notes are an integral part of these financial statements. 12
111 WEST VIRGINIA INFRASTRUCTURE AND JOBS DEVELOPMENT COUNCIL BALANCE SHEET - GOVERNMENTAL FUND June 30, 2018 Debt Service Fund ASSETS Cash $ 24 FUND BALANCE Restricted fund balance $ 24 The accompanying notes are an integral part of these financial statements. 13
112 WEST VIRGINIA INFRASTRUCTURE AND JOBS DEVELOPMENT COUNCIL STATEMENT OF REVENUES, EXPENDITURES, AND CHANGES IN FUND BALANCE - GOVERNMENTAL FUND Year Ended June 30, 2018 Debt Service Fund REVENUES: Intergovernmental (Note 10) $ 19,338,488 Investment earnings 72,455 Total revenues 19,410,943 EXPENDITURES: Debt service: Principal 14,905,000 Interest 4,472,312 Total expenditures 19,377,312 OTHER FINANCING SOURCES (USES): Transfers out (33,730) Total other financing uses (33,730) Net change in fund balance (99) FUND BALANCE, beginning 123 FUND BALANCE, ending $ 24 The accompanying notes are an integral part of these financial statements. 14
113 WEST VIRGINIA INFRASTRUCTURE AND JOBS DEVELOPMENT COUNCIL STATEMENT OF NET POSITION - PROPRIETARY FUND Year Ended June 30, 2018 Enterprise Fund ASSETS CURRENT ASSETS Cash equivalents $ 143,343,746 Investments (Notes 7 and 8) 95,922,505 Current portion of loans receivable 22,789,981 Accrued interest receivable 2,471,844 Miscellaneous receivable 17,241 Total current assets 264,545,317 NONCURRENT ASSETS Loans receivable, net of allowances of $23,663, ,407,642 Total noncurrent assets 545,407,642 Total assets $ 809,952,959 DEFERRED OUTFLOWS OF RESOURCES Deferred outflows of resources from OPEB (Note 12) $ 3,345 Deferred outflows of resources from pensions (Note 11) 33,088 Loss on bond refundings $ 983,593 1,020,026 LIABILITIES CURRENT LIABILITIES Accounts payable $ 10,929 Due to other State of West Virginia agencies (Note 10) 210,486 Accrued interest payable 2,714,800 Current portion of revenue bonds payable, net of unamortized premium of $835,085 (Note 9) 6,350,085 Total current liabilities 9,286,300 NONCURRENT LIABILITIES Net OPEB liability (Note 12) 50,460 Net pension liability (Note 11) 55,576 Noncurrent portion of revenue bonds payable, net of unamortized premium of $14,765,056 (Note 9) 172,045,056 Total liabilities $ 181,437,392 DEFERRED INFLOWS OF RESOURCES Deferred inflows of resources from OPEB (Note 12) $ 19,343 Deferred inflows of resources from pensions (Note 11) $ 30,952 50,295 NET POSITION Restricted (Note 15) $ 621,723,250 Unrestricted 7,762,048 Total net position $ 629,485,298 The accompanying notes are an integral part of these financial statements. 15
114 WEST VIRGINIA INFRASTRUCTURE AND JOBS DEVELOPMENT COUNCIL STATEMENT OF REVENUES, EXPENSES, AND CHANGES IN FUND NET POSITION - PROPRIETARY FUND Year Ended June 30, 2018 Enterprise Fund INTEREST CHARGES FOR SERVICES $ 3,344,075 OPERATING EXPENSES Infrastructure and economic development 20,285,164 Provisions for uncollectible loans 9,753,754 General and administrative (Note 13) 802,289 Total operating expenses 30,841,207 Operating loss (27,497,132) NONOPERATING REVENUES (EXPENSES) Miscellaneous income 5,732 Intergovernmental (Note 10) 46,000,000 Investment earnings, net 2,598,700 Interest on bonds (6,744,292) Total nonoperating revenues, net 41,860,140 Transfers in 33,730 Change in net position 14,396,738 NET POSITION, beginning 615,158,620 Cumulative effect of change in accounting principle (Note 5) (70,060) NET POSITION, beginning as restated 615,088,560 NET POSITION, ending $ 629,485,298 The accompanying notes are an integral part of these financial statements. 16
115 WEST VIRGINIA INFRASTRUCTURE AND JOBS DEVELOPMENT COUNCIL STATEMENT OF CASH FLOWS - PROPRIETARY FUND Year Ended June 30, 2018 Enterprise Fund OPERATING ACTIVITIES Receipts of principal on loans $ 20,979,571 Receipts of interest on loans 3,212,343 Disbursements of loans (39,858,974) Disbursements of grants (20,285,164) Disbursements of general and administrative expenses (310,198) Disbursements on behalf of employees (317,135) Net cash used in operations (36,579,557) NONCAPITAL FINANCING ACTIVITIES Transfers 33,730 Proceeds from sale of assets held by others 5,732 Excess lottery and other appropriations 46,000,000 Principal paid on revenue bonds (6,060,000) Interest paid on revenue bonds (7,580,124) Net cash provided by noncapital financing activities 32,399,338 INVESTING ACTIVITIES Purchase of investments (271,550,526) Proceeds from sale of investments 275,936,534 Investment earnings 2,300,261 Net cash provided by investing activities 6,686,269 Net increase in cash and cash equivalents 2,506,050 CASH AND CASH EQUIVALENTS, beginning 140,837,696 CASH AND CASH EQUIVALENTS, ending $ 143,343,746 Reconciliation of operating loss to net cash used in operating activities: Operating loss $ (27,497,132) Adjustment to reconcile operating loss to net cash used in operating activities: Provision for loan losses 9,753,754 Pension expense (19,274) OPEB expense 2,925 Noncash OPEB contribution support (3,182) Changes in operating accounts: Due to other agencies 42,778 Assets held by others 206,000 Loans receivable (18,879,403) Miscellaneous receivables 218 Accrued interest receivable (131,950) Accounts payable (24,559) Deferred outflows of resources due to pension contributions (26,387) Deferred outflows of resources due to OPEB contributions (3,345) Net cash used in operating activities $ (36,579,557) The accompanying notes are an integral part of these financial statements. 17
116 WEST VIRGINIA INFRASTRUCTURE AND JOBS DEVELOPMENT COUNCIL NOTES TO FINANCIAL STATEMENTS June 30, 2018 Note 1. Reporting Entity The West Virginia Infrastructure and Jobs Development Council (the Council) was created as a governmental entity of the State of West Virginia (the State) under the provisions of Chapter 31, Article 15A, Section 3 of the Code of West Virginia, 1931, as amended, and known as the West Virginia Infrastructure and Jobs Development Act (the Act). The Council has statutory responsibility to review the preliminary applications for wastewater facilities, water facilities or combination projects, or infrastructure projects seeking State funding and to either make a written recommendation as to the infrastructure project financing, in terms of the kind, amount and source of funding, which the project sponsor should pursue and which the State infrastructure agency or agencies should consider an appropriate investment of public funds, or a determination that the project or infrastructure project is not eligible for funding assistance from any State infrastructure agency or the project or infrastructure project is not otherwise an appropriate or prudent investment of State funds, and make a recommendation that the project sponsor not seek funding from any State infrastructure agency. The Council consists of thirteen voting members, including the Governor or their designee as chairman and executive representation from the Housing Development Fund, Department of Environmental Protection, Economic Development Authority, Water Development Authority (the Authority), Bureau for Public Health, Public Service Commission and six members representing the general public. The Authority serves as the administrative agency for the Council, is the fiduciary agent of the West Virginia Infrastructure Fund and is authorized to issue infrastructure revenue and refunding bonds on behalf of the Council. As the state is able to impose its will over the Council, the Council is included in the State s comprehensive annual financial report as an enterprise fund. Note 2. Government-Wide and Fund Financial Statements The government-wide financial statements (i.e., the statement of net position and the statement of activities) report information on all of the non-fiduciary activities of the government. The effect of inter-fund activity has been eliminated from these statements. Governmental activities, which normally are supported by taxes and intergovernmental revenues, are reported separately from business-type activities, which rely to a significant extent on fees and charges for support. Separate financial statements are provided for the governmental fund and the enterprise fund, which are reported as separate columns in the government-wide financial statements. Note 3. Measurement Focus, Basis of Accounting, and Financial Statement Presentation The government-wide financial statements are reported using the economic resources measurement focus and the accrual basis of accounting, as are the proprietary fund financial statements. Revenues are recorded when earned and expenses are recorded when a liability is incurred regardless of the timing of related cash flows. (Continued) 18
117 WEST VIRGINIA INFRASTRUCTURE AND JOBS DEVELOPMENT COUNCIL NOTES TO FINANCIAL STATEMENTS June 30, 2018 Note 3. Measurement Focus, Basis of Accounting, and Financial Statement Presentation (Continued) Governmental fund financial statements are reported using the current financial resources measurement focus and the modified accrual basis of accounting. Revenues are recognized as soon as they are both measurable and available. Revenues are considered to be available when they are collectible within the current period or soon enough thereafter to pay liabilities of the current period. The government reports the following major governmental fund: The Debt Service Fund accounts for the accumulation of resources for, and the payment of, principal and interest on long term debt. The government reports the following major proprietary fund: The Enterprise Fund accounts for the operations of certain lending activities that are financed with debt, which is secured by a pledge of fees and charges for that activity. In addition, a grant program for watershed improvements was funded with proceeds of a bond issue. The debt service on the bond issue is to be paid from annual appropriations of funds from an external revenue source. The effect of interfund activity has been eliminated from the government-wide financial statements. Proprietary funds distinguish operating revenues and expenses from nonoperating items. Operating revenues and expenses generally result from providing services and producing and delivering goods in connection with a proprietary fund s principal ongoing operations. The principal operating revenues of the proprietary fund are interest on loans receivable. Operating expenses for the proprietary fund includes the cost of services and administrative expenses. All revenues and expenses not meeting this definition are reported as nonoperating revenues and expenses. Note 4. Significant Accounting Policies Budgetary accounting Except for excess lottery revenue appropriated to the enterprise fund for expenditure and mineral severance taxes appropriated to the debt service fund for debt service, the Council s funds are not subject to the Legislative budget process. Cash equivalents Cash equivalents include investments with original maturities of less than ninety days. Investments All investments are reported in accordance with generally accepted accounting principles (GAAP) and are carried at either cost, amortized cost, contract value, or fair value as applicable. (Continued) 19
118 WEST VIRGINIA INFRASTRUCTURE AND JOBS DEVELOPMENT COUNCIL NOTES TO FINANCIAL STATEMENTS June 30, 2018 Note 4. Significant Accounting Policies (Continued) Allowance for uncollectible loans The Council uses the allowance method of providing for loan losses on economic development project loans. The provision for loan losses charged to operating expense is based on factors which deserve current recognition in estimating possible losses, such as growth and composition of the loan portfolio, relationship of the allowance for uncollectible loans to outstanding loans, current financial condition of the borrowers, changes in specific industries, and overall economic conditions. Because of uncertainties in the estimation process, including local and industry economic conditions, as well as collateral values, it is reasonably possible that management s estimate of losses in the loan portfolio for economic development projects and the related allowance may materially change in the near term. The amount of the change that is reasonably possible, however, cannot be estimated. The Council has not established an allowance for uncollectible loans in its loan portfolio for water and wastewater projects because of remedies available to it in the loan agreements that exist between the Authority on behalf of the Council and the various entities to which the loans were made. Inter-fund transactions During the normal course of Council operations, transfers of resources to provide services take place between funds. Inter-fund transactions are recorded as transfers as determined by Council management. Bond premiums, discounts and issuance costs Bond premiums and discounts are amortized using the straight-line method over the varying terms of the bonds issued. The straight-line method is not in accordance with GAAP, but the difference in amortization using the straight-line method, versus the effective interest method which is in accordance with GAAP, is not material to the financial statements as a whole. Bond issuance costs are expensed as incurred. Deferred outflows of resources / deferred inflows of resources The statement of net position reports a separate financial statement element called deferred outflows of resources. This financial statement element represents a consumption of net position that applies to a future period and so will not be recognized as an outflow of resources (expense) until that time. The council reports losses on bond refundings, certain pension amounts, and certain OPEB amounts as deferred outflows of resources on the statement of net position. The statement of net position reports a separate financial statement element called deferred inflows of resources. This financial statement element represents an acquisition of net position that applies to a future period and so will not be recognized as an inflow of resources (revenue) until that time. The Council reports deferred inflows of resources related to gains on bond refundings, pensions, and OPEB on the statement of net position. (Continued) 20
119 WEST VIRGINIA INFRASTRUCTURE AND JOBS DEVELOPMENT COUNCIL NOTES TO FINANCIAL STATEMENTS June 30, 2018 Note 4. Significant Accounting Policies (Continued) Pension For purposes of measuring the net pension liability, deferred outflows of resources and inflows of resources related to pensions, and pension expense, information about the fiduciary net position of the West Virginia Public Employees Retirement System (PERS) and additions to/deductions from PERS fiduciary net position have been determined on the same basis as they are reported by PERS. For this purpose, benefit payments (including refunds of employee contributions) are recognized when due and payable in accordance with the benefit terms. Investments in the PERS are reported at fair value. Postemployment benefits other than pensions (OPEB) For purposes of measuring the net OPEB liability, deferred outflows of resources and deferred inflows of resources related to OPEB, and OPEB expense, information about the fiduciary net position of the West Virginia Retiree Health Benefit Trust OPEB Plan (RHBT) and additions to/deductions from RHBT's fiduciary net position have been determined on the same basis as they are reported by RHBT. For this purpose, RHBT recognizes benefit payments when due and payable in accordance with the benefit terms. Investments are reported at fair value, except for certain pooled investments, money market investments and participating interest-earning investment contracts that have a maturity at the time of purchase of one year or less, which are reported at amortized cost. Arbitrage rebate payable The United States Internal Revenue Code of 1986, as amended (the Code ), prescribes restrictions applicable to the Council as issuer of Infrastructure Fund Revenue and Refunding Bonds. Among those include restrictions on earnings on the bond proceeds. The Code requires payment to the federal government of investment earnings on certain bond proceeds in excess of the amount that would have been earned if the proceeds were invested at a rate equal to the yield on the bonds. As of June 30, 2018, the Council is not liable to the federal government as a result of arbitrage. Fund balances In the governmental fund financial statements, fund balance has been reported as restricted. Restricted fund balances represent fund balances which are restricted by constraints placed on its use of resources by either: (1) externally imposed creditors, grantors, contributors, or laws or regulations of other governments or (2) imposed by law through constitutional provisions and enabling legislation. The Council s governmental fund is restricted by enabling legislation. Net position Net position is presented as restricted or unrestricted. Restricted net position represents assets restricted for the repayment of bond proceeds or by bond covenants. When an expense is incurred for purposes for which both restricted and unrestricted net position is available, restricted resources are applied first. 21
120 WEST VIRGINIA INFRASTRUCTURE AND JOBS DEVELOPMENT COUNCIL NOTES TO FINANCIAL STATEMENTS June 30, 2018 Note 5. Cumulative Effect of Adoption of Accounting Principle Effective July 1, 2017, the Council adopted the provisions of Governmental Accounting Standards Board (GASB) Statement No. 75, Accounting and Financial Reporting for Postemployment Benefits other than Pensions. The Council determined that it was not practical to restate all periods presented and has recorded the cumulative effect of the decrease to beginning net position of implementing this change of $70,060 as of July 1, 2017, which is the net OPEB liability of $74,275 less deferred outflows of resources related to OPEB contributions of $4,215 as of that date. The Council further determined that it was not practical to determine the amounts of all deferred inflows of resources and deferred outflows of resources related to OPEB as of July 1, 2017 and these amounts are not reported. Note 6. Reconciliation of Government-Wide and Fund Financial Statements Amounts reported in the statement of net position differ from the governmental fund balance sheet because of the following: Total fund balance on governmental fund balance sheet $ 24 Under the current financial resources measurement focus and modified accrual basis of accounting, liabilities related to debt service are not recorded until due and are not included in the governmental funds balance sheet: Deferred outflows of resources 5,493,428 General obligation bonds (173,097,918) Accrued interest on general obligation bonds (715,690) Net position (deficit) of governmental activities $ (168,320,156) Amounts reported in the statement of activities differ from the statement of revenues, expenditures, and changes in fund balance - governmental fund because of the following: Net change in fund balance - governmental fund $ (99) Principal debt payments recorded on the modified accrual basis of accounting are not recorded in the governmental activities 14,905,000 Accretion of interest related to capital appreciation bonds is an expense of the governmental activities (2,411,881) Change in net position of governmental activities $ 12,493,020 22
121 WEST VIRGINIA INFRASTRUCTURE AND JOBS DEVELOPMENT COUNCIL NOTES TO FINANCIAL STATEMENTS June 30, 2018 Note 7. Deposit and Investment Risk Disclosures The Authority, as fiscal agent for the Council, adopted and adheres to investment guidelines for the Council. Those guidelines and the General Revenue Bond Resolution authorize the Council to invest all bond proceeds and other revenues in obligations of the United States and certain of its agencies, certificates of deposit, public housing bonds, direct and general obligations of states which are rated in either of the two highest categories by Standard & Poor s Corporation, advance-refunded municipal bonds and repurchase agreements relating to certain securities. With the exception of deposits and investments of the General Obligation Debt Service Fund, investments are managed by the financial institution serving as trustee for the Council. As required by West Virginia Code, the mineral severance tax revenue appropriated annually for debt service on the general obligation bonds is deposited in the General Obligation Debt Service Fund held by the Treasurer of the State of West Virginia and is invested in accordance with the Act and in conformity with investment guidelines of the Board of Treasury Investments (BTI). The Council s Debt Service Fund, which is included in the General Obligation Debt Service Fund s cash balances, reports a carrying amount of $24 at June 30, Interest rate risk - West Virginia Money Market Pool Interest rate risk is the risk that changes in interest rates will adversely affect the fair value of an investment. The West Virginia Money Market Pool is subject to interest rate risk. The overall weighted average maturity of the investments of the West Virginia Money Market Pool cannot exceed 60 days. Maximum maturity of individual securities cannot exceed 397 days from date of purchase, except for government floating rate notes, which can be up to 762 days. The following table provides information on the weighted average maturities for the various asset types in the WV Money Market Pool: Security Type Carrying Value (In Thousands) WAM (Days) Repurchase agreements $ 227,800 3 U.S. Treasury notes 90, U.S. Treasury bills 252, Commercial paper 1,868, Negotiable certificates of deposit 663, Corporate bonds and notes 18, Money market funds 143,067 3 $ 3,264, (Continued) 23
122 WEST VIRGINIA INFRASTRUCTURE AND JOBS DEVELOPMENT COUNCIL NOTES TO FINANCIAL STATEMENTS June 30, 2018 Note 7. Deposit and Investment Risk Disclosures (Continued) Interest rate risk - all other investments As of June 30, 2018, the Council had the following investments and maturities: Investment Type Investment Maturities (in Years) Carrying Value Less than U.S. Treasury obligations (carried at fair value) $ 87,023,050 $ 74,686,100 $ 12,336,950 Corporate bonds (carried at fair value) 8,899,455 1,492,185 7,407,270 Money markets (carried at amortized cost) 143,343, ,343,746 - $239,266,251 $219,522,031 $19,744,220 As a means of limiting its exposure to carrying value losses arising from rising interest rates, the Authority s investment guidelines for the Council limit the maturities of investments not matched to a specific debt or obligation of the Council to five years or less, unless otherwise approved by the Authority. Investments matched to obligations of the Council would include investments of reserve funds for each of the Authority s outstanding revenue and refunding bond issues. The General Revenue Bond Resolution requires that, while the bonds are outstanding, there be on deposit in the reserve funds an amount equal to the maximum amount of principal installments and interest coming due during the current or any succeeding year. The Council has both the intent and the ability to hold long-term securities until final maturity and thus is limited in its exposure to interest rate risk on these long-term obligations. Concentration of credit risk - West Virginia Money Market Pool Concentration of credit risk is the risk of loss attributed to the magnitude of an investment in a single corporate issuer. The BTI investment policy prohibits the West Virginia Money Market Pool from investing more than 5% of their assets in any one corporate name or one corporate issue. The West Virginia Money Market Pool is not exposed to concentration of credit risk. Concentration of credit risk - all other investments The Authority s investment guidelines for the Council manage concentration of credit risk by limiting its investment activity so that at any time its total investment portfolio will not exceed the percentage limits as to the permitted investments. The enterprise fund investment portfolio s percentage of permitted investments is shown below: (Continued) 24
123 WEST VIRGINIA INFRASTRUCTURE AND JOBS DEVELOPMENT COUNCIL NOTES TO FINANCIAL STATEMENTS June 30, 2018 Note 7. Deposit and Investment Risk Disclosures (Continued) Maximum Enterprise Fund Percentage Percentage as of Permitted Investments of Portfolio June 30, 2018 (a) Direct Federal Obligations 100% 36.37% (b) Federally Guaranteed Obligations 100% - (c) Federal Agency Obligations 90% - (d) Money Markets 90% 59.91% (e) Repurchase Agreements/Investment Contracts 90% - (f) Time Deposits/Certificates of Deposit 90% - (g) Demand Deposits 30% - (h) Corporate Obligations 15% 3.72% (i) Other State/Local Obligations 15% - (j) West Virginia Obligations 15% - (k) Housing Bonds Secured by Annual Contributions Contracts 5% - With the exception of money market funds, repurchase agreements/investment contracts, time deposits/certificates of deposit and demand deposits, investments that comprise more than 15% of the investment portfolio must be direct federal, federal agency or federally guaranteed obligations. All other investments listed above that comprise more than 15% of the investment portfolio must be either provided by an institution with a rating of at least A/A by Moody s and/or Standard and Poor s, invested in a money market fund rated AAAm or AAAm-G or better by Standard and Poor s, secured by obligations of the United States or not exceed the insurance limits established by the FDIC unless adequate collateral is provided. Credit risk - West Virginia Money Market Pool Credit risk is the risk that an issuer or other counterparty to an investment will not fulfill its obligations. The WV Money Market Pool has been rated AAAm by the Standard & Poor s. A fund rated AAAm has extremely strong capacity to maintain principal stability and to limit exposure to principal losses due to credit, market and/or liquidity risks. AAAm is the highest principal stability fund rating assigned by Standard & Poor s. The BTI itself has not been rated for credit risk by any organization. The BTI limits the exposure to credit risk in the WV Money Market Pool by requiring all corporate bonds to be rated A+ by Standard & Poor s (or its equivalent) or higher. Short-term corporate debt must be rated at least A-1 by Standard & Poor s and P-1 by Moody s. The pool must have at least 15% of its assets in U.S. Treasury obligations or obligations guaranteed as to repayment of interest and principal by the United States of America. The following table provides information on the credit ratings of the WV Money Market Pool s investments (in thousands): (Continued) 25
124 WEST VIRGINIA INFRASTRUCTURE AND JOBS DEVELOPMENT COUNCIL NOTES TO FINANCIAL STATEMENTS June 30, 2018 Note 7. Deposit and Investment Risk Disclosures (Continued) Credit Rating Security Type Moody s S&P Carrying Value Percent of Pool Assets Commercial paper P-1 A-1+ $ 473, % P-1 A-1 1,351, P-2 A-1 44, Corporate bonds and notes P-1 A-1 18, U.S. Treasury notes * Aaa AA+ 90, U.S. Treasury bills * P-1 A , Negotiable certificates of deposit P-1 A , P-1 A-1 458, Money market funds Aaa AAAm 143, Repurchase agreements (underlying securities): U.S. agency bonds and notes Aaa AA+ 227, $ 3,264, % *U.S. Treasury issues are explicitly guaranteed by the United States government and are not considered to have credit risk. Credit risk - all other investments The table below provides information on the credit ratings of the Council s cash equivalents and investments: Standard & Security Type Moody's Poors Carrying Value Money markets Aaa-mf AAAm $ 143,343,746 U.S. Treasury Obligations P-1 A-1+ 87,023,050 Corporate Bonds P-1 A-1+ 8,899,455 West Virginia Money Market Pool - AAAm 24 $ 239,266,275 *US Treasury issues are explicitly guaranteed by the United States government and are not subject to credit risk. (Continued) 26
125 WEST VIRGINIA INFRASTRUCTURE AND JOBS DEVELOPMENT COUNCIL NOTES TO FINANCIAL STATEMENTS June 30, 2018 Note 7. Deposit and Investment Risk Disclosures (Continued) Credit risk with investment of bond proceeds is managed by the limitation on investment of those proceeds in the following types of debt securities in accordance with the Authority s investment guidelines for the Council and the authorizing General Revenue Bond Resolution: Government obligations, obligations of certain federal agencies, either representing the full faith and credit of the United States of America or which are rated Aaa-mf by Moody s and AAAm by Standard and Poor s, certain types of commercial paper, advance-refunded municipal bonds, certain general obligations of the State of West Virginia or any other state, or other forms of investments approved in writing by the applicable bond insurer, if any. Accordingly, the credit risk with the investment of cash assets other than bond proceeds, known as other revenues, is managed by the limitation on investment of other revenues in the following types of debt securities in accordance with the Authority s investment guidelines for the Council: direct obligations of or obligations guaranteed by the United States of America, the State of West Virginia or any other state, provided that obligations of other states meet certain requirements, obligations of certain federal agencies, certain types of indebtedness of public agencies or municipalities, corporate indebtedness meeting certain requirements or any other debt security investment permitted with bond proceeds. Custodial credit risk - West Virginia Money Market Pool For an investment, custodial credit risk is the risk that, in the event of the failure of the counterparty, the BTI will not be able to recover the value of its investments or collateral securities that are in the possession of an outside party. Repurchase agreements are required to be collateralized by at least 102% of their value, and the collateral is held in the name of the BTI. In all transactions, the BTI or its agent does not release cash or securities until the counterparty delivers its side of the transaction. Custodial credit risk - all other investments The Authority s investment guidelines for the Council put certain restrictions on repurchase agreements, including the following: the Council can only enter into repurchase agreements with financial institutions having a credit rating of at least A/A ; collateral is limited to direct federal, federally guaranteed or federal agency obligations; collateral is required to be delivered to a thirdparty custodian, the Council or the trustee; and, the financial institution must guarantee the aggregate market value of the collateral will equal or exceed the outstanding repurchase agreement by the margin specified in the respective repurchase agreement. As of June 30, 2018, the Council held no securities that were subject to custodial credit risk. Foreign currency risk - all investments Foreign currency risk is the risk that changes in exchange rates will adversely affect the fair value of an investment or a deposit. There are no securities that are subject to foreign currency risk. (Continued) 27
126 WEST VIRGINIA INFRASTRUCTURE AND JOBS DEVELOPMENT COUNCIL NOTES TO FINANCIAL STATEMENTS June 30, 2018 Note 7. Deposit and Investment Risk Disclosures (Continued) A reconciliation of investments as disclosed in this Note to the amounts reported on the Statement of Net Position - Proprietary Fund is as follows: As disclosed in this Note: Total investments $ 239,266,251 Less: cash equivalents (143,343,746) Carrying amount of investments $ 95,922,505 As reported on the Statement of Net Position - Proprietary Fund: Investments $ 95,922,505 Note 8. Investments Measured at Fair Value The Council measures the investments listed below at fair value for financial reporting purposes. GAAP defines fair value as the price that would be received to sell an asset or paid to transfer a liability in an orderly transaction between market participants at the measurement date. Fair value is a market-based measurement, not an entity-specific measurement. The Council categorizes fair value measurements within the fair value hierarchy established by GAAP. The fair value hierarchy categorizes the inputs to valuation techniques used to measure fair value into three levels as follows: Level 1 inputs - Quoted prices (unadjusted) for identical assets or liabilities in active markets that a government can access at the measurement date. Level 2 inputs - Other than quoted prices included within Level 1, these are inputs that are observable for an asset or liability, either directly or indirectly. Level 3 inputs - Unobservable inputs for an asset or liability. The fair value hierarchy gives the highest priority to Level 1 inputs and the lowest priority to Level 3 inputs. U.S. Treasury obligations and corporate bonds are reported at fair value, which is determined by a third-party pricing service based on an asset portfolio pricing models and other sources. The table below summarizes the recurring fair value measurements of the investment securities based on the fair value hierarchy as of June 30, Investment Type Level 1 Level 2 Level 3 Total U.S. Treasury obligations $ - $ 87,023,050 $ - $ 87,023,050 Corporate Bonds - 8,899,455-8,899,455 Total $ - $ 95,922,505 $ - $ 95,922,505 28
127 WEST VIRGINIA INFRASTRUCTURE AND JOBS DEVELOPMENT COUNCIL NOTES TO FINANCIAL STATEMENTS June 30, 2018 Note 9. Long-Term Debt The following is a summary of changes in long-term debt for the year ended June 30, 2018: Balance July 1, 2017 Additions/ Accretions Debt Reductions Balance June 30, 2018 Governmental fund type: General Obligation Bonds 1996 Series A & D $ 5,030,000 $ - $ 2,440,000 $ 2,590, Series A Capital Appreciation 66,204,908 3,430,081 7,075,000 62,559, Series A Refunding 3,420,000-1,650,000 1,770, Series A Refunding 65,965,000-2,300,000 63,665, Series B Refunding 2,910,000-1,440,000 1,470, Series Refunding 28,215, ,215, ,744,908 3,430,081 14,905, ,269,989 Proprietary fund type: Revenue and Refunding Bonds 2012 Series A Refunding 24,435, ,000 23,740, Series A 70,100,000-2,490,000 67,610, Series A Refunding 74,320,000-2,875,000 71,445, ,855,000-6,060, ,795,000 Total $ 340,599,908 $ 3,430,081 $ 20,965,000 $ 323,064,989 Debt service fund The proceeds from the Council s bond programs, which originated with a 1994 Constitutional Amendment authorizing the issuance of $300,000,000 in Infrastructure General Obligation Bonds, provide financial assistance to infrastructure and economic development projects throughout the state. All general obligation bonds are considered a moral obligation of the State of West Virginia. The source of repayment for the general obligation, capital appreciation, and refunding bonds is the annual receipt of $19.3 million of mineral severance tax revenue deposited into the Governmental Fund from the State s general fund. Principal, net of accretion, and interest paid on these bonds were $14,905,000 and $4,472,313, respectively for the year ended June 30, Future maturities of general obligation bonds and capital appreciation bonds, with interest rates ranging from 2.0% to 7.625% and maturing through 2027, are as follows: (Continued) 29
128 WEST VIRGINIA INFRASTRUCTURE AND JOBS DEVELOPMENT COUNCIL NOTES TO FINANCIAL STATEMENTS June 30, 2018 Note 9. Long-Term Debt (Continued) Principal Interest Total 2019 $ 9,455,000 $ 4,076,969 $ 13,531, ,685,000 3,687,475 13,372, ,020,000 3,290,925 13,310, ,420,000 2,809,900 13,229, ,955,000 2,282,975 13,237,975 50,535,000 16,148,244 66,683, ,175,000 4,138,775 51,313,775 $ 97,710,000 $ 20,287,019 $ 117,997,019 Capital Appreciation Bonds: Principal, net of amounts to be accreted in future years Amounts to be accreted in future years Total 2019 $ 6,898,611 $ 126,389 $ 7,025, ,976, ,991 8,575, ,598,827 1,026,173 8,625, ,280,957 1,444,043 8,725, ,876,696 1,823,304 8,700,000 36,631,100 5,018,900 41,650, ,928,889 11,571,111 37,500,000 Total capital appreciation bonds 62,559,989 $ 16,590,011 $ 79,150,000 Total general obligation bonds and capital appreciation bonds 160,269,989 Add: unamortized premium 12,827,929 Less: amount due within one year (18,073,873) Amount due after one year $ 155,024,045 (Continued) 30
129 WEST VIRGINIA INFRASTRUCTURE AND JOBS DEVELOPMENT COUNCIL NOTES TO FINANCIAL STATEMENTS June 30, 2018 Note 9. Long-Term Debt (Continued) Business type activity Future maturities of principal and interest of revenue and refunding bonds, with interest ranging from 2.0% to 5.0% and maturing through October 2045, are as follows: Principal Interest Total 2019 $ 5,515,000 $ 7,369,825 $ 12,884, ,735,000 7,134,050 12,869, ,985,000 6,873,925 12,858, ,255,000 6,584,325 12,839, ,565,000 6,266,150 12,831,150 30,055,000 34,228,275 64,283, ,975,000 26,328,569 63,303, ,255,000 16,969,713 61,224, ,270,000 6,682,675 41,952, ,660,000 1,998,156 14,658, ,580, ,000 3,810, ,740,000 52,209, ,949,113 Total revenue and refunding bonds 162,795,000 $ 86,437,388 $ 249,232,388 Add: unamortized premium 15,600,141 Less: amount due within one year (6,350,085) Amount due after one year $ 172,045,056 The $6,000,000 statutory allocation of revenues from the State Excess Lottery Revenue Fund to the Council will pay annual debt service on the 2014 Series A Bonds. West Virginia Code a prescribes the priority and timing of the deposits to the Council for debt service. The primary source of repayment for the remaining revenue and refunding bonds is the receipt of payments of principal and interest on a set of loans, known as defined loans, previously made to projects from general obligation and revenue bond proceeds. Repayments of principal and interest on the defined loans of $7,686,859 and $674,808 respectively were available for revenue bond debt service of $7,707,375, comprised of $3,570,000 for principal and $4,137,375 for interest, respectively for the year ended June 30, In prior years, certain general obligation bonds and revenue bonds were defeased by placing the proceeds of new bonds in irrevocable trusts to provide for all future debt service payments on the refunded bonds. Accordingly, the trust assets and the liability for the defeased bonds are not included in the Council s financial statements. At June 30, 2018, there were $678,600 in defeased general obligation bonds outstanding. 31
130 WEST VIRGINIA INFRASTRUCTURE AND JOBS DEVELOPMENT COUNCIL NOTES TO FINANCIAL STATEMENTS June 30, 2018 Note 10. Transactions with State of West Virginia Agencies The Council received $19.3 million of mineral severance tax revenue from the State s general fund into the Debt Service Fund to accommodate the general obligation bonds debt service payments required in fiscal year Funds remaining after the payment of general obligation bonds debt service have been transferred to the Enterprise Fund to provide additional lending and granting capacity, which is consistent with the Council s purpose. West Virginia Code a (Section 18a) created within the State s lottery fund in the State Treasury an excess lottery revenue fund from which moneys are disbursed in specific allocations to various State accounts, including the Council. In accordance to Senate Bill 1013, $46 million was appropriated to the West Virginia Infrastructure Council during fiscal year 2018 with the first $6 million to be used for debt service on the Series 2014 bonds that were issued for the Chesapeake Bay and Greenbrier Watershed projects and the remaining $40 million to be used for water, wastewater and economic development projects around the state. During the year ended June 30, 2018, the Council contributed $1,648,200 to the Bureau for Public Health for the required State match for the federally sponsored Drinking Water Treatment Revolving Fund to secure federal dollars and continue that program. The Council also contributed $9,137,600 ($5,004,000 applies to fiscal year 2019) to the Department of Environmental Protection for the required State match for the federally sponsored Clean Water State Revolving Fund to secure federal dollars and continue that program as well. The West Virginia Water Development Authority (the Authority) as the fiduciary agent of the Council, pays for certain expenses on behalf of the Council. As of June 30, 2018, the Council had incurred $802,289 of expenses of which $210,485 remains unpaid at June 30, Note 11. Pension Benefits Plan Description The Council contributes to the PERS, a cost-sharing multiple-employer defined benefit pension plan administered by the West Virginia Consolidated Public Retirement Board (CPRB). PERS covers substantially all employees of the State and its component units, as well as employees of participating non-state governmental entities who are not participants of another state or municipal system. Benefits under PERS include retirement, death and disability benefits, and have been established and may be amended by action of the State Legislature. The CPRB issues a publicly available financial report that includes financial statements for PERS that may be obtained at (Continued) 32
131 WEST VIRGINIA INFRASTRUCTURE AND JOBS DEVELOPMENT COUNCIL NOTES TO FINANCIAL STATEMENTS June 30, 2018 Note 11. Pension Benefits (Continued) Benefits Provided PERS provides retirement benefits as well as death and disability benefits. Qualification for normal retirement is age 60 with five years of service or at least age 55 with age and service equal to 80 or greater. A member may retire with the pension reduced actuarially if the member is at least 55 and has at least 10 years of contributory service, or at any age with 30 years of contributory service. For all employees hired on or after July 1, 2015, qualification for normal retirement is age 62 with 10 years of service. A member hired after July 1, 2015 may retire with the pension reduced actuarially if the member is between ages 60 and 62 with at least ten years of contributory service, between ages 57 and 62 with at least twenty years of contributory services, or between ages 55 and 62 with at least thirty years of contributory service. The straight-life annuity retirement benefit is equivalent to 2% of average salary multiplied by years of service. Average salary is the average of the highest annual compensation during any period of three consecutive years within the last fifteen years of earnings. For all employees hired on or after July 1, 2015, average salary is the average of the five consecutive highest annual earnings out of the last fifteen years of earnings. Terminated members with at least five years of contributory service who do not withdraw their accumulated contributions may elect to receive their retirement annuity beginning at age 62. For all employees hired on or after July 1, 2015, this age increases to 64 with at least ten years of contributory service, or age 63 with at least twenty years of contributory service. Contributions Although contributions are not actuarially determined, actuarial valuations are performed to assist the Legislature in establishing appropriate contribution rates. Current funding policy requires contributions, consisting of member contributions of 4.5% of covered payroll for all members hired before July 1, 2015, or member contributions of 6% for all members hired on or after July 1, 2015, and employer contributions of 11.0%, 12.0%, and 13.5% for the years ended June 30, 2018, 2017, and 2016 respectively. During the years ended June 30, 2018, 2017, and 2016, the Council s contributions to PERS required and made were approximately $26,387, $21,726, and $37,417, respectively. Pension Liabilities, Pension Expense, and Deferred Outflows of Resources and Deferred Inflows of Resources Related to Pensions At June 30, 2018, the Council reported a liability of $55,576 for its proportionate share of the net pension liability. The net pension liability was measured as of June 30, 2017, and the total pension liability used to calculate the net pension liability was determined by an actuarial valuation as of July 1, 2016, rolled forward to the measurement date of June 30, The Council s proportion of the net pension liability was based on the Council s share of contributions to the pension plan relative to the contributions of all employers participating in PERS for the year ended June 30, At June 30, 2017, the Council s proportion was percent, which was a decrease of percent from its proportion measured as of June 30, (Continued) 33
132 WEST VIRGINIA INFRASTRUCTURE AND JOBS DEVELOPMENT COUNCIL NOTES TO FINANCIAL STATEMENTS June 30, 2018 Note 11. Pension Benefits (Continued) For the year ended June 30, 2018, the Council recognized pension expense of ($19,274). At June 30, 2018, the Council reported deferred outflows of resources and deferred inflows of resources related to pensions from the following sources: Deferred Deferred Outflows of Inflows of Resources Resources Net difference between projected and actual earnings on pension plan investments $ - $ 13,511 Changes in assumptions - 2,883 Changes in proportion and differences between the Council s contributions and proportionate share of contributions 1,755 14,435 Difference between expected and actual experience 4, The Council s contributions made subsequent to the measurement date of June 30, ,387 - Total $ 33,088 $ 30,952 The $26,387 reported as deferred outflows of resources related to pensions resulting from the Council s contributions subsequent to the measurement date will be recognized as a reduction of the net pension liability in the year ended June 30, Other amounts reported as deferred outflows of resources and deferred inflows of resources related to pensions will be recognized in pension expense as follows: Year ended June 30, 2019 $ (8,942) 2020 (152) 2021 (3,483) 2022 (11,674) Actuarial Assumptions The total pension liability in the June 30, 2017 actuarial valuation was determined using the following actuarial assumptions, applied to all periods in the measurement: Inflation Salary increases Investment rate of return 3.0 percent percent, average, including inflation 7.5 percent, net of pension plan investment expense (Continued) 34
133 WEST VIRGINIA INFRASTRUCTURE AND JOBS DEVELOPMENT COUNCIL NOTES TO FINANCIAL STATEMENTS June 30, 2018 Note 11. Pension Benefits (Continued) Mortality rates were based on 100% of RP Non-Annuitant, Scale AA fully generational for active employees, 110% of the RP-2000 Non-Annuitant, Scale AA fully generational for healthy males, 101% of the RP-2000 Non-Annuitant, Scale AA fully generational for healthy females, 96% of RP-2000 Disabled Annuitant, Scale AA fully generational for disabled males, and 107% of RP-2000 Disabled Annuitant, Scale AA fully generational for disabled females. The actuarial assumptions used in the June 30, 2016 valuation were based on the results of an actuarial experience study for the period July 1, 2009 through June 30, The long-term expected rate of return on pension plan investments was determined using a buildingblock method in which best-estimate ranges of expected future real rates of return (expected returns, net of pension plan investment expense and inflation) are developed for each major asset class. These ranges are combined to produce the long-term expected rate of return by weighting the expected future real rates of return by the target asset allocation percentage and by adding expected inflation. The target allocation and best estimates of arithmetic real rates of return for each major asset class are summarized in the following table: Asset Class Target Allocation Long-term Expected Rate of Return Weighted Average Expected Real Rate of Return US equity 27.5% 7.0% 1.92% International equity 27.5% 7.7% 2.12% Core fixed income 7.5% 2.7% 0.20% High yield fixed income 7.5% 5.5% 0.41% Real estate 10.0% 7.0% 0.70% Private equity 10.0% 9.4% 0.94% Hedge funds 10.0% 4.7% 0.47% Total 6.76% Inflation (CPI) % 1.90% 8.66% Discount Rate The discount rate used to measure the total pension liability was 7.5 percent. The projection of cash flows used to determine the discount rate assumed that employee contributions will be made at the current contribution rate and that contributions from employers will continue to be made at statutorily required rates, which are determined annually based on actuarial valuations. Based on those assumptions, the pension plan s fiduciary net position was projected to be available to make all projected future benefit payments of current active and inactive employees. Therefore, the long-term expected rate of return on pension plan investments was applied to all periods of projected benefit payments to determine the total pension liability. Although discount rates are subject to change between measurement dates, there were no changes in the discount rate in the current period. (Continued) 35
134 WEST VIRGINIA INFRASTRUCTURE AND JOBS DEVELOPMENT COUNCIL NOTES TO FINANCIAL STATEMENTS June 30, 2018 Note 11. Pension Benefits (Continued) Sensitivity of the Authority s Proportionate Share of the Net Pension Liability to Changes in the Discount Rate The following presents the Authority s proportionate share of the net pension liability calculated using the discount rate of 7.5 percent, as well as what the Authority s proportionate share of the net pension liability would be if it were calculated using a discount rate that is one-percentage-point lower or one-percentage-point higher than the current rate: 1% Decrease Current Discount 1% Increase (6.5%) Rate (7.5%) (8.5%) The Council s proportionate share of the net pension liability $ 153,859 $ 55,576 $ 27,521 Note 12. Other Postemployment Benefits Plan description The West Virginia Other Postemployment Benefit Plan (the OPEB Plan) is a cost-sharing, multipleemployer, defined benefit other post-employment benefit plan and covers the retirees of State agencies, colleges and universities, county boards of education, and other government entities as set forth in the West Virginia Code Section 5-16D-2 (the Code). The financial activities of the OPEB Plan are accounted for in the West Virginia Retiree Health Benefit Trust Fund (RHBT), a fiduciary fund of the State of West Virginia. The OPEB Plan is administered by a combination of the West Virginia Public Employees Insurance Agency (PEIA) and the RHBT staff. OPEB Plan benefits are established and revised by PEIA and the RHBT management with approval of their Finance Board. The PEIA issues a publically available financial report of the RHBT that can be obtained at or by writing to the West Virginia Public Employees Insurance Agency, th Street, SE Suite 2, Charleston, WV Benefits provided Council employees who retire are eligible for PEIA health and life benefits, provided they meet the minimum eligibility requirements of the PERS or meet certain other eligibility requirements of other CPRB sponsored retirement plans. RHBT provides medical and prescription drug insurance and life insurance benefits to those qualified participants. Life insurance is provided through a vendor and is fully funded by member contributions. The medical and prescription drug insurance is provided through two options; Self-Insured Preferred Provider Benefit Plan - primarily for non-medicareeligible retirees and spouses or External Managed Care Organizations - primarily for Medicareeligible retirees and spouses. The RHBT Medicare-eligible retired employees and their Medicare-eligible dependents receive medical and drug coverage from a Medicare Advantage Plan. Under this arrangement, the vendor assumes the financial risk of providing comprehensive medical and drug coverage with limited copayments. Non-Medicare retirees continue enrollment in PEIA's Preferred Provider Benefit or the Managed Care Option. The RHBT collects employer contributions for Managed Care Organization (MCO) participants and remits capitation payments to the MCO. Survivors of retirees have the option of purchasing the medical and prescription drug coverage. (Continued) 36
135 WEST VIRGINIA INFRASTRUCTURE AND JOBS DEVELOPMENT COUNCIL NOTES TO FINANCIAL STATEMENTS June 30, 2018 Note 12. Other Postemployment Benefits (Continued) Eligible participants hired after June 30, 2010, will be required to fully fund premium contributions upon retirement. The Plan is a closed plan to new entrants. Contributions West Virginia Code section 5-16D-6 assigns to the PEIA Finance Board the authority to establish and amend contribution requirements of the plan members and the participating employers. Participating employers are required by statute to contribute at a rate assessed each year by the RHBT. The annual contractually required rate is the same for all participating employers. Employer contributions represent what the employer was billed during the respective year for their portion of the pay as you go premiums, commonly referred to as paygo, retiree leave conversion billings, and other matters, including billing adjustments. The annual contractually required per active policyholder per month rates for State non-general funded agencies and other participating employers effective June 30, 2018, 2017, and 2016, respectively, were: /1/17-6/30/17 7/1/112/31/16 Paygo Premium $ 177 $ 135 $ 196 $ 163 Contributions to the OPEB plan from the Council were $3,345, $8,604, and $19,152 for the years ended June 30, 2018, 2017, and 2016, respectively. Members retired before July 1, 1997, pay retiree healthcare contributions at the highest sponsor subsidized rate, regardless of their actual years of service. Members retired between July 1, 1997 and June 30, 2010, pay a subsidized rate depending on the member's years of service. Members hired on or after July 1, 2010, pay retiree healthcare contributions with no sponsor provided implicit or explicit subsidy. Retiree leave conversion contributions from the employer depend on the retiree's date of hire and years of service at retirement as described below; Members hired before July 1, 1988, may convert accrued sick or leave days into 100% of the required retiree healthcare contribution. Members hired from July 1, 1988, to June 30, 2001, may convert accrued sick or leave days into 50% of the required retiree healthcare contribution. The conversion rate is two days of unused sick and annual leave days per month for single healthcare coverage and three days of unused sick and annual leave days per month for family healthcare coverage. (Continued) 37
136 WEST VIRGINIA INFRASTRUCTURE AND JOBS DEVELOPMENT COUNCIL NOTES TO FINANCIAL STATEMENTS June 30, 2018 Note 12. Other Postemployment Benefits (Continued) Contributions by Nonemployer Contributing Entities in Special Funding Situations The State of West Virginia is a nonemployer contributing entity that provides funding through SB 419, effective July 1, 2012, amended by West Virginia Code The State provides a supplemental pre-funding source dedicating $30 million annually to the RHBT Fund from annual collections of the Personal Income Tax Fund and dedicated for payment of the unfunded liability of the RHBT. The $30 million transferred pursuant to this Code shall be transferred until the Governor certifies to the Legislature that an independent actuarial study has determined that the unfunded liability of RHBT has been provided for in its entirety or July 1, 2037, whichever date is later. This funding is to the advantage of all RHBT contributing employers. The State is a nonemployer contributing entity that provides funding through West Virginia State Code 11B The Financial Stability Fund is a plan to transfer an annual amount of $5 million to the RHBT from special revenue funds to be used to lower retiree premiums, to help reduce benefit cuts, to help reduce premium increases or any combination thereof. The $5 million transferred pursuant to this Code shall be transferred annually into the RHBT through June 30, This funding is to the advantage of all RHBT contributing employers. The State is a nonemployer contributing entity that provides funding through SB 469 which was passed February 10, 2012, granting OPEB liability relief to the 55 County Boards of Education effective July 1, The public school support plan (PSSP) is a basic foundation allowance program that provides funding to the local school boards for "any amount of the employer's annual required contribution allocated and billed to the county boards for employees who are employed as professional employees, employees who are employed as service personnel and employees who are employed as professional student support personnel", within the limits authorized by the State Code. This special funding under the school aid formula subsidizes employer contributions of the county boards of education. OPEB Liabilities, OPEB Expense, and Deferred Outflows of Resources and Deferred Inflows of Resources Related to OPEB At June 30, 2018, the Council reported a liability for its proportionate share of the RHBT net OPEB liability that reflected a reduction for State OPEB support provided to the Council. The amount recognized by the Council as its proportionate share of the net OPEB liability, the related State support, and the total portion of the net OPEB liability that was associated with the Council was as follows: Council s proportionate share of the net OPEB liability $ 50,460 State s special funding proportionate share of the net OPEB liability associated with the Council. 10,365 Total portion of net OPEB liability associated with the Council $ 60,825 (Continued) 38
137 WEST VIRGINIA INFRASTRUCTURE AND JOBS DEVELOPMENT COUNCIL NOTES TO FINANCIAL STATEMENTS June 30, 2018 Note 12. Other Postemployment Benefits (Continued) The net OPEB liability was measured as of June 30, 2017, and the total OPEB liability used to calculate the net OPEB liability was determined by an actuarial valuation as of June 30, The Council s proportion of the net OPEB liability was based on its proportionate share of employer and non-employer contributions to the OPEB Plan for the fiscal year ended on the measurement date. At June 30, 2017, the Council s proportion was percent, which is a decrease of percent from its proportion measured as of June 30, For the year ended June 30, 2018, the Council recognized OPEB expense of $2,925 and for support provided by the State under special funding situations revenue of $3,182. At June 30, 2018, the Council reported deferred outflows of resources and deferred inflows of resources related to OPEB from the following sources: Deferred Outflows of Resources Deferred Inflows of Resources Differences between expected and actual experience $ - $ 169 Net difference between projected and actual earnings on OPEB plan investments Changes in proportion and differences between Council s contributions and proportionate share of contributions - 18,369 Council s contributions subsequent to the measurement date of June 30, ,345 - Total $ 3,345 $ 19,343 The amount of $3,345 reported as deferred outflows of resources related to OPEB resulting from Council s contributions subsequent to the measurement date will be recognized as a reduction of the net OPEB liability in the year ended June 30, Other amounts reported as deferred outflows of resources and deferred inflows of resources related to OPEB will be recognized in OPEB expense as follows: Year ended June 30: 2019 $ (5,193) 2020 (5,193) 2021 (5,193) 2022 (3,764) Actuarial assumptions The total OPEB liability was determined by an actuarial valuation as of June 30, 2016, rolled forward to June 30, 2017 using the following actuarial assumptions, applied to all periods included in the measurement, unless otherwise specified: (Continued) 39
138 WEST VIRGINIA INFRASTRUCTURE AND JOBS DEVELOPMENT COUNCIL NOTES TO FINANCIAL STATEMENTS June 30, 2018 Note 12. Other Postemployment Benefits (Continued) Actuarial assumptions (Continued) Inflation 2.75% Salary increases Dependent upon pension system ranging from 3.00% to 6.50%, including inflation Investment rate of return Healthcare cost trend rates Actuarial cost method Amortization method 7.15%, net of OPEB plan investment expense, including inflation Actual trend used for fiscal year For fiscal years on and after 2018, trend starts at 8.50% and 9.75% for pre and post- Medicare, respectively, and gradually decreases to an ultimate trend of 4.50%. Excess trend rate of 0.14% and 0.29% for pre and post-medicare, respectively, is added to healthcare trend rates pertaining to per capita claims costs beginning in 2020 to account for the Excise Tax Entry Age Normal Cost Method Level percentage of payroll over a 21 year closed period Remaining amortization period 21 years closed as of June 30, 2016 Mortality rates were based on the RP-2000 Healthy Annuitant Mortality Table projected with Scale AA on a fully generational basis for PERS and Teachers Retirement System (TRS). RP-2000 Healthy Annuitant Mortality Table projected to 2025 with scale BB for West Virginia Death, Disability, and Retirement Fund (Troopers A) and West Virginia State Police Retirement System (Troopers B). Pre-Retirement: RP-2000 Non-Annuitant Mortality Table projected with Scale AA on a fully generational basis for PERS and TRS. RP-2000 Non-Annuitant Mortality Table projected to 2020 with Scale BB for Troopers A and B. The actuarial assumptions used in the June 30, 2016 valuation were based on the results of an actuarial experience study for the period July 1, June 30, The long-term expected rate of return of 7.15% on OPEB plan investments was determined by a combination of an expected long-term rate of return of 7.50% for long-term assets invested with the West Virginia Investment Management Board (WVIMB) and an expected short-term rate of return of 3.0% for assets invested with the WVBTI. Long-term pre-funding assets are invested with the WVIMB. The strategic asset allocation consists of 55% equity, 15% fixed income, 10% private equity, 10% hedge fund and 10% real estate invested. Short-term assets used to pay current year benefits and expenses are invested with the WVBTI. (Continued) 40
139 WEST VIRGINIA INFRASTRUCTURE AND JOBS DEVELOPMENT COUNCIL NOTES TO FINANCIAL STATEMENTS June 30, 2018 Note 12. Other Postemployment Benefits (Continued) Actuarial assumptions (Continued) The long-term rate of return on OPEB plan investments were determined using a building block method in which estimates of expected future real rates of return (expected returns, net of OPEB plan investment expense and inflation) was developed for each major asset class. These ranges were combined to produce the long-term expected rate of return by weighting the expected future real rates of return by the target asset allocation percentages and by adding expected inflation. Best estimates of long-term geometric rates are summarized in the following table: Asset Class Long-Term Expected Real Rate of Return Large Cap Domestic 17.0% Non-Large Cap Domestic 22.0% International Qualified 24.6% International Non-Qualified 24.3% International Equity 26.2% Short-Term Fixed 0.5% Total Return Fixed Income 6.7% Core Fixed Income 0.1% Hedge Fund 5.7% Private Equity 19.6% Real Estate 8.3% Opportunistic Income 4.8% Cash 0.0% Discount rate The discount rate used to measure the total OPEB liability was 7.15%. The projection of cash flows used to determine the discount rate assumed that RHBT contributions would be made at rates equal to the actuarially determined contribution rates, in accordance with prefunding and investment policies. Future pre-funding assumptions include a $30 million annual contribution from the State through Based on those assumptions, and that the Plan is expected to be fully funded by fiscal year ended June 30, 2036, the OPEB plan's fiduciary net position was projected to be available to make all projected future benefit payments of current plan members. Therefore, the long-term expected rate of return on OPEB plan investments was applied to all periods of projected benefit payments to determine the total OPEB liability. Discount rates are subject to change between measurement dates. The discount rate used to measure the total OPEB liability at June 30, 2016 is a 0.45% increase from the June 30, 2015 valuation. Other key assumptions The projection assumes that the capped subsidy aggregate contribution limit of $150 million for 2017 would increase by $10 million per year on and after Additionally, the per member subsidy is projected to increase by at least 3.0% per year but no more than the healthcare trend inflation assumption such that the product of the projected subsidy and projected members is less than the (Continued) 41
140 WEST VIRGINIA INFRASTRUCTURE AND JOBS DEVELOPMENT COUNCIL NOTES TO FINANCIAL STATEMENTS June 30, 2018 Note 12. Other Postemployment Benefits (Continued) Other key assumptions (Continued) projected aggregated capped costs; and the member's share of plan costs is expected remain stable as a percentage of total costs following the year that the program is fully funded. After 2035, the program is projected to be fully funded and the sponsor is assumed to contribute the residual portion of normal cost and operational expenses needed to maintain a funded ratio of 100% in future years. In addition, after 2035, the member's share of total plan costs is assumed to remain stable at approximately 61% of total plan costs. These assumptions produced per member annual capped subsidy increases of 3.0% per year from 2018 to 2023 and 4.5% per year after Members hired on or after July 1, 2010, are required to pay 100% of expected cost of coverage, resulting in no implicit or explicit employer cost. Consequently, these members are excluded from the actuarial valuation. Sensitivity of the Council s proportionate share of the net OPEB liability to changes in the discount rate The following presents the Council s proportionate share of the net OPEB liability calculated using the current discount rate, as well as what the Council s proportionate share of the net OPEB liability would be if it were calculated using a discount rate that is 1-percentage point lower or 1-percentagepoint higher than the current rate: 1% Decrease (6.15%) Current Discount Rate (7.15%) 1% Increase (8.15%) Council s proportionate share of the net OPEB liability $ 58,755 $ 50,460 $ 43,565 Sensitivity of the Authority s proportionate share of net OPEB liability to changes in the healthcare cost trend rates The following presents the Authority s proportionate share of the net OPEB liability, as well as what the Authority s proportionate share of the net OPEB liability would be if it were calculated using healthcare cost trend rates that are 1-percentage-point lower or 1-percentage point higher than the current rates: 1% Decrease Current Healthcare Cost Trend Rates 1% Increase Authority s proportionate share of the net OPEB liability $ 42,387 $ 50,460 $ 60,334 42
141 WEST VIRGINIA INFRASTRUCTURE AND JOBS DEVELOPMENT COUNCIL NOTES TO FINANCIAL STATEMENTS June 30, 2018 Note 13. Schedule of General and Administrative Expenses General and administrative expenses in the enterprise fund for the year ended June 30, 2018, were as follows: Salaries and benefits $ 339,129 Legal 172,929 Consulting and professional 59,237 Rentals 96,434 Travel and training 4,818 Office supplies 7,127 Computer services 1,806 Telecommunications 1,834 Trustee 110,181 Insurance 4,549 Storage Expense 69 Property Tax 4,176 Total general and administrative $ 802,289 Note 14. Risk Management The Council is exposed to various risks of loss related to torts; theft of, damage to, and destruction of assets; errors and omissions; injuries to and illnesses of employees; and natural disasters. The Council has obtained coverage for job-related injuries to employees and health coverage for its employees in exchange for the payment of premiums to a commercial insurance provider and WVPEIA. Accordingly, the Council has transferred its risk related to job-related injuries and health coverage for employees. The Council obtained coverage transferring its risk for general liability, property damage, business interruption, errors and omissions, and natural disasters from the West Virginia Board of Risk and Insurance Management in exchange for an annual premium. There were no changes in any of the above coverages or claims in excess of coverage for the year ended June 30, Note 15. Restricted Net Position Restrictions of net position are the result of constraints placed on the use of net position which have been imposed through third party bond indentures and enabling legislation. The enterprise fund Statement of Net Position reports $621,723,250 of restricted net position, of which $103,215,062 is restricted for the debt service related to the defined loan program segment of the revenue bonds. Note 16. Commitments The Council s Enterprise Fund has issued commitments to loan or grant funds to qualifying applicants for a period of time contingent on numerous actions to be completed by the applicants. As of June 30, 2018, $12,831,922 was designated by the Council for loans and grants to water, wastewater, and economic development projects. The Council also has commitments to provide grants in the amount of $3,343 remaining for the Greenbrier Watershed projects. The Council has also designated $7,225,400 for contributions to two State agencies for the required State match for federally sponsored revolving funds. 43
142 WEST VIRGINIA INFRASTRUCTURE AND JOBS DEVELOPMENT COUNCIL NOTES TO FINANCIAL STATEMENTS June 30, 2018 Note 17. New Accounting Pronouncements The Governmental Accounting Standards Board (GASB) has issued the following Statements which are not yet effective. The GASB issued Statement No. 83, Certain Asset Retirement Obligations in November This Statement establishes criteria for determining the timing and pattern of recognition of a liability and a corresponding deferred outflow of resources for asset retirement obligations. The requirements of this Statement are effective for periods beginning after June 15, The GASB issued Statement No. 84, Fiduciary Activities in January This Statement establishes standards of accounting and financial reporting for fiduciary activities. The requirements of this Statement are effective for periods beginning after December 15, The GASB issued Statement No. 87, Leases in June This Statement establishes standards of accounting and financial reporting for leases by lessees and lessors. The requirements of this Statement are effective for periods beginning after December 15, Management has not determined the effects these new GASB Statements may have on prospective financial statements. Note 18. Segment Information The presentation of segment information for the Council s Enterprise Fund, which conforms with GAAP. The Defined Loan Program segment consists of a series of defined loans, which are the primary source of repayment of the revenue bonds, as dictated by the bond resolutions. (Continued) 44
143 WEST VIRGINIA INFRASTRUCTURE AND JOBS DEVELOPMENT COUNCIL NOTES TO FINANCIAL STATEMENTS June 30, 2018 Note 18. Segment Information (Continued) Defined Loan Program ASSETS CURRENT $ 27,631,993 NONCURRENT 176,802,974 Total assets $ 204,434,967 Deferred outflows of resources: Losses on bond refundings $ 983,593 $ 983,593 LIABILITIES CURRENT $ 4,555,472 NONCURRENT 97,648,026 Total liabilities $ 102,203,498 Net position: Restricted $ 103,215,062 Operating revenue: Charges for services $ 674,808 Operating expenses: General and administrative 215,374 Interest on bonds 3,990,478 Operating loss: (3,531,044) Nonoperating revenues (expenses): Interest and investment revenue, net of arbitrage 181,145 Transfers (net) (3,561) Change in net position (3,353,460) Beginning net position 106,568,522 Ending net position $ 103,215,062 Cash flows: Net cash provided (used) by: Operating activities $ 4,237,528 Noncapital financing activities (3,698,183) Investing activities 165,821 Beginning cash and cash equivalents 18,971,234 Ending cash and cash equivalents $ 19,676,400 45
144 REQUIRED SUPPLEMENTARY INFORMATION
145 THE WEST VIRGINIA INFRASTRUCTURE AND JOBS DEVELOPMENT COUNCIL SCHEDULE OF THE PROPORTIONATE SHARE OF THE NET PENSION LIABILITY Public Employees Retirement System Plan Year Ended June 30, The Council's proportion (percentage) of the net pension liability % % % % The Council's proportionate share of the net pension liability $ 55,576 $ 178,377 $ 123,848 $ 77,670 The Council's covered payroll $ 181,050 $ 277,162 $ 301,770 $ 257,684 The Council's proportionate share of the net pension's liability as a percentage of its covered payroll 30.70% 64.36% 41.04% 30.14% Plan fiduciary net position as a percentage of the total pension liability 93.67% 86.11% 91.29% 93.98% Note: All amounts are presented as of the measurement date, which is one year prior to the fiscal year end date. See Independent Auditor's Report and accompanying Note to Required Supplementary Information. 46
146 THE WEST VIRGINIA INFRASTRUCTURE AND JOBS DEVELOPMENT COUNCIL SCHEDULE OF CONTRIBUTIONS TO THE PERS Years Ended June Statutorily required contribution $ 26,387 $ 21,726 $ 37,417 $ 42,090 $ 37,400 $ 32,210 Contributions in relation to the statutorily required contribution (26,387) (21,726) (37,417) (42,090) (37,400) (32,210) Contribution deficiency (excess) $ - $ - $ - $ - $ - $ - The Council's covered payroll $ 239,873 $ 181,050 $ 277,162 $ 301,770 $ 257,684 $ 232,969 Contributions as a percentage of covered payroll 11.00% 12.00% 13.50% 13.95% 14.51% 13.83% See Independent Auditor's Report and accompanying Note to Required Supplementary Information. 47
147 THE WEST VIRGINIA INFRASTRUCTURE AND JOBS DEVELOPMENT COUNCIL SCHEDULE OF THE PROPORTIONATE SHARE OF THE NET OPEB LIABILITY Retiree Health Benefit Trust Year Ended June 30, 2018 The Council's proportion (percentage) of the net OPEB liability % The Council's proportionate share of the net OPEB liability $ 50,460 The State's proportionate share of the net OPEB liability associated with the Council 10,365 Total proportionate share of the net OPEB liability associated with the Council $ 60,825 The Council's covered emplyee payroll $ 67,537 The Council's proportionate share of the net OPEB liability as a percentage of its covered employee payroll 74.71% Plan fiduciary net position as a percentage of the total OPEB liability 25.10% Note: All amounts presented are as of the measurement date, which is one year prior to the fiscal year end date. See Independent Auditor's Report and accompanying Note to Required Supplementary Information. 48
148 THE WEST VIRGINIA INFRASTRUCTURE AND JOBS DEVELOPMENT COUNCIL SCHEDULE OF CONTRIBUTIONS TO THE RHBT Year Ended June 30, 2018 Statutorily required contribution $ 3,345 Contributions in relation to the statutorily required contribution (3,345) Contribution deficiency (excess) $ - The Council's covered employee payroll $ 42,914 Contributions as a percentage of covered employee payroll 7.79% See Independent Auditor's Report and accompanying Note to Required Supplementary Information. 49
149 THE WEST VIRGINIA INFRASTRUCTURE AND JOBS DEVELOPMENT COUNCIL NOTE TO REQUIRED SUPPLEMENTARY INFORMATION Note 1. Trend Information Presented The accompanying schedules of the proportionate share of the net pension liability, contributions to PERS, the proportionate share of the net OPEB liability, and contributions to the RHBT, are required supplementary information to be presented for 10 years. However, until a full 10 year trend is compiled, information is presented in the schedules for those years for which information is available. Note 2. OPEB Changes in Assumptions Below are changes in the assumptions between the 2016 and 2015 valuations: Certain economic and behavioral assumptions are unique to healthcare benefits. These assumptions include the healthcare trend, per capita claims costs, the likelihood that a member selects healthcare coverage and the likelihood that a retiree selects one-person, two person or family coverage. These assumptions were updated based on a recent experience study performed by the RHBT actuaries using five-year experience data through June 30, The updated per capita claims costs were also based on recent claims, enrollment and premium information as of the valuation date. For the June 30, 2016 valuation, the retiree healthcare participation assumption for each retirement plan is slightly higher than the previous assumption used in the June 30, 2015 OPEB valuation. More members who were covered as actives will be assumed to participate as retirees. The 2016 and 2015 valuations include consideration of the $30 million annual appropriations under Senate Bill 419, through July 1, 2037, or if earlier, the year the benefit obligation is fully funded. Additionally, the presentation of covered payroll was changed for the June 30, 2015, actuarial valuation. Participating employees hired before July 1, 2010, pay retiree premiums that are subsidized based on years of service at retirement. Participating employees hired on or after July 1, 2010, are required to fully fund premium contributions upon retirement. Consequently, beginning June 30, 2015, actuarial valuation covered payroll represents only the payroll for those OPEB eligible participating employees that were hired before July 1, 2010, allowing a better representation of the UAAL as a percentage of covered payroll, whereas, for the prior years, covered payroll is in total for all participating employees. Note 3. Pension Plan Amendments The PERS was amended to make changes which apply to new employees hired July 1, 2015 and later as follows: For employees hired prior to July 1, 2015, qualification for normal retirement is age 60 with five years of service or at least age 55 with age and service equal to 80 or greater. A member may retire with the pension reduced actuarially if the member is at least age 55 and has at least 10 years of contributory service, or at any age with 30 years of contributory service. For employees hired July 1, 2015 and later, qualification for normal retirement is 62 with 10 years of service. A member hired after July 1, 2015 may retire with the pension reduced actuarially if the member is between ages 60 and 62 with at least ten years of contributory service, between ages 57 and 62 with at least twenty years of contributory service, or between ages 55 and 62 with at least thirty years of contributory service. (Continued) 50
150 THE WEST VIRGINIA INFRASTRUCTURE AND JOBS DEVELOPMENT COUNCIL NOTE TO REQUIRED SUPPLEMENTARY INFORMATION Note 3. Pension Plan Amendments The straight life annuity retirement benefit is equivalent to 2% of average salary multiplied by years of service. For employees hired prior to July 1, 2015, average salary is the average of the three consecutive highest annual earnings out of the last fifteen years of earnings. For all employees hired July 1, 2015 and later average salary is the average of the five consecutive highest annual earnings out of the last fifteen years of earnings. For employees hired prior to July 1, 2015, terminated members with at least five years of contributory service who do not withdraw their accumulated contributions may elect to receive their retirement annuity beginning at age 62. For all employees hired July 1, 2015 and later, this age increases to 64 with at least ten years of contributory service, or age 63 with at least twenty years of contributory service. For all employees hired prior to July 1, 2015, employees are required to contribute 4.5% of annual earnings. All employees hired July 1, 2015 and later, are required to contribute 6% of annual earnings. Note 4. Pension Plan Assumptions An experience study, which was based on the years 2009 through 2014, was completed prior to the 2015 actuarial valuation. As a result, several assumptions were changed for the actuarial valuations as follows: Projected salary increases: State % % Nonstate % % Inflation rate 3.0% (2016 and 2017); 1.9% (2015) 2.2% Mortality rates Active-RP Non-Annuitant Healthy males 1983 GAM tables, Scale AA fully generational Healthy females 1971 GAM Healthy males - 110% of RP- Disabled males 1971 GAM 2000 Non-Annuitant, Scale AA Disabled females - Revenue fully generational ruling Non-Annuitant, Scale AA Healthy females GAM Healthy females - 101% of RP Non-Annuitant, Scale AA fully generational Disabled males 96% of RP-2000 Disabled Annuitant, Scale AA fully generational Disabled females -107% of RP-2000 Disabled Annuitant, Scale AA fully generational Withdrawal rates State % 1-26% Non-state % % Disability rates % 51

151 INDEPENDENT AUDITOR S REPORT ON INTERNAL CONTROL OVER FINANCIAL REPORTING AND ON COMPLIANCE AND OTHER MATTERS BASED ON AN AUDIT OF FINANCIAL STATEMENTS PERFORMED IN ACCORDANCE WITH GOVERNMENT AUDITING STANDARDS To the Board of Directors West Virginia Infrastructure and Jobs Development Council Charleston, West Virginia We have audited, in accordance with the auditing standards generally accepted in the United States of America and the standards applicable to financial audits contained in Government Auditing Standards issued by the Comptroller General of the United States, the financial statements of the governmental activities, business-type activities, and each major fund of the West Virginia Infrastructure and Jobs Development Council (the Council), as of and for the year ended June 30, 2018, and the related notes to the financial statements, which collectively comprise the Council s basic financial statements, and have issued our report thereon dated October 9, Internal Control over Financial Reporting In planning and performing our audit of the financial statements, we considered the Council s internal control over financial reporting (internal control) to determine the audit procedures that are appropriate in the circumstances for the purpose of expressing our opinions on the financial statements, but not for the purpose of expressing an opinion on the effectiveness of the Council s internal control. Accordingly, we do not express an opinion on the effectiveness of the Council s internal control. A deficiency in internal control exists when the design or operation of a control does not allow management or employees, in the normal course of performing their assigned functions, to prevent, or detect and correct, misstatements on a timely basis. A material weakness is a deficiency, or a combination of deficiencies, in internal control, such that there is a reasonable possibility that a material misstatement of the Council s financial statements will not be prevented, or detected and corrected on a timely basis. A significant deficiency is a deficiency, or a combination of deficiencies, in internal control that is less severe than a material weakness, yet important enough to merit attention by those charged with governance. Our consideration of internal control was for the limited purpose described in the first paragraph of this section and was not designed to identify all deficiencies in internal control that might be material weaknesses or significant deficiencies. Given these limitations, during our audit we did not identify any deficiencies in internal control that we consider to be material weaknesses. However, material weaknesses may exist that have not been identified. Your Success is Our Focus 300 Chase Tower, 707 Virginia Street, East Charleston, WV Fax:
Audited Financial Statements West Virginia Water Development Authority Year Ended June 30, 2017 Certified Public Accountants
 Audited Financial Statements West Virginia Water Development Authority Year Ended June 30, 2017 Certified Public Accountants Audited Financial Statements WEST VIRGINIA WATER DEVELOPMENT AUTHORITY Year
West Virginia Water Development Authority
 Audited Financial Statements West Virginia Water Development Authority Year Ended June 30, 2017 Certified Public Accountants Audited Financial Statements Year Ended June 30, 2017 TABLE OF CONTENTS Page
West Virginia Infrastructure and Jobs Development Council
 Audited Financial Statements West Virginia Infrastructure and Jobs Development Council Year Ended June 30, 2016 Certified Public Accountants Audited Financial Statements Year Ended June 30, 2016 TABLE
Alabama Water Pollution Control Authority
 Alabama Water Pollution Control Authority COMPONENT UNIT FINANCIAL STATEMENTS For the Year Ended September 30, 2015 Table of Contents September 30, 2015 TAB: REPORT Independent Auditors Report 1 TAB: FINANCIAL
West Virginia Economic Development Authority
 Audited Financial Statements West Virginia Economic Development Authority Years Ended June 30, 2017 and 2016 Certified Public Accountants Audited Financial Statements Years Ended June 30, 2017 and 2016
Alabama Water Pollution Control Authority
 Alabama Water Pollution Control Authority COMPONENT UNIT FINANCIAL STATEMENTS For the Year Ended September 30, 2016 Alabama Water Pollution Control Authority Table of Contents September 30, 2016 TAB: REPORT
Alabama Water Pollution Control Authority
 Alabama Water Pollution Control Authority COMPONENT UNIT FINANCIAL STATEMENTS For the Year Ended September 30, 2018 Table of Contents September 30, 2018 REPORT Independent Auditors Report 1 FINANCIAL STATEMENTS
INDIANA BOND BANK (A COMPONENT UNIT OF THE STATE OF INDIANA)
") FINANCIAL STATEMENTS AND INDEPENDENT AUDITORS REPORT WITH SUPPLEMENTARY AND OTHER INFORMATION June 30, 2017 and 2016 Table of Contents Page(s) Independent Auditors Report 1-3 Management s Discussion and
FINANCIAL STATEMENTS AND INDEPENDENT AUDITORS REPORT WITH SUPPLEMENTARY AND OTHER INFORMATION June 30, 2017 and 2016 Table of Contents Page(s) Independent Auditors Report 1-3 Management s Discussion and
INDIANA BOND BANK (A COMPONENT UNIT OF THE STATE OF INDIANA)
") FINANCIAL STATEMENTS AND INDEPENDENT AUDITORS REPORT WITH SUPPLEMENTARY AND OTHER INFORMATION June 30, 2014 and 2013 Table of Contents Page(s) Independent Auditors Report 1 2 Management s Discussion and
FINANCIAL STATEMENTS AND INDEPENDENT AUDITORS REPORT WITH SUPPLEMENTARY AND OTHER INFORMATION June 30, 2014 and 2013 Table of Contents Page(s) Independent Auditors Report 1 2 Management s Discussion and
Greater New Haven Water Pollution Control Authority. Financial Report June 30, 2016 and 2015
 Greater New Haven Water Pollution Control Authority Financial Report June 30, 2016 and 2015 Contents Financial Section Independent auditor s report 1-2 Management s Discussion and Analysis - unaudited
Texas Treasury Safekeeping Trust Company (A Component Unit of the State of Texas) Basic Financial Statements August 31, 2017
 Basic Financial Statements August 31, 2017") Texas Treasury Safekeeping Trust Company (A Component Unit of the State of Texas) Basic Financial Statements Contents Independent Auditor s Report 1-2 Management s Discussion and Analysis 3-6 Basic Financial
Texas Treasury Safekeeping Trust Company (A Component Unit of the State of Texas) Basic Financial Statements Contents Independent Auditor s Report 1-2 Management s Discussion and Analysis 3-6 Basic Financial
Alabama Water Pollution Control Authority
 Alabama Water Pollution Control Authority COMPONENT UNIT FINANCIAL STATEMENTS For the Year Ended September 30, 2014 Alabama Water Pollution Control Authority Table of Contents September 30, 2014 TAB: REPORT
FINANCIAL REPORT LOUISIANA HOUSING CORPORATION JUNE 30, 2017 AND 2016
 FINANCIAL REPORT LOUISIANA HOUSING CORPORATION INDEX TO REPORT PAGE INDEPENDENT AUDITOR'S REPORT... 1-3 MANAGEMENT S DISCUSSION AND ANALYSIS... 4-9 FINANCIAL STATEMENTS: Statements of Net Position... 10-11
ENGLEWOOD WATER DISTRICT FINANCIAL STATEMENTS AND SUPPLEMENTARY INFORMATION YEARS ENDED SEPTEMBER 30, 2017 AND 2016
 FINANCIAL STATEMENTS AND SUPPLEMENTARY INFORMATION YEARS ENDED TABLE OF CONTENTS YEARS ENDED INDEPENDENT AUDITORS REPORT 1 MANAGEMENT S DISCUSSION AND ANALYSIS 4 BASIC FINANCIAL STATEMENTS STATEMENTS OF
AUSTIN UTILITIES FINANCIAL STATEMENTS AND SUPPLEMENTARY INFORMATION YEAR ENDED DECEMBER 31, 2018
 FINANCIAL STATEMENTS AND SUPPLEMENTARY INFORMATION YEAR ENDED TABLE OF CONTENTS INTRODUCTION SECTION ORGANIZATION SCHEDULE 1 FINANCIAL SECTION INDEPENDENT AUDITORS REPORT 2 REQUIRED SUPPLEMENTARY INFORMATION
NEW RIVER VALLEY REGIONAL JAIL AUTHORITY FINANCIAL REPORT FOR THE YEAR ENDED JUNE 30, 2018
 NEW RIVER VALLEY REGIONAL JAIL AUTHORITY FINANCIAL REPORT FOR THE YEAR ENDED JUNE 30, 2018 NEW RIVER VALLEY REGIONAL JAIL AUTHORITY FINANCIAL REPORT FISCAL YEAR ENDED JUNE 30, 2018 TABLE OF CONTENTS FINANCIAL
METROPOLITAN SEWER DISTRICT OF GREATER CINCINNATI HAMILTON COUNTY TABLE OF CONTENTS. Independent Auditor s Report... 1
 METROPOLITAN SEWER DISTRICT OF GREATER CINCINNATI TABLE OF CONTENTS TITLE PAGE Independent Auditor s Report... 1 Prepared by Management: Management s Discussion and Analysis... 5 Basic Financial Statements:
CITY OF ANAHEIM WATER UTILITY FUND. Financial Statements. June 30, 2016 and (With Independent Auditors Report Thereon)
") Financial Statements (With Independent Auditors Report Thereon) Table of Contents Page Independent Auditors Report 1 Management s Discussion and Analysis (Unaudited) 3 Financial Statements: Statement of
Financial Statements (With Independent Auditors Report Thereon) Table of Contents Page Independent Auditors Report 1 Management s Discussion and Analysis (Unaudited) 3 Financial Statements: Statement of
TAUNTON MUNICIPAL LIGHTING PLANT (A COMPONENT UNIT OF THE CITY OF TAUNTON, MASSACHUSETTS)
") (A COMPONENT UNIT OF THE CITY OF TAUNTON, MASSACHUSETTS) FINANCIAL STATEMENTS CONTENTS Independent Auditors Report... 1-3 Management s Discussion and Analysis... 4-7 Financial Statements Statements of
(A COMPONENT UNIT OF THE CITY OF TAUNTON, MASSACHUSETTS) FINANCIAL STATEMENTS CONTENTS Independent Auditors Report... 1-3 Management s Discussion and Analysis... 4-7 Financial Statements Statements of
CITY OF SPRINGFIELD, ILLINOIS
 CITY OF WATER FUND (An Enterprise Fund of the City of Springfield, Illinois) For the Years Ended February 28, 2018 and February 28, 2017 TABLE OF CONTENTS Page(s) Independent Auditor s Report... 1-2 Financial
Greenville Electric Utility System (GEUS) FINANCIAL STATEMENTS (with Independent Auditor s Report)
 FINANCIAL STATEMENTS (with Independent Auditor s Report)") Greenville Electric Utility System (GEUS) (A component unit of the City of Greenville, Texas) FINANCIAL STATEMENTS (with Independent Auditor s Report) and 2017 TABLE OF CONTENTS and 2017 Independent Auditor
Greenville Electric Utility System (GEUS) (A component unit of the City of Greenville, Texas) FINANCIAL STATEMENTS (with Independent Auditor s Report) and 2017 TABLE OF CONTENTS and 2017 Independent Auditor
JEAN CARTER RYAN, PRESIDENT
 BASIC FINANCIAL STATEMENTS FOR THE YEAR ENDED DECEMBER 31, 2016 JEAN CARTER RYAN, PRESIDENT BASIC FINANCIAL STATEMENTS TABLE OF CONTENTS Independent Auditor s Report... 2 Management s Discussion and Analysis...
Parker Water and Sanitation District Douglas County, Colorado. Financial Statements December 31, 2017 and 2016
 Douglas County, Colorado Financial Statements December 31, 2017 and 2016 Contents Independent auditor s report 1 Management s discussion and analysis 3-11 Basic financial statements Statements of net position
City of Chicago Department of Water Management Water Fund Comprehensive Annual Financial Report For the Years Ended December 31, 2016 and 2015
 City of Chicago Department of Water Management Water Fund Comprehensive Annual Financial Report For the Years Ended December 31, 2016 and 2015 Rahm Emanuel, Mayor Carole L. Brown, Chief Financial Officer
CHEROKEE COUNTY WATER AND SEWERAGE AUTHORITY FINANCIAL REPORT FOR THE FISCAL YEAR ENDING AUGUST 31, 2012
 CHEROKEE COUNTY WATER AND SEWERAGE AUTHORITY FINANCIAL REPORT FOR THE FISCAL YEAR ENDING AUGUST 31, 2012 CHEROKEE COUNTY WATER AND SEWERAGE AUTHORITY FINANCIAL REPORT FOR THE FISCAL YEAR ENDED AUGUST 31,
CITY OF DETROIT WATER FUND. Basic Financial Statements and Required Supplementary Information. June 30, 2006 and 2005
 Basic Financial Statements and Required Supplementary Information (With Independent Auditors Report Thereon) Table of Contents Page(s) Independent Auditors Report 1 2 Basic Financial Statements: Statements
UNIVERSITY OF WASHINGTON INTERNAL LENDING PROGRAM. Financial Statements. June 30, 2014 and (With Independent Auditors Report Thereon)
") Financial Statements (With Independent Auditors Report Thereon) Table of Contents Page Independent Auditors Report 1 Management s Discussion and Analysis 3 Statements of Net Position 7 Statements of Revenues,
Financial Statements (With Independent Auditors Report Thereon) Table of Contents Page Independent Auditors Report 1 Management s Discussion and Analysis 3 Statements of Net Position 7 Statements of Revenues,
SANTA CLARA COUNTY FINANCING AUTHORITY (A Component Unit of the County of Santa Clara, California)
") SANTA CLARA COUNTY FINANCING AUTHORITY (A Component Unit of the County of Santa Clara, California) Independent Auditor s Reports, Management s Discussion and Analysis and Basic Financial Statements Table
SANTA CLARA COUNTY FINANCING AUTHORITY (A Component Unit of the County of Santa Clara, California) Independent Auditor s Reports, Management s Discussion and Analysis and Basic Financial Statements Table
State Board of Regents of the State of Utah
 State Board of Regents of the State of Utah Student Loan Purchase Program An Enterprise Fund of the State of Utah Financial Statements and Government Auditing Standards Report An Enterprise Fund of the
CITY OF SPRINGFIELD, ILLINOIS. WATER FUND (An Enterprise Fund of the City of Springfield, Illinois)
") CITY OF WATER FUND (An Enterprise Fund of the City of Springfield, Illinois) For the Years Ended February 29, 2016 and February 28, 2015 TABLE OF CONTENTS Page(s) Independent Auditor s Report... 1-2 Financial
CITY OF WATER FUND (An Enterprise Fund of the City of Springfield, Illinois) For the Years Ended February 29, 2016 and February 28, 2015 TABLE OF CONTENTS Page(s) Independent Auditor s Report... 1-2 Financial
PARKER WATER AND SANITATION DISTRICT Douglas County, Colorado. FINANCIAL STATEMENTS December 31, 2013 and 2012
 Douglas County, Colorado FINANCIAL STATEMENTS TABLE OF CONTENTS PAGE INDEPENDENT AUDITOR S REPORT... I MANAGEMENT S DISCUSSION AND ANALYSIS... III BASIC FINANCIAL STATEMENTS Statements of Net Position...
MONROE COUNTY WATER AUTHORITY (A Discretely Presented Component Unit of the County of Monroe, New York)
") MONROE COUNTY WATER AUTHORITY (A Discretely Presented Component Unit of the County of Monroe, New York) Financial Statements as of December 31, 2017 Together with Independent Auditor s Report MONROE COUNTY
MONROE COUNTY WATER AUTHORITY (A Discretely Presented Component Unit of the County of Monroe, New York) Financial Statements as of December 31, 2017 Together with Independent Auditor s Report MONROE COUNTY
BROWARD COUNTY, FLORIDA WATER AND WASTEWATER FUND A Major Fund of Broward County, Florida
 BROWARD COUNTY, FLORIDA WATER AND WASTEWATER FUND A Major Fund of Broward County, Florida Financial Statements For the Years Ended BROWARD COUNTY, FLORIDA WATER AND WASTEWATER FUND FINANCIAL STATEMENTS
DOWNTOWN DEVELOPMENT AUTHORITY (A Component Unit of The Atlanta Development Authority, d/b/a Invest Atlanta) Basic Financial Statements.
 Basic Financial Statements.") (A Component Unit of The Atlanta Development Authority, d/b/a Invest Atlanta) Basic Financial Statements (With Independent Auditor s Report Thereon) Table of Contents Independent Auditor s Report 1 and
(A Component Unit of The Atlanta Development Authority, d/b/a Invest Atlanta) Basic Financial Statements (With Independent Auditor s Report Thereon) Table of Contents Independent Auditor s Report 1 and
OHIO PETROLEUM UNDERGROUND STORAGE TANK RELEASE COMPENSATION BOARD Financial Statements For the Year Ended June 30, 2016 and Independent Auditor s
 Financial Statements For the Year Ended June 30, 2016 and Independent Auditor s Report Theron The Board Ohio Petroleum Underground Storage Tank Release Compensation Board 50 West Broad Street, Suite 1500
CITY OF AURORA, ILLINOIS AURORA PUBLIC LIBRARY
 ANNUAL FINANCIAL REPORT For the Year Ended December 31, 2017 TABLE OF CONTENTS Page(s) INDEPENDENT AUDITOR S REPORT... 1-2 GENERAL PURPOSE EXTERNAL FINANCIAL STATEMENTS Management s Discussion and Analysis...
CITY OF CLARKSVILLE, TENNESSEE
 GAS, WATER AND Wastewater DEPARTMENTS AUDITED FINANCIAL STATEMENTS AND OTHER INFORMATION JUNE 30, 2018 AND 2017 JUNE 30, 2018 AND 2017 TABLE OF CONTENTS Financial Section Independent Auditor s Report 1
Kern Community College District Bakersfield, California FINANCIAL STATEMENTS AND SUPPLEMENTARY INFORMATION WITH INDEPENDENT AUDITORS REPORTS
 Bakersfield, California FINANCIAL STATEMENTS AND SUPPLEMENTARY INFORMATION WITH INDEPENDENT AUDITORS REPORTS June 30, 2018 TABLE OF CONTENTS June 30, 2018 Page Number Independent Auditors Report 1 FINANCIAL
BROWARD COUNTY, FLORIDA WATER AND WASTEWATER FUND A Major Fund of Broward County, Florida
 BROWARD COUNTY, FLORIDA WATER AND WASTEWATER FUND A Major Fund of Broward County, Florida Financial Statements For the Years Ended September 30, 2013 and 2012 BROWARD COUNTY, FLORIDA WATER AND WASTEWATER
Des Moines Metropolitan Wastewater Reclamation Authority. Financial Report June 30, 2016
 Des Moines Metropolitan Wastewater Reclamation Authority Financial Report June 30, 2016 Contents Independent auditor s report 1-2 Management s discussion and analysis 3-6 Basic financial statements Statements
PUBLIC LIGHTING AUTHORITY (A Component Unit of the City of Detroit, Michigan) FINANCIAL STATEMENTS (With Required Supplementary Information)
 FINANCIAL STATEMENTS (With Required Supplementary Information)") (A Component Unit of the City of Detroit, Michigan) FINANCIAL STATEMENTS (With Required Supplementary Information) CONTENTS INDEPENDENT AUDITOR S REPORT 1 MANAGEMENT S DISCUSSION AND ANALYSIS (UNAUDITED)
(A Component Unit of the City of Detroit, Michigan) FINANCIAL STATEMENTS (With Required Supplementary Information) CONTENTS INDEPENDENT AUDITOR S REPORT 1 MANAGEMENT S DISCUSSION AND ANALYSIS (UNAUDITED)
CHEROKEE COUNTY WATER AND SEWERAGE AUTHORITY CHEROKEE COUNTY, GEORGIA FINANCIAL STATEMENTS FOR THE FISCAL YEAR ENDED AUGUST 31, 2016
 CHEROKEE COUNTY WATER AND SEWERAGE AUTHORITY CHEROKEE COUNTY, GEORGIA FINANCIAL STATEMENTS FOR THE FISCAL YEAR ENDED AUGUST 31, 2016 TOGETHER WITH INDEPENDENT AUDITORS REPORTS FINANCIAL STATEMENTS AUGUST
MASSACHUSETTS WATER RESOURCES AUTHORITY. Financial Statements and Supplemental Schedules and Required Supplementary Information
 Financial Statements and Supplemental Schedules and Required Supplementary Information (With Independent Auditors Report Thereon) Table of Contents Page(s) Independent Auditors Report 1 2 Management s
PUBLIC LIGHTING AUTHORITY (A Component Unit of the City of Detroit, Michigan) FINANCIAL STATEMENTS (With Required Supplementary Information)
 FINANCIAL STATEMENTS (With Required Supplementary Information)") (A Component Unit of the City of Detroit, Michigan) FINANCIAL STATEMENTS (With Required Supplementary Information) CONTENTS INDEPENDENT AUDITOR S REPORT 1 MANAGEMENT S DISCUSSION AND ANALYSIS (UNAUDITED)
(A Component Unit of the City of Detroit, Michigan) FINANCIAL STATEMENTS (With Required Supplementary Information) CONTENTS INDEPENDENT AUDITOR S REPORT 1 MANAGEMENT S DISCUSSION AND ANALYSIS (UNAUDITED)
SONOMA VALLEY COUNTY SANITATION DISTRICT (A Component Unit of the County of Sonoma) Independent Auditor s Reports, Management s Discussion and
 Independent Auditor s Reports, Management s Discussion and") . SONOMA VALLEY COUNTY SANITATION DISTRICT (A Component Unit of the County of Sonoma) Independent Auditor s Reports, Management s Discussion and Analysis and Basic Financial Statements For the Fiscal Year
. SONOMA VALLEY COUNTY SANITATION DISTRICT (A Component Unit of the County of Sonoma) Independent Auditor s Reports, Management s Discussion and Analysis and Basic Financial Statements For the Fiscal Year
INDIANAPOLIS PUBLIC TRANSPORTATION CORPORATION (A COMPONENT UNIT OF THE CONSOLIDATED CITY OF INDIANAPOLIS MARION COUNTY GOVERNMENT REPORTING ENTITY)
") INDIANAPOLIS PUBLIC TRANSPORTATION CORPORATION (A COMPONENT UNIT OF THE CONSOLIDATED CITY OF INDIANAPOLIS MARION COUNTY GOVERNMENT REPORTING ENTITY) FINANCIAL STATEMENTS December 31, 2015 Indianapolis,
INDIANAPOLIS PUBLIC TRANSPORTATION CORPORATION (A COMPONENT UNIT OF THE CONSOLIDATED CITY OF INDIANAPOLIS MARION COUNTY GOVERNMENT REPORTING ENTITY) FINANCIAL STATEMENTS December 31, 2015 Indianapolis,
CAL STATE EAST BAY EDUCATIONAL FOUNDATION, INC. (a Component Unit of California State University, East Bay)
") CAL STATE EAST BAY EDUCATIONAL FOUNDATION, INC. (a Component Unit of California State University, East Bay) Financial Statements and Supplementary Information (With Independent Auditor s Report Thereon)
CAL STATE EAST BAY EDUCATIONAL FOUNDATION, INC. (a Component Unit of California State University, East Bay) Financial Statements and Supplementary Information (With Independent Auditor s Report Thereon)
Annual Financial Report of the Town of Griswold, Connecticut. For the Year Ended June 30, 2018
 Annual Financial Report of the Table of Contents Page No. Financial Section Independent Auditors Report 1 Management s Discussion and Analysis 3 Basic Financial Statements Exhibit Government-Wide Financial
SANTA CRUZ COUNTY SANITATION DISTRICT A COMPONENT UNIT OF THE COUNTY OF SANTA CRUZ BASIC FINANCIAL STATEMENTS AND INDEPENDENT AUDITOR S REPORTS
 SANTA CRUZ COUNTY SANITATION DISTRICT A COMPONENT UNIT OF THE COUNTY OF SANTA CRUZ BASIC FINANCIAL STATEMENTS AND INDEPENDENT AUDITOR S REPORTS JUNE 30, 2017 SANTA CRUZ COUNTY SANITATION DISTRICT JUNE
CITY OF SPRINGFIELD, ILLINOIS
 CITY OF ELECTRIC LIGHT AND POWER FUND (An Enterprise Fund of the City of Springfield, Illinois) For the Years Ended February 28, 2018 and February 28, 2017 CITY OF SPRINGFIELD - ELECTRIC LIGHT AND POWER
CAL STATE EAST BAY EDUCATIONAL FOUNDATION, INC. (a Component Unit of California State University, East Bay)
") CAL STATE EAST BAY EDUCATIONAL FOUNDATION, INC. (a Component Unit of California State University, East Bay) Financial Statements and Supplementary Information Year Ended June 30, 2017 (With Independent
CAL STATE EAST BAY EDUCATIONAL FOUNDATION, INC. (a Component Unit of California State University, East Bay) Financial Statements and Supplementary Information Year Ended June 30, 2017 (With Independent
CAPS EDUCATION COLLABORATIVE
 CAPS COLLABORATIVE Financial Statements And Required Supplementary And Other Information And Independent Auditors Reports Financial Statements And Required Supplementary And Other Information And Independent
AMELIA WALK COMMUNITY DEVELOPMENT DISTRICT TABLE OF CONTENTS. Year Ended September 30, 2017
 AMELIA WALK COMMUNITY DEVELOPMENT DISTRICT TABLE OF CONTENTS Year Ended September 30, 2017 Page I. Financial Section: Independent Auditor's Report 1 Management's Discussion and Analysis 3 Financial Statements:
PALM BEACH STATE COLLEGE ANNUAL FINANCIAL REPORT June 30, Table of Contents
 PALM BEACH STATE COLLEGE ANNUAL FINANCIAL REPORT June 30, 2018 Table of Contents MANAGEMENT S DISCUSSION AND ANALYSIS... 1 BASIC FINANCIAL STATEMENTS...12 Notes to Financial Statements...17 OTHER REQUIRED
Annual Report Maine Health & Higher Educational Facilities Authority
 Annual Report Maine Health & Higher Educational Facilities Authority 2012 Michael R. Goodwin, Executive Director Tel 207-622-1958 Fax 207-623-5359 TO: FROM: RE: INTERESTED PARTIES Michael R. Goodwin,
STATE BOARD OF REGENTS OF THE STATE OF UTAH STUDENT LOAN PURCHASE PROGRAM An Enterprise Fund of the State of Utah
 An Enterprise Fund of the State of Utah Financial Statements AN ENTERPRISE FUND OF THE STATE OF UTAH FOR THE THREE MONTHS ENDED SEPTEMBER 30, 2018 TABLE OF CONTENTS Page MANAGEMENT S REPORT 1 FINANCIAL
City of Chicago Department of Water Management Sewer Fund Comprehensive Annual Financial Report For the Year Ended December 31, 2012
 City of Chicago Department of Water Management Sewer Fund Comprehensive Annual Financial Report For the Year Ended December 31, 2012 Rahm Emanuel, Mayor Lois Scott, Chief Financial Officer Amer Ahmad,
Lyons Township School Treasurer Township 38 North, Range 12 East Cook County, Illinois
 Township 38 North, Range 12 East Cook County, Illinois Financial Statements Year Ended CONTENTS FINANCIAL SECTION Page Independent Auditors' Report 1-2 Management's Discussion and Analysis (Unaudited)
AUDITED FINANCIAL STATEMENTS and other financial information
 AUDITED FINANCIAL STATEMENTS and other financial information For the years ended June 30, 2017 and 2016 Audited Financial Statements and Other Financial Information WEST VIRGINIA HOUSING DEVELOPMENT FUND
CITY OF SPRINGFIELD, ILLINOIS. WATER FUND (An Enterprise Fund of the City of Springfield, Illinois)
") CITY OF WATER FUND (An Enterprise Fund of the City of Springfield, Illinois) For the Years Ended February 28, 2014 and February 28, 2013 TABLE OF CONTENTS Page(s) Independent Auditor s Report... 1-2 Financial
CITY OF WATER FUND (An Enterprise Fund of the City of Springfield, Illinois) For the Years Ended February 28, 2014 and February 28, 2013 TABLE OF CONTENTS Page(s) Independent Auditor s Report... 1-2 Financial
CALIFORNIA STATE UNIVERSITY, EAST BAY FOUNDATION, INC. (a Component Unit of California State University, East Bay)
") CALIFORNIA STATE UNIVERSITY, EAST BAY FOUNDATION, INC. (a Component Unit of California State University, East Bay) Basic Financial Statements and Supplementary Information (With Independent Auditor s Report
CALIFORNIA STATE UNIVERSITY, EAST BAY FOUNDATION, INC. (a Component Unit of California State University, East Bay) Basic Financial Statements and Supplementary Information (With Independent Auditor s Report
Massachusetts Educational Financing Authority Financial Statements with Management's Discussion and Analysis June 30, 2017 and 2016
 Massachusetts Educational Financing Authority Financial Statements with Management's Discussion and Analysis June 30, 2017 and 2016 Massachusetts Educational Financing Authority Index Page(s) Management's
STATE BOARD OF REGENTS OF THE STATE OF UTAH STUDENT LOAN PURCHASE PROGRAM An Enterprise Fund of the State of Utah
 An Enterprise Fund of the State of Utah Financial Statements AN ENTERPRISE FUND OF THE STATE OF UTAH FOR THE NINE MONTHS ENDED MARCH 31, 2018 TABLE OF CONTENTS Page MANAGEMENT S REPORT 1 FINANCIAL STATEMENTS:
NORTH DAKOTA HOUSING FINANCE AGENCY BISMARCK, NORTH DAKOTA AUDITED FINANCIAL STATEMENTS FOR THE YEARS ENDED JUNE 30, 2016 AND 2015
 BISMARCK, NORTH DAKOTA AUDITED FINANCIAL STATEMENTS FOR THE YEARS ENDED Table of Contents INDEPENDENT AUDITOR S REPORT 1 MANAGEMENT S DISCUSSION AND ANALYSIS 4 FINANCIAL STATEMENTS Statements of Net Position
WEST BAY SANITARY DISTRICT FINANCIAL STATEMENTS AND INDEPENDENT AUDITOR S REPORT JUNE 30, 2015 * * *
 WEST BAY SANITARY DISTRICT FINANCIAL STATEMENTS AND INDEPENDENT AUDITOR S REPORT JUNE 30, 2015 * * * CHAVAN & ASSOCIATES LLP CERTIFIED PUBLIC ACCOUNTANTS 1475 SARATOGA AVE, SUITE 180 SAN JOSE, CA 95129
Basic Financial Statements and Report of Independent Certified Public Accountants City of Dallas, Texas Dallas Water Utilities (An Enterprise Fund of
 Basic Financial Statements and Report of Independent Certified Public Accountants City of Dallas, Texas September 30, 2016 FINANCIAL STATEMENTS For Fiscal Year Ended September 30, 2016 TABLE OF CONTENTS
Lehigh Carbon Community College
 Lehigh Carbon Community College Financial Statements Table of Contents Independent Auditors Report 1 Management s Discussion and Analysis 3 Financial Statements Statement of Net Position - Primary Institution
DEDHAM-WESTWOOD WATER DISTRICT Financial Statements For the Year Ended December 31, 2017 (With Independent Auditors Report Thereon)
") DEDHAM-WESTWOOD WATER DISTRICT Financial Statements For the Year Ended December 31, 2017 (With Independent Auditors Report Thereon) Dedham-Westwood Water District TABLE OF CONTENTS PAGE INDEPENDENT AUDITORS
DEDHAM-WESTWOOD WATER DISTRICT Financial Statements For the Year Ended December 31, 2017 (With Independent Auditors Report Thereon) Dedham-Westwood Water District TABLE OF CONTENTS PAGE INDEPENDENT AUDITORS
Basic Financial Statements
 2018 Basic Financial Statements For the Fiscal Year Ended June 30, 2018 San Diego, CA 4705 9/18 San Diego Association of Governments San Diego, California Basic Financial Statements and Independent Auditor
KANSAS TURNPIKE AUTHORITY (A COMPONENT UNIT OF THE STATE OF KANSAS)
") FINANCIAL STATEMENTS FOR THE YEARS ENDED JUNE 30, 2018 AND 2017 WITH INDEPENDENT AUDITOR S REPORT FINANCIAL STATEMENTS FOR THE YEARS ENDED JUNE 30, 2018 AND 2017 WITH INDEPENDENT AUDITOR S REPORT FINANCIAL
FINANCIAL STATEMENTS FOR THE YEARS ENDED JUNE 30, 2018 AND 2017 WITH INDEPENDENT AUDITOR S REPORT FINANCIAL STATEMENTS FOR THE YEARS ENDED JUNE 30, 2018 AND 2017 WITH INDEPENDENT AUDITOR S REPORT FINANCIAL
Financial Statements June 30, 2016 Rogers State University
 Financial Statements Rogers State University www.eidebailly.com Table of Contents Independent Auditor s Report... 1 Management s Discussion and Analysis... 4 Financial Statements Statement of Net Position...
CALIFORNIA STATE UNIVERSITY, CHANNEL ISLANDS FOUNDATION
 CALIFORNIA STATE UNIVERSITY, CHANNEL ISLANDS FOUNDATION Financial Statements and Supplementary Information for the Year Ended June 30, 2017 and Independent Auditors Report TABLE OF CONTENTS Page FINANCIAL
NIAGARA FALLS WATER BOARD Basic Financial Statements, Supplementary Information and Independent Auditors Report December 31, 2017 and 2016
 Basic Financial Statements, Supplementary Information and Independent Auditors Report December 31, 2017 and 2016 Table of Contents Independent Auditors Report 1-3 Management s Discussion and Analysis 4-10
MISSISSIPPI HOME CORPORATION. Audited Financial Statements Year Ended June 30, 2015
 Audited Financial Statements Year Ended June 30, 2015 CONTENTS Independent Auditor's Report 1 3 Management's Discussion and Analysis For the Years Ended June 30, 2015 and 2014 4 12 Combined Statement of
Attalla Water Works Board. Financial Statements. for the. Years Ended September 30, 2015 and 2014
 Attalla Water Works Board Financial Statements for the Years Ended HINDSMAN, P. C. Certified Public Accountants ATTALLA WATER WORKS BOARD TABLE OF CONTENTS INDEPENDENT AUDITORS' REPORT 1-3 FINANCIAL STATEMENTS
RHODE ISLAND COMMERCE CORPORATION (A COMPONENT UNIT OF THE STATE OF RHODE ISLAND)
") step forward RHODE ISLAND COMMERCE CORPORATION (A COMPONENT UNIT OF THE STATE OF RHODE ISLAND) FINANCIAL STATEMENTS TABLE OF CONTENTS Independent Auditors Report 1-3 Management s Discussion and Analysis
step forward RHODE ISLAND COMMERCE CORPORATION (A COMPONENT UNIT OF THE STATE OF RHODE ISLAND) FINANCIAL STATEMENTS TABLE OF CONTENTS Independent Auditors Report 1-3 Management s Discussion and Analysis
RHODE ISLAND COMMERCE CORPORATION (A COMPONENT UNIT OF THE STATE OF RHODE ISLAND)
") FINANCIAL STATEMENTS TABLE OF CONTENTS Independent Auditors Report 1-3 Management s Discussion and Analysis 4-7 Financial Statements: Statements of Net Position 8-9 Statements of Revenues, Expenses and
FINANCIAL STATEMENTS TABLE OF CONTENTS Independent Auditors Report 1-3 Management s Discussion and Analysis 4-7 Financial Statements: Statements of Net Position 8-9 Statements of Revenues, Expenses and
EAST AURORA SCHOOL DISTRICT 131. FINANCIAL STATEMENTS June 30, (With Independent Auditor s Report Therein)
") FINANCIAL STATEMENTS (With Independent Auditor s Report Therein) FINANCIAL STATEMENTS CONTENTS INDEPENDENT AUDITOR S REPORT... 1 BASIC FINANCIAL STATEMENTS Government-Wide Financial Statements: Statement
FINANCIAL STATEMENTS (With Independent Auditor s Report Therein) FINANCIAL STATEMENTS CONTENTS INDEPENDENT AUDITOR S REPORT... 1 BASIC FINANCIAL STATEMENTS Government-Wide Financial Statements: Statement
Financial Statements June 30, 2017 and 2016 Utah Municipal Power Agency
 Financial Statements Utah Municipal Power Agency www.eidebailly.com Table of Contents Independent Auditor s Report... 1 Management s Discussion and Analysis... 3 Financial Statements Statements of Net
NORTH ATTLEBOROUGH ELECTRIC DEPARTMENT FINANCIAL STATEMENTS AND SUPPLEMENTARY INFORMATION
 NORTH ATTLEBOROUGH ELECTRIC DEPARTMENT FINANCIAL STATEMENTS AND SUPPLEMENTARY INFORMATION YEARS ENDED DECEMBER 31, 2017 AND 2016 NORTH ATTLEBOROUGH ELECTRIC DEPARTMENT FINANCIAL STATEMENTS AND SUPPLEMENTARY
Parking Authority of the City of Paterson, NJ
 Parking Authority of the City of Paterson, NJ Financial Statements Years Ended Parking Authority of the City of Paterson, NJ Table of Contents PAGE Management's Discussion and Analysis 1 Independent Auditors'
ADDISON PUBLIC LIBRARY ADDISON, ILLINOIS
 ANNUAL FINANCIAL REPORT For the Year Ended April 30, 2018 TABLE OF CONTENTS Page(s) INDEPENDENT AUDITOR S REPORT... 1-3 GENERAL PURPOSE EXTERNAL FINANCIAL STATEMENTS Management s Discussion and Analysis...
CONFLUENCE ACADEMY LEA A LOCAL EDUCATION AGENCY OF CONFLUENCE ACADEMY, INC. FINANCIAL STATEMENTS JUNE 30, 2016
 A LOCAL EDUCATION AGENCY OF CONFLUENCE ACADEMY, INC. FINANCIAL STATEMENTS JUNE 30, 2016 Contents Page Independent Auditors Report... 1-3 Management s Discussion And Analysis... 4-10 Financial Statements
Lyons Township School Treasurer Township 38 North, Range 12 East Cook County, Illinois
 Township 38 North, Range 12 East Cook County, Illinois Financial Statements Year Ended CONTENTS FINANCIAL SECTION Page Independent Auditors' Report 1-3 Management's Discussion and Analysis (Unaudited)
BOISE COUNTY, IDAHO. Report on Audited Basic Financial Statements and Supplemental Information. For the Year Ended September 30, 2016
 BOISE COUNTY, IDAHO Report on Audited Basic Financial Statements and Supplemental Information Table of Contents Independent Auditor s Report 3 BASIC FINANCIAL STATEMENTS Government-wide Financial Statements:
ISLIP RESOURCE RECOVERY AGENCY Combined Financial Statements December 31, 2017 and 2016 (With Independent Auditors Report thereon)
") Combined Financial Statements December 31, 2017 and 2016 (With Independent Auditors Report thereon) Table of Contents Independent Auditors Report 1-3 Management s Discussion and Analysis 4-11 Financial
Combined Financial Statements December 31, 2017 and 2016 (With Independent Auditors Report thereon) Table of Contents Independent Auditors Report 1-3 Management s Discussion and Analysis 4-11 Financial
City of Chicago, Illinois Water Fund
 City of Chicago, Illinois Water Fund Basic Financial Statements as of and for the Years Ended December 31, 2010 and 2009, Required Supplementary Information, Additional Information, Statistical Data, and
BLUEFIELD STATE COLLEGE FINANCIAL STATEMENTS YEARS ENDED JUNE 30, 2018 AND 2017
 FINANCIAL STATEMENTS YEARS ENDED JUNE 30, 2018 AND 2017 TABLE OF CONTENTS YEARS ENDED JUNE 30, 2018 INDEPENDENT AUDITORS REPORT 1 MANAGEMENT S DISCUSSION AND ANALYSIS (RSI) (UNAUDITED) 3 FINANCIAL STATEMENTS
VIRGINIA HOUSING DEVELOPMENT AUTHORITY (A Component Unit of the Commonwealth of Virginia)
") Management s Discussion and Analysis, Basic Financial Statements, and Supplementary Information (With Independent Auditors Reports Thereon) Table of Contents Management s Discussion and Analysis (unaudited)
Management s Discussion and Analysis, Basic Financial Statements, and Supplementary Information (With Independent Auditors Reports Thereon) Table of Contents Management s Discussion and Analysis (unaudited)
ALABAMA HOUSING FINANCE AUTHORITY
 FINANCIAL STATEMENTS TABLE OF CONTENTS INDEPENDENT AUDITORS REPORT 1 MANAGEMENT S DISCUSSION AND ANALYSIS 3 BASIC FINANCIAL STATEMENTS Statements of Net Position 7 Statements of Revenues, Expenses, and
CITY OF SPRINGFIELD, ILLINOIS. WATER FUND (An Enterprise Fund of the City of Springfield, Illinois)
") CITY OF WATER FUND (An Enterprise Fund of the City of Springfield, Illinois) For the Years Ended February 28, 2015 and February 28, 2014 TABLE OF CONTENTS Page(s) Independent Auditor s Report... 1-2 Financial
CITY OF WATER FUND (An Enterprise Fund of the City of Springfield, Illinois) For the Years Ended February 28, 2015 and February 28, 2014 TABLE OF CONTENTS Page(s) Independent Auditor s Report... 1-2 Financial
FINANCIAL STATEMENTS. (Unaudited) Three Months Ended. December 31, 2016 and 2015
 Three Months Ended. December 31, 2016 and 2015") FINANCIAL STATEMENTS (Unaudited) Three Months Ended December 31, 2016 and 2015 GREATER ORLANDO AVIATION AUTHORITY Orlando, Florida TABLE OF CONTENTS Page Independent Accountant s Review Report 1 Department
FINANCIAL STATEMENTS (Unaudited) Three Months Ended December 31, 2016 and 2015 GREATER ORLANDO AVIATION AUTHORITY Orlando, Florida TABLE OF CONTENTS Page Independent Accountant s Review Report 1 Department
AUDIT REPORT OF GREENBRIER PUBLIC SERVICE DISTRICT NO. 1 RONCEVERTE, WEST VIRGINIA FOR THE FISCAL YEAR ENDED JUNE 30, 2016
 AUDIT REPORT OF GREENBRIER PUBLIC SERVICE DISTRICT NO. 1 RONCEVERTE, WEST VIRGINIA FOR THE FISCAL YEAR ENDED JUNE 30, 2016 Imre D. Pentek Certified Public Accountant P.O. Box 1390 Lewisburg, West Virginia
SACRAMENTO EMPLOYMENT AND TRAINING AGENCY INDEPENDENT AUDITORS REPORT, FINANCIAL STATEMENTS AND SINGLE AUDIT REPORT FOR THE YEAR ENDED JUNE 30, 2017
 SACRAMENTO EMPLOYMENT AND TRAINING AGENCY INDEPENDENT AUDITORS REPORT, FINANCIAL STATEMENTS AND SINGLE AUDIT REPORT FINANCIAL STATEMENTS AND SINGLE AUDIT REPORT TABLE OF CONTENTS FINANCIAL SECTION PAGE
BROWARD COUNTY, FLORIDA WATER AND WASTEWATER FUND A Major Fund of Broward County, Florida
 BROWARD COUNTY, FLORIDA WATER AND WASTEWATER FUND A Major Fund of Broward County, Florida Special Purpose Financial Statements Years Ended September 30, 2012 and 2011 BROWARD COUNTY, FLORIDA WATER AND
FINANCIAL STATEMENTS. June 30, 2017 and 2016
 FINANCIAL STATEMENTS June 30, 2017 and 2016 CONTENTS Page INDEPENDENT AUDITORS' REPORT ON FINANCIAL STATEMENTS AND SUPPLEMENTAL INFORMATION 3-4 MANAGEMENT'S DISCUSSION AND ANALYSIS 5-11 FINANCIAL STATEMENTS
CHEROKEE COUNTY WATER AND SEWERAGE AUTHORITY CHEROKEE COUNTY, GEORGIA FINANCIAL STATEMENTS FOR THE FISCAL YEAR ENDED AUGUST 31, 2017
 CHEROKEE COUNTY WATER AND SEWERAGE AUTHORITY CHEROKEE COUNTY, GEORGIA FINANCIAL STATEMENTS FOR THE FISCAL YEAR ENDED AUGUST 31, 2017 TOGETHER WITH INDEPENDENT AUDITORS REPORTS FINANCIAL STATEMENTS AUGUST
CANBY UTILITY BOARD (A COMPONENT UNIT OF THE CITY OF CANBY, OREGON)
") REPORT OF INDEPENDENT AUDITORS AND FINANCIAL STATEMENTS WITH SUPPLEMENTARY INFORMATION CANBY UTILITY BOARD (A COMPONENT UNIT OF THE CITY OF CANBY, OREGON) June 30, 2018 and 2017 Table of Contents Introductory
REPORT OF INDEPENDENT AUDITORS AND FINANCIAL STATEMENTS WITH SUPPLEMENTARY INFORMATION CANBY UTILITY BOARD (A COMPONENT UNIT OF THE CITY OF CANBY, OREGON) June 30, 2018 and 2017 Table of Contents Introductory
PARKER WATER AND SANITATION DISTRICT Douglas County, Colorado. FINANCIAL STATEMENTS December 31, 2014 and 2013
 Douglas County, Colorado FINANCIAL STATEMENTS December 31, 2014 and 2013 TABLE OF CONTENTS PAGE INDEPENDENT AUDITOR S REPORT... I MANAGEMENT S DISCUSSION AND ANALYSIS... III BASIC FINANCIAL STATEMENTS
TOWN OF PLAISTOW, NEW HAMPSHIRE ANNUAL FINANCIAL REPORT AS OF AND FOR THE FISCAL YEAR ENDED DECEMBER 31, 2017
 TOWN OF PLAISTOW, NEW HAMPSHIRE ANNUAL FINANCIAL REPORT AS OF AND FOR THE FISCAL YEAR ENDED DECEMBER 31, 2017 TOWN OF PLAISTOW, NEW HAMPSHIRE ANNUAL FINANCIAL REPORT AS OF AND FOR THE FISCAL YEAR ENDED