This page intentionally left blank.
|
|
|
- Adelia Flowers
- 6 years ago
- Views:
Transcription
1
2 This page intentionally left blank.
3 Table of Contents Introductory Section Page Letter of Transmittal 1 GFOA Certificate of Achievement 5 Organizational Chart 6 List of Principal City Officials 7 Financial Section Independent Auditors Report 11 Management s Discussion and Analysis 16 Basic Financial Statements: Government-wide Financial Statements: Statement of Net Position 25 Statement of Activities 26 Fund Financial Statements: Balance Sheet Governmental Funds 30 Reconciliation of Fund Balances of Governmental Funds to Net Position of Governmental Funds 31 Statement of Revenues, Expenditures and Changes in Fund Balances Governmental Funds 32 Reconciliation of Net Changes in Fund Balances of Governmental Funds to Change in Net Position of Governmental Activities 33 Statement of Revenues, Expenditures and Change in Fund Balance Budget and Actual - General Fund 34 Statement of Revenues, Expenditures and Change in Fund Balance Budget and Actual - Community Development Special Revenue Fund 39 Statement of Net Position Proprietary Funds 40 Reconciliation of Net Position of Enterprise Funds to Net Position of Business-type Activities 43 Statement of Revenues, Expenses and Changes in Fund Net Position Proprietary Funds 44 Reconciliation of Change in Net Position of Enterprise Funds to Change in Net Position of Business-type Activities 47 Statement of Cash Flows Proprietary Funds 48 Statement of Fiduciary Assets and Liabilities - Fiduciary Funds 52 Statement of Changes in Fiduciary Net Position - Pension and Other Employee Benefit Trust Funds 53 Combining Statement of Net Position Component Units 56 Combining Statement of Activities Component Units 58 Notes to Financial Statements 62
4 Table of Contents Required Supplementary Information: Schedules of Funding Progress and Employer Contributions - Police and Fire Retirement System 100 Schedule of Changes in Net Pension Liability and Related Ratios 101 Schedule of the Net Pension Liability 102 Schedule of City Contributions 103 Schedules of Funding Progress and Employer Contributions: Municipal Employees Retirement System of Michigan 104 Other Postemployment Benefits 105 Combining and Individual Fund Financial Statements and Schedules: Combining Balance Sheet Nonmajor Governmental Funds 108 Combining Statement of Revenues, Expenditures and Changes in Fund Balance Nonmajor Governmental Funds 109 Combining Balance Sheet Nonmajor Special Revenue Funds 110 Combining Statement of Revenues, Expenditures and Changes in Fund Balance Nonmajor Special Revenue Funds 114 Schedule of Revenues, Expenditures and Changes in Fund Balance Final Budget and Actual Nonmajor Special Revenue Funds 118 Combining Balance Sheet Nonmajor Debt Service Funds 128 Combining Statement of Revenues, Expenditures and Changes in Fund Balance Nonmajor Debt Service Funds 130 Combining Balance Sheet Nonmajor Capital Projects Funds 132 Combining Statement of Revenues, Expenditures and Changes in Fund Balance Nonmajor Capital Projects Funds 134 Combining Balance Sheet Nonmajor Permanent Funds 136 Combining Statement of Revenues, Expenditures and Changes in Fund Balance Nonmajor Permanent Funds 137 Combining Statement of Net Position - Nonmajor Enterprise Funds 138 Combining Statement of Revenues, Expenses and Changes in Fund Net Position Nonmajor Enterprise Funds 139 Combining Statement of Cash Flows Nonmajor Enterprise Funds 140 Combining Statement of Net Position Internal Service Funds 142 Combining Statement of Revenues, Expenses and Changes in Fund Net Position Internal Service Funds 143 Combining Statement of Cash Flows Internal Service Funds 144 Combining Statement of Fiduciary Net Position - Pension and Other Employee Benefits Trust Funds 147 Combining Statement of Changes in Assets and Liabilities - Pension and Other Employee Benefits Trust Funds 148 Combining Statement of Fiduciary Net Position - Agency Funds 151 Combining Statement of Changes in Assets and Liabilities - Agency Funds 152 Page
5 Table of Contents Statistical Section (Unaudited) Page Net Position by Component 158 Changes in Net Position 160 Fund Balances - Governmental Funds 164 Changes in Fund Balances - Governmental Funds 166 Changes in Fund Balances - General Fund 168 Assessed and Taxable Value of Property 170 Direct and Overlapping Property Tax Rates 172 Principal Property Taxpayers 174 Property Tax Levies and Collections 177 Number of Water System Customers by User Class 178 Number of Water System Customers by User Class as a Percent of Total 180 Water System Revenues by User Class 182 Water System Revenues by User Class as a Percent of Total Revenue 184 Water System Sales Volume by User Class (Cubic Feet) 186 Water System Sales Volume by User Class as a Percent of Total Sales (Cubic Feet) 188 Water Pumped and Sold (Cubic Feet) 190 Water Revenues and Usage Major Customers 191 Current Water Rates (Beginning as of July 1, 2008) 193 Number of Wastewater System Customers by User Class 194 Wastewater System Customers by User Class as a Percent of Total 196 Wastewater System Revenues by User Class 198 Wastewater System Revenues by User Class as a Percent of Total Revenue 200 Wastewater System Ten Year History of Volumes 203 Wastewater System Sales Volume by User Class (Cubic Feet) 204 Wastewater System Sales Volume by User Class as a Percent of Total Sales (Cubic Feet) 206 Wastewater Revenue and Usage Major Customers 208 Largest Wastewater Customers 209 Current Wastewater Rates 210 Ratios of General Bonded Debt Outstanding 214 Computation of Net Direct and Overlapping Debt 216 Legal Debt Margin 217 Water and Wastewater System Revenue Bond Coverage 218 Demographic and Economic Statistics 219 Principal Employers 220 Full-time Equivalent Employees by Function/Program 222 Operating Indicators by Function/Program 224 Capital Asset Statistics by Function/Program 226 Schedule of Insurance 228
6 This page intentionally left blank.
7 INTRODUCTORY SECTION
8 This page intentionally left blank.
9 December 18, 2014 To the Honorable Mayor, Members of the City Commission and Citizens of the City of Battle Creek: State law requires that all local governments, subject to certain size criteria, publish within six months of the close of each fiscal year a complete set of financial statements presented in conformity with generally accepted accounting principles (GAAP) and audited in accordance with generally accepted auditing standards by a firm of licensed certified public accountants. Pursuant to that requirement, we hereby issue the comprehensive annual financial report of the City of Battle Creek for the fiscal year ended June 30, This report consists of management s representations concerning the finances of the City of Battle Creek. Consequently, management assumes full responsibility for the completeness and reliability of all of the information presented in this report. To provide a reasonable basis for making these representations, City management has established a comprehensive internal control framework that is designed both to protect the government s assets from loss, theft, or misuse and to compile sufficient reliable information for the preparation of the City s financial statements in conformity with GAAP. Because the cost of internal controls should not outweigh their benefits, the City s comprehensive framework of internal controls has been designed to provide reasonable rather than absolute assurance that the financial statements will be free from material misstatement. As management, we assert that, to the best of our knowledge and belief, this financial report is complete and reliable in all material respects. The City s financial statements have been audited by Rehmann Robson, a firm of licensed certified public accountants. The goal of the independent audit was to provide reasonable assurance that the financial statements of the City for the fiscal year ended June 30, 2014 are free of material misstatement. The independent audit involved examining, on a test basis, evidence supporting the amounts and disclosures in the financial statements; assessing the accounting principles used and significant estimates made by management; and evaluating the overall financial statement presentation. The independent auditor concluded, based upon the audit, that there was a reasonable basis for rendering an unmodified opinion that the City s financial statements for the fiscal year ended June 30, 2014 are fairly presented in conformity with GAAP. The independent auditor s report is presented as the first component of the financial section of this report. GAAP require that management provide a narrative introduction, overview, and analysis to accompany the basic financial statements in the form of Management s Discussion and Analysis (MD&A). This letter of transmittal is designed to complement MD&A and should be read in conjunction with it. The City s MD&A can be found immediately following the report of the independent auditors. 1
10 Profile of the Government The City of Battle Creek, incorporated as a City in 1859 and as a Home Rule City in 1913, is located in southwest Michigan, approximately 115 miles west of Detroit and 160 miles northeast of Chicago. It is the largest city in Calhoun County, encompassing an area of 44 square miles, with a current estimated population of 51,848. The City is well known as the breakfast food capital of the world. The government has operated under the commission-manager form of government since Policymaking and legislative authorities are vested in the City Commission, which is comprised of nine members including the mayor. The governing council is responsible, among other things, for passing ordinances and resolutions, making public policy decisions, adopting the budget, appointing boards, commissions, and committees, approving contracts, authorizing real estate transactions, awarding bids, selling property, and hiring the government s manager and attorney. Four commissioners are elected at-large for two-year terms and five commissioners are elected from the five wards in the city, also serving two-year terms. The City Commission elects a Mayor and Vice-Mayor from among its members. The City Manager is the chief administrative officer of the City and is appointed by and serves at the pleasure of the City Commission. The City Manager is responsible for carrying out the policies and ordinances of the City Commission, for overseeing the day-to-day operations of the government, and appointing government s department heads. The City of Battle Creek provides a full range of services including: police and fire protection; the construction and maintenance of highways, streets and other infrastructure; wastewater treatment and disposal; water treatment and distribution; economic development; recreational activities; public transportation services and cultural events. Factors Affecting Financial Condition The information presented in the financial statements is perhaps best understood when it is considered from the broader perspective of the specific environment within which the City of Battle Creek operates. Local economy. The City s economy is diverse with industrial and commercial categories accounting for over 50% of the 2014 taxable valuation. The remainder, primarily residential, provides area residents with convenient and affordable housing to take advantage of the City s industrial, commercial, cultural, educational and recreational opportunities. The City is home to Kellogg Company s world headquarters, the W.K. Kellogg Foundation, and the International Food Protection Training Institute. Battle Creek has many other major corporate community members including Post Cereals, ConAgra Foods, Denso, II Stanley, and Duncan Aviation. The City is revitalizing its downtown to accommodate food science and other innovation industries. Battle Creek s commercial airport and industrial park are diversifying the economy and attracting worldwide business for military, aviation, aerospace and alternative energy. Long term financial planning. The City of Battle Creek believes long-term financial planning has been and will continue to be an important component to ensure the City s fiscal health. Economic development and downtown development continue to be high priorities for the City. Battle Creek Unlimited, a non-profit organization partnering with the City to perform economic development, continues to promote and develop the City s Fort Custer Industrial Park (FCIP) and the downtown in an effort to maintain and enhance the City s tax base. 2
11 Along with efforts to ensure a future growth in tax revenue, the City has developed a Capital Improvement Program (CIP) to identify its long-term capital needs and ability to fund the program. Over the next six years, the City has identified over $131.6 million in capital needs. In September, 2013 the City issued $15,370,000 in general obligation limited tax bonds to fund a number of the capital improvements identified in the CIP including $3.5 million for Downtown Quiet Zone, $3 million for Kellogg Arena Improvements and $1.2 million for a public safety records management system. From an operational perspective, the City s revenue profile is diverse and has shown improvement over the prior year. Income tax revenue accounts for 37.6% of general fund revenues for the year ending June 30, 2014 and has shown growth two of the last three years. Property tax revenue makes up another 32.4% of general fund revenues for the year ending June 30, 2014, and the City has a mill (6.7%) margin available under the Headlee roll-back limit for operation. This could generate approximately $700,000 in additional property tax revenue. June 30, 2014 is the second year in a row the City has shown positive operations in the general fund and added to fund balance. The implementation of a high deductible health care plan and negotiation of lower cost pension benefits for new employees has had positive financial results across all city funds and has allowed flexibility for negotiation of pay raises and contributions to employees health savings accounts. The City will continue to pursue ways to keep costs in line with revenues. Awards and Acknowledgements The Government Finance Officers Association of the United States and Canada (GFOA) awarded a Certificate of Achievement for Excellence in Financial Reporting to the City of Battle Creek for its comprehensive annual financial report (CAFR) for the fiscal year ended June 30, This was the fifteenth consecutive year that the City has received this prestigious award. In order to be awarded a Certificate of Achievement, the government published an easily readable and efficiently organized CAFR. This report satisfied both generally accepted accounting principles and applicable legal requirements. A Certificate of Achievement is valid for a period of one year only. We believe that our current CAFR continues to meet the Certificate of Achievement Program s requirements and we are submitting it to the GFOA to determine its eligibility for another certificate. The preparation of this report would not have been possible without the efficient and dedicated services of the entire staff of the City of Battle Creek. We would like to express our appreciation to all members of the departments who assisted and contributed to the preparation of this report. Credit also must be given to the Mayor and City Commission for their support for maintaining the highest standards of professionalism in the management of the City of Battle Creek s finances. Susan E. Bedsole Interim City Manager / Community Services Director Linda A. Morrison Interim Assistant City Manager / Finance Director [Signatures omitted for security purposes.] 3
12 This page intentionally left blank. 4
13 GFOA Certificate of Achievement 5
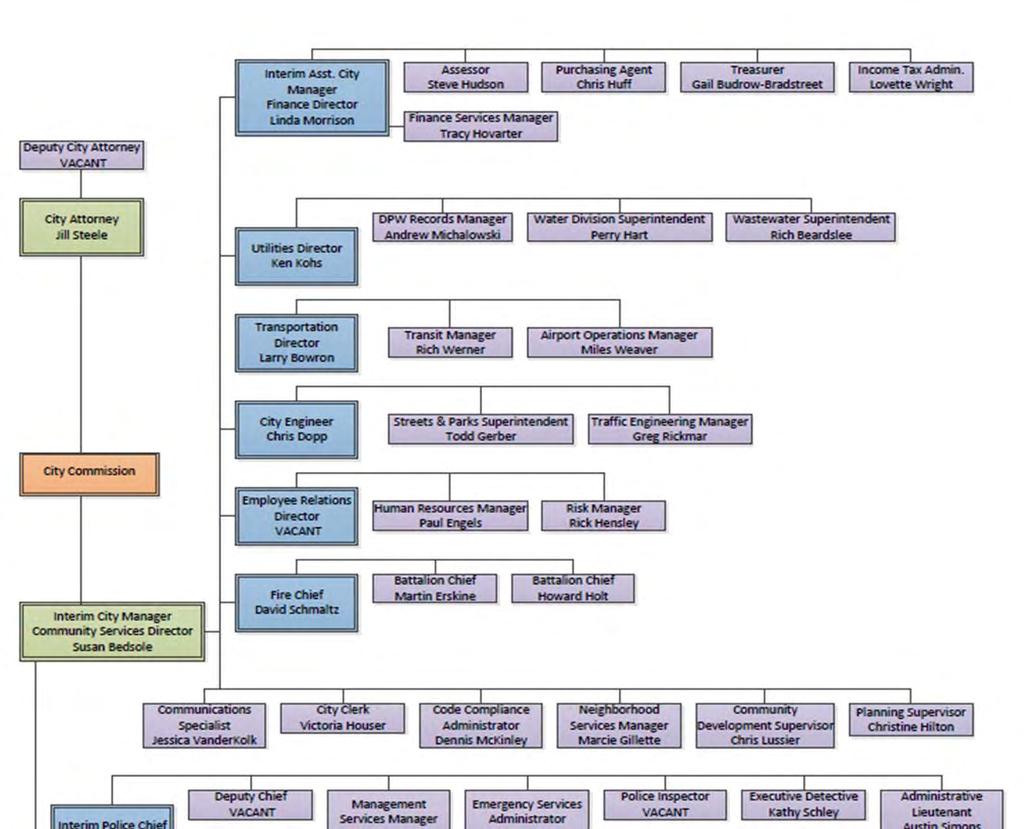
14 Organizational Chart 6
15 List of Principal City Officials CITY COMMISSION: David Walters Mayor Deborah Owens Vice Mayor Susan Baldwin Mark Behnke Jeffrey Domenico Lynn Ward Gray Andy Helmboldt Dean Newsome Mike Sherzer Administration Susan E. Bedsole Interim City Manager/ Community Services Director Jill Humphreys Steele City Attorney Linda A. Morrison Interim Assistant City Manager / Finance Director 7
16 This page intentionally left blank. 8
17 FINANCIAL SECTION 9
18 This page intentionally left blank. 10
19 Rehmann Robson INDEPENDENT AUDITORS' REPORT 675 Robinson Rd. Jackson, MI Ph: Fx: rehmann.com December 18, 2014 Honorable Mayor and Members of the City Commission City of Battle Creek, Michigan Report on the Financial Statements We have audited the accompanying financial statements of the governmental activities, the businesstype activities, the aggregate discretely presented component units, each major fund and the aggregate remaining fund information of the City of Battle Creek, Michigan (the "City") as of and for the year ended June 30, 2014, and the related notes to the financial statements, which collectively comprise the City's basic financial statements as listed in the table of contents. Management's Responsibility for the Financial Statements Management is responsible for the preparation and fair presentation of these financial statements in accordance with accounting principles generally accepted in the United States of America; this includes the design, implementation, and maintenance of internal control relevant to the preparation and fair presentation of financial statements that are free from material misstatement, whether due to fraud or error. Independent Auditors' Responsibility Our responsibility is to express opinions on these financial statements based on our audit. We conducted our audit in accordance with auditing standards generally accepted in the United States of America and the standards applicable to financial audits contained in Government Auditing Standards, issued by the Comptroller General of the United States. Those standards require that we plan and perform the audit to obtain reasonable assurance about whether the financial statements are free from material misstatement. An audit involves performing procedures to obtain audit evidence about the amounts and disclosures in the financial statements. The procedures selected depend on the auditor s judgment, including the assessment of the risks of material misstatement of the financial statements, whether due to fraud or error. In making those risk assessments, the auditor considers internal control relevant to the entity s preparation and fair presentation of the financial statements in order to design audit procedures that are appropriate in the circumstances, but not for the purpose of expressing an opinion on the effectiveness of the City s internal control. Accordingly, we express no such opinion. An audit also includes evaluating the appropriateness of accounting policies used and the reasonableness of significant accounting estimates made by management, as well as evaluating the overall presentation of the financial statements. We believe that the audit evidence we have obtained is sufficient and appropriate to provide a basis for our audit opinions. Rehmann is an independent member of Nexia International. CPAs & Consultants Wealth Advisors Corporate Investigators 11
20 Opinions In our opinion, the financial statements referred to above present fairly, in all material respects, the respective financial position of the governmental activities, the business-type activities, the aggregate discretely presented component units, each major fund and the aggregate remaining fund information of the City of Battle Creek, Michigan, as of June 30, 2014, and the respective changes in financial position and the respective budgetary comparison for the general fund and community development special revenue fund for the year then ended in accordance with accounting principles generally accepted in the United States of America. Implementation of GASB Statement No. 67 The City implemented the provisions of GASB Statement No. 67, Financial Reporting for Pension Plans, in the current year. While there was no effect on the amounts reported in the financial statements themselves, there were substantial changes to the disclosures found in Note 17 to the financial statements, including the calculation of the City's net pension liability, which will be required to be recorded by the City in its next fiscal year. Our opinion is not modified with respect to this matter. Other Matters Required Supplementary Information Accounting principles generally accepted in the United States of America require that management's discussion and analysis and the schedules of funding progress and employer contributions listed in the table of contents be presented to supplement the basic financial statements. Such information, although not a part of the basic financial statements, is required by the Governmental Accounting Standards Board who considers it to be an essential part of financial reporting for placing the basic financial statements in an appropriate operational, economic, or historical context. We have applied certain limited procedures to the required supplementary information in accordance with auditing standards generally accepted in the United States of America, which consisted of inquiries of management about the methods of preparing the information and comparing the information for consistency with management s responses to our inquiries, the basic financial statements, and other knowledge we obtained during our audit of the basic financial statements. We do not express an opinion or provide any assurance on the information because the limited procedures do not provide us with sufficient evidence to express an opinion or provide any assurance. Other Information Our audit was conducted for the purpose of forming opinions of the financial statements that collectively comprise the City's basic financial statements. The introductory section, combining and individual fund financial statements and schedules, and statistical section are presented for purposes of additional analysis and are not a required part of the basic financial statements. The combining and individual fund financial statements and schedules are the responsibility of management and were derived from and relate directly to the underlying accounting and other records used to prepare the basic financial statements. Such information has been subjected to the auditing procedures applied in the audit of the basic financial statements and certain additional procedures, including comparing and reconciling such information directly to the underlying accounting and other records used to prepare the basic financial statements or to the basic financial statements themselves, and other additional procedures in accordance with auditing standards generally accepted in the United States of America. In our opinion, the combining and individual fund financial statements and schedules are fairly stated, in all material respects, in relation to the basic financial statements as a whole. 12
21 The introductory section and statistical tables have not been subjected to the auditing procedures applied in the audit of the basic financial statements, and accordingly, we do not express an opinion or provide any assurance on them. Other Reporting Required by Government Auditing Standards In accordance with Government Auditing Standards, we have also issued, under separate cover, our report dated December 18, 2014 on our consideration of the City of Battle Creek, Michigan's internal control over financial reporting and on our tests of its compliance with certain provisions of laws, regulations, contracts, and grant agreements and other matters. The purpose of that report is to describe the scope of our testing of internal control over financial reporting and compliance and the results of that testing, and not to provide an opinion on internal control over financial reporting or on compliance. That report is an integral part of an audit performed in accordance with Government Auditing Standards in considering the City's internal control over financial reporting and compliance. 13
22 This page intentionally left blank. 14
23 MANAGEMENT'S DISCUSSION AND ANALYSIS 15
24 Management's Discussion and Analysis As management of the City of Battle Creek, Michigan, we offer readers of the City s financial statements this narrative overview and analysis of the financial activities of the City for the fiscal year ended June 30, We encourage readers to consider the information presented here in conjunction with additional information that we have furnished in our letter of transmittal, as noted in the table of contents. Financial Highlights The assets and deferred outflows of resources of the City exceeded its liabilities and deferred inflows of resources at the close of the most recent fiscal year by $343,031,820 (net position). Of this amount, $34,456,702 (unrestricted net position) may be used to meet the government s ongoing obligations to citizens and creditors. The government s total net position decreased by $5,461,329. As of the close of the current fiscal year, the City s governmental funds reported combined ending fund balances of $23,688,184, an increase of $10,710,919 in comparison with the prior year. Approximately 27% of the combined fund balance, or $6,449,504 was available for spending at the City's discretion ('unassigned fund balance"). At the end of the current fiscal year, unassigned fund balance for the general fund was $6,580,891 or 15.3% of total budgeted general fund operating revenues. The City s total bonded debt increased by $11,925,000 during the current fiscal year. The City issued a new bond and also advance refunded a bond. Combined enterprise funds net position increased $333,682. This included an increase of $1,484,868 in net position of the water and wastewater system fund. Overview of the Financial Statements This discussion and analysis is intended to serve as an introduction to the City s basic financial statements. The City s basic financial statements are comprised of three components: 1) government-wide financial statements, 2) fund financial statements, and 3) notes to the financial statements. This report also contains other supplementary information in addition to the basic financial statements themselves. Government-wide financial statements. The government-wide financial statements are designed to provide readers with a broad overview of the City s finances, in a manner similar to a private sector business. The statement of net position presents information on all of the City s assets, deferred outflows of resources, and liabilities, with the difference between the three reported as net position. Over time, increases or decreases in net position may serve as a useful indicator of whether the financial position of the City is improving or deteriorating. The statement of activities presents information shows how the government s net position changed during the most recent fiscal year. All changes in net position are reported as soon as the underlying event giving rise to the change occurs, regardless of the timing of related cash flows. Thus, revenues and expenses are reported in this statement for some items that will only result in cash flows in future fiscal periods (e.g., earned but unused vacation leave). Both of the government-wide financial statements distinguish functions of the City that are principally supported by taxes and intergovernmental revenues (governmental activities) from other functions that are intended to recover all or a significant portion of their costs through user fees and charges (business-type activities). The governmental activities of the City include general government, public safety, public works, highways and streets, parks and recreation and community development. The business-type activities of the City include wastewater, water, public transit, solid waste collection and other enterprise operations. 16
25 Management's Discussion and Analysis The government-wide financial statements include not only the City itself (known as the primary government), but also legally separate entities for which the City is financially accountable. Financial information for these component units are reported separately from the financial information presented for the primary government itself. These component units include the Downtown Development Authority, the Lakeview Downtown Development Authority, the Tax Incremental Financing Authority, the Brownfield Redevelopment Authority and the Local Development Finance Authority. The Building Authority, although also legally separate, functions for all practical purposes as a department of the City, and therefore has been included as an integral part of the primary government. Fund financial statements. A fund is a grouping of related accounts that is used to maintain control over resources that have been segregated for specific activities or objectives. The City, like other state and local governments, uses fund accounting to ensure and demonstrate compliance with finance-related legal requirements. All of the funds of the City can be divided into three categories: governmental funds, proprietary funds, and fiduciary funds. Governmental funds. Governmental funds are used to account for essentially the same functions reported as governmental activities in the government-wide financial statements. However, unlike the government-wide financial statements, governmental fund financial statements focus on near-term inflows and outflows of spendable resources, as well as on balances of spendable resources available at the end of the fiscal year. Such information may be useful in evaluating a government s near-term financing requirements. Because the focus of governmental funds is narrower than that of the government-wide financial statements, it is useful to compare the information presented for governmental funds with similar information presented for governmental activities in the government-wide financial statements. By doing so, readers may better understand the long-term impact of the government s near-term financing decisions. Both the governmental fund balance sheet and the governmental fund statement of revenues, expenditures, and changes in fund balances provide a reconciliation to facilitate this comparison between governmental funds and governmental activities. The City maintains 24 individual governmental funds. Information is presented separately in the governmental fund balance sheet and in the governmental fund statement of revenues, expenditures, and changes in fund balances for the general fund, community development special revenue fund and capital improvements capital projects fund, which are considered to be major funds. Data from the other 21 governmental funds are combined into a single, aggregated presentation. Individual fund data for each of these nonmajor governmental funds is provided in the form of combining statements elsewhere in this report. The City adopts an annual appropriated budget for its general and special revenue funds. Budgetary comparison statements or schedules have been provided herein to demonstrate compliance with those budgets. Proprietary funds. The City maintains two different types of proprietary funds. Enterprise funds are used to report the same functions presented as business-type activities in the government-wide financial statements. The City uses enterprise funds to account for its wastewater, water, public transit, solid waste collection and other operations. Internal service funds are an accounting device used to accumulate and allocate costs internally among the City s various functions. The City uses internal service funds to account for its equipment maintenance, self-insurance, information management services and printing/reproduction services. Because these services predominantly benefit governmental rather than business-type functions, they have been included within governmental activities in the government-wide financial statements. Proprietary funds provide the same type of information as the government-wide financial statements, only in more detail. The proprietary fund financial statements provide separate information for the wastewater and water system fund, economic development fund and W.K. Kellogg Airport fund, which are considered to be major funds of the City. Conversely, all of the internal service funds are combined into a single, aggregated presentation in the proprietary fund financial statements. Individual fund data for the internal service funds is provided in the form of combining statements elsewhere in this report. Fiduciary funds. Fiduciary funds are used to account for resources held for the benefit of parties outside the government. Fiduciary funds are not reflected in the government-wide financial statements because the resources of those funds are not available to support the City s own programs. The accounting used for fiduciary funds is much like that used for proprietary funds. 17
26 Management's Discussion and Analysis Notes to the financial statements. The notes provide additional information that is essential to a full understanding of the data provided in the government-wide and fund financial statements. Other information. In addition to the basic financial statements and accompanying notes, this report also presents certain required supplementary information. This includes three schedules concerning the City s progress in funding its obligation to provide pension and other postemployment benefits to its employees. The combined statements referred to earlier in connection with nonmajor, internal service and fiduciary funds are presented immediately following the required supplementary information. Government-wide Financial Analysis As noted earlier, net position may serve over time as a useful indicator of a government s financial position. In the case of the City of Battle Creek, assets and deferred outflows of resources exceeded liabilities and deferred inflows of resources by $343,031,820 at the close of the most recent fiscal year. By far the largest portion of the City s net position (86 percent) reflects its investment in capital assets (e.g., land, buildings, vehicles, equipment, systems and infrastructure), less any related debt used to acquire those assets that are still outstanding. The City uses these capital assets to provide services to citizens; consequently, these assets are not available for future spending. Although the City s investment in its capital assets is reported net of related debt, it should be noted that the resources needed to repay this debt must be provided from other sources, since the capital assets themselves cannot be used to liquidate these liabilities. Net Position Governmental activities Business-type activities Total Assets Current and other assets $ 52,781,707 $ 38,416,953 $ 23,359,348 $ 22,157,340 $ 76,141,055 $ 60,574,293 Capital assets 234,890, ,290, ,167, ,075, ,057, ,365,690 Total assets 287,671, ,707, ,527, ,232, ,199, ,939,983 Deferred outflows of resources Deferred charge on refunding 255, , , , , ,510 Liabilities Other liabilities 22,777,465 16,269,048 2,188,811 1,884,690 24,966,276 18,153,738 Long-term liabilities 34,845,929 21,094,961 10,755,193 12,691,334 45,601,122 33,786,295 Total liabilities 57,623,394 37,364,009 12,944,004 14,576,024 70,567,398 51,940,033 Deferred inflows of resources Deferred gain on refunding - 25, ,311 Net position Net investment in capital assets 213,803, ,155,508 92,099,833 92,885, ,903, ,040,706 Restricted 2,671,582 3,326, ,671,582 3,326,396 Unrestricted 13,828,647 16,137,588 20,628,055 19,988,459 34,456,702 36,126,047 Total net position $ 230,303,932 $ 235,619,492 $ 112,727,888 $ 112,873,657 $ 343,031,820 $ 348,493,149 18
27 Management's Discussion and Analysis An additional portion of the City s net position (0.8 percent) represents resources that are subject to external restrictions on how they may be used. The remaining balance of unrestricted net position (10.0 percent or $34,456,702) may be used to meet the government s ongoing obligations to citizens and creditors. At the end of the current fiscal year, the City is able to report positive balances in all three categories of net position, both for the government as a whole, as well as for its governmental and business-type activities; the same held true for the prior fiscal year. The City s net position decreased by $5,461,329 during the current year as compared to a prior year decrease of $3,266,929. The change in the amount of the decrease between the current and prior year was $2,194,400; there are a variety of offsetting increases and decreases in the revenues and expenses and between the governmental and business-type activities, which are discussed in the succeeding sections. Changes in Net Position Governmental activities Business-type activities Total Revenue: Program revenue: Charges for services $ 7,489,959 $ 8,878,555 $ 31,347,774 $ 30,132,800 $ 38,837,733 $ 39,011,355 Grants and contributions - Operating 10,289,625 12,618,453 3,571,072 5,060,638 13,860,697 17,679,091 General revenue: Property taxes 16,258,935 15,809, ,258,935 15,809,783 Income taxes 16,093,707 16,234, ,093,707 16,234,540 Unrestricted grants and contributions 5,336,347 5,271, ,336,347 5,271,399 Other 953, ,196 96,548 (63,487) 1,049, ,709 ` Total revenue 56,421,609 59,183,926 35,015,394 35,129,951 91,437,003 94,313,877 Expenses: General government 12,208,561 10,372, ,208,561 10,372,803 Public safety 27,215,335 26,952, ,215,335 26,952,192 Public works 2,199,624 1,891, ,199,624 1,891,765 Highways and streets 9,731,567 11,585, ,731,567 11,585,808 Parks and recreation 5,759,128 6,323, ,759,128 6,323,529 Community development 3,019,449 4,907, ,019,449 4,907,271 Interest on long-term debt 1,206, , ,206, ,018 Sewer ,642,028 15,247,288 15,642,028 15,247,288 Water - - 7,930,788 7,520,760 7,930,788 7,520,760 Transit system - - 4,814,924 4,924,554 4,814,924 4,924,554 Solid waste collection - - 3,004,407 2,940,000 3,004,407 2,940,000 Airport - - 2,485,677 2,511,613 2,485,677 2,511,613 Parking - - 1,549,455 1,509,283 1,549,455 1,509,283 Economic development , , , ,922 Total expenses 61,340,653 62,778,386 35,557,679 34,802,420 96,898,332 97,580,806 Increase (decrease) in net position before transfers (4,919,044) (3,594,460) (542,285) 327,531 (5,461,329) (3,266,929) Transfers (396,516) (349,082) 396, , Change in net position (5,315,560) (3,943,542) (145,769) 676,613 (5,461,329) (3,266,929) Net position, beginning of year 235,619, ,563, ,873, ,197, ,493, ,760,078 Net position, end of year $ 230,303,932 $ 235,619,492 $ 112,727,888 $ 112,873,657 $ 343,031,820 $ 348,493,149 19
28 Management's Discussion and Analysis Governmental activities. Governmental activities decreased the City s net position by $5,315,560 (as compared to a prior year decrease of $3,943,542). Key elements of this decrease and the change from the prior year include: Total revenue decreased by $2.8 million primarily as a result of decreased federal intergovernmental and other revenue from the neighborhood stabilization program in the Community Development Block Grant fund. This $2.1 million decrease in revenue has a corresponding decrease in expenses. Business type activities. Business type activities decreased the City s net position by $145,769 as compared to an increase of $676,613 the prior year. Key elements of this decrease and the change from the prior year include: Water and wastewater charges for services increased $817,772 over the prior year offset with a corresponding increase in contractual expenses. Revenue increases include a rate increase that was effective 7/1/13. Contractual expenses increased due to two major on-going capital projects in the water and wastewater systems: the Pulver Dryer solids handling project and water meter replacement project. Financial Analysis of the City s Governmental Funds As noted earlier, the City uses fund accounting to ensure and demonstrate compliance with finance-related legal requirements. Governmental funds. The focus of the City s governmental funds is to provide information on near-term inflows, outflows, and balances of spendable resources. Such information is useful in assessing the City s financing requirements. In particular, unassigned fund balance may serve as a useful measure of a government s net resources available for spending at the end of the fiscal year. As of the end of the current fiscal year, the City s governmental funds reported combined ending fund balances of $23,688,184 an increase of $10,710,919 in comparison with the prior year. Nonspendable portion of fund balance has increased from $1,460,910 to $1,501,305. Nonspendable fund balance is not available for new spending because it has been set aside for the following purposes: to generate income for the support and maintenance of the youth center and Kellogg Arena ($879,909); and for inventories and prepaid expenditures ($621,396). A new fund was added to the governmental funds for the year ending June 30, 2014 to account for the capital improvement bonds that were sold in September Proceeds of $15,370,000 plus a premium of $383,666 were partially spent in the current fiscal year, with some projects being longer term. These projects include repairs to the City s linear park, parking lot repairs in many of the City s parks, decorative lighting upgrades along a major corridor, culvert replacements and a diversion channel in addition to the projects discussed in the letter of transmittal. The general fund is the chief operating fund of the City. At the end of the current fiscal year, unassigned fund balance (which is only reported in the general fund) was $6,580,891, while total fund balance was $8,149,022. In accordance with the City s adopted fund balance policy, the minimum unassigned fund balance in the general fund of no less than 8 percent of current year budgeted operating revenue has been met. The percent as of June 30, 2014 is 15.3%. The fund balance of the City s general fund increased by $479,877 during the current fiscal year. This was favorable as compared to the final budgeted decrease in fund balance of $180,532. The community development fund has a fund balance of $46 which increased from the previous year of no fund balance. Original budget estimates anticipated a greater level of activity than actually occurred; however, community development grant funds may be carried over to subsequent years. Proprietary funds. The City s proprietary funds provide the same type of information found in the government-wide financial statements, but in more detail. 20
29 Management's Discussion and Analysis Unrestricted net position of the water and wastewater system fund at the end of the year amounted to $7,678,908. The fund had an increase in total net position for the year of $1,484,868. Factors concerning the finances of this fund have already been addressed in the discussion of the City s business type activities. The economic development fund had total net position at the end of the year of $9,860,823, all of which was unrestricted. For the year, the fund had a decrease in net position of $38,829. The W.K. Kellogg Airport fund had total net position of $11,464,500 of which $552,018 was unrestricted; the fund had a decrease in net position of $589,506 for the year. The decrease in net position is due to depreciation. The substantial decrease in W.K. Kellogg Airport intergovernmental subsidies from the prior year is the completion in the prior year of a federal noise mitigation grant used to purchase properties within an identified area around the airport. The Battle Creek Transit System had a total net position of $2,942,362 of which $726,226 was unrestricted; the fund had a decrease in net position of $504,155 for the year primarily as a result of depreciation expense. General Fund Budgetary Highlights Mid-year adjustments were made to the general fund budget to account for minor changes in transfers out and departmental budgeted revenues. Budgeted expenses also increased for any prior year encumbrances carried forward, as they are a use of the prior year fund balance and were reflected in the assigned fund balance at 6/30/13. Net change in fund balance for the general fund was an increase of $479,877 compared to a budgeted decrease of $180,532. This is primarily due to departmental savings from changes in health insurance to a high deductible plan. Capital Assets and Debt Administration Capital Assets. The City s investment in capital assets for its governmental and business-type activities as of June 30, 2014, amounted to $337,057,980 (net of accumulated depreciation). This investment in capital assets includes land, improvements, buildings, systems, vehicles and equipment, park facilities, roads, highways, and bridges. Net capital assets for governmental activities increased by 0.3%, and for business-type activities decreased by 2.8%. Overall, total net capital assets for the City decreased by 1%. City of Battle Creek's Capital Assets (Net of Depreciation) Governmental activities Business-type activities Total Land and land improvements $ 15,106,878 $ 7,603,222 $ 5,436,093 $ 5,226,546 $ 20,542,971 $ 12,829,768 Construction in progress 6,192,398 9,003,623 3,870,017-10,062,415 9,003,623 Buildings 28,748,440 30,084,603 18,134,556 19,928,338 46,882,996 50,012,941 Vehicles 2,024,361 2,072, ,003 1,000,884 2,590,364 3,073,416 Equipment 2,454,457 2,978,149 1,000,854 1,606,489 3,455,311 4,584,638 Systems ,160,304-73,160,304 - Infrastructure 180,363, ,548,296-77,313, ,363, ,861,304 Total $ 234,890,153 $ 234,290,425 $ 102,167,827 $ 105,075,265 $ 337,057,980 $ 339,365,690 Major capital asset events during the current fiscal year included: Fleet operation purchases of vehicles and equipment in the amount of $580,335. The completion of the Downtown Transformation project (a multi-year endeavor) resulted in total additions to capital assets of $8,158,579. Additional information on the City s capital assets can be found in note 8 to the financial statements. 21
30 Management's Discussion and Analysis Long term debt. At the end of the current fiscal year, the City had total bonded debt outstanding of $38,185,000. Of this amount, $28,790,000 is comprised of debt backed by the full faith and credit of the government. The remainder of the City s bonded debt represents bonds secured solely by specified revenue sources. General Obligation and Revenue Bonds Governmental activities Business-type activities Total General obligation bonds $ 28,790,000 $ 15,130,000 $ - $ - $ 28,790,000 $ 15,130,000 Revenue bonds - - 9,395,000 11,130,000 9,395,000 11,130,000 Total $ 28,790,000 $ 15,130,000 $ 9,395,000 $ 11,130,000 $ 38,185,000 $ 26,260,000 The City s total bonded debt increased by $11,925,000 (45.4 percent) during the current fiscal year. During the year the City issued a new bond for capital improvements in the amount of $15,370,000 and also advance refunded a bond. The following chart depicts the City s credit rating for the various outstanding debt and the different rating agencies: Moody's S&P Fitch General obligation limited tax bonds Aa3 AA- AA Water and wastewater revenue bonds Aa3 A AA- State statutes limit the amount of general obligation debt a governmental entity may issue to 10 percent of its total state equalized valuation. The current debt limitation for the City is $160,147,070 which is significantly in excess of the City s outstanding general obligation debt. Additional information on the City s long term debt can be found in note 11 to the financial statements. Economic Factors City Administration, accompanied by a representative from Battle Creek Unlimited, visited bond rating agencies in July 2013 in anticipation of the sale of the $15 million capital improvement bond issue. The City of Detroit had just declared bankruptcy, and there was much speculation within the municipal bond industry. The City of Battle Creek had all three bond ratings affirmed even in light of what was called the Michigan penalty due to management s demonstrated ability to maintain adequate and stable general fund reserves despite revenue pressures and economic and real estate pressures in the area. Next Year s Budgets and Rates Developed the fiscal year ending June 30, 2015 budget with no increase in property taxes. Increased budgeted income tax revenue $100,000 for compliance. Included a 1% increase in general fund expenditures. Included 2-2.5% wage raises in many collective bargaining agreements. Continued the progress of health insurance plan savings due to transition to high deductible plans with City contributions to health savings accounts. Requests for Information This financial report is designed to provide a general overview of the City s finances for all those with an interest in the government s finances. The financial statements are available on the City s web site: Questions concerning any of the information provided in this report or requests for additional financial information should be addressed to the City Finance Director, P.O. Box 1717, Battle Creek, Michigan
31 BASIC FINANCIAL STATEMENTS 23
32 GOVERNMENT-WIDE FINANCIAL STATEMENTS 24
33 Statement of Net Position June 30, 2014 Primary Government Governmental Business-type Component Activities Activities Total Units Assets Pooled cash and investments $ 37,800,375 $ 14,521,290 $ 52,321,665 $ 26,243,859 Receivables 10,147,870 6,583,951 16,731,821 3,298,968 Receivables, long-term portion 4,075, ,372 4,315,372 4,070,718 Internal balances (600,474) 600, Inventories, prepaid items and other assets 1,358,936 1,413,261 2,772,197 16,542 Capital assets not being depreciated 8,243,038 7,322,880 15,565,918 13,107,100 Capital assets being depreciated, net 226,647,115 94,844, ,492,062 1,039,745 Total assets 287,671, ,527, ,199,035 47,776,932 Deferred outflows of resources Deferred charge on refunding 255, , ,183 1,759,939 Liabilities Accounts payable and accrued liabilities 12,160,584 2,076,096 14,236,680 2,647,194 Accrued interest payable 262, , ,827 Unearned revenue 1,041, ,715 1,153,919 - Long-term liabilities: Due within one year 3,839,104 2,700,962 6,540,066 3,907,521 Due in more than one year 31,006,825 8,054,231 39,061,056 47,220,297 Other liability due in more than one year - net other postemployment benefits liability 9,312,938-9,312,938 - Total liabilities 57,623,394 12,944,004 70,567,398 54,126,839 Net position Net investment in capital assets 213,803,703 92,099, ,903,536 14,146,845 Restricted for: Debt service 58,357-58,357 - Capital projects 1,663,316-1,663,316 - Endowment - nonexpendable 879, ,909 - Endowment - expendable 70,000-70,000 - Other purposes ,414,804 Unrestricted (deficit) 13,828,647 20,628,055 34,456,702 (20,151,617) Total net position (deficit) $ 230,303,932 $ 112,727,888 $ 343,031,820 $ (4,589,968) The accompanying notes are an integral part of these financial statements. 25
34 Statement of Activities For the Year Ended June 30, 2014 Program Revenues Operating Capital Charges Grants and Grants and Net (Expense) Functions / Programs Expenses for Services Contributions Contributions Revenues Primary government Governmental activities: General government $ 12,208,561 $ 2,824,535 $ 2,197,872 $ - $ (7,186,154) Public safety 27,215, , ,794 - (25,510,413) Public works 2,199, ,493 92,427 - (1,905,704) Highways and streets 9,731,567 27,929 5,758,357 - (3,945,281) Parks and recreation 5,759,128 3,250, (2,508,178) Community development 3,019, ,924 1,443,175 - (1,298,350) Interest on long-term debt 1,206, (1,206,989) Total governmental activities 61,340,653 7,489,959 10,289,625 - (43,561,069) Business-type activities: Wastewater 15,642,028 15,586,240 18,775 - (37,013) Water 7,930,788 9,465,371 31,852-1,566,435 Public transit 4,814, ,705 2,917,721 - (1,471,498) Solid waste collection 3,004,407 3,082, ,762 Airport 2,485,677 1,365, ,724 - (517,206) Parking 1,549,455 1,330, (218,484) Economic development 130,400 91, (38,829) Total business-type activities 35,557,679 31,347,774 3,571,072 - (638,833) Total primary government $ 96,898,332 $ 38,837,733 $ 13,860,697 $ - $ (44,199,902) Component units Community development $ 11,175,739 $ 186,329 $ - $ 480,301 $ (10,509,109) continued 26
35 Statement of Activities For the Year Ended June 30, 2014 Primary Government Governmental Business-type Component Activities Activities Total Units Changes in net position Net revenues (expense) $ (43,561,069) $ (638,833) $ (44,199,902) $ (10,509,109) General revenues: Property taxes 16,258,935-16,258,935 14,252,945 Income taxes 16,093,707-16,093,707 - Grants and contributions not restricted to specific programs 5,336,347-5,336,347 - Unrestricted investment earnings 953,036 96,548 1,049, ,866 Transfers (396,516) 396, Total general revenues and transfers 38,245, ,064 38,738,573 15,047,811 Change in net position (5,315,560) (145,769) (5,461,329) 4,538,702 Net position (deficit), beginning of year 235,619, ,873, ,493,149 (9,128,670) Net position (deficit), end of year $ 230,303,932 $ 112,727,888 $ 343,031,820 $ (4,589,968) concluded. The accompanying notes are an integral part of these financial statements. 27
36 This page intentionally left blank. 28
37 FUND FINANCIAL STATEMENTS 29
38 Balance Sheet Governmental Funds June 30, 2014 Capital Nonmajor Total Community Improvements Governmental Governmental General Development Bond Funds Funds Assets Pooled cash and investments $ 7,489,947 $ - $ 12,309,291 $ 5,690,982 $ 25,490,220 Receivables: Interest 133, , ,033 Accounts 2,118,190 48,122-1,223,312 3,389,624 Special assessments 204, ,818 Grants 39, , , ,346 Loans 1,866,805 2,771, ,000-4,888,242 Inventories 9, , ,855 Prepaid items 475, , ,541 Interfund receivable 930, ,157 Total assets $ 13,267,790 $ 2,933,260 $ 12,559,314 $ 7,280,472 $ 36,040,836 Liabilities Accounts payable $ 1,276,961 $ 20,404 $ 1,904,815 $ 966,529 $ 4,168,709 Accrued payroll 1,749, ,749,122 Retentions, deposits and other liabilities , ,364 Interfund payable - 141, , ,761 Unearned revenue 70, , ,924 Total liabilities 3,096, ,777 1,904,815 2,395,476 7,558,880 Deferred inflows of resources Unavailable revenue: Loans receivable 1,866,805 2,771, ,638,242 Special assessments 155, ,530 Total deferred inflows of resources 2,021,956 2,771, ,793,772 Fund balances Nonspendable 484, ,016,652 1,501,305 Restricted 147, ,654, ,880 11,624,559 Committed 844, ,436,895 3,281,519 Assigned 91, , ,297 Unassigned (deficit) 6,580, (131,387) 6,449,504 Total fund balances 8,149, ,654,499 4,884,617 23,688,184 Total liabilities, deferred inflows of resources and fund balances $ 13,267,790 $ 2,933,260 $ 12,559,314 $ 7,280,472 $ 36,040,836 The accompanying notes are an integral part of these financial statements. 30
39 Reconciliation Fund Balances of Governmental Funds to Net Position of Governmental Activities June 30, 2014 Fund balances - total governmental funds $ 23,688,184 Amounts reported for governmental activities in the statement of net position are different because: Capital assets used in governmental activities are not financial resources and therefore are not reported in the funds. Capital assets 385,428,022 Accumulated depreciation (153,490,857) Internal service funds are used by management to charge the costs of certain equipment usage to individual governmental funds. The assets and liabilities of the internal service funds are included in governmental activities in the statement of net position. Net position of governmental internal service funds 10,000,305 Portion of internal service funds net operating income attributed to business-type funds (600,474) Because the focus of governmental funds is on short-term financing, some assets will not be available to pay for current expenditures. Those assets (i.e., receivables) are offset by deferred outflows of resources in the governmental funds and, therefore, not included in fund balance. Unavailable special assessments 155,530 Loans receivable related to the sale of capital assets and other loans 4,638,242 Gains and losses on refunding are not reported in the governmental funds, whereas they are capitalized and amortized for net position. Deferred charge on refunding 255,466 Certain liabilities, such as bonds payable, are not due and payable in the current period and therefore are not reported in the funds. Bonds and installment contracts payable (31,996,415) Receivables from other entities for their share of debt 4,515,000 Accrued interest on bonds and installment contracts payable (262,739) Net other postemployment benefits liability (9,312,938) Compensated absences (2,713,394) Net position of governmental activities $ 230,303,932 The accompanying notes are an integral part of these financial statements. 31
40 Statement of Revenues, Expenditures and Changes in Fund Balances Governmental Funds For the Year Ended June 30, 2014 Capital Nonmajor Total Community Improvements Governmental Governmental General Development Bond Funds Funds Revenues Taxes $ 30,777,650 $ - $ - $ 1,574,992 $ 32,352,642 Licenses and permits 744, , ,738 Intergovernmental 6,659,514 1,088,562-7,695,029 15,443,105 Charges for services 1,981, ,538,976 4,520,247 Fines and forfeitures 134, ,497 Investment earnings 511, ,894 35, ,839 Contributions , ,742 Other 1,965,686 99, ,600 2,823,774 Total revenues 42,774,315 1,366,726 12,894 12,747,649 56,901,584 Expenditures Current expenditures: General government 7,225,082-4,799,722 1,193,236 13,218,040 Public safety 25,303, ,036 25,587,422 Public works 2,152, ,152,726 Highway and streets ,261,973 9,261,973 Parks and recreation 2,708, ,076,524 4,784,815 Community development - 1,364, ,984 1,725,369 Inspections , ,325 Unallocated 1,272, ,272,866 Debt service: Principal retirement ,960,721 1,960,721 Interest ,183,898 1,183,898 Bond issuance costs , ,339 Total expenditures 38,662,351 1,364,385 5,112,061 16,759,697 61,898,494 Revenue over (under) expenditures 4,111,964 2,341 (5,099,167) (4,012,048) (4,996,910) Other financing sources (uses) Issuance of bonds ,370,000-15,370,000 Premium on issuance of bonds , ,666 Transfers in 16, ,383,517 5,400,117 Transfers out (3,648,687) (2,295) - (1,794,972) (5,445,954) Total other financing sources (uses) (3,632,087) (2,295) 15,753,666 3,588,545 15,707,829 Net change in fund balances 479, ,654,499 (423,503) 10,710,919 Fund balances, beginning of year 7,669, ,308,120 12,977,265 Fund balances, end of year $ 8,149,022 $ 46 $ 10,654,499 $ 4,884,617 $ 23,688,184 The accompanying notes are an integral part of these financial statements. 32
41 Reconciliation Net Changes in Fund Balances of Governmental Funds to Change in Net Position of Governmental Activities For the Year Ended June 30, 2014 Net change in fund balances - total governmental funds $ 10,710,919 Amounts reported for governmental activities in the statement of activities are different because: Governmental funds report capital outlays as expenditures. However, in the statement of activities, the cost of those assets is allocated over their estimated useful lives and reported as depreciation expense. Capital outlay 9,205,954 Depreciation expense (8,454,644) Revenues in the statement of activities that do not provide resources are not reported as revenues in the funds, but rather deferred to subsequent fiscal years. Change in special assessments (87,692) Change in assets held for resale (175,099) Change in unearned revenues related to loans receivable (313,787) Bond proceeds provide current financial resources to governmental funds in the period issued, but issuing bonds increases long-term liabilities in the statement of net position. Repayment of bond principal is an expenditure in the governmental funds, but the repayment reduces long-term liabilities in the statement of net position. Principal payments on long-term liabilities 1,960,721 Amount received from other entities for their share of debt principal (425,000) Proceeds from issuance of long-term debt (15,370,000) Premium from issuance of long-term debt (383,666) Internal service funds are used by management to charge the costs of certain equipment usage to individual governmental funds. The net revenues (expense) attributable to those funds is reported with governmental activities. Net operating loss from governmental activities in internal service funds (954,031) Interest earnings from governmental internal service funds 207,816 Interest paid from governmental activities in internal service funds (1,574) Gain on disposal of capital assets 33,504 Transfers received in governmental internal service funds 689,760 Transfers made from governmental internal services funds (1,040,439) Some expenses reported in the statement of activities do not require the use of current financial resources and therefore are not reported as expenditures in the funds. Change in accrued interest payable on bonds (21,517) Change in net other postemployment benefits liability (722,258) Change in the accrual for compensated absences (174,527) Change in net position of governmental activities $ (5,315,560) The accompanying notes are an integral part of these financial statements. 33
42 Statement of Revenues, Expenditures and Change in Fund Balance Budget and Actual - General Fund For the Year Ended June 30, 2014 Actual Original Final Over (Under) Budget Budget Actual Final Budget Revenues Taxes: City income $ 16,350,000 $ 16,350,000 $ 16,093,707 $ (256,293) Real estate 12,514,734 12,514,734 11,874,167 (640,567) Personal property 1,400,000 1,400,000 1,963, ,780 Administration fees 727, , ,054 3,554 Other 2,000 2, , ,942 Total taxes 30,994,234 30,994,234 30,777,650 (216,584) Licenses and permits 718, , ,302 26,004 Intergovernmental: State shared - statutory 1,329,768 1,329,768 1,393,833 64,065 State shared - constitutional 3,923,648 3,923,648 3,905,356 (18,292) Other 1,322,363 1,322,363 1,360,325 37,962 Total intergovernmental 6,575,779 6,575,779 6,659,514 83,735 Charges for services: Parks and recreation 1,082,445 1,274,496 1,180,827 (93,669) Police services 871, , ,444 (71,300) Total charges for services 1,954,189 2,146,240 1,981,271 (164,969) Fines and forfeitures 181, , ,497 (47,003) Investment income 594, , ,395 (83,371) Other: Rent and leases 239, , ,354 (11,064) Contributions and donations 192, Miscellaneous and other 434, , , ,663 Administrative reimbursements 1,067,434 1,067,434 1,075,328 7,894 Total other 1,933,378 1,757,409 1,965, ,277 Total revenues 42,952,144 42,968,226 42,774,315 (193,911) continued 34
43 Statement of Revenues, Expenditures and Changes in Fund Balance Budget and Actual - General Fund For the Year Ended June 30, 2014 Actual Original Final Over (Under) Budget Budget Actual Final Budget Expenditures General government: Administration: Mayor and city commission $ 99,793 $ 99,793 $ 99,106 $ (687) City clerk 225, , ,385 (6,626) City manager 706, , ,244 (177,729) City hall 361, , ,994 (10,414) Neighborhood code compliance 199, , ,946 (6,364) Employee relations 239, , , Human resources 366, , ,157 (30,013) Labor attorney 21,012 21,012 15,304 (5,708) Legal department 836, , ,274 (149,413) Elections 76,439 76,439 74,162 (2,277) Civil service 74,553 74,553 90,515 15,962 Data processing 980, , ,252 - Total administration 4,188,284 4,269,335 3,896,498 (372,837) Community development: City planning 707, , ,735 (17,506) Housing board of appeals 4,100 4,100 2,842 (1,258) Intermodal facility 94,456 94, ,561 17,105 Total community development 806, , ,138 (1,659) Finance: Accounting 765, , ,931 (35,074) Purchasing 257, , ,361 (17,957) Treasurer's office 333, , ,533 (50,357) Assessing 737, , ,991 (32,042) Income tax division 561, , ,630 (4,368) Total finance 2,654,192 2,663,244 2,523,446 (139,798) Total general government 7,648,696 7,739,376 7,225,082 (514,294) continued 35
44 Statement of Revenues, Expenditures and Changes in Fund Balance Budget and Actual - General Fund For the Year Ended June 30, 2014 Actual Original Final Over (Under) Budget Budget Actual Final Budget Expenditures (continued) Public safety: Police department: Administration $ 906,381 $ 897,340 $ 873,506 $ (23,834) Crime lab 697, , ,418 (49,337) Investigation 1,398,102 1,398,102 1,396,140 (1,962) Fleet management 139, , ,398 7,907 Special investigative unit 668, , ,360 13,873 Management service 899, , ,490 (48,721) Patrol 8,864,195 9,205,765 8,942,387 (263,378) Community service 995, , ,342 (1,629) Officer training 227, , ,108 (8,201) Detention center 117, , , Gang task force 526, , ,787 (827) Total police department 15,440,831 15,443,105 15,067,421 (375,684) Fire department: Administration 780, , ,558 (79,667) Fire fighting 7,748,470 7,754,296 7,693,532 (60,764) Total fire department 8,528,695 8,534,521 8,394,090 (140,431) Dispatch 1,660,750 1,660,750 1,681,010 20,260 Civil defense 146, , ,865 (13) Total public safety 25,776,621 25,799,254 25,303,386 (495,868) Public works: Street and storm sewers 397, , ,981 (15,685) Engineering 89,207 89, ,088 71,881 Street lighting 1,310,890 1,310,890 1,367,210 56,320 Outside service 136, , , ,057 Total public works 1,934,153 1,934,153 2,152, ,573 continued 36
45 Statement of Revenues, Expenditures and Changes in Fund Balance Budget and Actual - General Fund For the Year Ended June 30, 2014 Actual Original Final Over (Under) Budget Budget Actual Final Budget Expenditures (concluded) Parks and recreation: Administration $ 839,219 $ 822,171 $ 827,970 $ 5,799 Sports 1,314,924 1,256,174 1,085,813 (170,361) Youth center and water park 841, , ,508 (46,697) Total parks and recreation 2,995,348 2,919,550 2,708,291 (211,259) Unallocated: Special projects 129, , ,550 (18,357) Other 1,064,911 1,092,001 1,148,316 56,315 Total unallocated 1,193,911 1,234,908 1,272,866 37,958 Total expenditures 39,548,729 39,627,241 38,662,351 (964,890) Revenue over expenditures 3,403,415 3,340,985 4,111, ,979 Other financing sources (uses) Transfers in - 44,400 16,600 (27,800) Transfers out (3,450,215) (3,565,917) (3,648,687) (82,770) Total other financing sources (uses) (3,450,215) (3,521,517) (3,632,087) (110,570) Net change in fund balance (46,800) (180,532) 479, ,409 Fund balance, beginning of year 7,669,145 7,669,145 7,669,145 - Fund balance, end of year $ 7,622,345 $ 7,488,613 $ 8,149,022 $ 660,409 concluded. The accompanying notes are an integral part of these financial statements. 37
46 This page intentionally left blank. 38
47 Statement of Revenues, Expenditures and Change in Fund Balance Budget and Actual - Community Development Special Revenue Fund For the Year Ended June 30, 2014 Actual Original Final Over (Under) Budget Budget Actual Final Budget Revenues Licenses and permits $ - $ 177,716 $ 178,436 $ 720 Intergovernmental 1,583,018 1,583,018 1,088,562 (494,456) Investment income Loan collection and other - 94,441 99,488 5,047 - Total revenues 1,583,018 1,855,414 1,366,726 (488,688) Expenditures Community development 1,580,723 1,853,119 1,364,385 (488,734) Revenues over expenditures 2,295 2,295 2, Other financing uses Transfers out (2,295) (2,295) (2,295) - Net change in fund balance Fund balance, beginning of year Fund balance, end of year $ - $ - $ 46 $ 46 The accompanying notes are an integral part of these financial statements. 39
48 Statement of Net Position Proprietary Funds June 30, 2014 Business-type Activities - Enterprise Funds Water and Nonmajor Wastewater Economic W.K. Kellogg Battle Creek Enterprise System Development Airport Transit System Funds Assets Current assets: Pooled cash and investments $ 4,767,178 $ 8,070,622 $ 686,421 $ - $ 1,492,465 Receivables: Interest 4,390 61,458 14, Accounts 2,998,143 2,270 44, ,970 Special assessments 103, Grants 24, ,231,703 - Loans, current portion - 1,486, Other assets ,145 Inventories 1,327, ,400 - Prepaid items Total current assets 9,225,259 9,620, ,203 1,317,248 2,105,840 Noncurrent assets: Loans receivable, net - 240, Capital assets, net 82,735,106-11,406,612 2,216,136 5,809,973 Total noncurrent assets 82,735, ,372 11,406,612 2,216,136 5,809,973 Total assets 91,960,365 9,860,823 12,151,815 3,533,384 7,915,813 Deferred outflows of resources Deferred charge on refunding 144, Liabilities Current liabilities: Accounts payable and accrued liabilities 896,618-73,688 56, ,374 Compensated absences 363,720-56, ,994 7,660 Retentions, deposits and other liabilities 180, ,812 Accrued interest payable 79,482-10, Claims payable, current portion Interfund payable ,248 76,148 Unearned revenue 26,119-52,896-33,700 Lease payable, current portion , Bonds payable, current portion 1,988, Total current liabilities 3,534, , , ,694 Noncurrent liabilities: Advances from other government ,540 Claims payable Lease payable , Bonds payable 7,730, Total noncurrent liabilities 7,730, , ,540 Total liabilities 11,264, , , ,234 Net position Net investment in capital assets 73,161,242-10,912,482 2,216,136 5,809,973 Unrestricted 7,678,908 9,860, , ,226 1,209,606 Total net position $ 80,840,150 $ 9,860,823 $ 11,464,500 $ 2,942,362 $ 7,019,579 continued The accompanying notes are an integral part of these financial statements. 40
49 Statement of Net Position Proprietary Funds June 30, 2014 Governmental Activities Total Assets Current assets: Pooled cash and investments 15,016,686 Internal Service Funds $ $ 11,783,329 Receivables: Interest 80, ,671 Accounts 3,657, ,340 Special assessments 103,407 - Grants 1,256,128 - Loans, current portion 1,486,101 - Other assets 30,145 - Inventories 1,383, ,680 Prepaid items - 142,860 Total current assets 23,014,001 13,229,880 Noncurrent assets: Loans receivable, net 240,372 - Capital assets, net 102,167,827 2,952,988 Total noncurrent assets 102,408,199 2,952,988 Total assets 125,422,200 16,182,868 Deferred outflows of resources Deferred charge on refunding 144,717 - Liabilities Current liabilities: Accounts payable and accrued liabilities 1,340,460 1,941,570 Compensated absences 542, ,120 Retentions, deposits and other liabilities 248,224 - Accrued interest payable 89,975 - Claims payable, current portion - 2,324,796 Interfund payable 495,396 - Unearned revenue 112,715 70,280 Lease payable, current portion 170,480 - Bonds payable, current portion 1,988,000 - Total current liabilities 4,987,732 4,472,766 Noncurrent liabilities: Advances from other government 397,540 - Claims payable - 1,709,797 Lease payable 323,650 - Bonds payable 7,730,581 - Total noncurrent liabilities 8,451,771 1,709,797 Total liabilities 13,439,503 6,182,563 Net position Net investment in capital assets 92,099,833 2,952,988 Unrestricted 20,027,581 7,047,317 Total net position $ 112,127,414 $ 10,000,305 concluded. 41
50 This page intentionally left blank. 42
51 Reconciliation Net Position of Enterprise Funds to Net Position of Business-type Activities June 30, 2014 Net position - total enterprise funds $ 112,127,414 Amounts reported for business-type activities in the statement of net position are different because: Internal service funds are used by management to charge the costs of certain services to individual governmental and enterprise funds. The net revenues (expense) of the internal service funds are allocated to governmental and business-type activities. Cumulative portion of internal service funds net operating income attributed to enterprise funds. 600,474 Net position of business-type activities $ 112,727,888 The accompanying notes are an integral part of these financial statements. 43
52 Statement of Revenues, Expenses and Changes in Fund Net Position Proprietary Funds For the Year Ended June 30, 2014 Business-type Activities - Enterprise Funds Water and Wastewater Economic W.K. Kellogg System Development Airport Operating revenues Charges for services $ 24,385,474 $ - $ 935,269 Other 666,137 61,592 26,078 Total operating revenues 25,051,611 61, ,347 Operating expenses Personal services 7,305, ,208 Materials and supplies 2,430, ,654 Contractual and other 6,697, , ,592 Depreciation 6,475, ,669 Total operating expenses 22,908, ,400 2,131,123 Operating income (loss) 2,142,996 (68,808) (1,169,776) Nonoperating revenues (expenses) Intergovernmental subsidies 50, ,724 Interest earnings 71,912 29,979 12,976 Gain on disposal of capital assets Interest expense (280,822) - (29,437) Loss on disposal of capital assets (14,318) - - Total nonoperating revenues (expense) (172,601) 29, ,263 Income (loss) before transfers 1,970,395 (38,829) (583,513) Transfers in Transfers out (485,527) - (5,993) Change in net position 1,484,868 (38,829) (589,506) Net position, beginning of year 79,355,282 9,899,652 12,054,006 Net position, end of year $ 80,840,150 $ 9,860,823 $ 11,464,500 continued The accompanying notes are an integral part of these financial statements. 44
53 Statement of Revenues, Expenses and Changes in Fund Net Position Proprietary Funds - Business-type Activities - Enterprise Funds Governmental Activities Nonmajor Battle Creek Enterprise Internal Transit System Funds Total Service Funds Operating revenues Charges for services $ 419,361 $ 4,755,630 $ 30,495,734 $ 19,055,367 Other 6,344 61, , ,857 Total operating revenues 425,705 4,817,540 31,317,795 19,555,224 Operating expenses Personal services 2,809, ,701 11,154,107 4,004,702 Materials and supplies 807,389 33,074 3,451,702 2,590,767 Contractual and other 547,445 4,117,749 11,910,193 13,609,332 Depreciation 566, ,819 8,237, ,905 Total operating expenses 4,731,170 4,852,343 34,753,651 20,988,706 Operating income (loss) (4,305,465) (34,803) (3,435,856) (1,433,482) Nonoperating revenues (expenses) Intergovernmental subsidies 2,917,721-3,571,072 - Interest earnings - 11, , ,816 Gain on disposal of capital assets ,504 Interest expense - - (310,259) (1,574) Loss on disposal of capital assets - - (14,318) - Total nonoperating revenues (expense) 2,917,721 11,660 3,373, ,746 Income (loss) before transfers (1,387,744) (23,143) (62,834) (1,193,736) Transfers in 888,230 62, , ,760 Transfers out (4,641) (58,409) (554,570) (1,040,439) Change in net position (504,155) (18,696) 333,682 (1,544,415) Net position, beginning of year 3,446,517 7,038, ,793,732 11,544,720 Net position, end of year $ 2,942,362 $ 7,019,579 $ 112,127,414 $ 10,000,305 concluded. 45
54 This page intentionally left blank. 46
55 Reconciliation Change in Net Position of Enterprise Funds to Change in Net Position of Business-type Activities For the Year Ended June 30, 2014 Change in net position - total enterprise funds $ 333,682 Amounts reported for business-type activities in the statement of activities are different because: Internal service funds are used by management to charge the costs of certain services to individual governmental and enterprise funds. The net operating loss of the internal service funds are allocated to governmental and business-type activities. (479,451) Change in net position of business-type activities $ (145,769) The accompanying notes are an integral part of these financial statements. 47
56 Statement of Cash Flows Proprietary Funds For the Year Ended June 30, 2014 Business-type Activities - Enterprise Funds Water and Wastewater Economic W.K. Kellogg System Development Airport Cash flows from operating activities Receipts from customers and users $ 25,548,981 $ 33,476 $ 941,059 Loans collected from borrowers - 117,357 - Receipts from interfund services Payments to suppliers (5,498,842) (157,151) (583,437) Loans made to borrowers - (150,000) - Payments to employees (7,294,282) - (794,147) Payments for interfund services (3,243,526) - - Net cash provided by (used in) operating activities 9,512,331 (156,318) (436,525) Cash flows from noncapital financing activities Transfers in Transfers out (485,527) - (5,993) Intergovernmental subsidies 50, ,724 Net cash provided by (used in) noncapital financing activities (434,900) - 596,731 Cash flows from capital and related financing activities Principal and interest paid on debt (6,480,576) - (192,039) Principal and interest paid on capital lease Issuance of capital bonds 4,385, Purchase of capital assets (5,282,733) - (35,944) Net cash used in capital and related financing activities (7,378,309) - (227,983) Cash flows from investing activities Interest earnings on investments 71,910 29,979 12,976 Net change in pooled cash and investments 1,771,032 (126,339) (54,801) Pooled cash and investments, beginning of year 2,996,146 8,196, ,222 Pooled cash and investments, end of year $ 4,767,178 $ 8,070,622 $ 686,421 continued 48
57 Statement of Cash Flows Proprietary Funds Business-type Activities - Enterprise Funds Governmental Activities Nonmajor Battle Creek Enterprise Internal Transit System Funds Total Service Funds Cash flows from operating activities Receipts from customers and users $ 572,161 $ 4,810,757 $ 31,906,434 $ - Loans collected from borrowers ,357 - Receipts from interfund services ,555,224 Payments to suppliers (612,091) (4,050,130) (10,901,651) (13,802,868) Loans made to borrowers - - (150,000) - Payments to employees (2,999,447) (301,515) (11,389,391) (4,013,636) Payments for interfund services (736,082) (36,160) (4,015,768) - Net cash provided by (used in) operating activities (3,775,459) 422,952 5,566,981 1,738,720 Cash flows from noncapital financing activities Transfers in 888,230 62, , ,760 Transfers out (4,641) (58,409) (554,570) (1,040,439) Intergovernmental subsidies 2,917,721-3,571,072 - Net cash provided by (used in) noncapital financing activities 3,801,310 4,447 3,967,588 (350,679) Cash flows from capital and related financing activities Principal and interest paid on debt - - (6,672,615) - Principal and interest paid on capital lease (176,017) Issuance of capital bonds - - 4,385,000 - Purchase of capital assets (25,851) - (5,344,528) (632,323) Net cash used in capital and related financing activities (25,851) - (7,632,143) (808,340) Cash flows from investing activities Interest earnings on investments - 11, , ,816 Net change in pooled cash and investments - 438,654 2,028, ,517 Pooled cash and investments, beginning of year - 1,053,811 12,988,140 10,995,812 Pooled cash and investments, end of year $ - $ 1,492,465 $ 15,016,686 $ 11,783,329 continued 49
58 Statement of Cash Flows Proprietary Funds For the Year Ended June 30, 2014 Business-type Activities - Enterprise Funds Water and Wastewater Economic W.K Kellogg System Development Airport Cash flows from operating activities Operating income (loss) $ 2,142,996 $ (68,808) $ (1,169,776) Adjustments to reconcile operating income (loss) to net cash from operating activities: Depreciation 6,475, ,669 Amortization 72, Changes in assets and liabilities: Interest receivable 1,355 (28,116) (172) Accounts receivable 423,671 - (20,133) Special assessments receivable 59, Grants receivable 1, Loans receivable - (32,643) - Inventories 60, Prepaid items Accounts payable 342,812 (26,751) 17,762 Retentions, deposits and other liabilities (4,135) - - Compensated absences 11,061-16,061 Accrued interest payable (86,510) - (2,953) Claims payable Interfund payable Unearned revenue 11, Net cash provided by (used in) operating activities $ 9,512,331 $ (156,318) $ (436,525) continued 50
59 Statement of Cash Flows Proprietary Funds Business-type Activities - Enterprise Funds Governmental Activities Nonmajor Battle Creek Enterprise Internal Transit System Funds Total Service Funds Cash flows from operating activities Operating income (loss) $ (4,305,465) $ (34,803) $ (3,435,856) $ (1,433,482) Adjustments to reconcile operating income (loss) to net cash from operating activities: Depreciation 566, ,819 8,237, ,905 Amortization ,358 - Changes in assets and liabilities: Interest receivable (26,552) 1,177 Accounts receivable 105,504 (7,164) 501,878 42,881 Special assessments receivable ,947 - Grants receivable 40,952-42,096 - Loans receivable - - (32,643) - Inventories 20,408-80,607 (23,590) Prepaid items (23,325) Accounts payable (14,072) 52, ,522 1,728,946 Retentions, deposits and other liabilities - 11,762 7,627 - Compensated absences 11,471 2,622 41,215 (8,934) Accrued interest payable - - (89,463) - Claims payable ,585 Interfund payable (201,063) (75,436) (276,499) - Unearned revenue ,270 1,557 Net cash provided by (used in) operating activities $ (3,775,459) $ 422,952 $ 5,566,981 $ 1,738,720 concluded. ` The accompanying notes are an integral part of these financial statements. 51
60 Statement of Fiduciary Net Position Fiduciary Funds June 30, 2014 Pension and Other Employee Benefit Agency Trust Funds Funds Assets Pooled cash and investments $ - $ 306,589 Cash and cash equivalents 6,526,846 - Investments: U.S. treasuries 9,170,824 - U.S. agencies 16,504,694 - Domestic corporate securities 33,871,406 - Domestic equities 22,972,818 - American depository receipts 13,314,182 - International equities 32,145,125 - Real estate trusts 310,303 - Mutual funds 3,460,510 - Taxes receivable Interest receivable 427,765 - Pension contributions receivable 89,718 - Delinquent taxes receivable - 635,663 Total assets 138,794,191 $ 942,895 Liabilities Obligation for impaired investment of securities lending collateral 131,239 $ - Undistributed receipts - 942,895 Total liabilities 131,239 $ 942,895 Net position Held in trust for pension and postemployment healthcare benefits $ 138,662,952 The accompanying notes are an integral part of these financial statements. 52
61 Statement of Changes in Fiduciary Net Position Pension and Other Employee Benefit Trust Funds For the Year Ended June 30, 2014 Additions Investment income: From investing activities: Net appreciation in fair value of investments $ 14,984,100 Interest and dividends 3,170,437 Less investment expenses (453,794) Net income from investing activities 17,700,743 From securities lending activities: Gross earnings 1,760 Borrower rebates 17,654 Securities lending fees (5,821) Impaired investment recovery 25,093 Net income from securities lending activities 38,686 Total net investment income 17,739,429 Contributions: Employer 4,967,580 Employees 1,215,512 Total contributions 6,183,092 Total additions 23,922,521 Deductions Pension benefit payments 8,389,950 Contribution refunds 47,356 Medical insurance premiums/benefits 1,143,088 Administrative expenses 197,492 Total deductions 9,777,886 Change to net position held in trust for benefits 14,144,635 Net position held in trust for benefits, beginning of year 124,518,317 Net position held in trust for benefits, end of year $ 138,662,952 The accompanying notes are an integral part of these financial statements. 53
62 This page intentionally left blank. 54
63 COMPONENT UNITS FINANCIAL STATEMENTS 55
64 Combining Statement of Net Position Component Units June 30, 2014 Battle Creek Lakeview Battle Creek Downtown Downtown Tax Increment Development Development Financing Authority Authority Authority Assets Pooled cash and investments $ 1,512,575 $ 853,133 $ 23,674,558 Receivables, net 1,464,471 48,630 1,388,254 Advance to other government ,540 Prepaid items and other assets ,542 Long-term receivables - due in more than one year 263,918-3,806,800 Capital assets not being depreciated ,107,100 Capital assets being depreciated, net - - 1,039,745 Total assets 3,240, ,763 43,430,539 Deferred outflows of resources Deferred charge on refunding 1,759, Liabilities Accounts payable and accrued liabilities 200, ,368 1,675,584 Accrued interest payable 321,626-30,201 Unearned revenue Long-term liabilities: Due within one year 2,700,000-1,207,521 Due in more than one year 37,031,511-6,381,986 Total liabilities 40,253, ,368 9,295,292 Net position Net investment in capital assets ,146,845 Restricted for loan commitments and minority lending 1,414, Unrestricted (deficit) (36,667,834) 147,395 19,988,402 Total net position (deficit) $ (35,253,030) $ 147,395 $ 34,135,247 continued 56
65 Combining Statement of Net Position Component Units Local Brownfield Development Redevelopment Finance Authority Authority Total Assets Pooled cash and investments $ 177,522 $ 26,071 $ 26,243,859 Receivables, net ,901,428 Advance to other government ,540 Prepaid items and other assets ,542 Long-term receivables - due in more than one year - - 4,070,718 Capital assets not being depreciated ,107,100 Capital assets being depreciated, net - - 1,039,745 Total assets 177,522 26,144 47,776,932 Deferred outflows of resources Deferred charge on refunding - - 1,759,939 Liabilities Accounts payable and accrued liabilities 16,446-2,647,194 Accrued interest payable ,827 Unearned revenue Long-term liabilities: Due within one year - - 3,907,521 Due in more than one year 3,806,800-47,220,297 Total liabilities 3,823,246-54,126,839 Net position Net investment in capital assets ,146,845 Restricted for loan commitments and minority lending - - 1,414,804 Unrestricted (deficit) (3,645,724) 26,144 (20,151,617) Total net position (deficit) $ (3,645,724) $ 26,144 $ (4,589,968) concluded. The accompanying notes are an integral part of these financial statements. 57
66 Combining Statement of Activities Component Units For the Year Ended June 30, 2014 Battle Creek Lakeview Battle Creek Downtown Downtown Tax Increment Development Development Financing Authority Authority Authority Expenses Community development $ 4,051,276 $ 1,921,917 $ 5,004,697 Program revenues Charges for services 43, ,926 Capital grants and contributions ,555 Total program revenues 43, ,481 Net program expense (revenues) 4,007,873 1,921,917 4,599,216 General revenues Property taxes 5,823,828 1,924,255 6,314,010 Unrestricted investment earnings 56,555 27, ,406 Total general revenues 5,880,383 1,951,597 7,024,416 Change in net position 1,872,510 29,680 2,425,200 Net position (deficit), beginning of year (37,125,540) 117,715 31,710,047 Net position (deficit), end of year $ (35,253,030) $ 147,395 $ 34,135,247 continued 58
67 Combining Statement of Activities Component Units Local Brownfield Development Redevelopment Finance Authority Authority Total Expenses Community development $ 197,849 $ - $ 11,175,739 Program revenues Charges for services ,329 Capital grants and contributions 217, ,301 Total program revenues 217, ,630 Net program expense (revenues) (19,897) - 10,509,109 General revenues Property taxes 190,852-14,252,945 Unrestricted investment earnings ,866 Total general revenues 190, ,047,811 Change in net position 210, ,538,702 Net position (deficit), beginning of year (3,856,473) 25,581 (9,128,670) Net position (deficit), end of year $ (3,645,724) $ 26,144 $ (4,589,968) concluded. The accompanying notes are an integral part of these financial statements. 59
68 This page intentionally left blank. 60
69 NOTES TO FINANCIAL STATEMENTS 61
70 Notes to Financial Statements 1. SUMMARY OF SIGNIFICANT ACCOUNTING POLICIES Reporting Entity The accompanying financial statements present the activities of the City of Battle Creek, Michigan (the City or government ) and its six component units, legally separate organizations for which the City is financially accountable. The activities of the Building Authority are so intertwined with the City that it is, in substance, the same as the City and, therefore, is blended and reported as if it were part of the City. The other five component units are not so intertwined and, therefore, are discretely presented in a separate column in the government-wide financial statements to emphasize that they are legally separate from the City. The component units each have a June 30 year-end. Component Unit Building Authority (BA); finances and constructs the City s public buildings Downtown Development Authority (DDA); corrects and prevents deterioration in the downtown district, encourages historical preservation and promotes economic growth within the district Lakeview Downtown Development Authority (LDDA); promotes development of the Lakeview district Tax Increment Financing Authority (TIFA); administers the Fort Custer Industrial Park development district Brownfield Redevelopment Authority (BRA); administers brownfield redevelopment projects Local Development Finance Authority (LDFA); encourages technological development through the City s SmartZone Included in the Reporting Entity Because City Commission appoints and may remove BA board City Commission appoints and may remove DDA board and approves DDA budget City Commission appoints and may remove LDDA board and approves LDDA budget City Commission appoints and may remove TIFA board and approves TIFA budget City Commission appoints and may remove BRA board and approves BRA budget City Commission appoints and may remove LFDA board and approves LFDA budget Separate Financial Statements Available Not prepared Finance Department in City Hall Finance Department in City Hall Finance Department in City Hall Finance Department in City Hall Finance Department in City Hall 62
71 Notes to Financial Statements Basis of Presentation Government-wide Financial Statements. The statements of net position and activities display information about the primary government (the "City") and its component units. These statements include the financial activities of the overall government, except for fiduciary activities. Eliminations have been made to minimize the double-counting of internal activities. These statements distinguish between the City s governmental and business-type activities. Governmental activities generally are financed through taxes, intergovernmental revenues and other nonexchange transactions. Business-type activities are financed in whole or in part by fees charged to external parties. The statement of activities presents a comparison between direct expenses and program revenues for the different business-type activities of the City and for each function of the City s governmental activities. Direct expenses are those that are specifically associated with a program or function and, therefore, are clearly identifiable to a particular function. Indirect expense allocations that have been made in the funds have been reversed for the statement of activities. Program revenues include (a) fees, fines and charges paid by the recipients of goods or services offered by the programs and (b) grants and contributions that are restricted to meeting the operational or capital requirements of a particular program. Revenues that are not classified as program revenues, including all taxes, are presented as general revenues. Fund Financial Statements. The fund financial statements provide information about the City s funds, including its fiduciary funds and blended component units. Separate statements for each fund category governmental, proprietary and fiduciary are presented. The emphasis of fund financial statements is on major governmental and enterprise funds, each displayed in a separate column. All remaining governmental and enterprise funds are aggregated and reported as nonmajor funds. The City reports the following major governmental funds: General fund. This is the government s primary operating fund. It is used to account for and report all financial resources not accounted for and reported in another fund. Community development special revenue fund. This fund accounts for grants under the Housing and Community Development Act of 1974, as amended. The Act provides for a series of grants over a period of years to be used for various community development activities. Capital improvements fund. This fund accounts for capital expenditures related to various construction projects in the area. The City has the following major enterprise funds: Water and wastewater system enterprise fund. This fund accounts for the activities of the City's water distribution, water treatment, sewage disposal and sewage treatment systems. Economic development enterprise fund. development revolving loan program. This fund accounts for the activities of the City's economic W.K. Kellogg Airport. This fund accounts for the activities of the City's airport. Battle Creek Transit System. This fund accounts for the activities of the City's transit system. 63
72 Notes to Financial Statements Additionally, the City reports the following fund types: Special revenue funds. These funds are used to account and report proceeds of specific revenue sources that are restricted or committed to expenditure for specific purposes other than debt service or capital projects. Debt service funds. These funds account for all financial resources restricted, committed or assigned to expenditure for principal and interest. Capital projects funds. These funds account for all financial resources restricted, committed or assigned to expenditure for the acquisition or construction of capital assets. Permanent funds. These funds account for resources restricted to the extent that only earnings, and not principal, may be used for purposes that support the government's purposes. Enterprise funds. These funds account for those operations that are financed and operated in a manner similar to private business or where the City has decided that the determination of revenues earned, costs incurred and/or net income is necessary for management accountability. Internal service funds. These funds account for operations that provide services to other departments or agencies of the City, or to other governments, on a cost-reimbursement basis. This includes machinery, equipment and building space management services; liability, auto, and workers compensation self-insurance; information technology services; and printing, mailing and reproduction services. Pension and other employee benefits trust funds. These funds account for the activities of the Police and Fire Retirement System, Voluntary Employees Beneficiary Association, and Fire Retiree Health Care Trust, which accumulate resources for retirement and other employee benefit payments to qualified employees. Agency funds. These funds account for assets held for other governments in an agency capacity, including property tax collections and fire insurance escrow. Measurement Focus, Basis of Accounting, and Financial Statement Presentation Government-wide, proprietary and fiduciary fund financial statements. The government-wide, proprietary and fiduciary fund financial statements are reported using the economic resources measurement focus and the accrual basis of accounting, except for agency funds, which do not have a measurement focus. Revenue is recorded when earned and expenses are recorded when a liability is incurred, regardless of the timing of related cash flows. Proprietary fund operating revenues, such as charges for services, result from exchange transactions associated with the principal activity of the fund. Exchange transactions are those in which each party receives and gives up essentially equal values. Operating expenses for proprietary funds include the cost of sales/services, administration and depreciation on capital assets. All revenues and expenses not meeting this definition are reported as nonoperating revenues and expenses. 64
73 Notes to Financial Statements Nonexchange transactions, in which the City gives (or receives) value without directly receiving (or giving) equal value in exchange, include property taxes, grants, entitlements and donations. Property taxes are recognized as revenue in the year for which they are levied. Grants and similar items are recognized as revenue as soon as all eligibility requirements imposed by the provider have been met. Governmental fund financial statements. Governmental funds are reported using the current financial resources measurement focus and the modified accrual basis of accounting. Under this method, revenues are recognized when measurable and available. The City considers all revenues reported in the governmental funds to be available if they are collected within sixty days after year-end, except for income tax revenue for which a 15-day collection period is used. Property taxes, franchise taxes, licenses and interest are considered to be susceptible to accrual. Expenditures generally are recorded when a related fund liability is incurred, except for debt service expenditures, compensated absences, and claims and judgments, which are recognized as expenditures to the extent they have matured. General capital asset acquisitions are reported as expenditures in governmental funds. Proceeds from general long-term debt and acquisitions under capital leases, if any, are reported as other financing sources. Under the terms of grant agreements, the City funds certain programs by a combination of specific costreimbursement grants, categorical block grants, and general revenues. Thus, when program expenses are incurred, there are both restricted and unrestricted net position available to finance the program. It is the City s policy to first apply cost-reimbursement grant resources to such programs, followed by categorical block grants, and then by general revenues, subject to satisfying any grant program matching provisions. Assets, Deferred Outflows of Resources, Liabilities, Deferred Inflows of Resources and Equity Deposits and Investments The City maintains a cash and investment pool for all City monies. Each fund s portion of the cash and investment pool is displayed on the statement of net position/balance sheet as pooled cash and investments. The cash resources of the pension and other employee benefits trust funds are invested separately. The City s cash and cash equivalents are considered to be cash on hand, demand deposits and short-term investments with original maturities of three months or less from the date of acquisition. State statutes authorize the government to deposit in the accounts of federally insured banks, credit unions, and savings and loan associations, and to invest in obligations of the U.S. Treasury, certain commercial paper, repurchase agreements, bankers acceptances, and mutual funds composed of otherwise legal investments. The State s Pension Investment Act, as amended, authorizes the pension trust fund to invest in common stocks, real estate, and various other investment instruments, subject to certain limitations. Investments are stated at fair value. Short-term investments are reported at cost, which approximates fair value. Securities traded on a national or international exchange are valued at the last reported sales price at current exchange rates. Mortgages are valued on the basis of future principal and interest payments, and are discounted at prevailing interest rates for similar instruments. Investments that do not have established market values are reported at estimated fair value. Cash deposits are reported at carrying amounts, which reasonably approximates fair value. Unrealized appreciation or depreciation on pension trust fund investments due to changes in fair value are recognized each year. 65
74 Notes to Financial Statements Receivables and Payables All trade and delinquent property tax receivables are shown net of an allowance for uncollectibles, as applicable. Certain loans receivable in governmental funds consist of rehabilitation and redevelopment loans that are generally not expected or scheduled to be collected in the subsequent year. Activity between funds that are representative of lending/borrowing arrangements outstanding at the end of the fiscal year are referred to as either interfund receivables/payables (i.e., the current portion of interfund loans) or advances to/from other funds (i.e., the non-current portion of interfund loans). All other outstanding balances between funds are reported as due to/from other funds. Any residual balances outstanding between the governmental and business-type activities are reported in the government-wide financial statements as internal balances. Inventories, Prepaid Items and Other Assets All inventories are valued at cost using the first-in/first-out method. Inventories of governmental funds are recorded as expenditures when purchased. Certain payments to vendors reflect costs applicable to future accounting periods and are recorded as prepaid items in both government-wide and fund financial statements using the consumption method. Capital Assets Capital assets, which include property, plant, equipment, and infrastructure assets (e.g., roads, bridges, sidewalks, and similar items), are reported in the applicable governmental or business-type activities columns in the government-wide financial statements. The government defines capital assets as assets with an initial, individual cost of more than $10,000 and an estimated useful life in excess of two years. Such assets are recorded at historical cost or estimated historical cost if purchased or constructed. Donated capital assets are recorded at estimated fair value at the date of donation. The costs of normal maintenance and repairs that do not add to the value of the asset or materially extend assets lives are not capitalized. ` Major outlays for capital assets and improvements are capitalized as projects are constructed. Interest incurred during the construction phase of capital assets of business type activities, if any, is included as part of the capitalized value of the assets constructed. 66
75 Notes to Financial Statements Capital assets of the primary government are depreciated using the straight-line method over the following estimated useful lives: Assets Years Deferred Outflows of Resources Compensated Absences Long-term Obligations Land improvements 5-50 Buildings and building improvements 50 Public domain infrastructure 50 Water and wastewater system infrastructure Vehicles 7-10 Office equipment 6-10 Machinery and equipment 3-10 In addition to assets, the statement of financial position will sometimes report a separate section for deferred outflows of resources. This separate financial statement element represents a consumption of net position that applies to future periods and so will not be recognized as an outflow of resources until then. The City only has one item that qualifies for reporting in this category, which is the deferred charge on refunding reported in the government-wide statement of net position. A deferred charge on refunding results from the difference in the carrying value of refunded debt and its reacquisition price. This amount is deferred and amortized over the shorter of the life of the refunded or refunding debt. It is the government s policy to permit employees to accumulate earned but unused vacation and compensatory time benefits, subject to certain limitations. Certain bargaining unit employees (i.e., firefighters) are also permitted to accumulate earned but unused sick leave. All vacation and compensatory time pay and 50 percent of sick leave are accrued when incurred in the government-wide and proprietary fund financial statements. A liability for these amounts is reported in governmental funds only if they have matured, for example, as a result of employee resignations or retirements. Liability accruals for vacation and compensatory time in the government-wide and proprietary fund financial statements are reported as current liabilities; the liability for sick leave in the governmental activities is allocated between current and long-term. In the government-wide financial statements and proprietary fund types in the fund financial statements, long-term debt and other long-term obligations are reported as liabilities in the applicable governmental activities, business-type activities, or proprietary fund type statement of net position. Bond premiums and discounts are deferred and amortized over the life of the bonds using the effective interest method. Bonds payable are reported net of the applicable bond premium or discount. In the fund financial statements, governmental fund types recognize bond premiums and discounts, as well as bond issuance costs, during the current period. The face amount of debt issued is reported as other financing sources. Premiums received on debt issuances are reported as other financing sources while discounts on debt issuances are reported as other financing uses. Issuance costs, whether or not withheld from actual debt proceeds, are reported as debt service expenditures. 67
76 Notes to Financial Statements Deferred Inflows for Resources In addition to liabilities, the statement of financial position will sometimes report a separate section for deferred inflows of resources. This separate financial statement element represents an acquisition of net position that applies to future periods and so will not be recognized as an inflow of resources until that time. The governmental funds report unavailable revenues, which arises only under the modified accrual basis of accounting, from two sources: property taxes and loans receivable. These amounts are deferred and recognized as an inflow of resources in the period that the amounts become available. Fund Balances Governmental funds report nonspendable fund balance for amounts that cannot be spent because they are either (a) not in spendable form or (b) legally or contractually require to be maintained intact. Restricted fund balance is reported when externally imposed constraints are placed on the use of the resources by grantors, contributors, or laws or regulations of other governments. The committed fund balance classification includes amounts that can be used only for the specific purposes determined by a formal action of the government s highest level of decision-making authority, the Board of Commissioners. The City Commission is the highest level of decision-making authority for the government that can, authorize a resolution prior to the end of the fiscal year, commit fund balance. Once adopted, the limitation imposed by the resolution remains in place until a similar action is taken (the adoption of another resolution) to remove or revise the limitation. Assigned fund balance is reported for amounts that are constrained by the government s intent to be used for specific purposes, but are neither restricted nor committed. The Board of Commissioners has by resolution authorized City management to assign fund balance. Unassigned fund balance is the residual classification used for a general fund. When the government incurs expenditures for purposes for which various fund balance classifications can be used, it is the government s policy to use restricted fund balance first, then committed, assigned and finally unassigned fund balance. 2. BUDGETARY INFORMATION Annual budgets are adopted on a basis consistent with generally accepted accounting principles for the general and special revenue funds. Annual appropriations lapse at year-end, except for those approved by the City Commission for carry forward. The legal level of budgetary control is the fund level. The City Commission requires the City Manager to submit an estimate of revenues and anticipated expenditures for the succeeding fiscal year in June. The City Manager is then authorized to assign and transfer budget amounts within each fund to the extent that the net total fund appropriation (which the City defines as gross authorized expenditures less related revenues that are specifically designated to fund those activities) is not exceeded. City Commission approval is required for any budgetary changes that result in an increase to net appropriations. Formal budgetary integration is employed as a management control during the year. Supplemental appropriations were approved by the City Commission in the form of budget amendment resolutions or as part of special authorizing motions for grants, bonds or notes, the total of which was not significant in relation to the original budget appropriation valuations. 68
77 Notes to Financial Statements 3. EXCESS OF EXPENDITURES OVER APPROPRIATIONS State statutes provide that a local unit shall not incur expenditures in excess of the amount appropriated. The approved budgets of the City were adopted on a fund level basis, although budget and actual information in the fund financial statements have been presented at a level of detail greater than the level of legal budgetary control. During the year ended June 30, 2014, the City did not incur expenditures in excess of the amounts appropriated at the legal level of budgetary control. 4. DEFICIT FUND EQUITY The Kellogg Arena special revenue fund, a nonmajor governmental fund, has a total fund deficit of $74,495 at year-end. Fiscal 2014 is the first year of a three-year deficit elimination plan adopted by the City Commission in January DEPOSITS AND INVESTMENTS - POOLED CASH AND INVESTMENTS Following is a reconciliation of deposit and investment balances, including both pooled cash and investments as well as pension and other employee benefits trust fund balances, as of June 30, 2014: Primary Government Component Units Total Statement of net position Pooled cash and investments $ 52,321,665 $ 26,243,859 $ 78,565,524 Statement of fiduciary net position Pooled cash and investments: Agency funds 306, ,589 Other employee benefits 1,300,614-1,300,614 Cash and cash equivalents - pension 5,226,232-5,226,232 Investments: Pension 128,289, ,289,352 Other employee benefits 3,460,510-3,460,510 Total $ 190,904,962 $ 26,243,859 $ 217,148,821 Deposits and investments: Bank deposits (checking, savings and certificates of deposit) $ 15,297,666 Portfolio cash - pension 5,226,232 Investments in securities, mutual funds and similar vehicles: Pool 64,858,292 Pension 128,289,352 Other employee benefits 3,460,510 Cash on hand 16,769 Total $ 217,148,821 69
78 Notes to Financial Statements Custodial Credit Risk - Deposits. For deposits, custodial credit risk is the risk, that in the event of a bank failure, the City s deposits may not be returned to the government. As of June 30, 2014, $15,966,246 of the City s total bank balance of $16,375,893 (total book balance was $15,297,666) was exposed to custodial credit risk as it was uninsured and uncollateralized. The City s investment policy does not specifically address this risk, although the City believes that due to the dollar amounts of cash deposits and the limits of FDIC insurance, it is impractical to insure all bank deposits. As a result, the City evaluates each financial institution with which it deposits City funds and assesses the level of risk of each institution; only those institutions with an acceptable estimated risk level are used as depositories. Custodial Credit Risk Investments. Following is a summary of the City s investments as of June 30, 2014: U.S. agencies $ 54,151,809 Municipal bonds 1,025,937 Money market 4,454,314 Short-term investments 5,226,232 Total investments $ 64,858,292 For investments, custodial credit risk is the risk that, in the event of the failure of the counterparty, the City will not be able to recover the value of its investments or collateral securities that are in the possession of an outside party. The City s investment policy requires that investment securities be held in third-party safekeeping by a designated institution and that the safekeeping agent follow the procedure of delivery vs. payment. As of June 30, 2014, none of the City s investments, excluding the money market accounts which are not subject to custodial credit risk, were exposed to risk since the securities are held in the City s name by the counterparty. Credit Risk. As of June 30, 2014, all of the City s investments in securities of U.S. agencies were rated AA+ by Standard & Poor s. The City also held investments in money market accounts, which are not rated. The municipal bonds were rated AAA by Standard and Poor's. All of the City s investments comply with its policy regarding the types of investments it may hold. Concentration of Credit Risk. At June 30, 2014, the investment portfolio was concentrated as follows: % of portfolio U.S. agencies Federal Farm Credit Bank 41.6% Federal Home Loan Bank 20.4% Federal National Mortgage Association 18.7% Federal Home Loan Mortgage Corporation 18.3% The City s investment policy does not address concentration of credit risk. 70
79 Notes to Financial Statements Interest Rate Risk. follows: As of June 30, 2014, maturities of the City s investments in the debt securities were as Investment Maturities (fair value by years) Less More Fair Value Than Than 10 U.S. agencies $ 54,151,809 $ 6,067,720 $ 31,865,005 $ 15,125,515 $ 1,093,569 Municipal bonds 1,025, , ,000 $ 55,177,746 $ 6,613,657 $ 31,865,005 $ 15,125,515 $ 1,573,569 The City s investment policy does not address interest rate risk. 6. DEPOSITS, INVESTMENTS AND SECURITIES LENDING - PENSION AND OPEB TRUST FUNDS The deposits and investments of the Police and Fire Retirement System Trust Fund (the System ) and of the other employee benefits trust funds are maintained separately from the City s pooled cash and investments, and are subject to separate investment policies and state statutes. Accordingly, the required disclosures for these deposits and investments are presented separately. Deposits - The System and the other employee benefits trust funds do not maintain any checking or other demand/time deposit accounts. Amounts reported as cash and cash equivalents in the statement of plan net position are composed entirely of short-term investments in money market accounts. Investments - The Michigan Public Employees Retirement Systems Investment Act, Public Act 314 of 1965, as amended, authorizes the System to invest in stocks, government and corporate securities, mortgages, real estate, and various other investment instruments, subject to certain limitations. The Retirement Board has the responsibility and authority to oversee the investment portfolio. Various professional investment managers are contracted to assist in managing the System s assets. All investment decisions are subject to Michigan law and the investment policy established by the Retirement Board. Investments at fair value, as determined by quoted market price U.S. treasuries $ 9,170,824 U.S. agencies 16,504,694 Domestic corporate securities 33,871,406 Domestic equities: Not on securities loan 21,673,674 On securities loan 1,299,144 American depository receipts 13,314,182 International equities 32,145,125 Real estate investment trusts 310,303 Total investments $ 128,289,352 71
80 Notes to Financial Statements In addition to the above, the System and the other employee benefits trust funds had short-term investments of $5,226,232 held in money market funds and $1,300,614 included in the pooled cash and investments, respectively, as of June 30, Also, the Retirement Health Funding Vehicle fund, one of the other employee benefits trust funds, had $3,460,510 held in a mutual fund at year-end. Credit Risk. The System s investment policy provides that its investments in fixed income securities be limited to those rated BBB or better by a nationally recognized statistical rating organization. As of June 30, 2014, the System s investments in securities of U.S. agencies were not rated by Standard & Poor s. The System s investments in corporate securities were rated by Standard & Poor s as follows: Rating AAA $ 4,291,058 AA 3,738,724 A 7,179,556 BBB 7,948,547 Not rated 10,713,521 Totals $ 33,871,406 Custodial Credit Risk. For investments, custodial credit risk is the risk that, in the event of the failure of the counterparty, the System will not be able to recover the value of its investments or collateral securities that are in the possession of an outside party. The System s investment policy requires that investment securities be held in trust by a third-party institution in the System s name. As such, although uninsured and unregistered, the System s investments are not exposed to custodial credit risk since the securities are held by the counterparty s trust department in the System s name. Investments in money market and mutual funds are not subject to custodial credit risk. Concentration of Credit Risk. The System s investments are not exposed to concentration of credit risk relative to a single issuer (i.e. company or government agency) inasmuch as no holdings equal or exceed 5% or more of total investments. The System s investment policy requires that the securities of any one company or government agency should not exceed 10% of the total fund and no more than 25% of the total fund should be invested in any one industry. Interest Rate Risk. As of June 30, 2014, maturities of the System s debt securities were as follows: Investment Maturities (fair value by years) Less More Fair Value Than Than 10 U.S. treasuries $ 9,170,825 $ - $ 2,686,026 $ 3,638,727 $ 2,846,072 U.S. agencies 16,504, ,507 3,200,957 12,553,471 Domestic corporate securities 33,871, ,389 8,034,237 9,097,752 16,167,028 $ 59,546,924 $ 573,147 $ 11,469,770 $ 15,937,436 $ 31,566,571 None of the above securities are callable. 72
81 Notes to Financial Statements The System s investment policy provides that the maximum maturity for any single fixed income security is ten years and that the weighted average portfolio maturity may not exceed eight years. Foreign Currency Risk. Foreign currency risk is the risk that significant fluctuations in exchange rates may adversely affect the fair value of an investment. The System has various investment holdings in international equities (excluding American depository receipts) totaling $32,145,125; these holdings are primarily in common and preferred stocks of Canadian (dollars) and European (euros) companies. The System does not have any policies regarding foreign currency risk. Securities Lending. A contract approved by the System s Board permits the System to lend its securities to broker-dealers and banks (borrowers) for collateral that will be returned for the same securities in the future. The System s custodial bank manages the securities lending program and receives cash as collateral. The collateral securities cannot be pledged or sold by the System unless the borrower defaults. Collateral cash is initially pledged at 100 percent of the fair value of the securities lent, and may not fall below 100 percent during the term of the loan. There are no restrictions on the amount of securities that can be loaned. Securities on loan at year-end are classified in the preceding schedule of investments according to the category for the collateral received on the securities lent. At year-end, the System has no credit risk exposure to borrowers because the amounts the System owes the borrowers exceed the amounts the borrowers owe the System. The contract with the System s custodian requires it to indemnify the System if the borrowers fail to return the securities (and if the collateral is inadequate to replace the securities lent) or fail to pay the System for income distributions by the securities issuers while the securities are on loan. Also at year-end, through a cash collateral investing program provided by the custodial bank, the System has an obligation to repay $131,239 of cash collateral that was invested in a Sigma Finance Medium Term Note, which is impaired. Any current or future recoveries from Sigma Finance are not expected. 7. RECEIVABLES Receivables in the governmental activities are 48.0 percent loans, 43.9 percent accounts receivable, 2.0 percent special assessments, 3.5 percent grants and 2.6 percent interest; business-type activities receivables are 55.6 percent due from customers, 19.1 percent grants, 1.6 percent special assessments, 22.6 percent loans, and 1.1 percent interest. Governmental activities accounts receivable are reported net of an allowance for uncollectible accounts of $1,466,
82 Notes to Financial Statements 8. CAPITAL ASSETS Capital assets activity for the year ended June 30, 2014, was as follows: Beginning Balance Increases Decreases Governmental activities Capital assets not being depreciated: Land $ 2,024,685 $ 25,955 - Ending Balance $ $ 2,050,640 Construction in progress 9,003,623 - (2,811,225) 6,192,398 11,028,308 25,955 (2,811,225) 8,243,038 Capital assets being depreciated: Land improvements 10,243,714 8,274,490-18,518,204 Buildings 53,914,524 27,850-53,942,374 Vehicles 10,142, ,205 (149,110) 10,613,575 Equipment 24,223, ,219 (38,812) 24,331,500 Infrastructure 285,146,101 3,553, ,699, ,669,912 12,623,547 (187,922) 396,105,537 Less accumulated depreciation for: Land improvements (4,665,177) (796,789) - (5,461,966) Buildings (23,829,921) (1,364,013) - (25,193,934) Vehicles (8,069,948) (668,376) 149,110 (8,589,214) Equipment (21,244,944) (670,911) 38,812 (21,877,043) Infrastructure (102,597,805) (5,738,460) - (108,336,265) (160,407,795) (9,238,549) 187,922 (169,458,422) Total capital assets being depreciated, net 223,262,117 3,384, ,647,115 Governmental activities capital assets, net $ 234,290,425 $ 3,410,953 $ - $ 234,890,153 Depreciation expense was charged to programs of the primary government as follows: Governmental activities: General government $ 64,277 Public safety 494,408 Public works, including depreciation of general infrastructure assets 6,951,997 Parks and recreation 943,962 Capital assets held by the government's internal service funds are charged to the various functions based on their usage of the assets 783,905 Total depreciation expense - governmental activities $ 9,238,549 74
83 Notes to Financial Statements Beginning Balance Increases Decreases Business-type activities Capital assets not being depreciated: Land $ 3,452,863 $ - - Ending Balance $ $ 3,452,863 Construction in progress - 3,870,017-3,870,017 3,452,863 3,870,017-7,322,880 Capital assets being depreciated: Land improvements 6,057, ,079-6,371,095 Buildings 63,150,200 13,203-63,163,403 Vehicles 4,622,317 - (55,408) 4,566,909 Equipment 14,604, ,163 (160,579) 14,564,149 Systems 185,902,311 1,027,066 (111,634) 186,817, ,336,409 1,474,511 (327,621) 275,483,299 Less accumulated depreciation for: Land improvements (4,283,333) (104,532) - (4,387,865) Buildings (43,221,862) (1,806,985) - (45,028,847) Vehicles (3,621,433) (434,881) 55,408 (4,000,906) Equipment (12,998,076) (711,481) 146,262 (13,563,295) Systems (108,589,303) (5,179,770) 111,634 (113,657,439) (172,714,007) (8,237,649) 313,304 (180,638,352) Total capital assets being depreciated, net 101,622,402 (6,763,138) (14,317) 94,844,947 Business-type activities capital assets, net $ 105,075,265 $ (2,893,121) $ (14,317) $ 102,167,827 Business-type activities: Wastewater $ 4,464,688 Water 2,010,992 Public transit 566,481 Airport 722,669 Parking 348,514 Other 124,305 Total depreciation expense - business-type activities $ 8,237,649 At June 30, 2014, the City's had outstanding commitments through a construction contract of approximately $15,000,000 for building, street and equipment improvements. 75
84 Notes to Financial Statements Activity for the TIFA for the year ended June 30, 2014, was as follows: Beginning Balance Increases Decreases Component unit - TIFA Capital assets not being depreciated: Land $ 12,675,578 $ - - Ending Balance $ $ 12,675,578 Construction in progress - 431, ,522 12,675, ,522-13,107,100 Capital assets being depreciated: Land improvements 987, ,661-1,165,421 Buildings 278,190 37, ,845 Equipment 429, ,858 1,695, ,316-1,911,124 Less accumulated depreciation for: Land improvements (240,959) (21,532) - (262,491) Buildings (211,430) (13,010) - (224,440) Equipment (366,285) (18,163) - (384,448) (818,674) (52,705) - (871,379) Total capital assets being depreciated, net 877, ,611-1,039,745 TIFA capital assets, net $ 13,552,712 $ 594,133 $ - $ 14,146, PAYABLES Payables in the governmental activities are 50.3 percent vendors, 19.1 percent claims and 30.6 percent accrued payroll, interest, compensated absences and other liabilities. Business-type activities payables are 64.6 percent vendors, 19.1 percent advances and 16.3 percent interest and other liabilities. 10. INTERFUND RECEIVABLES, PAYABLES AND TRANSFERS At June 30, 2014, the following interfund balances were outstanding: Payable Funds Community Nonmajor Nonmajor Development Governmental Battle Creek Enterprise Receivable Fund Fund Funds Transit System Funds Total General fund $ 141,373 $ 293,388 $ 419,248 $ 76,148 $ 930,157 These balances result from negative cash balances in the respective funds with interfund payables, also to move charges for services from the general to nonmajor funds. 76
85 Notes to Financial Statements For the year ended June 30, 2014, interfund transfers consisted of the following: Transfers In Nonmajor Nonmajor Governmental Battle Creek Enterprise Transfers Out General Fund Funds Transit System Funds General fund $ - $ 2,569,639 $ 888,230 $ 53,820 Community development fund Nonmajor governmental funds - 1,781,774-9,036 Water and wastewater fund W.K. Kellogg airport fund Battle Creek Transit System Nonmajor enterprise funds - 42, Internal service funds 16, , $ 16,600 $ 5,383,517 $ 888,230 $ 62,856 Transfers In Internal Service Transfers Out Funds Total General fund $ 136,998 $ 3,648,687 Community development fund 2,295 2,295 Nonmajor governmental funds 4,162 1,794,972 Water and wastewater fund 485, ,527 W.K. Kellogg airport fund 5,993 5,993 Battle Creek Transit System 4,641 4,641 Nonmajor enterprise funds 15,776 58,409 Internal service funds 34,368 1,040,439 $ 689,760 $ 7,040,963 Transfers are used to: (1) move revenues from the fund that is required to collect them to the fund that is required or allowed to expend them; (2) move receipts restricted to or allowed for debt service from the funds collecting the receipts to the debt service fund as debt service payments become due; and (3) use unrestricted revenues collected in the general fund to finance various programs accounted for in other funds in accordance with budgetary authorizations. The more significant of these transfers are from the general fund to the nonmajor governmental funds for various projects, initiatives and debt service. 77
86 Notes to Financial Statements 11. LONG-TERM DEBT Primary Government General obligation bonds. The government issues general obligation bonds to provide funds for the acquisition and construction of major capital facilities. General obligation bonds have been issued for both governmental and business-type activities. The original amount of general obligation bonds issued in prior years for the items listed below was $40,994,000 for the primary government and $11,810,000 for the discretely presented component units. During the fiscal year 2014 the City issued capital improvement bonds of $15,370,000. General obligation bonds are direct obligations and pledge the full faith and credit of the government. These bonds are issued as 5 to 20 year serial bonds with varying amounts of principal maturing each year. General obligation bonds currently outstanding are as follows: Year of Maturity Interest Rates Amount Governmental activities 2006 dispatch equipment % $ 885, building authority refunding % % 4,515, building authority - golf course refunding % % 2,130, building authority limited tax refunding % % 6,430, capital improvement % % 14,830,000 Total governmental activities $ 28,790,000 Year of Maturity Interest Rates Amount Discretely presented component units 2009 tax increment - airport % % $ 3,185, tax increment - airport hangar % % 2,875,000 Total component units $ 6,060,000 78
87 Notes to Financial Statements Annual debt service requirements to maturity for general obligation bonds are as follows: Governmental Activities Component Units Year Ended June 30, Principal Interest Principal Interest 2015 $ 2,080,000 $ 567,736 $ 360,000 $ 229, ,265, , , , ,785, , , , ,855, , , , ,935, , , , ,610, ,761 1,760, , ,285,000 54,752 2,175, , ,975, ,000 9,975 $ 28,790,000 $ 3,247,780 $ 6,060,000 $ 2,079,693 Revenue bonds. The City and its discretely presented component units also issue bonds where the income derived from the acquired or constructed assets is pledged to pay debt service. The original amount of revenue bonds issued in prior years was $23,940,000 for the City and $64,305,000 for the component units. During the fiscal year 2014 the City issued revenue refunding bonds of $4,385,000 and $3,675,000. Year of Maturity Interest Rates Amount Business-type activities 2011 water and wastewater system refunding % % $ 5,010, water and wastewater system refunding % 4,385,000 Total business-type activities $ 9,395,000 Discretely presented component units 1997 development refunding % % $ 1,300, downtown development refunding % 34,920, downtown development refunding % 3,675,000 Total component units $ 39,895,000 79
88 Notes to Financial Statements Revenue bond debt service requirements to maturity are as follows: Business-type Activities Component Units Year Ended June 30, Principal Interest Principal Interest 2015 $ 1,988,000 $ 220,762 $ 3,455,000 $ 1,994, ,026, ,990 3,410,000 1,822, ,066, ,162 4,245,000 1,651, , ,225 4,485,000 1,439, ,000 93,912 4,740,000 1,215, ,070, ,600 18,275,000 2,478, ,285,000 64,250 $ 9,395,000 $ 891,651 $ 39,895,000 $ 10,665,000 Refunded Debt During fiscal year 2014, the City issued $4,385,000 of refunding bonds to advance refund $4,417,750 of bonds to provide resources to purchase U.S. government securities that were placed in an irrevocable trust to generate resources for all future debt service payments. As a result, the refunded bonds are considered to be defeased and the liability has been removed from the governmental activities. The refunding resulted in a savings of $374,912 and an economic gain of $270,013. Also during fiscal year 2014, the City issued $3,675,000 of refunding bonds to partially advance refund $3,487,451 of the 2008 downtown development refunding bonds to provide resources to purchase U.S. government securities that were placed in an irrevocable trust to generate resources for all future debt service payments. As a result, the refunded bonds are considered to be defeased and the liability has been removed from the governmental activities. The refunding resulted in a loss of $2,085,646 and an economic loss of $402,083. The dissaving was allowed due to a decline in value and projected substantial use of fund balance. Installment obligations. The government has entered into various long-term installment payment agreements. The original amount of installment obligations issued in prior years for the items listed below was $9,502,005 for the primary government. No new installment debt was entered into during the year. Year of Maturity Interest Rates Amount Governmental activities 2007 energy savings equipment contract # % $ 2,426, energy savings equipment contract # % 181, energy savings equipment contract # % 59,396 Total governmental activities $ 2,667,042 80
89 Notes to Financial Statements Annual debt service requirements to maturity for installment obligations are as follows: Governmental Activities Year Ended June 30, Principal Interest 2015 $ 262,498 $ 120, , , ,734 95, ,250 82, ,399 67, ,225, ,960 $ 2,667,042 $ 589,857 Capital leases. The government entered into various lease agreements for computers and airport snow removal equipment. The original amount of capital leases issued in prior years for the items listed below was $2,423,835 for the primary government. The City did not enter into any new capital leases during the year. Year of Maturity Interest Rates Amount Business-type activities 2005 plow % $ 38, runway snowplow % 78, snow blower % 184, runway snowplow % 192,415 Total business-type activities $ 494,130 Annual debt service requirements to maturity for the capital leases are as follows: Business-type Activities Year Ended June 30, Principal Interest 2015 $ 170,480 $ 24, ,078 16, ,500 9, ,446 4, ,626 2,298 $ 494,130 $ 57,029 Loans payable. The TIFA (a discretely presented component unit) has borrowed from the Michigan Economic Development Corporation (MEDC) to fund certain economic development activities in the Fort Custer Industrial Park. The original amount of these loans was $1,689,
90 Notes to Financial Statements During the year ended June 30, 2008, the Brownfield Redevelopment Authority entered a loan with the Battle Creek Tax Increment Finance Authority (a component unit of the City of Battle Creek) to borrow up to $3,530,000 for use with a particular brownfield project. As of June 30, 2014, the Brownfield Redevelopment Authority had drawn a total of $2,560,708 on the authorized amount (no amount was drawn during the current year). During the year ended June 30, 2010, another loan was made between the two component units in the total amount of $5,500,000 to be used in accordance with another particular brownfield plan. As of June 30, 2014, a total of $2,303,513 (no amount was drawn during the current year) had been drawn on the authorized amount. Since repayment between the two component units is based on the future collection of incremental tax revenues, the loans are reported as a long-term liability by the Brownfield and a noncurrent receivable by the TIFA. The repayment obligations include interest at 5% per annum. Loans outstanding at year-end are as follows: Year of Maturity Interest Rates Amount Discretely presented component units Core communities loan % $ 242,056 Brownfield redevelopment loans n/a 5.00% 3,806,800 Total component units $ 4,048,856 Annual debt service requirements to maturity for the MEDC loans are as follows: Component Units Year Ended June 30, Principal Interest 2015 $ 92,521 $ 12, ,198 6, ,337 1,158 $ 242,056 $ 20,415 82
91 Notes to Financial Statements Changes in long-term debt. Long-term debt activity for fiscal 2014 was as follows: Beginning Balance Additions Deductions Ending Balance Primary government Governmental activities General obligation bonds $ 15,130,000 $ 15,370,000 $ (1,710,000) 28,790,000 Due Within One Year $ $ 2,080,000 Installment contracts 3,084,762 - (417,720) 2,667, ,498 Compensated absences 2,683,921 1,590,350 (1,424,757) 2,849,514 1,496,606 Deferred amounts: For issuance premiums 221, ,666 (43,059) 561,769 - For issuance discounts (24,884) - 2,488 (22,396) - Total governmental activities debt $ 21,094,961 $ 17,344,016 $ (3,593,048) $ 34,845,929 $ 3,839,104 Beginning Balance Additions Deductions Ending Balance Due Within One Year Business-type activities Revenue bonds $ 11,130,000 $ 4,385,000 $ (6,120,000) $ 9,395,000 $ 1,988,000 Capital leases 656,732 - (162,602) 494, ,480 Compensated absences 501, ,573 (515,358) 542, ,482 Deferred amounts - For issuance premiums 403,335 - (79,754) 323,581 - Total business-type activities debt $ 12,691,334 $ 4,941,573 $ (6,877,714) $ 10,755,193 $ 2,700,962 Component units DDA Revenue bonds $ 40,765,000 $ 3,675,000 $ (5,845,000) $ 38,595,000 $ 2,700,000 Deferred amounts - For issuance premiums 1,278,575 - (142,064) 1,136,511 - Total DDA debt $ 42,043,575 $ 3,675,000 $ (5,987,064) $ 39,731,511 $ 2,700,000 TIFA General obligation bonds $ 6,410,000 $ - $ (350,000) $ 6,060,000 $ 360,000 Revenue bonds 2,070,000 - (770,000) 1,300, ,000 Loans payable 329,228 - (87,172) 242,056 92,521 Deferred amounts - For issuance discounts (13,345) (12,549) - Total TIFA debt $ 8,795,883 $ - $ (1,206,376) $ 7,589,507 $ 1,207,521 Brownfield Loans payable $ 4,012,299 $ - $ (205,499) $ 3,806,800 $ - 83
92 Notes to Financial Statements For the governmental activities, compensated absences, net pension obligations and net other postemployment benefits obligations are generally liquidated by the general fund. 12. SEGMENT INFORMATION - ENTERPRISE FUNDS The government issued revenue bonds to finance certain improvements to its water and wastewater system. Because the water and wastewater fund, an individual fund that accounts entirely for the government s water and wastewater activities, is a segment and is reported as a major fund in the fund financial statements, segment disclosures herein are not required. 13. ENDOWMENTS Youth Center Endowment Permanent Trust Fund. For the year ended June 30, 2014, the net appreciation on investments of donor-restricted endowments was $5,338. Under the terms of the endowment, and consistent with State statutes, the City is authorized based on a total-return policy to spend the net appreciation for the benefit of the youth center. At year-end, accumulated available net appreciation of $5,338 is reported in restricted; the nonexpendable endowment balance is $256,376. Kellogg Arena Endowment Permanent Trust Fund. For the year ended June 30, 2014, the net appreciation on investments of donor-restricted endowments was $15,692. Under the terms of the endowment, and consistent with State statutes, the City is authorized based on a total-return policy to spend the net appreciation for the benefit of the Kellogg Arena. At year-end, accumulated available net appreciation of $64,662 is reported in restricted; the nonexpendable endowment balance is $623, RISK MANAGEMENT The City is exposed to various risks of loss related to property loss, torts, errors and omissions, and employee injuries, as well as medical, dental and death benefits provided to employees. The City has purchased commercial insurance for employee dental and life coverages, certain property and inland marine exposures, airport liability, liquor liability, and emergency medical treatment. The City s workers compensation exposure is handled on a self-funded basis using a third-party administrator, with excess insurance for claims greater than a self-insured retention (SIR) of $650,000 per occurrence. As of July 1, 1986, the City s general and related liability insurance was allowed to expire; any occurrences prior to that date may be covered by liability policies previously in effect. The City now self-administers general liability and related exposures, utilizing excess liability insurance for losses greater than a SIR of $1 million per occurrence and $2.5 million in the aggregate, annually. The limits of the excess liability insurance have been as follows: $15 million per occurrence effective September 1, 1999; $5 million per occurrence effective October 1, 2002; then $9 million per occurrence effective November 14, Settled claims related to commercial insurance have not exceeded the amount of insurance coverage in any of the past three fiscal years. Effective October 1, 2003, the City converted from a premium-based policy for employee medical coverage to a self-funded plan, with specific stop-loss insurance that limits claim expense to $50,000 per contract (i.e., employee and dependents), annually. Aggregate stop-loss insurance limits annual losses to 120 percent of expected claims. 84
93 Notes to Financial Statements The City estimates its self-insured liability for workers compensation, medical and comprehensive general liability claims that have been incurred through the end of the fiscal year, including both those claims that have been reported as well as those that have not yet been reported. These estimates are prepared by the City s Risk Management Department and recorded in the self-insurance internal service fund. Changes in the estimated liability for the fiscal years ended June 30 were as follows: Estimated liability, beginning of year $ 3,365,008 $ 3,834,142 Estimated claims incurred, including changes in estimates 7,952,821 10,263,569 Claim payments (7,283,236) (10,732,703) Estimated liability, end of year $ 4,034,593 $ 3,365, PROPERTY TAXES The government s property taxes are levied each July 1 on the taxable valuation of property located in the City as of the preceding December 31, the lien date. Property taxes are payable without penalty and interest through August 31; as of March 1 of the succeeding year, unpaid real property taxes are sold to and collected by Calhoun County. Assessed values, as established annually by the government and subject to acceptance by the County, are equalized by the State at an estimated 50% of current market value. The taxable value of real and personal property in the City for the 2013 levy, including industrial facilities and neighborhood enterprise zone properties, but net of renaissance zones, was $1,491,889,619. The government s general operating tax rate for fiscal was mills with an additional mills for police and fire pension. Property taxes for the DDA, LDDA, TIFA and BRA are derived from tax increment financing agreements with the various applicable taxing authorities. Under these arrangements, the tax increment finance entities receive the property taxes levied on the increment of current taxable values over the base year values on those properties located within the established tax increment financing district. Property taxes are recognized in the fiscal year in which they are levied. 16. CONTINGENT LIABILITIES Amounts received or receivable from grantor agencies are subject to audit and potential adjustment by grantor agencies, principally the federal government. Any disallowed claims, including amounts already collected, may constitute a liability of the applicable funds. The amount, if any, of expenditures which may be disallowed by the grantor cannot be determined at this time although the government expects such amounts, if any, to be immaterial. The government is a defendant in various lawsuits. Although the outcome of these lawsuits is not presently determinable, it is the opinion of the government s counsel that resolution of these matters will not have a material adverse effect on the financial condition of the government. 85
94 Notes to Financial Statements The City is currently involved in various tax appeals pending before the Michigan Tax Tribunal. The appeals cover various commercial and industrial properties for Due to the large number of appeals currently before the Tribunal, the time frame for resolution of these matters is unknown at this time. The City has an estimated maximum exposure of approximately $3.01 million in taxable value. The City is vigorously defending all litigation. 17. DEFINED BENEFIT PENSION PLANS Police and Fire Retirement System The Police and Fire Retirement System (the System ) is a single-employer defined benefit pension plan that provides retirement, health, disability and death benefits to all full-time police and fire personnel of the City, subject to the limitations on health care benefits described in Note 17. The System is administered by the Retirement Board of the Police and Fire Retirement System. The System issues a publicly available financial report that includes financial statements and required supplementary information. That report may be obtained by writing to the System at 10 North Division Street, Battle Creek, MI The financial statements of the System are prepared using the accrual basis of accounting. System member contributions are recognized in the period in which the contributions are due. The City s contributions are recognized when due and a formal commitment to provide the contributions has been made. Benefits and refunds are recognized when due and payable in accordance with the terms of the plans. System investments are reported at fair value. Short-term investments are reported at cost, which approximates fair value. Securities traded on national or international exchanges are valued at the last reported sales price at current exchange rates. Investments for which market quotations are not readily available are valued at their fair values as determined by the custodian under the direction of the Retirement Board, with the assistance of a valuation service. Administrative costs are financed through investment earnings. System members are required to contribute between 7.5% to 10% of their annual covered wages to the System for pension benefits, depending on the bargaining unit. The City is required to contribute such additional amounts as necessary, based on actuarial determinations, to provide assets sufficient to pay for member benefits. The City s pension contribution to the System for the year ended June 30, 2014 amounted to 30.12% of annual covered payroll. Plan Membership. At June 30, 2014, plan membership consisted of the following: Retirees and beneficiaries currently receiving benefits 248 Terminated employees entitled to but not yet receiving benefits 9 Vested and non-vested active participants 177 Total membership 434 System benefit provisions were established and may be amended under the authority of City Ordinances. Contribution requirements were established and may be amended subject to collective bargaining agreements and approval by the System Retirement Board and City Commission. 86
95 Notes to Financial Statements The annual required contribution (ARC) for the year ended June 30, 2014 for pension was $4,316,203. The ARC was made by the City. There was no net pension obligation at the beginning or the end of the fiscal year. Three-Year Trend Information Annual Years Ended Pension Percentage Net Pension June 30, Cost (APC) Contributed Obligation 2012 $ 3,659, % $ ,105, % ,316, % - The funded status of the pension portion of the System as of June 30, 2013, the date of the most recent actuarial valuation, was as follows: Actuarial accrued liability (AAL) $ 149,004,999 Actuarial value of assets 117,879,023 Unfunded AAL (UAAL) $ 31,125,976 Funded ratio 79.1% Covered payroll $ 11,700,630 UAAL as % of covered payroll 266.0% Actuarial valuations of an ongoing plan involve estimates of the value of reported amounts and assumptions about the probability of occurrence of events far into the future. Examples include assumptions about future employment and mortality. Actuarially determined amounts are subject to continual revision as actual results are compared with past expectations and new estimates are made about the future. The schedule of funding progress, presented as required supplementary information following the notes to the financial statements, present multi-year trend information about whether the actuarial values of plan assets are increasing or decreasing over time relative to the actuarial accrued liabilities for benefits. For purposes of the schedule of funding progress, the actuarial accrued liability value as shown is determined using the entry age actuarial cost method. The accompanying schedule of employer contributions presents trend information about the amounts contributed to the System by the employer in comparison to the ARC (annual required contribution), an amount that is actuarially determined in accordance with the parameters of GASB Statement 27. The ARC represents a level of funding that, if paid on an ongoing basis, is projected to cover normal cost for each year and amortize any unfunded actuarial liabilities (or funding excess) over a period not to exceed 30 years. Projections of benefits for financial reporting purposes are based on the substantive plan (the plan understood by the employer and plan members) and include the types of benefits provided at the time of each valuation and the historical pattern of sharing of benefit costs between the employer and plan members to that point. The actuarial methods and assumptions used include techniques that are designed to reduce the effects of short-term volatility in actuarial accrued liabilities and the actuarial value of assets, consistent with the long-term perspective of the calculations. 87
96 Notes to Financial Statements Additional information as of the latest actuarial valuation includes: Valuation date June 30, 2013 Actuarial cost method Entry-age Amortization method Level percent-of-payroll Remaining amortization period 30 year open Asset valuation method 5-year smoothed market w/ 20% corridor Actuarial assumptions: Investment rate of return 7.0% Projected salary increases 4.5% to 12.9% Wage inflation 4.5% Cost-of-living adjustments None Inflation rate 3.0% to 4.0% GASB Statement 27 required supplementary information is presented after the notes to the financial statements section of this report. Net pension liability (under GASB Statement 67) The components of the net pension liability of the City at June 30, 2014, are as follows: Total pension liability $ 153,438,134 Plan fiduciary net position (133,897,145) City's net pension liability $ 19,540,989 Plan fiduciary net position as a percentage of the total pension liability 87.26% Actuarial assumptions. The total pension liability was determined by an actuarial valuation as of June 30, 2013 (and rollforward to June 30, 2014, the measurement date), using the following actuarial assumptions, applied to all periods included in the measurement: Inflation Salary increases Investment rate of return 4.5 percent 4.5 to 12.9 percent, including inflation 7.0 percent, net of pension plan investment expense, including inflation Mortality rates were based on the RP 2000 Male Combined Healthy Table projected to 2010 using the projection scale AA. 88
97 Notes to Financial Statements The long-term expected rate of return on pension plan investments was determined using a building-block method in which best-estimate ranges of expected future real rates of return (expected returns, net of investment expense and inflation) are developed for each major asset class. These ranges are combined to produce the long-term expected rate of return by weighting the expected future real rates of return by the target asset allocation percentage and by adding expected inflation. Best estimates of arithmetic real rates of return for each major asset class included in the pension plan s target asset allocation as of June 30, 2014 (see the discussion of the System's investment allocation policy) are summarized in the following table: Asset Class Long-term Expected Real Rate of Return U.S. treasuries 0.75% U.S. agencies 0.75% Domestic corporate securities 5.25% Domestic equities 5.60% American depository receipts 0.75% International equities 5.25% Real estate investment trusts 0.75% Discount rate. The discount rate used to measure the total pension liability was 7.0 percent. The projection of cash flows used to determine the discount rate assumed that plan member contributions will be made at the current contribution rate and that City contributions will be made at rates equal to the difference between actuarially determined contribution rates and the member rate. Based on those assumptions, the pension plan s fiduciary net position was projected to be available to make all projected future benefit payments of current plan members. Therefore, the long-term expected rate of return on pension plan investments was applied to all periods of projected benefit payments to determine the total pension liability. Sensitivity of the net pension liability to changes in the discount rate. The following presents the net pension liability of the City, calculated using the discount rate of 7.0 percent, as well as what the City s net pension liability would be if it were calculated using a discount rate that is 1-percentage-point lower (6.0 percent) or 1-percentage point higher (8.0 percent) than the current rate: 1% Current 1% Decrease Discount Increase (6.0%) (7.0%) (8.0%) City's net pension liability $ 37,479,769 $ 19,540,989 $ 4,468,898 89
98 Notes to Financial Statements Municipal Employees Retirement System of Michigan The City also participates in the Municipal Employees Retirement System of Michigan (MERS), an agent multiple-employer plan administered by the Retirement Board of MERS. The Plan provides retirement and disability benefits, annual cost of living adjustments, and death benefits to Plan members and beneficiaries. The MERS Retirement Board establishes and amends the benefit provisions of the participants in MERS. The Municipal Employees Retirement System of Michigan issues a publicly available financial report that includes financial statements and required supplementary information for MERS. That report may be obtained by writing to the Municipal Employees Retirement System of Michigan, 447 N. Canal Road, Lansing, Michigan 48917, by calling (800) , or it can be viewed on-line at The City is required to contribute at an actuarially determined rate; the current rate is 23.8% of annual covered payroll. City employees are required to contribute 0.0% to 7.20% of their annual covered payroll, depending on the applicable bargaining unit. The contribution requirements of the City are established and may be amended by the Retirement Board of MERS. The contribution requirements of plan members are established and may be amended by the City, subject to collective bargaining agreements and depending on the MERS contribution program adopted by the City. For the year ended June 30, 2014, the City s annual pension cost of $3,767,996 for MERS was equal to the City s required and actual contributions. The required contribution was determined as part of the December 31, 2013 actuarial valuation using the entry age actuarial cost method. The actuarial assumptions included: (a) a rate of return on the investment of present and future assets of 8.0%; (b) projected salary increase of 4.5% per year compounded annually, attributable to inflation; and (c) additional projected salary increases of 0.0% to 17.50% per year, depending on age, attributable to seniority/merit. The actuarial value of MERS assets was determined on the basis of a valuation method that assumes the fund earns the expected rate of return, and includes an adjustment to reflect fair value. The City s unfunded actuarial accrued liability is being amortized as a level percentage of projected payroll on an open basis. The remaining amortization period at December 31, 2013, the date of the latest actuarial valuation, was 25 years. Three-Year Trend Information Annual Years Ended Pension Percentage Net Pension June 30, Cost (APC) Contributed Obligation 2012 $ 3,337, % $ ,531, % ,767, % - 90
99 Notes to Financial Statements The funded status of the pension portion of the Plan as of December 31, 2013, the date of the most recent actuarial valuation, was as follows: Actuarial accrued liability (AAL) $ 128,362,120 Actuarial value of assets 87,954,127 Unfunded AAL (UAAL) $ 40,407,993 Funded ratio 68.5% Covered payroll $ 16,371,734 UAAL as % of covered payroll 246.8% As previously mentioned, actuarial valuations of an ongoing plan involve estimates of the value of reported amounts and assumptions about the probability of occurrence of events far into the future. Examples include assumptions about future employment and mortality. Actuarially determined amounts are subject to continual revision as actual results are compared with past expectations and new estimates are made about the future. The schedule of funding progress for the MERS Plan, presented as required supplementary information following the notes to the financial statements, present multi-year trend information about whether the actuarial values of plan assets are increasing or decreasing over time relative to the actuarial accrued liabilities for benefits. For purposes of the schedule of funding progress, the actuarial accrued liability value as shown is determined using the entry age actuarial cost method. 18. POSTEMPLOYMENT BENEFITS The City provides health care benefits under a single-employer plan to certain full-time employees upon retirement, in accordance with labor agreements and/or the City Administrative Code, or in the case of police and fire personnel according to City Commission resolution. The City includes pre-medicare retirees and their dependents in its insured health care plan, with contributions required in varying amounts. The City purchases Medicare supplemental insurance for retirees eligible for Medicare. For police and fire employees, the obligation for police and fire personnel retiree health care, prior to fiscal 2007, was entirely advance-funded through the Police and Fire Retirement System (the System ). Beginning in fiscal 2007, following negotiations and arbitration, the System became responsible for only the first $512,795 of health care costs of the then current retirees. Police and fire personnel retiring on or after July 1, 2007 receive their health care benefits through either the Retirement Health Funding Vehicle (RHFV) or Fire Retiree Health Care trust fund, which are employee contributory plans (that are presented as other employee benefit trust funds in separately issued financial statements; these two trust funds constitute the financial statements for the City s postemployment benefits plan). For all other eligible City employees, the City contributes a maximum of $200 per month towards the purchase of retiree health care. The Systems' financial statements are prepared using the accrual basis of accounting. System contributions are recognized in the period in which the contributions are due and the employer has made a formal commitment to provide the contribution. Benefits and refunds are recognized when due and payable in accordance with the terms of the plan. 91
100 Notes to Financial Statements Plan investments are reported at fair value. Short-term investments are reported at cost, which approximates fair value. Securities traded on national or international exchanges are valued at the last reported sales price at current exchange rates. Investments that do not have established market values are reported at estimated fair values as determined by the custodian under the direction of the Retirement Board with the assistance of a valuation service. Administrative costs are financed through investment earnings. The RHFV portion of the plan utilizes a retirement health funding vehicle trust established with the Municipal Employees Retirement System of Michigan to invest plan assets. Plan membership consisted of 311 retirees currently receiving benefits and 490 active members (for a total of 801) as of June 30, 2013, the date of the latest actuarial valuation. The City has no obligation to make contributions in advance of when the insurance premiums or benefits are due for payment; in other words, the plan may be financed on a pay-as-you-go basis. Administrative costs of the plan are paid for by the City s general fund. Certain plan participants are required to contribute to the plan. For the year ended June 30, 2014, $1,754,700 was contributed towards the cost of benefits and funding the plan. See below for summary: Fund Employee Employer Total Retirement health funding vehicle $ - $ 401,377 $ 401,377 Fire retiree health care 223, , ,720 Police and fire pension fund - 512, ,795 Internal service - self-insurance fund - 366, ,808 $ 223,720 $ 1,530,980 $ 1,754,700 Funding Progress. For the year ended June 30, 2014, the City estimated the cost of providing retiree healthcare benefits through an actuarial valuation as of June 30, Such valuation computes the annual required contribution (ARC) that represents a level of funding, that if paid on an ongoing basis, is projected to cover the normal cost each year and amortize any unfunded actuarial liabilities (or funding excess) over a period not to exceed 30 years. The current combined ARC is 8.73% of annual covered payroll. Annual OPEB Cost and Net OPEB Obligation. For fiscal year 2014, the components of the City s annual OPEB (other postemployment benefit) cost for the year, the amount actually contributed to the plan (including pay-as-you-go amounts), and changes in the City s net OPEB obligation to the plan are as follows: Annual required contribution $ 2,386,371 Interest on net OPEB obligation 429,534 Adjustment to annual required contribution (338,947) Annual OPEB cost 2,476,958 Contributions made (1,754,700) Increase in net OPEB obligation 722,258 Net OPEB obligation, beginning of year 8,590,680 Net OPEB obligation, end of year $ 9,312,938 92
101 Notes to Financial Statements The City s annual OPEB cost, the percentage of annual OPEB cost contributed to the plan, and the net OPEB obligation for 2014 and the two preceding years were as follows: Annual Percentage Net Year OPEB of OPEB Cost OPEB Ended Cost Contributed Obligation 6/30/2012 $ 3,663, % $ 6,972,588 6/30/2013 3,310, % 8,590,680 6/30/2014 2,476, % 9,312,938 The funded status of the plan as of June 30, 2013, the date of the latest actuarial valuation, was as follows: Actuarial accrued liability (AAL) $ 41,620,241 Actuarial value of assets 4,078,070 Unfunded AAL (UAAL) $ 37,542,171 Funded ratio 9.8% Covered payroll $ 28,591,928 UAAL as % of covered payroll 131.3% Actuarial valuations of an ongoing plan involve estimates of the value of reported amounts and assumptions about the probability of occurrence of events far into the future. Examples include assumptions about future employment, mortality, and the healthcare cost trend. Amounts determined regarding the funded status of the plan and the annual required contributions of the employer are subject to continual revision as actual results are compared to past expectations and new estimates are made about the future. The schedule of funding progress, presented as required supplementary information following the notes to the financial statements, presents multiyear trend information that shows whether the actuarial value of plan assets is increasing or decreasing over time relative to the actuarial accrued liabilities for benefits. Projections of benefits for financial reporting purposes are based on the substantive plan (the plan as understood by the employer and plan members) and include the types of benefits provided at the time of each valuation and the historical pattern of sharing benefit costs between the employer and plan members to that point. The actuarial methods and assumptions used include techniques that are designed to reduce the effects of short-term volatility in actuarial accrued liabilities and the actuarial value of assets, consistent with the long-term perspective of the calculations. 93
102 Notes to Financial Statements Significant methods and assumptions were as follows: Actuarial valuation date June 30, 2013 Actuarial cost method Individual entry age Amortization method Level percent open Remaining amortization period 26 years closed Asset valuation method Market value Actuarial assumptions: Investment rate of return 5.0% Projected salary increases 4.5%-17.5% Inflation rate 4.5% Healthcare inflation rate 9% (2014), grading to 4.5% (2023) 19. FINANCIAL STATEMENTS FOR INDIVIDUAL PENSION AND OTHER POSTEMPLOYMENT BENEFIT FUNDS Pension Other Employee Benefits Retirement Police and Fire Health Retirement Funding Fire Retiree System Vehicle Health Care Total Assets Cash and cash equivalents $ 5,226,232 $ 61 $ 1,300,553 $ 6,526,846 Investments: U.S. treasuries 9,170, ,170,824 U.S. agencies 16,504, ,504,694 Domestic corporate securities 33,871, ,871,406 Domestic equities 22,972, ,972,818 American depository receipts 13,314, ,314,182 International equities 32,145, ,145,125 Real estate trusts 310, ,303 Mutual funds - 3,460,510-3,460,510 Interest receivable 423,082-4, ,765 Pension contributions receivable 89, ,718 Total assets 134,028,384 3,460,571 1,305, ,794,191 Liabilities Obligation for impaired investment of securities lending collateral 131, ,239 Net position Held in trust for pension and postemployment healthcare benefits $ 133,897,145 $ 3,460,571 $ 1,305,236 $ 138,662,952 94
103 Notes to Financial Statements Pension Other Employee Benefits Retirement Police and Fire Health Retirement Funding Fire Retiree System Vehicle Health Care Total Additions Investment income: From investing activities: Net appreciation in fair value of investments $ 14,984,100 $ - $ - $ 14,984,100 Investment earnings (loss) and dividends 2,727, ,926 26,007 3,170,437 Less investment expenses (453,794) - - (453,794) Net income from investing activities 17,257, ,926 26,007 17,700,743 From securities lending activities: Gross earnings 1, ,760 Borrower rebates 17, ,654 Securities lending fees (5,821) - - (5,821) Impaired investment recovery 25, ,093 Net income from securities lending activities 38, ,686 Total net investment income 17,296, ,926 26,007 17,739,429 Contributions: Employer 4,316, , ,000 4,967,580 Employees 991, ,720 1,215,512 Total contributions 5,307, , ,720 6,183,092 Total additions 22,604, , ,727 23,922,521 Deductions Pension benefit payments $ 8,389,950 $ - $ - $ 8,389,950 Contribution refunds 47, ,356 Medical insurance premiums/benefits 512, , ,416 1,143,088 Administrative expenses 197, ,492 Total deductions 9,147, , ,416 9,777,886 Net change to net position held in trust for benefits 13,456, ,426 (22,689) 14,144,635 Net position held in trust for benefits: Beginning of year 120,440,247 2,750,145 1,327, ,518,317 End of year $ 133,897,145 $ 3,460,571 $ 1,305,236 $ 138,662,952 95
104 Notes to Financial Statements 20. NET INVESTMENT IN CAPITAL ASSETS Following is a summary of net investment in capital assets, as presented in the government-wide statement of net position: Governmental Business-type Activities Activities Capital assets: Capital assets not being depreciated $ 8,243,038 $ 7,322,880 Capital assets being depreciated 226,647,115 94,844, ,890, ,167,827 Long-term liabilities related to capital assets: Due within one year 3,839,104 2,700,962 Due in more than one year 31,006,825 8,054,231 Deferred charge on refunding (255,466) (144,717) Unexpended bond proceeds (10,654,499) - Compensated absences (2,849,514) (542,482) Net long-term liabilities related to capital assets 21,086,450 10,067,994 Net investment in capital assets $ 213,803,703 $ 92,099,833 96
105 Notes to Financial Statements 21. FUND BALANCES - GOVERNMENTAL FUNDS Capital Community Improvement Nonmajor Total General Development Bonds Governmental Governmental Nonspendable: Inventories $ 9,353 $ - $ - $ 108,502 $ 117,855 Prepaid items 475, , ,541 Endowments , , , ,016,652 1,501,305 Restricted for: Michigan justice training ,065 10,065 Narcotics forfeiture ,561 89,561 Public safety communication ,425 4,425 Building inspection , ,951 Binder park golf course ,876 10,876 Youth center ,338 5,338 Kellogg arena ,662 64,662 Community development Special projects 147, ,134 Capital improvements (unexpended bond proceeds) ,654,499-10,654, , ,654, ,880 11,624,559 Committed for: Major and local streets ,272,918 1,272,918 Special grants , ,881 Debt service ,357 58,357 Capital projects , ,739 Special projects 844, , , ,436,895 3,281,519 Assigned for: Departmental appropriations , ,577 Capital outlay and projects 91, ,720 91, , ,297 Unassigned (deficit) 6,580, (131,387) 6,449,504 Total fund balances, governmental funds $ 8,149,022 $ 46 $ 10,654,499 $ 4,884,617 $ 23,688,184 97
106 Notes to Financial Statements 22. SETTLEMENT On November 6, 2014, the City settled a lawsuit with 70 current, former and/or retired City firefighters. The terms of the agreement provide for payment to the plaintiffs in the amount of $1,170,000 ($585,000 as wages and $585,000 as liquidated damages). This amount has been recorded as a liability as of June 30, 2014 along with payroll taxes and fringe benefits of $11,408, attorney fees incurred by the plaintiffs in the amount of $330,000, and maximum reimbursable costs of the plaintiffs of $20,000. The total liability of $1,531,408 is reported in the self-insurance internal service fund. 98
107 REQUIRED SUPPLEMENTARY INFORMATION 99
108 Required Supplementary Information (GASB 27) Police and Fire Retirement System Schedule of Funding Progress - Pension Only Actuarial Actuarial Accrued (Over) Under OAAL/UAAL Actuarial Value of Liability Funded AAL Funded as a % of Valuation Assets (AAL) (OAAL/UAAL) Ratio Covered Covered Date (A) (B) (B-A) (A/B) Payroll Payroll 6/30/2004 $ 103,745,735 $ 104,336,169 $ 590, % $ 12,114, % 6/30/ ,755, ,487,311 7,731, % 12,085, % 6/30/ ,283, ,501,359 11,217, % 12,283, % 6/30/ ,245, ,823,413 13,578, % 12,358, % 6/30/ ,285, ,752,205 13,466, % 12,497, % 6/30/ ,094, ,052,817 20,958, % 11,953, % 6/30/ ,804, ,557,259 24,752, % 12,383, % 6/30/ ,774, ,863,694 25,088, % 12,609, % 6/30/ ,083, ,540,987 30,457, % 12,269, % 6/30/ ,879, ,004,999 31,125, % 11,700, % Schedule of Employer Contributions - Pension Only Annual Year Ended Required Percentage June 30 Contributions Contributed 2005 $ 1,824, % ,458, % ,877, % ,117, % ,408, % ,122, % ,846, % ,659, % ,105, % ,316, % 100
109 Required Supplementary Information (GASB 67) Police and Fire Retirement System Schedule of Changes in Net Pension Liability and Related Ratios Fiscal Year Ending June 30, 2014 Total pension liability Service cost $ 3,152,919 Interest on total pension liability 10,227,546 Benefit changes - Difference between expected and actual experience - Assumption changes - Benefit payments (8,947,330) Refunds - Net change in total pension liability 4,433,135 Total pension liability, beginning of year 149,004,999 Total pension liability, end of year 153,438,134 Plan fiduciary net position Employer contributions 4,316,203 Employee contributions 991,792 Pension plan net investment income 17,296,496 Benefit payments (8,437,306) Pension plan administrative expense (197,492) Other (512,795) Net change in plan fiduciary net position 13,456,898 Plan fiduciary net position, beginning of year 120,440,247 Plan fiduciary net position, end of year 133,897,145 Net pension liability $ 19,540,989 Plan fiduciary net position as a percentage of total pension liability 87.26% Covered employee payroll $ 11,700,630 Net pension liability as a percentage of covered employee payroll % Note: GASB 67 was implemented in fiscal year This schedule is being built prospectively. Ultimately, 10 years of data will be presented. 101
110 Required Supplementary Information (GASB 67) Single-employer Defined Benefit Pension Plan Schedule of the Net Pension Liability Fiscal Year Ending June 30, Total Pension Liability Plan Net Position Net Pension Liability Plan Net Position as Percentage of Total Pension Liability Covered Payroll Net Pension Liability as Percentage of Covered Payroll 2014 $ 153,438,134 $ 133,897,145 $ 19,540, % $ 11,700, % Schedule of Investment Returns Fiscal Year Ending June 30, Annual Return (1) 6/30/ % 6/30/ % (1) Annual money-weighted rate of return, net of investment expenses Note: GASB 67 was implemented in fiscal year This schedule is being built prospectively. Ultimately, 10 years of data will be presented. 102
111 Required Supplementary Information (GASB 67) Schedule of City Contributions Last Fiscal Year Contributions in Relation Contributions to the as a Fiscal Actuarially Actuarially Contribution Percentage of Year Determined Determined Deficiency Covered Covered Ended Contribution Contribution (Excess) Payroll Payroll 6/30/2014 $ 4,316,203 $ 4,316,203 $ - $ 12,656, % Notes to Schedule of Contributions Valuation date June 30, 2013 (rolled forward to June 30, 2014, the measurement date) Notes Actuarially determined contribution rates are calculated as of June 30 that is 12 months prior to the beginning of the fiscal year for which the contributions are reported. Other information There were no changes in benefit provisions or actuarial assumptions as of the actuarial valuation date. Methods and assumptions used to determine contribution rates: Actuarial cost method Entry age normal Amortization method Level percentage of payroll, closed Remaining amortization period Closed 30 years for initial unfunded liability Closed years for benefit changes in Closed 26 years for method/assumption changes in 2009 Asset valuation method 5-year smoothed market Inflation 4.5% Salary increases 4.5%-12.9% including inflation Investment rate of return 7.0% net of pension plan investment expense, including inflation Mortality rates RP-2000 Mortality Table 103
112 Required Supplementary Information Municipal Employees Retirement System of Michigan Schedule of Funding Progress Actuarial Actuarial Accrued Unfunded UAAL Actuarial Value of Liability AAL Funded as a % of Valuation Assets (AAL) (UAAL) Ratio Covered Covered Date (A) (B) (B-A) (A/B) Payroll Payroll 12/30/2004 $ 69,677,870 $ 92,602,174 $ 22,924, % $ 18,588, % 12/30/ ,555,512 98,161,300 24,605, % 18,925, % 12/30/ ,531, ,019,360 24,487, % 18,967, % 12/30/ ,685, ,343,302 24,657, % 19,277, % 12/30/ ,758, ,485,126 28,726, % 19,272, % 12/30/ ,170, ,667,634 30,496, % 19,628, % 12/30/ ,247, ,967,784 33,720, % 16,067, % 12/30/ ,028, ,554,938 39,526, % 16,024, % 12/30/ ,424, ,080,017 39,655, % 16,257, % 12/30/ ,954, ,362,120 40,407, % 16,371, % Schedule of Employer Contributions Annual Year Ended Required Percentage June 30 Contributions Contributed 2005 $ 2,503, % ,865, % ,822, % ,156, % ,927, % ,662, % ,813, % ,337, % ,531, % ,767, % 104
113 Required Supplementary Information Other Postemployment Benefits Schedule of Funding Progress Actuarial Actuarial Accrued Unfunded UAAL Actuarial Value of Liability AAL Funded as a % of Valuation Assets (AAL) (UAAL) Ratio Covered Covered Date (A) (B) (B-A) (A/B) Payroll Payroll 6/30/2007 $ 75,887 $ 53,576,166 $ 53,500, % $ 31,097, % 6/30/2009 1,491,954 53,965,475 52,473, % 32,793, % 6/30/2011 3,094,002 51,185,806 48,091, % 30,158, % 6/30/2013 4,078,070 41,620,241 37,542, % 28,591, % Schedule of Employer Contributions Annual Year Ended Required Actual Percentage June 30 Contribution Contribution Contributed 2011 $ 3,610,915 $ 1,661, % ,610,915 1,703, % ,236,660 1,692, % ,386,371 1,754, % 105
114 This page intentionally left blank. 106
115 COMBINING AND INDIVIDUAL FUND FINANCIAL STATEMENTS 107
116 Combining Balance Sheet Nonmajor Governmental Funds June 30, 2014 Special Debt Capital Revenue Service Projects Permanent Totals Assets Pooled cash and investments $ 2,462,394 $ 58,443 $ 2,230,237 $ 939,908 $ 5,690,982 Receivables: Interest 13, ,001 23,081 Accounts 1,088, ,530 9,674-1,223,312 Special assessments Grants 205, ,975 Inventories 108, ,502 Prepaid items 28, ,241 Total assets $ 3,906,256 $ 184,352 $ 2,239,955 $ 949,909 $ 7,280,472 Liabilities Accounts payable $ 384,013 $ 8,086 $ 574,430 $ - $ 966,529 Accrued payroll Retentions, deposits and other liabilities 235, ,364 Interfund payable 175, , ,388 Unearned revenue 897,986-2, ,195 Total liabilities 1,693, , ,639-2,395,476 Deferred inflows of resources Unavailable revenue - Special assessments Fund balances Nonspendable 136, ,909 1,016,652 Restricted 752, , ,880 Committed 1,454,799 58, ,739-2,436,895 Assigned , ,577 Unassigned (deficit) (131,387) (131,387) Total fund balances 2,213,035 58,357 1,663, ,909 4,884,617 Total liabilities, deferred inflows of resources and fund balances $ 3,906,256 $ 184,352 $ 2,239,955 $ 949,909 $ 7,280,
117 Combining Statement of Revenues, Expenditures and Changes in Fund Balances Nonmajor Governmental Funds For the Year Ended June 30, 2014 Special Debt Capital Revenue Service Projects Permanent Totals Revenues Property tax $ - $ - $ 1,574,992 $ - $ 1,574,992 Intergovernmental 7,313, ,712 15,224-7,695,029 Charges for services 2,538, ,538,976 Investment earnings (loss) 10,515 1,384 2,381 21,030 35,310 Contributions 24, , ,742 Other 73, ,074 59, ,600 Total revenues 9,960, ,170 1,771,853 21,030 12,747,649 Expenditures Current expenditures: General government 387, ,548-1,193,236 Public safety 284, ,036 Highway and streets 5,961,986-3,299,987-9,261,973 Parks and recreation 2,076, ,076,524 Community development 338,153 22, ,984 Inspections 438, ,325 Debt service: Principal retirement 455,000 1,505, ,960,721 Interest 121,231 1,062, ,183,898 Total expenditures 10,062,943 2,591,219 4,105,535-16,759,697 Revenues over (under) expenditures (102,347) (1,597,049) (2,333,682) 21,030 (4,012,048) Other financing sources (uses) Transfers in 1,999,356 1,599,726 1,784,435-5,383,517 Transfers out (1,665,698) - (114,274) (15,000) (1,794,972) Total other financing sources (uses) 333,658 1,599,726 1,670,161 (15,000) 3,588,545 Net change in fund balances 231,311 2,677 (663,521) 6,030 (423,503) Fund balances, beginning of year 1,981,724 55,680 2,326, ,879 5,308,120 Fund balances, end of year $ 2,213,035 $ 58,357 $ 1,663,316 $ 949,909 $ 4,884,
118 Combining Balance Sheet Nonmajor Special Revenue Funds June 30, 2014 Major Street and Trunkline Local Special Maintenance Street Grants Assets Pooled cash and investments $ - $ 449,354 $ 154,662 Receivables: Interest - 11,003 - Accounts 850, ,799 - Grants ,851 Inventories Prepaid items Total assets $ 850,017 $ 629,156 $ 293,513 Liabilities Accounts payable $ 25,837 $ 5,100 $ 59,025 Retentions, deposits and other liabilities Interfund payable 172, Unearned revenue 3,302-52,607 Total liabilities 201,155 5, ,632 Fund balances Nonspendable Restricted Committed 648, , ,881 Unassigned (deficit) Total fund balances (deficits) 648, , ,881 Total liabilities and fund balances $ 850,017 $ 629,156 $ 293,513 continued 110
119 Combining Balance Sheet Nonmajor Special Revenue Funds June 30, 2014 Michigan HOME Justice Narcotics Program Training Forfeiture Assets Pooled cash and investments $ - $ 10,487 $ 325,040 Receivables: Interest - - 2,033 Accounts Grants 67, Inventories Prepaid items - - 2,000 Total assets $ 67,124 $ 10,487 $ 329,073 Liabilities Accounts payable $ 63,280 $ 422 $ 2,148 Retentions, deposits and other liabilities ,364 Interfund payable 3, Unearned revenue Total liabilities 67, ,512 Fund balances Nonspendable - - 2,000 Restricted 2 10,065 89,561 Committed Unassigned (deficit) Total fund balances (deficits) 2 10,065 91,561 Total liabilities and fund balances $ 67,124 $ 10,487 $ 329,073 continued 111
120 Combining Balance Sheet Nonmajor Special Revenue Funds June 30, 2014 Public Safety Kellogg Binder Park Communications Arena Golf Course Assets Pooled cash and investments $ 455,532 $ 406,376 $ 32,832 Receivables: Interest Accounts - 57,625 - Grants Inventories - 32,368 76,134 Prepaid items - 24,524 - Total assets $ 455,532 $ 520,893 $ 108,966 Liabilities Accounts payable $ - $ 211,118 $ 15,256 Retentions, deposits and other liabilities Interfund payable Unearned revenue 451, ,270 6,700 Total liabilities 451, ,388 21,956 Fund balances Nonspendable - 56,892 76,134 Restricted 4,425-10,876 Committed Unassigned (deficit) - (131,387) - Total fund balances (deficits) 4,425 (74,495) 87,010 Total liabilities and fund balances $ 455,532 $ 520,893 $ 108,966 continued 112
121 Combining Balance Sheet Nonmajor Special Revenue Funds June 30, 2014 Building Inspection Fund Total Assets Pooled cash and investments $ 628,111 $ 2,462,394 Receivables: Interest - 13,036 Accounts 11,667 1,088,108 Grants - 205,975 Inventories - 108,502 Prepaid items 1,717 28,241 Total assets $ 641,495 $ 3,906,256 Liabilities Accounts payable 1,827 $ 384,013 Retentions, deposits and other liabilities - 235,364 Interfund payable - 175,858 Unearned revenue - 897,986 Total liabilities 1,827 1,693,221 Fund balances Nonspendable 1, ,743 Restricted 637, ,880 Committed - 1,454,799 Unassigned (deficit) - (131,387) Total fund balances (deficits) 639,668 2,213,035 Total liabilities and fund balances $ 641,495 $ 3,906,256 concluded. 113
122 Combining Statement of Revenues, Expenditures and Changes in Fund Balance Nonmajor Special Revenue Funds For the Year Ended June 30, 2014 Major Street and Trunkline Local Special Maintenance Street Grants Revenues Intergovernmental $ 4,567,218 $ 1,175,915 $ 329,630 Charges for services Investment earnings (loss) 957 (12,327) 785 Contributions and donations ,742 Other 50,389 2,037 - Total revenues 4,618,564 1,165, ,157 Expenditures Current expenditures: General government ,631 Public safety ,489 Highways and streets 3,145,045 2,816,941 - Parks and recreation Community development Inspections Debt service: Principal Interest Total expenditures 3,145,045 2,816, ,120 Revenues over (under) expenditures 1,473,519 (1,651,316) (15,963) Other financing sources (uses) Transfers in 217,221 1,652, ,635 Transfers out (1,664,933) - - Total other financing sources (uses) (1,447,712) 1,652, ,635 Net change in fund balances 25,807 1,184 90,672 Fund balances (deficit), beginning of year 623, ,872 91,209 Fund balances (deficit), end of year $ 648,862 $ 624,056 $ 181,881 continued 114
123 Combining Statement of Revenues, Expenditures and Changes in Fund Balance Nonmajor Special Revenue Funds For the Year Ended June 30, 2014 Michigan HOME Justice Narcotics Program Training Forfeiture Revenues Intergovernmental $ 338,920 $ 20,011 $ 126,632 Charges for services Investment earnings (loss) - - 7,834 Contributions and donations Other ,648 Total revenues 338,920 20, ,114 Expenditures Current expenditures: General government - 47, ,993 Public safety Highways and streets Parks and recreation Community development 338, Inspections Debt service: Principal Interest Total expenditures 338,153 47, ,993 Revenues over (under) expenditures 767 (27,053) (90,879) Other financing sources (uses) Transfers in Transfers out (765) - - Total other financing sources (uses) (765) - - Net change in fund balances 2 (27,053) (90,879) Fund balances (deficit), beginning of year - 37, ,440 Fund balances (deficit), end of year $ 2 $ 10,065 $ 91,561 continued 115
124 Combining Statement of Revenues, Expenditures and Changes in Fund Balance Nonmajor Special Revenue Funds For the Year Ended June 30, 2014 Public Safety Kellogg Binder Park Communications Arena Golf Course Revenues Intergovernmental $ 454,767 $ 300,000 $ - Charges for services - 868,825 1,066,889 Investment earnings (loss) Contributions and donations Other Total revenues 454,767 1,168,825 1,066,889 Expenditures Current expenditures: General government Public safety 7, Highways and streets Parks and recreation - 1,147, ,983 Community development Inspections Debt service: Principal 415,000-40,000 Interest 39,767-81,464 Total expenditures 462,314 1,147,541 1,050,447 Revenues over (under) expenditures (7,547) 21,284 16,442 Other financing sources (uses) Transfers in - 15,000 8,000 Transfers out Total other financing sources (uses) - 15,000 8,000 Net change in fund balances (7,547) 36,284 24,442 Fund balances (deficit), beginning of year 11,972 (110,779) 62,568 Fund balances (deficit), end of year $ 4,425 $ (74,495) $ 87,010 continued 116
125 Combining Statement of Revenues, Expenditures and Changes in Fund Balance Nonmajor Special Revenue Funds For the Year Ended June 30, 2014 Building Inspection Fund Total Revenues Intergovernmental $ - $ 7,313,093 Charges for services 603,262 2,538,976 Investment income (loss) 13,266 10,515 Contributions and donations - 24,742 Other ,270 Total revenues 616,724 9,960,596 Expenditures Current expenditures: General government - 387,688 Public safety - 284,036 Highways and streets - 5,961,986 Parks and recreation - 2,076,524 Community development - 338,153 Inspections 438, ,325 Debt service: Principal - 455,000 Interest - 121,231 Total expenditures 438,325 10,062,943 Revenues over (under) expenditures 178,399 (102,347) Other financing sources (uses) Transfers in - 1,999,356 Transfers out - (1,665,698) Total other financing sources (uses) - 333,658 Net change in fund balances 178, ,311 Fund balances, beginning of year 461,269 1,981,724 Fund balances (deficit), end of year $ 639,668 $ 2,213,035 concluded. 117
126 Schedule of Revenues, Expenditures and Changes in Fund Balance Final Budget and Actual - Nonmajor Special Revenue Funds For the Year Ended June 30, 2014 Major Street and Trunkline Maintenance Fund Actual Final Over (Under) Budget Actual Final Budget Revenues Intergovernmental revenue $ 4,837,180 $ 4,567,218 $ (269,962) Charges for services Investment earnings (loss) Contributions and donations Other 42,000 50,389 8,389 Total revenues 4,879,180 4,618,564 (260,616) Expenditures Current expenditures: General government Public safety Highways and streets 3,469,382 3,145,045 (324,337) Parks and recreation Community development Inspections Debt service: Principal Interest Total expenditures 3,469,382 3,145,045 (324,337) Revenues over (under) expenditures 1,409,798 1,473,519 63,721 Other financing sources (uses) Transfers in 217, ,221 - Transfers out (1,664,933) (1,664,933) - Total other financing sources (uses) (1,447,712) (1,447,712) - Net change in fund balances (37,914) 25,807 63,721 Fund balances, beginning of year 623, ,055 - Fund balances (deficits), end of year $ 585,141 $ 648,862 $ 63,721 continued 118
127 Schedule of Revenues, Expenditures and Changes in Fund Balance Final Budget and Actual - Nonmajor Special Revenue Funds For the Year Ended June 30, 2014 Local Street Fund Actual Final Over (Under) Budget Actual Final Budget Revenues Intergovernmental revenue $ 984,971 $ 1,175,915 $ 190,944 Charges for services Investment earnings (loss) - (12,327) (12,327) Contributions and donations Other 500 2,037 1,537 Total revenues 985,471 1,165, ,154 Expenditures Current expenditures: General government Public safety Highways and streets 3,231,045 2,816,941 (414,104) Parks and recreation Community development Inspections Debt service: Principal Interest Total expenditures 3,231,045 2,816,941 (414,104) Revenues over (under) expenditures (2,245,574) (1,651,316) 594,258 Other financing sources (uses) Transfers in 1,892,500 1,652,500 (240,000) Transfers out Total other financing sources (uses) 1,892,500 1,652,500 (240,000) Net change in fund balances (353,074) 1, ,258 Fund balances, beginning of year 622, ,872 - Fund balances (deficits), end of year $ 269,798 $ 624,056 $ 354,258 continued 119
128 Schedule of Revenues, Expenditures and Changes in Fund Balance Final Budget and Actual - Nonmajor Special Revenue Funds For the Year Ended June 30, 2014 Special Grants Fund Actual Final Over (Under) Budget Actual Final Budget Revenues Intergovernmental revenue $ 1,941,387 $ 329,630 $ (1,611,757) Charges for services Investment earnings (loss) Contributions and donations 41,426 24,742 (16,684) Other (912) Total revenues 1,984, ,157 (1,629,353) Expenditures Current expenditures: General government 1,328,209 94,631 (1,233,578) Public safety 939, ,489 (663,227) Highways and streets Parks and recreation Community development Inspections Debt service: Principal Interest Total expenditures 2,267, ,120 (1,896,805) Revenues over (under) expenditures (283,415) (15,963) 267,452 Other financing sources (uses) Transfers in 123, ,635 (16,837) Transfers out Total other financing sources (uses) 123, ,635 (16,837) Net change in fund balances (159,943) 90, ,615 Fund balances, beginning of year 91,209 91,209 - Fund balances (deficits), end of year $ (68,734) $ 181,881 $ 250,615 continued 120
129 Schedule of Revenues, Expenditures and Changes in Fund Balance Final Budget and Actual - Nonmajor Special Revenue Funds For the Year Ended June 30, 2014 HOME Program Fund Actual Final Over (Under) Budget Actual Final Budget Revenues Intergovernmental revenue $ 469,606 $ 338,920 $ (130,686) Charges for services Investment earnings (loss) Contributions and donations Other Total revenues 469, ,920 (130,686) Expenditures Current expenditures: General government Public safety Highways and streets Parks and recreation Community development 468, ,153 (130,688) Inspections Debt service: Principal Interest Total expenditures 468, ,153 (130,688) Revenues over (under) expenditures Other financing sources (uses) Transfers in Transfers out (765) (765) - Total other financing sources (uses) (765) (765) - Net change in fund balances Fund balances, beginning of year Fund balances (deficits), end of year $ - $ 2 $ 2 continued 121
130 Schedule of Revenues, Expenditures and Changes in Fund Balance Final Budget and Actual - Nonmajor Special Revenue Funds For the Year Ended June 30, 2014 Michigan Justice Training Fund Actual Final Over (Under) Budget Actual Final Budget Revenues Intergovernmental revenue $ 20,000 $ 20,011 $ 11 Charges for services Investment earnings (loss) Contributions and donations Other Total revenues 20,000 20, Expenditures Current expenditures: General government 48,600 47,064 (1,536) Public safety Highways and streets Parks and recreation Community development Inspections Debt service: Principal Interest Total expenditures 48,600 47,064 (1,536) Revenues over (under) expenditures (28,600) (27,053) 1,547 Other financing sources (uses) Transfers in Transfers out Total other financing sources (uses) Net change in fund balances (28,600) (27,053) 1,547 Fund balances, beginning of year 37,118 37,118 - Fund balances (deficits), end of year $ 8,518 $ 10,065 $ 1,547 continued 122
131 Schedule of Revenues, Expenditures and Changes in Fund Balance Final Budget and Actual - Nonmajor Special Revenue Funds For the Year Ended June 30, 2014 Narcotics Forfeiture Fund Actual Final Over (Under) Budget Actual Final Budget Revenues Intergovernmental revenue $ 150,000 $ 126,632 $ (23,368) Charges for services Investment earnings (loss) 6,000 7,834 1,834 Contributions and donations Other - 20,648 20,648 Total revenues 156, ,114 (886) Expenditures Current expenditures: General government 247, ,993 (1,065) Public safety Highways and streets Parks and recreation Community development Inspections Debt service: Principal Interest Total expenditures 247, ,993 (1,065) Revenues over (under) expenditures (91,058) (90,879) 179 Other financing sources (uses) Transfers in Transfers out Total other financing sources (uses) Net change in fund balances (91,058) (90,879) 179 Fund balances, beginning of year 182, ,440 - Fund balances (deficits), end of year $ 91,382 $ 91,561 $ 179 continued 123
132 Schedule of Revenues, Expenditures and Changes in Fund Balance Final Budget and Actual - Nonmajor Special Revenue Funds For the Year Ended June 30, 2014 Public Safety Communications Actual Final Over (Under) Budget Actual Final Budget Revenues Intergovernmental revenue $ 467,214 $ 454,767 $ (12,447) Charges for services Investment earnings (loss) Contributions and donations Other Total revenues 467, ,767 (12,447) Expenditures Current expenditures: General government Public safety 20,100 7,547 (12,553) Highways and streets Parks and recreation Community development Inspections Debt service: Principal 415, ,000 - Interest 39,767 39,767 - Total expenditures 474, ,314 (12,553) Revenues over (under) expenditures (7,653) (7,547) 106 Other financing sources (uses) Transfers in Transfers out Total other financing sources (uses) Net change in fund balances (7,653) (7,547) 106 Fund balances, beginning of year 11,972 11,972 - Fund balances (deficits), end of year $ 4,319 $ 4,425 $ 106 continued 124
133 Schedule of Revenues, Expenditures and Changes in Fund Balance Final Budget and Actual - Nonmajor Special Revenue Funds For the Year Ended June 30, 2014 Kellogg Arena Fund Actual Final Over (Under) Budget Actual Final Budget Revenues Intergovernmental revenue $ 300,000 $ 300,000 $ - Charges for services 1,136, ,825 (267,373) Investment earnings (loss) Contributions and donations Other Total revenues 1,436,198 1,168,825 (267,373) Expenditures Current expenditures: General government Public safety Highways and streets Parks and recreation 1,436,198 1,147,541 (288,657) Community development Inspections Debt service: Principal Interest Total expenditures 1,436,198 1,147,541 (288,657) Revenues over (under) expenditures - 21,284 21,284 Other financing sources (uses) Transfers in - 15,000 15,000 Transfers out Total other financing sources (uses) - 15,000 15,000 Net change in fund balances - 36,284 36,284 Fund balances, beginning of year (110,779) (110,779) - Fund balances (deficits), end of year $ (110,779) $ (74,495) $ 36,284 continued 125
134 Schedule of Revenues, Expenditures and Changes in Fund Balance Final Budget and Actual - Nonmajor Special Revenue Funds For the Year Ended June 30, 2014 Binder Park Golf Course Actual Final Over (Under) Budget Actual Final Budget Revenues Intergovernmental revenue $ - $ - $ - Charges for services 1,106,783 1,066,889 (39,894) Investment earnings (loss) Contributions and donations Other Total revenues 1,106,783 1,066,889 (39,894) Expenditures Current expenditures: General government Public safety Highways and streets Parks and recreation 961, ,983 (32,898) Community development Inspections Debt service: Principal 40,000 40,000 - Interest 81,464 81,464 - Total expenditures 1,083,345 1,050,447 (32,898) Revenues over (under) expenditures 23,438 16,442 (6,996) Other financing sources (uses) Transfers in - 8,000 8,000 Transfers out Total other financing sources (uses) - 8,000 8,000 Net change in fund balances 23,438 24,442 1,004 Fund balances, beginning of year 62,568 62,568 - Fund balances (deficits), end of year $ 86,006 $ 87,010 $ 1,004 continued 126
135 Schedule of Revenues, Expenditures and Changes in Fund Balance Final Budget and Actual - Nonmajor Special Revenue Funds For the Year Ended June 30, 2014 Building Inspection Fund Actual Final Over (Under) Budget Actual Final Budget Revenues Intergovernmental revenue $ - $ - $ - Charges for services 478, , ,912 Investment earnings (loss) - 13,266 13,266 Contributions and donations Other (4) Total revenues 478, , ,174 Expenditures Current expenditures: General government Public safety Highways and streets Parks and recreation Community development Inspections 528, ,325 (89,846) Debt service: Principal Interest Total expenditures 528, ,325 (89,846) Revenues over (under) expenditures (49,621) 178, ,020 Other financing sources (uses) Transfers in Transfers out Total other financing sources (uses) Net change in fund balances (49,621) 178, ,020 Fund balances, beginning of year 461, ,269 - Fund balances, end of year $ 411,648 $ 639,668 $ 228,020 concluded. 127
136 Combining Balance Sheet Nonmajor Debt Service Funds June 30, 2014 Michigan Building Special Transportation DPW Authority Assessment Fund Bonds Building Bonds Debt Service Debt Service Assets Pooled cash and investments $ 3,064 $ 5,311 $ 49,142 $ 926 Receivables: Accounts Special assessments Total assets $ 3,064 $ 5,311 $ 49,521 $ 926 Liabilities Accounts payable $ - $ - $ 86 $ - Interfund payable Total liabilities Deferred inflows of resources Unavailable revenue - Special assessments Fund balances Committed 3,064 5,311 49, Total liabilities, deferred inflows of resources and fund balances $ 3,064 $ 5,311 $ 49,521 $ 926 continued 128
137 Combining Balance Sheet Nonmajor Debt Service Funds June 30, 2014 Capital Energy Improvement Savings Bonds Total Assets Pooled cash and investments $ - $ - $ 58,443 Receivables: Accounts - 125, ,530 Special assessments Total assets $ - $ 125,530 $ 184,352 Liabilities Accounts payable $ - $ 8,000 $ 8,086 Interfund payable - 117, ,530 Total liabilities - 125, ,616 Deferred inflows of resources Unavailable revenue - Special assessments Fund balances Committed ,357 Total liabilities, deferred inflows of resources and fund balances $ - $ 125,530 $ 184,352 concluded. 129
138 Combining Statement of Revenues, Expenditures and Changes in Fund Balance Nonmajor Debt Service Funds For the Year Ended June 30, 2014 Michigan Building Special Transportation DPW Authority Assessment Fund Bonds Building Bonds Debt Service Debt Service Revenues Intergovernmental $ - $ - $ - $ - Investment earnings (loss) - - 1,384 - Local sources - 601,950 24,124 - Total revenues - 601,950 25,508 - Expenditures Community development ,831 - Debt service: Principal retirement 290, , Interest 260, , Total expenditures 550, ,950 22,831 - Revenues over (under) expenditures (550,790) - 2,677 - Other financing sources Transfers in 550, Net change in fund balances - - 2,677 - Fund balances, beginning of year 3,064 5,311 46, Fund balances, end of year $ 3,064 $ 5,311 $ 49,056 $ 926 continued 130
139 Combining Statement of Revenues, Expenditures and Changes in Fund Balance Nonmajor Debt Service Funds For the Year Ended June 30, 2014 Capital Energy Improvement Savings Bonds Total Revenues Intergovernmental $ - $ 366,712 $ 366,712 Investment earnings (loss) - - 1,384 Local sources ,074 Total revenues - 366, ,170 Expenditures Community development ,831 Debt service: Principal retirement 250, ,000 1,505,721 Interest 132, ,328 1,062,667 Total expenditures 383,320 1,032,328 2,591,219 Revenues over (under) expenditures (383,320) (665,616) (1,597,049) Other financing sources Transfers in 383, ,616 1,599,726 Net change in fund balances - - 2,677 Fund balances, beginning of year ,680 Fund balances, end of year $ - $ - $ 58,357 concluded. 131
140 Combining Balance Sheet Nonmajor Capital Projects Funds June 30, 2014 Justice General Street Center Capital Projects Construction Improvement Assets Pooled cash and investments $ 1,037,783 $ 8,224 $ 1,096,575 Receivables: Interest Accounts 2,247-7,427 Total assets $ 1,040,030 $ 8,268 $ 1,104,002 Liabilities Accounts payable $ 210,933 $ - $ 362,216 Unearned revenue - - 2,209 Total liabilities 210, ,425 Fund balances Committed 829,097 8,268 - Assigned ,577 Total fund balances 829,097 8, ,577 Total liabilities and fund balances $ 1,040,030 $ 8,268 $ 1,104,002 continued 132
141 Combining Balance Sheet Nonmajor Capital Projects Funds Dispatch Downtown Capital Transformation Improvement Projects Total Assets Pooled cash and investments $ 87,620 $ 35 $ 2,230,237 Receivables: Interest Accounts - - 9,674 Total assets $ 87,620 $ 35 $ 2,239,955 Liabilities Accounts payable $ 1,281 $ - $ 574,430 Unearned revenue - - 2,209 Total liabilities 1, ,639 Fund balances Committed 86, ,739 Assigned ,577 Total fund balances 86, ,663,316 Total liabilities and fund balances $ 87,620 $ 35 $ 2,239,955 concluded. 133
142 Combining Statement of Revenues, Expenditures and Changes in Fund Balance Nonmajor Capital Projects Funds For the Year Ended June 30, 2014 Justice General Street Center Capital Projects Construction Improvement Revenue Property tax $ 1,574,992 $ - $ - Intergovernmental Investment earnings Contributions ,000 Other 25,892-33,364 Total revenue 1,600, ,364 Expenditures General government ,548 Highways and streets 3,284, Total expenditures 3,284, ,548 Revenue over (under) expenditures (1,683,414) 186 (652,184) Other financing sources (uses) Transfers in 1,707,137-76,798 Transfers out (99,274) - (15,000) Total other financing sources (uses) 1,607,863-61,798 Net change in fund balances (75,551) 186 (590,386) Fund balances, beginning of year 904,648 8,082 1,329,963 Fund balances, end of year $ 829,097 $ 8,268 $ 739,577 continued 134
143 Combining Statement of Revenues, Expenditures and Changes in Fund Balance Nonmajor Capital Projects Funds For the Year Ended June 30, 2014 Dispatch Downtown Capital Transformation Improvement Projects Total Revenue Property tax $ - $ - $ 1,574,992 Intergovernmental - 15,224 15,224 Investment earnings 2,195-2,381 Contributions ,000 Other ,256 Total revenue 2,195 15,224 1,771,853 Expenditures General government ,548 Highways and streets - 15,689 3,299,987 Total expenditures - 15,689 4,105,535 Revenue over (under) expenditures 2,195 (465) (2,333,682) Other financing sources (uses) Transfers in ,784,435 Transfers out - - (114,274) Total other financing sources (uses) ,670,161 Net change in fund balances 2, (663,521) Fund balances, beginning of year 84,144-2,326,837 Fund balances, end of year $ 86,339 $ 35 $ 1,663,316 concluded. 135
144 Combining Balance Sheet Nonmajor Permanent Funds June 30, 2014 Youth Kellogg Center Arena Endowment Endowment Total Assets Pooled cash and investments $ 256,364 $ 683,544 $ 939,908 Interest receivable 5,350 4,651 10,001 Total assets $ 261,714 $ 688,195 $ 949,909 Fund balances Nonspendable 256, , ,909 Restricted 5,338 64,662 70,000 Total fund balances 261, , ,909 Total liabilities and fund balances $ 261,714 $ 688,195 $ 949,
145 Combining Statement of Revenues, Expenditures and Changes in Fund Balance Nonmajor Permanent Funds For the Year Ended June 30, 2014 Youth Kellogg Center Arena Endowment Endowment Total Revenues Investment earnings $ 5,338 $ 15,692 $ 21,030 Other financing uses Transfers out - (15,000) (15,000) Net change in fund balances 5, ,030 Fund balances, beginning of year 256, , ,879 Fund balances, end of year $ 261,714 $ 688,195 $ 949,
146 Combining Statement of Net Position Nonmajor Enterprise Funds June 30, 2014 Automobile Parking Solid Waste System FAA Collection Total Assets Current assets: Pooled cash and investments $ 581,890 $ 910,575 $ - $ 1,492,465 Receivables: Interest Accounts - 68, , ,970 Total current assets 581, , ,724 2,105,840 Noncurrent assets - Capital assets, net 4,590,200 1,219,773-5,809,973 Total assets 5,172,090 2,198, ,724 7,915,813 Liabilities Current liabilities: Accounts payable 81,226 7, , ,374 Compensated absences payable - - 7,660 7,660 Retentions, deposits and other liabilities ,812 67,812 Interfund payable ,148 76,148 Unearned revenue - 33,700-33,700 Total current liabilities 81,226 41, , ,694 Noncurrent liabilities - Advance from other government - 397, ,540 Total liabilities 81, , , ,234 Net position Net investment in capital assets 4,590,200 1,219,773-5,809,973 Unrestricted 500, , ,917 1,209,606 Total net position $ 5,090,864 $ 1,759,798 $ 168,917 $ 7,019,
147 Combining Statement of Revenues, Expenses and Changes in Fund Net Position Nonmajor Enterprise Funds For the Year Ended June 30, 2014 Automobile Parking Solid Waste System FAA Collection Total Operating revenues Charges for services $ 1,330,971 $ 404,400 $ 3,020,259 $ 4,755,630 Other ,910 61,910 Total operating revenues 1,330, ,400 3,082,169 4,817,540 Operating expenses Personal services - 12, , ,701 Materials and supplies - 1,733 31,341 33,074 Contractual and other 1,200, ,623 2,753,185 4,117,749 Depreciation 348, , ,819 Total operating expenses 1,549, ,595 3,000,293 4,852,343 Operating income (loss) (218,484) 101,805 81,876 (34,803) Nonoperating revenues Investment income 11, ,660 Income (loss) before transfers (206,824) 101,805 81,876 (23,143) Transfers in 62, ,856 Transfers out (43,663) (826) (13,920) (58,409) Change in net position (187,631) 100,979 67,956 (18,696) Net position, beginning of year 5,278,495 1,658, ,961 7,038,275 Net position, end of year $ 5,090,864 $ 1,759,798 $ 168,917 $ 7,019,
148 Combining Statement of Cash Flows Nonmajor Enterprise Funds For the Year Ended June 30, 2014 Automobile Parking Solid Waste System FAA Collection Total Cash flows from operating activities Receipts from customers and users $ 1,330,985 $ 404,400 $ 3,075,372 $ 4,810,757 Payments to suppliers and contractors (1,148,638) (165,186) (2,736,306) (4,050,130) Payments to employees - (12,934) (288,581) (301,515) Payments for interfund services - - (36,160) (36,160) Net cash provided by operating activities 182, ,280 14, ,952 Cash flows from noncapital financing activities Transfers in 62, ,856 Transfers out (43,663) (826) (13,920) (58,409) Net cash provided by (used in) noncapital financing activities 19,193 (826) (13,920) 4,447 Cash flows from investing activities Investment gain (loss) 11,660 - (405) 11,255 Net increase in pooled cash and investments 213, , ,654 Pooled cash and investments, beginning of year 368, ,121-1,053,811 Pooled cash and investments, end of year $ 581,890 $ 910,575 $ - $ 1,492,465 continued 140
149 Combining Statement of Cash Flows Nonmajor Enterprise Funds For the Year Ended June 30, 2014 Automobile Parking Solid Waste System FAA Collection Total Cash flows from operating activities Operating income (loss) $ (218,484) $ 101,805 $ 81,876 $ (34,803) Adjustments to reconcile operating income (loss) to net cash provided by operating activities: Depreciation 348, , ,819 Changes in assets and liabilities: Interest receivable Accounts receivable - - (7,164) (7,164) Accounts payable 52, ,771 Retentions, deposits and other liabilities ,762 11,762 Compensated absences - - 2,622 2,622 Interfund payable - - (75,436) (75,436) Net cash provided by operating activities $ 182,347 $ 226,280 $ 14,325 $ 422,952 concluded. 141
150 Combining Statement of Net Position Internal Service Funds June 30, 2014 Equipment Self- Information Center Insurance Services Reproduction Total Assets Current assets: Pooled cash and investments $ 1,797,184 $ 9,618,063 $ 257,220 $ 110,862 $ 11,783,329 Interest - 101, ,671 Accounts 2, ,229 18,152 4, ,340 Inventories 594, ,680 Prepaid items - 142, ,860 Total current assets 2,393,931 10,444, , ,754 13,229,880 Noncurrent assets: Capital assets, net 1,928,475 46, ,723-2,952,988 Total assets 4,322,406 10,491,613 1,253, ,754 16,182,868 Liabilities Current liabilities: Accounts payable 238,546 1,663,911 38,006 1,107 1,941,570 Compensated absences payable 46,784 4,945 74,626 9, ,120 Claims payable, current portion - 2,324, ,324,796 Unearned revenue , ,280 Total current liabilities 285,680 4,063, ,632 10,872 4,472,766 Noncurrent liabilities: Claims payable - 1,709, ,709,797 Total liabilities 285,680 5,773, ,632 10,872 6,182,563 Net position Net investment in capital assets 1,928,475 46, ,723-2,952,988 Unrestricted 2,108,251 4,671, , ,882 7,047,317 Total net position $ 4,036,726 $ 4,718,234 $ 1,140,463 $ 104,882 $ 10,000,
151 Combining Statement of Revenues, Expenses and Changes in Fund Net Position Internal Service Funds For the Year Ended June 30, 2014 Equipment Self- Information Center Insurance Services Reproduction Total Operating revenues Charges for services $ 5,904,340 $ 11,688,236 $ 1,225,608 $ 237,183 $ 19,055,367 Other 237, , ,857 Total operating revenues 6,142,279 11,950,060 1,225, ,183 19,555,224 Operating expenses Personal services 1,088,520 1,659,868 1,071, ,223 4,004,702 Materials and supplies 2,385,946 59,578 63,433 81,810 2,590,767 Contractual and other 1,445,707 11,433, ,821 31,393 13,609,332 Depreciation 605, ,598 4, ,905 Total operating expenses 5,525,279 13,152,857 2,007, ,627 20,988,706 Operating income (loss) 617,000 (1,202,797) (782,241) (65,444) (1,433,482) Nonoperating revenues (expenses) Investment gain - 207, ,816 Gain on disposal of assets 33, ,504 Interest expense - - (1,574) - (1,574) Total nonoperating revenues (expenses) 33, ,816 (1,574) - 239,746 Income (loss) before transfers 650,504 (994,981) (783,815) (65,444) (1,193,736) Transfers in 190, ,126 54, ,760 Transfers out (599,106) (440,874) - (459) (1,040,439) Change in net position 241,398 (1,435,855) (338,689) (11,269) (1,544,415) Net position, beginning of year 3,795,328 6,154,089 1,479, ,151 11,544,720 Net position, end of year $ 4,036,726 $ 4,718,234 $ 1,140,463 $ 104,882 $ 10,000,
152 Combining Statement of Cash Flows Internal Service Funds For the Year Ended June 30, 2014 Equipment Self- Information Center Insurance Services Reproduction Total Cash flows from operating activities Receipts from interfund services $ 6,142,279 $ 11,950,060 $ 1,225,702 $ 237,183 $ 19,555,224 Payments to suppliers/claimants (3,754,770) (9,183,103) (753,025) (111,970) (13,802,868) Payments to employees (1,109,738) (1,661,444) (1,059,095) (183,359) (4,013,636) Net cash provided by (used in) operating activities 1,277,771 1,105,513 (586,418) (58,146) 1,738,720 Cash flows from noncapital financing activities Transfers in 190, ,126 54, ,760 Transfers out (599,106) (440,874) - (459) (1,040,439) Net cash provided by (used in) noncapital financing activities (409,106) (440,874) 445,126 54,175 (350,679) Cash flows from capital and related financing activities Principal and interest paid on capital lease - - (176,017) - (176,017) Purchase of capital assets (580,334) (51,989) - - (632,323) Net cash used in capital and related financing activities (580,334) (51,989) (176,017) - (808,340) Cash flows from investing activities Investment income - 207, ,816 Net change in pooled cash and investments 288, ,466 (317,309) (3,971) 787,517 Pooled cash and investments, beginning of year 1,508,853 8,797, , ,833 10,995,812 Pooled cash and investments, end of year $ 1,797,184 $ 9,618,063 $ 257,220 $ 110,862 $ 11,783,329 continued 144
153 Combining Statement of Cash Flows Internal Service Funds For the Year Ended June 30, 2014 Equipment Self- Information Center Insurance Services Reproduction Total Cash flows from operating activities Operating income (loss) $ 617,000 $ (1,202,797) $ (782,241) $ (65,444) $ (1,433,482) Adjustments to reconcile operating income (loss) to net cash from operating activities: Depreciation 605, ,598 4, ,905 Changes in assets and liabilities: Interest receivable - 1, ,177 Accounts receivable 2,949 51,199 (12,283) 1,016 42,881 Inventories (23,590) (23,590) Prepaid items - (29,194) 5,869 - (23,325) Accounts payable 97,524 1,615,562 15, ,728,946 Accrued compensated absences (21,218) (1,576) 11,996 1,864 (8,934) Claims payable - 669, ,585 Unearned revenue - 1, ,557 Net cash provided by (used in) operating activities $ 1,277,771 1,105,513 (586,418) (58,146) 1,738,720 concluded. ` 145
154 This page intentionally left blank. 146
155 Combining Statement of Fiduciary Net Position Pension and Other Employee Benefits Trust Funds June 30, 2014 Pension Other Employee Benefits Retirement Police and Fire Health Retirement Funding Fire Retiree System Vehicle Health Care Total Assets Cash and cash equivalents $ 5,226,232 $ 61 $ 1,300,553 $ 6,526,846 Investments: U.S. treasuries 9,170, ,170,824 U.S. agencies 16,504, ,504,694 Domestic corporate securities 33,871, ,871,406 Domestic equities 22,972, ,972,818 American depository receipts 13,314, ,314,182 International equities 32,145, ,145,125 Real estate trusts 310, ,303 Mutual funds - 3,460,510-3,460,510 Interest receivable 423,082-4, ,765 Pension contributions receivable 89, ,718 Total assets 134,028,384 3,460,571 1,305, ,794,191 Liabilities Obligation for impaired investment of securities lending collateral 131, ,239 Net position Held in trust for pension and postemployment healthcare benefits $ 133,897,145 $ 3,460,571 $ 1,305,236 $ 138,662,
156 Combining Statement of Changes in Fiduciary Net Position Pension and Other Employee Benefits Trust Funds For the Year Ended June 30, 2014 Pension Other Employee Benefits Retirement Police and Fire Health Retirement Funding Fire Retiree System Vehicle Health Care Total Additions Investment income: From investing activities: Net appreciation in fair value of investments $ 14,984,100 $ - $ - $ 14,984,100 Investment earnings (loss) and dividends 2,727, ,926 26,007 3,170,437 Less investment expenses (453,794) - - (453,794) Net income from investing activities 17,257, ,926 26,007 17,700,743 From securities lending activities: Gross earnings 1, ,760 Borrower rebates 17, ,654 Securities lending fees (5,821) - - (5,821) Impaired investment recovery 25, ,093 Net income from securities lending activities 38, ,686 Total net investment income (loss) 17,296, ,926 26,007 17,739,429 Contributions: Employer 4,316, , ,000 4,967,580 Employees 991, ,720 1,215,512 Total contributions 5,307, , ,720 6,183,092 Total additions 22,604, , ,727 23,922,521 Deductions Pension benefit payments 8,389, ,389,950 Contribution refunds 47, ,356 Medical insurance premiums/benefits 512, , ,416 1,143,088 Administrative expenses 197, ,492 Total deductions 9,147, , ,416 9,777,886 continued 148
157 Combining Statement of Changes in Fiduciary Net Position Pension and Other Employee Benefits Trust Funds For the Year Ended June 30, 2014 Pension Other Employee Benefits Retirement Police and Fire Health Retirement Funding Fire Retiree System Vehicle Health Care Total Net change to net position held in trust for benefits $ 13,456,898 $ 710,426 $ (22,689) $ 14,144,635 Net position held in trust for benefits: Beginning of year 120,440,247 2,750,145 1,327, ,518,317 End of year $ 133,897,145 $ 3,460,571 $ 1,305,236 $ 138,662,952 concluded. 149
158 This page intentionally left blank. 150
159 Combining Statement of Fiduciary Assets and Liabilities Agency Funds June 30, 2014 Delinquent Fire Personal Summer Winter Insurance Property Property Tax Property Tax Escrow Taxes Collection Collection Total Assets Pooled cash and investments $ 134,642 $ 171,853 $ 85 $ 9 $ 306,589 Taxes receivable Delinquent taxes receivable - 635, ,663 Total assets $ 134,642 $ 807,516 $ 728 $ 9 $ 942,895 Liabilities Undistributed receipts $ 134,642 $ 807,516 $ 728 $ 9 $ 942,
160 Combining Statement of Changes in Assets and Liabilities Agency Funds For the Year Ended June 30, 2014 Balance Balance June 30, June 30, 2013 Additions Deletions 2014 Fire Insurance Escrow Assets Pooled cash and investments $ 125,933 $ 70,688 $ 61,979 $ 134,642 Liabilities Undistributed receipts $ 125,933 $ 70,688 $ 61,979 $ 134,642 Delinquent Personal Property Taxes Assets Pooled cash and investments $ 41,916 $ 739,396 $ 609,459 $ 171,853 Delinquent taxes receivable 1,052, , , ,663 Total assets $ 1,094,030 $ 1,043,231 $ 1,329,745 $ 807,516 Liabilities Undistributed receipts $ 1,094,030 $ 1,043,231 $ 1,329,745 $ 807,516 Summer Property Tax Collection Assets Pooled cash and investments $ 43,733 $ 58,490,309 $ 58,533,957 $ 85 Taxes receivable Total assets $ 43,733 $ 58,490,952 $ 58,533,957 $ 728 Liabilities Undistributed receipts $ 43,733 $ 58,490,309 $ 58,533,314 $ 728 Winter Property Tax Collection Assets Pooled cash and investments $ 2,848 $ 18,309,398 $ 18,312,237 $ 9 Liabilities Undistributed receipts $ 2,848 $ 18,309,398 $ 18,312,237 $ 9 continued 152
161 Combining Statement of Changes in Assets and Liabilities Agency Funds For the Year Ended June 30, 2014 Balance Balance June 30, June 30, 2013 Additions Deletions 2014 Total All Agency Funds Assets Pooled cash and investments $ 214,430 $ 77,609,791 $ 77,517,632 $ 306,589 Taxes receivable Delinquent taxes receivable 1,052, , , ,663 Total assets $ 1,266,544 $ 77,914,269 $ 78,237,918 $ 942,895 Liabilities Undistributed receipts $ 1,266,544 $ 77,913,626 $ 78,237,275 $ 942,895 concluded. 153
162 This page intentionally left blank. 154
163 STATISTICAL SECTION 155
164 This page intentionally left blank. 156
165 Statistical Section Table of Contents This part of the City of Battle Creek, Michigan's comprehensive annual financial report presents detailed information as a context for understanding what the information in the financial statements, note disclosures, and required supplementary information says about the government's overall financial health. Financial Trends (Schedules 1-5) Revenue Capacity (Schedules 6-28) Debt Capacity (Schedules 29-32) Page These schedules contain trend information to help the reader understand how the government's financial performance and wellbeing have changed over time. 158 These schedules contain information to help the reader assess the government's most significant local revenue sources: property taxes and water and wastewater usage fees. 170 These schedules present information to help the reader assess the affordability of the government's current levels of outstanding debt and the government's ability to issue additional debt in the future. 214 Demographic and Economic Information (Schedules 33 & 34) These schedules offer demographic and economic indicators to help the reader understand the environment within which the government's financial activities take place. 219 Operating Information (Schedules 35-38) These schedules contain service and infrastructure data to help the reader understand how the information in the government's financial report relates to the services the government provides and the activities it performs. 222 Sources: Unless otherwise noted, the information in these schedules are derived from the comprehensive annual financial reports for the applicable year. 157
166 Schedule 1 Unaudited Net Position by Component Last Ten Fiscal Years (accrual basis of accounting) Governmental activities Net investment in capital assets $ 205,272,983 $ 209,058,967 $ 208,138,951 $ 209,225,026 $ 213,060,080 Restricted 6,909,177 5,837,903 7,861,430 4,929,264 3,287,591 Unrestricted 39,004,878 38,237,634 33,944,289 33,063,496 28,294,180 Total governmental activities $ 251,187,038 $ 253,134,504 $ 249,944,670 $ 247,217,786 $ 244,641,851 Business-type activities Net investment in capital assets $ 101,991,510 $ 98,873,436 $ 97,919,583 $ 96,505,088 $ 96,106,663 Unrestricted 20,923,570 20,617,951 21,418,649 19,641,409 18,335,770 Total business-type activities $ 122,915,080 $ 119,491,387 $ 119,338,232 $ 116,146,497 $ 114,442,433 Primary government Net investment in capital assets $ 307,264,493 $ 307,932,403 $ 306,058,534 $ 305,730,114 $ 309,166,743 Restricted 6,909,177 5,837,903 7,861,430 4,929,264 3,287,591 Unrestricted 59,928,448 58,855,585 55,362,938 52,704,905 46,629,950 Total primary government $ 374,102,118 $ 372,625,891 $ 369,282,902 $ 363,364,283 $ 359,084,284 continued 158
167 Schedule 1 Unaudited Net Position by Component Last Ten Fiscal Years (accrual basis of accounting) Governmental activities Net investment in capital assets $ 207,342,367 $ 209,845,426 $ 216,252,011 $ 216,155,508 $ 213,803,703 Restricted 2,150,046 2,434,818 2,328,940 3,326,396 2,671,582 Unrestricted 29,256,852 21,529,980 21,344,934 16,137,588 13,828,647 Total governmental activities $ 238,749,265 $ 233,810,224 $ 239,925,885 $ 235,619,492 $ 230,303,932 Business-type activities Net investment in capital assets $ 96,648,044 $ 94,517,336 $ 93,175,690 $ 92,885,198 $ 92,099,833 Unrestricted 19,217,106 19,336,256 19,223,068 19,988,459 20,628,055 Total business-type activities $ 115,865,150 $ 113,853,592 $ 112,398,758 $ 112,873,657 $ 112,727,888 Primary government Net investment in capital assets $ 303,990,411 $ 304,362,762 $ 309,427,701 $ 309,040,706 $ 305,903,536 Restricted 2,150,046 2,434,818 2,328,940 3,326,396 2,671,582 Unrestricted 48,473,958 40,866,236 40,568,002 36,126,047 34,456,702 Total primary government $ 354,614,415 $ 347,663,816 $ 352,324,643 $ 348,493,149 $ 343,031,820 Source: City of Battle Creek Finance Department concluded. 159
168 Schedule 2 Unaudited Changes in Net Position Last Ten Fiscal Years (accrual basis of accounting) Expenses Governmental activities: General government $ 8,251,417 $ 10,138,832 $ 12,354,963 $ 13,176,854 $ 11,518,181 Public safety 24,912,304 23,052,841 25,211,331 27,337,709 27,392,970 Public works 2,425,660 1,721,053 1,862,529 1,896,351 2,267,154 Highways and streets 10,253,704 10,648,811 10,947,131 12,521,742 11,445,076 Parks and recreation 10,103,614 7,528,251 6,098,967 5,994,590 7,309,779 Community development 2,871,471 2,602,331 3,033,185 2,629,423 2,446,793 Interest on long-term debt 1,099,030 1,079,398 1,103, ,050 1,063,227 Total governmental activities 59,917,200 56,771,517 60,611,202 64,441,719 63,443,180 Business-type activities: Wastewater 14,103,654 14,598,187 14,492,263 15,371,605 15,196,805 Water 7,225,258 6,897,186 7,222,797 7,439,990 7,189,064 Public transit 3,887,041 3,724,879 3,762,533 3,985,668 4,179,374 Solid waste collection 2,184,244 2,292,562 2,437,238 2,591,517 2,698,282 Airport 1,841,153 1,991,606 2,094,172 2,393,643 2,395,483 Golf course 1,170,632 1,199,704 1,184,758 1,232,043 - Parking 1,309,483 1,021,337 1,151,969 1,147,371 1,179,759 Economic development 218, , , , ,000 Total business-type activities 31,939,493 32,490,151 32,526,600 35,092,105 33,031,767 Total primary government expenses 91,856,693 89,261,668 93,137,802 99,533,824 96,474,947 Program revenues Governmental activities: Charges for services: General government 2,697,742 2,596,709 2,535,769 2,907,276 2,952,331 Public safety 1,842,771 1,927,079 1,926,202 1,835,157 2,005,200 Public works 344, , , , ,610 Highways and streets ,903 5,240 23,998 Parks and recreation 3,277,043 3,428,780 3,159,269 2,320,582 3,464,587 Community development 147,600 80, ,502 45,239 24,320 Interest on long-term debt Operating grants and contributions 10,625,956 12,363,163 11,362,032 12,442,524 10,945,297 Capital grants and contributions 3,271,450 2,371,353 1,427,358 1,651,247 2,224,654 Total governmental activities 22,207,303 22,920,663 20,654,529 21,878,876 22,224,246 continued 160
169 Entity: Schedule 2 Unaudited Changes in Net Position Last Ten Fiscal Years (accrual basis of accounting) Expenses Governmental activities: General government $ 8,669,931 $ 10,303,586 $ 12,250,359 $ 10,372,803 $ 12,208,561 Public safety 31,461,275 29,053,426 27,025,682 26,952,192 27,215,335 Public works 1,839,732 2,803,968 2,396,590 1,891,765 2,199,624 Highways and streets 9,761,195 9,426,798 7,149,971 11,585,808 9,731,567 Parks and recreation 7,104,029 6,665,571 6,280,210 6,323,529 5,759,128 Community development 3,258,213 5,321,021 6,589,947 4,907,271 3,019,449 Interest on long-term debt 746, , , ,018 1,206,989 Total governmental activities 62,840,709 64,405,290 62,519,681 62,778,386 61,340,653 Business-type activities: Wastewater 14,132,718 15,444,292 15,215,733 15,247,288 15,642,028 Water 7,276,720 8,358,607 7,814,304 7,520,760 7,930,788 Public transit 3,968,197 4,498,411 4,705,296 4,924,554 4,814,924 Solid waste collection 2,753,730 2,741,558 2,865,831 2,940,000 3,004,407 Airport 2,552,763 2,634,483 2,662,373 2,511,613 2,485,677 Golf course Parking 1,155,113 1,252,970 1,406,230 1,509,283 1,549,455 Economic development 187, , , , ,400 Total business-type activities 32,026,536 35,285,696 34,794,740 34,802,420 35,557,679 Total primary government expenses 94,867,245 99,690,986 97,314,421 97,580,806 96,898,332 Program revenues Governmental activities: Charges for services: General government 2,447,656 2,739,519 3,270,597 3,363,317 2,824,535 Public safety 1,820,299 1,161,679 1,148, , ,128 Public works 142, ,374 98,263 84, ,493 Highways and streets 6,354 25,511 7,498 4,251 27,929 Parks and recreation 3,194,147 3,516,153 3,735,452 3,635,347 3,250,950 Community development - 54, , , ,924 Interest on long-term debt Operating grants and contributions 11,450,771 15,277,402 21,767,295 12,618,453 10,289,625 Capital grants and contributions Total governmental activities 19,061,941 23,098,078 30,635,274 21,497,008 17,779,584 continued 161
170 Schedule 2 Unaudited Changes in Net Position Last Ten Years (accrual basis of accounting) Business-type activities: Charges for services: Wastewater $ 10,265,249 $ 9,726,868 $ 10,992,780 $ 11,617,431 $ 12,056,109 Water 7,460,662 7,337,571 7,789,671 7,783,011 7,760,563 Public transit 392, , , , ,200 Solid waste collection 2,249,615 2,250,880 2,516,122 2,554,607 2,592,942 Airport 1,070,586 1,083,875 1,124,816 1,165,832 1,287,463 Golf course 1,161,808 1,187,918 1,208,185 1,186,315 - Parking 674, , , , ,725 Economic development 332, , , , ,384 Operating grants and contributions 2,567,262 2,408,957 4,756,705 3,891,109 3,571,310 Capital grants and contributions 4,909,860 2,696, , ,337 1,940,273 Total business-type activities 31,085,097 28,081,498 30,718,022 30,625,684 30,580,969 Total primary government Program revenues 53,292,400 51,002,161 51,372,551 52,504,560 52,805,215 Net (expense)/revenue Government activities (37,709,897) (33,850,854) (39,956,673) (42,562,843) (41,218,934) Business-type activities (854,396) (4,408,653) (1,808,578) (4,466,421) (2,450,798) Total primary government net expense (38,564,293) (38,259,507) (41,765,251) (47,029,264) (43,669,732) General revenues Governmental activities: General revenues: Property taxes 13,579,207 14,580,358 15,322,115 16,485,528 17,033,749 Income taxes 13,942,683 14,450,183 14,226,870 15,505,430 14,240,808 Grants and contributions not restricted to specific programs 6,291,976 6,221,293 6,038,495 6,090,487 5,882,127 Unrestricted investment earnings 1,716,088 1,241,966 2,166,102 2,448,172 1,921,942 Transfers - internal activities (619,138) (695,480) (986,742) (693,655) (585,336) Total governmental activities 34,910,816 35,798,320 36,766,840 39,835,962 38,493,290 Business-type activities: Unrestricted investment earnings 379, , , , ,107 Transfers - internal activities 619, , , , ,336 Total business-type activities 998, ,960 1,655,424 1,274, ,443 Total primary government 35,909,139 36,783,280 38,422,264 41,110,648 39,239,733 Change in net position Government activities (2,799,081) 1,947,466 (3,189,833) (2,726,881) (2,725,644) Business-type activities 143,927 (3,423,693) (153,154) (3,191,735) (1,704,355) Total primary government $ (2,655,154) $ (1,476,227) $ (3,342,987) $ (5,918,616) $ (4,429,999) continued ` 162
171 Entity: Schedule 2 Unaudited Changes in Net Position Last Ten Years (accrual basis of accounting) Business-type activities: Charges for services: Wastewater $ 13,600,518 $ 13,204,301 $ 14,268,729 $ 15,013,143 $ 15,586,240 Water 8,014,650 7,955,198 8,824,757 9,208,283 9,465,371 Public transit 390, , , , ,705 Solid waste collection 2,702,376 2,841,261 2,865,400 2,863,898 3,082,169 Airport 1,228,917 1,189,936 1,358,819 1,364,368 1,365,747 Golf course Parking 600, ,937 1,117,414 1,229,770 1,330,971 Economic development 479, , ,229 37,639 91,571 Operating grants and contributions 3,459,262 6,021,711 4,197,347 5,060,638 3,571,072 Capital grants and contributions 2,319, Total business-type activities 32,795,594 32,630,523 33,218,811 35,193,438 34,918,846 Total primary government Program revenues 51,857,535 55,728,601 63,854,085 56,690,446 52,698,430 Net (expense)/revenue Government activities (43,778,768) (41,307,212) (31,884,407) (41,281,378) (43,561,069) Business-type activities 769,058 (2,655,173) (1,575,929) 391,018 (638,833) Total primary government net expense (43,009,710) (43,962,385) (33,460,336) (40,890,360) (44,199,902) General revenues Governmental activities: General revenues: Property taxes 17,414,875 16,711,960 16,542,171 15,809,783 16,258,935 Income taxes 14,328,097 13,548,759 15,009,421 16,234,540 16,093,707 Grants and contributions not restricted to specific programs 5,235,168 5,599,849 5,296,135 5,271,399 5,336,347 Unrestricted investment earnings 1,816,033 1,070,544 1,176, , ,036 Transfers - internal activities (533,894) (562,941) (23,829) (349,082) (396,516) Total governmental activities 38,260,279 36,368,171 38,000,068 37,337,836 38,245,509 Business-type activities: Unrestricted investment earnings 119,765 80,674 97,266 (63,487) 96,548 Transfers - internal activities 533, ,941 23, , ,516 Total business-type activities 653, , , , ,064 Total primary government 38,913,938 37,011,786 38,121,163 37,623,431 38,738,573 Change in net position Government activities (5,518,489) (4,939,041) 6,115,661 (3,943,542) (5,315,560) Business-type activities 1,422,717 (2,011,558) (1,454,834) 676,613 (145,769) Total primary government $ (4,095,772) $ (6,950,599) $ 4,660,827 $ (3,266,929) $ (5,461,329) Source: City of Battle Creek Finance Department concluded. 163
172 Schedule 3 Unaudited Fund Balances - Governmental Funds Last Ten Fiscal Years (modified accrual basis of accounting) General fund Nonspendable Restricted Committed Assigned Unassigned Reserved $ 142,656 $ 195,796 $ 580,445 $ 297,534 $ 531,030 Unreserved 11,050,908 9,574,180 7,500,072 7,875,800 6,886,896 Total general fund $ 11,193,564 $ 9,769,976 $ 8,080,517 $ 8,173,334 $ 7,417,926 All other governmental funds Nonspendable Restricted Committed Assigned Unassigned (deficit) Reserved $ 2,304,993 $ 2,232,709 $ 2,411,576 $ 2,380,677 $ 2,270,931 Unreserved, reported in: Special revenue funds 3,126,389 2,714,722 2,074,998 1,153,026 (284,187) Debt service funds 1,052,207 1,052,660 1,099,349 62,483 7,380 Capital projects funds 2,896,070 5,010,124 5,362,221 4,000, ,055 Permanent funds 1,560,154 1,370,131 1,381,477 1,055,843 1,156,678 Total all other governmental funds $ 10,939,813 $ 12,380,346 $ 12,329,621 $ 8,652,780 $ 3,862,857 continued 164
173 Schedule 3 Unaudited Fund Balances - Governmental Funds Last Ten Fiscal Years (modified accrual basis of accounting) General fund Nonspendable $ 499,983 $ 865,127 $ 448,287 $ 484,653 Restricted 336, , , ,134 Committed 783, , , ,624 Assigned 1,489,087 1,064,255 68,152 91,720 Unassigned 4,682,496 4,895,117 6,171,173 6,580,891 Reserved $ 518, Unreserved 6,740, Total general fund $ 7,259,700 $ 7,791,452 $ 7,880,358 $ 7,669,145 $ 8,149,022 All other governmental funds Nonspendable $ 1,120,738 $ 964,756 $ 1,012,623 $ 1,016,652 Restricted 689, , ,079 11,477,425 Committed 958,394 2,209,308 2,389,690 2,436,895 Assigned 649, ,288 1,329, ,577 Unassigned (deficit) (512,389) - (179,235) (131,387) Reserved $ 1,121, Unreserved, reported in: Special revenue funds 664, Debt service funds 7, Capital projects funds 1,250, Permanent funds 1,157, Total all other governmental funds $ 4,201,408 $ 2,906,497 $ 4,329,516 $ 5,308,120 $ 15,539,162 Source: City of Battle Creek Finance Department concluded. 165
174 Schedule 4 Unaudited Changes in Fund Balances - Governmental Funds Last Ten Fiscal Years (modified accrual basis of accounting) Revenues Income taxes $ 13,942,683 $ 14,586,873 $ 14,226,870 $ 15,505,430 $ 14,240,808 Property taxes 13,591,892 14,450,183 15,322,115 16,485,528 17,033,749 Licenses and permits 1,166,882 1,084,527 1,075,341 1,026,490 1,012,079 Intergovernmental 16,267,323 17,709,598 16,665,977 16,942,219 16,323,084 Charges for services 4,659,697 4,842,463 4,674,591 3,975,149 5,329,100 Fines and forfeitures 213, , , , ,251 Investment income 1,659,348 1,177,345 1,933,354 1,942,756 1,626,797 Other 5,672,269 4,100,007 4,642,201 4,266,257 3,566,605 Total revenues 57,173,984 58,201,679 58,751,244 60,393,638 59,339,473 Expenditures General government 7,123,031 8,841,806 10,325,281 11,975,613 10,426,091 Public safety 25,239,131 25,551,655 25,106,311 26,766,867 27,333,095 Public works 2,068,952 1,480,494 1,606,562 1,600,366 2,005,097 Highway and streets 9,768,176 10,760,834 9,837,482 11,599,488 13,495,120 Parks and recreation 9,277,231 7,503,210 5,757,306 5,192,125 6,411,034 Community development 2,080,063 1,781,415 2,093,161 1,829,799 2,273,906 Unallocated 2,286,466 2,331,588 3,123,061 2,504, ,947 Capital outlay 92,816 1,199,315 2,807, , ,213 Debt service: Principal retirement 1,575,000 1,630,000 2,889,000 2,110,890 2,119,432 Interest 1,121,701 1,091,107 1,127, ,236 1,035,366 Bond issuance costs ,915 - Total expenditures 60,632,567 62,171,424 64,673,803 64,892,342 65,978,301 Revenues over (under) expenditures (3,458,583) (3,969,745) (5,922,559) (4,498,704) (6,638,828) Other financing sources (uses) Issuance of bonds - 3,819,000 3,708,005 8,975,420 - Premium (discount) on bonds (39,814) - Payment to refunding bond escrow agent (8,556,980) - Proceeds from sales of capital assets 596, , , ,229 1,094,075 Transfers in 10,968,311 8,896,090 8,535,425 9,521,452 8,829,217 Transfers out (11,291,913) (9,359,654) (8,758,763) (9,972,627) (8,353,518) Total other financing sources (uses) 272,682 3,986,690 4,182, ,680 1,569,774 Net changes in fund balances $ (3,185,901) $ 16,945 $ (1,740,184) $ (3,584,024) $ (5,069,054) Debt services as a percentage of noncapital expenditures 4.9% 5.3% 7.0% 5.1% 5.4% continued 166
175 Schedule 4 Unaudited Changes in Fund Balances - Governmental Funds Last Ten Fiscal Years (modified accrual basis of accounting) Revenues Income taxes $ 14,328,097 $ 13,548,759 $ 15,009,421 $ 16,234,540 $ 16,093,707 Property taxes 17,414,875 16,711,960 16,542,171 15,809,783 16,258,935 Licenses and permits 1,038,089 1,198, , , ,738 Intergovernmental 15,867,905 19,635,529 25,974,924 17,729,297 15,443,105 Charges for services 4,833,110 4,479,740 5,235,921 5,058,388 4,520,247 Fines and forfeitures 217, , , , ,497 Investment income 985, , , , ,839 Other 2,903,858 3,511,690 5,225,127 3,441,665 2,968,516 Total revenues 57,589,049 59,980,025 69,601,811 59,360,863 56,901,584 Expenditures General government 7,970,982 9,025,067 10,840,690 8,324,868 13,218,040 Public safety 27,096,596 26,296,938 25,721,232 25,856,822 25,587,422 Public works 1,906,614 2,739,101 2,422,655 1,801,123 2,152,726 Highway and streets 8,270,729 9,674,093 13,336,410 10,504,607 9,261,973 Parks and recreation 5,791,915 5,613,072 5,396,641 5,404,433 4,784,815 Community development 3,040,116 4,371,354 5,871,937 3,729,026 1,725,369 Unallocated 537,689 1,080, , , ,325 Capital outlay 267,009-1,230,028 1,789,974 1,272,866 Debt service: Principal retirement 2,103,669 2,363,469 1,843,730 1,439,473 1,960,721 Interest 927, , , ,414 1,183,898 Bond issuance costs 83, , ,339 Total expenditures 57,995,538 62,212,994 67,787,931 60,030,749 61,898,494 Revenues over (under) expenditures (406,489) (2,232,969) 1,813,880 (669,886) (4,996,910) Other financing sources (uses) Issuance of bonds 2,240,000 6,725, ,370,000 Premium (discount) on bonds 5, , ,666 Payment to refunding bond escrow agent (2,162,125) (6,818,624) Proceeds from sales of capital assets 974,036 1,029, Transfers in 10,851,446 7,706,637 5,629,173 6,035,359 5,400,117 Transfers out (11,331,409) (7,423,378) (5,931,128) (4,598,082) (5,445,954) Total other financing sources (uses) 577,168 1,469,810 (301,955) 1,437,277 15,707,829 Net changes in fund balances $ 170,679 $ (763,159) $ 1,511,925 $ 767,391 $ 10,710,919 Debt services as a percentage of noncapital expenditures 5.7% 6.0% 4.7% 4.2% 6.0% Source: City of Battle Creek Finance Department concluded. 167
176 Schedule 5 Unaudited Changes in Fund Balances - General Fund Last Ten Fiscal Years (modified accrual basis of accounting) Revenues Income taxes $ 13,942,683 $ 14,450,183 $ 14,226,870 $ 15,505,430 $ 14,240,808 Property taxes 13,579,207 14,580,358 15,322,115 16,485,528 17,033,749 Licenses and permits 1,166,882 1,084,527 1,075,341 1,026,490 1,012,079 Intergovernmental 7,701,623 7,804,482 7,814,021 7,932,595 7,688,340 Charges for services 2,522,682 2,518,560 2,436,074 2,377,713 2,297,536 Fines and forfeitures 213, , , , ,251 Investment income 1,474,106 1,047,649 1,408,071 1,455,000 1,330,682 Other 1,849,970 1,700,687 1,607,005 2,083,831 2,042,606 Total revenues 42,451,043 43,437,129 44,100,292 47,116,396 45,853,051 Expenditures General government 6,655,187 6,835,195 7,100,784 7,818,545 8,526,593 Public safety 23,855,387 24,207,356 24,691,224 26,187,733 26,631,841 Public works 2,068,952 1,480,494 1,606,562 1,600,366 2,005,097 Parks and recreation 4,349,374 4,155,768 4,013,727 3,847,291 3,756,736 Unallocated 2,022,281 2,082,499 2,871,545 2,140, ,265 Total expenditures 38,951,181 38,761,312 40,283,842 41,594,473 41,322,532 Revenues over (under) expenditures 3,499,862 4,675,817 3,816,450 5,521,923 4,530,519 Other financing sources (uses) Transfers in 942,459 46,244 70, , ,742 Sale of land and other assets 578, , , , ,715 Transfers out (5,512,369) (6,776,903) (6,273,924) (6,337,369) (6,260,384) Total other financing sources (uses) (3,991,066) (6,099,405) (5,505,909) (5,429,106) (5,285,927) Net changes in fund balances $ (491,204) $ (1,423,588) $ (1,689,459) $ 92,817 $ (755,408) continued 168
177 Schedule 5 Unaudited Changes in Fund Balances - General Fund Last Ten Fiscal Years (modified accrual basis of accounting) Revenues Income taxes $ 14,328,097 $ 13,548,759 $ 15,009,421 $ 16,234,540 $ 16,093,707 Property taxes 17,414,875 16,711,960 14,909,932 14,227,428 14,683,943 Licenses and permits 1,038,089 1,160, , , ,302 Intergovernmental 7,121,712 6,731,957 6,353,111 6,595,260 6,659,514 Charges for services 2,305,552 2,142,591 2,228,868 2,026,494 1,981,271 Fines and forfeitures 217, , , , ,497 Investment income 793, , , , ,395 Other 1,545,510 2,142,638 3,167,419 1,833,188 1,965,686 Total revenues 44,764,452 43,264,011 43,096,053 41,903,628 42,774,315 Expenditures General government 7,707,358 7,521,606 7,082,687 7,268,561 7,225,082 Public safety 26,452,872 25,607,110 24,741,135 25,021,620 25,303,386 Public works 1,906,614 2,739,101 2,422,655 1,801,123 2,152,726 Parks and recreation 3,390,286 3,284,606 3,017,352 2,887,026 2,708,291 Unallocated 364,755 1,053,986 1,230,028 1,789,974 1,272,866 Total expenditures 39,821,885 40,206,409 38,493,857 38,768,304 38,662,351 Revenues over (under) expenditures 4,942,567 3,057,602 4,602,196 3,135,324 4,111,964 Other financing sources (uses) Transfers in 1,820, , ,792 1,056 16,600 Sale of land and other assets 917, , Transfers out (7,838,862) (5,767,462) (4,681,082) (3,347,593) (3,648,687) Total other financing sources (uses) (5,100,793) (3,905,425) (4,513,290) (3,346,537) (3,632,087) Net changes in fund balances $ (158,226) $ (847,823) $ 88,906 $ (211,213) $ 479,877 Source: City of Battle Creek Finance Department concluded. 169
178 Schedule 6 Unaudited Assessed and Taxable Value of Property Last Ten Fiscal Years (in thousands of dollars) Taxable Value (1) Fiscal Total Year Ended Tax Valued as of Assessed Value Real Personal June 30, Year December 31, (S.E.V.) Property Property $ 1,601,470,703 $ 1,090,543,166 $ 321,394, ,672,651,855 1,125,760, ,590, ,727,239,263 1,147,982, ,603, ,828,928,429 1,191,931, ,774, ,960,436,729 1,232,773, ,956, ,957,111,278 1,175,550, ,175, ,897,043,026 1,144,865, ,109, ,813,627,641 1,092,427, ,958, ,744,721,015 1,049,158, ,597, ,548,617,763 1,018,660, ,022,818 continued 170
179 Schedule 6 Unaudited Assessed and Taxable Value of Property Last Ten Fiscal Years (in thousands of dollars) Taxable Value (2) Total Estimated Fiscal (2) Neighborhood Actual Value Year Ended Industrial Enterprise of Taxable Total Direct June 30, Facilities Zone Total Property Tax Rate 2014 $ 143,777,085 $ 96,372 $ 1,555,812,649 $ 3,202,941, ,610, ,072 1,614,113,561 3,345,303, ,383, ,736 1,643,286,271 3,454,478, ,283, ,409 1,697,485,024 3,657,856, ,737, ,073 1,770,978,572 3,920,873, ,617, ,177 1,727,797,153 3,914,222, ,647, ,147 1,682,075,791 3,794,086, ,814, ,688 1,605,760,466 3,627,255, ,621, ,280 1,553,255,563 3,489,442, ,170, ,253 1,516,732,367 3,097,235, concluded. Notes: Property in the City of Battle Creek is assessed every year representing approximately 50% of the actual (1) Assessed value is ad valorem property only and does not include tax abated properties (see #2 below). (2) Represents current values of tax abated properties. SOURCE: City of Battle Creek Assessor's Office. 171
180 Schedule 7 Unaudited Direct and Overlapping Property Tax Rates Last Ten Fiscal Years (rate per $1,000 of taxable value) Fiscal Year Ended June 30, Levied July 1, (1) City of Battle Creek Operating Debt Pension Total Direct Rate Battle Creek Public Schools State Education Tax continued 172
181 Schedule 7 Unaudited Direct and Overlapping Property Tax Rates Last Ten Fiscal Years (rate per $1,000 of taxable value) Fiscal Year Ended June 30, Calhoun Intermediate School District Kellogg Community College District Library Totals County Non-Homestead Homestead (2) , , , , , , , , , , , , , , , , , , , , (1) Approximately 2/3 of the City's taxable value is contained in Battle Creek School District. Four other school districts overlap into the geographical boundaries of the City. The millage rates for these other school districts are approximately equivalent to Battle Creek School District's. concluded. (2) Passage of Proposal A in 1994 reduced operating millage for Michigan public schools to 18 mills for non-homestead properties and exempted homestead properties. Both homestead and non-homestead properties are subject to the State Education Tax of 6 mills as well as any debt service levy. Source: City of Battle Creek Finance Department 173
182 Schedule 8 Unaudited Principal Property Taxpayers Current Year and Nine Years Ago Percentage of Total Taxable City Taxable Taxpayer Value Rank Value Kellogg Company $ 148,165, % Denso Manufacturing MI Inc. 99,328, % Post Foods LLC 54,068, % Musashi Auto Parts-Michigan Inc Consumer Energy 17,723, % TRMI Inc. 14,270, % II Stanley Co Inc. 23,077, % Conagra Foods Inc. 17,123, % Semco Energy Inc. 12,393, % Graphic Packaging International Technical Auto Parts 32,545, % Yorozu Auto Parts 13,011, % 2005 $ 431,706, % continued 174
183 Schedule 8 Unaudited Principal Property Taxpayers Current Year and Nine Years Ago Percentage of Total Taxable City Taxable Taxpayer Value Rank Value Kellogg Company $ 144,418, % Denso Manufacturing MI Inc. 82,798, % Post Foods LLC 46,832, % Musashi Auto Parts-Michigan Inc. 36,207, % Consumer Energy 31,107, % TRMI Inc. 22,235, % II Stanley Co Inc. 17,475, % Conagra Foods Inc. 14,408, % Semco Energy Inc. 12,723, % Graphic Packaging International 10,776, % Technical Auto Parts Yorozu Auto Parts $ 418,984, % Source: City of Battle Creek Assessor's Office. concluded. 175
184 This page intentionally left blank. 176
185 Schedule 9 Unaudited Property Tax Levies and Collections Last Ten Fiscal Years Taxes Levied Collected within the Fiscal Year of the Levy Subsequent Total Collections to Date for the Fiscal % of Years % of Year Year Amount Levy Collections Amount Levy 2014 $ 21,005,303 $ 20,940, % $ 4,911 $ 20,945, % ,447,205 21,408, % 3,195 21,411, % ,158,202 22,104, % 12,611 22,117, % ,579,440 22,506, % 25,414 22,532, % ,571,614 23,501, % 21,539 23,523, % ,135,527 23,070, % 18,492 23,088, % ,783,861 22,530, % 253,471 22,783, % ,506,199 19,403, % 1,102,875 20,506, % ,922,342 18,016, % 906,068 18,922, % ,605,060 17,672, % 932,552 18,605, % Source: City of Battle Creek Treasurer's Office 177
186 Schedule 10 Unaudited Number of Water System Customers by User Class Last Ten Fiscal Years Type of User In-City Residential 15,144 15,762 15,743 15,627 14,639 Commercial (1) 1,753 1,807 1,795 1,756 1,718 Industrial ,060 17,794 17,759 17,587 16,568 Outside City Emmett Township Bedford Township Springfield City Bulk Bulk Bulk Bulk Bulk Pennfield Township Bulk Bulk Bulk Bulk Bulk 1,277 1,200 1,146 1,173 1,191 Totals 18,337 18,994 18,905 18,760 17,759 continued 178
187 Schedule 10 Unaudited Number of Water System Customers by User Class Last Ten Fiscal Years Type of User In-City Residential 14,467 14,318 14,430 14,814 14,791 Commercial (1) 1,575 1,557 1,557 1,622 1,628 Industrial ,168 15,999 16,115 16,565 16,551 Outside City Emmett Township Bedford Township Springfield City Bulk Bulk Bulk Bulk Bulk Pennfield Township Bulk Bulk Bulk Bulk Bulk 1,089 1,066 1,079 1,107 1,099 Totals 17,257 17,065 17,194 17,672 17,650 (1) This class includes commercial and governmental users. concluded. Source: City of Battle Creek Treasurer's Office 179
188 Schedule 11 Unaudited Number of Water System Customers by User Class as a Percent of Total Last Ten Fiscal Years Type of User In-City Residential 82.59% 82.98% 83.27% 83.30% 82.43% Commercial 9.56% 9.51% 9.49% 9.36% 9.67% Industrial 0.89% 1.18% 1.17% 1.09% 1.19% 93.04% 93.68% 93.94% 93.75% 93.29% Outside City Emmett Township 4.17% 4.03% 3.80% 3.96% 4.25% Bedford Township 2.79% 2.28% 2.26% 2.30% 2.46% Springfield City n/a n/a n/a n/a n/a Pennfield Township n/a n/a n/a n/a n/a 6.96% 6.32% 6.06% 6.25% 6.71% Totals % % % % % continued 180
189 Schedule 11 Unaudited Number of Water System Customers by User Class as a Percent of Total Last Ten Fiscal Years Type of User In-City Residential 83.83% 83.90% 83.92% 83.83% 83.80% Commercial 9.13% 9.12% 9.06% 9.18% 9.22% Industrial 0.73% 0.73% 0.74% 0.72% 0.75% 93.69% 93.75% 93.72% 93.73% 93.77% Outside City Emmett Township 3.87% 3.80% 3.78% 3.79% 3.79% Bedford Township 2.44% 2.45% 2.50% 2.48% 2.44% Springfield City n/a n/a n/a n/a n/a Pennfield Township n/a n/a n/a n/a n/a 6.31% 6.25% 6.28% 6.27% 6.23% Totals % % % % % Source: City of Battle Creek Treasurer's Office concluded. 181
190 Schedule 12 Unaudited Water System Revenues by User Class Last Ten Fiscal Years Type of User In-City Residential $ 2,988,206 $ 2,930,112 $ 3,114,683 $ 3,128,571 $ 3,116,515 Commercial (1) 2,107,130 2,384,246 2,229,896 2,140,021 2,018,350 Industrial 1,534,992 1,458,381 1,775,531 1,782,813 1,709,693 6,630,328 6,772,739 7,120,110 7,051,405 6,844,558 Outside City Emmett Township (2) Bedford Township (2) East Leroy Township (2) Springfield City 257, , , , ,048 Pennfield Township 25,819 24,931 25,170 24,215 23, , , , , ,514 Totals $ 6,913,529 $ 7,067,479 $ 7,409,433 $ 7,345,789 $ 7,135,072 continued 182
191 Schedule 12 Unaudited Water System Revenues by User Class Last Ten Fiscal Years Type of User In-City Residential $ 3,013,516 $ 2,973,697 $ 3,197,288 $ 3,410,041 $ 3,403,962 Commercial (1) 2,036,886 1,683,483 1,886,236 2,099,206 2,092,311 Industrial 1,865,248 1,750,581 2,047,362 2,005,796 2,133,970 6,915,650 6,407,761 7,130,886 7,515,043 7,630,243 Outside City Emmett Township (2) 157, , , , ,684 Bedford Township (2) 45,160 97,724 90, ,866 92,695 East Leroy Township (2) 6,162 14,230 23,539 34,188 19,460 Springfield City 278, , , , ,441 Pennfield Township 26,304 66,760 28,274 55,498 29, , , , ,108 1,085,899 Totals $ 7,428,581 $ 7,313,717 $ 8,093,783 $ 8,478,151 $ 8,716,142 (1) This class includes commercial and governmental users. concluded. (2) Effective 11/1/99 to 6/30/09, Emmett, Bedford and East Leroy Townships residential revenues are Source: City of Battle Creek Treasurer's Office 183
192 Schedule 13 Unaudited Water System Revenues by User Class as a Percent of Total Revenue Last Ten Fiscal Years Type of User In-City Residential 43.22% 41.46% 42.04% 42.59% 43.68% Commercial (1) 30.48% 33.74% 30.10% 29.13% 28.29% Industrial 22.20% 20.64% 23.96% 24.27% 23.96% 95.90% 95.83% 96.10% 95.99% 95.93% Outside City Emmett Township (2) 0.00% 0.00% 0.00% 0.00% 0.00% Bedford Township (2) 0.00% 0.00% 0.00% 0.00% 0.00% East Leroy Township (2) 0.00% 0.00% 0.00% 0.00% 0.00% Springfield City 3.72% 3.82% 3.57% 3.68% 3.74% Pennfield Township 0.37% 0.35% 0.34% 0.33% 0.33% 4.10% 4.17% 3.90% 4.01% 4.07% Totals % % % % % continued 184
193 Schedule 13 Unaudited Water System Revenues by User Class as a Percent of Total Revenue Last Ten Fiscal Years Type of User In-City Residential 40.57% 40.66% 39.50% 40.22% 39.05% Commercial (1) 27.42% 23.02% 23.30% 24.76% 24.01% Industrial 25.11% 23.94% 25.30% 23.66% 24.48% 93.10% 87.61% 88.10% 88.64% 87.54% Outside City Emmett Township (2) 2.12% 7.09% 7.03% 5.85% 7.01% Bedford Township (2) 0.61% 1.34% 1.11% 1.20% 1.06% East Leroy Township (2) 0.08% 0.19% 0.29% 0.40% 0.22% Springfield City 3.74% 2.85% 3.12% 3.25% 3.83% Pennfield Township 0.35% 0.91% 0.35% 0.66% 0.34% 6.90% 12.39% 11.90% 11.36% 12.46% Totals % % % % % (1) This class includes commercial and governmental users. concluded. (2) Effective 11/1/99 to 6/30/09, Emmett, Bedford & East Leroy Townships residential revenues are included above in In-City Residential. Source: City of Battle Creek Treasurer's Office 185
194 Schedule 14 Unaudited Water System Sales Volume by User Class (Cubic Feet) Last Ten Fiscal Years Type of User In-City Residential 135,354, ,288, ,922, ,667, ,570,888 Commercial (1) 108,753, ,556, ,436, ,213, ,337,291 Industrial 121,679, ,409, ,573, ,340, ,527, ,787, ,254, ,933, ,220, ,435,729 Outside City Emmett Township 4,195,427 15,288,468 17,771,062 19,970,065 17,390,165 Bedford Township 4,560,943 3,602,107 3,301,180 3,647,245 3,199,666 Springfield City 21,277,255 20,754,525 19,956,511 22,897,818 19,962,071 Pennfield Township 3,165,700 2,937,600 2,700,500 2,570,500 2,467,500 33,199,325 42,582,700 43,729,253 49,085,628 43,019,402 Totals 398,986, ,837, ,662, ,306, ,455,131 continued 186
195 Schedule 14 Unaudited Water System Sales Volume by User Class (Cubic Feet) Last Ten Fiscal Years Type of User In-City Residential 126,426, ,730, ,428, ,321, ,821,573 Commercial (1) 104,709, ,704,045 94,180, ,996, ,258,848 Industrial 113,482, ,505, ,043, ,981, ,575, ,619, ,940, ,652, ,298, ,655,564 Outside City Emmett Township 19,058,356 22,469,497 20,989,946 22,861,381 25,097,179 Bedford Township 3,513,561 3,357,542 3,387,117 3,989,779 3,281,149 Springfield City 18,041,171 20,371,021 20,084,605 20,452,628 18,474,474 Pennfield Township 2,368,300 2,532,700 2,506,600 2,238,500 2,223,900 42,981,388 48,730,760 46,968,268 49,542,288 49,076,702 Totals 387,600, ,671, ,620, ,840, ,732,266 (1) This class includes commercial and governmental users. concluded. Source: City of Battle Creek Treasurer's Office 187
196 Schedule 15 Unaudited Water System Sales Volume by User Class as a Percent of Total Sales (Cubic Feet) Last Ten Fiscal Years Type of User In-City Residential 33.92% 30.13% 32.29% 31.84% 32.00% Commercial (1) 27.26% 27.98% 26.58% 27.30% 28.37% Industrial 30.50% 31.39% 30.50% 28.81% 28.67% 91.68% 89.51% 89.38% 87.95% 89.04% Outside City Emmett Township 1.05% 3.77% 4.32% 4.90% 4.43% Bedford Township 1.14% 0.89% 0.80% 0.90% 0.82% Springfield City 5.33% 5.11% 4.85% 5.62% 5.09% Pennfield Township 0.79% 0.72% 0.66% 0.63% 0.63% 8.32% 10.49% 10.62% 12.05% 10.96% Totals % % % % % continued 188
197 Schedule 15 Unaudited Water System Sales Volume by User Class as a Percent of Total Sales (Cubic Feet) Last Ten Fiscal Years Type of User In-City Residential 32.62% 32.52% 28.56% 30.71% 28.76% Commercial (1) 27.01% 26.82% 24.36% 26.09% 25.59% Industrial 29.28% 28.06% 34.93% 31.35% 33.25% 88.91% 87.40% 87.85% 88.15% 87.60% Outside City Emmett Township 4.92% 5.81% 5.43% 5.47% 6.34% Bedford Township 0.91% 0.87% 0.88% 0.95% 0.83% Springfield City 4.65% 5.27% 5.19% 4.89% 4.67% Pennfield Township 0.61% 0.66% 0.65% 0.54% 0.56% 11.09% 12.60% 12.15% 11.85% 12.40% Totals % % % % % (1) This class includes commercial and governmental users. concluded. Source: City of Battle Creek Treasurer's Office 189
198 Schedule 16 Unaudited Water Pumped and Sold (Cubic Feet) Last Ten Fiscal Years Fiscal Year Percent Percent Water Sold Ended Water Increase Water Increase as a % of June 30 Pumped (Decrease) Sold (Decrease) Water Pumped ,232, % 395,732, % 83.10% ,366, % 417,840, % 87.35% ,471, % 386,620, % 75.89% ,914, % 386,671, % 80.24% ,834, % 387,600, % 81.29% ,044, % 392,455, % 84.03% ,009, % 407,306, % 78.18% ,835, % 411,662, % 84.21% ,143, % 405,837, % 80.18% ,578, % 398,986, % 78.92% Source: City of Battle Creek Treasurer's Office 190
199 Schedule 17 Unaudited Water Revenues and Usage - Major Customers Fiscal Year Ended June 30, 2014 Consumption % of % of Company Product or Service (Cu. Ft.) Total Revenue Total Kellogg Company - Plant Breakfast foods 45,100, % $ 677, % Post Foods Breakfast foods 33,084, % 517, % Denso Mfg Automotive parts 9,956, % 157, % Fire Keepers Casino Gambling/entertainment 8,441, % 172, % Graphic Packaging/MI Paperboard Paper Mill 8,189, % 132, % VA Medical Center - Hospital Medical services 5,904, % 90, % City of Battle Creek - WWTP Government 4,836, % 76, % Rock-Tenn/Waldorf Corp Paperboard 4,631, % 70, % Prairie Farms Dairy Dairy processing 4,207, % 68, % Bronson Battle Creek Health Sys. Medical services 4,069, % 68, % Johnson Controls Heating & Venting 3,772, % 62, % Calhoun County Justice Center Government-Jails/Courts 2,650, % 43, % Kellogg Company - Research Food research 2,508, % 42, % Ralcorp Holdings, Inc Breakfast foods 2,442, % 37, % Musashi Auto Parts Automotive parts 2,356, % 39, % Rolling Hills MHP Mobile Home Park 2,269, % 37, % Cello-Foil Products Cellophane Product Mfg. 2,150, % 35, % Kellogg Company - Headquarters Breakfast foods 2,117, % 37, % VA Medical Center - Laundry Laundry 1,794, % 30, % Gallagher Laundry Laundry 1,358, % 23, % Totals 151,842, % $ 2,421, % Source: City of Battle Creek Treasurer's Office 191
200 This page intentionally left blank. 192
201 Schedule 18 Unaudited Current Water Rates Beginning as of July 1, 2008 Monthly Water Commodity Charge (1) (Fiscal Year Ending June 30) Inside City 0 to 4,410,000 $ 1.26 $ 1.29 $ 1.32 $ 1.39 $ 1.46 $ ,410,001 to 11,000, Over 11,000, Outside City (bulk rate) Pennfield Township Springfield City Monthly Readiness-to-Serve Charge (2) (Fiscal Year Ending June 30) Inside City 5/8" $ 7.23 $ 7.41 $ 7.59 $ 7.97 $ 8.37 $ /4" or less '' '' '' '' '' '' '' '' Over 10" (4) Monthly Fire Sprinkler Charges (3) (Fiscal Year Ending June 30) Inside City 2'' $ 5.40 $ 5.53 $ 5.67 $ 5.95 $ 6.25 $ '' '' '' '' '' (1) Rate per 100 cubic feet. (2) Rate based on meter size; Outside City rates are set by contract. (3) Rate based on connection size; Outside City rates are set by contract. (4) To be calculated at time of permit. Source: City of Battle Creek Treasurer's Office 193
202 Schedule 19 Unaudited Number of Wastewater System Customers by User Class Last Ten Fiscal Years Type of User In-City Residential 16,854 16,761 16,738 16,788 16,893 Commercial (1) 1,808 1,798 1,756 2,068 1,736 Industrial ,814 18,710 18,639 19,011 18,784 Outside City Emmett Township 1,835 1,825 1,828 1,842 1,885 Bedford Township Springfield City Bulk Bulk Bulk Bulk Bulk Pennfield Township Bulk Bulk Bulk Bulk Bulk 2,417 2,404 2,367 2,428 2,497 Totals 21,231 21,114 21,006 21,439 21,281 continued 194
203 Schedule 19 Unaudited Number of Wastewater System Customers by User Class Last Ten Fiscal Years Type of User In-City Residential 15,490 15,287 15,304 15,812 15,785 Commercial (1) 1,563 1,518 1,500 1,570 1,576 Industrial ,169 16,921 16,923 17,501 17,483 Outside City Emmett Township 1,665 1,631 1,690 1,660 1,683 Bedford Township Springfield City Bulk Bulk Bulk Bulk Bulk Pennfield Township Bulk Bulk Bulk Bulk Bulk 2,210 2,171 2,243 2,223 2,236 Totals 19,379 19,092 19,166 19,724 19,719 (1) This class includes commercial and governmental users. concluded. Source: City of Battle Creek Treasurer's Office 195
204 Schedule 20 Unaudited Wastewater System Customers by User Class as a Percent of Total Last Ten Fiscal Years Ended June 30, 2014 Type of User In-City Residential 79.38% 79.38% 79.68% 78.31% 79.38% Commercial (1) 8.52% 8.52% 8.36% 9.65% 8.16% Industrial 0.72% 0.72% 0.69% 0.72% 0.73% 88.62% 88.61% 88.73% 88.67% 88.27% Outside City Emmett Township 8.64% 8.64% 8.70% 8.59% 8.86% Bedford Township 2.74% 2.74% 2.57% 2.73% 2.88% Springfield City n/a n/a n/a n/a n/a Pennfield Township n/a n/a n/a n/a n/a 11.38% 11.39% 11.27% 11.33% 11.73% Totals % % % % % continued 196
205 Schedule 20 Unaudited Wastewater System Customers by User Class as a Percent of Total Last Ten Fiscal Years Ended June 30, 2014 Type of User In-City Residential 79.93% 80.07% 79.85% 80.17% 80.05% Commercial (1) 8.07% 7.95% 7.83% 7.96% 7.99% Industrial 0.60% 0.61% 0.62% 0.60% 0.62% 88.60% 88.63% 88.30% 88.73% 88.66% Outside City Emmett Township 8.59% 8.54% 8.82% 8.42% 8.53% Bedford Township 2.81% 2.83% 2.89% 2.85% 2.80% Springfield City n/a n/a n/a n/a n/a Pennfield Township n/a n/a n/a n/a n/a 11.40% 11.37% 11.70% 11.27% 11.34% Totals % % % % % (1) This class includes commercial and governmental users. concluded. Source: City of Battle Creek Treasurer's Office 197
206 Schedule 21 Unaudited Wastewater System Revenues by User Class Last Ten Fiscal Years Type of User In-City Residential $ 2,811,084 $ 2,761,007 $ 3,376,960 $ 3,267,808 $ 3,763,342 Commercial (1) 1,941,867 1,783,669 2,058,448 2,169,934 2,108,616 Industrial 3,731,951 3,446,719 3,731,009 4,262,166 4,290,110 8,484,902 7,991,395 9,166,417 9,699,908 10,162,068 Outside City Emmett Township 623, , , , ,156 Bedford Township 172, , , , ,640 East Leroy Township Springfield City 379, , , , ,221 Pennfield Township 380, , , , ,602 1,555,907 1,604,320 1,689,944 1,771,366 1,838,619 Totals $ 10,040,809 $ 9,595,715 $ 10,856,361 $ 11,471,274 $ 12,000,687 continued 198
207 Schedule 21 Unaudited Wastewater System Revenues by User Class Last Ten Fiscal Years Type of User In-City Residential $ 4,012,982 $ 4,145,313 $ 4,323,322 $ 4,450,077 $ 4,764,798 Commercial (1) 2,219,711 2,169,252 2,340,662 2,385,212 2,592,433 Industrial 5,235,533 4,732,896 5,220,780 5,815,387 5,564,090 11,468,226 11,047,460 11,884,764 12,650,676 12,921,321 Outside City Emmett Township 855, , , ,189 1,087,836 Bedford Township 177, , , , ,892 East Leroy Township ,961 24,345 35,571 16,971 Springfield City 536, , , , ,192 Pennfield Township 496, , , , ,887 2,065,768 1,994,668 2,168,960 2,173,872 2,471,778 Totals $ 13,533,994 $ 13,042,128 $ 14,053,724 $ 14,824,548 $ 15,393,099 (1) This class includes commercial and governmental users. concluded. Source: City of Battle Creek Treasurer's Office 199
208 Schedule 22 Unaudited Wastewater System Revenues by User Class as a Percent of Total Revenue Last Ten Fiscal Years Type of User In-City Residential 28.00% 28.77% 31.11% 28.49% 31.36% Commercial (1) 19.34% 18.59% 18.96% 18.92% 17.57% Industrial 37.17% 35.92% 34.37% 37.16% 35.75% 84.50% 83.28% 84.43% 84.56% 84.68% Outside City Emmett Township (2) 6.21% 6.13% 6.27% 5.94% 5.61% Bedford Township (2) 1.72% 2.51% 1.92% 1.73% 1.69% East Leroy Township (2) 0.00% 0.00% 0.00% 0.00% 0.00% Springfield City 3.78% 4.13% 3.65% 3.99% 3.98% Pennfield Township 3.79% 3.95% 3.73% 3.79% 4.05% 15.50% 16.72% 15.57% 15.44% 15.32% Totals % % % % % continued 200
209 Schedule 22 Unaudited Wastewater System Revenues by User Class as a Percent of Total Revenue Last Ten Fiscal Years Type of User In-City Residential 29.65% 31.78% 30.76% 30.02% 30.95% Commercial (1) 16.40% 16.63% 16.66% 16.09% 16.84% Industrial 38.68% 36.29% 37.15% 39.23% 36.15% 84.74% 84.71% 84.57% 85.34% 83.94% Outside City Emmett Township (2) 6.32% 6.58% 6.06% 6.11% 7.07% Bedford Township (2) 1.31% 1.49% 1.68% 0.88% 1.49% East Leroy Township (2) 0.00% 0.10% 0.17% 0.24% 0.11% Springfield City 3.96% 3.70% 3.82% 3.76% 3.81% Pennfield Township 3.67% 3.43% 3.70% 3.68% 3.59% 15.26% 15.29% 15.43% 14.66% 16.06% Totals % % % % % (1) This class includes commercial and governmental users. concluded. (2) Effective 11/1/99, Emmett, Bedford and East Leroy Townships residential revenues are included above in In-City Source: City of Battle Creek Treasurer's Office 201
210 This page intentionally left blank. 202
211 Schedule 23 Unaudited Wastewater System Ten Year History of Volumes Total Annual Total Annual Fiscal Amount of Sewer Amount of Year Ended Total Treatment Sold Sewer Treated June 30, Customers (000,000's Gallons) (000,000's Gallons) ,719 2,287 3, ,724 2,356 3, ,166 2,278 3, ,092 2,330 3, ,379 2,322 3, ,281 2,286 3, ,439 2,644 3, ,006 2,576 3, ,114 3,040 3, ,231 2,770 3,556 Source: City of Battle Creek Treasurer's Office 203
212 Schedule 24 Unaudited Wastewater System Sales Volume by User Class (Cubic Feet) Last Ten Fiscal Years Type of User In-City Residential 123,417, ,601, ,484, ,629, ,898,268 Commercial (1) 92,006, ,331,052 94,077, ,897,362 84,822,970 Industrial 84,933, ,255,306 70,828,876 46,361,097 42,910, ,357, ,187, ,390, ,887, ,631,360 Outside City Emmett Township 25,851,285 22,416,138 11,346,135 30,642,811 16,913,606 Bedford Township 7,251,759 7,141,993 3,176,176 7,342,349 5,620,143 Springfield City 17,822,333 17,858,390 17,077,626 18,222,458 17,902,584 Pennfield Township 18,974,550 15,795,100 18,438,800 16,392,850 17,519,550 69,899,927 63,211,621 50,038,737 72,600,468 57,955,883 Totals 370,257, ,399, ,429, ,488, ,587,243 continued 204
213 Schedule 24 Unaudited Wastewater System Sales Volume by User Class (Cubic Feet) Last Ten Fiscal Years Type of User In-City Residential 118,720, ,253, ,628, ,420, ,523,455 Commercial (1) 83,527,632 79,250,599 76,113,173 79,329,661 80,966,406 Industrial 42,917,747 44,410,403 45,466,669 43,565,656 37,475, ,165, ,914, ,208, ,316, ,965,594 Outside City Emmett Township 28,623,502 30,339,592 28,112,337 32,937,121 32,620,458 Bedford Township 6,339,386 5,409,186 5,798,143 5,866,583 5,462,014 Springfield City 16,043,919 16,990,491 17,028,636 16,822,846 15,906,771 Pennfield Township 14,309,350 15,813,350 16,344,800 14,984,100 14,855,300 65,316,157 68,552,619 67,283,916 70,610,650 68,844,543 Totals 310,481, ,466, ,492, ,926, ,810,137 (1) This class includes commercial and governmental users. concluded. Source: City of Battle Creek Treasurer's Office 205
214 Schedule 25 Unaudited Wastewater System Sales Volume by User Class as a Percent of Total Sales (Cubic Feet) Last Ten Fiscal Years Ended June 30, 2014 Type of User In-City Residential 33.33% 30.91% 37.59% 37.80% 39.24% Commercial (1) 24.85% 25.43% 27.31% 28.54% 27.76% Industrial 22.94% 28.11% 20.56% 13.12% 14.04% 81.12% 84.45% 85.47% 79.46% 81.03% Outside City Emmett Township 6.98% 5.52% 3.29% 8.67% 5.53% Bedford Township 1.96% 1.76% 0.92% 2.08% 1.84% Springfield City 4.81% 4.39% 4.96% 5.16% 5.86% Pennfield Township 5.12% 3.89% 5.35% 4.64% 5.73% 18.88% 15.55% 14.53% 20.54% 18.97% Totals % % % % % continued 206
215 Schedule 25 Unaudited Wastewater System Sales Volume by User Class as a Percent of Total Sales (Cubic Feet) Last Ten Fiscal Years Ended June 30, 2014 Type of User In-City Residential 38.24% 38.29% 37.97% 38.56% 38.76% Commercial (1) 26.90% 25.44% 25.00% 25.19% 26.48% Industrial 13.82% 14.26% 14.93% 13.83% 12.25% 78.96% 77.99% 77.90% 77.58% 77.49% Outside City Emmett Township 9.22% 9.74% 9.23% 10.46% 10.67% Bedford Township 2.04% 1.74% 1.90% 1.86% 1.79% Springfield City 5.17% 5.45% 5.60% 5.34% 5.20% Pennfield Township 4.61% 5.08% 5.37% 4.76% 4.86% 21.04% 22.01% 22.10% 22.42% 22.51% Totals % % % % % (1) This class includes commercial and governmental users concluded. Source: City of Battle Creek Treasurer's Office 207
216 Schedule 26 Unaudited Wastewater Revenue and Usage - Major Customers Fiscal Year Ended June 30, 2014 Consumption % of % of Company Product or Service (Cu. Ft.) Total Revenue Total Kellogg Company - Plant Breakfast foods 39,267, % $ 1,846, % Rock-Tenn/Waldorf Corp Paperboard 20,099, % 1,239, % Graphic Packaging/MI Paperboard Paper mill 19,534, % 1,026, % Post Foods Breakfast foods 18,259, % 848, % Fire Keepers Casino Gambling/Entertainment 7,455, % 194, % Denso Mfg. Michigan, Inc. Automotive parts 7,311, % 178, % VA Medical Center - Hospital Medical services 5,904, % 149, % Ralcorp Holdings Breakfast foods 4,636, % 119, % Prairie Farms Dairy Dairy processing 4,207, % 103, % Johnson Controls Heating & Venting 3,772, % 92, % Bronson Battle Creek Health Sys. Medical services 3,078, % 79, % Federal Center Government 2,678, % 73, % Calhoun Co. Justice Center Government-Jails/Courts 2,650, % 66, % Kellogg Company - Research Food research 2,201, % 55, % Rolling Hills MHP Mobile home park 2,149, % 45, % VA Medical Center - Laundry Laundry Services 1,745, % 42, % Bedford Hills MHP Mobile home park 1,563, % 33, % Kellogg Company - Headquarters Breakfast foods 1,396, % 35, % Fort Custer Training & Vet Affairs Military base 1,383, % 39, % Gallagher Laundry Laundry 1,302, % 32, % Totals 150,598, % $ 6,302, % (1) Consumption measured in Cubic Feet (M3). Source: City of Battle Creek Treasurer's Office 208
217 Schedule 27 Unaudited Largest Wastewater Customers Last Ten Fiscal Years Ended June 30, 2014 Fiscal Year Ended June 30, Kellogg Company Graphic Packaging/ MI Paperboard Rock-Tenn/Waldorf Corp Consumption Revenue Consumption Revenue Consumption Revenue ,663,447 $ 1,881,377 19,534,989 $ 1,026,706 20,099,514 $ 1,239, ,616,531 1,700,951 21,209,655 1,075,708 16,555,655 1,187, ,537,470 1,664,917 18,827, ,539 18,013,957 1,115, ,883,378 1,717,446 16,115, ,338 13,191, , ,501,750 2,037,778 17,583, ,414 9,173, , ,684,404 1,594,973 19,446, ,983 8,839, , ,436,961 1,669,857 25,055, ,028 8,938, , ,580,214 1,318,253 25,858, ,869 13,191, , ,061,497 1,181,361 26,485, ,208 14,089, , ,468,841 1,225,508 27,942, ,030 2,548, ,641 Consumption measured in Cubic Feet (M3). Source: City of Battle Creek Treasurer's Office 209
218 Current Wastewater Rates From July 1, 2009 to June 30, 2016 Commodity Charge Regular Commodity Rate Date (per ccf or 750 gallons) July 1, 2009 June 30, 2010 $2.010 July 1, 2010 June 30, 2011 $2.010 July 1, 2011 June 30, 2012 $2.110 July 1, 2012 June 30, 2013 $2.220 July 1, 2013 June 30, 2014 $2.330 July 1, 2014 June 30, 2015 $2.440 July 1, 2015 June 30, 2016 $2.570 Monitoring Charge Monitoring Charge (per Date sample) July 1, 2009 June 30, 2010 $89.80 July 1, 2010 June 30, 2011 $89.80 July 1, 2011 June 30, 2012 $94.29 July 1, 2012 June 30, 2013 $99.00 July 1, 2013 June 30, 2014 $ July 1, 2014 June 30, 2015 $ July 1, 2015 June 30, 2016 $ Source: City of Battle Creek Finance Department continued 210
219 Schedule 28 Unaudited Readiness to Serve Charges Inside City and Outside City Customers Billed by City Meter Size Current July 1, 2009 to June 30, 2010 July 1, 2010 to June 30, 2011 July 1, 2011 to June 30, 2012 July 1, 2012 to June 30, /8" $11.75 $10.15 $10.15 $10.66 $11.19 ¾ " $15.50 $13.39 $13.39 $14.06 $ $23.00 $19.87 $19.87 $20.86 $ $41.76 $36.07 $36.07 $37.87 $ $64.26 $55.51 $55.51 $58.29 $ $ $ $ $ $ $ $ $ $ $ $ $ $ $ $ $ $ $ $ $ $ $ $ $ $ Meter Size Current July 1, 2013 to June 30, 2014 July 1, 2014 to June 30, 2015 July 1, 2015 to June 30, /8" $11.75 $11.75 $12.34 $12.95 ¾ " $15.50 $15.50 $16.28 $ $23.00 $23.00 $24.15 $ $41.76 $41.76 $43.84 $ $64.26 $64.26 $67.47 $ $ $ $ $ $ $ $ $ $ $ $ $ $ $ $ $ $ $ $ $ Source: City of Battle Creek Finance Department continued 211
220 Current Wastewater Rates From 7/01/09 to 6/30/16 BOD and Suspended Solids Charges Date BOD Charge (per pound) Suspended Solids Charge (per pound) July 1, 2009 June 30, 2010 $ July 1, 2010 June 30, 2011 $ July 1, 2011 June 30, 2012 $ July 1, 2012 June 30, 2013 $ July 1, 2013 June 30, 2014 $ July 1, 2014 June 30, 2015 $ July 1, 2015 June 30, 2016 $ Sewer Customer Only (No Water Service) Customer is charged based on 750 cubic feet per month commodity charge, readiness to serve charge (same as outside City performing their own billing), and bill processing charge (below). Date Bill Processing Charge July 1, 2009 June 30, 2010 $0.81 July 1, 2010 June 30, 2011 $0.81 July 1, 2011 June 30, 2012 $0.85 July 1, 2012 June 30, 2013 $0.89 July 1, 2013 June 30, 2014 $0.94 July 1, 2014 June 30, 2015 $0.98 July 1, 2015 June 30, 2016 $1.03 Source: City of Battle Creek Finance Department continued 212
221 Schedule 28 Unaudited Outside City Performing Their Own Billing July 1, 2009 to July 1, 2010 to July 1, 2011 to July 1, 2012 to Meter Size Current June 30, 2010 June 30, 2011 June 30, 2012 June 30, /8" $7.50 $6.48 $6.48 $6.80 $7.14 ¾ " $11.25 $9.72 $9.72 $10.21 $ $18.75 $16.20 $16.20 $17.01 $ $37.51 $32.40 $32.40 $34.02 $ $60.01 $51.84 $51.84 $54.43 $ $ $97.20 $97.20 $ $ $ $ $ $ $ $ $ $ $ $ $ $ $ $ $ $ $ $ $ $ Meter Size Current July 1, 2013 to June 30, 2014 July 1, 2014 to June 30, 2015 July 1, 2015 to June 30, /8" $7.50 $7.50 $7.88 $8.27 ¾ " $11.25 $11.25 $11.81 $ $18.75 $18.75 $19.69 $ $37.51 $37.51 $39.38 $ $60.01 $60.01 $63.01 $ $ $ $ $ $ $ $ $ $ $ $ $ $ $ $ $ $ $ $ $ Source: City of Battle Creek Finance Department concluded. 213
222 Schedule 29 Unaudited Ratios of General Bonded Debt Outstanding and Total Outstanding Debt Last Ten Fiscal Years Governmental Activities General Bonded Debt Outstanding Business-type Activities Less: Amounts Less: Amounts General Restricted General Restricted Obligation to Repaying Obligation to Repaying Year Bonds Principal Bonds Principal Total 2014 $ 29,329,373 $ (17,300) $ - $ - $ 29,312, ,326,278 (9,300) ,316, ,545,805 (9,300) ,536, ,945,000 (5,972) 250,000-18,189, ,880,000 (6,209) 485,000-20,358, ,810,000 (6,445) 710,000-22,513, ,170,000 (5,548) 3,510,000-24,674, ,860,000 (4,256) 3,860,000-26,715, ,729,000 (4,298) 4,195,000-28,919, ,375,000 (4,403) 4,515,000-26,885,597 Governmental Activities Less: Amounts General Special Restricted Obligation Assessment Installment Capital Loans to Repaying Year Bonds Bonds Obligations Leases Payable Principal Total 2014 $ 29,329,373 $ - $ 2,667,042 $ - $ - $ (17,300) $ 31,979, ,326,278-3,084, (9,300) 18,401, ,545,805-3,479, (9,300) 20,015, ,945,000-3,857, (5,972) 21,796, ,880,000-4,221,434 8,491 - (6,209) 24,103, ,810,000-4,565,103 17,370 - (6,445) 26,386, ,170,000-4,132,535 25,642 - (5,548) 25,322, ,860,000-3,943,005 33,350 - (4,256) 26,832, ,729, , ,000 (4,298) 26,004, ,375,000 25, ,000-1,300,000 (4,403) 24,215,
223 Schedule 29 Unaudited Ratios of General Bonded Debt Outstanding and Total Outstanding Debt Last Ten Fiscal Years % of Actual % of Taxable Personal Value of Per Year Income Property Capita % 1.88% % 0.95% % 1.01% % 1.07% % 1.15% % 1.30% % 1.47% % 1.66% % 1.86% % 1.77% Business-type Activities Less: Amounts % of Actual General Restricted % of Taxable Obligation Revenue Capital to Repaying Personal Value of Per Year Bonds Bonds Leases Principal Total Income Property Capita 2014 $ - $ 9,718,581 $ 494,130 $ - $ 10,212, % 2.71% ,533, ,732-12,190, % 1.90% ,865, ,100-13,720, % 2.05% ,000 14,520,000 1,082,294-15,852, % 2.23% ,000 16,240,000 1,299,151-18,024, % 2.41% ,000 17,760,000 1,165,735-19,635, % 2.71% ,510,000 19,225,000 1,338,099-24,073, % 3.15% 1, ,860,000 20,650, ,544-25,484, % 3.50% 1, ,195,000 21,885,000 1,090,948-27,170, % 3.69% 1, ,515,000 23,085, ,586-28,448, % 3.77% 1, Source: City of Battle Creek Finance Department 215
224 Schedule 30 Unaudited Computation of Net Direct and Overlapping Debt As of June 30, 2014 Percentage Amount (1) Applicable to Applicable to Net Debt City of City of Outstanding Battle Creek Battle Creek Direct: City issued bonded debt (2) $ 29,329, % $ 29,329,373 Installment obligations 2,667, % 2,667,042 31,996,415 Overlapping: (3) Battle Creek Public Schools 58,435, % 44,907,298 Calhoun County 12,364, % 4,720,671 Climax-Scotts School District 4,250, % 170,451 Harper Creek School District 68,285, % 204,856 Kalamazoo RESA 16,400, % 9,840 Lakeview School District 43,315, % 43,315,000 Pennfield School District 36,309, % 1,416,076 Kellogg community College 9,725, % 3,712,033 98,456,223 Total direct and overlapping debt $ 130,452,638 (1) Excludes self-supporting debt. (2) Excludes discretely presented component unit. (3) The percentage of overlapping debt applicable is estimated using taxable assessed values. Applicable percentages were estimated by dividing the portion of the county's taxable assessed value that is within the City's boundaries and dividing it by the county's total taxable assessed value. Source: City of Battle Creek Finance Department and Municipal Advisory Council of Michigan. 216
225 Schedule 31 Unaudited Legal Debt Margin Last Ten Fiscal Years State Equalized Value - ad valorem property $ 1,457,597,246 State Equalized Value - tax abated property: Industrial Facilities 143,777,085 Neighborhood Enterprise Zone 96,372 Total State Equalized Value (SEV) $ 1,601,470,703 Legal debt limit (10% of SEV) $ 160,147,070 Outstanding debt subject to limitation $ 86,807,042 Less exempt obligations (5,685,000) 81,122,042 Legal debt margin $ 79,025,028 Debt subject to limitation as a percent of SEV 5.07% Total Net Debt Total Applicable Net Debt to Limit as a Debt Applicable Legal Percentage of Fiscal Year Limit to Limit Debt Margin Debt Limit 2014 $ 160,147,070 $ 81,122,042 $ 79,025, % ,265,186 86,884,761 80,380, % ,723,926 70,681, ,042, % ,892,843 77,051, ,841, % ,043,673 82,766, ,277, % ,711,128 84,202, ,508, % ,704,303 85,136, ,567, % ,362,764 88,015,790 93,346, % ,472,102 83,450,407 91,021, % ,861,776 82,015,000 72,846, % Source: City of Battle Creek Finance Department 217
226 Schedule 32 Unaudited Water and Wastewater System Revenue Bond Coverage Last Ten Fiscal Years Fiscal (1) (2) Net Revenue (3) Total Year Ended Gross Operating Available for Debt Service June 30, Revenue Expenses Debt Service Requirement Coverage 2014 $ 25,174,150 $ 16,432,935 $ 8,741,215 $ 2,265, ,197,436 15,601,499 8,595,937 2,265, ,225,329 15,793,089 7,432,240 2,455, ,058,232 15,480,363 7,577,869 2,283, ,800,246 15,078,231 6,722,015 2,287, ,017,923 15,555,502 4,462,421 2,283, ,423,713 15,358,388 4,065,325 2,290, ,815,313 14,712,942 4,102,371 2,140, ,438,691 14,533,605 2,905,086 2,139, ,128,410 14,075,713 4,052,697 2,039, (1) Includes operating and nonoperating revenue, as well as loss on disposal of assets. (2) Excludes depreciation expense. (3) Includes principal and interest on revenue bonds only. Source: City of Battle Creek Finance Department 218
227 Schedule 33 Unaudited Demographic and Economic Statistics Last Ten Fiscal Years (b) (b) Personal Income Per Capita (thousands Personal Unemployment Year Population of dollars) Income Rate 2014 (a) 51,848 $ 4,812,597 $ 35, % ,848 4,812,597 35, % ,900 4,812,597 35, % ,068 4,644,128 34, % ,347 4,518,817 33, % 2009 (a) 51,843 4,342,138 32, % 2008 (a) 52,154 4,231,549 31, % 2007 (a) 52,184 4,075,917 29, % 2006 (a) 52,525 3,931,003 28, % 2005 (a) 52,771 3,873,401 28, % (a) Reflects most recent data available. (b) Battle Creek MSA data. Sources: U.S. Census Bureau, U.S. Department of Commerce Michigan Department of Career Development Employment Service Agency Michigan Economic Development Corporation Source: City of Battle Creek Finance Department 219
228 Schedule 34 Unaudited Principal Employers Prior Year and Nine Years Ago % of Total City Employer Employees Rank Employment Kellogg Company 1, % Denso Manufacturing Michigan, Inc. 2, % Firekeepers Casino Bronson Battle Creek 1, % Veterans Administration Med Center 1, % Michigan Air National Guard Hart-Doyle-Inouye Federal Center 1, % Battle Creek Public Schools 1, % Kellogg Community College II Stanley Company, Inc % Kraft Foods, Post Division % Family Fare % Meijer Inc % 13, % 2005 continued 220
229 Schedule 34 Unaudited Principal Employers Prior Year and Nine Years Ago % of Total City Employer Employees Rank Employment Kellogg Company 2, % Denso Manufacturing Michigan, Inc. 2, % Firekeepers Casino 1, % Bronson Battle Creek 1, % Veterans Administration Med Center 1, % Michigan Air National Guard 1, % Hart-Doyle-Inouye Federal Center 1, % Battle Creek Public Schools 1, % Kellogg Community College % II Stanley Company, Inc % Kraft Foods, Post Division Family Fare Meijer Inc , % 2014 concluded. Source: City of Battle Creek Finance Department Note: Current year information not available. This schedule will be updated every other year. 221
230 Schedule 35 Unaudited Full-Time Equivalent Employees by Function/Program Last Ten Fiscal Years Function/Program General Fund and Special Revenue Funds Administration Community development Finance Police department Fire department Public works Parks and recreation Enterprise Funds W.K. Kellogg airport Battle Creek transit system Sewer and wastewater plant Water Internal Service Funds Information systems Equipment center Self insurance Reproduction and stores Total continued 222
231 Schedule 35 Unaudited Full-Time Equivalent Employees by Function/Program Last Ten Fiscal Years Function/Program General Fund and Special Revenue Funds Administration Community development Finance Police department Fire department Public works Parks and recreation Enterprise Funds W.K. Kellogg airport Battle Creek transit system Sewer and wastewater plant Water Internal Service Funds Information systems Equipment center Self insurance Reproduction and stores Total Source: City of Battle Creek Finance Department concluded. 223
232 Schedule 36 Unaudited Operating Indicators by Function/Program Last Eight Fiscal Years Function/Program Public Safety Police Number of incidents 55,366 50,458 47,045 45,346 Number of crash reports 2,308 1,992 2,231 1,423 Fire Number of incidents 5,538 5,752 5,061 4,686 Number of medical calls 3,709 3,971 2,620 1,337 Number of structural fires Public Works Major street miles maintained Local street miles maintained Culture & Recreation Participation: Softball 1,671 1,893 2,004 1,943 Soccer Baseball 2,328 1,167 3,938 1,615 Basketball Floor hockey 1, Football Tennis Volleyball Other 1,365 2, Aquatic center participation 138, ,000 63,441 19,007 Rounds of golf 48,000 49,100 49,000 47,000 Parks maintained Number of linear park trail miles Building Permits Commercial and Industrial Number of permits Dollar value $ 16,336,269 $ 21,868,619 $ 44,855,746 $ 74,785,330 Residential Number of permits Dollar value $ 24,074,807 $ 19,095,837 $ 7,467,058 $ 3,148,829 Totals Number of permits Dollar value $ 40,411,076 $ 40,964,456 $ 52,322,804 $ 77,934,159 continued 224
233 Schedule 36 Unaudited Operating Indicators by Function/Program Last Eight Fiscal Years Function/Program Public Safety Police Number of incidents 50,210 58,529 58,741 56,276 44,599 Number of crash reports 1,781 1,755 1,703 1,802 2,004 Fire Number of incidents 5,341 5,701 5,258 6,071 6,441 Number of medical calls 3,453 2,547 3,800 3,958 4,149 Number of structural fires Public Works Major street miles maintained Local street miles maintained Culture & Recreation Participation: Softball 1,686 1,711 1, Soccer Baseball 1,214 2,003 2,097 1,242 1,019 Basketball Floor hockey Football Tennis Volleyball Other 879 1, Aquatic center participation 20,357 23,003 28,321 23,217 24,796 Rounds of golf 51,000 48,350 49,583 43,016 40,935 Parks maintained Number of linear park trail miles Building Permits Commercial and Industrial Number of permits Dollar value $ 77,741,692 $ 17,807,968 $ 25,353,933 $ 23,102,086 $ 12,174,483 Residential Number of permits Dollar value $ 3,366,900 $ 6,052,107 $ 7,566,696 $ 7,342,332 $ 9,863,788 Totals Number of permits ,190 1, Dollar value $ 81,108,592 $ 23,860,075 $ 32,920,629 $ 30,444,418 $ 22,038,271 Source: City of Battle Creek Finance Department concluded. 225
234 Schedule 37 Unaudited Capital Asset Statistics by Function/Program Last Eight Fiscal Years Function/Program Police - vehicle patrol units Police patrol Detective Other SIU Fire Fire vehicle units: Trucks Engines Other Fire stations Administrative facilities Parks and Recreation Parks: Parkland acreage 1,200 1,028 1,200 1,036 Natural area acreage Picnic areas Buildings: Log cabins Recreation center Fishing structures Pavilions Concession Swimming beach areas Golf course - 27 holes Trails: Nature Multi-use Playgrounds Water areas: Water parks Spray play feature Public Works Major street miles maintained Local street miles maintained Vehicles: Dump trucks Heavy equipment Other continued 226
235 Schedule 37 Unaudited Capital Asset Statistics by Function/Program Last Eight Fiscal Years Function/Program Police - vehicle patrol units Police patrol Detective Other SIU Fire Fire vehicle units: Trucks Engines Other Fire stations Administrative facilities Parks and Recreation Parks: Parkland acreage 1,036 1,036 1,036 1,036 1,036 Natural area acreage Picnic areas Buildings: Log cabins Recreation center Fishing structures Pavilions Concession Swimming beach areas Golf course - 27 holes Trails: Nature Multi-use Playgrounds Water areas: Water parks Spray play feature Public Works Major street miles maintained Local street miles maintained Vehicles: Dump trucks Heavy equipment Other Source: City of Battle Creek Finance Department concluded. 227
236 Schedule 38 Unaudited Schedule of Insurance As of June 30, 2014 Type of Coverage Policy Name of Company Expiration Date Premium Description Airport Liability 7/1/15 $12,864 $50,000,000 CSL each occ.; ded. $1,000 per occ./$10,000 agg., $50,000,000 per aircraft/occ Hangar $250,000 fire damage - any one fire Keepers liability. Terrorism declined. Auto Liability 6/25/15 N/A Self-insured for 1st $1 million(pip SIR is (Except Buses) equal to MCCA threshold, Increased to $500, ), must renew certification with Assigned Claims Fund each year, by June 25th. Auto Physical 7/1/15 Included in Stated amount coverage on all but transit Damage Property Insurance vehicles, with over-the-road physical damage (except Buses) deductible of $50,000 on buses, fire trucks except $100,000 on two largest fire trucks, and $25,000 on all other vehicles. Deductibles are on per occurrence basis. Boiler & 7/1/15 Included in $100,000,000 Property limit, subject to Machinery Property Insurance $25,000 per occ. ded. Crime Coverage 7/1/15 $5,498 Employee dishonesty $1,000,000 per loss, $1,514 Treasurer's with $10,000 ded.; Bond forgery $50,000 with $500 ded., blanket limits, $500,000 on Treasurer. Data Processing 7/1/15 Included in Blanket coverage for equipment on Equipment Property Insurance premises, blanket coverage for data/media and extra expense coverage, subject to ded. on mechanical breakdown and other perils. Emergency Care 7/1/15 $4,499 including $1,000,000/claim/general aggregate Services (First surplus lines tax, $250 deductible each claim - excludes terrorism Responder Prof. policy fee Liability) Employee N/A N/A See Excess Liability, for losses above Benefits Liability $1,000,000 SIR. continued 228
237 Schedule 38 Unaudited Schedule of Insurance As of June 30, 2014 Type of Coverage Policy Name of Company Expiration Date Premium Description Employment N/A N/A See Excess Liability, for losses above Practices $1,000,000 SIR. Liability Insurance Excess Liability 10/1/15 $90,051 $5,000,000 each occ. and/or wrongful act (first layer) $5,000,000 aggregate limit for Personal Inj, Products/Completed Operations and Public Officials E&O combined. Subject to $1,000,000 per occ/wrongful act, and $2,500,000 Annual Aggregate SIR. Terrorism rejected. Does not apply to Airport Liability. Excess of all primary limits, subject to SIR on any self-insured primary exposures. Excess Liability 10/1/15 $92,240 $5,000,000 excess of Clatlin's (2nd layer) (including surplus $5,000,000 layer. Does not apply to Transit lines taxes & fees, Operations. broker's fee) Garage Liab. (Ambulance Repairs) no longer applicable Inland Marine 7/1/15 Included in Property Coverage on fine arts, contractors Insurance equipment(acv), communications equipment, including dispatch equipment and towers. Liquor Liability 3/8/15 $500 $1,000,000 each common cause/annual Binder Park Golf (including surplus aggregate limit. No deductible. lines tax, fees) Note: License in name of Cereal City Development Corporation. (excludes Terrorism) Police Professional N/A N/A See Excess Liability, for losses above Liability $1 million SIR. continued 229
238 Schedule 38 Unaudited Schedule of Insurance As of June 30, 2014 Type of Coverage Policy Name of Company Expiration Date Premium Description Property Insurance 7/1/15 $188,659 All Risk coverage on real property, personal $14,000 Broker Fee property, business interruption, extra expense, earthquake & flood, and vehicle physical damage, with $200,000,000 per occ loss limit on real property, $50,000,000 limit on flood and earthquake, with other special sublimits. $50,000,000 E&O limit. $100,000,000 terrorism coverage included. $40,000 basic All Perils deductible added pollution coverage $500,000 and CYBER $2,000,000. Pollution Liability N/A N/A Note: Finance department files for selfinsured authority with State, for UST liability. $500,000 aggregate Public Officials N/A N/A See Excess Liability, for losses above $1 million SIR. Transit 7/1/15 Included in Property Stated amount coverage on all transit (Physical Damage) Insurance vehicles, with over-the-road physical damage deductibles of $10,000 on handi-vans, $50,000 on large busses. Deductible on per-occurrence basis. Transit N/A Primary Policy non- Note: See 1st Layer of excess coverage (Liability) renewed ($5 million) for losses excess of $1 million (PIP excess of $375,000) SIR. 2nd Layer of excess does not apply to Transit. Warehouse N/A No longer applicable; None (Liability) BCTIFA owns Worker's Comp. 6/30/15 N/A Note: If requested by W.C. Bureau, must (Primary) update self-insured certification by July 1st. Also, must notify if any changes in excess coverage, or TPA. continued 230
239 Schedule 38 Unaudited Schedule of Insurance As of June 30, 2014 Type of Coverage Policy Name of Company Expiration Date Premium Description Worker's Comp. 7/1/15 $40,955 Statutory limit, $1,000,000 (Excess) Employers Liability, Specific Excess subject to $600,000 per accident or disease. No agg. limit on S.I.R. per year. Liquor Liability N/A N/A None - See separate policy for Binder Park Except Binder Park concluded. 231
240 This page intentionally left blank. 232
241 City of Battle Creek, Michigan Year Ended June 30, 2014 Single Audit Act Compliance
242 Table of Contents Page Independent Auditors Report on the Schedule of Expenditures of Federal Awards Required by OMB Circular A Schedule of Expenditures of Federal Awards Notes to Schedule of Expenditures of Federal Awards 2 4 Independent Auditors Report on Internal Control over Financial Reporting and on Compliance and Other Matters Based on an Audit of Financial Statements Performed in Accordance with Government Auditing Standards 6 Independent Auditors Report on Compliance for Each Major Federal Program and on Internal Control Over Compliance Required by OMB Circular A Schedule of Findings and Questioned Costs Summary Schedule of Prior Audit Findings 10 12
243 Rehmann Robson 675 Robinson Rd. Jackson, MI Ph: Fx: rehmann.com INDEPENDENT AUDITORS REPORT ON THE SCHEDULE OF EXPENDITURES OF FEDERAL AWARDS REQUIRED BY OMB CIRCULAR A-133 December 18, 2014 Honorable Mayor and Members of the City Commission City of Battle Creek, Michigan We have audited the financial statements of the governmental activities, the business-type activities, the aggregate discretely presented component units, each major fund, and the aggregate remaining fund information of the City of Battle Creek, Michigan (the "City") as of and for the year ended June 30, 2014, and the related notes to the financial statements, which collectively comprise the City s basic financial statements. We issued our report thereon dated December 18, 2014, which contained unmodified opinions on those financial statements. Our audit was conducted for the purpose of forming opinions on the financial statements that collectively comprise the basic financial statements. The accompanying schedule of expenditures of federal awards is presented for purposes of additional analysis as required by OMB Circular A-133 and is not a required part of the basic financial statements. Such information is the responsibility of management and was derived from and relates directly to the underlying accounting and other records used to prepare the basic financial statements. The information has been subjected to the auditing procedures applied in the audit of the basic financial statements and certain additional procedures, including comparing and reconciling such information directly to the underlying accounting and other records used to prepare the basic financial statements or to the basic financial statements themselves, and other additional procedures in accordance with auditing standards generally accepted in the United States of America. In our opinion, the schedule of expenditure of federal awards is fairly stated in all material respects in relation to the basic financial statements as a whole. Rehmann is an independent member of Nexia International. CPAs & Consultants Wealth Advisors Corporate Investigators 1
244 Schedule of Expenditures of Federal Awards For the Year Ended June 30, 2014 CFDA Passed Pass-through / Federal Federal Agency / Cluster / Program Title Number Through Grantor Number Expenditures U.S. Department of Housing and Urban Development Community Development Block Grant/Entitlement Grant: Community Development Block Grant 2012/ Direct B-12-MC $ 324,590 Community Development Block Grant 2013/ Direct B-13-MC ,940 1,090,530 Home Investment Partnership: Program year 2011/ Direct M-11-MC (7,717) Program year 2012/ Direct M-12-MC ,672 Program year 2013/ Direct M-13-MC , ,919 ARRA - Neighborhood Stabilization Program Grant MSHDA NS (1,968) Public and Indian Housing Drug Elimination BCHC -n/a- 90,403 Total U.S. Department of Housing and Urban Development 1,517,884 U.S. Department of Justice Bulletproof Vest Grant Program: Program year Direct -n/a- 5,330 Edward Byrne Memorial Justice Assistance Grant Cluster: 2010 Justice Assistance Grant Direct 2010-DJ-BX , Justice Assistance Grant Direct 2011-DJ-BX , Justice Assistance Grant Direct 2012-DJ-BX , ,054 Project Safe Neighborhood GVSU 2011-GP-BX ,475 Total U.S. Department of Justice 123,859 U.S. Department of Transportation ARRA - Capital Direct MI-96-X ,373 Operating Direct MI-90-X ,026,861 1,067,234 continued 2
245 Schedule of Expenditures of Federal Awards For the Year Ended June 30, 2014 CFDA Passed Pass-through / Federal Federal Agency / Cluster / Program Title Number Through Grantor Number Expenditures U.S. Department of Transportation (Concluded) 2013 Section 5316 Job Access and Reverse Commute Program MDOT MI-37-X $ 57, Section 5316 Job Access and Reverse Commute Program MDOT MI-37-X , ,746 Total U.S. Department of Transportation 1,219,980 U.S. Environmental Protection Agency Capitalization Grants for Drinking Water State Revolving Funds Program year 2012/ MDEQ -n/a- 7,427 Program year 2013/ MDEQ -n/a- 24,425 31,852 ARRA - Brownfields Assessment Direct BF-00E ,959 ARRA - Brownfields RLF Grant Direct BF-00E ,322 78,281 Total U.S. Environmental Protection Agency 110,133 U.S. Department of Homeland Security Emergency Management Performance: Program year 2009/ MSP EMW-2010-EP ,824 Program year 2010/ MSP EMW-2011-EP ,619 Program year 2011/ MSP EMW-2012-EP ,910 Program year 2012/ MSP EMW-2013-EP S01 8,355 Program year 2013/ MSP EMW-2014-EP S01 29,670 63, Homeland Security Grant Program - SHSP MSP -n/a- 16, Homeland Security Grant Program - SHSP MSP -n/a- 19,364 35,964 Total U.S. Department of Homeland Security 99,342 Total expenditures of federal awards $ 3,071,198 concluded. See notes to schedule of expenditures of federal awards. 3
246 Notes to Schedule of Expenditures of Federal Awards 1. BASIS OF PRESENTATION The accompanying schedule of expenditures of federal awards (the Schedule ) includes the federal grant activity of the City of Battle Creek, Michigan under programs of the federal government for the year ended June 30, The information in this Schedule is presented in accordance with the requirements of the Office of Management and Budget (OMB) Circular A-133, Audits of States, Local Governments, and Non-Profit Organizations. Because the Schedule presents only a selected portion of the operations of the City of Battle Creek, Michigan, it is not intended to and does not present the financial position, changes in net position or cash flows of the City of Battle Creek, Michigan. The City s reporting entity is defined in Note 1 of the City s comprehensive annual financial report. 2. SUMMARY OF SIGNIFICANT ACCOUNTING POLICIES Expenditures reported on the Schedule are reported on the accrual and modified accrual basis of accounting based on fund type, which is described in Note 1 to the financial statements. Such expenditures are recognized following the cost principles contained in OMB Circular A-87, Cost Principles for State, Local, and Indian Tribal Governments, wherein certain types of expenditures are not allowable or are limited as to reimbursement. Negative amounts shown on the Schedule represent adjustments or credits made in the normal course of business to amounts reported as expenditures in prior years. Passthrough entity identifying numbers are presented where available. 3. PASS-THROUGH AGENCIES The City receives certain federal grants as subawards from non-federal entities. Pass-through entities, where applicable, have been identified in the Schedule with an abbreviation, defined as follows: Pass-through Agency Abbreviation BCHC GVSU MDOT MDEQ MSHDA MSP Pass-through Agency Name Battle Creek Housing Commission Grand Valley State University Michigan Department of Transportation Michigan Department of Environmental Quality Michigan State Housing Development Authority Michigan State Police 4
247 Notes to Schedule of Expenditures of Federal Awards 4. SUBRECIPIENTS The City administers certain federal awards programs through subrecipients. Those subrecipients are not considered part of the City's reporting entity. Of the federal expenditures presented in the Schedule, the City provided federal awards to subrecipients as follows: Program Title CFDA Number Amount Provided to Subrecipients HOME Investment Partnership Program $ 151,669 Edward Byrne Memorial Justice Assistance Program ,968 $ 170,637 5
248 Rehmann Robson 675 Robinson Rd. Jackson, MI Ph: Fx: rehmann.com INDEPENDENT AUDITORS' REPORT ON INTERNAL CONTROL OVER FINANCIAL REPORTING AND ON COMPLIANCE AND OTHER MATTERS BASED ON AN AUDIT OF FINANCIAL STATEMENTS PERFORMED IN ACCORDANCE WITH GOVERNMENT AUDITING STANDARDS Honorable Mayor and Members of the City Commission City of Battle Creek, Michigan December 18, 2014 We have audited, in accordance with the auditing standards generally accepted in the United States of America and the standards applicable to financial audits contained in Government Auditing Standards issued by the Comptroller General of the United States, the financial statements of the governmental activities, the business-type activities, the aggregate discretely presented component units, each major fund, and the aggregate remaining fund information of the City of Battle Creek, Michigan (the City ) as of and for the year ended June 30, 2014, and the related notes to the financial statements, which collectively comprise the City's basic financial statements, and have issued our report thereon dated December 18, Internal Control Over Financial Reporting In planning and performing our audit of the financial statements, we considered the City s internal control over financial reporting (internal control) to determine the audit procedures that are appropriate in the circumstances for the purpose of expressing our opinions on the financial statements, but not for the purpose of expressing an opinion on the effectiveness of the City s internal control. Accordingly, we do not express an opinion on the effectiveness of the City s internal control. A deficiency in internal control exists when the design or operation of a control does not allow management or employees, in the normal course of performing their assigned functions, to prevent, or detect and correct misstatements on a timely basis. A material weakness is a deficiency, or a combination of deficiencies, in internal control such that there is a reasonable possibility that a material misstatement of the entity s financial statements will not be prevented, or detected and corrected on a timely basis. A significant deficiency is a deficiency, or a combination of deficiencies, in internal control that is less severe than a material weakness, yet important enough to merit attention by those charged with governance. Our consideration of internal control was for the limited purpose described in the first paragraph of this section and was not designed to identify all deficiencies in internal control that might be material weaknesses or significant deficiencies. Given these limitations, during our audit we did not identify any deficiencies in internal control that we consider to be material weaknesses. However, material weaknesses may exist that have not been identified. Rehmann is an independent member of Nexia International. CPAs & Consultants Wealth Advisors Corporate Investigators 6
249 Compliance and Other Matters As part of obtaining reasonable assurance about whether the City s financial statements are free from material misstatement, we performed tests of its compliance with certain provisions of laws, regulations, contracts, and grant agreements, noncompliance with which could have a direct and material effect on the determination of financial statement amounts. However, providing an opinion on compliance with those provisions was not an objective of our audit, and accordingly, we do not express such an opinion. The results of our tests disclosed no instances of noncompliance or other matters that are required to be reported under Government Auditing Standards. Purpose of this Report The purpose of this report is solely to describe the scope of our testing of internal control and compliance and the results of that testing, and not to provide an opinion on the effectiveness of the City s internal control or on compliance. This report is an integral part of an audit performed in accordance with Government Auditing Standards in considering the entity s internal control and compliance. Accordingly, this communication is not suitable for any other purpose. 7
250 Rehmann Robson 675 Robinson Rd. Jackson, MI Ph: Fx: rehmann.com INDEPENDENT AUDITORS REPORT ON COMPLIANCE FOR EACH MAJOR FEDERAL PROGRAM AND ON INTERNAL CONTROL OVER COMPLIANCE REQUIRED BY OMB CIRCULAR A-133 Honorable Mayor and Members of the City Commission City of Battle Creek, Michigan December 18, 2014 Report on Compliance for Each Major Federal Program We have audited the compliance of the City of Battle Creek, Michigan (the City ) with the types of compliance requirements described in the OMB Circular A-133 Compliance Supplement that could have a direct and material effect on each of the City's major federal programs for the year ended June 30, The City s major federal programs are identified in the summary of auditor s results section of the accompanying schedule of findings and questioned costs. Management's Responsibility Management is responsible for compliance with the requirements of laws, regulations, contracts, and grants applicable to its federal programs. Independent Auditors' Responsibility Our responsibility is to express an opinion on compliance for each of the City s major federal programs based on our audit of the types of compliance requirements referred to above. We conducted our audit of compliance in accordance with auditing standards generally accepted in the United States of America; the standards applicable to financial audits contained in Government Auditing Standards issued by the Comptroller General of the United States; and OMB Circular A-133, Audits of States, Local Governments, and Non-Profit Organizations. Those standards and OMB Circular A-133 require that we plan and perform the audit to obtain reasonable assurance about whether noncompliance with the types of compliance requirements referred to above that could have a direct and material effect on a major federal program occurred. An audit includes examining, on a test basis, evidence about the City s compliance with those requirements and performing such other procedures as we considered necessary in the circumstances. We believe that our audit provides a reasonable basis for our opinion on compliance for each major federal program. However, our audit does not provide a legal determination of the City's compliance. Opinion on Each Major Federal Program In our opinion, the City complied, in all material respects, with the types of compliance requirements referred to above that could have a direct and material effect on each of its major federal programs for the year ended June 30, Rehmann is an independent member of Nexia International. CPAs & Consultants Wealth Advisors Corporate Investigators 8
251 Report on Internal Control Over Compliance Management of the City is responsible for establishing and maintaining effective internal control over compliance with the types of compliance requirements referred to above. In planning and performing our audit of compliance, we considered the City s internal control over compliance with the types of requirements that could have a direct and material effect on each major federal program to determine the auditing procedures that are appropriate in the circumstances for the purpose of expressing an opinion on compliance for each major federal program and to test and report on internal control over compliance in accordance with OMB Circular A-133, but not for the purpose of expressing an opinion on the effectiveness of internal control over compliance. Accordingly, we do not express an opinion on the effectiveness of the City s internal control over compliance. A deficiency in internal control over compliance exists when the design or operation of a control over compliance does not allow management or employees, in the normal course of performing their assigned functions, to prevent, or detect and correct, noncompliance with a type of compliance requirement of a federal program on a timely basis. A material weakness in internal control over compliance is a deficiency, or combination of deficiencies, in internal control over compliance, such that there is a reasonable possibility that material noncompliance with a type of compliance requirement of a federal program will not be prevented, or detected and corrected, on a timely basis. A significant deficiency in internal control over compliance is a deficiency, or a combination of deficiencies, in internal control over compliance with a type of compliance requirement of a federal program that is less severe that a material weakness in internal control over compliance, yet important enough to merit attention by those charged with governance. Our consideration of internal control over compliance was for the limited purpose described in the first paragraph of this section and was not designed to identify all deficiencies in internal control over compliance that might be material weaknesses or significant deficiencies. We did not identify any deficiencies in internal control over compliance that we consider to be material weaknesses. However, material weaknesses may exist that have not been identified. Purpose of this Report The purpose of this report on internal control over compliance is solely to describe the scope of our testing of internal control over compliance and the results of that testing based on the requirements of OMB Circular A-133. Accordingly, this report is not suitable for any other purpose. 9
252 Schedule of Findings and Questioned Costs For the Year Ended June 30, 2014 SECTION I - SUMMARY OF AUDITORS RESULTS Financial Statements Type of auditors report issued: Unmodified Internal control over financial reporting: Material weakness(es) identified? Significant deficiency(ies) identified? Noncompliance material to financial statements noted? yes X no yes X none reported yes X no Federal Awards Internal control over major programs: Material weakness(es) identified? Significant deficiency(ies) identified? Type of auditors report issued on compliance for major programs: Any audit findings disclosed that are required to be reported in accordance with Circular A-133, Section 510(a)? yes X no yes X none reported See opinion for each major program below yes X no Identification of major programs: CFDA Number Name of Federal Program or Cluster Opinion Community Development Block Grant/Entitlement Grant ARRA - Federal Transit Formula Grants Unmodified Unmodified Dollar threshold used to distinguish between Type A and Type B programs: Auditee qualified as low-risk auditee? $ 300,000 yes X no 10
253 Schedule of Findings and Questioned Costs For the Year Ended June 30, 2014 SECTION II FINANCIAL STATEMENT FINDINGS None reported. SECTION III FEDERAL AWARD FINDINGS AND QUESTIONED COSTS None reported. 11
254 Summary Schedule of Prior Audit Findings For the Year Ended June 30, 2014 No matters were reported. 12
255 Rehmann Robson 675 Robinson Rd. Jackson, MI Ph: Fx: rehmann.com INDEPENDENT AUDITORS COMMUNICATION WITH THOSE CHARGED WITH GOVERNANCE December 18, 2014 To the City Commission of the City of Battle Creek, Michigan We have audited the financial statements of the governmental activities, the business-type activities, the aggregate discretely presented component units, each major fund, and the aggregate remaining fund information of the City of Battle Creek, Michigan (the City ) as of and for the year ended June 30, 2014, and have issued our report thereon dated December 18, Professional standards require that we advise you of the following matters relating to our audit. Our Responsibility in Relation to the Financial Statement Audit As communicated in our engagement letter dated July 2, 2014, our responsibility, as described by professional standards, is to form and express opinions about whether the financial statements that have been prepared by management with your oversight are fairly presented, in all material respects, in conformity with accounting principles generally accepted in the United States of America. Our audit of the financial statements does not relieve you or management of your respective responsibilities. Our responsibility, as prescribed by professional standards, is to plan and perform our audit to obtain reasonable, rather than absolute, assurance about whether the financial statements are free of material misstatement. An audit of financial statements includes consideration of internal control over financial reporting as a basis for designing audit procedures that are appropriate in the circumstances, but not for the purpose of expressing an opinion on the effectiveness of the entity s internal control over financial reporting. Accordingly, as part of our audit, we considered the internal control of the City solely for the purpose of determining our audit procedures and not to provide any assurance concerning such internal control. We are also responsible for communicating significant matters related to the audit that are, in our professional judgment, relevant to your responsibilities in overseeing the financial reporting process. However, we are not required to design procedures for the purpose of identifying other matters to communicate to you. We have provided our findings regarding internal control over financial reporting and compliance noted during our audit in a separate letter to you dated December 18, In addition, we noted certain other matters which are included in Attachment A to this letter. Planned Scope and Timing of the Audit We performed the audit according to the planned scope and timing previously communicated to you in our engagement letter and in our meeting about planning matters on October 8, Compliance with All Ethics Requirements Regarding Independence The engagement team, others in our firm, as appropriate, and our firm has complied with all relevant ethical requirements regarding independence. Rehmann is an independent member of Nexia International. CPAs & Consultants Wealth Advisors Corporate Investigators 1
256 Page 2 Qualitative Aspects of the City s Significant Accounting Practices Significant Accounting Policies Management has the responsibility to select and use appropriate accounting policies. A summary of the significant accounting policies adopted by the City included in Note 1 to the financial statements. For the fiscal year ending June 30, 2014, the City implemented Statement of Governmental Accounting Standards (GASB Statement) No. 67, Financial Reporting for Pension Plans. This standard had no impact on beginning equity of the City, but provided for expanded disclosures on the City's pension plans in the footnotes and required supplemental information. No matters have come to our attention that would require us, under professional standards, to inform you about (1) the methods used to account for significant unusual transactions and (2) the effect of significant accounting policies in controversial or emerging areas for which there is a lack of authoritative guidance or consensus. Significant Accounting Estimates Accounting estimates are an integral part of the financial statements prepared by management and are based on management s current judgments. Those judgments are normally based on knowledge and experience about past and current events and assumptions about future events. Certain accounting estimates are particularly sensitive because of their significance to the financial statements and because of the possibility that future events affecting them may differ markedly from management s current judgments. The most sensitive accounting estimates affecting the financial statements were: Management s estimate of the useful lives of depreciable capital assets is based on the length of time it is believed that those assets will provide some economic benefit in the future. Management s estimate of the original cost and accumulated depreciation of infrastructure capital assets. Management s estimate of the accrued compensated absences is based on current hourly rates and policies regarding payment of sick and vacation banks. Management s estimate of the collectability of receivables (excluding those receivables for which the City has the right to levy a lien against the applicable property owner). Management s estimate of the liability for uninsured risks of loss, including incurred but not reported claims, which are accounted for in the City s self-insurance internal service fund. We relied upon the work of the City s third-party administrator and internal risk manager for the estimated liabilities on reported claims and the work of the City s internal risk manager for the calculation of the estimated liabilities for incurred but not reported claims based on GASB Statement No. 10, as amended by GASB Statement No. 30 and Interpretation No. 4. The assumptions used in the actuarial valuations of the pension and other postemployment benefits plans are based on historical trends and industry standards.
257 We evaluated the key factors and assumptions used to develop these estimates and determined that they are reasonable in relation to the basic financial statements taken as a whole and in relation to the applicable opinion units. Significant Difficulties Encountered During the Audit We encountered no significant difficulties in dealing with management relating to the performance of the audit. Uncorrected and Corrected Misstatements For purposes of this communication, professional standards require us to accumulate all known and likely misstatements identified during the audit, other than those that we believe are trivial, and communicate them to the appropriate level of management. Further, professional standards require us to also communicate the effect of uncorrected misstatements related to prior periods on the relevant classes of transactions, account balances or disclosures, and the financial statements as a whole and each applicable opinion unit. In addition, professional standards require us to communicate to you all material, corrected misstatements that were brought to the attention of management as a result of our audit procedures. We did not identify any misstatements during our audit. Disagreements with Management For purposes of this letter, professional standards define a disagreement with management as a matter, whether or not resolved to our satisfaction, concerning a financial accounting, reporting, or auditing matter, which could be significant to the City s financial statements or the auditors report. No such disagreements arose during the course of the audit. Representations Requested from Management We have requested certain written representations from management, which are included in Attachment C to this letter. Management s Consultations with Other Accountants In some cases, management may decide to consult with other accountants about auditing and accounting matters. Management informed us that, and to our knowledge, there were no consultations with other accountants regarding auditing and accounting matters. Other Significant Matters, Findings, or Issues In the normal course of our professional association with the City, we generally discuss a variety of matters, including the application of accounting principles and auditing standards, operating and regulatory conditions affecting the entity, and operational plans and strategies that may affect the risks of material misstatement. None of the matters discussed resulted in a condition to our retention as the City s auditors. Other Information in Documents Containing Audited Financial Statements Our responsibility for the supplementary information accompanying the financial statements, as described by professional standards, is to evaluate the presentation of the supplementary information in relation to the financial statements as a whole and to report on whether the supplementary information is fairly stated, in all material respects, in relation to the financial statements as a whole. We made certain inquiries of management and evaluated the form, content, and methods of preparing Page 3
258 the information to determine that the information complies with accounting principles generally accepted in the United States of America, the method of preparing it has not changed from the prior period, and the information is appropriate and complete in relation to our audit of the financial statements. We compared and reconciled the supplementary information to the underlying accounting records used to prepare the financial statements or to the financial statements themselves. Upcoming Changes in Accounting Standards Generally accepted accounting principles (GAAP) are continually changing in order to promote the usability and enhance the applicability of information included in external financial reporting. While it would not be practical to include an in-depth discussion of every upcoming change in professional standards, Attachment B to this letter contains a brief overview of recent pronouncements of the Governmental Accounting Standards Board (GASB) and their related effective dates. Management is responsible for reviewing these standards, determining their applicability, and implementing them in future accounting periods. This information is intended solely for the use of the governing body and management of the City of Battle Creek, Michigan and is not intended to be and should not be used by anyone other than these specified parties. Very truly yours, Page 4
259 Attachment A - Comments and Recommendations For the June 30, 2014 Audit During our audit, we became aware of certain other matters that are opportunities for strengthening internal control and/or improving operating efficiency. This memorandum summarizes our comments and recommendations regarding those matters. Our consideration of the City's internal control over financial reporting is described in our report, dated December 18, 2014, issued in accordance with Government Auditing Standards. This memorandum does not affect that report or our report dated December 18, 2014, on the financial statements of the City of Battle Creek, Michigan. Community Development Payroll During testing of proper approval and support for time worked in the community development department we noted that time cards prepared by supervisors or department heads do not contain an indication of review, as indicated by initials or signature. It was noted that these time cards are reviewed by the payroll department at the time they are entered into the payroll software although they are not reviewed by another individual from the community development department. We recommend all time worked be reviewed by a knowledgeable employee as indicated on the time cards with initial or signature of the individual whom performed the review. We also noted that the employees' percentage of time is allocated to the various grants based on predetermined percentages set-up in the New World payroll module. The department supervisors performs a quarterly analysis to compare the actual time worked per the employee tracking forms to the predetermined percentage. He noted that percentages are adjusted as necessary. We did however note that if a percentage is reasonable that there is no true-up done to bring the amount charged to the grant to actual. We recommend that at least quarterly actual hours charged to the grants are agreed to the predetermined percentages and a true-up is performed to reflect actual time worked is charged to the programs. A1
260 Attachment B Upcoming Changes in Accounting Standards For the June 30, 2014 Audit The following pronouncements of the Governmental Accounting Standards Board (GASB) have been released recently and may be applicable to the City in the near future. We encourage management to review the following information and determine which standard(s) may be applicable to the City. For the complete text of these and other GASB standards, visit and click on the pronouncements tab. If you have questions regarding the applicability, timing, or implementation approach for any of these standards, please contact your audit team. GASB 68 Accounting and Financial Reporting for Pensions Effective 06/15/2015 (your FY 2015) This standard establishes new requirements for governments to report a net pension liability for the unfunded portion of its pension plan. Governments that maintain their own pension plans (either single employer or agent multiple-employer) will report a liability for the difference between the total pension liability calculated and the amount held in the pension trust fund. Governments that participate in a cost sharing plan will report a liability for their proportionate share of the net pension liability of the entire system. Historically, governments have only been required to report a net pension obligation to the extent that they have not met the annual required contribution (ARC) in any given year. Upon implementation of this standard, governments will be required to report a net pension liability based on the current funded status of their pension plans. This liability would be limited to the government-wide financial statements and proprietary funds. Changes in this liability from year to year will largely be reflected on the income statement, though certain amounts will be deferred and amortized over varying periods. GASB 68 also requires more extensive note disclosures and required supplementary information, including 10 years of historical information. The methods used to determine the discount rate (the assumed rate of return on plan assets held in trust) are mandated and must be disclosed, along with what the impact would be on the net pension liability if that rate changed by 1% in either direction. Other new disclosure requirements include details of the changes in the components of the net pension liability, comparisons of actual employer contributions to actuarially determined contributions, and ratios to put the net pension liability in context. For single-employer and agent multiple-employer plans, the information for these statements will come from the annual actuarial valuation. For cost sharing plans, this information will be derived from the financial reports of the plan itself, multiplied by the government s proportionate share of plan. GASB 68 is only applicable to pension plans. However, the GASB has announced its intent to issue similar standards for other postemployment benefits (e.g., retiree healthcare) on a two year delay from these standards. B1
261 Attachment B Upcoming Changes in Accounting Standards For the June 30, 2014 Audit GASB 69 Government Combinations and Disposals of Government Operations Effective 12/15/2014 (your FY 2015) This standard provides detailed requirements for the accounting and disclosure of various types of government combinations, such as mergers, acquisitions, and transfers of operations. The guidance available previously was limited to nongovernmental entities, and therefore did not provide practical examples for situations common in government-specific combinations and disposals. The accounting and disclosure requirements for these events vary based on whether a significant payment is made, the continuation or termination of services, and the legal structure of the new or continuing entity. Given the infrequent nature of these types of events, we do not expect this standard to have any impact on the City at this time. GASB 71 Pension Transition for Contributions Made Subsequent to the Measurement Date Effective with the Implementation of GASB 68 This standard is an amendment to GASB 68, and seeks to clarify certain implementation issues related to amounts that are deferred and amortized at the time GASB 68 is first adopted. It applies to situations in which the measurement date of an actuarial valuation differs from the government's fiscal year. 2 CFR 200 Uniform Guidance for Federal Awards Cost Principles Effective 12/26/2014; Single Audit Requirements Effective 12/26/2015 (your FY 2016) The Office of Management and Budget (OMB) has consolidated seven separate circulars (including administrative requirements, cost principles, and audit requirements) into a single federal regulation. The new Uniform Guidance covers all aspects of federal grants from pre-award through the single audit. While much of the guidance was simply reorganized and recodified, there were also several substantive changes to the single audit thresholds. A single audit will now only be required if total expenditures of federal awards exceed $750,000 (up from $500,000). The OMB has indicated that further changes to the single audit will be announced in In addition, the Uniform Guidance now explicitly requires grant recipients to have sound internal controls that are consistent with the COSO framework and documented procedures for grant administration. Rehmann is available to assist grant recipients in developing/documenting these policies and procedures in compliance with the new requirements. B2
262 Attachment C Management Representations For the June 30, 2014 Audit Following are the written representations that we requested from management. C1
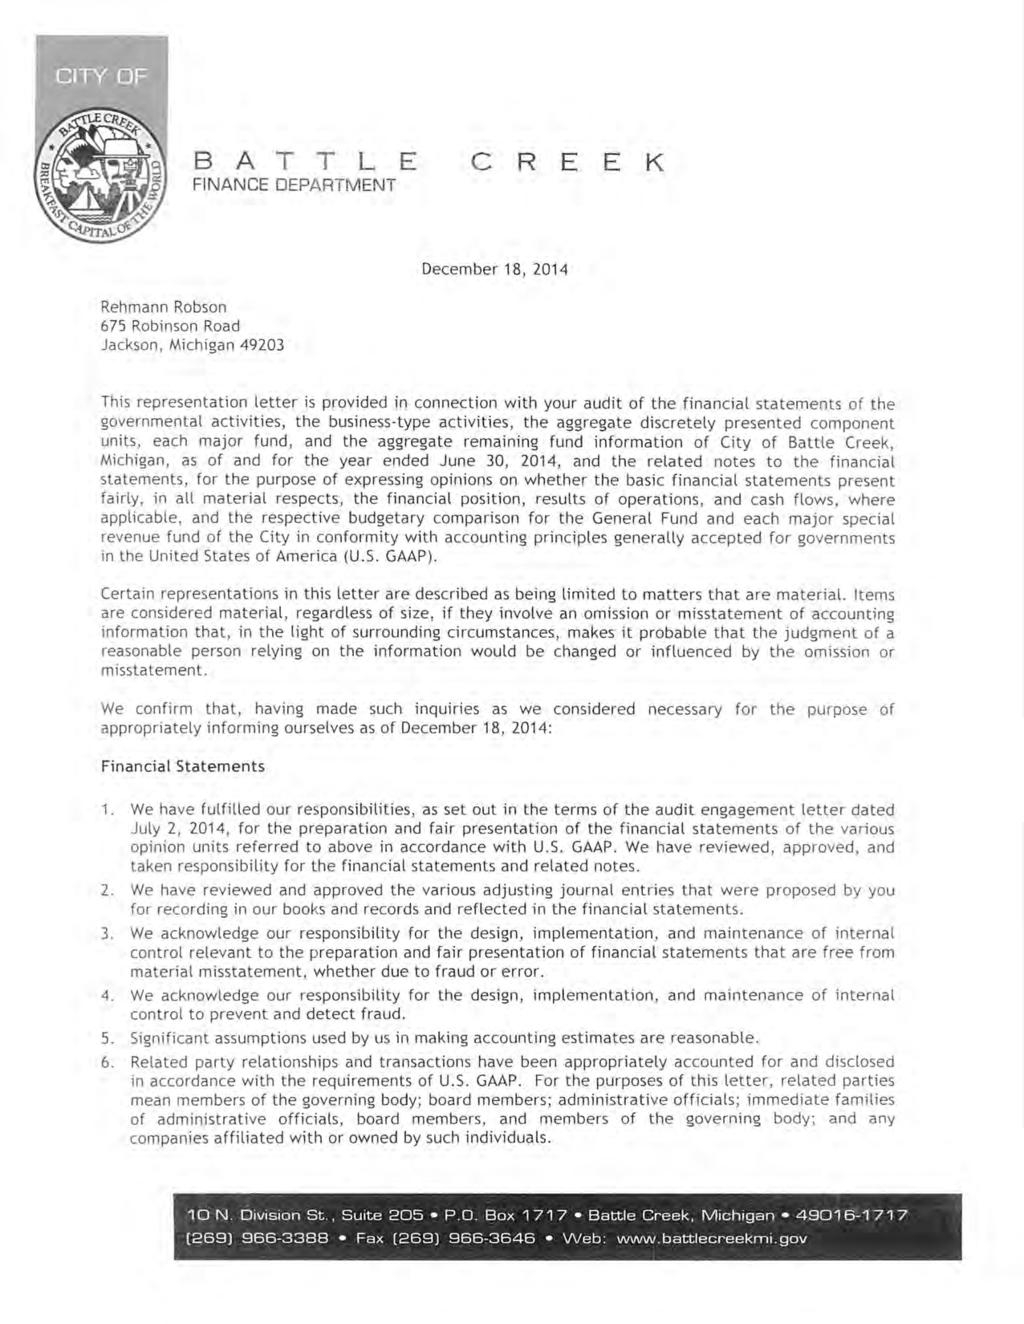
263
264
265
266
267
CITY OF HOWELL, MICHIGAN
 COMPREHENSIVE ANNUAL FINANCIAL REPORT For the Fiscal Year Ended June 30, 2017 Prepared by: Finance Department This page intentionally left blank. Table of Contents INTRODUCTORY SECTION Page Letter of Transmittal
CITY OF LAKE ELMO, MINNESOTA COMPREHENSIVE ANNUAL FINANCIAL REPORT FOR THE FISCAL YEAR ENDED DECEMBER 31, 2017
 COMPREHENSIVE ANNUAL FINANCIAL REPORT FOR THE FISCAL YEAR ENDED DECEMBER 31, 2017 PREPARED BY: FINANCE DEPARTMENT CITY OF LAKE ELMO, MINNESOTA FINANCIAL STATEMENTS For the Fiscal Year Ended December 31,
CITY OF INKSTER, MICHIGAN. Year Ended June 30, Financial Statements and Single Audit Compliance Act
 CITY OF INKSTER, MICHIGAN Year Ended June 30, 2016 Financial Statements and Single Audit Compliance Act This page intentionally left blank. Table of Contents Independent Auditors Report 1 Management s
COMPREHENSIVE ANNUAL FINANCIAL REPORT CITY OF ORMOND BEACH, FLORIDA FISCAL YEAR ENDED SEPTEMBER 30, 2018
 City of Ormond Beach Florida Photo by Sam West Comprehensive Annual Financial Report Fiscal Year Ended September 30, 2018 COMPREHENSIVE ANNUAL FINANCIAL REPORT FISCAL YEAR ENDED Prepared by: Finance Department
CITY OF LAKE ELMO, MINNESOTA COMPREHENSIVE ANNUAL FINANCIAL REPORT FOR THE FISCAL YEAR ENDED DECEMBER 31, 2016
 COMPREHENSIVE ANNUAL FINANCIAL REPORT FOR THE FISCAL YEAR ENDED DECEMBER 31, 2016 PREPARED BY: FINANCE DEPARTMENT CITY OF LAKE ELMO, MINNESOTA FINANCIAL STATEMENTS For the Fiscal Year Ended December 31,
City of Grand Ledge. FINANCIAL STATEMENTS (With Required Supplementary Information) June 30, 2018
 June 30, 2018") FINANCIAL STATEMENTS (With Required Supplementary Information) TABLE OF CONTENTS Page INDEPENDENT AUDITOR S REPORT MANAGEMENT S DISCUSSION AND ANALYSIS i-iii iv-x BASIC FINANCIAL STATEMENTS Government-wide
FINANCIAL STATEMENTS (With Required Supplementary Information) TABLE OF CONTENTS Page INDEPENDENT AUDITOR S REPORT MANAGEMENT S DISCUSSION AND ANALYSIS i-iii iv-x BASIC FINANCIAL STATEMENTS Government-wide
YEO & YEO CPAs & BUSINESS CONSULTANTS
 , Michigan Comprehensive Annual Financial Report For the Year Ended June 30, 2017 YEO & YEO CPAs & BUSINESS CONSULTANTS Comprehensive Annual Financial Report County of Washtenaw State of Michigan Fiscal
SALEM CITY CORPORATION FINANCIAL STATEMENTS
 FINANCIAL STATEMENTS FOR THE YEAR ENDED JUNE 30, 2017 Allred Jackson, PC 50 East 2500 North, Suite 200 North Logan, UT 84341 (P) 435.752.6441 (F) 435.752.6451 www.allredjackson.com ii Table of Contents
ROBINSON, FARMER, COX ASSOCIATES
 ROBINSON, FARMER, COX ASSOCIATES A PROFESSIONAL LIMITED LIABILITY COMPANY CERTIFIED PUBLIC ACCOUNTANTS Independent Auditors Report To the Honorable Members of the City Council City of Manassas, Virginia
SALEM CITY CORPORATION FINANCIAL STATEMENTS
 FINANCIAL STATEMENTS FOR THE YEAR ENDED JUNE 30, 2014 TABLE OF CONTENTS Introductory Section: Page Letter of transmittal 3 Financial Section: Independent Auditors Report 7 Management Discussion and Analysis
City of Bentonville, Arkansas
 Comprehensive Annual Financial Report For the Year Ended December 31, 2016 Prepared by: Denise Land Finance Director Jake Harper Assistant Finance Director Visit our web site at: www.bentonvillear.com
SALEM CITY CORPORATION FINANCIAL STATEMENTS
 FINANCIAL STATEMENTS FOR THE YEAR ENDED JUNE 30, 2016 ii Table of Contents Introductory Section Page Letter of transmittal... 3 Financial Section Independent Auditors Report... 7 Management Discussion
Comprehensive Annual Financial Report. Fiscal Year Ended June 30, 2017
 Comprehensive Annual Financial Report Fiscal Year Ended June 30, 2017 CITY OF COVINGTON, GEORGIA COMPREHENSIVE ANNUAL FINANCIAL REPORT FOR THE FISCAL YEAR ENDED JUNE 30, 2017 Prepared by: Randy Smith,
City of Healdsburg. Comprehensive Annual Financial Report Year Ended June 30, Healdsburg Ridge.
 City of Healdsburg California Healdsburg Ridge Comprehensive Annual Financial Report Year Ended June 30, 2011 www.cityofhealdsburg.org CITY OF HEALDSBURG ADMINISTRATION 401 Grove Street Healdsburg,
City of North Chicago, Illinois
 Annual Financial Report Year Ended April 30, 2015 Annual Financial Report Table of Contents For the Year Ended April 30, 2015 Page INDEPENDENT AUDITORS' REPORT 1-3 MANAGEMENT'S DISCUSSION AND ANALYSIS
Comprehensive Annual Financial Report
 Comprehensive Annual Financial Report Cambrian Commons, Rosemount - Built in 2016 For the Year Ended June 30, 2016 Dakota County Community Development Agency A component unit of Dakota County, Minnesota
FINAL DRAFT 05/30/2018 Page 1 of 195. County of Barry, Michigan. Annual Financial Report. Year Ended December 31, 2017
 Page 1 of 195 County of Barry, Michigan Year Ended December 31, 2017 Annual Financial Report Page 2 of 195 Table of Contents Independent Auditors Report 1 Management s Discussion and Analysis 5 Basic Financial
CITY OF EAST GRAND RAPIDS, MICHIGAN FINANCIAL STATEMENTS FOR THE YEAR ENDED JUNE
 , MICHIGAN FINANCIAL STATEMENTS Vredeveld Haefner LLC TABLE OF CONTENTS FINANCIAL SECTION PAGE Independent Auditors Report 1-2 Management s Discussion and Analysis 3-8 Basic Financial Statements Government-wide
CITY OF ATWATER, CALIFORNIA ANNUAL FINANCIAL REPORT FOR THE FISCAL YEAR ENDED JUNE 30, 2016
 CITY OF ATWATER, CALIFORNIA ANNUAL FINANCIAL REPORT FOR THE FISCAL YEAR ENDED JUNE 30, 2016 Prepared by: Finance Department This page intentionally left blank. Basic Financial Statements Table of Contents
City of Murphy, Texas
 Comprehensive Annual Financial Report Fiscal Year Ended September 30, 2018 Prepared by: Finance Department This Page Left Intentionally Blank Comprehensive Annual Financial Report For the Fiscal Year Ended
City of Clinton, Iowa. Financial and Compliance Report Year Ended June 30, 2014
 Financial and Compliance Report Year Ended June 30, 2014 Table of Contents Introductory Section Table of contents City officials Organizational chart i ii iii iv Financial Section Independent auditor
CITY OF CARSON CITY, MICHIGAN
 , MICHIGAN FINANCIAL STATEMENTS Vredeveld Haefner LLC CPAs and Consultants TABLE OF CONTENTS FINANCIAL SECTION PAGE Independent Auditors Report 1-2 Management s Discussion and Analysis 3-8 Basic Financial
CITY OF DEERFIELD BEACH, FLORIDA
 COMPREHENSIVE ANNUAL FINANCIAL REPORT FOR THE FISCAL YEAR ENDED SEPTEMBER 30, 2014 Prepared by the Department of Financial Services Director of Finance, Hugh B. Dunkley Assistant Director of Finance, Sophia
CITY OF BOYNE CITY CHARLEVIOX COUNTY, MICHIGAN ANNUAL FINANCIAL REPORT YEAR ENDED APRIL 30, 2014
 CITY OF BOYNE CITY CHARLEVIOX COUNTY, MICHIGAN ANNUAL FINANCIAL REPORT YEAR ENDED APRIL 30, 2014 TABLE OF CONTENTS INDEPENDENT AUDITOR'S REPORT 1 MANAGEMENT S DISCUSSION AND ANALYSIS 4 BASIC FINANCIAL
CITY OF ECORSE, MICHIGAN. Year Ended June 30, Financial Statements
 Year Ended June 30, 2015 Financial Statements This page intentionally left blank. Table of Contents Financial Section Page Independent Auditors Report 1 Management s Discussion and Analysis 6 Basic Financial
CITY OF NEDERLAND, TEXAS. Comprehensive Annual Financial Report
 Comprehensive Annual Financial Report For the Year Ended September 30, 2014 Prepared by the Finance Department INTRODUCTORY SECTION Comprehensive Annual Financial Report September 30, 2014 Table of Contents
COMPREHENSIVE ANNUAL FINANCIAL REPORT EST. 1872
 COMPREHENSIVE ANNUAL FINANCIAL REPORT ENNIS TEXAS EST. 1872 City of Ennis, Texas Fiscal Year Ended September 30, 2013 COMPREHENSIVE ANNUAL FINANCIAL REPORT Year Ended September 30, 2013 Issued By Department
CITY OF CHEYENNE FINANCIAL & COMPLIANCE REPORT
 CITY OF CHEYENNE FINANCIAL & COMPLIANCE REPORT Cheyenne, Wyoming Year Ended Prepared by City Treasurer s Office This page is intentionally left blank 2 City of Cheyenne Financial and Compliance Report
City of North Chicago, Illinois
 Annual Financial Report Year Ended Annual Financial Report Table of Contents For the Year Ended Page INDEPENDENT AUDITORS' REPORT 1-3 MANAGEMENT'S DISCUSSION AND ANALYSIS (UNAUDITED) 4-13 BASIC FINANCIAL
City of Merced, California
 For the Fiscal Year Ended June 30, 2015 Basic Financial Statements, California Merced, California Annual Financial Report For the year ended June 30, 2015 This page intentionally left blank Annual Financial
Prepared by Department of Finance
 COMPREHENSIVE ANNUAL FINANCIAL REPORT Year Ended September 30, 2016 Prepared by Department of Finance THIS PAGE INTENTIONALLY LEFT BLANK COMPREHENSIVE ANNUAL FINANCIAL REPORT TABLE OF CONTENTS Year Ended
CITY OF MINNETRISTA, MINNESOTA COMPREHENSIVE ANNUAL FINANCIAL REPORT YEAR ENDED DECEMBER 31, 2013
 , MINNESOTA COMPREHENSIVE ANNUAL FINANCIAL REPORT YEAR ENDED DECEMBER 31, 2013 PREPARED BY THE FINANCE DEPARTMENT OF THE CITY OF MINNETRISTA, MINNESOTA BRIAN GRIMM DIRECTOR OF FINANCE TABLE OF CONTENTS
City of North Chicago, Illinois
 Annual Financial Report Year Ended Annual Financial Report Table of Contents For the Year Ended Page INDEPENDENT AUDITORS' REPORT 1-3 MANAGEMENT'S DISCUSSION AND ANALYSIS (UNAUDITED) 4-12 BASIC FINANCIAL
TOWN OF MEDLEY, FLORIDA Financial Section, Required Supplementary Information, Combining Fund Statements, and Supplementary Financial Reports
 TOWN OF MEDLEY, FLORIDA Financial Section, Required Supplementary Information, Combining Fund Statements, and Supplementary Financial Reports Compliance Section With Independent Auditors Report TABLE OF
City of Moorhead, Minnesota. Comprehensive Annual Financial Report. For The Year Ended December 31,
 City of Moorhead, Minnesota Comprehensive Annual Financial Report For The Year Ended December 31, 2009 www.cityofmoorhead.com This page intentionally left blank COMPREHENSIVE ANNUAL FINANCIAL REPORT OF
CITY OF CHARLESTON, ILLINOIS. FINANCIAL STATEMENTS For the Year Ended April 30, 2015
 FINANCIAL STATEMENTS For the Year Ended April 30, 2015 TABLE OF CONTENTS Page No. INDEPENDENT AUDITOR'S REPORT... 1 INDEPENDENT AUDITOR'S REPORT ON INTERNAL CONTROL OVER FINANCIAL REPORTING AND ON COMPLIANCE
Celebrating 25 Years of Excellence
 Celebrating 25 Years of Excellence Comprehensive Annual Financial Report Fiscal Year Ended June 30, 2017 Chino Hills, California , CALIFORNIA COMPREHENSIVE ANNUAL FINANCIAL REPORT FISCAL YEAR ENDED JUNE
CITY OF ST. PAUL PARK FINANCIAL STATEMENTS FOR THE FISCAL YEAR ENDED DECEMBER 31, 2014
 FINANCIAL STATEMENTS FOR THE FISCAL YEAR ENDED DECEMBER 31, 2014 FINANCIAL STATEMENTS For the Fiscal Year Ended December 31, 2014 TABLE OF CONTENTS INTRODUCTORY SECTION Elected and Appointed Officials
CITY OF MINNETRISTA, MINNESOTA COMPREHENSIVE ANNUAL FINANCIAL REPORT YEAR ENDED DECEMBER 31, 2016
 , MINNESOTA COMPREHENSIVE ANNUAL FINANCIAL REPORT YEAR ENDED DECEMBER 31, 2016 PREPARED BY THE FINANCE DEPARTMENT OF THE CITY OF MINNETRISTA, MINNESOTA BRIAN GRIMM DIRECTOR OF FINANCE TABLE OF CONTENTS
CITY OF HEALDSBURG HEALDSBURG, CALIFORNIA COMPREHENSIVE ANNUAL FINANCIAL REPORT WITH REPORT ON AUDIT BY INDEPENDENT CERTIFIED PUBLIC ACCOUNTANTS
 HEALDSBURG, CALIFORNIA COMPREHENSIVE ANNUAL FINANCIAL REPORT WITH REPORT ON AUDIT BY INDEPENDENT CERTIFIED PUBLIC ACCOUNTANTS FISCAL YEAR ENDED JUNE 30, 2008 Prepared by the Finance Department COMPREHENSIVE
NASSAU COUNTY, FLORIDA
 NASSAU COUNTY, FLORIDA COMPREHENSIVE ANNUAL FINANCIAL REPORT FOR THE FISCAL YEAR ENDED SEPTEMBER 30, 2017 PREPARED BY: John A. Crawford CLERK OF THE CIRCUIT COURT/COMPTROLLER Table of Contents INTRODUCTORY
City of Ocoee, Florida COMPREHENSIVE ANNUAL FINANCIAL REPORT. For The Year Ended September 30, 2016
 City of Ocoee, Florida COMPREHENSIVE ANNUAL FINANCIAL REPORT For The Year Ended September 30, 2016 Prepared by: City of Ocoee Finance Department This page intentionally left blank. INTRODUCTORY SECTION
TOWN OF MEDLEY, FLORIDA Financial Section, Required Supplementary Information, Combining Fund Statements, and Supplementary Financial Reports
 TOWN OF MEDLEY, FLORIDA Financial Section, Required Supplementary Information, Combining Fund Statements, and Supplementary Financial Reports Compliance Section With Independent Auditors Report TABLE OF
City of Park Rapids Hubbard County, Minnesota. Financial Statements. December 31, 2016
 Hubbard County, Minnesota Financial Statements December 31, 2016 Table of Contents Elected Officials and Administration 1 Independent Auditor's Report 2 Management's Discussion and Analysis 5 Basic Financial
City of Tombstone, Arizona Financial Statements. Year Ended June 30, 2016
 City of Tombstone, Arizona Financial Statements Year Ended June 30, 2016 CONTENTS Page INDEPENDENT AUDITOR S REPORT 1 MANAGEMENT S DISCUSSION AND ANALYSIS (MD&A) (Required Supplementary Information) 5
Borough of East Stroudsburg East Stroudsburg, Pennsylvania Monroe County. Financial Statements Year Ended December 31, 2015
 Borough of East Stroudsburg East Stroudsburg, Pennsylvania Monroe County Financial Statements Year Ended CONTENTS INDEPENDENT AUDITOR'S REPORT 1 MANAGEMENT S DISCUSSION AND ANALYSIS 3 BASIC FINANCIAL STATEMENTS
City of Grayling, Michigan
 BASIC FINANCIAL STATEMENTS June 30, 2016 CITY OF GRAYLING, MICHIGAN ORGANIZATION MEMBERS OF THE CITY COUNCIL MAYOR MAYOR PRO TEM COUNCILPERSON COUNCILPERSON COUNCILPERSON KARL SCHREINER HEIDI FARMER KARL
State of New Mexico City of Hobbs. Annual Financial Report For the Year Ended June 30, 2016
 State of New Mexico Annual Financial Report For the Year Ended June 30, 2016 (This page intentionally left blank.) 2 INTRODUCTORY SECTION 3 STATE OF NEW MEXICO Annual Financial Report June 30, 2016 Table
City of Sachse, Texas As Prepared by The Finance Department
 COMPREHENSIVE ANNUAL FINANCIAL REPORT Fiscal Year Ended September 30, 2017 City of Sachse, Texas As Prepared by The Finance Department Sachse is a tranquil community welcoming the future while offering
SPRINGVILLE CITY CORPORATION. Financial Statements and Independent Auditors Report. Year Ended June 30, 2017
 Financial Statements and Independent Auditors Report Year Ended June 30, 2017 Financial Statements and Independent Auditors Report Year Ended June 30, 2017 Table of Contents Page FINANCIAL SECTION Report
INDEPENDENT AUDITOR S REPORT
 INDEPENDENT AUDITOR S REPORT To the Honorable Members of City Council City of Manassas, Virginia We have audited the accompanying financial statements of the governmental activities, the business-type
Eaton County, Michigan. Year Ended September 30, Financial Statements and Single Audit Act Compliance
 Eaton County, Michigan Year Ended September 30, 2017 Financial Statements and Single Audit Act Compliance Table of Contents Introductory Section 1 Letter of Transmittal 3 Organizational Chart 5 Principal
BUCKEYE ELEMENTARY SCHOOL DISTRICT NO. 33
 BUCKEYE ELEMENTARY SCHOOL DISTRICT NO. 33 Comprehensive Annual Financial Report Fiscal Year Ended June 30, 2016 25555 West Durango Street Buckeye, Arizona 85326 BUCKEYE, ARIZONA COMPREHENSIVE ANNUAL FINANCIAL
The following document was not prepared by the Office of the State Auditor, but was prepared by and submitted to the Office of the State Auditor by a
 The following document was not prepared by the Office of the State Auditor, but was prepared by and submitted to the Office of the State Auditor by a private CPA firm. The document was placed on this web
HEBER-OVERGAARD UNIFIED SCHOOL DISTRICT NO. 6
 HEBER-OVERGAARD UNIFIED SCHOOL DISTRICT NO. 6 Comprehensive Annual Financial Report Fiscal Year Ended June 30, 2012 3375 Buckskin Canyon Road P.O. Box 547 Heber, Arizona 85928 HEBER, ARIZONA COMPREHENSIVE
CHARTER TOWNSHIP OF YPSILANTI Washtenaw County, Michigan AUDITED FINANCIAL REPORT. For the Fiscal Year Ended December 31, 2014
 Washtenaw County, Michigan AUDITED FINANCIAL REPORT For the Fiscal Year Ended December 31, 2014 PSLZ LLP Certified Public Accountants For the Year Ended December 31, 2014 Table of Contents INTRODUCTORY
Washington State Auditor Troy Kelley
 Washington State Auditor Troy Kelley INDEPENDENT AUDITOR S REPORT July 17, 2014 Board of Commissioners Kitsap County Port Orchard, Washington REPORT ON FINANCIAL STATEMENTS We have audited the accompanying
GOGEBIC COUNTY ANNUAL FINANCIAL REPORT YEAR ENDED DECEMBER 31, 2013
 GOGEBIC COUNTY ANNUAL FINANCIAL REPORT YEAR ENDED DECEMBER 31, 2013 TABLE OF CONTENTS INDEPENDENT AUDITOR'S REPORT 1 MANAGEMENT S DISCUSSION AND ANALYSIS 4 BASIC FINANCIAL STATEMENTS Government-wide Financial
City of Rittman, Ohio
 City of Rittman, Ohio Comprehensive Annual Financial Report For the Year Ended December 31, 2013 Members of Council and Management City of Rittman 30 North Main Street Rittman, Ohio 44270 We have reviewed
CITY FLORIDA REPORT COUNCIL (MARCH 2017) LITA MANAGER BMC R 30, 2016 MIKE BRADY NC.
 LITA MANAGER BMC R 30, 2016 MIKE BRADY NC.") CITY OF DEBARY, FLORIDA ANNUAL FINANCIAL REPORT FOR THE FISCAL YEAR ENDED SEPTEMBER R 30, 2016 CITY COUNCIL (MARCH 2017) BOB GARCIA, MAYOR LITA HANDY-PETERS, VICE MAYOR STEPHEN BACON ERIKA BENFIELD MIKE
CITY OF DEBARY, FLORIDA ANNUAL FINANCIAL REPORT FOR THE FISCAL YEAR ENDED SEPTEMBER R 30, 2016 CITY COUNCIL (MARCH 2017) BOB GARCIA, MAYOR LITA HANDY-PETERS, VICE MAYOR STEPHEN BACON ERIKA BENFIELD MIKE
CITY OF LOCKHART, TEXAS
 CITY OF LOCKHART, TEXAS ANNUAL FINANCIAL REPORT For the fiscal year ended September 30, 2017 CITY OF LOCKHART, TEXAS ANNUAL FINANCIAL REPORT For the year ended September 30, 2017 FINANCIAL SECTION Independent
Comprehensive Annual Financial Report. For the Year Ended December 31, 2013 City of Waconia, Minnesota
 Comprehensive Annual Financial Report For the Year Ended December 31, 2013 City of Waconia, Minnesota COMPREHENSIVE ANNUAL FINANCIAL REPORT OF THE CITY OF WACONIA, MINNESOTA FOR THE YEAR ENDED DECEMBER
INDEPENDENT AUDITORS' REPORT
 FINANCIAL SECTION This section contains the following subsections: INDEPENDENT AUDITORS REPORT MANAGEMENT S DISCUSSION AND ANALYSIS BASIC FINANCIAL STATEMENTS REQUIRED SUPPLEMENTARY INFORMATION OTHER SUPPLEMENTARY
TOWN OF NEWPORT NORTH CAROLINA ANNUAL FINANCIAL REPORT
 TOWN OF NEWPORT NORTH CAROLINA ANNUAL FINANCIAL REPORT MAYOR Dennis Barber MAYOR PRO-TEM David Heath TOWN COUNCIL MEMBERS Chuck Shinn Jim McCoy Mark Eadie Danny Fornes TOWN MANAGER Angela Christian FINANCE
TOWN OF NEW SHOREHAM, RHODE ISLAND FINANCIAL STATEMENTS YEAR ENDED JUNE 30, 2015
 FINANCIAL STATEMENTS YEAR ENDED JUNE 30, 2015 Hague, Sahady & Co., Certified Public Accountants P.C. Committed to Excellence Table of Contents Independent Auditors' Report... 1 Management s Discussion
CITY OF PAHOKEE, FLORIDA FINANCIAL STATEMENTS WITH INDEPENDENT AUDITOR S REPORT THEREON
 FINANCIAL STATEMENTS WITH INDEPENDENT AUDITOR S REPORT THEREON FISCAL YEAR ENDED SEPTEMBER 30, 2014 FINANCIAL STATEMENTS SEPTEMBER 30, 2014 TABLE OF CONTENTS Pages FINANCIAL SECTION Independent Auditor
TOWN OF NEW SHOREHAM, RHODE ISLAND FINANCIAL STATEMENTS YEAR ENDED JUNE 30, 2016
 FINANCIAL STATEMENTS YEAR ENDED JUNE 30, 2016 Hague, Sahady & Co., Certified Public Accountants P.C. Committed to Excellence Table of Contents Independent Auditors' Report... 1 Management s Discussion
CITY OF COMPTON STATE OF CALIFORNIA. Comprehensive Annual Financial Report. Fiscal Year Ended June 30, 2009
 STATE OF CALIFORNIA Comprehensive Annual Financial Report Fiscal Year Ended Comprehensive Annual Financial Report Table of Contents Page(s) Independent Auditor s Report... 1 Management s Discussion and
CITY OF HIALEAH, FLORIDA COMPREHENSIVE ANNUAL FINANCIAL REPORT FISCAL YEAR ENDED SEPTEMBER 30, 2017
 COMPREHENSIVE ANNUAL FINANCIAL REPORT FISCAL YEAR ENDED SEPTEMBER 30, 2017 Prepared by: Finance Department TABLE OF CONTENTS PAGE I. INTRODUCTORY SECTION (UNAUDITED) Letter of Transmittal i-iv Certificate
City of Le Sueur Le Sueur County, Minnesota. Financial Statements. December 31, 2015
 Le Sueur County, Minnesota Financial Statements December 31, 2015 Table of Contents Page Elected Officials and Administration 1 Independent Auditor's Report 3 Management's Discussion and Analysis 7 Basic
Comprehensive Annual Financial Report
 City of Brentwood, Missouri Comprehensive Annual Financial Report For the year ended December 31, 2014 Brentwood City Hall 2348 South Brentwood Boulevard Brentwood, Missouri 63144 brentwoodmo.org COMPREHENSIVE
CITY OF ST. PAUL PARK FINANCIAL STATEMENTS FOR THE FISCAL YEAR ENDED DECEMBER 31, 2012
 FINANCIAL STATEMENTS FOR THE FISCAL YEAR ENDED DECEMBER 31, 2012 FINANCIAL STATEMENTS For the Fiscal Year Ended December 31, 2012 TABLE OF CONTENTS INTRODUCTORY SECTION Elected and Appointed Officials
City of St. Joseph Berrien County, Michigan FINANCIAL STATEMENTS. June 30, 2015
 Berrien County, Michigan FINANCIAL STATEMENTS TABLE OF CONTENTS Page INDEPENDENT AUDITOR S REPORT MANAGEMENT S DISCUSSION AND ANALYSIS i-iii iv-x BASIC FINANCIAL STATEMENTS Government-wide Financial Statements
Eaton County, Michigan. Year Ended September 30, Financial Statements and Single Audit Act Compliance
 Eaton County, Michigan Year Ended September 30, 2016 Financial Statements and Single Audit Act Compliance Table of Contents Introductory Section 1 Letter of Transmittal 3 Organizational Chart 5 Principal
City of Palmer, Alaska
 Basic Financial Statements, Required Supplementary Information, Supplementary Information, and Single Audit Reports Year Ended December 31, 2015 DeLena Johnson Mayor Nathan Wallace City Manager Prepared
Eaton County, Michigan. Year Ended September 30, Financial Statements and Single Audit Act Compliance
 Eaton County, Michigan Year Ended September 30, 2014 Financial Statements and Single Audit Act Compliance Table of Contents Introductory Section 1 Letter of Transmittal 3 Organizational Chart 5 Principal
Township of Cranberry
 Township of Cranberry Financial Statements and Required Supplementary and Supplementary Information Year Ended December 31, 2013 with Independent Auditor s Report TABLE OF CONTENTS Independent Auditor's
TOWN OF NEW SHOREHAM, RHODE ISLAND REPORTING PACKAGE JUNE 30, 2014
 REPORTING PACKAGE JUNE 30, 2014 REPORTING PACKAGE JUNE 30, 2014 TABLE OF CONTENTS Section I: Annual Financial Report Section II: Single Audit Report Section III: Current Year Findings and Questioned Costs
City of Sioux Center, Iowa
 City of Sioux Center, Iowa growingebright Annual Financial Report for the fiscal year ended June 30, 2015 Prepared by: Finance Department Darryl Ten Pas, Finance Director CITY OF SIOUX CENTER, IOWA COMPREHENSIVE
CITY OF COLEMAN, FLORIDA. Annual Financial Report. September 30, (With Independent Auditors' Report Thereon)
") Annual Financial Report September 30, 2018 (With Independent Auditors' Report Thereon) INTRODUCTORY SECTION This section contains the following subsections: List of City Council and Principal City Officials
Annual Financial Report September 30, 2018 (With Independent Auditors' Report Thereon) INTRODUCTORY SECTION This section contains the following subsections: List of City Council and Principal City Officials
CITY OF MINNETRISTA, MINNESOTA COMPREHENSIVE ANNUAL FINANCIAL REPORT YEAR ENDED DECEMBER 31, 2014
 , MINNESOTA COMPREHENSIVE ANNUAL FINANCIAL REPORT YEAR ENDED DECEMBER 31, 2014 PREPARED BY THE FINANCE DEPARTMENT OF THE, MINNESOTA BRIAN GRIMM DIRECTOR OF FINANCE TABLE OF CONTENTS YEAR ENDED DECEMBER
DUNN COUNTY, WISCONSIN FINANCIAL STATEMENTS AND SUPPLEMENTARY INFORMATION YEAR ENDED DECEMBER 31, 2015
 FINANCIAL STATEMENTS AND SUPPLEMENTARY INFORMATION YEAR ENDED TABLE OF CONTENTS YEAR ENDED INDEPENDENT AUDITORS' REPORT MANAGEMENT'S DISCUSSION AND ANALYSIS BASIC FINANCIAL STATEMENTS STATEMENT OF NET
SCHAUMBURG PARK DISTRICT, ILLINOIS COMPREHENSIVE ANNUAL FINANCIAL REPORT
 SCHAUMBURG PARK DISTRICT, ILLINOIS COMPREHENSIVE ANNUAL FINANCIAL REPORT FOR THE FISCAL YEAR ENDED MARCH 31, 2017 COMPREHENSIVE ANNUAL FINANCIAL REPORT FOR THE FISCAL YEAR ENDED MARCH 31, 2017 Prepared
City of Escanaba, Michigan. Fiscal Year Ended June 30, Financial Statements and Single Audit Act Compliance
 City of Escanaba, Michigan Fiscal Year Ended June 30, 2016 Financial Statements and Single Audit Act Compliance Table of Contents List of Elected and Appointed Officials 1 Independent Auditors Report 2-4
VILLAGE OF TEQUESTA, FLORIDA 2017 COMPREHENSIVE ANNUAL FINANCIAL REPORT
 2017 COMPREHENSIVE ANNUAL FINANCIAL REPORT FISCAL YEAR ENDED SEPTEMBER 30, 2017 VILLAGE OF TEQUESTA COUNCIL MEMBERS 2017 From left to right: Council Member Thomas Paterno, Council Member Vince Arena, Mayor
TOWN OF EAST GREENWICH ANNUAL FINANCIAL REPORT FOR THE FISCAL YEAR ENDED JUNE 30, 2017
 TOWN OF EAST GREENWICH ANNUAL FINANCIAL REPORT FOR THE FISCAL YEAR ENDED JUNE 30, 2017 Town Hall East Greenwich, Rhode Island Built in 1804 Gayle Corrigan Town Manager Linda Dykeman Finance Director Prepared
TOWN OF MIDDLEBOROUGH, MASSACHUSETTS
 BASIC FINANCIAL STATEMENTS AND MANAGEMENT S DISCUSSION AND ANALYSIS WITH INDEPENDENT AUDITORS REPORT FOR THE YEAR ENDED JUNE 30, 2013 BASIC FINANCIAL STATEMENTS AND MANAGEMENT S DISCUSSION AND ANALYSIS
City of Sioux Center, Iowa
 City of Sioux Center, Iowa Annual Financial Report for the fiscal year ended June 30, 2011 Prepared by: Finance Department Darryl Ten Pas, Finance Director CITY OF SIOUX CENTER, IOWA TABLE OF CONTENTS
CITY OF FORNEY, TEXAS
 CITY OF FORNEY, TEXAS COMPREHENSIVE ANNUAL FINANCIAL REPORT FISCAL YEAR ENDED SEPTEMBER 30, 2014 CITY MANAGER BRIAN BROOKS DIRECTOR OF ADMINISTRATIVE SERVICES LEIGH CORSON CITY OF FORNEY, TEXAS COMPREHENSIVE
Annual Financial Report
 Annual Financial Report City of Byron Byron, Minnesota For the Year Ended December 31, 2017 THIS PAGE IS LEFT BLANK INTENTIONALLY Annual Financial Report Table of Contents For the Year Ended December 31,
TOWN OF MEDLEY, FLORIDA FINANCIAL SECTION, REQUIRED SUPPLEMENTARY INFORMATION, COMBINING FUND STATEMENTS, AND SUPPLEMENTARY FINANCIAL REPORTS
 FINANCIAL SECTION, REQUIRED SUPPLEMENTARY INFORMATION, COMBINING FUND STATEMENTS, AND SUPPLEMENTARY FINANCIAL REPORTS COMPLIANCE SECTION Year Ended CONTENTS Independent Auditors Report 1 Financial Section:
CITY OF SEBASTIAN, FLORIDA
 COMPREHENSIVE ANNUAL FINANCIAL REPORT For the Year Ended September 30, 2018 CITY COUNCIL Jim Hill Mayor Linda Kinchen Vice-Mayor Ed Dodd Council Member Albert Iovino Council Member Bob McPartlan Council
TOOELE CITY CORPORATION. Financial Statements and Independent Auditor's Report. June 30, 2014
 Financial Statements and Independent Auditor's Report June 30, 2014 Table of Contents Page Independent Auditor's Report 1 Management's Discussion and Analysis 3 Basic Financial Statements: Government-Wide
CITY OF FRIENDSWOOD, TEXAS
 COMPREHENSIVE ANNUAL FINANCIAL REPORT YEAR ENDED SEPTEMBER 30, 2011 Officials Issuing Report: Roger C. Roecker City Manager Cindy S. Edge Director of Administrative Services COMPREHENSIVE ANNUAL FINANCIAL
COMPREHENSIVE ANNUAL FINANCIAL REPORT OF THE CITY OF CRYSTAL, MINNESOTA
 COMPREHENSIVE ANNUAL FINANCIAL REPORT OF THE CITY OF CRYSTAL, MINNESOTA For the Year Ended December 31, 2017 Prepared by Finance Department AEM Financial Solutions, Finance Director (THIS PAGE LEFT BLANK
TOWN OF ASHFORD, CONNECTICUT BASIC FINANCIAL STATEMENTS, SUPPLEMENTARY INFORMATION, AND INDEPENDENT AUDITOR S REPORT
 BASIC FINANCIAL STATEMENTS, SUPPLEMENTARY INFORMATION, AND INDEPENDENT AUDITOR S REPORT JUNE 30, 2014 Contents Page Independent Auditor s Report 1 Management s Discussion and Analysis (Unaudited) 3 Basic
TOWN OF BLACKSTONE, MASSACHUSETTS. Report on Examination of Basic Financial Statements and Additional Information Year Ended June 30, 2016
 TOWN OF BLACKSTONE, MASSACHUSETTS Report on Examination of Basic Financial Statements and Additional Information Year Ended June 30, 2016 Report on Internal Control Over Financial Reporting and On Compliance
BEDFORD TOWNSHIP Monroe County, Michigan
 BEDFORD TOWNSHIP Monroe County, Michigan FINANCIAL STATEMENTS For The Year Ended June 30, 2016 BEDFORD TOWNSHIP Monroe County, Michigan FINANCIAL STATEMENTS FOR THE YEAR ENDED JUNE 30, 2016 Bedford Township
COMPREHENSIVE ANNUAL FINANCIAL REPORT City of McGregor, Texas. Year ended September 30, 2015
 COMPREHENSIVE ANNUAL FINANCIAL REPORT City of McGregor, Texas Year ended September 30, 2015 This page is intentionally left blank. CITY OF MCGREGOR, TEXAS COMPREHENSIVE ANNUAL FINANCIAL REPORT FOR THE
CITY OF DRIGGS, IDAHO. Basic Financial Statements and Supplementary Information with Independent Auditors' Report
 Basic Financial Statements and Supplementary Information with Independent Auditors' Report September 30, 2017 Table of Contents September 30, 2017 Independent Auditors Report... 1-3 Management s Discussion