A Difficult Puzzle. Social Assistance Caseloads in the Great Depression and Three Major Post-war Recessions John Stapleton Open Policy May 3, 2012
|
|
|
- Deborah Ramsey
- 6 years ago
- Views:
Transcription

1 A Difficult Puzzle Social Assistance Caseloads in the Great Depression and Three Major Post-war Recessions John Stapleton Open Policy May 3, 2012
2 The Puzzle The Great Recession of is understood to be the largest and steepest economic downturn since the Great Depression It could be expected that social assistance caseloads would be highest during the Depression and in the recent downturn However, this is not the case A Difficult Puzzle 2
3 The Puzzle The total increase in percentage of population receiving social assistance starting in October 2008 (beginning of the recession) is one percentage point from 5.5% to 6.5% of Ontario's population This makes the Great Recession of roughly equal to the recession of in welfare caseload growth terms (4.5% to 5.2%). A Difficult Puzzle 3
4 The Puzzle But the recession most resembles the Great Depression of the 1930 s in terms of social assistance recipiency. The puzzle to solve is why, from a welfare perspective, the two big caseload run ups were in the Great Depression (15.5% of population in April 1933) and the recession (13.9% of population in March 1994). A Difficult Puzzle 4
5 18 Percent of Population receiving Social Assistance in Ontario: Peak Caseloads in the Great Depression and Three Major Recessions April 1933 December 1983 March 1994 November 1011 A Difficult Puzzle 5
6 18 Change in % of Population on Social Assistance in Ontario: Before Major Downturns to Peak Caseloads in the Great Depression and Three Major Recessions March 1994 Oct Nov A Difficult Puzzle 6
7 The Wrong Explanation? Level of unemployment doesn't solve the puzzle as unemployment stood at 10.4% of population in 1983 when 5.2% of population received social assistance, with unemployment rates almost as high as in 1992 and 1993 (10.8% and 10.9% respectively). EI changes don't solve the puzzle as EI was much easier to get in the early 1990's than it is now. A Difficult Puzzle 7
8 30 Percent of Population Receiving Social Assistance and Unemployment Rate in Ontario: The Great Depression & Three Major Recessions April 1933 December 1983 March 1994 November 1011 % population on SA Unemployment rate A Difficult Puzzle 8
9 The Wrong Explanation? One problem is that since the late 1980 s, regressions (R2) show that there is a very strong correlation between the unemployment rate and social assistance recipiency as a percentage of population Another problem is that the correlation does not show before 1988 and cannot account for either the Great Depression or the recession A Difficult Puzzle 9
10 The Structure of Unemployment is Important Structure of unemployment = who became unemployed (age, gender, industries The recession of the early 1990s was structurally quite different from that of the early 1980s. Good quality jobs were lost in the 1990 s - quite different from what happened in the early 1980s. A Difficult Puzzle 10
11 The Structure of Unemployment is Important Two aspects: the average duration of unemployment (see the chart below). The average duration of unemployment was much longer in the early 1990s and the average duration of unemployment returned to pre-recession levels more quickly in the early 1980s. Second, in the early 1980s the unemployment rate peaked at a rate similar to that in the 1990s, but fell again quickly (see the second following chart). In the early 1990s it remained stubbornly high for a much longer period. The most recent recession resembles the early 1980s more than the early 1990s. By the end of 2011 the unemployment rate hadn t risen to nearly the same level it did in previous recessions. A Difficult Puzzle 11
12 ONTARIO Unemployment Rates and Percentage of Population on SA 1981 to P E R C E N T A G E Unemployment Rate % of Population on SA A Difficult Puzzle 12

13 Duration of unemployment helps solve the puzzle: high in the Great Depression and in the 1990 s A Difficult Puzzle 13
14 Prolonged employment near 10% or more? Only in the Great Depression and early 1990 s A Difficult Puzzle 14
15 Other Explanations Five other changes one can point to are: 1. Increases to the minimum wage relative to social assistance rates - the single welfare rate was 70% of minimum wage in 1991 and about 36% now; A Difficult Puzzle 15
16 ONTARIO Annual SA Income as Percentage of Annual Income from Minimum Wage Employment Single Employable Person 1967 to % 70% 60% 50% 40% 30% 20% SA as % of Minimum Wage (37.5 hour week) A Difficult Puzzle 16
17 Other Explanations 2. The spectacular structural changes taking place within the caseloads - the upsurge in singles relative to continued reductions in family and sole support parent recipients would still appear to be the largest single key to solving the puzzle over the last 31 years and the three major recessions during that time. A Difficult Puzzle 17
18 160,000 ONTARIO: Divergence between Singles and Single Parents on OW to , ,000 Crossover point 100,000 80,000 60,000 40,000 20,000 - Steady increase in number of singles until and dramatic increase after. - Singles increasing as a proportion of the caseload, from 40% in to 59% in Number of single parents decreases, with slight upturn starting in Single parents as a proportion of the caseload decreasing steadily from high point of 45% in to 30% in Singles Single Parents A Difficult Puzzle 18
19 Other Explanations 3. Social assistance Rates lowest in real terms in 1980 s and Social assistance rates don't fully solve the puzzle as rates rose sharply ahead of inflation in the 1970's but did moderate somewhat in the early 1980's. Social Assistance rates were lowest in real terms in the early 1980 s and in recent years Rates were highest in the early 1990 s. A Difficult Puzzle 19


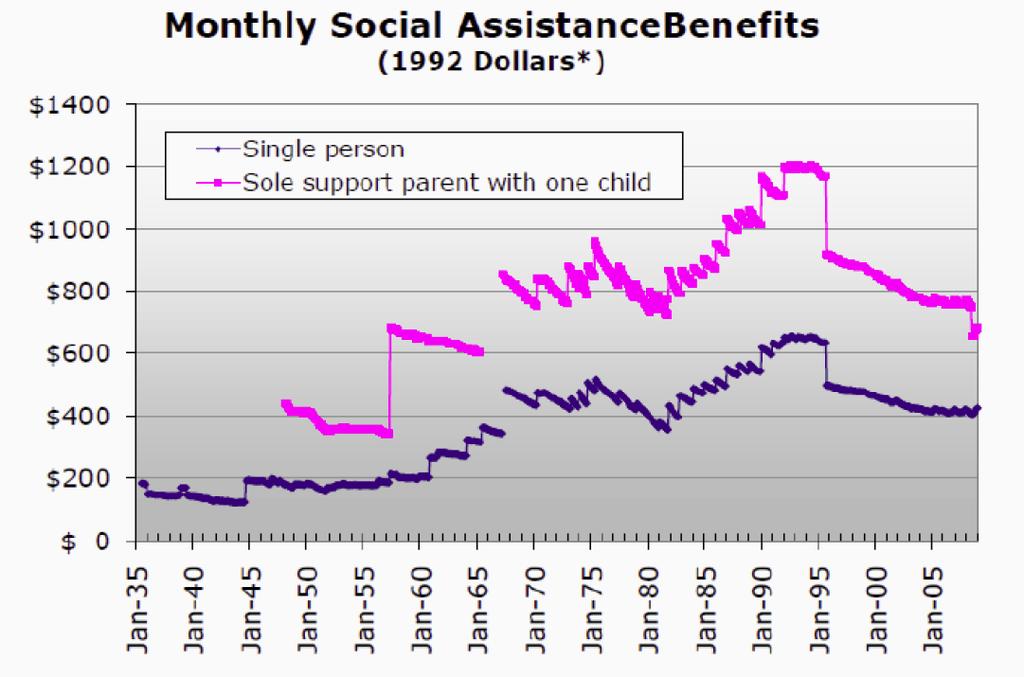
20 Social Assistance Rates A Difficult Puzzle 20
21 Other Explanations 4. Stigma: Program stigma was highest in the 1980 s and in the post Harris era and during recent times especially with questioning of cost of entitlement programs. A Difficult Puzzle 21
22 Other Explanations 5. Eligibility Changes: e.g. cancellation of STEP to applicants in 1990 s; Harris changes of e.g. assets; rate restructuring in 2008; Changes in eligibility requirements may partially give us answers but there is not enough here to explain why the 1990's run-up almost equaled levels we only saw in the mid 1930's. Eligibility was easier in the early 1990's but only slightly easier than the early 1980's. Eligibility is much tougher now but it's also tougher to get EI. A Difficult Puzzle 22
The Province of Prince Edward Island Employment Trends and Data Poverty Reduction Action Plan Backgrounder
 The Province of Prince Edward Island Employment Trends and Data Poverty Reduction Action Plan Backgrounder 5/17/2018 www.princeedwardisland.ca/poverty-reduction $000's Poverty Reduction Action Plan Backgrounder:
Economic Recovery. Lessons Learned From Previous Recessions. Timothy S. Parker Alexander W. Marré
 Economic Recovery Lessons Learned From Previous Recessions Timothy S. Parker tparker@ers.usda.gov Lorin D. Kusmin lkusmin@ers.usda.gov Alexander W. Marré amarre@ers.usda.gov AMBER WAVES VOLUME 8 ISSUE
UNEMPLOYMENT PART II. Cessation of work is not accompanied by cessation of expenses. Cato the Elder
 UNEMPLOYMENT PART II Cessation of work is not accompanied by cessation of expenses. Cato the Elder Defining Full Employment...the situation that exists when the official unemployment rate equals the natural
REGIONAL SUMMARIES. Nonfarm employment grew in the second quarter. Non-farm jobs totaled 56,900 in June, up from 55,500 in June 2016.
 Second Quarter 2017 Quarterly narrative An independent economic analysis of four Arkansas metro areas: Central Arkansas Northwest Arkansas The Fort Smith region Jonesboro metro REGIONAL SUMMARIES Fort
Multifamily Market Commentary May 2017
 Millions Multifamily Market Commentary May 2017 : Fundamentals Soften but Remain Healthy in First Quarter 2017 Seniors housing fundamentals softened modestly in the first quarter of 2017, with elevated
UNEMPLOYMENT RATES IMPROVING IN THE DISTRICT By Caitlin Biegler
 An Affiliate of the Center on Budget and Policy Priorities 820 First Street NE, Suite 460 Washington, DC 20002 (202) 408-1080 Fax (202) 408-8173 www.dcfpi.org UNEMPLOYMENT RATES IMPROVING IN THE DISTRICT
Quarterly General Fund Revenue Report JANUARY 2017 BARRY BOARDMAN, PH.D.
 Quarterly General Fund Revenue Report JANUARY 2017 BARRY BOARDMAN, PH.D. Highlights» FY 2016-17 Revenue through December: 3.1% ($322 million) above the 6-month revenue target.» Economic Outlook: The economy
ARLA Survey of Residential Investment Landlords
 Prepared for The Association of Residential Letting Agents ARLA Survey of Residential Investment Landlords June 2012 Prepared by O M Carey Jones 5 Henshaw Lane, Yeadon, Leeds, LS19 7RW June 2012 CONTENTS
Monetary Policy as the Economy Approaches the Fed s Dual Mandate
 EMBARGOED UNTIL Wednesday, February 15, 2017 at 1:10 P.M., U.S. Eastern Time OR UPON DELIVERY Monetary Policy as the Economy Approaches the Fed s Dual Mandate Eric S. Rosengren President & Chief Executive
Monetary policy assessment of 12 March 2009 Swiss National Bank takes decisive action to forcefully relax monetary conditions
 Communications P.O. Box, CH-8022 Zurich Telephone +41 44 631 31 11 Fax +41 44 631 39 10 Zurich, 12 March 2009 Monetary policy assessment of 12 March 2009 Swiss National Bank takes decisive action to forcefully
Unemployment in the Great Recession Compared to the 1980s
 Unemployment in the Great Recession Compared to the 1980s Richard A. Hobbie Executive Director National Association of State Workforce Agencies Assisted by Gina Turrini Please direct questions or comments
Two New Indexes Offer a Broad View of Economic Activity in the New York New Jersey Region
 C URRENT IN ECONOMICS FEDERAL RESERVE BANK OF NEW YORK Second I SSUES AND FINANCE district highlights Volume 5 Number 14 October 1999 Two New Indexes Offer a Broad View of Economic Activity in the New
Empire State Manufacturing Survey
 November 217 Empire State Manufacturing Survey Business activity continued to grow strongly in New York State, according to firms responding to the November 217 Empire State Manufacturing Survey. Though
UNIVERSITY OF CALIFORNIA Economics 134 DEPARTMENT OF ECONOMICS Spring 2018 Professor David Romer
 UNIVERSITY OF CALIFORNIA Economics 134 DEPARTMENT OF ECONOMICS Spring 2018 Professor David Romer LECTURE 3 POSTWAR FLUCTUATIONS AND THE GREAT RECESSION JANUARY 24, 2018 I. CHANGES IN MACROECONOMIC VOLATILITY
When will US Employment Recover from the Great Recession?
 Periodical Articles Upjohn Research home page 2011 When will US Employment Recover from the Great Recession? Randall W. Eberts W.E. Upjohn Institute, eberts@upjohn.org Citation Eberts, Randall W. 2011.
The Labor Force Participation Puzzle
 The Labor Force Participation Puzzle May 23, 2013 by David Kelly of J.P. Morgan Funds Slow growth and mediocre job creation have been common themes used to describe the U.S. economy in recent years, as
POVERTY AT THE CROSSROADS. John Stapleton Open Policy Policy Class 2015
 POVERTY AT THE CROSSROADS John Stapleton Open Policy Policy Class 2015 Poverty at the Crossroads 2 Poverty at the Crossroads 3 Quotes to set the stage ( and the frame) The Third Rail: Leech & McNish The
Poverty Rates in the Northwest Area: A comparison of poverty measures
 s in the Northwest Area: A comparison of poverty measures By Colin Morgan-Cross and Marieka Klawitter, Evans School of Public Affairs, University of Washington This briefing compares state level poverty
JUNE Living Standards REPORT HIGHLIGHTS. ANDREW SHARPE AND JEAN-FRANÇOIS ARSENAULT Centre for the Study of Living Standards (CSLS)
") JUNE 2009 Living Standards REPORT HIGHLIGHTS ANDREW SHARPE AND JEAN-FRANÇOIS ARSENAULT Centre for the Study of Living Standards (CSLS) Living Standards (Summary and Highlights) The Living Standards Domain
JUNE 2009 Living Standards REPORT HIGHLIGHTS ANDREW SHARPE AND JEAN-FRANÇOIS ARSENAULT Centre for the Study of Living Standards (CSLS) Living Standards (Summary and Highlights) The Living Standards Domain
Monitoring the Performance of the South African Labour Market
 Monitoring the Performance of the South African Labour Market An overview of the South African labour market from 3 of 2010 to of 2011 September 2011 Contents Recent labour market trends... 2 A brief labour
The Employment Situation, February 2010: Unemployment Rate for Older Workers Increases Again 1
 AARP Public Policy Institute The Employment Situation, February : 1 More than 2 million people aged 55 and over were unemployed in February, 118,000 more than in January. The unemployment rate for this
Equal pay for breadwinners
 istockphoto/sjlocke Equal pay for breadwinners More men are jobless while women earn less for equal work Heather Boushey January 2009 www.americanprogress.org Equal pay for breadwinners More men are jobless
Empire State Manufacturing Survey
 November 218 218 Business activity continued to grow at a solid clip in New York State, according to firms responding to the November 218. The headline general business conditions index edged up two points
ARLA Survey of Residential Investment Landlords
 Prepared for The Association of Residential Letting Agents ARLA Survey of Residential Investment Landlords March 2013 Prepared by O M Carey Jones 5 Henshaw Lane, Yeadon, Leeds, LS19 7RW March 2013 CONTENTS
Summary of Economic Indicators
 La Paz County Summary of Economic Indicators The economic overview includes a variety of topic areas and benchmarks of economic performance over the past six years Data is indexed based on 2005 county
NI Employment rises in Q & unemployment still rising
 Group Economics Group Economics Employment Falls in Q4 21 & unemployment still rising NI Employment rises in 212 & unemployment still rising Contact: Richard Ramsey Chief Economist, Northern Ireland 289
ECONorthwest ECONOMICS FINANCE PLANNING
 ECONorthwest ECONOMICS FINANCE PLANNING DATE: July 13th, 2015 TO: TriMet Board of Directors FROM: Andrew Dyke, Senior Economist SUBJECT: PORTLAND ECONOMIC RECOVERY ANALYSIS Introduction TriMet contracted
LABOUR MARKET DEVELOPMENTS IN THE EURO AREA AND THE UNITED STATES SINCE THE BEGINNING OF THE GLOBAL FINANCIAL CRISIS
 Box 7 LABOUR MARKET IN THE EURO AREA AND THE UNITED STATES SINCE THE BEGINNING OF THE GLOBAL FINANCIAL CRISIS This box provides an overview of differences in adjustments in the and the since the beginning
McGraw-Hill/Irwin 2002 The McGraw-Hill Companies, Inc., All Rights Reserved.
 The Business Cycle Macroeconomics The Great Depression was the springboard for modern macroeconomics. Macroeconomics Macroeconomics is the study of aggregate economic behavior, of the economy as a whole.
Annual Financial Report of the Government of Canada
 Department of Finance Canada Ministère des Finances Canada Annual Financial Report of the Government of Canada Fiscal Year 2009 2010 Her Majesty the Queen in Right of Canada (2010) All rights reserved
MEDIUM-TERM FORECAST
 MEDIUM-TERM FORECAST Q2 2010 Published by: Národná banka Slovenska Address: Národná banka Slovenska Imricha Karvaša 1 813 25 Bratislava Slovakia Contact: Monetary Policy Department +421 2 5787 2611 +421
NORTH WEST QUARTERLY ECONOMIC OUTLOOK. August 2012
 NORTH WEST QUARTERLY ECONOMIC OUTLOOK August 2012 North West Quarterly Economic Outlook August 2012 Quarterly Economic Outlook Through the Regional Leaders Board the North West s five Local Enterprise
Above Average growth expected in the GTA and Kitchener Waterloo Area in 2017
 1 2 Above Average growth expected in the GTA and Kitchener Waterloo Area in 2017 The GTA and Kitchener Waterloo are also forecasted to have higher GDP growth through 2020 Southwestern Ontario will also
BDO MONTHLY BUSINESS TRENDS INDICES April Copyright BDO LLP. All rights reserved.
 BDO MONTHLY BUSINESS TRENDS INDICES April 2017 Copyright BDO LLP. All rights reserved. INTRODUCTION The BDO Monthly Trends Indices are polls of polls that pull together the results of all the main UK business
The Long View Rates, GDP & Challenges
 The Long View Rates, GDP & Challenges May 3, 2017 by Lance Roberts of Real Investment Advice There has been much debate about the current low levels of interest rates in the economy today. The primary
CalWORKs 101: Key Facts. About California s Welfareto-Work
 CalWORKs 101: Key Facts 1107 9th Street, Suite 310 Sacramento, California 95814 (916) 444-0500 www.cbp.org cbp@cbp.org About California s Welfareto-Work Program A PRESENTATION BY SCOTT GRAVES, SENIOR POLICY
TAX AND OTHER REVENUE INITIATIVES IN THE PROPOSED FISCAL YEAR 2013 BUDGET
 An Affiliate of the Center on Budget and Policy Priorities 820 First Street NE, Suite 460 Washington, DC 20002 (202) 408-1080 Fax (202) 408-1073 www.dcfpi.org TAX AND OTHER REVENUE INITIATIVES IN THE PROPOSED
LETTER. economic THE CANADA / U.S. PRODUCTIVITY GAP: THE EFFECT OF FIRM SIZE FEBRUARY Canada. United States. Interest rates.
 economic LETTER FEBRUARY 2014 THE CANADA / U.S. PRODUCTIVITY GAP: THE EFFECT OF FIRM SIZE For many years now, Canada s labour productivity has been weaker than that of the United States. One of the theories
PART-TIME PURGATORY YOUNG AND UNDEREMPLOYED IN AUSTRALIA
 PART-TIME PURGATORY YOUNG AND UNDEREMPLOYED IN AUSTRALIA DECEMBER 2018 Being young, even in one of the most prosperous nations in the world, isn t what it used to be. Negotiating adulthood in the 21st
Monitoring the Performance of the South African Labour Market
 Monitoring the Performance of the South African Labour Market An overview of the South African labour market from 1 of 2009 to of 2010 August 2010 Contents Recent labour market trends... 2 A brief labour
Background to the Recent Decline in the Growth Rate of Banknotes in Circulation
 Bank of Japan Review -E-3 Background to the Recent Decline in the Growth Rate of Banknotes in Circulation Yoshihito Saito and Hideki Takada October The year-on-year growth rate of banknotes in circulation
Selected Financial Market & Economic Data
 Financial Crisis Inquiry Commission Selected Financial Market & Economic Data January 13, 2010 CONTENTS FINANCIAL SECTOR... 3 HOUSEHOLD SECTOR... 6 HOUSING MARKET... 7 LABOR MARKET... 10 BUSINESS SECTOR...
Tracking Real GDP over Time
 OpenStax-CNX module: m48710 1 Tracking Real GDP over Time OpenStax This work is produced by OpenStax-CNX and licensed under the Creative Commons Attribution License 3.0 By the end of this section, you
Educational Attainment and Economic Outcomes
 Educational Attainment and Economic Outcomes Eric S. Rosengren President & Chief Executive Officer Federal Reserve Bank of Boston Early Childhood Summit 2013: Innovation and Opportunity Federal Reserve
Policy Reforms after the Crisis
 367 Policy Reforms after the Crisis Norman Chan The title of this session is supposed to be policy reforms after the 28 9 financial crisis. I think there s a big question about the title because I m not
Part 1 Academic Reading 1
 Contents Introduction How to Use This Book v Part 1 Academic Reading 1 Unit 1 About the Academic Reading Test 1 Unit 2 The Skills You Need 7 Unit 3 Multiple-choice Questions 14 Unit 4 True/False/Not Given
THE U.S. ECONOMY IN 1986
 of women in the labor force. Over the past decade, women have accounted for 62 percent of total labor force growth. Increasing labor force participation of women has not led to large increases in unemployment
Principles of Macroeconomics. Twelfth Edition. Chapter 13. The Labor Market in the Macroeconomy. Copyright 2017 Pearson Education, Inc.
 Principles of Macroeconomics Twelfth Edition Chapter 13 The Labor Market in the Macroeconomy Copyright 2017 Pearson Education, Inc. 13-1 Copyright Copyright 2017 Pearson Education, Inc. 13-2 Chapter Outline
Unemployment Insurance Primer: Understanding What s At Stake as Congress Reopens Stimulus Package Debate. Wayne Vroman January 2002
 Unemployment Insurance Primer: Understanding What s At Stake as Congress Reopens Stimulus Package Debate Wayne Vroman January 2002 With the economy in recession, President Bush is asking (has asked) Congress
Household Income Trends March Issued April Gordon Green and John Coder Sentier Research, LLC
 Household Income Trends March 2017 Issued April 2017 Gordon Green and John Coder Sentier Research, LLC 1 Household Income Trends March 2017 Source This report on median household income for March 2017
CBO Projects More Severe Downturn
 Issue Brief August 2009 CBO Projects More Severe Downturn BY DEAN BAKER * Center for Economic and Policy Research 1611 Connecticut Ave, NW Suite 400 Washington, DC 20009 tel: 202-293-5380 fax: 202-588-1356
Survey of Residential Landlords
 Survey of Residential Landlords Fourth Quarter 2014 REPORT O M Carey Jones 5 Henshaw Lane, Yeadon, Leeds, LS19 7RW Telephone: 0113 250 6411 CONTENTS Page 1. INTRODUCTION & BACKGROUND 4 2. METHODOLOGY 5
WebMemo22. Reduced Job Creation Not Increased Layoffs Explains High Unemployment. Published by The Heritage Foundation.
 No. 3422 November 29, WebMemo22 Published by The Heritage Foundation Reduced Job Creation Not Increased Layoffs Explains High Unemployment James Sherk Unemployment remains stuck at 9 percent because of
Did the Social Assistance Take-up Rate Change After EI Reform for Job Separators?
 Did the Social Assistance Take-up Rate Change After EI for Job Separators? HRDC November 2001 Executive Summary Changes under EI reform, including changes to eligibility and length of entitlement, raise
This PDF is a selection from an out-of-print volume from the National Bureau of Economic Research
 This PDF is a selection from an out-of-print volume from the National Bureau of Economic Research Volume Title: Business Cycles, Inflation, and Forecasting, 2nd edition Volume Author/Editor: Geoffrey H.
Consumer Instalment Credit Expansion
 Consumer Instalment Credit Expansion EXPANSION OF instalment credit reached a high in the summer of 1959, and then moderated in the fourth quarter. In early 1960 expansion increased, but at a slower rate
The Index Leading Indicators
 Our Sponsors: Housing Sales Up, Wide Growth Professor Erick Eschker, Director Jonathan Ashbach, Assistant Editor Catherine Carter, Assistant Analyst While no especially dramatic records were broken in
The State of Working Florida 2011
 The State of Working Florida 2011 Labor Day, September 5, 2011 By Emily Eisenhauer and Carlos A. Sanchez Contact: Emily Eisenhauer Center for Labor Research and Studies Florida International University
Smith Leonard PLLC Kenneth D. Smith, CPA Mark S. Laferriere, CPA
 Smith Leonard PLLC s Industry Newsletter January 2018 HIGHLIGHTS - EXECUTIVE SUMMARY A ccording to our latest survey of residential furniture manufacturers and distributors, new orders in November 2017
The Interaction of Workforce Development Programs and Unemployment Compensation by Individuals with Disabilities in Washington State
 External Papers and Reports Upjohn Research home page 2011 The Interaction of Workforce Development Programs and Unemployment Compensation by Individuals with Disabilities in Washington State Kevin Hollenbeck
New Hampshire Medicaid Program Enrollment Forecast SFY Update
 New Hampshire Medicaid Program Enrollment Forecast SFY 2011-2013 Update University of New Hampshire Whittemore School of Business and Economics Ross Gittell, James R Carter Professor Matt Magnusson, M.B.A.
Some Thoughts on Roller Coaster Investing
 Some Thoughts on Roller Coaster Investing Take a look at this roller coaster stock price chart. The stock crashed by 63% in just 118 days between late 2008 and early 2009. Then, after a rise over the next
Will the Real Private Nonfarm Payrolls Please Stand Up?
 Northern Trust Global Economic Research 50 South LaSalle Chicago, Illinois 603 northerntrust.com Paul Kasriel plk1@ntrs.com Will the Real Private Nonfarm Payrolls Please Stand Up? May 31, 20 Each month
Danske Bank October 2015 Economic Update,
 Monthly update: 5 October 2015 Danske Bank Chief Economist, Twitter: angela_mcgowan www.danskebank.co.uk/ec Local job and investment announcements during September 2015 Over the month of September there
LETTER. economic. Slowdown in international trade: has interprovincial trade made up for it? DECEMBER bdc.ca
 economic LETTER DECEMBER Slowdown in international trade: has interprovincial trade made up for it? Canada has always been a country open to the world, but it has become increasingly so over the years.
LETTER. economic COULD INTEREST RATES HEAD UP IN 2015? JANUARY Canada. United States. Interest rates. Oil price. Canadian dollar.
 economic LETTER JANUARY 215 COULD INTEREST RATES HEAD UP IN 215? For six years now, that is, since the financial crisis that shook the world in 28, Canadian interest rates have stayed low. The key interest
City of Modesto Economic Indicators December 2014 Edition
 City of Modesto Economic Indicators December 2014 Edition Steve Christensen City of Modesto Economic Outlook: City of Modesto The City of Modesto continues to slowly recover from the Great Recession. Some
ECONorthwest ECONOMICS FINANCE PLANNING
 ECONorthwest ECONOMICS FINANCE PLANNING DATE: May 7, 2015 TO: FROM: Board of Directors, Lane Transit District Andrew Dyke, Senior Economist and Lisa Rau, Senior Analyst SUBJECT: RECENT ECONOMIC PERFORMANCE
April 2016 Lutgert College Of Business FGCU Blvd. South Fort Myers, FL Phone
 Southwest Florida Regional Economic Indicators April 2016 Lutgert College Of Business 10501 FGCU Blvd. South Fort Myers, FL 33965 Phone 239-590-7090 www.fgcu.edu/cob/reri Table of Contents Introduction:
GDP During the Great Depression
 V i s u a l 1 3 A GDP During the Great Depression Thousands of businesses like this small shop in Eastport, Maine failed or went bankrupt during the Great Depression. U.S. Gross Domestic Product, 1929
EXPLAINING CHANGES IN FOOD STAMP PROGRAM PARTICIPATION RATES
 Page 1 EXPLAINING CHANGES IN FOOD STAMP PROGRAM PARTICIPATION RATES Office of Analysis, Nutrition and Evaluation September 2004 Summary Each year, the Food and Nutrition Service estimates the rate of participation
The State of the Domestic Auto Industry: Part II
 The State of the Domestic Auto Industry: Part II [Editor's note: These comments by Mark Zandi, chief economist of Moody's Economy.com, are edited excerpts of testimony he gave before the U.S. Senate Banking
Economic Shocks: the Great Depression and Great Recession. Andy Bauer Senior Regional Economist October 19, 2017
 Economic Shocks: the Great Depression and Great Recession Andy Bauer Senior Regional Economist October 19, 2017 Economic Shocks: the Great Depression and Great Recession Andy Bauer Senior Regional Economist
The Big Four Economic Indicators: December Nonfarm Employment
 The Big Four Economic Indicators: December Nonfarm Employment January 4, 2019 by Jill Mislinski of Advisor Perspectives Official recession calls are the responsibility of the NBER Business Cycle Dating
GfK Consumer Climate Europe: Uncertainty impacts consumer sentiment. GfK Consumer Climate Europe results for the third quarter of 2016
 Press release October 14, 2016 Rolf Bürkl Tel. +49 911 395 3056 rolf.buerkl@gfk.com Ursula Fleischmann Corporate Communications Tel: +49 911 395 2745 ursula.fleischmann@gfk.com GfK Consumer Climate Europe:
Labour Market Bulletin
 Labour Market Bulletin Quebec October 2015 This Labour Market Bulletin provides an analysis of Labour Force Survey results for the province of Quebec and its regions. OVERVIEW In October 2015, employment
Empire State Manufacturing Survey.
 February 218 Empire State Manufacturing Survey Business activity continued to expand in New York State, according to firms responding to the February 218 Empire State Manufacturing Survey. The headline
Empire State Manufacturing Survey
 December 217 Empire State Manufacturing Survey Business activity continued to grow at a solid clip in New York State, according to firms responding to the December 217 Empire State Manufacturing Survey.
C H A P T E R 1 T H E I L L I N O I S R E P O R T
 C H A P T E R 1 8 T H E I L L I N O I S R E P O R T 2 0 1 3 C H A P T E R 1 Giertz After the Great Recession, Where is the Great Recovery? By J. Fred Giertz This chapter provides a broad overview of trends
Supplemental Nutrition Assistance Program participation during the economic recovery of 2003 to 2007
 Supplemental Nutrition Assistance Program participation during the economic recovery of 2003 to 2007 Janna Johnson Janna Johnson is a graduate student in Public Policy at the Harris School, University
BUYING POWER OF MINIMUM WAGE AT 51 YEAR LOW: Congress Could Break Record for Longest Period without an Increase By Jared Bernstein and Isaac Shapiro 1
 820 First Street NE, Suite 510 Washington, DC 20002 Tel: 202-408-1080 Fax: 202-408-1056 center@cbpp.org http://www.cbpp.org 1660 L Street N.W., Suite 1200 Washington, D.C. 20036 Tel: 202-775-8810 Fax:
District Economic. Structurally Deficient Bridges, 2001 (Percent)
") District Economic BY ROBERT LACY Apprehension about terrorism and political developments regarding Iraq cast a pall over the Fifth District economy in the last three months of. Many businesses continued
District Economic BY ROBERT LACY Apprehension about terrorism and political developments regarding Iraq cast a pall over the Fifth District economy in the last three months of. Many businesses continued
Empire State Manufacturing Survey
 November 216 Empire State Manufacturing Survey Business activity stabilized in New York State, according to firms responding to the November 216 Empire State Manufacturing Survey. The headline general
Baseline Current Progress. 2.0% Point Gap with UK
 October 2017 GBSLEP KPI Report KPI Dashboard KPI Baseline Current Progress To Date Latest Data Create 250,000 Private Sector Jobs by 2030 to be the Leading Core City LEP for Private Sector Job Creation
CEO optimism prevails.
 CEO Confidence Index Surveying CEOs of small to mid-sized businesses since 2003 Q3 2018 September 10-17 CEO optimism prevails. Economic confidence among CEOs continued to slowly decline in the Q3 2018
Arvest Consumer Sentiment Survey April 2016
 Arvest Consumer Sentiment Survey April Produced for Arvest Bank by a multi-university collaboration including: Center for Business and Economic Research Sam M. Walton College of Business University of
To What Extent Is the Unemployment Insurance System a Safety Net for Former TANF Recipients? Evidence from New Jersey 1
 To What Extent Is the Unemployment Insurance System a Safety Net for Former TANF Recipients? Evidence from New Jersey 1 Anu Rangarajan Carol Razafindrakoto Walter Corson November 6, 2 1 This study was
ECONOMY REPORT - CHINESE TAIPEI
 ECONOMY REPORT - CHINESE TAIPEI (Extracted from 2001 Economic Outlook) REAL GROSS DOMESTIC PRODUCT The Chinese Taipei economy grew strongly during the first three quarters of 2000, thanks largely to robust
Birmingham Update. April Economic Research & Policy Economy Directorate
 Birmingham Update April 2018 Economic Research & Policy Economy Directorate Economic Dashboard 6.4% +217 Claimant Unemployed - Mar 2018 + 1.2bn +4.8% Economic Output GVA (Nominal) - 2016 63.6% -1,800 50.4%
Australian inflation & unemployment: an overview
 Australian inflation & unemployment: an overview Three main measures of inflation in Australia 1. 2. 3. The consumer price index - or CPI. This the main measure used in media and business transactions.
Post-Secondary Education, Training and Labour Prepared November New Brunswick Minimum Wage Report
 Post-Secondary Education, Training and Labour Prepared November 2018 2018 New Brunswick Minimum Wage Report Contents Section 1 Minimum Wage Rates in New Brunswick... 2 1.1 Recent History of Minimum Wage
LIA Monthly Economic Report
 This publication is made possible through the support of: LIA Monthly Economic Report A Research Report for Directors and Members of the Long Island Association, Inc. June, 2017 Prepared by Dr. John A.
Box 2 Lessons to be drawn from the oil price shocks of the 1970s and early 1980s
 Box Lessons to be drawn from the oil price shocks of the 197s and early 19s Since January 1999, i.e. in little more than a year and a half, the price of crude oil has more than tripled in US dollar terms
FRONT BARNETT ASSOCIATES LLC
 FRONT BARNETT ASSOCIATES LLC I N V E S T M E N T C O U N S E L March 21, 1998 The Economic Outlook - - No Recession in Sight This month the U.S. economic expansion will enter its seventh year. Even more
THE STATE OF THE ECONOMY
 THE STATE OF THE ECONOMY ANDREW CRAMPTON Portland State University Although market fundamentals remain strong with record unemployment and continued economic growth, signs point to a softening market due
OVERVIEW OF DEVELOPMENTS IN ICT INVESTMENT IN CANADA, 2011
 September 212 151 Slater Street, Suite 71 Ottawa, Ontario K1P 5H3 613-233-8891, Fax 613-233-825 csls@csls.ca CENTRE FOR THE STUDY OF LIVING STANDARDS OVERVIEW OF DEVELOPMENTS IN ICT INVESTMENT IN CANADA,
The Relationship Between SNAP and Work Among Low- Income Households
 The Relationship Between SNAP and Work Among Low- Income Households Implementing the SNAP Pilot Projects to Reduce Dependency and Increase Work Levels April 10, 2013 Center on Budget and Policy Priorities
5.9 Percent 4.4 Percent 10.2 Percent 9.7 Percent. autonomous federated state Head of Government Angela Merkel Horst Seehofer José Manuel Barroso 3,7%
 Economic Outlook Germany, Bavaria, Eurozone, and EU-27 General Information Germany Bavaria Eurozone EU-27 Area 357.022 km² 70.552 km² 4.324.782 km² Population 81.796.000 12.583.538 327.054.866 502.489.100
Consumer Debt and Money Report Q making business sense
 Consumer Debt and Money Report Q3 2012 3 making business sense Executive summary & commentary The StepChange Debt Charity Consumer Debt and Money Report Q3 2012 expands on previous reports to build a nuanced
Consensus Forecast for 2011
 Consensus Forecast for 2011 William Strauss Senior Economist and Economic Advisor Review of past performance 1 The growth in real GDP came in initially at a faster pace than was anticipated quarterly forecasts