Canadian Labour Market and Skills Researcher Network
|
|
|
- Franklin Parsons
- 6 years ago
- Views:
Transcription
")
1 Canadian Labour Market and Skills Researcher Network Working Paper No. 50 A New View of the Male/Female Pay Gap Michael Baker University of Toronto Marie Drolet Statistics Canada December 2009 CLSRN is supported by Human Resources and Social Development Canada (HRSDC) and the Social Sciences and Humanities Research Council of Canada (SSHRC). All opinions are those of the authors and do not reflect the views of HRSDC or the SSHRC.
2 A New View of the Male/Female Pay Gap Michael Baker University of Toronto Marie Drolet Statistics Canada March 2009 Abstract We construct a new time series on the Canadian female/male pay ratio. The new series is based on wage data rather than the earnings data that has been used in the past. Wages more closely correspond to the price of labour, which is the focus of most theories of labour market discrimination and public policies in this area. Earnings based estimates combine gender differences in wages with gender differences in decisions of how much to work (i.e., hours). Our results reveal significant differences between the wage and earnings based series. Most importantly the wage series reveals that women have continued to make progress in the last fifteen years. In 2006 the wage based ratio is 0.85 while the earnings based ratio is only We also find that as the gender wage ratio has risen, the remaining gap in wages is increasingly unexplained in the sense that it cannot be accounted for by gender differences in characteristics that the labour market values. JEL Code: Keywords: J31 Gender pay gap, Wages, Earnings We gratefully acknowledge research funding from the Canadian Labour Market Skills Network. We have benefited from the comments of Doug Murphy, Shelley Phipps, and participants in the CLSRN Workshop. 1
3 Executive Summary Most discussion of differences in male and female compensation in Canada is framed by Statistics Canada s annual release of Income Trends in Canada. Based on data from the Survey of Consumer Finances and Survey of Labor and Income Dynamics this publication provides annual observations on the ratio of females earnings to males earnings for full year full time workers (the gender earnings ratio ). Recent news from this publication is not good: the female/male earnings ratio for full year full time workers shows modest improvement in the late 1980s but has been in a holding pattern around 0.70 since From a policy perspective the lack of movement in the ratio is puzzling. Canadian governments at various levels have been active with legislation intended to right inequities in compensation by gender. In this paper, we investigate the possibility that the gender earnings ratio does not provide an informative gauge of the relative status of women. We offer estimates of the female/male wage ratio as an alternative. Wages more closely correspond to the price of labour that is the focus of economic models of discrimination. Earnings combine prices and quantities so an earnings gap might arise simply because Full-Year, Full-Time (FYFT) females work less than FYFT males. Gender employment gaps are an interesting but distinct issue. Piecing together wage data from various surveys starting in 1981, we construct a consistent time series on the gender wage ratio in Canada. The wage based series is different from the earnings ratio in both level and trend. It is consistently higher than the earnings based ratio by 10 to 15 percentage points. In 2006 the wage based ratio for full time workers stood at 0.85, while the earnings based ratio for full year full time workers stood at It also changes differently over time. Of particular note the wage based ratio displays steady if modest progress over the last 15 years while the earnings based ratio remains stalled. Both the males and females in the sample have become older and more educated over time and females have gained more labour market experience. We investigate how the gender wage ratio changes as we control for gender differences in productive characteristics. In many dimensions females increasingly hold an edge on males in this regard. As a result if females commanded the same returns to these characteristics as males we would expect them to be receive higher not lower wages than males. The most significant exception to this conclusion is the industrial distribution of employment in which males hold a significant advantage. From a policy perspective this research raises important issues. First, a gender compensation ratio of clearly raises different issues than one that is Second, the wage based ratio shows women have made steady if modest progress through the 1990s and 2000s while the earnings based ratio does not.
4 The Labour Force Survey now provides timely, consistent evidence on the wages of male and female workers in the Canadian economy. There is a strong case for moving the annual report of the gender pay ratio and the policy debate that surrounds it to a wage basis.
5 Introduction Most discussion of differences in male and female compensation in Canada is framed by Statistics Canada s annual release of Income Trends in Canada. 1 Based on data from the Survey of Consumer Finances (SCF) and Survey of Labor and Income Dynamics (SLID) this publication provides annual observations on the gender ratio of earnings for full year full time (FYFT) workers. The news from this publication is not good, as figure 1 makes clear. 2 While showing modest improvement in the late 1980s the female/male earnings ratio for full year full time workers has been in a holding pattern around 0.70 since From a policy perspective the lack of movement in the ratio is puzzling. Canadian governments at various levels have been active with legislation intended to right inequities in compensation by gender. For example, pay equity laws now cover federal workers, public sector workers in many provinces, and private sector workers in Ontario and Quebec. While we can t rule out the possibility that things would be worse in the absence of these initiatives, it does seem surprising that there has been so little demonstrable progress. Research provides some clues to this puzzle. For example, Baker and Fortin (2001) show that low wages in female jobs were not a particular problem in Canada in the period preceding the introduction of many of these laws. Their 2004 paper suggests the application of pay equity laws to the private sector can face substantial hurdles. An intriguing implication of Drolet s (2002a, 2002b) recent studies of the female/male wage gap is that we may be using the wrong metric to monitor progress. When these studies were released they garnered considerable attention by showing that the female/male wage ratio, adjusting for male/female differences in observable characteristics, might be as high as These same statistics are also available through CANSIM. 2 The earnings ratios in this figure are for full year full time workers. 2
6 Passing almost unnoticed was evidence that circa 2000 the unadjusted female/male wage ratio was This is substantially different than the ratio of 0.70 (or 0.61 for all workers) from the SLID. The key difference here appears to be that the SCF and SLID statistics compare the annual earnings of FYFT workers while Drolet s evidence is based on (mostly) direct observations on hourly wages. Wages more closely correspond to the price of labour that is the focus of economic models of discrimination. Earnings combine prices and quantities so an earnings gap might arise simply because FYFT females work less than FYFT males. Gender employment gaps are an interesting but distinct issue. What is currently unknown is whether the difference between the wage and earnings based ratios is only present in the years that Drolet examined or pervasive across the entire time series. Previous studies provide a hint. Baker et al. (1995) and Gunderson (1998) report that the unadjusted female/male earnings ratio for FYFT workers in the early 1980s was , consistent with the information in figure 1. In contrast Doiron and Riddell (1994) report that the female/male wage ratio was in this same period. From a policy perspective this is an important issue. First, a gender compensation ratio of 0.80 plus clearly raises different issues than one that is less than Second, it is not currently known if movements in a wage based ratio follow the time series in figure 1. Any differences would change the historical record but also potentially change our evaluation of past policies in this area. For example, in the figure the most dramatic movement in the earnings based ratio is over the economic expansion of the late 1980s. This might suggest that economic growth is of particular importance to the relative economic status of females. 3
7 In this paper we offer a new time series on the gender compensation gap based on wage data. Piecing together wage data from various surveys starting in 1981, we construct a consistent time series on the gender wage gap in Canada. The wage based series is different from its earnings based counterpart in both level and trend. The wage based ratio reveals that women s relative compensation has increased over the last 15 years, a message that sharply contrasts with the story told by the earnings based ratio. In 2006 the wage based ratio for full time workers aged was 0.85, while the earnings based ratio for full year full time workers of this age was just Both the males and females in the sample have become older and more educated over time and females have gained more labour market experience. Accounting for the gender log wage differential using the familiar Blinder-Oaxaca decomposition we find that as the gap has decreased it is increasingly unexplained. In many dimensions females hold an advantage in productive characteristics, such that we would expect them to be paid more than males if they commanded the same return to those characteristics in the labour market. Previous Research The majority of previous studies of the male/female compensation gap use annual earnings as a measure of compensation. The raw data for this analysis are presented in figure 1. There are two periods of relative stability. Between 1980 and 1988 the ratio rose very modestly from 0.64 to just shy of Starting in 1992 and continuing to the present the ratio has fluctuated around The period then is the time of change as the ratio rises from below 0.66 to above While some earnings based studies use data other than the SCF and SLID data used for this graph, there is general agreement with the times series in figure 1. 4
8 Baker et al. (1995) and Gunderson (1998) are examples of the earnings approach that provide evidence for multiple points in time. 3 Baker et al. document the male/female earnings gap in 1970, 1980, 1985 and 1990 using data from the Canadian census (1971, 1981 and 1986) and SCF (1986 and 1991). They report unadjusted female/male earnings ratios for these years in line with the evidence in figure 1. Adjusting for any differences between males in females in observable productive characteristics, the adjusted ratios are between 4 (1990) to 9 (1970) percentage points higher. The results from their most complete specification, which controls for gender differences in occupation, indicate that the adjusted gender earnings ratio hovered around 0.70 throughout the entire period. Gunderson (1998) provides a comparable set of estimates using the 1971, 1981 and 1991 Canadian censuses. His estimates of the unadjusted ratio are again in line with figure 1 with the exception that he reports a ratio of 0.72 for 1990, which predates the achievement of the 0.70 ratio in the data from Income Trends in Canada. Gunderson s most complete specification of the earnings function includes several controls that are not typical in other studies: possession of vocational training, language (French, English, both, neither) hours per week and industry. The result is much higher adjusted gender earnings ratios that show steady improvement throughout the period. In table 1 we summarize the results of these two studies as a point of reference for our wage based results. There are only a few previous studies that have used a wage based measure of compensation rather than earnings. Doiron and Riddell (1994) provide estimates for the 1980s using Survey of Work History (SWH), Survey of Union Membership (SUM) and Labour Market Activity Survey (LMAS) data. Their estimates of the unadjusted gender wage ratio range 3 See also Gunderson (1979), Holmes (1976), Maki and Ng (1990), Miller (1987), Robb (1978), Shapiro and Stelcner (1987) and Wannel (1990). 5
9 between 0.76 and 0.77 for the years 1981, 1984 and Estimates of an adjusted ratio for each of these years are Drolet (2002a and 2002b) provides corresponding estimates for 1997 and Her estimates of the unadjusted gender wage ratio for these years are Once she controls for a host of productive characteristics, including some only available in her Survey of Labour and Income Dynamics (SLID) and Worker Employer Survey (WES) data, the ratio ranges from 0.89 to Finally, Fortin and Schirle (2006) present estimates of the median gender pay gap based on estimates of hourly wages constructed from the Survey of Consumer Finances data, as annual earnings divided by the product of annual weeks and usual weekly hours. The results for individuals with at least one year of tenure show an unadjusted ratio rising from just under 0.7 to just over 0.7 through the 1980s. Starting in 1990 the ratio rises from 0.7 to roughly 0.77 by Earnings or Wages? Differences between wage and earnings based estimates of the gender compensation gap suggest a deficiency in the earnings based measures. Wages more accurately capture the price of labour. Gender differences in the price of labour commonly define gender based labour market discrimination. There are also at the centre of economic theories of discrimination. Focusing on wages also neatly delineates any gender gaps in labour supply that necessarily are part of the gender earnings gap. Although many earnings based studies focus on the weekly earnings of full year full time workers, any gender differences in weekly hours of 4 Christofides and Swidinsky (1994) provide wage based estimates for 1989 using LMAS data. The estimate of the white female/white male gap for this year is roughly Kidd and Shannon (1997) report gender wage ratios for 1981 and 1989 of and respectively. 6
10 work among these workers will remain part of the resulting gender earnings gap. While part of the gender gap in hours or weeks worked may arise from discrimination, it is also thought that corresponding gender differences in preferences play a role. For example, family responsibilities are known to have a greater association with females labour supply than with males. Earnings do have an advantage of conveying individuals command over good and services and therefore can be viewed as providing an index of economic welfare. However, it is well known that earnings (or income) based indices of welfare are better measured at the family or household level, and that individual based indices can provide a misleading picture of the standard of living an individual actually attains. Finally, wages rather than earnings are typically the focus of public policy in this area. For example, pay equity legislation mandates equal wages for work of equal value. Data Because there is no single, on going source of wage data for an extended period of time, we use data from a variety of surveys conducted over the last 30 years. The oldest source of wage data that we are aware of is the Survey of Work History (SWH) for The next observation is for 1984 from the Survey of Union Membership (SUM). We obtain data for the period from the Labour Market Activity Survey (LMAS) and for from the SLID. Finally from the wage data come from the Labour Force Survey (LFS). The base population of interest is all paid employees in their main job. 5 The particular strengths of the data should be highlighted. These data cover a long period of time, are nationally representative and use the LFS sample design or are supplements to the 5 With the exception of the SUM, the wages are for the job held in May. The SUM uses the main job in December. 7
11 LFS. The variables used have been harmonized in such a manner as to provide a consistent concept over the survey years. There are naturally some inconsistencies in data taken from so many sources. Most importantly, the definition of wages (taken as the usual wages or salaries before taxes and other deductions) varies across surveys, as tips and commissions and overtime are not treated consistently. Appendix Table 1 describes the wage and hours concept used in each survey. Also, each survey uses different imputation methods for missing data. 6 The LFS revised its concept of educational attainment in 1990 from a measure based on the number of years of schooling to the highest level of education attained. The LFS has changed industry coding from the Standardized Industry Codes (SIC) - used up until to the North American Industrial Coding System (NAICS) and has changed occupation coding from the Standardized Occupation Coding (SOC) to the National Occupation Coding (NOC). In some instances we can directly address these problems. Our methods for creating consistent industry and occupation codes across the different data sets are reported in the appendix. We can report gender wage gaps based on medians to address changes in topcoding. In other cases we can merely document the problems. The Gender Pay Gap A comparison with the Earnings based ratio We begin our analysis by comparing our wage based estimates of the gender pay gap to the more well known, and widely available earnings based measures. The earnings based estimates are available annually, by some limited demographic characteristics. In figure 2 we 6 The LMAS uses hot deck imputation method while the LFS uses donor imputation methods. Donor imputation is a method by which missing data is imputed using a donor record that has all the same characteristics as the missing record. Hot deck imputation is a method by which only selected information between the donor and the missing record are compared. 8
12 graph both the wage and earnings based series for workers 17 to One comparison is the earnings and wage based series for all workers. The most striking feature of this comparison is the horizontal distance between the two series. The earnings based ratios ranges from 0.53 to almost 0.65, while the wage based ratios ranges from just under 0.74 to over In many years the difference is almost 20 percentage points. There are also some differences in the time variation of the two series, most notably in the early 1980s when the wage based ratios fall while the earnings based ratio rise. Also notable is the late 1990s and 2000s when the earnings ratio loses and regains ground while the wage based ratio shows steady if modest improvement. It is the gender earnings ratio for FYFT workers that is more commonly cited in the media and by commentators. In figure 2 we also graph this series and the wage based estimates for full time workers as a point of comparison. Note this comparison is not completely consistent as the earnings estimates exclude part year full time workers. There is a significant difference in the level of the earnings series relative to its all workers counterpart. In contrast the move from all workers to full time workers makes less of a difference for the wage series effectively no difference in the early 1980s. The wage based ratios are again consistently higher now by about 10 to 15 percentage points and the two series again display different trends in the early 1980s. What s new here is that the earnings based series shows the well known result of a relatively constant ratio starting 1992, while the wage based ratio increases by over 5 percentage points over this period. Starting from the mid 1980s the earnings based ratio improves by just over 6 points while the wage based ration improves by just less than 12 points a dramatic difference. 7 Our earnings based series for workers aged are almost identical to the earnings based series available through CANSIM for workers of all ages shown in figure 1. 9
13 To more formally evaluate the difference between the two series we run a simple regression of the difference on a time trend and the prime age male unemployment rate. 8 The results are reported in table 2. For the series based on all workers there is some evidence of a cyclical relationship but little evidence of a trend. A rise in the unemployment lowers the difference between the wage and earnings based series perhaps because the gender difference in hours falls in recessions so that earnings comparisons more closely match the wage comparison. For full time workers there is both a cyclical and trend component. Consistent with the evidence in figure 2, over the period the two series diverge. Controlling for economic conditions, the linear trend specification result indicates a relative increase in the wage based series of almost 4½ percentage points over the period. To complete the analysis of this section, we conclude with evidence on the gender ratio for part time workers. Part time work is a heterogeneous category spanning casual jobs through effectively full time jobs parceled out over several workers in part time blocks. The series for part time wages and the earnings of full year part time employees are in figure 3. Either series conveys much more equitable outcomes then the series for full time workers. The wage series is consistently greater than 1.0 since the mid 1990s and peaks at over 1.2. The earnings based series is more variable but also rises above 1.0 on occasion. The gender ratio for full time prime age workers While the preceding evidence for full time workers is a good basis for point in time analysis, over longer periods it is important to consider economic and social trends that may change the composition of the sample. There are three that stand out for the period under study. 8 We also considered real GDP as a regressor. In the sample years the variable simply trends upwards and therefore is not well distinguished from the time trend. Note that we do not have observations on the wage series for either the 1982 or 1991 recessions. 10
14 First is the changing educational investment of young adults. For example, Neill (2006) reports a steady increase in the full time university enrollment of the year old population between 1979 and In some provinces the enrollment rate rose from under 10 percent to over 25 percent in this period. This means the types of young adults we observe working full time over the period could be systematically changing, which could in turn affect the gender wage ratio for this group. At the other end of the age distribution is changing retirement patterns, as an increasing number of Canadians leave the labour market in their early 60s or even their late 50s. For example, Milligan and Schirle (2008) document significant decreases in the employment rates of year old and year old males between 1976 and the mid 1990s with a rebound for both groups in the 2000s. For females in these age groups the employment rates are mostly flat until the 1990s when they also start to trend upwards. Again the resulting changes in the sample of adults working full time in these age groups could affect estimates of the gender wage ratio. We address both of these developments by selecting a sample of full time workers between the ages of 25 and 54. By age 25 most individuals have completed their schooling while the trend towards early retirement is not significant before age 55. The third trend is the rising employment rates for females of all ages over the period. In figure 4 we graph the full time employment rate of females (and males) aged Although there are some significant upward deviations in the 1980s, the male rate is roughly 0.80 throughout much of the period. The female rate shows two periods of substantial increase. Between 1981 and 1990 it rises from 0.44 to 0.54, and then from 1996 through 2007 it rises from 0.54 to Therefore over the sample period the rate rises by almost 20 percentage points. 9 The increase is from less than 10 percent to over 25 percent (on some provinces) between 1979 and
15 We clearly cannot address this development by tailoring our sample. In fact some authors have attributed the changes in the gender wage gap for the prime age population to these changes in the employment of females (Mulligan and Rubinstein 2008). While the source of any changes in the gender wage gap is not our primary purpose here, it is important to keep the changing labour market participation of females in mind as we review the evidence. We begin in figure 5 with evidence for the full age group. The series show good agreement with the evidence for the broader population in figure 2. The ratios for year olds are perhaps a shade lower, but there is still a steady 10 percentage point increase in the ratio over the 20 years starting in The numbers underlying this graph are reported in table A1 of the Appendix. We also graph the ratio based on medians to provide a view of the relative skewness of the male and female wage distributions and as way of addressing the topcoding of wages in a few of the surveys. Save for the late 1990s the ratios based on the medians and averages tell a very similar story. One of the reasons for focusing on wages is that earnings ratios combine information on wages and the number of hours worked and females tend to work less than males. This is certainly true for our sample of year old full time workers as can be seen in figure 6 where we graph total usual hours on the main job per week. There is substantial male/female gap in hours throughout the period starting at over 4 hours and ending at just short of 3½. The message from the graph of actual hours per week on the main job (not reported) is slightly different, as the ratio of female to male hours rises modestly and then declines over the period. In the next figures we provide information on the gender wage ratio by some important demographic characteristics. Figure 7 shows the series by ten year age groups. While all ages 12
16 see an increase in the wage ratio over the period the most dramatic improvement is for the year olds: upwards of 15 percentage points. The timing of the improvement differs by age group. For the youngest women almost all the increase is in the 1980s, while for older women the increase continues throughout the 1990s. This delay for the older age groups suggests the cohort effects may play some role. There is also a well defined age profile of the wage gap in each year, ranging as high as 20 points in the early part of the period and falling to under 10 points by the end. A different perspective on this finding is provided in figure 8 where we graph the age profile of the wage gap experienced by cohorts of males and female who enter the labour market at different points of our sample period. Here the story is quite different. The age profile of the gap is flat for the cohorts entering the labour market in the late 1970s and early 1980s. For later cohorts there is a downward sloping profile but the decline is relatively small compared to the cross section profiles in the previous figure. This suggests much of the cross section age profile in the gender wage gap is the result of cohort effects. In figure 9 are the results by marital status. 10 Married or common law females make steady progress throughout the period matching the results for all workers. Singles experience a significant improvement between the mid 1980s and mid 1990s, but lose some ground in the latter part of the period. It is important to note that the proportions in these different categories change significantly over the period. For example, the proportion of males reporting being married or common law ranges from a high of 83 percent in 1981 to a low of 69 percent in We code married and common law together in the LMAS, SLID and LFS data. Common law relationships are not separately identified in the SWH or SUM data, but the proportion of the sample reporting being married suggest those in common law relationships used this category. 13
17 In figure 10 are the results by education. Splits by education are difficult to construct because Statistics Canada changed the coding of education in 1989, and the post secondary educational sector has changed quite significantly over the period. The three categories that appear to be coded consistently over the period are 1) a university degree, 2) a post secondary certificate or diploma and 3) up to high school completion. Note there is some erratic movement in the university ratio in the late 1980s. Over the entire period there is notable convergence across the education categories with lower educated females catching up with their counterparts in the other groups. The university ratio holds steady or declines modestly over the period. The gender wage ratios by province are presented in figure 11. Females in most provinces enjoyed the progress over the period evident in figure 5. That said, there is considerable variation in the ratio across provinces over time. For example, by the end of the period there is over a 19 percentage point difference between the ratio in Alberta and the ratio in PEI. To make the relative standing of women in different provinces clearer, in table 3 we present averages of the ratios by province for selected sub periods. Presented this way the data suggest a few points. First women in PEI consistently fare better than their counterparts in other provinces. Second, females in Alberta, British Columbia and Newfoundland consistently face among the largest ratios in the country. Finally the ranking of Quebec in the distribution is quite steady at roughly third. Olivetta and Petrongolo (2008) argue that differences in the gender pay gap across countries can be partly explained by corresponding differences in female employment. If female employment exhibits positive selection, then those countries with lower female employment rates will have relatively higher wage women in the labour market and as a result a lower gender wage gap. At first blush this is not a promising explanation of the provincial differences in 14
18 gender wage gaps we observe. The Pearson correlation coefficient for this sample between gender wage ratios and female full time employment rates across provinces is as often positive as it is negative and averages over the period. In the next figure we investigate differences in the gender wage ratio by job tenure. Although females lifetime work experience still lags males (Drolet 2002), it has risen in relative terms throughout the period that is thought to have played role in changing gender pay ratios (Blau and Kahn 2006). Our data does not contain a measure of lifetime work experience. We do have a measure of current job tenure, however, which under certain assumptions should move with changes in lifetime experience. 11 The figure reveals changes in the gender wage ratio within tenure class that, with some exceptions, match the aggregate story. There is a degree of compression of the ratio across classes in the middle of the period, but by the last years the ratios spread out as they were at the beginning of the period. As noted above, there have been significant changes in the observable characteristics of our sample over the period. Relative to the 1980s, both males and females are now older on average, females have greater labour market experience relative to males, both groups are more educated and household relationships have changed. A very simple way of attempting to understand the impact of these changes on the gender pay gap is to ask what would the female - male ratio look like if the composition of the sample had remained the same throughout the period. To do this we construct a simulated gender wage ratios series keeping the distribution of a given characteristic at the 1981 levels but allowing the wages (prices) that a given characteristic commands to change over time. 11 For example, if females shorter experience results from fertility related job interruptions, and the expansion of maternity leave mandates promotes both their return to the labour market post birth and their job continuity across the birth event. See Baker and Milligan (2008). 15
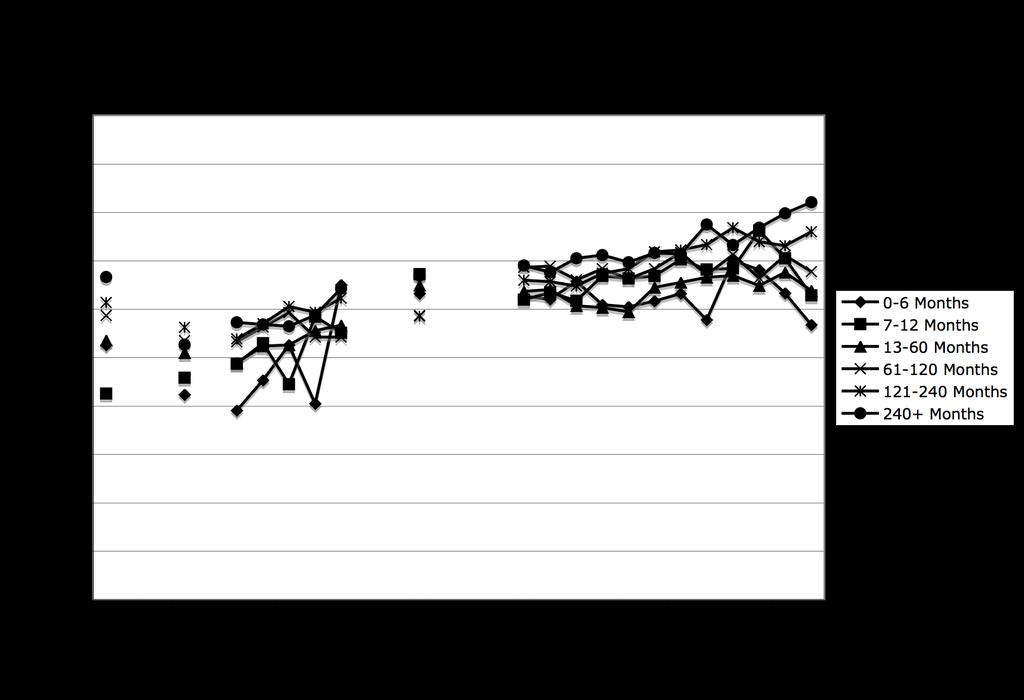
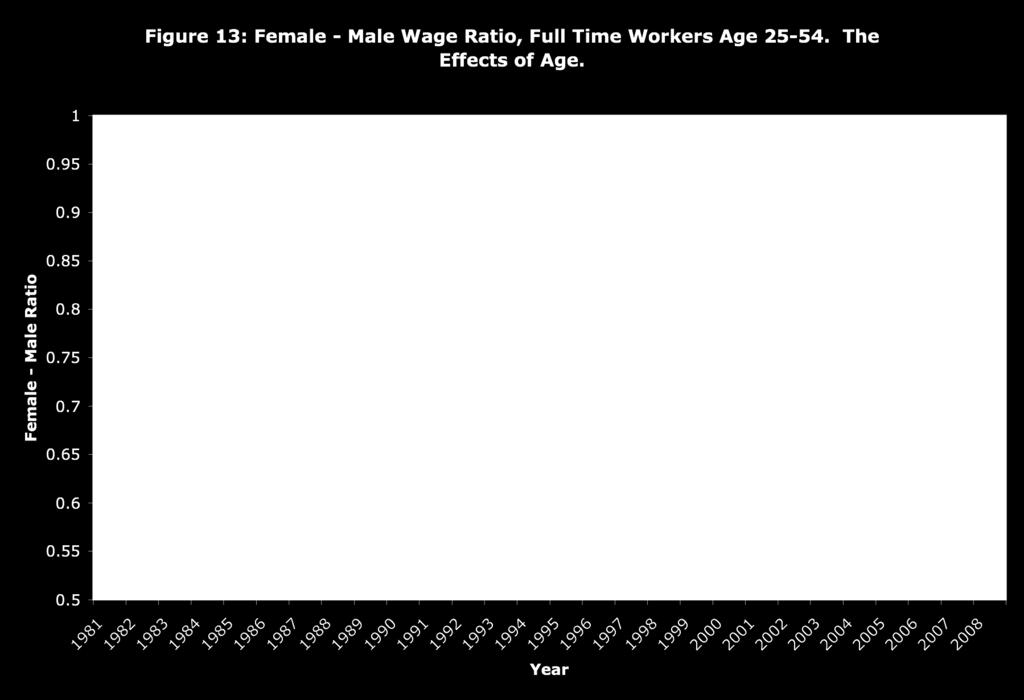
19 In figure 13 we investigate the effects of age. The average age of both males and females rose similarly in our sample over the period. The age group represented roughly 45 percent of the sample in 1981 falling to one-third of the sample by Because the gender wage ratio tends to larger at older ages (figure 6) we might expect this change to have some impact on the overall ratio. As we can see the aging made little difference. This is because as the sample aged the difference in the gender wage ratio by age narrowed (figure 6). The results by tenure are in figure 14. The actual and simulated series track each other quite closely through the 1980s but a gap opens up in the 1990s. By the end of the period there is 2½ percentage point gap between the two ratios. Based on this admittedly simplistic analysis about 24 percent of the increase in the gender wage ratio between the mid 1980s and the end of the period is due to the relative increase in females job tenure. Regression Adjusted Estimates We next turn to regression adjusted estimates of the gender wage gap that can help us understand how differences in observable characteristics across males and females can account for any corresponding differences in wages. We begin very simply, by pooling the male and female samples and estimating the equation (1) lnw i = X i " + F i # + $ i. Individual i s log wages are modeled as a function of explanatory variables X i, a dummy variable F i for females and an error term. In this specification both males and females attributes are valued at an average of the males and female prices. While this is clearly restrictive, this specification has the advantage of allowing us to make some simple points about the conditional (adjusted) wage gap easily. We present estimates from the more traditional specification that allows separate parameters for males and females below. 16
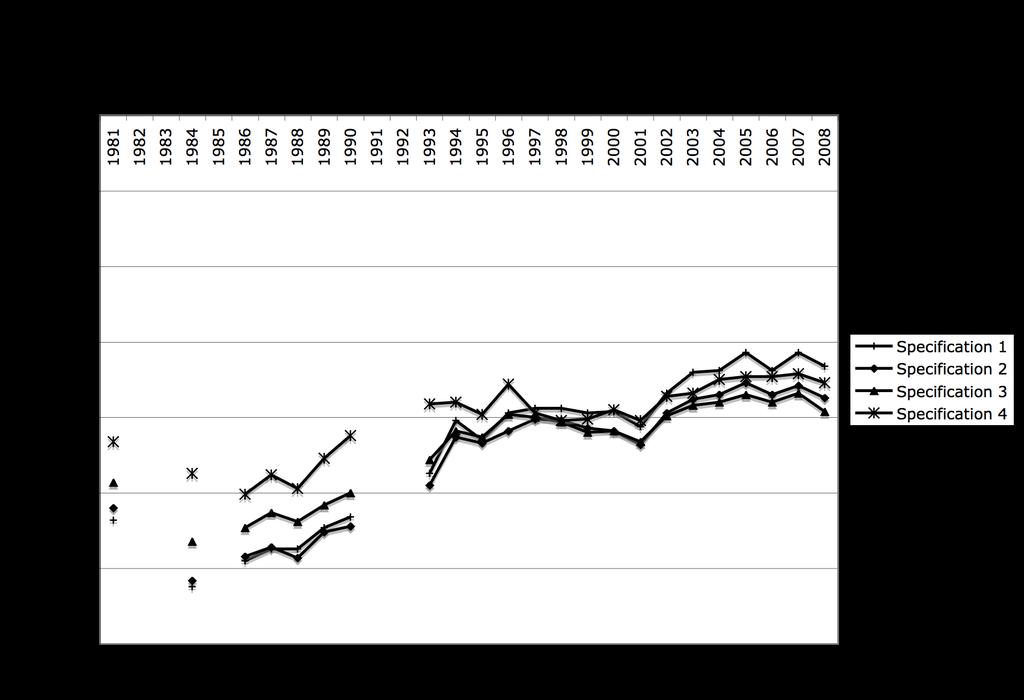
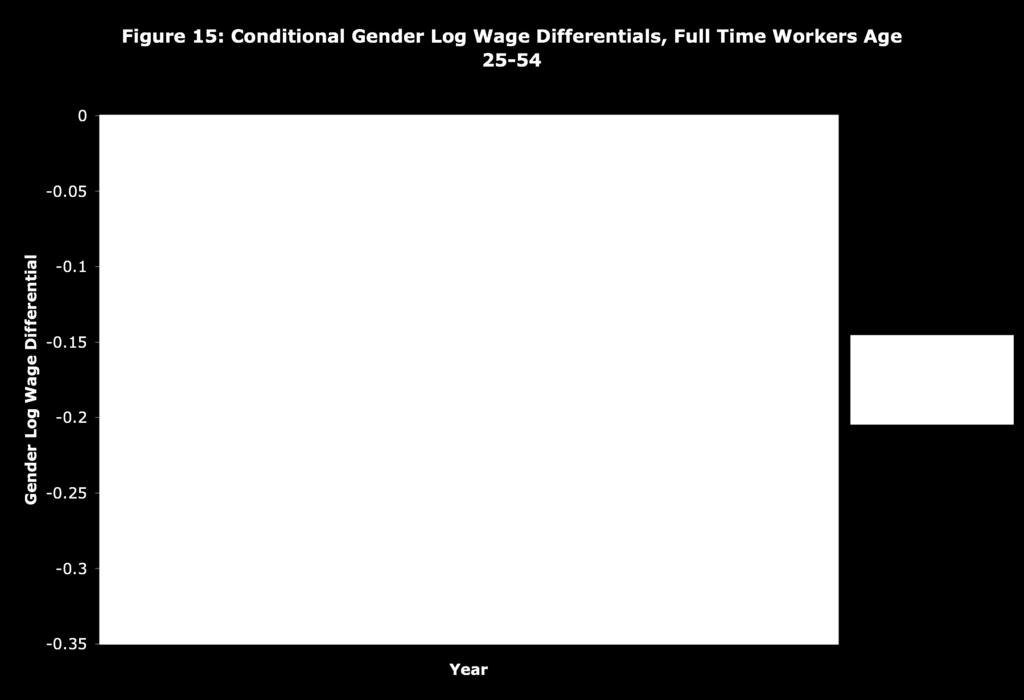
20 We estimate four specifications of the explanatory variables. The first serves as a baseline and includes only the female dummy but no other explanatory variables (called Specification 1). For the second we add controls for age, education, and province (Specification 2). The third add controls for marital status, union status and tenure (Specification 3). Finally the fourth adds controls for industry and occupation (Specification 4). The definition of these variables is provided in the Appendix. Because the objective of this part of the analysis to provide an overview of trends over the period, we present estimates of the " graphically by year. All the estimates presented this way are statistically significant at least at the 5 percent level. The results are presented in figure 15. In the early years of the time series the results line up across specifications as might be expected. The largest gap is in specification 1 (implied wage ratio of 0.76) and the smallest in richest (implied wage ratio 0.81). Also as expected is the explanatory variables do not make a huge difference. Even when controls for industry and occupation are added to the regression we can account for about 5 cents of the gender wage gap. In later years of the period there are two perhaps surprising developments. First the difference in the implied wage gaps from the baseline and richer specifications converge. By the last years all the estimates are clustered together. Second the estimate from the baseline specification actually implies the smallest wage ratio. For example, in 2008 the implied ratio from the baseline specification is 0.85, while the ratio from the richest specification is 0.84 (even lower for some of the leaner specifications). Typically, and in earlier years here, we expect that accounting for observable characteristics will close some of the gender gap in pay. By the last years of our sample, however, accounting for observable characteristics makes the gender gap larger. This twist in the ordering of the estimates across specifications suggests that females 17
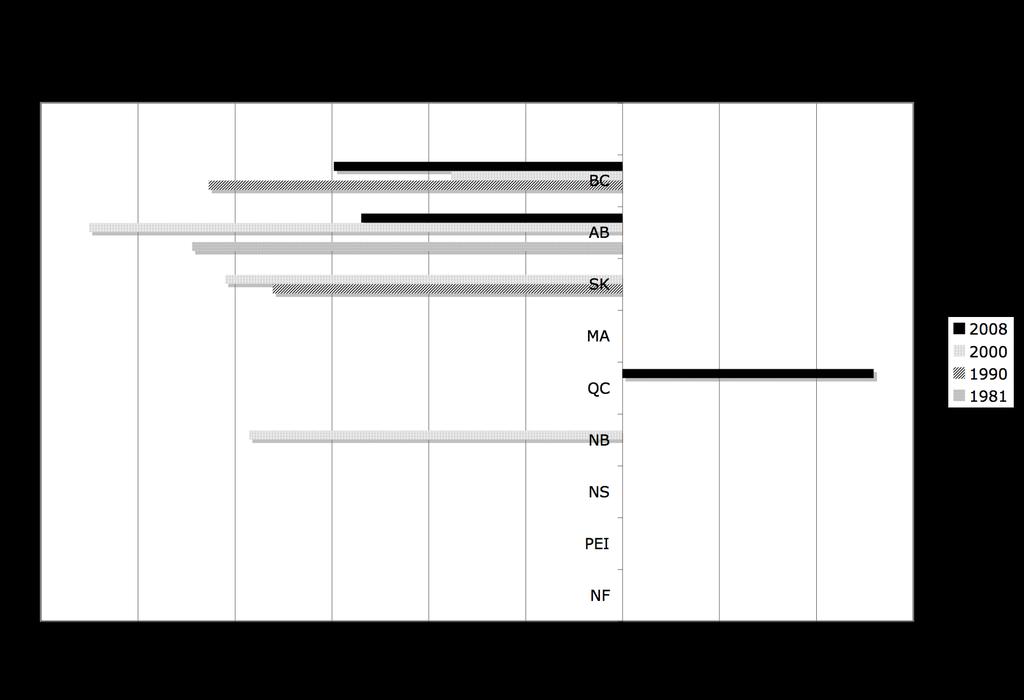
21 observable characteristics have changed to levels that we would expect them to be paid more than males. Of course in this specification we may be overvaluing female characteristics by not allowing separate parameters on the X i by gender. Another issue we can explore with this specification is the differences in the gender wage ratios by province. To do this we add a full set of interactions between the female dummy variable and the dummy variables for province. We use the same specifications. Again we present the results graphically for selected years and only report interactions that are statistically significant at the five percent level. The results are reported in figures 16 and 17. We report the provincial interactions as deviations from the gender wage gap in Ontario (the omitted province). Therefore a negative number indicates that the gender log wage differential is larger in the indicated province than in Ontario. Because our interest is to discover how provincial differences in the gender wage gap can be mitigated by differences in the characteristics of their workers we focus on two of our richer specifications, specifications 3 and 4. Only estimates statistically significant at least at the 5 percent level are reported. The first thing to notice is that in that many of the provincial interactions are not individually statistically significant. Therefore, many of the provincial differences identified in table 3 are not statistically distinguishable in our sample once we account for differences in industry, occupation and the other explanatory variables across provinces. Next, in either specification there is a tendency for the gender wage differential to be larger in the western provinces and this persists through the sample period. Finally, a recent development is a smaller gender gap in Quebec. 18
22 We next turn to the more traditional Blinder-Oaxaca decompositions of the gender wage gap that are common in the literature. This is accomplished by dropping the dummy variable for females from equation (1) and estimating the equation separately for the male and female samples. Then we can express the difference in mean log wages between males and females as (2) lnw M " ln w F = ˆ # M (X M " X F ) + X F ( ˆ # M " ˆ # F ). The first component of this decomposition is usually interpreted to explain some portion of the log wage gap as due to differences in the average values of the explanatory variables across males and females. The second component is usually referred to as the unexplained portion of the gap, resulting from gender differences in the returns the different explanatory variables command in the labour market. There is some debate over which explanatory variables can be legitimately included in this regression. Occupation provides a nice demonstration of the issues. Some people believe that differences in occupation across the genders are the result of differences in preferences between males and females and so there is little reason not to include them in the decomposition. Other people believe that women are forced into certain occupations and/or denied access to others so that gender differences in occupation are in fact a measure of the discrimination females face in the educational system and in hiring. In this case including occupation in the regression runs the risk of explaining discrimination with discrimination. Rather than taking a strong stand on this issue we offer decompositions of the log wage gap using both specifications 2 and 4. The specification 2 includes only age, education and province. Specification 4 includes all the available explanatory variables including industry and occupation. 19
23 The results for specification 2 are reported in table 4. At the beginning of the period the decompositions are in line with similar analyses of this time, in that the explained part of the gap is very small. For example in 1981 nearly 98 percent of the gap is unexplained. This is due to the strong similarities in average age, province and education across the genders. In later years differences in the explanatory variables begin to gain some traction but perhaps not in the way we would expect. These differences increasingly explain a negative proportion of the gap: -11 percent by the end of the period. What this means is that based on gender differences in age, education and province we would expect females to be paid more than males. This result is driven by gender differences in education. At the beginning of the period a higher proportion of males had a university degree. By the end of the period females in the sample, by a substantial margin, are more likely to be university educated. As a result the unexplained component of the log wage gap grows to 114 percent by The decomposition using specification 4 is reported in table 5. Here again the period begins with the expected result. Now a greater proportion of the gap is explained, but it is still fairly modest just over one-third in the mid 1980s. In later years the explained component gets smaller although it never becomes negative. It is again gender differences in education doing some of the work, accounting for just over -5 percent of the gap by However, relative to specification 2 the contribution of education is roughly halved. The contribution of gender differences in occupation initially alternate positive and negative, but by the end of the period it is solidly negative at about -10 percent. What keeps the overall explained component positive is the significant positive contribution of gender differences in industry throughout the period. The health industry appears to play the dominant role in most years. The proportion of females in this industry far exceeds the proportion of males, and the estimated parameter on the health 20
24 industry dummy in the male wage equation is typically large and negative. The overall result of all these developments is that the unexplained component of the log wage differential rises throughout the period from below 70 percent to over 80 percent. An alternative perspective on changes in the gender wage gap over time is provided by a dynamic Blinder-Oaxaca decomposition. A straightforward extension of equation (2) leads to the following decomposition of the change in the gender wage gap between time t and (t-j): (3) (ln w Mt " ln w Mt" j ) " (lnw Ft " lnw Ft" j ) = [ ˆ # Mt (X Mt " X Mt" j ) " ˆ # Ft (X Ft " X Ft" j )] + [X Mt" j ( ˆ # Mt " ˆ # Mt" j ) " X Ft" j ( ˆ # Ft " ˆ # Ft" j )]. The first component on the right hand side of the equation captures the impact of relative changes in the productive characteristics of males and female in the labour market. The second term captures the corresponding impact of changes in the relative prices these characteristics command. In table 6 we provide this decomposition for the entire sample period as well as selected years that are at roughly the same point of the business cycle. Over the entire time period almost 60 percent of the reduction in the log wage gap can be accounted for by changes in characteristics. While no one characteristic dominates, significant increases in the proportion of females with university degrees and in the managerial and social science/education/government occupations play important roles. The message of this analysis is that in many dimensions females possess characteristics that would lead us to expect they would be paid more than males; at least if they commanded the same returns to these characteristics that males do. The exception is their industrial distribution, particularly their presence in the health industry. In this dimension males hold an advantage and so industry accounts for a significant proportion of the wage gap. Nevertheless, as the gender wage gap has declined it is increasingly accounted for by gender differences in the returns males 21
25 and females command for their characteristics in the labour market; what is traditionally called the unexplained component of the gender pay gap. Furthermore, the decline in the gap has been furthered by the improving educational and occupational attainment of women. Discussion and Interpretation Our analysis indicates that the gender pay ratio based on wages is significantly different from the corresponding ratio based on earnings. Is this true in other countries? O Neill (2003) provides a view of both the gender gap in full time year round earnings and hourly wages for the US over much of the period we study. First, as is the case for Canada the ratio based on wages is consistently higher than the earnings ratio, typically by a margin of 5 to 12 percentage points. Second, the two series follow different paths in some periods, notably over the 1990s the wage series stalls while the earnings based series continues to rise. Third over the 1990s the wage based ratio is roughly 0.80, comparable to what we report for Canada. Olivetta and Petrongolo (2008) report gender log wage gaps for the US and a selection of European countries in The calculation of the hourly wage is slightly different; the ratio of annual or weekly earnings divided by the number of hours over this period. 12 The gender wage ratios implied by these gaps vary widely from a low o 0.72 in the U.S. to 0.95 in Greece. Our estimate of Canada s ratio at this time is , and Finland and Ireland are reported to have ratios at this level. One issue Olivetta and Petrongolo (2008) stress is that it is important to account for the labour market participation of women when comparing results across jurisdictions or over time. While the annual publication of the gender pay gap does not consider this issue or others such as gender differences in observable characteristics it is clearly an important topic for future research. 12 As noted above Fortin and Schirle (2006) use a similar methodology for Canada and report gender pay ratios that are somewhat lower then the ones we report for the same period. 22
26 While our evidence comes with these sorts of qualifications, perhaps the strongest implication of our results is that there is a strong case to start reporting the gender pay gap in terms of wages rather than earnings. The LFS now provides a timely and consistent report of wages over time, and the wage gap is the primary interest of theories of gender discrimination and public policy in this area. Conclusions We present new evidence of the gender pay gap in Canada. Our new series of the gender pay ratio is based on wage data rather than the earnings data that is more commonly reported and the subject of policy debate in Canada. Bringing together data from multiple data sets, we demonstrate how the wage based ratio differs from its earnings based counterpart and how it varies by geography, education and other demographic characteristics. The wage based series is different in both level and trend. It is consistently higher than the earnings based ratio by 10 to 15 percentage points. In 2006 the wage based ratio for full time workers stood at 0.85, while the earnings based ratio for full year full time workers stood at It also changes differently over time. Of particular note the wage based ratio displays steady if modest progress over the last 15 years while the earnings based ratio remains stalled. We also investigate how the wage based gender gap changes as we control for gender differences in productive characteristics. In many dimensions females increasingly hold an edge on males in this regard. As a result if females commanded the same returns to these characteristics as males we would expect them to be receive higher not lower wages than males. The most significant exception to this conclusion is the industrial distribution of employment in which males hold a significant advantage. Over time as the gender wage gap has 23
27 fallen, the proportion of it that is unexplained due to gender differences in the returns to characteristics in the labour market has neared 100 percent. We note that the earnings/wage distinction has proved important in other gender based comparisons. For example, Caponi and Plesca (forthcoming) find the male/female difference in the returns to university disappear once wages are the measure of compensation instead of earnings. The LFS now provides timely, consistent evidence on the wages of male and female workers in the Canadian economy. There is a strong case for moving the annual report of the gender pay ratio and the policy debate that surrounds it to a wage basis. 24
28 Appendix Variable Definitions Age: 10 year age groups. Quadratic in age in Tables 4 and 5 (midpoint of 10 year age intervals used in 1981 and 1984). Province: 10 Education: high school, post secondary, university Union: 0/1 Married: Married or common law (see footnote 10) Tenure: 0-6, 7-12, 13-60, , , 240+ months Industry and Occupation Standardized classification systems provide a systematic classification structure that categorizes the entire range of economic activity in Canada. The industry in which a person works is determined by the main economic activity of the employer while occupation reflects the kind of work performed. Often there is a strong relationship between occupation and industry since certain occupations are predominant in some industries. However, several of occupations may be found in any given industry. The industrial classification systems are hierarchical in nature composed of sectors (at the highest level) to industries (as the most detailed level). Industries within sectors are grouped according to their similarity of input structures, labour skills or production processes used. Occupational classification are identified and grouped primarily according to the work usually performed, as determined by the tasks, duties and responsibilities of the occupation. It is customary to revise these classifications to reflect the changing nature of the economy. As such, comparability over time is an issue. The industry data used in this paper is based on Standardized Industrial Codes SIC (1980) and the North American Industrial Classifications System (NAICS) The SIC classification differs from the NAICS classification in a number of important ways making comparability over time difficult. First, NAICS classifies industries on the basis of common inputs and process while the basis of the SIC was on outputs. Second, major changes included in the NAICS include classifications for new and emerging industries, service industries and industries engaged in the production of advanced technologies. Since many of the industries are being recognized for the first time, no SIC equivalent exists. Third, some industries used in the 1980 SIC classifications, were split or combined, or recombined into new NAIC industries. For example, Construction in SIC 1980 includes inspection services and excludes some repairs whereas while NAICS excludes inspection and includes some repairs. The following table based on the publication Labour Force Update (Statistics Canada, Cat no XPB) shows how the distribution of sector employment by each classification corresponds to that of the other system That is, it shows the proportion of a sector s employment according to (first) classification that would also be classified to the same sector using the 25
29 (second) classification. For example, 97.3% of the Agriculture sector in NAICS would be classified as the Agriculture using the SIC. Likewise, 92.6% of the Agriculture sector in SIC would be classified as the Agriculture using the NAICS. Distribution of employment Code SIC 80-NAICS97 NAICS97- SIC 80 1 Agriculture Fishing, Trapping, Forestry, 2 Mining Utilities Construction Manufacturing Mfg-Durables 6 Mfg-Non-durables Trade Wholesale 8 Retail 9 Transport-Warehousing FIRE Business services (1) Professional (2) Business support services (2) 12 Education Health Information (4) 15 Accommodation, Food Other services 37.7 (3) 53.8 (5) 17 Public Administration Unclassified There is no industry sector that is consistently defined in both systems. Although the majority of units would fall into the correct classification regardless of which system is adopted, (no less than 80% of total employment in 1998 would have consistent industry codes). Partial relationships exist for the following: (1) Employment in SIC Business services sector found in NAICS Professional Sector (73.7%) and found in Business Support services (17.7%). (2) 92.8% of employment in NAICS Professional sector and 40.5% of employment in Business Support sector found in SIC Business services. (3) Employment in SIC other services found in NAICS Information sector (24.1%), Business support sector (20.5%) and in other services (37.7%). (4) Employment in NAICS Information sector found in SIC manufacturing (13.4%); transportation, storage and communications (34.1%); and other services (39.2%). (5) Employment in NAICS other services found in SIC trade (28.2%) and in health (12.9%). 26
30 To further aggravate the problem, the industry data in SUM-SWH-LMAS is at an aggregated level. That is, there are 52 industry groupings corresponding to SIC The LFS uses 4-digit NAICS codes. Every attempt was made to harmonize the classification systems over time in order to minimize the impact of partial relationships between systems and to maximize the usefulness of the data. Concordance tables were used to derive the following industry breakdown. INDUSTRY NAIC 2002 LFS SLID Aggregated SIC SUM-SWH-LMAS 52 groupings 2-digit SIC Agriculture Subsector Industry group Forestry, Fishing, Mining, Oil and Gas Subsector Industry group 1153 Sector Utilities Sector Construction Sector , Manufacturing Sector Durables , , , 16, 17, 20-24, , 25, 26, 29-35, 39 6 Non-durables , , 12-15, 18, 19, ,24, 27, 36, 37 Trade Sector Wholesale trade Sector Retail trade Sector Transportation and Sector Warehousing 10 Finance, Insurance, Real Sector Estate and Leasing 11 Business Services Professional services Sector 54 Business and building Sector support 12 Educational Services Sector Health Care and Social Sector Assistance 14 Information, Culture and Sectors 51 and 71 19, 33, 43 28, 48, 96 Recreation 15 Accommodation and Food Sector Services 16 Other services Sector
31 17 Public administration Sector 91 42, 45, Using the 4-digit LFS NAIC codes, it is possible to classify industries that have changed sectors into a harmonized concept. The following adjustments were made to further harmonize the industry classification. Description NAICS SIC Equivalent Harmonized Notes Animal aquaculture Animal production Major Group 03 Fishing 2 NAIC code fully corresponds to SIC 1125 Retail trade 4413, , 4461, 4532 Printing, Publishing and Allied Industries Postal / courier service Information and Culture Publishing Industries 5111, 5112 Transportation Postal service 4911, 4912 Major Group 28 Manufacturing Printing, Publishing and Allied Industries Major group 48 Communications equivalent 8 NAIC retail codes include both SIC retail and wholesale codes. SIC cannot be disaggregated. 14 SIC code includes commercial printing, platemaking, typesetting and bindery industries as well as publishing industries. 14 SIC code 48 includes telecommunication and broadcasting industries. Include postal service in Information sector. Business services 5413, 5417, 5419 Major group Partial relationships in NAICS codes Utilities 5621, 5622,5629 Other utilities 3 Waste management Other services Recreation Personal services Household repair Advocacy groups Education Other schools 6116 Major group Major group 99 Other services Retail Repair and Major group Includes athletic instruction 28
32 Wholesale Maintenance Automotive 8111 Repair and Maintenance Electronics Retail Major group 57 7 SIC includes a wholesale not personal service The following table shows the distribution of employment by industry classification system using data from the LFS. The first two columns SIC1980 and NAICS 1997, are based on estimates from the Labour Force Update while the last two columns are based on workers aged in May 1998 excluding those with unknown wages. For the most part, the distributions look similar and that the harmonized industry coding system will not introduce any systematic bias into our results. Distribution of employment by industry classification, 1998 Code Industry SIC 1980 NAICS 1997 NAICS 2002 Harmonized SIC NAICS Agriculture Fishing, Trapping, Forestry, Mining Utilities Construction Manufacturing Mfg-Durables Mfg-Non-durables 7.5 Trade Wholesale Retail Transport-Warehousing FIRE Business services Professional Business support services Education Health Information Accommodation, Food Other services Public Administration Unclassified
33 The occupation data used in this paper is based on the Standardized Occupation Codes 1980 (SOC-1980) and the National Occupation Code (NOC 2001). The SOC classification differs from the NOC classification in a number of ways. First, SOC 1980 corresponds to economy of the 1970s and 1980s. Occupations in decline tend to be overrepresented in the SOC 1980 while there are too few in rapidly expanding service sectors. Second, groups are better defined according to skill level in NOCs. Third, technical occupations are separated from professional occupations in NOCs. A similar strategy used in the preceding analysis on harmonizing industry codes was used to harmonize occupation codes. There are 50 occupation groupings corresponding to SOC The LFS uses 4-digit NOC codes. Every attempt was made to harmonize the classification systems over time in order to minimize the impact of partial relationships between systems and to maximize the usefulness of the data. Concordance tables are not available for SOC 1980 and NOC Tables using SOC SOC 1991; SOC 1991 NOC 1997; and NOC 1997 NOC 2001 were used to derive the following occupation breakdown. Main differences between the SOC and NOC classification systems include: Greater detail in managerial, natural and applied science and services such as travel and tourism Technical occupations have been separated from professional occupations Supervisors are allocated to a separate group in sales and service occupations. The following table provides a very broad look at the relationship between the NOC and the SOC aggregates. However, there are significant Occupation Codes 4 digit NOC LFS-SLID SOC Aggregate SUM-SWH-LMAS Management* A 1-3 Business Finance and Administrative B Natural and applied sciences C 4-7 Health D Social science, Education, Government and E 8-12 Religion Art, Culture, Recreation and Sport F 16 Sales and Services G Trade, Transport, Equipment Operators and H related Unique to primary industry I Unique to Processing, Manufacturing and Utilities J Unclassified 30
34 Using the 4 digit NOCs codes in the LFS, the following adjustments were made to harmonize the occupation classification. NOC Description NOC Code SOC Equivalent Harmonized Supervisors: Sales, A211, A221-2 Sales and Service Sales and service Services Protective services A351-3 Protective services Sales and service 25 Other service managers A361 Sales and services Sales and service Residential home A372 Other construction trades Trade builders, renovators Securities agents B013 Sales agents and traders Sales and service Other financial officers B014 Assessors and brokers B115-6 Other sales and services Sales and service Insurance Underwriter B114 Management & Management administrative Dispatchers Transportation Route and Crew B575 B576 Other transportation operators Equipment operators Bookkeepers, loans, claims Secretaries Clerical Supervisors Clerical Occupations B111-3 B2 B4 B5 (excl. B575-6) Bookkeepers Secretaries and stenographers Other clerical Clerical Administrative and B3 Management Management regulatory occupations Professional occupations B0 (excl B013- Management Management in business and finance 4) Electrical service C142-4, C162 Repairing services Processing technicians Technical and regulatory C162-3 Inspectors Management inspectors Transport operators and C17 Other transport Transport controllers Industrial designer C152 Product and interior Art, recreation designer Program officers unique E037 Government officials Management to government Broadcast / Audio / F124-5, F127 Electronic equipment Trans Video technicians operator Artisans and craft F144-5 Processing Grain elevators G134 Management Management Cashiers G311 Cashiers and Tellers Clerical Occupations in travel and accommodation G711-5 Travel clerks Clerical 31
35 Tour and travel guides G721 Sales Sales & Service recreation G722, G731 Recreation Recreation Early childhood G812 Elementary educator Education educators Elemental Medical and Hospital Assistants G951 Nursing, therapy and related Health Commercial divers H522 Other services Sales & Service Pest control and H534 Other services Sales & Service fumigators The following table shows the distribution of employment by occupation classification system using data from the LFS. For the most part, the distributions look similar and that the harmonized industry coding system will not introduce any systematic bias into our results. Note that Business occupations in NOCS have been classified as clerical or management based on the SOC equivalent. Distribution of employment SOC 1988 NOC 1998 Harmonized 1998 Management Business Finance and Administrative* 19.9 Clerical Natural and applied sciences Health Social science, Education, Government and Religion Art, Culture, Recreation and Sport Sales and Services Trade, Transport, Equipment Operators and related Unique to primary industry Unique to Processing, Manufacturing and Utilities
36 Table A1: The Gender Wage Ratio for Full Time Workers in Selected Years Year Age Age
37 Appendix Table 2. Surveys, Sample Sizes, and Wage/Hours Definitions Full Time Workers Age Year Survey Sample Size Wages Hours Males Females 1981 SWH 13,602 7,302 Usual wage or salary before taxes and other deductions. Includes tips, no reference made commissions, bonuses and overtime. No topcoding. Usual days per week + usual hours per day. No reference to overtime SUM Usual wage or salary before taxes and other deductions. Includes tips, no Weeks worked in usual hours 11,719 7,321 reference made commissions, bonuses and overtime. No topcoding. per day. No reference to overtime LMAS 14,010 8,823 Usual wage or salary before taxes and other deductions. Includes tips, no Usual paid days per week + usual hours ,366 10, ,733 9, ,532 9, ,307 9, SLID 5,494 4, ,807 4, ,629 4, ,739 8, LFS 17,654 13, ,964 13, ,115 14, ,124 14, ,291 14, ,543 14, ,697 14, ,855 14, ,253 14, ,764 15, ,760 15, ,685 15,375 reference made commissions, bonuses and overtime. Minimal topcoding Usual wage or salary before taxes and other deductions includes tips, commissions, bonuses and paid overtime (includes items all together). Some topcoding. Wage or salary before taxes and other deductions includes tips, commissions, and bonuses but explicitly excludes paid overtime. Wage or salary before taxes and other deductions includes tips, commissions, and bonuses but explicitly excludes paid overtime. No topcoding. per day. No reference to overtime. Usual paid days per week + usual hours per day. No reference to overtime. Usual paid hours per week. No reference to overtime Usual paid hours per week explicitly excluding overtime. 34
38 References Baker, M, Benjamin, D., Desaulniers, A., and M. Grant. The Distribution of the Male/Female Earnings Differential: , Canadian Journal of Economics, 28, August 1995, Baker, M. and N. Fortin, Occupational Gender Composition and Wages in Canada: , Canadian Journal of Economics, 34, May 2001, Baker, M. and N. Fortin, Comparable Worth in a Decentralized Labour Market: The Case of Ontario, Canadian Journal of Economics, 37, November Baker M. and K, Milligan, How does job-protected maternity leave affect mothers employment?, Journal of Labor Economics, 26, October 2008, Blau, F. and L.M. Kahn, The US Gender Pay Gap in the 1990s: Slowing Convergence, Working Paper 508, IRS, Princeton University, March Caponi, V. and M. Plesca Post-Secondary Education in Canada: Can Ability Bias Explain the Earnings Gap Between College and University Graduates?, Canadian Journal of Economics, forthcoming. Christofides, L.N., and R. Swidinsky, Wage Determination by Gender and Visible Minority Status: Evidence from the 1989 LMAS, Canadian Public Policy, 20, 1994, Doiron, D. and W.C. Riddell, The Impact of Unionization on Male-Female Earnings Differences in Canada, Journal of Human Resources, 1994, 29, Drolet, M., New Evidence on Gender Pay Differentials: Does Measurement Matter?, Canadian Public Policy, 28, 2002a, 1-16 Drolet, M., Can the Workplace Explain Canadian Gender Pay Differentials, Canadian Public Policy, 28, 2002b, S41-S63. Fortin, N. and T. Schirle. "Gender Dimensions of Changes in Earnings Inequality in Canada" with Nicole Fortin, in Dimensions of Inequality in Canada, ed. David A. Green and Jonathan R. Kesselman. Vancouver: UBC Press Gunderson, M., Decomposition of the Male/Female Earnings Differential: Canada 1970, Canadian Journal of Economics, 12, 1979, Gunderson, M., Women and the Canadian Labour Market: Transition Towards the Future, Statistics Canada: Census Monograph Series, , Holmes, R., Male-Female Earnings Differentials in Canada, Journal of Human Resources, 11, 1976,
39 Kidd, M.P. and M. Shannon, The Gender Wage Gap in Canada over the 1980s, in M. Abbott, C. Beach and R Chaykowski (eds.) Transition and Structural Change in the North American Labor Market, Kingston ON: IRC Press, 1997, Maki, D. and I. Ng., Effects of Trade Unions on the Earnings Differential between Males and Females: Canadian Evidence, Canadian Journal of Economics, 23, 1990, Miller, P.W., Gender Differences in observed and Offered Wages in Canada: 1980, Canadian Journal of Economics, 20, 1987, Milligan K. and T. Schirle, Working while receiving a pension: Will double dipping change the elderly labour market?, Mimeo, University of British Columbia, April Mulligan C.B., and Y. Rubinstein, Selection, Investment and Women s Relative Wages Over Time, Quarterly Journal of Economics, 123, August 2008, Neill, C., Tuition Fees and the Demand for University Places, Wilfred Laurier University, Ollivetti, C and B. Petrongolo, Unequal Pay or Unequal Employment? A Cross Country Analysis of Gender Gaps, Journal of Labor Economics, 26, 2008, O Neill, J. The Gender Gap in Wages Circa 2000, American Economic Review, 93(2), 2003, Robb, R., Earnings Differential between Males and Females in Ontario, Canadian Journal of Economics, 11, 1978, Shapiro, D.M. and M. Stelcner, The Persistence of the Male-Female gap in Canada: The Impact of Equal Pay Laws and Language Policies, Canadian Public Policy, 13, 1987, Statistics Canada, Income Trends in Canada , Ottawa: Statistics Canada, (13F0022XCB). Wannel, T., Male-Female Earnings Gap Among Recent University Graduate, Perspectives on Labour and Income, Cat. No E, Summer 1990, Ottawa: Statistics Canada. 36
40 Table 1: Some Estimates of the Female/Male Earnings Ratio in Canada Source Year Data Source Unadjusted Ratio Adjusted Ratio Baker et al. (1995) Gunderson (1998) 1970 Census 1980 Census 1985 Census 1985 SCF 1990 SCF 1970 Census 1980 Census 1990 Census Adjusted Ratio: The productive characteristics included are: (Baker et al. 1995) years of education and years of potential experience, region, marital status, children and occupation; (Gunderson 1998) age, vocational training, education attainment, marital status, language, immigrant status, province, hours worked, occupation and industry. 37
41 Table 2: Cyclical and Trend Differences Between Wage Based and Earnings Based Estimates of the Gender Pay Ratio Unemployment Rate (0.002) Trend (0.0004) All Workers (0.003) (0.002) Trend Squared (0.0001) (0.002) (0.0004) Full Time (0.003) (0.0021) ( ) p-value H 0 : t=0 t 2 = Durbin Watson Notes: The reported estimates are the result of a regression of the gender wage ratio, , on the indicated explanatory variables. Standard errors in parentheses. 38
42 Table 3: The Average Gender Wage Ratio by Province for Selected Periods NF 0.75 (9) PEI 0.83 (1) NS 0.76 (6) NB 0.82 (2) QU 0.81 (3) ON 0.76 (6) MB 0.77 (5) SA 0.81 (3) AB 0.71 (10) BC 0.76 (6) 0.73 (9) 0.81 (1) 0.79 (2) 0.74 (8) 0.77 (4) 0.77 (4) 0.78 (3) 0.75 (6) 0.75 (6) 0.72 (10) 0.79 (9) 0.88 (1) 0.83 (3) 0.81 (7) 0.83 (3) 0.84 (2) 0.83 (3) 0.80 (8) 0.78 (10) 0.82 (6) 0.83 (8) 1.00 (1) 0.89 (3) 0.87 (6) 0.89 (3) 0.85 (7) 0.90 (2) 0.88 (5) 0.78 (10) 0.83 (8) Notes: Provincial rank in parentheses. 39
43 Table 4: Binder-Oaxaca Decompositions of the Gender Log Wage Gap Specification 2 Year Log Wage Gap Explained Component Contribution of Differences in Education Unexplained Component Notes: The reported statistics are the result of decompositions of the gender wage gap in the indicated year. The explanatory variables are age, education and province. The decomposition is made using the male parameters and female means as weights. The explained and unexplained components are as defined in the text. The two components may not add exactly to the overall log wage gap in some years due to rounding. The contribution of difference in education is to the explained component. 40
44 Table 5: Binder-Oaxaca Decompositions of the Gender Log Wage Gap Specification 4 Year Log Wage Gap Explained Component Contribution of differences in Unexplained Component Education Occupation Industry Notes: The reported statistics are the result of decompositions of the gender wage gap in the indicated year. The explanatory variables are age, education and province, union status marital status tenure, occupation and industry. The decomposition is made using the male parameters and female means as weights. The explained and unexplained components are as defined in the text. The two components may not add exactly to the overall log wage gap in some years due to rounding. The contribution of differences in education, occupation and industry are to the explained component. 41
45 Table 6: Dynamic Binder-Oaxaca Decompositions of the Gender Log Wage Gap Specification 4 Period Change in Log Explained Unexplained Wage Gap Notes: The reported statistics are the result of decompositions of the change in gender log wage gap between the indicated years. The explanatory variables are age, education and province, union status marital status tenure, occupation and industry. The explained and unexplained components are as defined in the text. The two components may not add exactly to the overall log wage gap in some years due to rounding. 42
46 43
47 44
48 45
49 46
50 47
51 48
52 49
53 50
54 51
Monitoring the Performance
 Monitoring the Performance of the South African Labour Market An overview of the Sector from 2014 Quarter 1 to 2017 Quarter 1 Factsheet 19 November 2017 South Africa s Sector Government broadly defined
Did the Social Assistance Take-up Rate Change After EI Reform for Job Separators?
 Did the Social Assistance Take-up Rate Change After EI for Job Separators? HRDC November 2001 Executive Summary Changes under EI reform, including changes to eligibility and length of entitlement, raise
THE GENDER WAGE GAP IN NEW BRUNSWICK
 THE GENDER WAGE GAP IN NEW BRUNSWICK Prepared for GPI Atlantic By Ather H. Akbari Department of Economics Saint Mary's University Halifax, NS E-mail: Ather.Akbari@SMU.Ca October, 2004 ACKNOWLEDGEMENTS
The Gender Earnings Gap: Evidence from the UK
 Fiscal Studies (1996) vol. 17, no. 2, pp. 1-36 The Gender Earnings Gap: Evidence from the UK SUSAN HARKNESS 1 I. INTRODUCTION Rising female labour-force participation has been one of the most striking
It is now commonly accepted that earnings inequality
 What Is Happening to Earnings Inequality in Canada in the 1990s? Garnett Picot Business and Labour Market Analysis Division Statistics Canada* It is now commonly accepted that earnings inequality that
An Analysis of Public and Private Sector Earnings in Ireland
 An Analysis of Public and Private Sector Earnings in Ireland 2008-2013 Prepared in collaboration with publicpolicy.ie by: Justin Doran, Nóirín McCarthy, Marie O Connor; School of Economics, University
Post-Secondary Education, Training and Labour Prepared November New Brunswick Minimum Wage Report
 Post-Secondary Education, Training and Labour Prepared November 2018 2018 New Brunswick Minimum Wage Report Contents Section 1 Minimum Wage Rates in New Brunswick... 2 1.1 Recent History of Minimum Wage
THE GENDER WAGE GAP IN THE PUBLIC AND PRIVATE SECTORS IN CANADA
 THE GENDER WAGE GAP IN THE PUBLIC AND PRIVATE SECTORS IN CANADA A Thesis Submitted to the College of Graduate Studies and Research In Partial Fulfillment of the Requirements For the Degree of Master of
Monitoring the Performance of the South African Labour Market
 Monitoring the Performance of the South African Labour Market An overview of the South African labour market from 1 of 2009 to of 2010 August 2010 Contents Recent labour market trends... 2 A brief labour
Post-Secondary Education, Training and Labour Prepared May New Brunswick Minimum Wage Report
 Post-Secondary Education, Training and Labour Prepared May 2018 2018 New Brunswick Minimum Wage Report Contents Section 1 Minimum Wage Rates in New Brunswick... 2 1.1 Recent History of Minimum Wage in
SENSITIVITY OF THE INDEX OF ECONOMIC WELL-BEING TO DIFFERENT MEASURES OF POVERTY: LICO VS LIM
 August 2015 151 Slater Street, Suite 710 Ottawa, Ontario K1P 5H3 Tel: 613-233-8891 Fax: 613-233-8250 csls@csls.ca CENTRE FOR THE STUDY OF LIVING STANDARDS SENSITIVITY OF THE INDEX OF ECONOMIC WELL-BEING
Perspectives on the Youth Labour Market in Canada
 Perspectives on the Youth Labour Market in Canada Presentation to the Financial Management Institute of Canada November 16 René Morissette Research Manager Analytical Studies Branch While unemployment
Public-private sector pay differential in UK: A recent update
 Public-private sector pay differential in UK: A recent update by D H Blackaby P D Murphy N C O Leary A V Staneva No. 2013-01 Department of Economics Discussion Paper Series Public-private sector pay differential
Analysis of Labour Force Survey Data for the Information Technology Occupations
 April 2006 Analysis of Labour Force Survey Data for the Information Technology Occupations 2000 2005 By: William G Wolfson, WGW Services Ltd. Contents Highlights... 2 Background... 4 1. Overview of Labour
Labor Force Participation in New England vs. the United States, : Why Was the Regional Decline More Moderate?
 No. 16-2 Labor Force Participation in New England vs. the United States, 2007 2015: Why Was the Regional Decline More Moderate? Mary A. Burke Abstract: This paper identifies the main forces that contributed
Monitoring the Performance of the South African Labour Market
 Monitoring the Performance of the South African Labour Market An overview of the South African labour market for the Year ending 2011 5 May 2012 Contents Recent labour market trends... 2 A labour market
Post-Secondary Education, Training and Labour August New Brunswick Minimum Wage Factsheet 2017
 Post-Secondary Education, Training and Labour August 2017 New Brunswick Minimum Wage Factsheet 2017 Contents PART 1 - Minimum Wage Rates in New Brunswick... 3 1.1 Recent History of Minimum Wage in New
The Long Term Evolution of Female Human Capital
 The Long Term Evolution of Female Human Capital Audra Bowlus and Chris Robinson University of Western Ontario Presentation at Craig Riddell s Festschrift UBC, September 2016 Introduction and Motivation
Catalogue no XIE. Income in Canada
 Catalogue no. 75-202-XIE Income in Canada 2005 How to obtain more information Specific inquiries about this product and related statistics or services should be directed to: Income in Canada, Statistics
Consumption Inequality in Canada, Sam Norris and Krishna Pendakur
 Consumption Inequality in Canada, 1997-2009 Sam Norris and Krishna Pendakur Inequality has rightly been hailed as one of the major public policy challenges of the twenty-first century. In all member countries
Monitoring the Performance of the South African Labour Market
 Monitoring the Performance of the South African Labour Market An overview of the South African labour market for the Year Ending 2012 6 June 2012 Contents Recent labour market trends... 2 A labour market
Workforce Aging and the Labour Market Opportunities of Youth: Evidence from Canada
 LCERPA Working Paper No. 2014-9 June 2014 Workforce Aging and the Labour Market Opportunities of Youth: Evidence from Canada Sundip Dhanjal, Department of Economics, Wilfrid Laurier University Tammy Schirle,
AUGUST THE DUNNING REPORT: DIMENSIONS OF CORE HOUSING NEED IN CANADA Second Edition
 AUGUST 2009 THE DUNNING REPORT: DIMENSIONS OF CORE HOUSING NEED IN Second Edition Table of Contents PAGE Background 2 Summary 3 Trends 1991 to 2006, and Beyond 6 The Dimensions of Core Housing Need 8
Labor Force Participation Rates by Age and Gender and the Age and Gender Composition of the U.S. Civilian Labor Force and Adult Population
 May 8, 2018 No. 449 Labor Force Participation Rates by Age and Gender and the Age and Gender Composition of the U.S. Civilian Labor Force and Adult Population By Craig Copeland, Employee Benefit Research
Monitoring the Performance of the South African Labour Market
 Monitoring the Performance of the South African Labour Market An overview of the South African labour market from 3 of 2010 to of 2011 September 2011 Contents Recent labour market trends... 2 A brief labour
Wage Gap Estimation with Proxies and Nonresponse
 Wage Gap Estimation with Proxies and Nonresponse Barry Hirsch Department of Economics Andrew Young School of Policy Studies Georgia State University, Atlanta Chris Bollinger Department of Economics University
The Impact of Demographic Change on the. of Managers and
 The Impact of Demographic Change on the Future Availability of Managers and Professionals in Europe Printed with the financial support of the European Union The Impact of Demographic Change on the Future
Trend Labour Supply in Canada: Implications of Demographic Shifts and the Increasing Labour Force Attachment of Women
 Trend Labour Supply in Canada: Implications of Demographic Shifts and the Increasing Labour Force Attachment of Women Russell Barnett, Research Department Over the past 25 years, labour input growth has
The Gender Imbalance in Participation in Canadian Universities ( ) 1
 1") The Gender Imbalance in Participation in Canadian Universities (1977-2003) 1 Louis N. Christofides Department of Economics, Universities of Cyprus and Guelph Kallipoleos75, P. O. Box 20537, Nicosia 20537,
The Gender Imbalance in Participation in Canadian Universities (1977-2003) 1 Louis N. Christofides Department of Economics, Universities of Cyprus and Guelph Kallipoleos75, P. O. Box 20537, Nicosia 20537,
To What Extent is Household Spending Reduced as a Result of Unemployment?
 To What Extent is Household Spending Reduced as a Result of Unemployment? Final Report Employment Insurance Evaluation Evaluation and Data Development Human Resources Development Canada April 2003 SP-ML-017-04-03E
Does Growth make us Happier? A New Look at the Easterlin Paradox
 Does Growth make us Happier? A New Look at the Easterlin Paradox Felix FitzRoy School of Economics and Finance University of St Andrews St Andrews, KY16 8QX, UK Michael Nolan* Centre for Economic Policy
Source(s): Statistics Canada, Cansim Table , Seasonally Adjusted
: Statistics Canada, Cansim Table , Seasonally Adjusted") Monthly Headlines Low Loonie Not Increasing Canadian Manufacturing Employment... Yet. From June to July, total employment fell by 600 (-0.3%) to 236,500 on a seasonally adjusted basis. i While full-time
Monthly Headlines Low Loonie Not Increasing Canadian Manufacturing Employment... Yet. From June to July, total employment fell by 600 (-0.3%) to 236,500 on a seasonally adjusted basis. i While full-time
Working Paper No Accounting for the unemployment decrease in Australia. William Mitchell 1. April 2005
 Working Paper No. 05-04 Accounting for the unemployment decrease in Australia William Mitchell 1 April 2005 Centre of Full Employment and Equity The University of Newcastle, Callaghan NSW 2308, Australia
A STATISTICAL PROFILE OF WOMEN IN THE SASKATCHEWAN LABOUR MARKET
 A STATISTICAL PROFILE OF WOMEN IN THE SASKATCHEWAN LABOUR MARKET A report prepared for: Status of Women Office Saskatchewan Ministry of Social Services by Sask Trends Monitor April 2017 Table of Contents
The labour force participation of older men in Canada
 The labour force participation of older men in Canada Kevin Milligan, University of British Columbia and NBER Tammy Schirle, Wilfrid Laurier University June 2016 Abstract We explore recent trends in the
Contents OCCUPATION MODELLING SYSTEM
 Contents Contents... 1 Introduction... 2 Why LMI?... 2 Why POMS?... 2 Data Reliability... 3 Document Content... 3 Key Occupation Labour Market Concepts... 4 Basic Labour Market Concepts... 4 Occupation
ECON 361: Income Distributions and Problems of Inequality
 ECON 361: Income Distributions and Problems of Inequality David Rosé Queen s University January 29, 2018 1/1 Last class... Taxes and Transfers The Tale of the Tails Today... Assignment 1 posted Inequality
CHAPTER 03. A Modern and. Pensions System
 CHAPTER 03 A Modern and Sustainable Pensions System 24 Introduction 3.1 A key objective of pension policy design is to ensure the sustainability of the system over the longer term. Financial sustainability
Monitoring the Performance of the South African Labour Market
 Monitoring the Performance of the South African Labour Market An overview of the South African labour market for the Year Ending 2016 14 July 2016 Contents Recent labour market trends... 2 A labour market
151 Slater Street, Suite 710 Ottawa, Ontario K1P 5H , Fax CSLS Research Report June 2012
 June 2012 151 Slater Street, Suite 710 Ottawa, Ontario K1P 5H3 613-233-8891, Fax 613-233-8250 csls@csls.ca Centre for the Study of Living Standards Labour Market Performance in Canada: 2007-2011 CSLS Research
Average income from employment in 1995 was
 Abdul Rashid Average income from employment in 1995 was $26,500. It varied widely among different occupations, from $4,300 for sports officials and referees to $120,600 for judges (Statistics Canada, 1999).
The Gender Pay Gap in Belgium Report 2014
 The Gender Pay Gap in Belgium Report 2014 Table of contents The report 2014... 5 1. Average pay differences... 6 1.1 Pay Gap based on hourly and annual earnings... 6 1.2 Pay gap by status... 6 1.2.1 Pay
Fluctuations in hours of work and employment across age and gender
 Fluctuations in hours of work and employment across age and gender IFS Working Paper W15/03 Guy Laroque Sophie Osotimehin Fluctuations in hours of work and employment across ages and gender Guy Laroque
Her Majesty the Queen in Right of Canada (2017) All rights reserved
 All rights reserved") Her Majesty the Queen in Right of Canada (2017) All rights reserved All requests for permission to reproduce this document or any part thereof shall be addressed to the Department of Finance Canada. Cette
Her Majesty the Queen in Right of Canada (2017) All rights reserved All requests for permission to reproduce this document or any part thereof shall be addressed to the Department of Finance Canada. Cette
The Changing Participation Rate of Canadians: New Evidence from a Panel of Demographic Groups
 The Changing Participation Rate of Canadians: New Evidence from a Panel of Demographic Groups Mario Fortin and Pierre Fortin Presented at the CEA s 38th Annual Meetings Toronto, June 5th, 2004 The decline
CONVERGENCES IN MEN S AND WOMEN S LIFE PATTERNS: LIFETIME WORK, LIFETIME EARNINGS, AND HUMAN CAPITAL INVESTMENT $
 CONVERGENCES IN MEN S AND WOMEN S LIFE PATTERNS: LIFETIME WORK, LIFETIME EARNINGS, AND HUMAN CAPITAL INVESTMENT $ Joyce Jacobsen a, Melanie Khamis b and Mutlu Yuksel c a Wesleyan University b Wesleyan
Short- Term Employment Growth Forecast (as at February 19, 2015)
") Background According to Statistics Canada s Labour Force Survey records, employment conditions in Newfoundland and Labrador showed signs of weakening this past year. Having grown to a record level high
Background According to Statistics Canada s Labour Force Survey records, employment conditions in Newfoundland and Labrador showed signs of weakening this past year. Having grown to a record level high
An Analysis of Differences in Labour Force Participation, Earnings and. Welfare Participation Among Canadian Lone Mothers Using Longitudinal Data
 An Analysis of Differences in Labour Force Participation, Earnings and Welfare Participation Among Canadian Lone Mothers Using Longitudinal Data Martin Dooley McMaster University Ross Finnie Statistic
The Province of Prince Edward Island Employment Trends and Data Poverty Reduction Action Plan Backgrounder
 The Province of Prince Edward Island Employment Trends and Data Poverty Reduction Action Plan Backgrounder 5/17/2018 www.princeedwardisland.ca/poverty-reduction $000's Poverty Reduction Action Plan Backgrounder:
DRAFT. A microsimulation analysis of public and private policies aimed at increasing the age of retirement 1. April Jeff Carr and André Léonard
 A microsimulation analysis of public and private policies aimed at increasing the age of retirement 1 April 2009 Jeff Carr and André Léonard Policy Research Directorate, HRSDC 1 All the analysis reported
Women in the Labor Force: A Databook
 Cornell University ILR School DigitalCommons@ILR Federal Publications Key Workplace Documents 2-2013 Women in the Labor Force: A Databook Bureau of Labor Statistics Follow this and additional works at:
CHAPTER 2. Hidden unemployment in Australia. William F. Mitchell
 CHAPTER 2 Hidden unemployment in Australia William F. Mitchell 2.1 Introduction From the viewpoint of Okun s upgrading hypothesis, a cyclical rise in labour force participation (indicating that the discouraged
Women in the Labor Force: A Databook
 Cornell University ILR School DigitalCommons@ILR Federal Publications Key Workplace Documents 9-2007 Women in the Labor Force: A Databook Bureau of Labor Statistics Follow this and additional works at:
April 2011 CENTRE FOR LIVING STANDARDS. CSLS Research Report i. Christopher Ross THE STUDY OF
 April 2011 111 Sparks Street, Suite 500 Ottawa, Ontario K1P 5B5 613-233-8891, Fax 613-233-8250 csls@csls.ca CENTRE FOR THE STUDY OF LIVING STANDARDS An Analysis of Alberta s Productivity, 1997-2007: Falling
FIGURE I.1 / Per Capita Gross Domestic Product and Unemployment Rates. Year
 FIGURE I.1 / Per Capita Gross Domestic Product and Unemployment Rates 40,000 12 Real GDP per Capita (Chained 2000 Dollars) 35,000 30,000 25,000 20,000 15,000 10,000 5,000 Real GDP per Capita Unemployment
Income Inequality Among Seniors in Canada: The Role of Women s Labour Market Experience
 Income Inequality Among Seniors in Canada: The Role of Women s Labour Market Experience Tammy Schirle Department of Economics, Wilfrid Laurier University Working Paper This Version: May 2009 tschirle@wlu.ca
Regional Development Patterns in Canada
 Regional Development Patterns in Canada David Andolfatto Simon Fraser University and Ying Yan Simon Fraser University Version: July 2008 1. INTRODUCTION We provide annual data over the sample period 1981-2007
by Rob Valletta and Leila Bengali - FRBSF Economic Letter, Federal Reserve Bank of San Francisco
 Behind the Increase in Part-Time Work by Rob Valletta and Leila Bengali - FRBSF Economic Letter, Federal Reserve Bank of San Francisco Part-time work spiked during the recent recession and has stayed stubbornly
INCOME DISTRIBUTION AND INEQUALITY IN LUXEMBOURG AND THE NEIGHBOURING COUNTRIES,
 INCOME DISTRIBUTION AND INEQUALITY IN LUXEMBOURG AND THE NEIGHBOURING COUNTRIES, 1995-2013 by Conchita d Ambrosio and Marta Barazzetta, University of Luxembourg * The opinions expressed and arguments employed
Gender Pay Differences: Progress Made, but Women Remain Overrepresented Among Low- Wage Workers
 Cornell University ILR School DigitalCommons@ILR Federal Publications Key Workplace Documents 10-2011 Gender Pay Differences: Progress Made, but Women Remain Overrepresented Among Low- Wage Workers Government
SHARE OF WORKERS IN NONSTANDARD JOBS DECLINES Latest survey shows a narrowing yet still wide gap in pay and benefits.
 Economic Policy Institute Brief ing Paper 1660 L Street, NW Suite 1200 Washington, D.C. 20036 202/775-8810 http://epinet.org SHARE OF WORKERS IN NONSTANDARD JOBS DECLINES Latest survey shows a narrowing
Sources of the Gender Wage Gap in a New Zealand Birth Cohort
 281 Volume 12 Number 3 2009 pp 281-298 Sources of the Gender Wage Gap in a New Zealand Birth Cohort Sheree J. Gibb, David M. Fergusson and L. John Horwood, University of Otago Abstract The gender wage
Discussion Audra J. Bowlus
 Discussion Audra J. Bowlus The paper by Crawford and Harrison focusses on an issue at the forefront of the current debate over inflation targeting and price stability: the extent of nominal wage rigidities
Additional Slack in the Economy: The Poor Recovery in Labor Force Participation During This Business Cycle
 No. 5 Additional Slack in the Economy: The Poor Recovery in Labor Force Participation During This Business Cycle Katharine Bradbury This public policy brief examines labor force participation rates in
BC CAMPAIGN 2000 WHAT IS CHILD POVERTY? FACT SHEET #1 November 24, 2005
 WHAT IS CHILD POVERTY? FACT SHEET #1 Poverty in Canada is measured by using Statistics Canada's Low Income Cut-Offs (LICOs). The cut-offs are based on the concept that people in poverty live in "straitened
ANNEX 3. The ins and outs of the Baltic unemployment rates
 ANNEX 3. The ins and outs of the Baltic unemployment rates Introduction 3 The unemployment rate in the Baltic States is volatile. During the last recession the trough-to-peak increase in the unemployment
GAO GENDER PAY DIFFERENCES. Progress Made, but Women Remain Overrepresented among Low-Wage Workers. Report to Congressional Requesters
 GAO United States Government Accountability Office Report to Congressional Requesters October 2011 GENDER PAY DIFFERENCES Progress Made, but Women Remain Overrepresented among Low-Wage Workers GAO-12-10
Nova Scotia Retirements drive rising hiring requirements, despite muted growth outlook
 CONSTRUCTION & MAINTENANCE LOOKING FORWARD Nova Scotia Retirements drive rising hiring requirements, despite muted growth outlook The Nova Scotia construction industry has seen significant expansion over
Over the pa st tw o de cad es the
 Generation Vexed: Age-Cohort Differences In Employer-Sponsored Health Insurance Coverage Even when today s young adults get older, they are likely to have lower rates of employer-related health coverage
to 4 per cent annual growth in the US.
 A nation s economic growth is determined by the rate of utilisation of the factors of production capital and labour and the efficiency of their use. Traditionally, economic growth in Europe has been characterised
The part-time pay penalty. Alan Manning and Barbara Petrongolo
 The part-time pay penalty Alan Manning and Barbara Petrongolo 1. Introduction 2. Defining Full-Time and Part-Time Status 3. What Types of Women Work Part-time? 4. The Current Level of the Part-time Pay
SEVERAL CANADIAN STUDIES have examined
 René Morissette Pensions: Immigrants and visible minorities SEVERAL CANADIAN STUDIES have examined differences in earnings between immigrants and Canadian-born individuals (Grant 1999; Baker and Benjamin
New Jersey Public-Private Sector Wage Differentials: 1970 to William M. Rodgers III. Heldrich Center for Workforce Development
 New Jersey Public-Private Sector Wage Differentials: 1970 to 2004 1 William M. Rodgers III Heldrich Center for Workforce Development Bloustein School of Planning and Public Policy November 2006 EXECUTIVE
Comparing Government and Private Sector Compensation in Ontario
 FRASER RESEARCHBULLETIN FROM THE CENTRE FOR FISCAL POLICY February 2017 Comparing Government and Private Sector Compensation in Ontario by Charles Lammam, Milagros Palacios, and Feixue Ren Main Conclusions
Socio-economic Series Changes in Household Net Worth in Canada:
 research highlight October 2010 Socio-economic Series 10-018 Changes in Household Net Worth in Canada: 1990-2009 introduction For many households, buying a home is the largest single purchase they will
CSO Research Paper. Econometric analysis of the public/private sector pay differential
 CSO Research Paper Econometric analysis of the public/private sector pay differential 2011 to 2014 2 Contents EXECUTIVE SUMMARY... 4 1 INTRODUCTION... 5 1.1 SPECIFICATIONS INCLUDED IN THE ANALYSIS... 6
April An Analysis of Saskatchewan s Productivity, : Capital Intensity Growth Drives Strong Labour Productivity Performance CENTRE FOR
 April 2011 111 Sparks Street, Suite 500 Ottawa, Ontario K1P 5B5 613-233-8891, Fax 613-233-8250 csls@csls.ca CENTRE FOR THE STUDY OF LIVING STANDARDS An Analysis of Saskatchewan s Productivity, 1997-2007:
The Effects of Increasing the Early Retirement Age on Social Security Claims and Job Exits
 The Effects of Increasing the Early Retirement Age on Social Security Claims and Job Exits Day Manoli UCLA Andrea Weber University of Mannheim February 29, 2012 Abstract This paper presents empirical evidence
Women Leading UK Employment Boom
 Briefing Paper Feb 2018 Women Leading UK Employment Boom Published by The Institute for New Economic Thinking, University of Oxford Women Leading UK Employment Boom Summary Matteo Richiardi a, Brian Nolan
HOUSEHOLDS INDEBTEDNESS: A MICROECONOMIC ANALYSIS BASED ON THE RESULTS OF THE HOUSEHOLDS FINANCIAL AND CONSUMPTION SURVEY*
 HOUSEHOLDS INDEBTEDNESS: A MICROECONOMIC ANALYSIS BASED ON THE RESULTS OF THE HOUSEHOLDS FINANCIAL AND CONSUMPTION SURVEY* Sónia Costa** Luísa Farinha** 133 Abstract The analysis of the Portuguese households
Usage of Sickness Benefits
 Final Report EI Evaluation Strategic Evaluations Evaluation and Data Development Strategic Policy Human Resources Development Canada April 2003 SP-ML-019-04-03E (également disponible en français) Paper
ACTUARIAL REPORT 25 th. on the
 25 th on the CANADA PENSION PLAN Office of the Chief Actuary Office of the Superintendent of Financial Institutions Canada 16 th Floor, Kent Square Building 255 Albert Street Ottawa, Ontario K1A 0H2 Facsimile:
The Effect of the Minimum Wage on the Employment Rate in Canada, by Eliana Shumakova ( ) Major Paper presented to the
 Major Paper presented to the") The Effect of the Minimum Wage on the Employment Rate in Canada, 1979 2016 by Eliana Shumakova (8494088) Major Paper presented to the Department of Economics of the University of Ottawa in partial fulfillment
The Effect of the Minimum Wage on the Employment Rate in Canada, 1979 2016 by Eliana Shumakova (8494088) Major Paper presented to the Department of Economics of the University of Ottawa in partial fulfillment
The labor market in Australia,
 GARRY BARRETT University of Sydney, Australia, and IZA, Germany The labor market in Australia, 2000 2016 Sustained economic growth led to reduced unemployment and real earnings growth, but prosperity has
Working Paper No. 727
 Working Paper No. 727 Simulations of Full-Time Employment and Household Work in the Levy Institute Measure of Time and Income Poverty (LIMTIP) for Argentina, Chile, and Mexico by Thomas Masterson Levy
Women in the Labor Force: A Databook
 Cornell University ILR School DigitalCommons@ILR Federal Publications Key Workplace Documents 12-2011 Women in the Labor Force: A Databook Bureau of Labor Statistics Follow this and additional works at:
BC CAMPAIGN FACT SHEETS
 2006 FACT SHEETS Fact Sheet #1 - What is Child Poverty? Fact Sheet #2 - BC Had the Worst Record Three Years in a Row Fact Sheet #3 - Child Poverty over the Years Fact Sheet #4 - Child Poverty by Family
Understanding reductions in the gender wage differential
 Understanding reductions in the gender wage differential 1997-2003 New Zealand Conference on Pay and Employment Equity for Women Wellington, 28-29 June 2004 Sylvia Dixon Labour Market Policy Group Department
Employment, Industry and Occupations of Inuit in Canada,
 Employment, Industry and Occupations of Inuit in Canada, 1981-2001 Inuit Tapiriit Kanatami and Research and Analysis Directorate January, 2007 Research Project Manager: Sacha Senécal, Strategic Research
Changing Levels or Changing Slopes? The Narrowing of the U.S. Gender Earnings Gap,
 Changing Levels or Changing Slopes? The Narrowing of the U.S. Gender Earnings Gap, 1959-1999 Catherine Weinberger and Peter Kuhn Department of Economics University of California, Santa Barbara Santa Barbara,
Top Earnings Inequality and the Gender Pay Gap: Canada, Sweden, and the United Kingdom
 AEA 2018 Meetings, Philadelphia, January 5 th 2018 Top Earnings Inequality and the Gender Pay Gap: Canada, Sweden, and the United Kingdom Nicole Fortin Vancouver School of Economics and Canadian Institute
The labor market in South Korea,
 JUNGMIN LEE Seoul National University, South Korea, and IZA, Germany The labor market in South Korea, The labor market stabilized quickly after the 1998 Asian crisis, but rising inequality and demographic
Are Today s Working Canadians Saving Enough for Tomorrow s Retirement?
 PH4-71/21E-PDF 978-1-1-17292-7 POLICY BRIEF Are Today s Working Canadians Saving Enough for Tomorrow s Retirement? Jennifer Robson Policy Research Initiative Highlights In the last 3 years, the rate of
Monitoring the Performance of the South African Labour Market
 Monitoring the Performance of the South African Labour Market An overview of the South African labour market for the Year Ending 2012 8 October 2012 Contents Recent labour market trends... 2 A labour market
Catalogue no XIE. Income in Canada. Statistics Canada. Statistique Canada
 Catalogue no. 75-202-XIE Income in Canada 1999 Statistics Canada Statistique Canada How to obtain more information Specific inquiries about this product and related statistics or services should be directed
THE GROWTH OF FAMILY EARNINGS INEQUALITY IN CANADA, and. Tammy Schirle*
 roiw_377 23..39 Review of Income and Wealth Series 57, Number 1, March 2011 THE GROWTH OF FAMILY EARNINGS INEQUALITY IN CANADA, 1980 2005 by Yuqian Lu and René Morissette Statistics Canada and Tammy Schirle*
The gender wage gap in Australia: causes, costs, and the future?
 The gender wage gap in Australia: causes, costs, and the future? Presentation to the CEDA Women in Leadership workshop series, Melbourne, October 20 th 2010 Professor Alan Duncan Director, National Centre
Gender Differences in the Labor Market Effects of the Dollar
 Gender Differences in the Labor Market Effects of the Dollar Linda Goldberg and Joseph Tracy Federal Reserve Bank of New York and NBER April 2001 Abstract Although the dollar has been shown to influence
Changes in the Experience-Earnings Pro le: Robustness
 Changes in the Experience-Earnings Pro le: Robustness Online Appendix to Why Does Trend Growth A ect Equilibrium Employment? A New Explanation of an Old Puzzle, American Economic Review (forthcoming) Michael
Household Income Distribution and Working Time Patterns. An International Comparison
 Household Income Distribution and Working Time Patterns. An International Comparison September 1998 D. Anxo & L. Flood Centre for European Labour Market Studies Department of Economics Göteborg University.