The Long Term Evolution of Female Human Capital
|
|
|
- Lorena Erin Eaton
- 6 years ago
- Views:
Transcription
1 The Long Term Evolution of Female Human Capital Audra Bowlus and Chris Robinson University of Western Ontario Presentation at Craig Riddell s Festschrift UBC, September 2016
2 Introduction and Motivation I Labor market attachment of females has increased dramatically over the last half century (Blundell and Macurdy (1999), section 3, Goldin (2006), Blau and Khan (2013).) Large and very interesting literature trying to explain why - not the topic of this paper Focus of this paper is on an important implication of human capital theory, given this greater labor market attachment: an increased incentive for females to invest in human capital
3 Introduction and Motivation II One manifestation of increased incentive to invest: convergence in share of successive female birth cohorts that are college graduates to that of males Only a partial indication of increased human capital Standard composition adjustment methods show increase in efficiency units of female human capital through changes in education and experience cell composition Cannot capture within cell increases for females: an implication of human capital theory given increased labor market attachment Consequence: under-estimate of the contribution of female human capital to postwar growth
4 Introduction and Motivation III Human capital is not directly observed: problem of identification Alternative approaches and data sources: (1) Wage-based approach uses data on changes in wages to infer changes in quantities of human capital - classic Ben-Porath (2) Standard composition adjustment uses data on changes in education and experience (3) Job-skills-based approach uses data on changes in occupations Paper uses and compares estimates from (1) and (3); by definition (2) cannot capture the within cell increases for females the paper seeks to explore
5 Outline of the Presentation: Wage-based Approach Description of Wage-based approach and identification - (Ben-Porath style with cohort effects) - extension of Bowlus and Robinson (AER 2012) Discussion of three sources of cohort effects: (1) selection on ability in education choice; (2) technological change in human capital production functions; and (3) expected attachment to the labor force Cohort data on education and participation relevant for (1) and (3) and some discussion of (2) Estimates of life-cycle human capital (efficiency units supplied) profiles - (wage-based approach) - and comparison of cohort patterns for males and females Complications due to (time path of) discrimination in comparing males and females
6 Outline of the Presentation: Job-Skills-based Approach Description of Job-Skills-based Approach Problems of identification of life-cycle and cohort effects with the Job-Skills-based Approach Construction of a single dimension measure to compare with the single dimension measure of the wage-based approach Estimates of life-cycle (single dimension measure) profiles - (job-skills-based approach) - and comparison of cohort patterns for males and females
7 Outline of the Presentation: Summary and Next Steps Wage-based approach yields: pattern of life-cycle human capital profiles for females that shift up for the cohorts with higher labor market attachment for all education groups contrast with pattern for males where there is much less change in labor market attachment across cohorts Job-skills-based approach yields mostly similar qualitative pattern in the contrast between females and males, though different magnitudes Next steps: (1) refinement of both methods; (2) use of panel data including LISA; (3) estimate of under-estimation of true aggregate labor input of females
8 Wage-Based Approach: Framework Heterogeneous human capital - type determined by education group - separate prices Each education group has only one type - quantities can be aggregated within type (efficiency units) - similar to canonical model Ben-Porath style optimal life-cycle accumulation problem with a first stage choosing education group (type) (Heckman, Lochner and Taber (1997)); solution follows from comparison of marginal cost of production of human capital and marginal benefit Bowlus and Robinson (2012) framework with cohort effects extended to allow for variation in labor market attachment Identification of human capital quantities (efficiency units) via implementation of a flat-spot method based on the Bowlus and Robinson (2012)
9 Wage-Based Approach: Three Sources of Cohort Effects Two sources of cohort effects in the original Bowlus and Robinson (2012) framework: (1) heterogeneity in ability and correlation of ability and education level (effects through the production functions and marginal cost) (2) technological change, broadly interpreted, in the production of the different types of human capital (again, effects through the production functions and marginal cost) Third source of cohort effects particularly important for this paper: increased incentive for females to invest in human capital following the large secular increase in their participation rates (effect through marginal benefit)
10 Wage-Based Approach: Data Patterns Relevant for Cohort Effects Data relevant for cohort effect (3) through increased marginal benefit for cohorts with greater labor market attachment are life-cycle participation patterns by cohort Data relevant for cohort effect (1) through heterogeneity in ability and correlation of ability and education level are completed education levels by cohort More difficult for cohort effect (2) through technological change in human capital production (currently inferred in Bowlus and Robinson (2012) and Agopsowicz, Bowlus and Robinson (2016)) Possibility of some direct data from other sources, e.g. Green and Riddell (2013), Barrett and Riddell (2016)
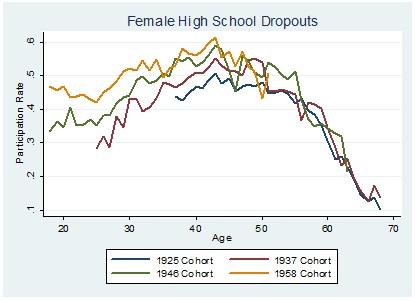
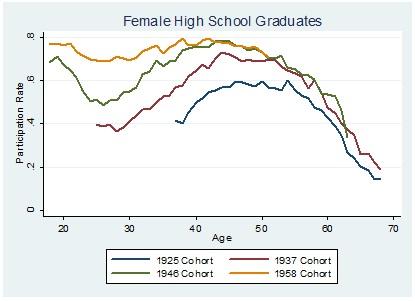
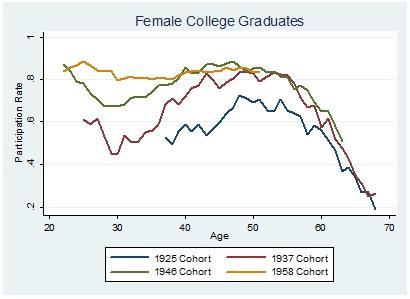
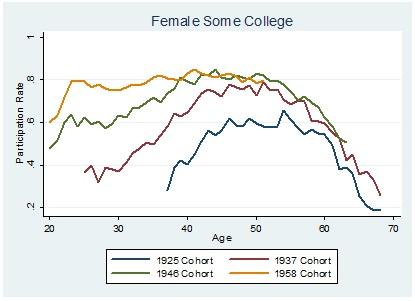
11 Female Life-Cycle Participation by Birth Cohort
12 Life-Cycle Participation by Cohort: Females Summary Participation rates are higher for more educated groups More recent cohorts for all education groups show higher participation levels at all ages Interesting changes in the life-cycle pattern of participation: For early cohorts the peak in participation rates does not happen until relatively late in the life-cycle Most dramatic difference in the shifts in profiles across the cohorts is that participation at the earlier part of the life-cycle increases For all but the dropouts, by the 1958 cohort the rate is at its peak and relatively flat shortly after the end of the formal education period Potential, therefore, for large cohort effects for females in all education groups

13 Male Life-Cycle Participation by Birth Cohort
14 Participation Rates by Age: Summary for Males By comparison with females: Males show only quite minor changes across cohorts Tendency for participation to fall slightly compared to the strong increase for females College graduates for all birth cohorts show flat participation rate at high level from their mid to late 20s until their mid-50s and still show participation rates of 80% or more until age 60 Some college males show same pattern but begin a slow decline earlier and start to fall below 80% by their late 50s High school graduates similar to some college except for more variation by cohort and dropouts show most cohort variation with lower participation for the most recent cohorts and generally lower participation at each age

15 Increasing Educational Attainment for Females

16 Lower Education Groups: Comparison of Males and Females

17 Higher Education Groups: Comparison of Males and Females
18 Increasing Educational Attainment for Females Completed education level shares of four education groups: dropouts, high school graduates, some college and college graduates for successive birth cohorts of females from 1931 to 1967 obtained from using observations on the same age group (point in the life-cycle), 31-35, for each cohort to control for life-cycle effects in reporting The two lowest education levels show declining shares, while the two highest education levels show increasing shares Overall, pattern of completed education levels for females relative to males shows the features expected from the increased incentive for females to invest in human capital implied by their increased labor force participation
19 Wage-Based Approach: Maintained Assumption for Male-Female Human Capital Comparisons There is no specifically male or female human capital - for example, female and male college graduates have the same type of college graduate human capital Same assumption made in constructing college graduate human capital in standard implementation of the canonical model using composition adjustment - males and females may have different amounts of the college graduate type human capital, but they do not have different types Same assumption in much of discrimination literature
20 Wage-Based Approach: Possible Distinction between Market and Home Human Capital Goldin (2006) discusses shift in the college majors for women: Whereas in 1970 a standard dissimilarity index for college majors between men and women exceeded 0.5, it fell to about 0.3 in 1985 Women s majors shifted from those that were consumption related to those that were investment related. There may be two types of human capital: one useful largely in market production (Goldin s investment major); and another more useful in home production (Goldin s consumption major) Shift in production at the university level as seen in major choice towards more market oriented human capital would show up as technological improvement in producing (market oriented) human capital for females relative to males This technological improvement would be tied to the pattern of participation increase and major shift Amend assumption to: there is no specifically male or female market oriented human capital
21 Wage-Based Approach: Identification of Male and Female Human capital The wage-based analysis in this paper uses the price series derived in Bowlus and Robinson (2012) from data on full time and full year males to back out the quantity of human capital profiles by cohort for both males and females In a standard competitive market males and females would face the same price for any given type of human capital - price series derived in Bowlus and Robinson (2012) based on data for males can be used to compute efficiency units of human capital for females Males used because their participation pattern for each cohort and across cohorts, and their (college graduates) education pattern across cohorts are important elements of the implementation of the flat-spot method Patterns for females make similar implementation of the flat-spot method on female data infeasible Complications from discrimination
22 Wage-Based Approach: Complications from Discrimination I Large literature that studies discrimination against females - can take many forms If it results in a different (lower) price for females for same type of human capital, male based price series would be an over-estimate of the price series females faced resulting in an under-estimate of the female human capital when the female wage is divided by this over-estimated price Using male price series not a problem if level of discrimination constant - changes in cohort pattern of efficiency units for females could still be identified and contrasted with changes in the cohort pattern for males Primary concern is that there may have been a secular decrease in discrimination resulting in secular decline in amount of under-estimation of female human capital, imparting an upward bias on estimated change in female human capital
23 Wage-Based Approach: Complications from Discrimination II Possible that the main effect of discrimination is not to put a large wedge on the price but rather to prevent females acquiring the levels of human capital acquired by males by reducing access to training and promotion opportunities or other barriers Also possible that a large part of the disappearance of the gender wage gap, at least on labor market entry for female college graduates is due to the shift in college major to produce the investment rather than consumption type human capital referred to by Goldin (2006) and that this shift could be in part a response to reduced barriers from discrimination In this case use of the price series based on males would still permit the estimation of changes in the actual amount of efficiency units supplied by females in the different cohorts even in the presence of declining discrimination
24 Wage-Based Approach: Data MCPS for the period , same as Bowlus and Robinson (2012) Provides source of annual data for large age range covering wide range of pre- and post-war cohorts Issues of time varying top coding and allocation treated same way as Bowlus and Robinson (2012) Allows for selection of full time and full year
25 Wage-Based Approach: Estimated Profiles and Cohort Differences The comparisons presented are for estimates based on the evidence for full time and full year males and females They are not designed to measure relative changes for females via changes in education or labor supply per se They are designed to examine whether a composition adjustment approach to measuring female human capital is likely to under count the growth in female human capital following a participation increase That is, we are looking for evidence of relative changes for females compared to males even within age and education group and full-time and full year workers

26 Wage Based Human Capital Profiles for Female

27 Wage Based Human Capital Profiles for Males
28 Wage-Based Approach: Cohort Pattern Differences in Male and Female Profiles The figures show a clear contrast for males and females: Apart from the dropout group, which for much of the period can be expected to have a negative selection effect based on the change in the fraction of the cohort that are dropouts, there is clear evidence of an upward shift in the profiles for females, consistent with the increased participation In contrast, male dropouts, high school graduates, and to a lesser extent the some college group show a decline in the recent cohorts For male college graduates there is an increase for the post 1949 cohorts, interpreted in terms of cohort effects from selection and technological change in the human capital production function in Bowlus and Robinson (2012) For female college graduates, however, there are clear increases across all three cohorts
29 Wage-Based Approach: Summary Estimates of Cohort Differences Bowlus and Robinson (2012) presented a simple measure of cohort differences in the profiles for male college graduates by regressing the log efficiency units from the previous plots for a particular age range (30-45) on a quadratic in age and cohort dummies The age range restriction means that all ages are represented for all cohorts used We extend this to males and females for all education groups and use the individual level data: the estimates of the cohort dummies are insensitive to the inclusion of the age quadratic the age quadratic is only necessary to pick up the life-cycle shape The cohort dummies are plotted separately for low and high education groups

30 Wage-based Cohort Patterns: Lower Education Groups

31 Wage-based Cohort Patterns: Higher Education Groups
32 Wage-Based Approach: Male-Female Comparison Results Clear evidence from wage-based approach of different cohort pattern for females consistent with increased labor market attachment Females human capital increases generally in education/experience cell, including lower education groups, unlike males Magnitudes are large: the 1961 cohort full time and full year college graduate is supplying on average over 20% more than her counterpart from the 1946 birth cohort Suggests conventional labor input measures result in significant under-estimate of the contribution of females to post-war growth
33 Job-Skills-based Approach: Description Infers the amount of human capital from occupation data instead of from wage data thus avoiding the problems associated with declining discrimination Growing literature uses measures of job skills to study human capital and wage patterns We assume skills can t be unbundled (Heckman and Scheinkman (1987), Firpo, Fortin and Lemieux (2013) - same skill types are held by all education groups but in different amounts and ratios Same objective function as in Ben-Porath framework - some optimal path for the bundle - but multi-dimensionality of bundle breaks simple link between quantity and wages In order to compare human capital from a multi-dimensional bundle of skills to the single dimension measure from the wage-based approach we scale the bundles along a single dimension
34 Data for the Job-Skills-based Approach Same as for the wage-based analysis - MCPS - except drop years of the data set before the start of three digit 1970 occupation coding (1970 coding began in 1971) Emphasis on consistency over time in the data source for occupations - four different census occupation coding periods in the data covering 1970, 1980, 1990 and 2000 census coding Strong similarity between 1980 and 1990 codes - more major differences between 1970 and 1980 and between 1990 and 2000 IPUMS project constructed a set of three digit occupation codes, based on census 1990 coding, that aims for consistency across 1970 through 2000 coding For consistency number of codes is reduced Final number of codes is less than the close to 500 in the later period original coding schemes, but still provides for a lot of variation with close to 400 codes
35 Job-Skills-based Approach: Definition of the Bundles Literature typically takes two steps to assign job skills to workers: (1) job skill ratings are taken from sources such as the DOT or ONET and average skill ratings for a low dimension vector of skills (skill portfolio) for each occupation are constructed (2) skill portfolios are assigned to individuals in the main workers data sets on the basis of the worker s 3-digit occupation code (Poletaev and Robinson (2008), Yamaguchi (2012), Gathman and Schonberg (2010), Bowlus, Mori and Robinson (2016).) Could make a grid of the separate skills from a low dimension skill portfolio obtained from (1) and treat these as the bundles Instead we treat each of the approximately 380 IPUMS consistent codes as a unique bundles of skills and bypass (1) so that scaling the bundles is the same as scaling the IPUMS occupations In practice, discretizing each skill in a three vector of skills and allowing for even a modest number of discrete categories for each skill soon results in a grid where there are as many points as unique occupations
36 Job-Skills-based Approach: Construction of Single Dimension Measure Analogous to composition adjustment approach to scaling different age/education cells to compute single total for a given type of human capital in the canonical model Standard implementation computes efficiency units for a single skill held by different age and education cells by pricing the cells using the wages of the cell averaged over the entire period Could price bundles to scale them and produce quantities on a single dimension in same way Preferred approach modifies this - does scaling using efficiency units for males from the wage-based approach Argument: male efficiency units are correctly estimated and can therefore provide a direct baseline quantity scaling for the bundles
37 Job-Skills-based Approach: Identification Wage-based method can capture both life-cycle and cohort effects on quantities of human capital - simply divide the observed wages across the life-cycle or across cohorts by the appropriate price For job-skills-based approach observed data across the life-cycle or across cohorts are occupations If there was a very fine grid of occupations in which all workers had identical skills within occupation we could capture changes in skills across the life-cycle and across cohorts by observing changes in these occupations Moreover, the price wedge between males and females for the same type of human capital could be estimated from wage differences within this fine grid of occupations Unfortunately, in practice the occupation codes and allocation of workers to these codes are very far from this ideal situation
38 Job-Skills-based Approach: Single Occupation Career Problem Example Suppose individuals start in an occupation corresponding to their initial bundle and then make investments that simply scale up the bundle The ideal fine occupation grid would represent sequences on job ladders such that each higher level bundle of any type corresponded to a different occupation - with enough occupation codes the growth in skills over the life-cycle or cohort changes could be inferred from occupation data Actual occupation coding is such that many careers in which the bundle does evolve through human capital investment are represented by a single occupation code rather than a sequence of codes on a job ladder (many professions such as lawyer, doctor, and professor) neither growth in skills over the life-cycle, nor differences in the human capital across cohorts of lawyers, can be identified from the occupation data
39 Job-Skills-based Approach: Summary Estimates of Cohort Differences The same regressions are run as for the wage based method with the log of efficiency units as the dependent variable and cohort dummies However, the log of efficiency units is now measured by the single dimension measure from the job-skills-based approach: each individual in the data set is assigned a value of efficiency units based on their 3 digit IPUMS consistent 1990 code The results are again insensitive to the inclusion of an age quadratic The cohort dummies are again plotted separately for low and high education groups

40 Skill-based Cohort Patterns: Lower Education Groups

41 Skill-based Cohort Patterns: Higher Education Groups
42 Job-Skills-based Approach: Male-Female Comparison Results for Low Education Groups Compared to the wage-based results, for the low income groups the male-female difference is still apparent, though there are some significant differences: The earlier cohorts for females again show improvement while for males their human capital declines However the later cohorts decline for both males and females, albeit the rate of decline is slower for females Job-skills-based approach can only capture cohort effects to the extent that cohorts change occupation patterns - cannot capture within occupation changes: magnitudes are, therefore, likely to be different pattern may be affected by differential changes in the amount of occupational change across cohorts (within education) for males and females
43 Job-Skills-based Approach: Male-Female Comparison Results for High Education Groups For the high education groups the results are qualitatively quite similar to the results from the wage-based approach, though again the magnitudes are different: Male college graduates show a very similar pattern to the wage-based estimates and the females show a similar continuous growth over cohorts Male some college group also show a similar pattern to the wage based estimates and their decline in the pre-war cohorts again contrast with the increase for females Unlike the wage-based estimates, however, the some college group for females shows no growth after the 1949 cohort
44 Outline of the Presentation: Summary and Next Steps The relative patterns for males and females are similar in both the wage-based and the job-skills-based approach For the higher education groups there is consistent evidence from both approaches of increased human capital in the more recent female cohorts Suggests that there is enough change in occupation patterns, especially for female college graduates, for the job-skills-based approach to capture at least some cohort effects wage-based approach suggests that there is also substantial within occupation increases in the human capital for females, but the potential bias induced by declining discrimination makes it difficult to assess the true magnitude Next steps: (1) refinement of both methods; (2) use of panel data including LISA; (3) estimate of under-estimation of true aggregate labor input of females
The Evolution of the Human Capital of Women
 Western University Scholarship@Western Centre for Human Capital and Productivity. CHCP Working Papers Economics Working Papers Archive 2017 2017-10 The Evolution of the Human Capital of Women Audra Bowlus
AER Web Appendix for Human Capital Prices, Productivity and Growth
 AER Web Appendix for Human Capital Prices, Productivity and Growth Audra J. Bowlus University of Western Ontario Chris Robinson University of Western Ontario January 30, 2012 The data for the analysis
CONVERGENCES IN MEN S AND WOMEN S LIFE PATTERNS: LIFETIME WORK, LIFETIME EARNINGS, AND HUMAN CAPITAL INVESTMENT $
 CONVERGENCES IN MEN S AND WOMEN S LIFE PATTERNS: LIFETIME WORK, LIFETIME EARNINGS, AND HUMAN CAPITAL INVESTMENT $ Joyce Jacobsen a, Melanie Khamis b and Mutlu Yuksel c a Wesleyan University b Wesleyan
Labor Force Participation Rates by Age and Gender and the Age and Gender Composition of the U.S. Civilian Labor Force and Adult Population
 May 8, 2018 No. 449 Labor Force Participation Rates by Age and Gender and the Age and Gender Composition of the U.S. Civilian Labor Force and Adult Population By Craig Copeland, Employee Benefit Research
Labor force participation of the elderly in Japan
 Labor force participation of the elderly in Japan Takashi Oshio, Institute for Economics Research, Hitotsubashi University Emiko Usui, Institute for Economics Research, Hitotsubashi University Satoshi
Changing Levels or Changing Slopes? The Narrowing of the U.S. Gender Earnings Gap,
 Changing Levels or Changing Slopes? The Narrowing of the U.S. Gender Earnings Gap, 1959-1999 Catherine Weinberger and Peter Kuhn Department of Economics University of California, Santa Barbara Santa Barbara,
Convergences in Men s and Women s Life Patterns: Lifetime Work, Lifetime Earnings, and Human Capital Investment
 Convergences in Men s and Women s Life Patterns: Lifetime Work, Lifetime Earnings, and Human Capital Investment Joyce Jacobsen, Melanie Khamis, and Mutlu Yuksel 2 nd Version Do not cite without permission:
The Gender Earnings Gap: Evidence from the UK
 Fiscal Studies (1996) vol. 17, no. 2, pp. 1-36 The Gender Earnings Gap: Evidence from the UK SUSAN HARKNESS 1 I. INTRODUCTION Rising female labour-force participation has been one of the most striking
CHAPTER 2 ESTIMATION AND PROJECTION OF LIFETIME EARNINGS
 CHAPTER 2 ESTIMATION AND PROJECTION OF LIFETIME EARNINGS ABSTRACT This chapter describes the estimation and prediction of age-earnings profiles for American men and women born between 1931 and 1960. The
2.5. Income inequality in France
 2.5 Income inequality in France Information in this chapter is based on Income Inequality in France, 1900 2014: Evidence from Distributional National Accounts (DINA), by Bertrand Garbinti, Jonathan Goupille-Lebret
Sarah K. Burns James P. Ziliak. November 2013
 Sarah K. Burns James P. Ziliak November 2013 Well known that policymakers face important tradeoffs between equity and efficiency in the design of the tax system The issue we address in this paper informs
Effects of Increased Elderly Employment on Other Workers Employment and Elderly s Earnings in Japan. Ayako Kondo Yokohama National University
 Effects of Increased Elderly Employment on Other Workers Employment and Elderly s Earnings in Japan Ayako Kondo Yokohama National University Overview Starting from April 2006, employers in Japan have to
LARGER BIRTH COHORT LOWERS WAGES
 MAY 17 1 LARGER BIRTH COHORT LOWERS WAGES by Teresa Ghilarducci, Bernard L. and Irene Schwartz Professor of Economics at The New School for Social Research and Director of the Schwartz Center for Economic
Wealth Inequality Reading Summary by Danqing Yin, Oct 8, 2018
 Summary of Keister & Moller 2000 This review summarized wealth inequality in the form of net worth. Authors examined empirical evidence of wealth accumulation and distribution, presented estimates of trends
The Persistent Effect of Temporary Affirmative Action: Online Appendix
 The Persistent Effect of Temporary Affirmative Action: Online Appendix Conrad Miller Contents A Extensions and Robustness Checks 2 A. Heterogeneity by Employer Size.............................. 2 A.2
Convergences in Men s and Women s Life Patterns: Lifetime Work, Lifetime Earnings, and Human Capital Investment
 DISCUSSION PAPER SERIES IZA DP No. 8425 Convergences in Men s and Women s Life Patterns: Lifetime Work, Lifetime Earnings, and Human Capital Investment Joyce Jacobsen Melanie Khamis Mutlu Yuksel August
Labor Force Participation in New England vs. the United States, : Why Was the Regional Decline More Moderate?
 No. 16-2 Labor Force Participation in New England vs. the United States, 2007 2015: Why Was the Regional Decline More Moderate? Mary A. Burke Abstract: This paper identifies the main forces that contributed
Health and the Future Course of Labor Force Participation at Older Ages. Michael D. Hurd Susann Rohwedder
 Health and the Future Course of Labor Force Participation at Older Ages Michael D. Hurd Susann Rohwedder Introduction For most of the past quarter century, the labor force participation rates of the older
How Was the U.S. Economy Doing Prior to the 2016 Election?
 How Was the U.S. Economy Doing Prior to the 2016 Election? Edward C. Prescott Arizona State University Restoring Prosperity: Contemporary and Historical Perspectives Conference Hoover Institution, Stanford
PERCEPTION OF CARD USERS TOWARDS PLASTIC MONEY
 PERCEPTION OF CARD USERS TOWARDS PLASTIC MONEY This chapter analyses the perception of card holders towards plastic money in India. The emphasis has been laid on the adoption, usage, value attributes,
Wage Gap Estimation with Proxies and Nonresponse
 Wage Gap Estimation with Proxies and Nonresponse Barry Hirsch Department of Economics Andrew Young School of Policy Studies Georgia State University, Atlanta Chris Bollinger Department of Economics University
$1,000 1 ( ) $2,500 2,500 $2,000 (1 ) (1 + r) 2,000
 $2,500 2,500 $2,000 (1 ) (1 + r) 2,000") Answers To Chapter 9 Review Questions 1. Answer d. Other benefits include a more stable employment situation, more interesting and challenging work, and access to occupations with more prestige and more
Answers To Chapter 9 Review Questions 1. Answer d. Other benefits include a more stable employment situation, more interesting and challenging work, and access to occupations with more prestige and more
Topic 2.3b - Life-Cycle Labour Supply. Professor H.J. Schuetze Economics 371
 Topic 2.3b - Life-Cycle Labour Supply Professor H.J. Schuetze Economics 371 Life-cycle Labour Supply The simple static labour supply model discussed so far has a number of short-comings For example, The
Women Leading UK Employment Boom
 Briefing Paper Feb 2018 Women Leading UK Employment Boom Published by The Institute for New Economic Thinking, University of Oxford Women Leading UK Employment Boom Summary Matteo Richiardi a, Brian Nolan
New Jersey Public-Private Sector Wage Differentials: 1970 to William M. Rodgers III. Heldrich Center for Workforce Development
 New Jersey Public-Private Sector Wage Differentials: 1970 to 2004 1 William M. Rodgers III Heldrich Center for Workforce Development Bloustein School of Planning and Public Policy November 2006 EXECUTIVE
CHAPTER 03. A Modern and. Pensions System
 CHAPTER 03 A Modern and Sustainable Pensions System 24 Introduction 3.1 A key objective of pension policy design is to ensure the sustainability of the system over the longer term. Financial sustainability
Adjustment Costs, Firm Responses, and Labor Supply Elasticities: Evidence from Danish Tax Records
 Adjustment Costs, Firm Responses, and Labor Supply Elasticities: Evidence from Danish Tax Records Raj Chetty, Harvard University and NBER John N. Friedman, Harvard University and NBER Tore Olsen, Harvard
Over the pa st tw o de cad es the
 Generation Vexed: Age-Cohort Differences In Employer-Sponsored Health Insurance Coverage Even when today s young adults get older, they are likely to have lower rates of employer-related health coverage
CHAPTER 2. Hidden unemployment in Australia. William F. Mitchell
 CHAPTER 2 Hidden unemployment in Australia William F. Mitchell 2.1 Introduction From the viewpoint of Okun s upgrading hypothesis, a cyclical rise in labour force participation (indicating that the discouraged
THE U.S. ECONOMY IN 1986
 of women in the labor force. Over the past decade, women have accounted for 62 percent of total labor force growth. Increasing labor force participation of women has not led to large increases in unemployment
STATE PENSIONS AND THE WELL-BEING OF
 STATE PENSIONS AND THE WELL-BEING OF THE ELDERLY IN THE UK James Banks Richard Blundell Carl Emmerson Zoë Oldfield THE INSTITUTE FOR FISCAL STUDIES WP06/14 State Pensions and the Well-Being of the Elderly
Equal Pay Audit 2017
 Equal Pay Audit 2017 University of Hull Equal Pay Audit 2017 1. Introduction. The University of Hull has undertaken regular equal pay audits since 2008, following the implementation of a pay and grading
SEX DISCRIMINATION PROBLEM
 SEX DISCRIMINATION PROBLEM 5. Displaying Relationships between Variables In this section we will use scatterplots to examine the relationship between the dependent variable (starting salary) and each of
Theory of the rate of return
 Macroeconomics 2 Short Note 2 06.10.2011. Christian Groth Theory of the rate of return Thisshortnotegivesasummaryofdifferent circumstances that give rise to differences intherateofreturnondifferent assets.
Wage Progression in the UK
 Wage Progression in the UK Monica Costa Dias Robert Joyce DWP meeting, January 2017 Outline Brief overview of recent and planned research relating to earnings progression Women: wages over the lifecycle,
It is now commonly accepted that earnings inequality
 What Is Happening to Earnings Inequality in Canada in the 1990s? Garnett Picot Business and Labour Market Analysis Division Statistics Canada* It is now commonly accepted that earnings inequality that
Changes in the Experience-Earnings Pro le: Robustness
 Changes in the Experience-Earnings Pro le: Robustness Online Appendix to Why Does Trend Growth A ect Equilibrium Employment? A New Explanation of an Old Puzzle, American Economic Review (forthcoming) Michael
Topic 2.3b - Life-Cycle Labour Supply. Professor H.J. Schuetze Economics 371
 Topic 2.3b - Life-Cycle Labour Supply Professor H.J. Schuetze Economics 371 Life-cycle Labour Supply The simple static labour supply model discussed so far has a number of short-comings For example, The
Boomers at Midlife. The AARP Life Stage Study. Wave 2
 Boomers at Midlife 2003 The AARP Life Stage Study Wave 2 Boomers at Midlife: The AARP Life Stage Study Wave 2, 2003 Carol Keegan, Ph.D. Project Manager, Knowledge Management, AARP 202-434-6286 Sonya Gross
GGDC RESEARCH MEMORANDUM 169
 GGDC RESEARCH MEMORANDUM 169 Vintage effects in human capital: Europe versus the United States Robert Inklaar and Marianna Papakonstantinou April 2017 university of groningen groningen growth and development
Returns to education in Australia
 Returns to education in Australia 2006-2016 FEBRUARY 2018 By XiaoDong Gong and Robert Tanton i About NATSEM/IGPA The National Centre for Social and Economic Modelling (NATSEM) was established on 1 January
Aging and Labor Market of Older Workers in Korea
 Aging and Labor Market of Older Workers in Korea Kyungsoo Choi Fellow, Korea Development Institute 1. Introduction One can easily expect that the share of older workers will rise and that of young workers
Private sector valuation of public sector experience: The role of education and geography *
 1 Private sector valuation of public sector experience: The role of education and geography * Jørn Rattsø and Hildegunn E. Stokke Department of Economics, Norwegian University of Science and Technology
Public Employees as Politicians: Evidence from Close Elections
 Public Employees as Politicians: Evidence from Close Elections Supporting information (For Online Publication Only) Ari Hyytinen University of Jyväskylä, School of Business and Economics (JSBE) Jaakko
NBER WORKING PAPER SERIES THE U.S. EMPLOYMENT-POPULATION REVERSAL IN THE 2000S: FACTS AND EXPLANATIONS. Robert A. Moffitt
 NBER WORKING PAPER SERIES THE U.S. EMPLOYMENT-POPULATION REVERSAL IN THE 2000S: FACTS AND EXPLANATIONS Robert A. Moffitt Working Paper 18520 http://www.nber.org/papers/w18520 NATIONAL BUREAU OF ECONOMIC
Discussion of Do taxes explain European employment? Indivisible labor, human capital, lotteries and savings, by Lars Ljungqvist and Thomas Sargent
 Discussion of Do taxes explain European employment? Indivisible labor, human capital, lotteries and savings, by Lars Ljungqvist and Thomas Sargent Olivier Blanchard July 2006 There are two ways to read
PIER Working Paper
 Penn Institute for Economic Research Department of Economics University of Pennsylvania 3718 Locust Walk Philadelphia, PA 19104-6297 pier@econ.upenn.edu http://www.econ.upenn.edu/pier PIER Working Paper
Online Appendix of. This appendix complements the evidence shown in the text. 1. Simulations
 Online Appendix of Heterogeneity in Returns to Wealth and the Measurement of Wealth Inequality By ANDREAS FAGERENG, LUIGI GUISO, DAVIDE MALACRINO AND LUIGI PISTAFERRI This appendix complements the evidence
Minimum Wage as a Poverty Reducing Measure
 Illinois State University ISU ReD: Research and edata Master's Theses - Economics Economics 5-2007 Minimum Wage as a Poverty Reducing Measure Kevin Souza Illinois State University Follow this and additional
ACCESS TO CREDIT BY NON-FINANCIAL FIRMS*
 ACCESS TO CREDIT BY NON-FINANCIAL FIRMS* António Antunes** Ricardo Martinho** 159 Articles Abstract In order to study the availability of credit to non-financial firms, we use in this article two different
Families and Careers
 Families and Careers Gueorgui Kambourov University of Toronto Iourii Manovskii University of Pennsylvania Irina A. Telyukova University of California - San Diego 1 Introduction November 30, 2007 Recent
Female labor force participation
 Female labor force participation Heidi L. Williams MIT 14.662 Spring 2015 Williams (MIT 14.662) Female labor force participation Spring 2015 1 / 51 See The Boston Globe article "Mayor Walsh Pushes to Gather
NBER WORKING PAPER SERIES THE NARROWING OF THE U.S. GENDER EARNINGS GAP, : A COHORT-BASED ANALYSIS. Catherine Weinberger Peter Kuhn
 NBER WORKING PAPER SERIES THE NARROWING OF THE U.S. GENDER EARNINGS GAP, 1959-1999: A COHORT-BASED ANALYSIS Catherine Weinberger Peter Kuhn Working Paper 12115 http://www.nber.org/papers/w12115 NATIONAL
Indian Households Finance: An analysis of Stocks vs. Flows- Extended Abstract
 Indian Households Finance: An analysis of Stocks vs. Flows- Extended Abstract Pawan Gopalakrishnan S. K. Ritadhi Shekhar Tomar September 15, 2018 Abstract How do households allocate their income across
Research Brief 09/47
 Research Brief 09/47 24.09.2009 WOMEN HAVE LONGER UNEMPLOYMENT SPELLS Seyfettin Gürsel, Burak Darbaz, Duygu Güner Executive Summary Turkish labor market exhibits substantial gender differences in labor-market
MERGERS AND ACQUISITIONS: THE ROLE OF GENDER IN EUROPE AND THE UNITED KINGDOM
 ) MERGERS AND ACQUISITIONS: THE ROLE OF GENDER IN EUROPE AND THE UNITED KINGDOM Ersin Güner 559370 Master Finance Supervisor: dr. P.C. (Peter) de Goeij December 2013 Abstract Evidence from the US shows
CHAPTER 16. EXPECTATIONS, CONSUMPTION, AND INVESTMENT
 CHAPTER 16. EXPECTATIONS, CONSUMPTION, AND INVESTMENT I. MOTIVATING QUESTION How Do Expectations about the Future Influence Consumption and Investment? Consumers are to some degree forward looking, and
CHAPTER IV: LABOUR FORCE STATUS
 CHAPTER IV: LABOUR FORCE STATUS 1. Trends in the Population in Labour Force Japan s population in labour force is 65. million, showing a labour force participation rate of 61.5%. According to the status
The labor market in Australia,
 GARRY BARRETT University of Sydney, Australia, and IZA, Germany The labor market in Australia, 2000 2016 Sustained economic growth led to reduced unemployment and real earnings growth, but prosperity has
Empirical Assessment of the Gender Wage Gap: An Application for East Germany During Transition ( )
") Empirical Assessment of the Gender Wage Gap: An Application for East Germany During Transition (1990-1994) By Katalin Springel Submitted to Central European University Department of Economics In partial
Empirical Assessment of the Gender Wage Gap: An Application for East Germany During Transition (1990-1994) By Katalin Springel Submitted to Central European University Department of Economics In partial
Trends. o The take-up rate (the A T A. workers. Both the. of workers covered by percent. in Between cent to 56.5 percent.
 April 2012 No o. 370 Employment-Based Health Benefits: Trends in Access and Coverage, 1997 20100 By Paul Fronstin, Ph.D., Employeee Benefit Research Institute A T A G L A N C E Since 2002 the percentage
Gender Disparity in Faculty Salaries at Simon Fraser University
 Gender Disparity in Faculty Salaries at Simon Fraser University Anke S. Kessler and Krishna Pendakur, Department of Economics, Simon Fraser University July 10, 2015 1. Introduction Gender pay equity in
The Changing Distribution of Pension Coverage*
 The Changing Distribution of Pension Coverage* Industrial Relations, April 2000 William E. Even David A. Macpherson Department of Economics Department of Economics Miami University Florida State University
The Reversal of the Employment- Population Ratio in the 2000s: Facts and Explanations
 robert a. moffitt Johns Hopkins University The Reversal of the Employment- Population Ratio in the 2000s: Facts and Explanations ABSTRACT The decline in the employment-population ratios for men and women
Does the Sophistication of Use of Unemployment Insurance Evolve with Experience?
 Does the Sophistication of Use of Unemployment Insurance Evolve with Experience? David Gray University of Ottawa Ted McDonald University of New Brunswick For presentation at the OECD June 2011 Topic: repeat
CAN EDUCATIONAL ATTAINMENT EXPLAIN THE RISE IN LABOR FORCE PARTICIPATION AT OLDER AGES?
 September 2013, Number 13-13 RETIREMENT RESEARCH CAN EDUCATIONAL ATTAINMENT EXPLAIN THE RISE IN LABOR FORCE PARTICIPATION AT OLDER AGES? By Gary Burtless* Introduction The labor force participation of
The Impact of a $15 Minimum Wage on Hunger in America
 The Impact of a $15 Minimum Wage on Hunger in America Appendix A: Theoretical Model SEPTEMBER 1, 2016 WILLIAM M. RODGERS III Since I only observe the outcome of whether the household nutritional level
Introduction. Education: Stylized Facts. The Schooling Model 4/15/2010. Chapter 6. Present Value Calculations
 Introduction Chapter 6 Human Capital People bring into the labor market a unique set of abilities and acquired skills known as human capital. Workers add to their stock of human capital throughout their
Consumption Inequality in Canada, Sam Norris and Krishna Pendakur
 Consumption Inequality in Canada, 1997-2009 Sam Norris and Krishna Pendakur Inequality has rightly been hailed as one of the major public policy challenges of the twenty-first century. In all member countries
Rising Inequality in Life Expectancy by Socioeconomic Status
 Anthony Webb Research Director, Retirement Equity Lab (ReLab) Rising Inequality in Life Expectancy by Socioeconomic Status Geoffrey T. Sanzencaher Center for Retirement Research at Boston College Anthony
Population Changes and the Economy
 Population Changes and the Economy Predicting the effect of the retirement of the baby boom generation on the economy is not a straightforward matter. J ANICE F. MADDEN SOME ECONOMIC forecasters have suggested
Labor Participation and Gender Inequality in Indonesia. Preliminary Draft DO NOT QUOTE
 Labor Participation and Gender Inequality in Indonesia Preliminary Draft DO NOT QUOTE I. Introduction Income disparities between males and females have been identified as one major issue in the process
GAO GENDER PAY DIFFERENCES. Progress Made, but Women Remain Overrepresented among Low-Wage Workers. Report to Congressional Requesters
 GAO United States Government Accountability Office Report to Congressional Requesters October 2011 GENDER PAY DIFFERENCES Progress Made, but Women Remain Overrepresented among Low-Wage Workers GAO-12-10
Patterns of Unemployment
 Patterns of Unemployment By: OpenStaxCollege Let s look at how unemployment rates have changed over time and how various groups of people are affected by unemployment differently. The Historical U.S. Unemployment
Gender Differences in the Labor Market Effects of the Dollar
 Gender Differences in the Labor Market Effects of the Dollar Linda Goldberg and Joseph Tracy Federal Reserve Bank of New York and NBER April 2001 Abstract Although the dollar has been shown to influence
The Outlook For Labor Force Growth
 The Outlook For Labor Force Growth National Association For Business Economics Chicago, Illinois January 5, 2007 Daniel Sullivan Federal Reserve Bank of Chicago Pop Quiz! Payroll employment increases have
How Rich Will China Become? A simple calculation based on South Korea and Japan s experience
 ECONOMIC POLICY PAPER 15-5 MAY 2015 How Rich Will China Become? A simple calculation based on South Korea and Japan s experience EXECUTIVE SUMMARY China s impressive economic growth since the 1980s raises
The Impact of Demographic Change on the. of Managers and
 The Impact of Demographic Change on the Future Availability of Managers and Professionals in Europe Printed with the financial support of the European Union The Impact of Demographic Change on the Future
University of the Basque Country/Euskal Herriko Unibertsitatea Department of Foundations of Economic Analysis II
 University of the Basque Country/Euskal Herriko Unibertsitatea Department of Foundations of Economic Analysis II 2010-2011 CHANGES IN THE GENDER WAGE GAP AND THE ROLE OF EDUCATION AND OTHER JOB CHARACTERISTICS:
The Health of Jefferson County: 2010 Demographic Update
 The Health of : 2010 Demographic Update BACKGROUND How people live the sociodemographic context of their lives influences their health. People who have lower incomes may not have the resources to meet
Income Inequality, Mobility and Turnover at the Top in the U.S., Gerald Auten Geoffrey Gee And Nicholas Turner
 Income Inequality, Mobility and Turnover at the Top in the U.S., 1987 2010 Gerald Auten Geoffrey Gee And Nicholas Turner Cross-sectional Census data, survey data or income tax returns (Saez 2003) generally
Analysis of Labour Force Survey Data for the Information Technology Occupations
 April 2006 Analysis of Labour Force Survey Data for the Information Technology Occupations 2000 2005 By: William G Wolfson, WGW Services Ltd. Contents Highlights... 2 Background... 4 1. Overview of Labour
The Minimum Wage, Turnover, and the Shape of the Wage Distribution
 The Minimum Wage, Turnover, and the Shape of the Wage Distribution Pierre Brochu David A. Green Thomas Lemieux James Townsend January 6 2018 Introduction In recent years, the minimum policy has played
An Analysis of Public and Private Sector Earnings in Ireland
 An Analysis of Public and Private Sector Earnings in Ireland 2008-2013 Prepared in collaboration with publicpolicy.ie by: Justin Doran, Nóirín McCarthy, Marie O Connor; School of Economics, University
Ability Bias and the Rising Education Premium in the United States: A Cohort Based Analysis
 Ability Bias and the Rising Education Premium in the United States: A Cohort Based Analysis Barış Kaymak Université de Montréal Abstract This paper uses variation in educational attainment by birth cohorts
Job Loss and the Decline in Job Security in the United States
 WORKING PAPER #520 PRINCETON UNIVERSITY INDUSTRIAL RELATIONS SECTION July 2007 Revised: December 7, 2009 Job Loss and the Decline in Job Security in the United States Henry S. Farber Princeton University
Online Robustness Appendix to Are Household Surveys Like Tax Forms: Evidence from the Self Employed
 Online Robustness Appendix to Are Household Surveys Like Tax Forms: Evidence from the Self Employed March 01 Erik Hurst University of Chicago Geng Li Board of Governors of the Federal Reserve System Benjamin
Online Appendix Long-Lasting Effects of Socialist Education
 Online Appendix Long-Lasting Effects of Socialist Education Nicola Fuchs-Schündeln Goethe University Frankfurt, CEPR, and IZA Paolo Masella University of Sussex and IZA December 11, 2015 1 Temporary Disruptions
DYNAMICS OF URBAN INFORMAL
 DYNAMICS OF URBAN INFORMAL EMPLOYMENT IN BANGLADESH Selim Raihan Professor of Economics, University of Dhaka and Executive Director, SANEM ICRIER Conference on Creating Jobs in South Asia 3-4 December
institution Top 10 to 20 undergraduate
 Appendix Table A1 Who Responded to the Survey Dynamics of the Gender Gap for Young Professionals in the Financial and Corporate Sectors By Marianne Bertrand, Claudia Goldin, Lawrence F. Katz On-Line Appendix
Can Social Security Explain Trends in Labor Force Participation of Older Men in the United States?
 Can Social Security Explain Trends in Labor Force Participation of Older Men in the United States? David Blau, Ohio State University Ryan Goodstein, University of North Carolina at Chapel Hill Revised
Identifying the Elasticity of Taxable Income
 Identifying the Elasticity of Taxable Income Sarah K. Burns Center for Poverty Research and Department of Economics University of Kentucky James P. Ziliak* Center for Poverty Research and Department of
Widening socioeconomic differences in mortality and the progressivity of public pensions and other programs
 Widening socioeconomic differences in mortality and the progressivity of public pensions and other programs Ronald Lee University of California at Berkeley Longevity 11 Conference, Lyon September 8, 2015
Ministry of Health, Labour and Welfare Statistics and Information Department
 Special Report on the Longitudinal Survey of Newborns in the 21st Century and the Longitudinal Survey of Adults in the 21st Century: Ten-Year Follow-up, 2001 2011 Ministry of Health, Labour and Welfare
Forecasting Labor Force Participation Rates
 Journal of Official Statistics, Vol. 22, No. 3, 2006, pp. 453 485 Forecasting Labor Force Participation Rates Edward W. Frees 1 Motivated by the desire to project the financial solvency of Social Security,
What You Don t Know Can t Help You: Knowledge and Retirement Decision Making
 VERY PRELIMINARY PLEASE DO NOT QUOTE COMMENTS WELCOME What You Don t Know Can t Help You: Knowledge and Retirement Decision Making February 2003 Sewin Chan Wagner Graduate School of Public Service New
The Evolution of Education: A Macroeconomic Analysis
 The Evolution of Education: A Macroeconomic Analysis Diego Restuccia University of Toronto Guillaume Vandenbroucke University of Iowa January 2010 Abstract Between 1940 and 2000 there has been a substantial
FIGURE I.1 / Per Capita Gross Domestic Product and Unemployment Rates. Year
 FIGURE I.1 / Per Capita Gross Domestic Product and Unemployment Rates 40,000 12 Real GDP per Capita (Chained 2000 Dollars) 35,000 30,000 25,000 20,000 15,000 10,000 5,000 Real GDP per Capita Unemployment
Saving energy. by Per Hedberg and Sören Holmberg
 Saving energy by Per Hedberg and Sören Holmberg Printed by EU Working Group on Energy Technology Surveys and Methodology (ETSAM). Brussels 2005 E Saving energy Per Hedberg and Sören Holmberg stablished
POPULATION AGING, LABOR DEMAND, AND THE STRUCTURE OF WAGES. Margarita Sapozhnikov and Robert K. Triest*
 WORK OPPORTUNITIES FOR OLDER AMERICANS SERIES WORKING PAPER # 8 OCTOBER 2007 POPULATION AGING, LABOR DEMAND, AND THE STRUCTURE OF WAGES Margarita Sapozhnikov and Robert K. Triest* CRR WP 2007-14 Released: