Poverty and development Week 11 March 15. Readings: Ray chapter 8
|
|
|
- Duane Edgar Richard
- 6 years ago
- Views:
Transcription
1 Poverty and development Week 11 March 15 Readings: Ray chapter 8 1
2 Introduction Poverty is both of intrinsic and functional significance. Poverty has enormous implications for the way in which entire economies function. Some of the functional implications were tied up in our discussion of inequality, but there are other that are specific to poverty itself. 2
3 Outline Poverty measures Empirical observations of poverty Functional aspects of poverty. 3
4 Poverty is an outcome of inequality at various levels Inequality of world income levels Inequality within the country Inequality within the household 4
5 Poverty Line An individual is poor if her income falls below some income deemed by various criteria to be necessary for basic necessities and adequate participation in economic life. Nutrition based poverty lines: The cost of a diet containing enough nutrition to meet basic human requirements. In this case, poverty line is the income needed to acquire this diet. Purely income based poverty lines: Some level of real income accepted as the poverty line. Countries have different types of poverty lines 5
6 Conceptual issues Overall expenditure or item-by-item consumption? Absolute or relative? Relative poverty: evaluated relative to the standards in each society Absolute poverty: based on standards that apply to all societies. Temporary or chronic? Households or individuals? 6
7 The head count ratio The head count ratio, HCR, measures the number of poor people (head count, HC) whose incomes are below the poverty line, relative to the whole population: yi p HCR # n HC n # indicates the number of individuals in the set {} p = poverty line. 7
8 Problems with the head-count ratio It is completely insensitive to the degree of individual poverty: It does not matter how close people s incomes are to the poverty line. Biases policy geared towards reducing HCR towards the richest of the poor. Same amount of resources can obtain a larger fall in HCR if the money is spent on people close to p lifting their incomes just above p, rather than spending it on people with incomes much below p. What does the target Halve extreme poverty by 2015! mean?: Should one focus on people just below the poverty line or on the poor among the poor? 8
9 Income Gap Ratio (IGR) It captures the acuteness of poverty IGR is the sum of income gaps (= difference of income from the poverty line) of poor people relative to the total income needed to eradicate poverty completely: IGR y p i p phc y i 9
10 Poverty Gap Ratio A measure of resources required to eradicate poverty. PGR measures the average income needed to get all poor people to the poverty line, divided by the mean income (m): p y PGR y p i nm i IGR and PGR measures are to some extent insensitive to the degree of poverty: The same weight is given to all income gaps to p. Inequality among the poor ignored 10
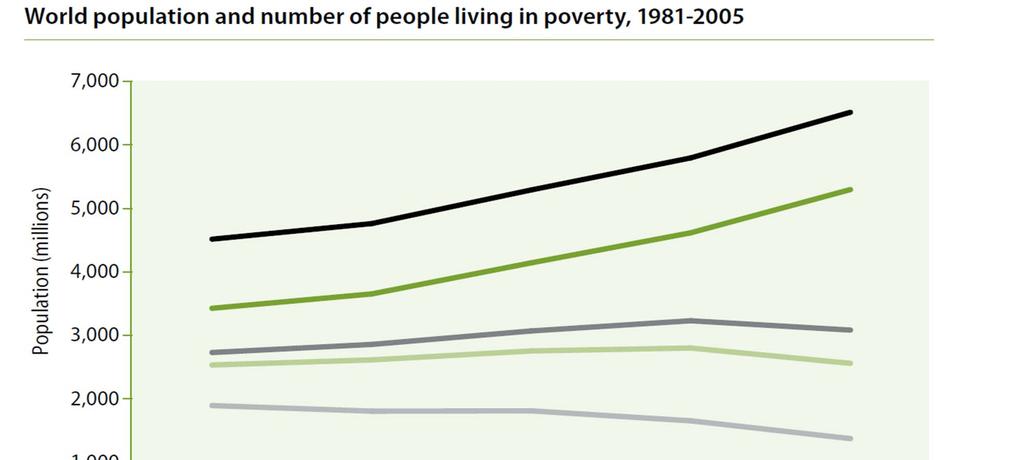
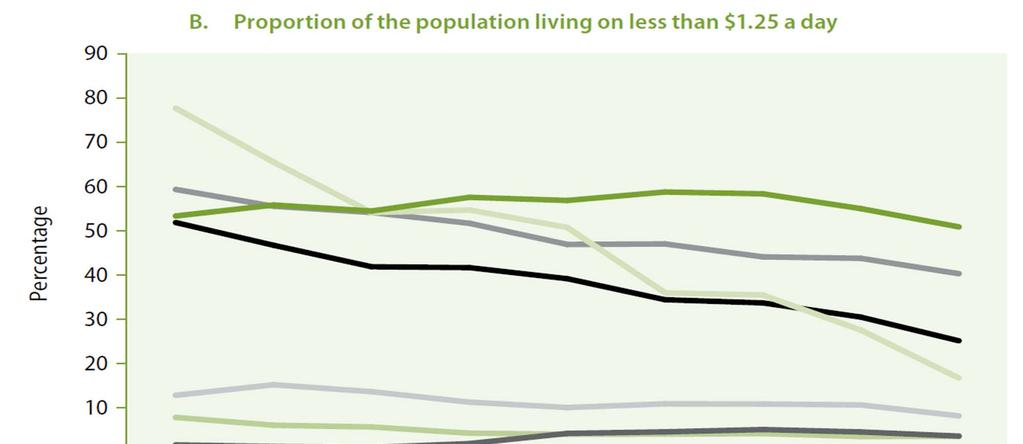
11 Poverty Numbers According to the World Bank s much cited dollar-a-day international poverty line, which was revised in 2008 to $1.25 a day in 2005 prices, there are still 1.4 billion people living in poverty. This represents a decline from the 1.9 billion in This figure is higher than the 2004 estimate of 984 million made with the old measure of $1-a-day. Millennium Development Goals set out in the Millennium Declaration: Halve the proportion of the world s people living on less than one dollar a day by
12 12
13 13
14 14

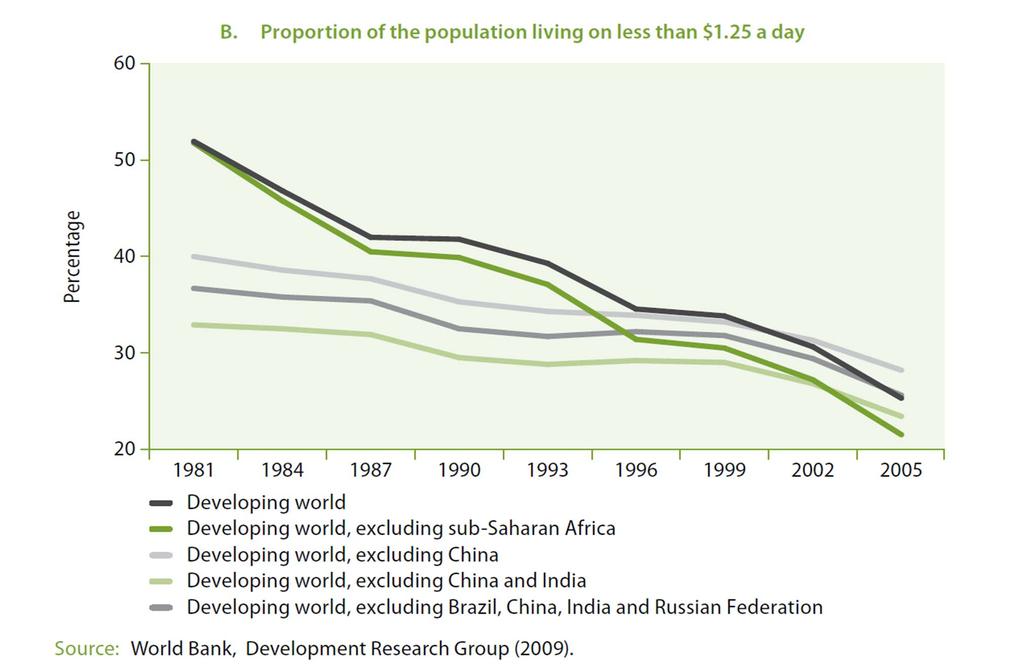
15 Source: World Bank, Development Research Group (2009). a By 2005, the region had achieved the 2015 target of halving poverty, using 1990 as the baseline. 15
16 The Functional Impact of Poverty - Credit The poor are unable to obtain loans that can be used to better their lives by allowing them to invest in productive activities. The failure occurs for several reasons: 1. Lack of collateral that can be put up for loan repayment. 2. It can be argued that the incentives to repay for the poor are limited, independent of their inability to put up collateral. Each additional unit of money in hand means far more to a poor individual than to a rich individual. The calculus of whether or not to default on the loan is naturally twisted in favor of default. 16
17 Incentives to repay for the poor and rich: a comparison utility Y poor Y rich income 17
18 The Functional Impact of Poverty - Credit It can be argued that the assumption of similar loan size is not sensible. The poor do get smaller loans, and precisely for the reason just described. We are not taking the costs of default into account. Perhaps the stakes are higher for the poor: they have more to lose from lack of future access to credit. It is possible that the poor have more to lose from default, but this only reinforces our argument that initial poverty reduces access to the credit market 18
19 The Functional Impact of Poverty - Nutrition and labor markets A simple story of energy balance within the human body: 1. Energy Input 2. Resting metabolism 3. Energy required for work 4. Storage and borrowing At least in the long run there has to be some form of balance between item 1 and the sum of item 2 and 3. In the short or medium run the body may run an excess or deficit of energy. A sustained deficit leads to undernutrition, and ultimately, the breakdown of the body. 19
20 The capacity curve. What happens as we move from left to right along the x axis? Work Capacity Initially, most of this nutrition goes into maintaining resting metabolism, very little extra energy is left over for work. So work capacity in this region is low and does not increase too quickly. Once resting metabolism is taken care of, there is a marked increase in work capacity. This phase is followed by a phase of diminishing returns. income 20
21 Nutrition and labor markets Labor markets generate income and therefore create the source of nutrition, and good nutrition in turn affects work capacity that generate income. There is a cycle here, and this cycle alerts us to the possibility that in developing countries, a significant fraction of the population may be caught in a poverty trap. This is the functional aspect of undernutrition: apart from being of social and ethical concern in its own right, it has an impact on the ability to earn. 21
22 The unequal sharing of poverty One of the great tragedies of poverty is that the poor may not afford to share their poverty equally. Unequal sharing because a certain minimum of nutrition have to be devoted to each person in order for that person s life to be productive. The potential gain of unequal division is that it helps some individuals in the household to be minimally productive under extreme circumstances. 22
23 The capacity curve and unequal allocation Work Capacity B Equal consumption allocation has no effect on total household work capacity A Y*/2 Y* income 23
24 The capacity curve and unequal allocation Work Capacity B Unequal consumption allocation creates greater household work capacity than equal allocation. A Y/2 Y income 24
25 The receiving end How does the unequal sharing look like? Who are the individuals at the bottom? They are typically the old. Nutrition and medical care serve a functional role, they provide the foundation for income-earning capabilities in the future. The old are in less of a position to provide these capabilities. They are typically females, both adults and children. Unless we believe that men are more fit than women for tasks of various sorts, we cannot make the case for discrimination against women. 25
26 Poverty and gender gaps Females receive systematically lower nutrition than men. It may not be enough to simply observe that women receive less nutrition than men: the question is whether they receive less nutrition relative to their requirement. The evidence on this matter is not clear-cut. 26
27 Calorie intakes and requirements by sex in rural Bangladesh ( ) Age group Calorie intake MALE Calorie requirement Ratio Calorie intake FEMALE Calorie requirement ,989 2, ,780 2, ,239 2, , ,049 3, ,110 2, ,962 3, ,437 1, ,866 2, ,272 1, ,702 2, ,193 1, ,569 2, ,088 1, ,617 1, ,463 1, Ratio 27
28 Poverty and gender gaps A female child may not be given education or her education may be neglected because education of female children is not expected to pay off. The World Development Report (1996) noted that for low-income countries as a whole, there were almost twice as many female illiterates as there were males in
29 Sibling Rivalry: Evidence from Ghana Garg and Morduch (1997) explored how economic constraints might create gender differences in Ghana. They shows that children aged with three siblings are over 50% more likely to attend middle or secondary school when all three of their siblings are sisters than when the three are brothers. The study illustrates the importance of considering issues of gender within the context of markets and institutions available to households. 29
30 Poverty and gender gaps Sex-based differences in infant mortality may explain a large amount of discrimination. The survivors may be treated relatively equally, but in looking for this we fail to count the dead (or never born). 30
31 Sex ratios (females per 100 males) in Asia, 2000 Afghanistan Armenia Azerbaijan Bahrain Bangladesh Bhutan Brunei Bulgaria Cambodia China India Indonesia Iran Iraq Iraq Israel Israel Jordan Kazakhstan Korea DPR Korea Rep Korea Rep Kuwait Kyrgyzstan Lao PDR Lebanon Malaysia Malaysia Mongolia Myanmar Nepal Oman Pakistan Philippines Qatar Saudi Arabia Singapore Sri Lanka Tajikistan Thailand Turkey Turkmenistan United Arab Emirates Uzbekistan Vietnam Females per 100 males 100 European Average 31
Cross-Border Tax Regimes. Steven Sieker Partner, Baker McKenzie 28 June 2018
 Cross-Border Tax Regimes Steven Sieker Partner, Baker McKenzie 28 June 2018 Taxation in the Cross-Border Context Payer service recipient / borrower / IP licensee / employer payments for services rendered
Third Working Meeting of the Technical Advisory Group (TAG) on Population and Social Statistics
 on Population and Social Statistics") Third Working Meeting of the Technical Advisory Group (TAG) on Population and Social Statistics Framework of Inclusive Growth Indicators (FIGI) Kaushal Joshi Senior Statistician, Research Division, Economics
Third Working Meeting of the Technical Advisory Group (TAG) on Population and Social Statistics Framework of Inclusive Growth Indicators (FIGI) Kaushal Joshi Senior Statistician, Research Division, Economics
What is So Bad About Inequality? What Can Be Done to Reduce It? Todaro and Smith, Chapter 5 (11th edition)
") What is So Bad About Inequality? What Can Be Done to Reduce It? Todaro and Smith, Chapter 5 (11th edition) What is so bad about inequality? 1. Extreme inequality leads to economic inefficiency. - At a
What is So Bad About Inequality? What Can Be Done to Reduce It? Todaro and Smith, Chapter 5 (11th edition) What is so bad about inequality? 1. Extreme inequality leads to economic inefficiency. - At a
Financing the MDG Gaps in the Asia-Pacific
 Financing the MDG Gaps in the Asia-Pacific Dr. Nagesh Kumar Chief Economist, ESCAP And Director, ESCAP Subregional Office for South and South-West Asia, New Delhi 1 2 Outline Closing the poverty gap: interactions
Agenda 3. The research framework for compiling and analyzing income support scheme
 2011 Expert Meeting Agenda 3. The research framework for compiling and analyzing income support scheme Yun Suk-myung Seoul 1 June 2011 Methodology Data & Information to be Compiled & Analyzed 2 Ⅰ. Methodology
The 2015 Social Protection Indicator Results for Asia Sri Wening Handayani ADB Principal Social Development Specialist
 The 2015 Social Protection Indicator Results for Asia Sri Wening Handayani ADB Principal Social Development Specialist The views expressed in this presentation are those of the author and do not necessarily
SECTION - 13: DEVELOPMENT INDICATORS FOR CIRDAP AND SAARC COUNTRIES
 Development Indicators for Cirdap and Saarc Countries 379 SECTION - 13: DEVELOPMENT INDICATORS FOR CIRDAP AND SAARC COUNTRIES The Centre for Integrated Rural Development for Asia and the Pacific (CIRDAP)
Asia-Pacific Countries with Special Needs Development Report Investing in Infrastructure for an Inclusive and Sustainable Future
 Asia-Pacific Countries with Special Needs Development Report 2017 Investing in Infrastructure for an Inclusive and Sustainable Future Manila, 30 August 2017 Countries with special needs Countries with
AIIB Strategy Briefing
 AIIB Strategy Briefing Background, Strategies, Investment and Challenges AIIB 2 nd Annual Meeting of the Board of Governors Governor Seminar I June 2017 Presentation I. Background and Context of Setting
Argentina Bahamas Barbados Bermuda Bolivia Brazil British Virgin Islands Canada Cayman Islands Chile
 Americas Argentina (Banking and finance; Capital markets: Debt; Capital markets: Equity; M&A; Project Bahamas (Financial and corporate) Barbados (Financial and corporate) Bermuda (Financial and corporate)
Demographic Trends in Japan and the Future of Life Insurance
 Demographic Trends in Japan and the Future of Life Insurance Naoko KUGA, M.E.,M.A.and M.T., NLI Research Institute, Inc. kuga@nli-research.co.jp 1 Outline Demographic Trends in Japan Effects of Declining
SECTION - 13: DEVELOPMENT INDICATORS FOR CIRDAP AND SAARC COUNTRIES
 Development Indicators for CIRDAP And SAARC Countries 485 SECTION - 13: DEVELOPMENT INDICATORS FOR CIRDAP AND SAARC COUNTRIES The Centre for Integrated Rural Development for Asia and the Pacific (CIRDAP)
MDG 8: Develop a Global Partnership for Development
 182 Key Indicators for Asia and the Pacific 2015 MDG 8: Develop a Global Partnership for Development Millennium Development Goal (MDG) 8 has six targets. The first three and last are the focus of this
Asia-Pacific Countries with Special Needs Development Report Investing in infrastructure for an inclusive and sustainable future
 Asia-Pacific Countries with Special Needs Development Report 2017 Investing in infrastructure for an inclusive and sustainable future Tbilisi, 8 May 2017 Introduction Countries with special needs (CSN)
Strengthening public finance in North and Central Asia. An overview
 Strengthening public finance in North and Central Asia An overview Public finance is the financing backbone for sustainable development and infrastructure investment The financing demand for the implementation
Double Tax Treaties. Necessity of Declaration on Tax Beneficial Ownership In case of capital gains tax. DTA Country Withholding Tax Rates (%)
") Double Tax Treaties DTA Country Withholding Tax Rates (%) Albania 0 0 5/10 1 No No No Armenia 5/10 9 0 5/10 1 Yes 2 No Yes Australia 10 0 15 No No No Austria 0 0 10 No No No Azerbaijan 8 0 8 Yes No Yes
Double Tax Treaties DTA Country Withholding Tax Rates (%) Albania 0 0 5/10 1 No No No Armenia 5/10 9 0 5/10 1 Yes 2 No Yes Australia 10 0 15 No No No Austria 0 0 10 No No No Azerbaijan 8 0 8 Yes No Yes
SINGAPORE - FINAL LIST OF MFN EXEMPTIONS (For the Second Package of Commitments) Countries to which the measure applies
 Countries to which the measure applies") All Sectors: Presence of: - unskilled and semi-skilled natural persons - skilled persons (include craftsmen skilled in a particular trade, but exclude specialists/professio nal personnel at management
All Sectors: Presence of: - unskilled and semi-skilled natural persons - skilled persons (include craftsmen skilled in a particular trade, but exclude specialists/professio nal personnel at management
Economic Consequence of Population Ageing in Asia
 Economic Consequence of Population Ageing in Asia Bazlul H Khondker Department of Economics Dhaka University Chairman South Asian Network on Economic Modeling (SANEM) Presented at 12 th Global NTA Meeting
Asia-Pacific: Sustainable Development Financing Outreach. Asia-Pacific: Landscape & State of Sustainable Financing
 Asia-Pacific: Sustainable Development Financing Outreach Asia-Pacific: Landscape & State of Sustainable Financing Dr. Shamshad Akhtar, United Nations Under-Secretary-General & ESCAP Executive Secretary
Withholding Tax Rate under DTAA
 Withholding Tax Rate under DTAA Country Albania 10% 10% 10% 10% Armenia 10% Australia 15% 15% 10%/15% [Note 2] 10%/15% [Note 2] Austria 10% Bangladesh Belarus a) 10% (if at least 10% of recipient company);
Asian Noodle Bowl of International Investment Agreements (IIAs)
") Asian Noodle Bowl of International Investment Agreements (IIAs) ARTNeT Conference 10 December, 2013 Macau, PRC Shintaro Hamanaka Economist, Office of Regional Economic Integration (OREI), Asian Development
Asian Noodle Bowl of International Investment Agreements (IIAs) ARTNeT Conference 10 December, 2013 Macau, PRC Shintaro Hamanaka Economist, Office of Regional Economic Integration (OREI), Asian Development
Albania 10% 10%[Note1] 10% 10% Armenia 10% 10% [Note1] 10% 10% Austria 10% 10% [Note1] 10% 10%
![Albania 10% 10%[Note1] 10% 10% Armenia 10% 10% [Note1] 10% 10% Austria 10% 10% [Note1] 10% 10%](/thumbs/88/116150947.jpg "Albania 10% 10%[Note1] 10% 10% Armenia 10% 10% [Note1] 10% 10% Austria 10% 10% [Note1] 10% 10%") Country Dividend (not being covered under Section 115-O) Withholding tax rates Interest Royalty Fee for Technical Services Albania 10% 10%[Note1] 10% 10% Armenia 10% Australia 15% 15% 10%/15% 10%/15% Austria
Country Dividend (not being covered under Section 115-O) Withholding tax rates Interest Royalty Fee for Technical Services Albania 10% 10%[Note1] 10% 10% Armenia 10% Australia 15% 15% 10%/15% 10%/15% Austria
Paul Browne, Partner, London Yongmei Cai, Partner, Beijing Jay Lee, Partner, Hong Kong
 One Belt One Road and RMB internationalisation: a look at how recent PRC regulatory developments provide significant opportunities for market participants in the Financial Markets in the UK and Europe
1 ACCOUNT OWNERSHIP. MAP 1.1 Account ownership varies widely around the world Adults with an account (%), Source: Global Findex database.
, Source: Global Findex database.") 1 ACCOUNT OWNERSHIP Globally, 69 percent of adults have an account. That gives them an important financial tool. Accounts provide a safe way to store money and build savings for the future. They also make
1 ACCOUNT OWNERSHIP Globally, 69 percent of adults have an account. That gives them an important financial tool. Accounts provide a safe way to store money and build savings for the future. They also make
Fiscal policy for inclusive growth in Asia
 Fiscal policy for inclusive growth in Asia Dr. Donghyun Park, Principal Economist Economics and Research Department, Asian Development Bank PRI-IMF-ADBI Tokyo Fiscal Forum on Fiscal Policy toward Long-Term
Withholding tax rates 2016 as per Finance Act 2016
 Withholding tax rates 2016 as per Finance Act 2016 Sr No Country Dividend Interest Royalty Fee for Technical (not being covered under Section 115-O) Services 1 Albania 10% 10% 10% 10% 2 Armenia 10% 10%
INFRASTRUCTURE NEEDS
 INFRASTRUCTURE NEEDS Key messages Developing Asia needs $26 trillion (in 2015 prices), or $1.7 trillion per year, for infrastructure investment in 2016-2030 Without climate change mitigation and adaptation,
Survey launch in 37 locations
 ECONOMIC AND SOCIAL SURVEY OF ASIA AND THE PACIFIC 213 Forward-looking Macroeconomic Policies for Inclusive and Sustainable Development 1 Survey launch in 37 locations 2 28 Locations in Asia-Pacific New
Money, Finance, and Prices
 118 III. Money, Finance, and Prices Snapshot Inflation, as measured by the consumer price index (CPI), exceeded 5.0% in 13 of 47 regional economies in 2017. In 2017, the money supply expanded on an annual
Supplementary Table S1 National mitigation objectives included in INDCs from Jan to Jul. 2017
 1 Supplementary Table S1 National mitigation objectives included in INDCs from Jan. 2015 to Jul. 2017 Country Submitted Date GHG Reduction Target Quantified Unconditional Conditional Asia Afghanistan Oct.,
FINANCE TO ENSURE ASIA S ECONOMIC GROWTH DR. RANEE JAYAMAHA CHAIRPERSON - HATTON NATIONAL BANK PLC
 FINANCE TO ENSURE ASIA S ECONOMIC GROWTH DR. RANEE JAYAMAHA CHAIRPERSON - HATTON NATIONAL BANK PLC TABLE 1 : REAL GDP GROWTH OF SOUTHEAST ASIA, CHINA AND INDIA (ANNUAL PERCENTAGE CHANGE) PROJECTIONS ASEAN-6
Oesterreichische Kontrollbank AG. Financing Waste Management Projects in Brazil September 2017
 Oesterreichische Kontrollbank AG Financing Waste Management Projects in Brazil September 2017 1 OeKB Group insuring your success 3.500 clients of our export service approx. 400 employees covering more
Comperative DTTs of Pakistan
 Comperative DTTs of Pakistan 1 2 3 4 5 6 7 8 9 10 11 12 13 14 15 S. No. COUNTRY CONTINENT Republic/Dem ocratic/kingdo m/sultanate P.E. BUSINESS PROFIT SHIPPING AIR TRANSPORT DIVIDEND INTEREST ROYALITIES
Annex Supporting international mobility: calculating salaries
 Annex 5.2 - Supporting international mobility: calculating salaries Base salary refers to a fixed amount of money paid to an Employee in return for work performed and it is determined in accordance with
Online Free Services Available on the Portal
 Online Free Services Available on the Portal MFN/Preferential Tariff of over 50 Countries MFN/ Preferential Tariff and SPS-TBT of India Rules of Origin to get preferential access to targeted markets under
YUM! Brands, Inc. Historical Financial Summary. Second Quarter, 2017
 YUM! Brands, Inc. Historical Financial Summary Second Quarter, 2017 YUM! Brands, Inc. Consolidated Statements of Income (in millions, except per share amounts) 2017 2016 2015 YTD Q3 Q4 FY FY Revenues Company
The G20 Mexico Summit 2012 Key Issues for Asia-Pacific
 The G20 Mexico Summit 2012 Key Issues for Asia-Pacific Third ESCAP High-Level Consultation Bangkok, 23 May 2012 Dr. Nagesh Kumar Chief Economist, UN-ESCAP And Director, ESCAP SRO-SSWA 1 Outline Reviving
GEF Evaluation Office MID-TERM REVIEW OF THE GEF RESOURCE ALLOCATION FRAMEWORK. Portfolio Analysis and Historical Allocations
 GEF Evaluation Office MID-TERM REVIEW OF THE GEF RESOURCE ALLOCATION FRAMEWORK Portfolio Analysis and Historical Allocations Statistical Annex #2 30 October 2008 Midterm Review Contents Table 1: Historical
ANTECENDENTES E CONCEITOS BASICOS
 REPÚBLICA DE MOÇAMBIQUE MINISTÉRIO DA ECONOMIA E FINANÇAS DIRECÇÃO NACIONAL DE ESTUDOS E ANÁLISE DE POLÍTICAS ANTECENDENTES E CONCEITOS BASICOS Curso sobre Análise de Pobreza Maputo, 6-10 Julho 2015 Outline
July 2017 CASH MARKET TRANSACTION SURVEY 2016
 July 2017 CASH MARKET TRANSACTION SURVEY 2016 CONTENTS Page Key findings... 1 Figures and tables... 4 1. Distribution of market trading value by investor type... 4 2. Distribution of overseas investor
ide: FRANCE Appendix A Countries with Double Taxation Agreement with France
 Fiscal operational guide: FRANCE ide: FRANCE Appendix A Countries with Double Taxation Agreement with France Albania Algeria Argentina Armenia 2006 2006 From 1 March 1981 2002 1 1 1 All persons 1 Legal
Dutch tax treaty overview Q3, 2012
 Dutch tax treaty overview Q3, 2012 Hendrik van Duijn DTS Duijn's Tax Solutions Zuidplein 36 (WTC Tower H) 1077 XV Amsterdam The Netherlands T +31 888 387 669 T +31 888 DTS NOW F +31 88 8 387 601 duijn@duijntax.com
Economics 448 Lecture 13 Poverty and Malnutrition
 Economics 448 Poverty and Malnutrition October 18, 2012 Underdevelopment Poverty is the most visible characteristic of underdevelopment. Easy to descriptive examples of the development process. But it
TRENDS AND MARKERS Signatories to the United Nations Convention against Transnational Organised Crime
 A F R I C A WA T C H TRENDS AND MARKERS Signatories to the United Nations Convention against Transnational Organised Crime Afghanistan Albania Algeria Andorra Angola Antigua and Barbuda Argentina Armenia
Today's CPI data: what you need to know
 Trend Macrolytics, LLC Donald Luskin, Chief Investment Officer Thomas Demas, Managing Director Michael Warren, Energy Strategist Data Insights: Consumer Price Index, Producer Price Index Friday, July 14,
Managing Risks along the Belt & Road. Navigating Country, Geopolitical and Business Entity Risks with data and analytics
 Managing Risks along the Belt & Road Navigating Country, Geopolitical and Business Entity Risks with data and analytics June 2018 FOREWORD The 'Belt and Road Initiative' offers significant benefits in
Figure I Changes in real GDP growth rates in China
 Chapter 3 Trends in the Chinese economy Section 1 Macroeconomic trends in China In this section, we will provide an overview of the Chinese economy in 2016, mainly the trends in major economic indicators.
ADB Economics Working Paper Series. Poverty Impact of the Economic Slowdown in Developing Asia: Some Scenarios
 ADB Economics Working Paper Series Poverty Impact of the Economic Slowdown in Developing Asia: Some Scenarios Rana Hasan, Maria Rhoda Magsombol, and J. Salcedo Cain No. 153 April 2009 ADB Economics Working
2 Albania Algeria , Andorra
 1 Afghanistan LDC 110 80 110 80 219 160 2 Albania 631 460 631 460 1 262 920 3 Algeria 8 628 6,290 8 615 6 280 17 243 12 570 4 Andorra 837 610 837 610 1 674 1 220 5 Angola LDC 316 230 316 230 631 460 6
SURVEY TO DETERMINE THE PERCENTAGE OF NATIONAL REVENUE REPRESENTED BY CUSTOMS DUTIES INTRODUCTION
 SURVEY TO DETERMINE THE PERCENTAGE OF NATIONAL REVENUE REPRESENTED BY CUSTOMS DUTIES INTRODUCTION This publication provides information about the share of national revenues represented by Customs duties.
Improving the Business Environment in Iraq Through Secured Transactions
 Improving the Business Environment in Iraq Through Secured Transactions Murat Sultanov Beirut, October 17, 2011 CONTENTS What is Secured Transactions? Economic Importance 1 Why these systems are underdeveloped
Financing for Development in Asia and the Pacific: Opportunities and Challenges
 Financing for Development in Asia and the Pacific: Opportunities and Challenges Dr. Shamshad Akhtar, Under-Secretary-General of the United Nations & Executive Secretary of The Economic and Social Commission
2019 Daily Prayer for Peace Country Cycle
 2019 Daily Prayer for Peace Country Cycle Tuesday January 1, 2019 All Nations Wednesday January 2, 2019 Thailand Thursday January 3, 2019 Sudan Friday January 4, 2019 Solomon Islands Saturday January 5,
JPMorgan Funds statistics report: Emerging Markets Debt Fund
 NOT FDIC INSURED NO BANK GUARANTEE MAY LOSE VALUE JPMorgan Funds statistics report: Emerging Markets Debt Fund Data as of November 30, 2016 Must be preceded or accompanied by a prospectus. jpmorganfunds.com
Withholding Tax Rates 2014*
 Withholding Tax Rates 2014* (Rates are current as of 1 March 2014) Jurisdiction Dividends Interest Royalties Notes Afghanistan 20% 20% 20% International Tax Albania 10% 10% 10% Algeria 15% 10% 24% Andorra
Hoi Wai Cheng, Dawn Holland, Ingo Pitterle
 Hoi Wai Cheng, Dawn Holland, Ingo Pitterle United Nations, GEMU/DPAD/DESA Project LINK Meeting 21-23 October 2015, New York Demand-side role Direct impact on the price level and terms of trade Secondary
Scale of Assessment of Members' Contributions for 2008
 General Conference GC(51)/21 Date: 28 August 2007 General Distribution Original: English Fifty-first regular session Item 13 of the provisional agenda (GC(51)/1) Scale of Assessment of s' Contributions
IMF-ADB Seminar on Medium Term Revenue Strategy: ISORA and ADB s Comparative Series on Tax Administration
 IMF-ADB Seminar on Medium Term Revenue Strategy: ISORA and ADB s Comparative Series on Tax Administration Presentation by: Richard Highfield Consultant in Tax System Administration (ADB) 1-2 December 2017,
WGI Ranking for SA8000 System
 Afghanistan not rated Highest Risk ALBANIA 47 High Risk ALGERIA 24 Highest Risk AMERICAN SAMOA 74 Lower Risk ANDORRA 91 Lower Risk ANGOLA 16 Highest Risk ANGUILLA 90 Lower Risk ANTIGUA AND BARBUDA 76 Lower
Asia Key Economic and Financial Indicators 20-Oct-16
 Asia Key Economic and Financial Indicators -Oct- ASEAN Brunei (BN) Cambodia (KH) Indonesia () Laos (LA) Malaysia () Myanmar (MM) Philippines () Singapore () Thailand () Vietnam () East Asia China (CN)
Recycling Regional Savings for Closing Asia-Pacific s Infrastructure Gaps
 Recycling Regional Savings for Closing Asia-Pacific s Infrastructure Gaps Presentation at the Conference on Global Cooperation for Sustainable Growth and Development: Views from G20 Countries ICRIER, New
Total Imports by Volume (Gallons per Country)
") 10/5/2018 Imports by Volume (Gallons per Country) YTD YTD Country 08/2017 08/2018 % Change 2017 2018 % Change MEXICO 67,180,788 71,483,563 6.4 % 503,129,061 544,043,847 8.1 % NETHERLANDS 12,954,789 12,582,508
10/5/2018 Imports by Volume (Gallons per Country) YTD YTD Country 08/2017 08/2018 % Change 2017 2018 % Change MEXICO 67,180,788 71,483,563 6.4 % 503,129,061 544,043,847 8.1 % NETHERLANDS 12,954,789 12,582,508
Total Imports by Volume (Gallons per Country)
") 11/2/2018 Imports by Volume (Gallons per Country) YTD YTD Country 09/2017 09/2018 % Change 2017 2018 % Change MEXICO 49,299,573 57,635,840 16.9 % 552,428,635 601,679,687 8.9 % NETHERLANDS 11,656,759 13,024,144
11/2/2018 Imports by Volume (Gallons per Country) YTD YTD Country 09/2017 09/2018 % Change 2017 2018 % Change MEXICO 49,299,573 57,635,840 16.9 % 552,428,635 601,679,687 8.9 % NETHERLANDS 11,656,759 13,024,144
Total Imports by Volume (Gallons per Country)
") 12/6/2018 Imports by Volume (Gallons per Country) YTD YTD Country 10/2017 10/2018 % Change 2017 2018 % Change MEXICO 56,462,606 60,951,402 8.0 % 608,891,240 662,631,088 8.8 % NETHERLANDS 11,381,432 10,220,226
12/6/2018 Imports by Volume (Gallons per Country) YTD YTD Country 10/2017 10/2018 % Change 2017 2018 % Change MEXICO 56,462,606 60,951,402 8.0 % 608,891,240 662,631,088 8.8 % NETHERLANDS 11,381,432 10,220,226
Total Imports by Volume (Gallons per Country)
") 3/6/2019 Imports by Volume (Gallons per Country) YTD YTD Country 12/2017 12/2018 % Change 2017 2018 % Change MEXICO 54,169,734 56,505,154 4.3 % 712,020,884 773,421,634 8.6 % NETHERLANDS 11,037,475 8,403,018
3/6/2019 Imports by Volume (Gallons per Country) YTD YTD Country 12/2017 12/2018 % Change 2017 2018 % Change MEXICO 54,169,734 56,505,154 4.3 % 712,020,884 773,421,634 8.6 % NETHERLANDS 11,037,475 8,403,018
UBI Pramerica SGR. US Economic Environment. Richard K. Mastain, Senior Vice President Jennison Associates LLC. April 2008
 UBI Pramerica SGR US Economic Environment Richard K. Mastain, Senior Vice President Jennison Associates LLC Subadvisor to Certain UBI Pramerica SGR Funds April 2008 Notice This presentation is for informational
Total Imports by Volume (Gallons per Country)
") 2/6/2019 Imports by Volume (Gallons per Country) YTD YTD Country 11/2017 11/2018 % Change 2017 2018 % Change MEXICO 48,959,909 54,285,392 10.9 % 657,851,150 716,916,480 9.0 % NETHERLANDS 11,903,919 10,024,814
2/6/2019 Imports by Volume (Gallons per Country) YTD YTD Country 11/2017 11/2018 % Change 2017 2018 % Change MEXICO 48,959,909 54,285,392 10.9 % 657,851,150 716,916,480 9.0 % NETHERLANDS 11,903,919 10,024,814
Request to accept inclusive insurance P6L or EASY Pauschal
 5002001020 page 1 of 7 Request to accept inclusive insurance P6L or EASY Pauschal APPLICANT (INSURANCE POLICY HOLDER) Full company name and address WE ARE APPLYING FOR COVER PRIOR TO DELIVERY (PRE-SHIPMENT
Executive summary. Universal social protection to achieve the Sustainable Development Goals
 Executive summary Universal social protection to achieve the Sustainable Development Goals 2017 19 Universal social protection to achieve the Sustainable Development Goals Executive summary Social protection,
Dutch tax treaty overview Q4, 2013
 Dutch tax treaty overview Q4, 2013 Hendrik van Duijn DTS Duijn's Tax Solutions Zuidplein 36 (WTC Tower H) 1077 XV Amsterdam The Netherlands T +31 888 387 669 T +31 888 DTS NOW F +31 88 8 387 601 duijn@duijntax.com
Today's CPI data: what you need to know
 Trend Macrolytics, LLC Donald Luskin, Chief Investment Officer Thomas Demas, Managing Director Michael Warren, Energy Strategist Data Insights: Consumer Price Index, Producer Price Index Wednesday, December
Today's CPI data: what you need to know
 Trend Macrolytics, LLC Donald Luskin, Chief Investment Officer Thomas Demas, Managing Director Michael Warren, Energy Strategist Data Insights: Consumer Price Index, Producer Price Index Wednesday, February
INTERNATIONAL BANK FOR RECONSTRUCTION AND DEVELOPMENT BOARD OF GOVERNORS. Resolution No. 612
 INTERNATIONAL BANK FOR RECONSTRUCTION AND DEVELOPMENT BOARD OF GOVERNORS Resolution No. 612 2010 Selective Increase in Authorized Capital Stock to Enhance Voice and Participation of Developing and Transition
Asian Double Tax Treaties 2011
 Corporate Establishment, Tax, Accounting & Payroll Throughout Asia Asian Double Tax Treaties 2011 A compilation of all Asian countries and regional double tax treaties and who they have signed them with.
Today's CPI data: what you need to know
 Trend Macrolytics, LLC Donald Luskin, Chief Investment Officer Thomas Demas, Managing Director Michael Warren, Energy Strategist Data Insights: Consumer Price Index, Producer Price Index Thursday, July
Today's CPI data: what you need to know
 Trend Macrolytics, LLC Donald Luskin, Chief Investment Officer Thomas Demas, Managing Director Michael Warren, Energy Strategist Data Insights: Consumer Price Index, Producer Price Index Friday, January
Today's CPI data: what you need to know
 Trend Macrolytics, LLC Donald Luskin, Chief Investment Officer Thomas Demas, Managing Director Michael Warren, Energy Strategist Data Insights: Consumer Price Index, Producer Price Index Wednesday, April
MAXIMUM MONTHLY STIPEND RATES FOR FELLOWS AND SCHOLARS. Afghanistan $135 $608 $911 1 March Albania $144 $2,268 $3,402 1 January 2005
 MAXIMUM MONTHLY STIPEND RATES FOR FELLOWS AND SCHOLARS (IN U.S. DOLLARS FOR COST ESTIMATE) COUNTRY DSA(US$) MAX RES RATE MAX TRV RATE EFFECTIVE DATE OF % Afghanistan $135 $608 $911 1 March 1989 Albania
Today's CPI data: what you need to know
 Trend Macrolytics, LLC Donald Luskin, Chief Investment Officer Thomas Demas, Managing Director Michael Warren, Energy Strategist Data Insights: Consumer Price Index, Producer Price Index Friday, October
Today's CPI data: what you need to know
 Trend Macrolytics, LLC Donald Luskin, Chief Investment Officer Thomas Demas, Managing Director Michael Warren, Energy Strategist Data Insights: Consumer Price Index, Producer Price Index Friday, August
Today's CPI data: what you need to know
 Trend Macrolytics, LLC Donald Luskin, Chief Investment Officer Thomas Demas, Managing Director Michael Warren, Energy Strategist Data Insights: Consumer Price Index, Producer Price Index Wednesday, November
Total Imports by Volume (Gallons per Country)
") 2/6/2018 Imports by Volume (Gallons per Country) YTD YTD Country 12/2016 12/2017 % Change 2016 2017 % Change MEXICO 50,839,282 54,169,734 6.6 % 682,281,387 712,020,884 4.4 % NETHERLANDS 10,630,799 11,037,475
2/6/2018 Imports by Volume (Gallons per Country) YTD YTD Country 12/2016 12/2017 % Change 2016 2017 % Change MEXICO 50,839,282 54,169,734 6.6 % 682,281,387 712,020,884 4.4 % NETHERLANDS 10,630,799 11,037,475
Total Imports by Volume (Gallons per Country)
") 7/6/2018 Imports by Volume (Gallons per Country) YTD YTD Country 05/2017 05/2018 % Change 2017 2018 % Change MEXICO 71,166,360 74,896,922 5.2 % 302,626,505 328,397,135 8.5 % NETHERLANDS 12,039,171 13,341,929
7/6/2018 Imports by Volume (Gallons per Country) YTD YTD Country 05/2017 05/2018 % Change 2017 2018 % Change MEXICO 71,166,360 74,896,922 5.2 % 302,626,505 328,397,135 8.5 % NETHERLANDS 12,039,171 13,341,929
Asia Key Economic and Financial Indicators 13-Jul-17
 Asia Key Economic and Financial Indicators -Jul-7 ASEAN Brunei (BN) Cambodia (KH) Indonesia () Laos (LA) Malaysia () Myanmar (MM) Philippines () Singapore () Thailand () Vietnam () East Asia China (CN)
Today's CPI data: what you need to know
 Trend Macrolytics, LLC Donald Luskin, Chief Investment Officer Thomas Demas, Managing Director Michael Warren, Energy Strategist Data Insights: Consumer Price Index, Producer Price Index Thursday, October
Fundamentals of Trademark
 Fundamentals of Trademark Categories of IP Rights Intellectual Properties Patent Trade Mark Industrial Design Copyrights Intangible assets Monopolistic right ( to make, sell or otherwise deals with) Limited
Infrastructure Financing Challenges in Southeast Asia
 Infrastructure Financing Challenges in Southeast Asia Alfredo Perdiguero Director, Regional Cooperation and Coordination Division Southeast Asia Department Asian Development Bank Policy Dialogue on Infrastructure
The Capital Requirements (Country-by-Country Reporting) Regulations December 2017
 Regulations December 2017") HSBC Holdings plc The Capital Requirements (Country-by-Country Reporting) Regulations 2013 31 December 2017 This report has been prepared for HSBC Holdings plc and its subsidiaries (the HSBC Group ) to
HSBC Holdings plc The Capital Requirements (Country-by-Country Reporting) Regulations 2013 31 December 2017 This report has been prepared for HSBC Holdings plc and its subsidiaries (the HSBC Group ) to
Total Imports by Volume (Gallons per Country)
") 6/6/2018 Imports by Volume (Gallons per Country) YTD YTD Country 04/2017 04/2018 % Change 2017 2018 % Change MEXICO 60,968,190 71,994,646 18.1 % 231,460,145 253,500,213 9.5 % NETHERLANDS 13,307,731 10,001,693
6/6/2018 Imports by Volume (Gallons per Country) YTD YTD Country 04/2017 04/2018 % Change 2017 2018 % Change MEXICO 60,968,190 71,994,646 18.1 % 231,460,145 253,500,213 9.5 % NETHERLANDS 13,307,731 10,001,693
Economic and Social Survey of Asia and the Pacific 2017 Governance and Fiscal Management
 Economic and Social Survey of Asia and the Pacific 217 Governance and Fiscal Management Launch and Panel Discussion on the UN Economic and Social Survey of Asia and the Pacific 217: Korean Perspective
Turkey Country Profile
 Turkey Country Profile EU Tax Centre June 2017 Key tax factors for efficient cross-border business and investment involving Turkey EU Member State Double Tax Treaties With: Albania Algeria Australia Austria
CBMS Network Evan Due, IDRC Singapore
 Community Based Monitoring System CBMS Network Evan Due, IDRC Singapore Outline of Presentation What is CBMS Rationale for Development of CBMS Key Features of CBMS Case Presentation: CBMS in the Philippines
The Commodities Roller Coaster: A Fiscal Framework for Uncertain Times
 International Monetary Fund October 215 Fiscal Monitor The Commodities Roller Coaster: A Fiscal Framework for Uncertain Times Tidiane Kinda Fiscal Affairs Department Vienna, November 26, 215 The views
EMBARGOED UNTIL GMT 1 AUGUST
 2016 Global Breastfeeding Scorecard: Country Scores EMBARGOED UNTIL 00.01 GMT 1 AUGUST Enabling Environment Reporting Practice UN Region Country Donor Funding (USD) Per Live Birth Legal Status of the Code
FOREIGN DIRECT INVESTMENT TRENDS IN ASIA AND THE PACIFIC
 FOREIGN DIRECT INVESTMENT TRENDS IN ASIA AND THE PACIFIC The fourth Asia-Pacific Foreign Direct Investment (FDI) Network for Least Developed and Landlocked Developing Countries 25 November 2014, Colombo,
PURSUING SHARED PROSPERITY IN AN ERA OF TURBULENCE AND HIGH COMMODITY PRICES
 2012 Key messages Asia-Pacific growth to slow in 2012 amidst global turbulence: Spillovers of the euro zone turmoil Global oil price hikes Excess liquidity and volatile capital flows Key long-term challenge:
Brown Advisory Somerset Emerging Markets Fund Class/Ticker: Institutional Shares / BAFQX Investor Shares / BIAQX Advisor Shares / BAQAX
 Summary Prospectus October 31, 2017 Brown Advisory Somerset Emerging Markets Fund Class/Ticker: Institutional Shares / BAFQX Investor Shares / BIAQX Advisor Shares / BAQAX Before you invest, you may want
Total Imports by Volume (Gallons per Country)
") 1/5/2018 Imports by Volume (Gallons per Country) YTD YTD Country 11/2016 11/2017 % Change 2016 2017 % Change MEXICO 50,994,409 48,959,909 (4.0)% 631,442,105 657,851,150 4.2 % NETHERLANDS 9,378,351 11,903,919
1/5/2018 Imports by Volume (Gallons per Country) YTD YTD Country 11/2016 11/2017 % Change 2016 2017 % Change MEXICO 50,994,409 48,959,909 (4.0)% 631,442,105 657,851,150 4.2 % NETHERLANDS 9,378,351 11,903,919
MEASURING INCOME AND MULTI-DIMENSIONAL POVERTY: THE IMPLICATIONS FOR POLICY
 MEASURING INCOME AND MULTI-DIMENSIONAL POVERTY: THE IMPLICATIONS FOR POLICY Sudarno Sumarto Policy Advisor National Team for the Acceleration of Poverty Reduction Senior Research Fellow SMERU Research
Achievements and Challenges
 LDCs Graduation in Asia-Pacific: Achievements and Challenges Ministerial Meeting of Asia-Pacific Least Developed Countries on Graduation and Post 2015 Development Agenda Kathmandu, Nepal 16-18 December