North Carolina Turnpike Authority Board of Directors Meeting
|
|
|
- Christine Greene
- 6 years ago
- Views:
Transcription
1 North Carolina Turnpike Authority Board of Directors Meeting September 3, 2015
2 North Carolina Turnpike Authority Board of Directors Meeting September 3, Presentation Agenda Triangle Expressway - 4 th Quarter Operations Update - Andy Lelewski, PE Triangle Expressway - 4 th Quarter Financial Update - David Roy Triangle Expressway Customer Service Update - Susan Pullium Monroe Expressway Construction Update - Andy Lelewski, PE & Rick Baucom, PE 2016 Triangle Expressway Toll Schedule - Beau Memory 2
3 FY Fourth Quarter Update TriEx Operations Andy Lelewski, PE Director of Toll Road Operations 3
4 FY Fourth Quarter Update Agenda Mainline Traffic Statistics Roadside Maintenance Statistics Toll Transaction Statistics 4
5 FY Fourth Quarter Update Triangle Expressway Mainline Traffic Statistics Q AWT = 11,970 Q AWT = 15, % Increase in Traffic Q AWT = 33,440 Q AWT = 39,430 18% Increase in Traffic Q AWT = 21,030 Q AWT = 26,610 27% Increase in Traffic Q AWT = 12,200 Q AWT = 15,070 24% Increase in Traffic AWT: Average Weekday Traffic 5
6 FY Fourth Quarter Update Triangle Expressway Roadside Maintenance Statistics Q Q Q Q Q Road Surface Unpaved Shoulders and Ditches Drainage Structures Roadside Traffic Control Devices Overall
7 Jul-13 Aug-13 Sep-13 Oct-13 Nov-13 Dec-13 Jan-14 Feb-14 Mar-14 Apr-14 May-14 Jun-14 Jul-14 Aug-14 Sep-14 Oct-14 Nov-14 Dec-14 Jan-15 Feb-15 Mar-15 Apr-15 May-15 Jun-15 FY Fourth Quarter Update Triangle Expressway Transaction Statistics 4,000,000 3,000,000 2,000,000 1,000,000 0 Q1 SFY-14 Q2 SFY-14 Q3 SFY-14 Q4 SFY-14 Q1 SFY-15 Q2 SFY-15 Q3 SFY-15 Q4 SFY Certified T&R Projection Actual Transactions Q1 SFY-14 Q2 SFY-14 Q3 SFY-14 Q4 SFY-14 Q1 SFY-15 Q2 SFY-15 Q3 SFY-15 Q4 SFY-15 Actual Transactions 6,050,465 6,369,239 6,306,133 7,809,224 8,150,134 8,384,818 8,063,472 9,747, Certified T&R Projection 1 5,316,445 6,061,929 6,792,657 7,306,969 8,003,596 7,503,370 8,234,180 9,389,855 Delta ($) 734, ,310 (486,524) 502, , ,448 (170,708) 357,322 Percent of Actual vs. Projection 114% 105% 93% 107% 102% 112% 98% 104% 1 Target monthly revenue data based on annualized numbers contained in the 2009 Certified Traffic and Revenue Report developed by CDM Smith Note: The data provided in this Summary is unaudited and intended for use as general information only. 7
8 FY Fourth Quarter Update Triangle Expressway Toll Transactions by Type 3,500,000 Triangle Expressway Toll Transactions 100% 3,000,000 90% 80% 2,500,000 2,000,000 62% 61% 59% 58% 56% 56% 57% 58% 58% 58% 58% 57% 60% 60% 59% 59% 56% 57% 70% 60% 50% 1,500,000 40% 1,000,000 30% 20% 500,000 10% - 0% ETC (NC Quick Pass) Video (Bill by Mail) NC Quick Pass User Percentage 8
9 Transponder User Percentage All-Electronic Tolling (AET) Facilities MdTA 74.0% E % NTTA 65.0% NCTA 58.0% 0% 20% 40% 60% 80% 100% 9
 MdTA 74.")


10 Transponder User Percentage North Carolina Turnpike Authority (NCTA) MdTA 74.0% E % NTTA 65.0% NCTA 58.0% 0% 20% 40% 60% 80% 100% Triangle Expressway opened in 2012 (AET) Transponder program introduced in % discount for NC Quick Pass transactions 10

11 Transponder User Percentage North Texas Tollway Authority (NTTA) MdTA 74.0% E % NTTA 65.0% NCTA 58.0% 0% 20% 40% 60% 80% 100% Dallas North Tollway opened in 1968 Transponder program since 1989 AET integration starting in %+ premium for ZipCash transactions 11
 MdTA 74.")


12 Transponder User Percentage E-470 Public Highway Authority (Colorado) MdTA 74.0% E % NTTA 65.0% NCTA 58.0% 0% 20% 40% 60% 80% 100% First segment of E-470 opened in 1991 Transponder program started in 1991 AET conversion in % premium for LicensePlateToll transactions 12
 Video Toll 50% premium for video toll")
13 Transponder User Percentage Maryland Transportation Authority (MdTA) MdTA 74.0% E % NTTA 65.0% NCTA 58.0% 0% 20% 40% 60% 80% 100% Transponder program in Maryland since 1999 First segment of ICC opened in 2011 (AET) Video Toll 50% premium for video toll transactions (minimum toll of $1.00) 13
14 FY Fourth Quarter Update Triangle Expressway Transponder Sales by Type 6,000 Transponder Sales 5,000 4,000 3,000 2,000 1,000 - Sticker Transponder Hard Case Transponder Exterior Transponder 14
15 FY Fourth Quarter Update TriEx Financials David Roy Director of Finance and Budget 15
16 Jul-13 Aug-13 Sep-13 Oct-13 Nov-13 Dec-13 Jan-14 Feb-14 Mar-14 Apr-14 May-14 Jun-14 Jul-14 Aug-14 Sep-14 Oct-14 Nov-14 Dec-14 Jan-15 Feb-15 Mar-15 Apr-15 May-15 Jun-15 TriEx Financial Update Revenue Statistics $3,000,000 $2,000,000 $1,000,000 $0 Q1 SFY-14 Q2 SFY-14 Q3 SFY-14 Q4 SFY-14 Q1 SFY-15 Q2 SFY-15 Q3 SFY-15 Q4 SFY Certified T&R Actual Revenue Q1 SFY-14 Q2 SFY-14 Q3 SFY-14 Q4 SFY-14 Q1 SFY-15 Q2 SFY-15 Q3 SFY-15 Q4 SFY-15 Actual Revenue 1 $ 4,295,730 $ 4,664,914 $ 4,989,599 $ 5,725,177 $ 6,575,724 $ 6,696,239 $ 7,563,900 $ 8,162, Certified Traffic and Revenue 2 $ 3,676,314 $ 4,191,815 $ 4,697,112 $ 5,052,759 $ 5,571,755 $ 5,223,522 $ 6,031,125 $ 6,877,599 Delta ($) $ 619,416 $ 473,099 $ 292,487 $ 672,418 $ 1,003,969 $ 1,472,717 $ 1,532,775 $ 1,285,031 Percent of Actual vs Base Case 117% 111% 106% 113% 118% 128% 125% 119% 1 Actual revenue is reported on a cash basis 2 Target monthly revenue data based on annualized numbers contained in the 2009 Certified Traffic and Revenue Report developed by CDM Smith Note: The data provided in this Summary is unaudited and intended for use as general information only. 16
17 Millions TriEx Financial Update Revenue Forecast vs. Actual $30 $20 $10 $0 Q4 Actual = $5.73 M Q3 Actual = $4.99 M Q2 Actual = $4.66 M Q1 Actual = $4.30 M FY 2014 Actual (Total = $19.7M) Q4 Projection = $6.88 M Q3 Projection = $6.03 M Q2 Projection = $5.22 M Q1 Projection = $5.57 M FY 2015 Projections (Total = $23.7M) Q4 Actual = $8.16 M Q3 Actual = $7.56 M Q2 Actual = $6.70 M Q1 Actual = $6.58 M FY 2015 Actual (Total = $29.0M) FY 2015 Q4 revenues exceeded projections by approximately 19% FY 2015 revenue up approximately 47% yearover-year - Revenue figures are inclusive of all toll revenue and fees, but exclude transponder revenues - Actual Revenues reported on a cash basis 17
18 Millions TriEx Financial Update Projected Operating Expenditures vs. Actual $15 $10 Q4 Actual = $3.62 M Q3 Actual = $3.91 M Q4 Projection = $3.61 M Q3 Projection = $3.32 M Q4 Actual = $4.20 M Q3 Actual = $2.98 M FY15 operating expenditures 2% lower than projections FY 15 operating expenditures up 1.5% year-over-year $5 Q2 Actual = $2.71 M Q2 Projection = $3.39 M Q2 Actual = $2.92 M Q1 Actual = $3.21 M Q1 Projection = $3.58 M Q1 Actual = $3.52 M $0 FY 2014 Actual (Total = $13.4M) FY 2015 Projections (Total = $13.9M) FY 2015 Actual (Total = $13.6M) - Actual operating expenses reported on a cash basis 18
19 FY Fourth Quarter Update TriEx Customer Service Susan Pullium Director of Customer Service 19
20 Customer Service Center Update Year to Date (January - July) 154,805 = Triangle Expressway calls 12,898 = new transponder accounts 20,749 = transponders sold 11,151 = visitors to store front 19,268 = ferry calls 20
")
21 Marketing Update Bill by Mail Inserts (June August) 21

22 Durham Bulls Games (Apr. Aug.) 22
 23")
23 Cary Lazy Daze (August 22) 23
24 Overdue Accounts Update DMV Hold Status (as of July 31, 2015) 58,632 accounts placed on hold to date 30,699 accounts paid to remove the hold 27,933 remain on hold ($4,147,749) 61% tolls and processing fees 39% civil penalties Collections Status (as of July 31, 2015) 1,416 accounts in collections ($477,846) 382 accounts paid in full ($228,113) 24
25 Project Update Monroe Expressway Andy Lelewski, P.E. Director of Toll Road Operations 25

26 Litigation Status 26
27 Project Activities Project is under construction Other Activities Updating 2010 Traffic & Revenue Study Proceeding with Right of Way acquisition Planning for Toll Collection System procurements Planning for landscaping contracts Planning for Operations 27
28 Construction Update Rick Baucom, PE Assistant Division Construction Engineer Division 10 28
29 Project Overview 20 mile long expressway 4 to 6 lanes wide (expandable to median) 37 bridges 21 box culverts 8 interchanges All-Electronic Tolling at 8 locations Current construction cost: $449.4M 29
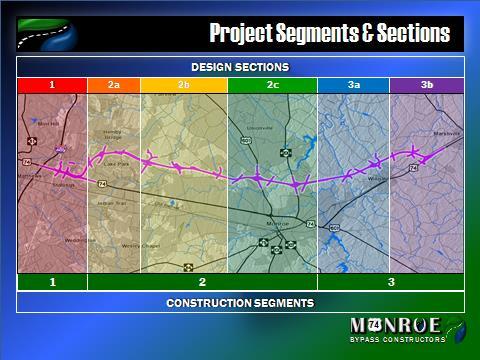
30 30
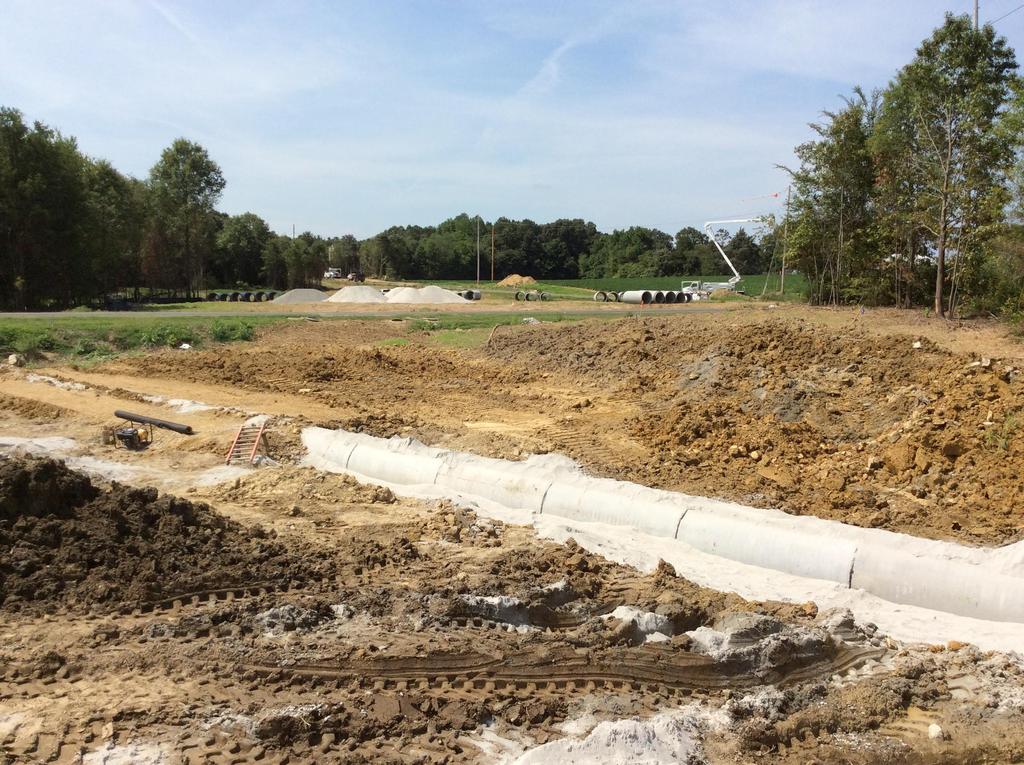
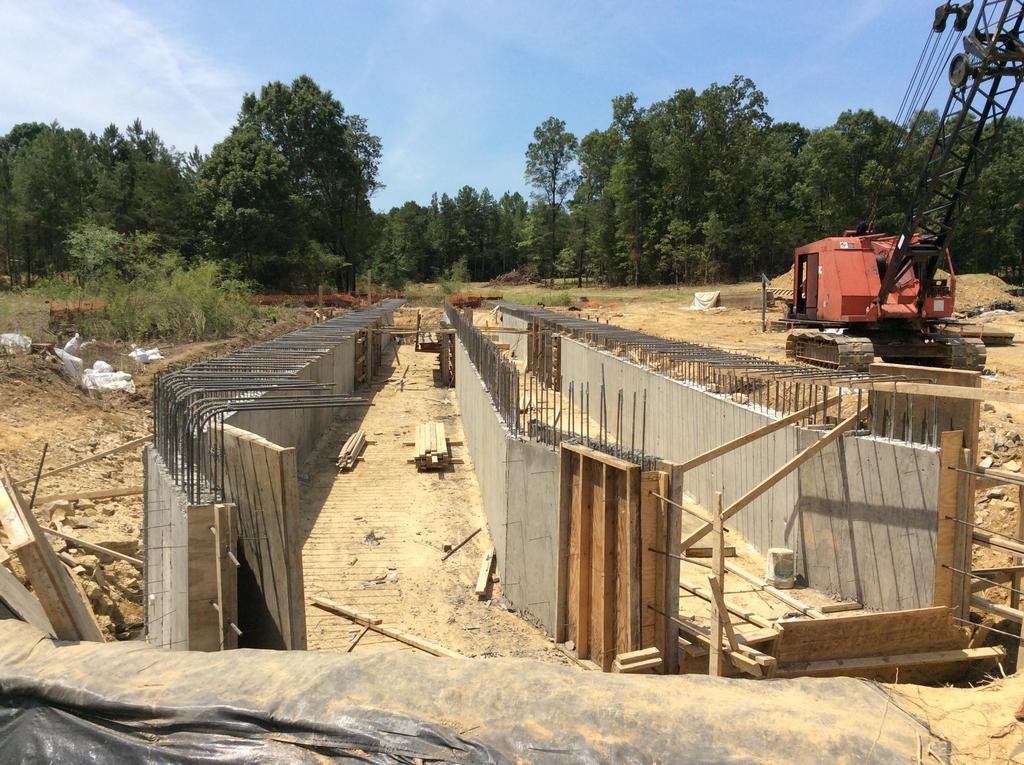
31 Current Operations Clearing & grubbing/erosion control almost complete in Section 3 starting in Section 2C (US 601 & NC 200) Box culverts/pipe 2 crews in Section 3 Utilities UBO & UC in Section 3 Grading started in Section 3B (Phifer Road) 31
32 Three Month Look-Ahead Clearing & grubbing/ec - expand thru Section 2 and Section 1 Focus on interchanges/elevated section utilities, detours, bridges Box culverts add 2-3 more crews, work from east to west Grading expand in Section 3 and focus on interchanges in Section 2 32

33 title style 33
34 34
35 35

36 36
37 SCHEDULE: IMPORTANT DATES Toll Sites turned over to NCTA: July 31, 2018 Substantial Completion: November 27, 2018 Final Completion: May 28,
38 2016 Triangle Expressway Toll Schedule Beau Memory Executive Director 38
39 Toll Rate Schedule Triangle Expressway (Powers of the Authority) Toll Rate Policy adopted September 17, 2008 Scheduled average toll rate increases: % % % After % (or less) Final 5% increase scheduled to take effect: January 1,
40 Questions? 40
North Carolina Turnpike Authority Joint Legislative Transportation Oversight Committee
 North Carolina Turnpike Authority Joint Legislative Oversight Committee Beau Memory Presenter Name North Carolina Turnpike Authority NCTA Background History/Timeline Organizational Information Roles &
Fiscal Year nd Quarter Report Quarterly Report of Actual Traffic and Toll Revenue For period ending February 28, 2018
 Fiscal Year 2018 2 nd Quarter Report Quarterly Report of Actual Traffic and Toll Revenue For period ending February 28, 2018 Footer Text Date Table of Contents Section Page Number Disclaimer 3 Notes and
Joint Appropriations Subcommittee on Transportation
 Joint Appropriations Subcommittee on Transportation Funding Overview February 21, 2013 H. Tasaico, PE 1 NCDOT Funding Overview - Agenda State Transportation Comparative Data Transportation Funding Sources
Joint Appropriations Subcommittee on Transportation. North Carolina Turnpike Authority Beau Memory March 14, 2017
 Joint Appropriations Subcommittee on Transportation North Carolina Turnpike Authority Beau Memory March 14, 2017 Benefits of Tolling: Funding source Supplements traditional transportation funding Can accelerate
Fiscal Year th Quarter Report Quarterly Report of Actual Traffic and Toll Revenue For period ending August 31, 2018
 Fiscal Year 2018 4 th Quarter Report Quarterly Report of Actual Traffic and Toll Revenue For period ending August 31, 2018 Footer Text Date Table of Contents Section Page Number Disclaimer 3 Notes and
Fiscal Year th Quarter Report Quarterly Report of Actual Traffic and Revenue For period ending August 31, 2017
 Fiscal Year 2017 4 th Quarter Report Quarterly Report of Actual Traffic and Revenue For period ending August 31, 2017 Footer Text Date Table of Contents Section Page Number Notes and Observations 3-4 Significant
Dulles Corridor Enterprise Financial Update Dulles Corridor Advisory Committee Meeting
 Dulles Corridor Enterprise Financial Update Dulles Corridor Advisory Committee Meeting December 15, 2014 Discussion Outline Finance Plan for the Metrorail Project Allocation of Estimated Capital Costs
Financial & Business Highlights For the Year Ended June 30, 2017
 Financial & Business Highlights For the Year Ended June, 17 17 16 15 14 13 12 Profit and Loss Account Operating Revenue 858 590 648 415 172 174 Investment gains net 5 162 909 825 322 516 Other 262 146
XML Publisher Balance Sheet Vision Operations (USA) Feb-02
 Feb-02") Page:1 Apr-01 May-01 Jun-01 Jul-01 ASSETS Current Assets Cash and Short Term Investments 15,862,304 51,998,607 9,198,226 Accounts Receivable - Net of Allowance 2,560,786
Page:1 Apr-01 May-01 Jun-01 Jul-01 ASSETS Current Assets Cash and Short Term Investments 15,862,304 51,998,607 9,198,226 Accounts Receivable - Net of Allowance 2,560,786
Status of the Unemployment Trust Fund and Related Issues. Commission on Unemployment Compensation. Ellen Marie Hess, Commissioner.
 Status of the Unemployment Trust Fund and Related Issues Commission on Unemployment Compensation August 8, 2018 Ellen Marie Hess, Commissioner 2 Trust Fund Data Standard Forecast (Millions of Dollars)
Performance Update. JP Morgan Transportation & Utility Investor Forum April 18-19, 2018
 Performance Update JP Morgan Transportation & Utility Investor Forum April 18-19, 2018 Participants and Resources 2 E-470 Public Highway Authority Jason Myers Finance Director Jaime Heitman Controller
HUD NSP-1 Reporting Apr 2010 Grantee Report - New Mexico State Program
 HUD NSP-1 Reporting Apr 2010 Grantee Report - State Program State Program NSP-1 Grant Amount is $19,600,000 $9,355,381 (47.7%) has been committed $4,010,874 (20.5%) has been expended Grant Number HUD Region
Transportation Primer
 Transportation Primer Joint Appropriations Committee on Transportation February 11, 2015 Amna Cameron Fiscal Research Division Agenda Background Transportation Revenues Items for Consideration Transportation
Spheria Australian Smaller Companies Fund
 29-Jun-18 $ 2.7686 $ 2.7603 $ 2.7520 28-Jun-18 $ 2.7764 $ 2.7681 $ 2.7598 27-Jun-18 $ 2.7804 $ 2.7721 $ 2.7638 26-Jun-18 $ 2.7857 $ 2.7774 $ 2.7690 25-Jun-18 $ 2.7931 $ 2.7848 $ 2.7764 22-Jun-18 $ 2.7771
Budget Manager Meeting. February 20, 2018
 Budget Manager Meeting February 20, 2018 Meeting Agenda DISCUSSION DRAFT NOT FOR DISTRIBUTION Budget Office Current Year Forecast Process Endowment Payout Control Charts FY19 Target Meetings Delphi Project
Oklahoma Turnpike Authority Report to Bondholders First Quarter Tim J. Gatz Executive Director. Prepared by the Controller Division
 Governor Mary Fallin, Member Ex-Officio Dana Weber, Chairwoman David A. Burrage Vice-Chairman G. Carl Gibson, Secretary & Treasurer Kenneth Adams, Member Guy Berry, Member Gene Love, Member Mike Patterson,
Big Walnut Local School District
 Big Walnut Local School District Monthly Financial Report for the month ended September 30, 2013 Prepared By: Felicia Drummey Treasurer BIG WALNUT LOCAL SCHOOL DISTRICT SUMMARY OF YEAR TO DATE FINANCIAL
WESTWOOD LUTHERAN CHURCH Summary Financial Statement YEAR TO DATE - February 28, Over(Under) Budget WECC Fund Actual Budget
 Budget WECC Fund Actual Budget") WESTWOOD LUTHERAN CHURCH Summary Financial Statement YEAR TO DATE - February 28, 2018 General Fund Actual A B C D E F WECC Fund Actual Revenue Revenue - Faith Giving 1 $ 213 $ 234 $ (22) - Tuition $ 226
WESTWOOD LUTHERAN CHURCH Summary Financial Statement YEAR TO DATE - February 28, 2018 General Fund Actual A B C D E F WECC Fund Actual Revenue Revenue - Faith Giving 1 $ 213 $ 234 $ (22) - Tuition $ 226
Department of Public Welfare (DPW)
") Department of Public Welfare (DPW) Office of Income Maintenance Electronic Benefits Transfer Card Risk Management Report Out-of-State Residency Review FISCAL YEAR 2014-2015 September 2014 (June, July and
Department of Public Welfare (DPW) Office of Income Maintenance Electronic Benefits Transfer Card Risk Management Report Out-of-State Residency Review FISCAL YEAR 2014-2015 September 2014 (June, July and
Big Walnut Local School District
 Big Walnut Local School District Monthly Financial Report for the month ended September 30, 2012 Prepared By: Felicia Drummey Treasurer BIG WALNUT LOCAL SCHOOL DISTRICT SUMMARY OF YEAR-TO-DATE FINANCIAL
Project NEON Interim Finance Committee Rudy Malfabon Director
 Project NEON Interim Finance Committee Rudy Malfabon Director October 22, 2014 1 Project Benefits Safety & Congestion 1,000 crashes per year! Connectivity /Mobility for City Redevelopment Efforts Congestion:
RMTA FY2016 Annual Traffic and Toll Revenue Report
 RMTA Richmond Metropolitan Transportation Authority RMTA RMTA FY216 Annual Traffic and Report Richmond Metropolitan Transportation Authority August 216 Final Report RMTA FY216 Annual Traffic and Report
Dulles Corridor Enterprise Financial Update Dulles Corridor Advisory Committee Meeting
 Dulles Corridor Enterprise Financial Update Dulles Corridor Advisory Committee Meeting May 30, 2014 Discussion Outline Finance Plan for the Metrorail Project Allocation of Estimated Capital Costs and TIFIA
AGENDA CENTRAL FLORIDA EXPRESSWAY AUTHORITY BOARD WORKSHOP April 11, 2019 Immediately following the 9:00 a.m. board meeting
 AGENDA CENTRAL FLORIDA EXPRESSWAY AUTHORITY BOARD WORKSHOP April 11, 2019 Immediately following the 9:00 a.m. board meeting Meeting location: Pelican Conference Room 4974 ORL Tower Road Orlando, FL 32807
THE B E A CH TO WN S O F P ALM B EA CH
 THE B E A CH TO WN S O F P ALM B EA CH C OU N T Y F LO R I D A August www.luxuryhomemarketing.com PALM BEACH TOWNS SINGLE-FAMILY HOMES LUXURY INVENTORY VS. SALES JULY Sales Luxury Benchmark Price : 7,
Oklahoma Turnpike Authority Report to Bondholders Third Quarter Tim J. Gatz Executive Director. Prepared by the Controller Division
 Governor Mary Fallin, Member Ex-Officio Dana Weber, Chairwoman David A. Burrage Vice-Chairman G. Carl Gibson, Secretary & Treasurer Kenneth Adams, Member Guy Berry, Member Gene Love, Member Mike Patterson,
Factor Leave Accruals. Accruing Vacation and Sick Leave
 Factor Leave Accruals Accruing Vacation and Sick Leave Factor Leave Accruals As part of the transition of non-exempt employees to biweekly pay, the UC Office of the President also requires standardization
Key IRS Interest Rates After PPA
 Key IRS Rates - After PPA - thru 2011 Page 1 of 10 Key IRS Interest Rates After PPA (updated upon release of figures in IRS Notice usually by the end of the first full business week of the month) Below
Oklahoma Turnpike Authority Report to Bondholders Second Quarter Tim J. Gatz Executive Director. Prepared by the Controller Division
 Governor Mary Fallin, Member Ex-Officio Dana Weber, Chairwoman David A. Burrage Vice-Chairman G. Carl Gibson, Secretary & Treasurer Kenneth Adams, Member Guy Berry, Member Gene Love, Member Mike Patterson,
EMPLOYER S MUNICIPAL INCOME TAX WITHHOLDING FORMS INSTRUCTIONS FOR FILING FORM LW-1
 CITY TAX DEPT 50 TOWN SQUARE P.O. BOX 155 LIMA, OHIO 45802 PHONE (419) 221-5245 FAX (419) 998-5527 (MONTHLY OR QUARTERLY STATEMENT) FORM LW-3 (ANNUAL RECONCILIATION) EMPLOYER S MUNICIPAL INCOME TAX WITHHOLDING
Review of Registered Charites Compliance Rates with Annual Reporting Requirements 2016
 Review of Registered Charites Compliance Rates with Annual Reporting Requirements 2016 October 2017 The Charities Regulator, in accordance with the provisions of section 14 of the Charities Act 2009, carried
Oklahoma Turnpike Authority Report to Bondholders First Quarter Tim J. Gatz Executive Director. Prepared by the Controller Division
 Governor Mary Fallin, Member Ex-Officio David A. Burrage, Vice-Chairman G. Carl Gibson, Secretary & Treasurer Kenneth Adams, Member Gene Love, Member Dana Weber, Member Gary Ridley, Secretary of Transportation
Section 6621 of the Internal Revenue Code establishes the interest rates on
 Part 1 Section 6621.--Determination of Rate of Interest 26 CFR 301.6621-1: Interest rate. Rev. Rul. -32 Section 6621 of the Internal Revenue Code establishes the interest rates on overpayments and underpayments
NCDOT Funding Overview
 NCDOT Funding Overview Joint Appropriations Subcommittee on Transportation Mark L. Foster, CFO H. Tasaico February 16, 2011 Transportation Outlook NCDOT Funding Sources Transportation Funding Equity Cash
Executive Summary. July 17, 2015
 Executive Summary July 17, 2015 The Revenue Estimating Conference adopted interest rates for use in the state budgeting process. The adopted interest rates take into consideration current benchmark rates
Section 6621(c) provides that for purposes of interest payable under 6601 on any large corporate underpayment, the underpayment
 provides that for purposes of interest payable under 6601 on any large corporate underpayment, the underpayment") Section 6621. Determination of Interest Rate 26 CFR 301.6621 1: Interest rate. Interest rates; underpayments and overpayments. The rate of interest determined under section 6621 of the Code for the calendar
Section 6621. Determination of Interest Rate 26 CFR 301.6621 1: Interest rate. Interest rates; underpayments and overpayments. The rate of interest determined under section 6621 of the Code for the calendar
Performance Report October 2018
 Structured Investments Indicative Report October 2018 This report illustrates the indicative performance of all Structured Investment Strategies from inception to 31 October 2018 Matured Investment Strategies
HIPIOWA - IOWA COMPREHENSIVE HEALTH ASSOCIATION Unaudited Balance Sheet As of July 31
 Unaudited Balance Sheet As of July 31 Total Enrollment: 407 Assets: Cash $ 9,541,661 $ 1,237,950 Invested Cash 781,689 8,630,624 Premiums Receivable 16,445 299,134 Prepaid 32,930 34,403 Assessments Receivable
HIPIOWA - IOWA COMPREHENSIVE HEALTH ASSOCIATION Unaudited Balance Sheet As of January 31
 Unaudited Balance Sheet As of January 31 Total Enrollment: 371 Assets: Cash $ 1,408,868 $ 1,375,117 Invested Cash 4,664,286 4,136,167 Premiums Receivable 94,152 91,261 Prepaid 32,270 33,421 Assessments
NC Turnpike Authority Presentation to the Joint Legislative Transportation Oversight Committee. David Joyner November 4, 2011
 NC Turnpike Authority Presentation to the Joint Legislative Transportation Oversight Committee David Joyner November 4, 2011 Agenda NC Turnpike Authority Tolling Process Projects Toll Operations National
City of Joliet 2014 Revenue Review. October 2013
 City of Joliet 2014 Revenue Review October 2013 General Fund 2014 Est. Revenues = $163.6 M Licenses, Permits, Fees Gaming Taxes 5% 12% Sales Taxes 27% Income Taxes 9% Charges for Services 14% Other Taxes
Business & Financial Services December 2017
 Business & Financial Services December 217 Completed Procurement Transactions by Month 2 4 175 15 125 1 75 5 2 1 Business Days to Complete 25 Jan Feb Mar Apr May Jun Jul Aug Sep Oct Nov Dec 217 Procurement
Outstanding debt in all sectors of the US fixed income market has gone from $4.6 trillion in 1985 to $33 trillion in 2008.
 US Fixed Income Debt Outstanding and Issuance, Selected Years Outstanding debt in all sectors of the US fixed income market has gone from $4.6 trillion in 1985 to $33 trillion in 2008. In 2008, NYSE total
EMPLOYER S MUNICIPAL INCOME TAX WITHHOLDING FORMS
 CITY TAX DEPT 50 TOWN SQUARE P.O. BOX 155 LIMA, OHIO 45802 PHONE (419) 221-5245 FAX (419) 998-5527 FORM LW-1 (MONTHLY OR QUARTERLY STATEMENT) FORM LW-3 (ANNUAL RECONCILIATION) EMPLOYER S MUNICIPAL INCOME
Asheville Metro Economic Report 2014 First Quarter
 Asheville Metro Economic Report Johnson Price Sprinkle PA HIGHLIGHTS: ASHEVILLE METRO Employment gains slowed in the first quarter of 2014 dropping behind five other N.C. Metros and lagging behind both
Oklahoma Turnpike Authority Report to Bondholders Fourth Quarter Tim J. Gatz Executive Director. Prepared by the Controller Division
 Governor Mary Fallin, Member Ex-Officio Dana Weber, Chairwoman David A. Burrage Vice-Chairman G. Carl Gibson, Secretary & Treasurer Kenneth Adams, Member Guy Berry, Member Gene Love, Member Mike Patterson,
TERMS OF REFERENCE FOR THE INVESTMENT COMMITTEE
 I. PURPOSE The purpose of the Investment Committee (the Committee ) is to recommend to the Board the investment policy, including the asset mix policy and the appropriate benchmark for both ICBC and any
22/02/ :48. skiron\roadshow\presentación Roadshow Script 2.ppt
 22/02/2013 09:48 skiron\roadshow\presentación Roadshow Script 2.ppt 1 Forward Looking Statements This presentation contains, or may be deemed to contain, forward-looking statements. By their nature, forward-looking
Texas Department of Transportation 1
 Texas Department of Transportation 1 TABLE OF CONTENTS A Note on Data Collection and Analysis 3 CTTS Executive Summary 4 Revenue Comparison 5 Average Weekday Transaction Comparison 6 Transactions by Type
Oklahoma Turnpike Authority Report to Bondholders Second Quarter Tim J. Gatz Executive Director. Prepared by the Controller Division
 Governor Mary Fallin, Member Ex-Officio Dana Weber, Chairwoman David A. Burrage Vice-Chairman G. Carl Gibson, Secretary & Treasurer Kenneth Adams, Member Guy Berry, Member Gene Love, Member Mike Patterson,
Historical Pricing PJM COMED, Around the Clock. Cal '15 Cal '16 Cal '17 Cal '18 Cal '19 Cal '20 Cal '21 Cal '22
 $50 Historical Pricing PJM COMED, Around the Clock $48 $46 $44 $42 $40 $38 $36 $34 $32 $30 $28 $26 Cal '15 Cal '16 Cal '17 Cal '18 Cal '19 Cal '20 Cal '21 Cal '22 The information presented above was gathered
Foundations of Investing
 www.edwardjones.com Member SIPC Foundations of Investing 1 5 HOW CAN I STAY ON TRACK? 4 HOW DO I GET THERE? 1 WHERE AM I TODAY? MY FINANCIAL NEEDS 3 CAN I GET THERE? 2 WHERE WOULD I LIKE TO BE? 2 Develop
Cost Estimation of a Manufacturing Company
 Cost Estimation of a Manufacturing Company Name: Business: Date: Economics of One Unit: Manufacturing Company (Only complete if you are making a product, such as a bracelet or beauty product) Economics
Comprehensive Monthly Financial Report July 2013
 Comprehensive Monthly Financial Report July 2013 MONTHLY FINANCIAL REPORT PERFORMANCE AT A GLANCE ALL FUNDS SUMMARY GENERAL FUND REV VS EXP PROPERTY TAXES SALES TAXES FRANCHISE FEES UTILITY FUND REV VS
Mechanics of Cash Flow Forecasting
 Texas Association Of State Senior College & University Business Officers July 13, 2015 Mechanics of Cash Flow Forecasting Susan K. Anderson, CEO Anderson Financial Management, L.L.C. 130 Pecan Creek Drive
Revenue Estimating Conference Tobacco Tax and Surcharge Executive Summary
 Revenue Estimating Conference Tobacco Tax and Surcharge Executive Summary February 12, 2014 The Revenue Estimating Conference reviewed Tobacco Tax and Surcharge revenues on February 12, 2014. The forecasts
Key West Cruise Ship Data - Passenger Counts Number of Passenger Arrivals
 Key West Cruise Ship Data - Passenger Counts Number of Passenger Arrivals (Source: City of Key West Port Operations Office) Month 2000 2001 2002 2003 2004 2005 2006 2007 2008 2009 2010 2011 2012 2013 2014
May 2016 MLS Statistical ReportREALTORS
 May 216 MLS Statistical ReportREALTORS 3 Year over Year Sales Comparison - Total Sales 25 2 15 1 5 213 214 215 216 Jan Feb Mar Apr May Jun Jul Aug Sep Oct Nov Dec Summary Overall Since the beginning of
PHOENIX ENERGY MARKETING CONSULTANTS INC. HISTORICAL NATURAL GAS & CRUDE OIL PRICES UPDATED TO July, 2018
 Jan-01 $12.9112 $10.4754 $9.7870 $1.5032 $29.2595 $275.39 $43.78 $159.32 $25.33 Feb-01 $10.4670 $7.8378 $6.9397 $1.5218 $29.6447 $279.78 $44.48 $165.68 $26.34 Mar-01 $7.6303 $7.3271 $5.0903 $1.5585 $27.2714
Historical Pricing PJM PSEG, Around the Clock. Cal '15 Cal '16 Cal '17 Cal '18 Cal '19 Cal '20 Cal '21 Cal '22
 $70 Historical Pricing PJM PSEG, Around the Clock $65 $60 $55 $50 $45 $40 $35 $30 $25 Cal '15 Cal '16 Cal '17 Cal '18 Cal '19 Cal '20 Cal '21 Cal '22 The information presented above was gathered and compiled
MESA ROYALTY TRUST FEDERAL INCOME TAX INFORMATION
 MESA ROYALTY TRUST 1999 FEDERAL INCOME TAX INFORMATION FEDERAL INCOME TAX INFORMATION Instructions for Schedules A, B and C Schedule A For Certificate Holders who file income tax returns on the basis of
Common stock prices 1. New York Stock Exchange indexes (Dec. 31,1965=50)2. Transportation. Utility 3. Finance
2. Transportation. Utility 3. Finance") Digitized for FRASER http://fraser.stlouisfed.org/ Federal Reserve Bank of St. Louis 000 97 98 99 I90 9 9 9 9 9 9 97 98 99 970 97 97 ""..".'..'.."... 97 97 97 97 977 978 979 980 98 98 98 98 98 98 987 988
Digitized for FRASER http://fraser.stlouisfed.org/ Federal Reserve Bank of St. Louis 000 97 98 99 I90 9 9 9 9 9 9 97 98 99 970 97 97 ""..".'..'.."... 97 97 97 97 977 978 979 980 98 98 98 98 98 98 987 988
Beginning Date: January 2016 End Date: June Managers in Zephyr: Benchmark: Morningstar Short-Term Bond
 Beginning Date: January 2016 End Date: June 2018 Managers in Zephyr: Benchmark: Manager Performance January 2016 - June 2018 (Single Computation) 11200 11000 10800 10600 10400 10200 10000 9800 Dec 2015
Fiscal Year 2018 Project 1 Annual Budget
 Fiscal Year 2018 Project 1 Annual Budget Table of Contents Table Page Summary 3 Summary of Costs Table 1 4 Treasury Related Expenses Table 2 5 Summary of Full Time Equivalent Table 3 6 Positions Cost-to-Cash
Review of Membership Developments
 RIPE Network Coordination Centre Review of Membership Developments 7 October 2009/ GM / Lisbon http://www.ripe.net 1 Applications development RIPE Network Coordination Centre 140 120 100 80 60 2007 2008
Beginning Date: January 2016 End Date: September Managers in Zephyr: Benchmark: Morningstar Short-Term Bond
 Beginning Date: January 2016 End Date: September 2018 Managers in Zephyr: Benchmark: Manager Performance January 2016 - September 2018 (Single Computation) 11400 - Yorktown Funds 11200 11000 10800 10600
OTHER DEPOSITS FINANCIAL INSTITUTIONS DEPOSIT BARKAT SAVING ACCOUNT
 WEIGHTAGES JAN FEB MAR APR MAY JUN JUL AUG SEPT OCT NOV DEC ANNOUNCEMENT DATE 19.Dez.14 27.Jän.15 24.Feb.15 26.Mär.15 27.Apr.15 26.Mai.15 25.Jun.15 28.Jul.15 26.Aug.15 23.Sep.15 27.Okt.15 25.Nov.15 MUDARIB
Economic Activity Index ( GDB-EAI ) For the month of May 2013 G O V E R N M E N T D E V E L O P M E N T B A N K F O R P U E R T O R I C O
 For the month of May 2013 G O V E R N M E N T D E V E L O P M E N T B A N K F O R P U E R T O R I C O") Economic Activity Index ( GDB-EAI ) For the month of May 2013 General Commentary May 2013 GDB-EAI for the month of May registered a 3.4% year-over-year ( YOY ) reduction May 2013 EAI was 126.7, a 3.4%
Economic Activity Index ( GDB-EAI ) For the month of May 2013 General Commentary May 2013 GDB-EAI for the month of May registered a 3.4% year-over-year ( YOY ) reduction May 2013 EAI was 126.7, a 3.4%
Pennsylvania Turnpike Commission Financial Overview
 Pennsylvania Turnpike Commission Financial Overview November 13, 2012 Presented by : The PFM Group PFM is the Nation s Leading Financial Advisor and the Leader in Advising Toll and Transportation Agencies
February 2016 MLS Statistical Report
 February 216 MLS Statistical Report 3 Year over Year Sales Comparison - Total Sales 2 1 213 214 21 216 Jan Feb Mar Apr May Jun Jul Aug Sep Oct Nov Dec Summary Overall Sales have slowed during February
Durham Orange Joint Staff Working Group Meeting Agenda October 10, :30 pm 4:00 pm Durham City Hall, Transportation 4B
 Durham Orange Joint Staff Working Group Meeting Agenda October 10, 2018 2:30 pm 4:00 pm Durham City Hall, Transportation 4B 1. Call to Order/Roll Call 2. Election Chair Position 3. Open Issues a. FY2019
Wednesday, June 6, 2018
 Wednesday, June 6, 2018 Excellence in Program Administration Award 2018 AASHTO Civil Rights Training Symposium Excellence in Program Administration Award Joanna McFadden EEO/DBE Section Head APRIL 2017-2018
Capturing equity gains whilst protecting portfolios
 Capturing equity gains whilst protecting portfolios Edward Park Q2 2018 MSCI North America Total Return in USD (2017 Discrete Calendar Months) 4.00% 3.50% 3.00% 2.50% 2.00% 1.50% 1.00% 0% 0.00% Jan-17
Quarterly Financial Review
 First Quarter 2014 Quarterly Financial Review Norfolk Southern Corporation Finance Department Three Commercial Place Norfolk, Virginia 23510.2191 Norfolk Southern Railway System Contents Consolidated Statements
NEWS RELEASE. R&I Affirms Ratings: 5 Expressway Companies. Rating and Investment Information, Inc. (R&I) has announced the following:
 has announced the following:") Aug 04, 2017 R&I Affirms Ratings: 5 Expressway Companies Rating and Investment Information, Inc. (R&I) has announced the following: SEC. COMPANY NAME CODE ---- Central Nippon Expressway Co., Ltd. ----
Aug 04, 2017 R&I Affirms Ratings: 5 Expressway Companies Rating and Investment Information, Inc. (R&I) has announced the following: SEC. COMPANY NAME CODE ---- Central Nippon Expressway Co., Ltd. ----
QUESTION 2. QUESTION 3 Which one of the following is most indicative of a flexible short-term financial policy?
 QUESTION 1 Compute the cash cycle based on the following information: Average Collection Period = 47 Accounts Payable Period = 40 Average Age of Inventory = 55 QUESTION 2 Jan 41,700 July 39,182 Feb 18,921
2016 Spring Conference And Training Seminar. Cash Planning and Forecasting
 Cash Planning and Forecasting A different world! Cash forecasting starts with expectations about future flows Uses history to identify beginning balances.and to understand patterns of how things interact
CASH MANAGEMENT & CONTRACT AWARDS
 CASH MANAGEMENT & CONTRACT AWARDS Brian Ragland, Chief Financial Officer Bill Hale, Chief Engineer Randy Hopmann, Director of District Operations Footer Text Date I. Cash Management Practices 2 FY 2018-2019
Economic and Revenue Update
 Economic and Revenue Update A Briefing for the Money Committees Aubrey L. Layne, Jr. Secretary of Finance Commonwealth of Virginia www.finance.virginia.gov January 2018 Topics for Discussion National and
Beginning Date: January 2016 End Date: February Managers in Zephyr: Benchmark: Morningstar Short-Term Bond
 Beginning Date: January 2016 End Date: February 2018 Managers in Zephyr: Benchmark: Manager Performance January 2016 - February 2018 (Single Computation) 11200 11000 10800 10600 10400 10200 10000 9800
(Internet version) Financial & Statistical Report November 2018
 Financial & Statistical Report November 2018") (Internet version) Financial & Statistical Report November 2018 12/17/2018 Statement of Operations For the Period Ended November 30, 2018 (in millions) Current Month Year-to-Date Operating Revenue $ 31.4
(Internet version) Financial & Statistical Report November 2018 12/17/2018 Statement of Operations For the Period Ended November 30, 2018 (in millions) Current Month Year-to-Date Operating Revenue $ 31.4
200 Years Of The U.S. Stock Market
 200 Years Of The U.S. Stock Market Professor John McConnell Krannert School of Management Purdue University September 25, 2018 1 200 Years Of The U.S. Stock Market Market Overview The long term The averages
QUARTERLY FINANCIAL REPORT December 31, 2017
 California Independent System Operator QUARTERLY FINANCIAL REPORT December 31, 2017 Preliminary and Unaudited 250 Outcropping Way Folsom, CA 95630 (916) 351-4000 CALIFORNIA INDEPENDENT SYSTEM OPERATOR
BANK OF GUYANA. BANKING SYSTEM STATISTICAL ABSTRACT Website:
 BANK OF GUYANA BANKING SYSTEM STATISTICAL ABSTRACT Website: www.bankofguyana.org.gy RESEARCH DEPARTMENT November 2010 STATISTICAL ABSTRACT TABLES CONTENTS 1. MONETARY AUTHORITY 1.1 Bank of Guyana: Assets
GENERAL FUND AT A GLANCE Category Budget YTD Actual % % Year Passed Resources 50.00% Uses 50.00% $0 $1,928,600
 City of Edmond Monthly Financial Report FY 2007/2008 Through the Month Ended Unaudited - Intended for Management Purposes Only The following is a summary of the City's financial results for operating funds.
Losses due to animal strikes
 Bulletin Vol. 29, No. 2 : April 2012 Losses due to animal strikes Animal strike claims typically rise dramatically in the fall, peaking in November. This analysis of claims from 2006 through 2011 shows
CBER Indexes for Nevada and Southern Nevada
 CBER Indexes for Nevada and Southern Nevada Published March 24, 2016 Stephen M. Miller, PhD, Director Jinju Lee, Economic Analyst Summary of CBER s Nevada Indexes Coincident Index Leading Index Mo. to
(Internet version) Financial & Statistical Report September 2017
 Financial & Statistical Report September 2017") (Internet version) Financial & Statistical Report September 2017 10/23/2017 Statement of Operations For the Period Ended September 30, 2017 (in millions) Current Month Year-to-Date Operating Revenue &
(Internet version) Financial & Statistical Report September 2017 10/23/2017 Statement of Operations For the Period Ended September 30, 2017 (in millions) Current Month Year-to-Date Operating Revenue &
SmallBizU WORKSHEET 1: REQUIRED START-UP FUNDS. Online elearning Classroom. Item Required Amount ($) Fixed Assets. 1 -Buildings $ 2 -Land $
 Fixed Assets. 1 -Buildings $ 2 -Land $") WORKSHEET 1: REQUIRED START-UP FUNDS Item Required Amount () Fixed Assets 1 -Buildings 2 -Land 3 -Initial Inventory 4 -Equipment 5 -Furniture and Fixtures 6 -Vehicles 7 Total Fixed Assets Working Capital
WORKSHEET 1: REQUIRED START-UP FUNDS Item Required Amount () Fixed Assets 1 -Buildings 2 -Land 3 -Initial Inventory 4 -Equipment 5 -Furniture and Fixtures 6 -Vehicles 7 Total Fixed Assets Working Capital
PASSENGER REJECTION REDUCTION INITIATIVE KIRK PEREIRA. 24 th April 2018
 PASSENGER REJECTION REDUCTION INITIATIVE KIRK PEREIRA 24 th April 2018 WHAT IS THIS PROJECT ABOUT? Well we are not going into that again this year! Nearly everyone in this room knows about the project
(Internet version) Financial & Statistical Report December 2017
 Financial & Statistical Report December 2017") (Internet version) Financial & Statistical Report December 2017 01/22/2018 Statement of Operations For the Period Ended December 31, 2017 (in millions) Current Month Year-to-Date Operating Revenue & Patronage
(Internet version) Financial & Statistical Report December 2017 01/22/2018 Statement of Operations For the Period Ended December 31, 2017 (in millions) Current Month Year-to-Date Operating Revenue & Patronage
(Internet version) Financial & Statistical Report December 2016
 Financial & Statistical Report December 2016") (Internet version) Financial & Statistical Report December 2016 1/23/2017 Statement of Operations For the Period Ended December 31, 2016 (in millions) Current Month Year-to-Date Operating Revenue & Patronage
(Internet version) Financial & Statistical Report December 2016 1/23/2017 Statement of Operations For the Period Ended December 31, 2016 (in millions) Current Month Year-to-Date Operating Revenue & Patronage
Japan Securities Finance Co.,Ltd
 Japan Securities Finance Co.,Ltd \ mil ( )ratio of OR Mar-13 Mar-14 Securities Finance Bussiness 14,093 16,363 Margin Loan Business 6,625 9,240 (37.5%) (47.2%) Interest on Loans 1,760 4,012 Interest
Key IRS Interest Rates After PPA
 Key IRS Interest After PPA (updated upon release of figures in IRS Notice usually by the end of the first full business week of the month) Below are Tables I, II, and III showing official interest rates
LOAN MARKET DATA AND ANALYTICS BY THOMSON REUTERS LPC
 LOAN MARKET DATA AND ANALYTICS BY THOMSON REUTERS LPC GLOBAL LOAN MARKET DATA AND ANALYTICS BY THOMSON REUTERS LPC Secondary Market Bid Levels: Europe Slide 2 European CLO New Issue Volume Monthly Slide
Quarterly Financial Review
 Second Quarter 2013 Quarterly Financial Review Norfolk Southern Corporation Finance Department Three Commercial Place Norfolk, Virginia 23510.2191 7/20/2012 DRAFTB Norfolk Southern Railway System Contents
Isle Of Wight half year business confidence report
 half year business confidence report half year report contents new company registrations closed companies (dissolved) net company growth uk company share director age director gender naming trends sic
11 May Report.xls Office of Budget & Fiscal Planning
 Education and General Fund Actual Revenues and s by Month MTD YTD Change Revenue Jul Aug Sep Oct Nov Dec Jan Feb Mar Apr May Jun Per 14 Total over FY06 Enrollment Fees $ 8,211 $ 219 $ 41,952 ($ 818) $
FUEL PRICE RISK MANAGEMENT POLICY REPORT "FUEL HEDGE"
 FUEL PRICE RISK MANAGEMENT POLICY REPORT "FUEL HEDGE" Sep-18 FUEL PRICE RISK MANAGEMENT POLICY REPORT Sep-18 (Office of Management and Budget 09/30/2018) The Fuel Price Risk Management Policy approved
FUEL PRICE RISK MANAGEMENT POLICY REPORT "FUEL HEDGE"
 FUEL PRICE RISK MANAGEMENT POLICY REPORT "FUEL HEDGE" December 2018 FUEL PRICE RISK MANAGEMENT POLICY REPORT December 2018 The Fuel Price Risk Management Policy approved by the Board on February 16, 2006