Debate on 11th March: The National Minimum Wage and Poverty. The impact of the National Minimum Wage on household and individual poverty
|
|
|
- Gwendoline Boyd
- 6 years ago
- Views:
Transcription

1 Debate on 11th March: The National Minimum Wage and Poverty This Library Note aims to provide background reading for the debate to be held on 11th March: The impact of the National Minimum Wage on household and individual poverty This Note examines the history and development of the National Minimum Wage since its introduction in 1999, and its effect on earnings, the economy, and groups within society. The Note then examines levels and trends in poverty since the election of the Labour Government and the subsequent introduction of the National Minimum Wage. James Tobin 8th March 2010 LLN 2010/008
2 House of Lords Library Notes are compiled for the benefit of Members of Parliament and their personal staff. Authors are available to discuss the contents of the Notes with the Members and their staff but cannot advise members of the general public. Any comments on Library Notes should be sent to the Head of Research Services, House of Lords Library, London SW1A 0PW or ed to
3 Table of Contents 1. Introduction The History and Evolution of the National Minimum Wage The Low Pay Commission and the rates of the National Minimum Wage The Impact of the National Minimum Wage The Impact of the National Minimum Wage on Pay/Earnings The Impact of the National Minimum Wage on the Economy The Impact of the National Minimum Wage: By Gender, Age and Ethnicity Measuring Poverty Cycles of poverty, unemployment and low pay report from the Joseph Rowntree Foundation... 15
4
5 1. Introduction 2009 saw the 10 year anniversary of the introduction of the National Minimum Wage. Established by the National Minimum Wage Act 1998, and introduced in April the following year, the National Minimum Wage was the first UK wide initiative to establish a statutory entitlement for all employees to receive a minimum rate of pay (expressed at hourly rate and as defined by the Government). According to the then (and now interim) Chairman of the Low Pay Commission Professor Sir George Bain, the introduction of the National Minimum Wage heralded: A fundamental change to the labour market in the UK. There will be a floor to wages in the first time in this country, eradicating the worst cases of exploitation. 1 This Note examines the development of the National Minimum Wage with regard to the forthcoming debate in the House of Lords on the impact of the National Minimum Wage on household and individual poverty. Accordingly, the contents of this paper are effectively divided into two main sections. The first examines the history and evolution of the National Minimum Wage since its introduction, including the work of the Low Pay Commission and changes to the National Minimum Wage which have taken place since that time. It also examines the effect of the National Minimum Wage on the economy, earnings and different groups within society, with particular regard to comparative rates of pay and equality. The second section of this paper examines measurements and trends in poverty since the introduction of the National Minimum Wage in It is worth noting here however that, as pointed out below, the causes of poverty are both multiple and complex. Therefore this Note does not attempt to draw or infer any conclusions on the impact of the National Minimum Wage on household and individual poverty, merely to highlight trends which have taken place over this period according to recognised poverty indicators. 2. The History and Evolution of the National Minimum Wage The National Minimum Wage was introduced to the United Kingdom by the Labour Government in April 1999, fulfilling a pledge made in its 1997 General Election Manifesto. With regard to introducing a sensibly set national minimum wage the Manifesto stated: There should be a statutory level beneath which pay should not fall with the minimum wage decided not on the basis of a rigid formula but according to the economic circumstances of the time and with the advice of an independent low pay commission, whose membership will include representatives of employers, including small business, and employees. Every modern industrial country has a minimum wage, including the US and Japan. Britain used to have minimum wages through the Wage Councils. Introduced sensibly, the minimum wage will remove the worst excesses of low pay (and be of particular benefit to women), while cutting down some of the 1 Low Pay Commission Press Release (1st April 1999): 1

6 massive 4 billion benefits bill by which the taxpayer subsidises companies that pay very low wages. 2 Introducing the Second Reading of the Minimum Wage Bill in the House of Commons on 16th December 1997, the then Secretary of State for Trade and Industry, Margaret Beckett, said: I am proud to be able to stand before the House today moving the Second Reading of the National Minimum Wage Bill. The Bill will introduce, for the first time in the United Kingdom, minimum wage protection for all workers and will begin to end the scandal of poverty pay The Low Pay Commission and the rates of the National Minimum Wage The levels at which the National Minimum Wage is set are decided upon by the Government, following recommendations made by the Low Pay Commission (LPC) an independent statutory non-departmental public body set up under the National Minimum Wage Act The remit of the LPC is set each year by Government, but its core role is to provide advice and make recommendations on the NMW, taking into account the impact of the minimum wage on the economy. 4 The current levels of the National Minimum wage are 5.73 for those 22 and over, 4,77 for those aged 18 to 21, and 3.53 for those aged 16 and 17. The rate of the NMW has been increased every year since its introduction, and the most recent report from the Low Pay Commission, National Minimum Wage: Low Pay Commission Report 2009, provides the following illustration of how these rates have changed over time: The Evolution of the National Minimum Wage Source: Low Pay Commission 2 I Dale (ed), Labour Party General Election Manifestos (2000). 3 HC Hansard, 16th December 1997, cols :
7 When compared to both average earnings and prices (both according to the Retail Price Index and the Consumer Price Index), the NMW has increased substantially faster than either measure since its introduction, and particularly since This growth trend is exemplified by the following illustration from the Low Pay Commission report 2009: Increases in the Real and Relative Value of the Adult National Minimum Wage, Source: LPC estimates based on ONS data, AEI including bonuses (LNMQ), RPIX (CHMK), RPI (CHAW) and CPI (D7BT), monthly, seasonally adjusted (not seasonally adjusted for RPI and CPI), UK (GB for AEI), However, the Government evidence cited above also pointed out: Reflecting a cautious approach, the NMW was initially set at a relatively low level and therefore increases above inflation and average earnings may have been expected in its early years The Impact of the National Minimum Wage Upon its introduction the Government estimated that the National Minimum Wage would benefit 1.2 million workers. 7 In December 2009, Business, Innovation and Skills Minister Pat McFadden provided the following figures on how many job holders had benefited from increases in the NMW in comparison to that estimate: 5 Department for Business, Innovation and Skills, Government Evidence to the Low Pay Commission on the Economic Effects of the National Minimum Wage (January 2010), p ibid, p House of Commons Library, National Minimum Wage Statistics (1st October 2008), SN/EP/
 (1) Figures for 1999, take earnings inflation into account, those earning between 3.50 and 2.90 in spring 1998 would benefit from the NMW introduction in April 1999.")
8 Table 1: Job holders benefiting from the annual October increases in the national minimum wage 1999 (1) (2) (3) 1.0 Number ( million) (1) Figures for 1999, take earnings inflation into account, those earning between 3.50 and 2.90 in spring 1998 would benefit from the NMW introduction in April (2) Figures for 2001, take earnings inflation into account, those earning beneath 3.40/ 4.00 and 3.50/ 4.10 in spring 2001 would benefit from the October 2001 increase. (3) Figures between 2003 and 2009 take into account earnings inflation. Source: BIS estimates using Annual Survey of Hours and Earnings (ASHE) and Annual Earnings Index (AEI); Office for National Statistics Source: HC Hansard, 8th December 2009, cols W With regard to how many occupations are currently paid the NMW (following the October 2009 uprating), the number of occupations paying under the NMW, and how those trends have changed over time, the 2009 Low Pay Commission report provides the following data: Jobs Held by Adults (Aged 22 and Over) Paying Below the Existing National Minimum Wage and the Forthcoming National Minimum Wage, UK, Source: ONS central estimates using ASHE without supplementary information and LFS, UK, ; LPC estimates using ASHE with supplementary information, low-pay weights, UK, ; and ASHE 2007 methodology, low-pay weights, UK, April Note: Prior to 2004, all our analyses were conducted in ten pence pay bands using the ONS central estimate methodology. In contrast to elsewhere in this report, where five pence pay bands are used, we use ten pence pay bands in this table. 8 8 Low Pay Commission, National Minimum Wage: Low Pay Commission Report 2009 (2009), p 25: Low%20Pay%20Commission-WEB.pdf. 4
9 2.3 The Impact of the National Minimum Wage on Pay/Earnings Expanding upon the figures cited above regarding the rises which have taken place in the NMW since 1999, and in comparison with the consumer and retail price indices, Government evidence to the Low Pay Commission from January 2010 gives the following assessment of the impact of the NMW on pay and earnings: Average earnings have consistently risen faster than prices since 1999 and the NMW has increased faster than average earnings. In real terms the value of the adult NMW has risen by a third when deflated by consumer prices, and by around a quarter when deflated by retail prices. Over the last year the adult NMW has increased in nominal terms by around 1.2 per cent. As prices have been falling, this represents a real rise of 2.0 per cent, when deflated by retail prices, but a real fall of 0.3 per cent when deflated by consumer prices. The NMW as a percentage of the median wage known as the bite is now around 50.8 per cent, an increase of around five percentage points since As the NMW wage has risen, an increasing proportion of the working population are earning wages near the statutory minimum. 9 The evidence provided by the Government also argues that the NMW has not only benefited the bottom few per cent of employees, but through an upward ripple effect it has also influenced the pay scales above the NMW, with employees in lower income brackets receiving larger percentage pay increases than those at the middle or top end. 10 This is echoed in research undertaken by Dickens, Riley and Wilkinson (2009) which found that the strongest wage growth in the period was in the lower percentiles the wage distribution The Impact of the National Minimum Wage on the Economy When the NMW was first introduced some observers, including the former Shadow Secretary of State for the Department of Trade and Industry, John Redwood, suggested that it could have a detrimental impact upon the economy, particularly in terms of rates of employment (as smaller employers in particular struggled to pay the NMW for example and thus laid off or recruited fewer staff) and number of hours worked by employees, particularly in part-time occupations (as the numbers of hours available to work were cut by employers). 12 More recently Conservative MP Christopher Chope tabled a Private Member s Bill in the House of Commons in February 2009 proposing the amendment of National Minimum Wage legislation in light of the current economic climate, which would allow for workers to be able to opt out and accept a wage less that the national minimum. Introducing the Bill on the floor of the House, Christopher Chope (who represents the Christchurch parliamentary constituency) said: 9 Department for Business, Innovation and Skills, Government evidence to the Low Pay Commission on the economic effects of the National Minimum Wage (January 2010), p ibid, p R Dickens, R Riley and D Wilkinson, The Employment and Hours of Work Effects of the Changing National Minimum Wage, Research Report for the Low Pay Commission, Centre for Economic Performance, London School of Economics, University of Sussex and National Institute of Economic and Social Research, (2009). 12 HC Hansard, 16th December 1997, cols : 5
10 In Christchurch, unemployment has more than doubled in one year, with very few job vacancies now available. Few would dispute that everything that possibly can be done must be done to create new job opportunities for our fellow citizens. My Bill, by restoring rights to work that have been taken away by this Government, would boost employment. Giving people the freedom to opt out of the minimum wage would help not only those who are out of work but those in the hard-pressed retail and hospitality sectors where businesses are going down like ninepins. 13 The Low Pay Commission asserts however that over the period of the NMW the labour market has largely fared well, with employment rising from million in April 1999, to million in April 2008, an annual rate of growth of approximately one per cent. The report s authors do acknowledge however that this has been affected by the recent economic climate and recession, with a fall in employment of 0.5 per cent between May 2008 and January 2009 (29.54 million to million). 14 According to the most recent figures available from the Office of National Statistics published on the 17th February 2010 the number of people currently in employment is million. 15 However, Government evidence to the Commission from January this year asserts that even in the recent economic climate the NMW has not adversely affected employment rates: UK academic research to date has not found evidence that the adult NMW has had a significant adverse effect on employment. There has been a slight decline in the share of UK employment in low-paying sectors since 1999 but there is no evidence that this is the result of the NMW and the trend actually predates its introduction. In addition, there is also no evidence that the NMW has hindered low paying sectors in coping with the economic downturn. Jobs have fallen by less in the low paying sectors than in the economy as a whole. 16 The Low Pay Commission also suggests that there was little evidence to suggest that increases in the minimum wage had led to a reduction in hours worked, or to changes in productivity, though the Commission did suggest that there was some evidence that profits may have been squeezed. 17 Overall however, the report s authors conclude that the minimum wage has and continues to exert a benign influence on the economy, despite recent economic conditions HC Hansard, 10th February 2009, col 1256: 14 Low Pay Commission, National Minimum Wage: Low Pay Commission Report 2009 (2009), p Office of National Statistics, Unemployment Rates (17th February 2010): 16 Department for Business, Innovation and Skills, Government Evidence to the Low Pay Commission on the Economic Effects of the National Minimum Wage (January 2010), p Low Pay Commission, National Minimum Wage: Low Pay Commission Report 2009, (2009), p xiii. 18 ibid, p 17. 6
11 2.5 The Impact of the National Minimum Wage: By Gender, Age and Ethnicity The following section briefly examines the effect of the National Minimum Wage on different groups within society, according to gender, age, and ethnicity. Gender Women are more likely to be low-paid than men, and more likely to work in low paying sectors. 19 However, both the Low Pay Commission report and the Government evidence to the Commission from this year claim that the NMW has helped to reduce the gender inequality gap, arguing that more women than men have been lifted onto a higher wage rate since the introduction of the National Minimum Wage in This is demonstrated by the chart below from the 2009 Low Pay Commission Report: Hourly Gender Pay Gap, by Percentile, Full-time Workers Aged 18 Years and Over, UK, 1998 and Source: LPC estimates based on ASHE without supplementary information, April 1998, and ASHE 2007 methodology, April , low-pay weights, UK. Note: Direct comparisons before and after 2004 and those before and after 2006, should be made with care due to changes in the data series. The Low Pay Commission report further highlights that, as a result of the prevalence of women in part-time roles as well as low-paying sectors, the NMW arguably plays a more important role and has a greater impact upon raising women s earnings in comparison to those of men Ibid, p Low Pay Commission, National Minimum Wage: Low Pay Commission Report 2009, (2009), p102. 7

12 Ethnic Minorities The Low Pay Commission point out that the earnings of workers from ethnic minority backgrounds are, on average, lower than the earnings of white workers. However the Commission suggests that the NMW has helped to significantly reduce the pay gap amongst the lowest income groups since its introduction, as exemplified in the chart below: Pay Gap between White and Ethnic Minority Workers, UK, 1998 and 2008 Source: LPC estimates based on LFS Microdata, not seasonally adjusted, UK, spring seasonal quarter 1998 and Q2 calendar quarter In its evidence to the Low Pay Commission, the Equality and Human Rights Commission (EHRC) also concluded that the ethnic minority pay gap has improved since the introduction of the NMW. 21 However, the relative earnings of different ethnic minority groups remains distinctly different, with those from the Pakistani or Bangladeshi communities for example more likely to be unemployed or in jobs paying less than the adult minimum wage compared to those from Indian or Black ethnic groups. 22 The Low Pay Commission also recognises that though ethnic minorities have seen faster improvements than their white counterparts, the employment and unemployment gaps had been closing since before the introduction of the NMW. 23 Age The Low Pay Commission suggests that age is arguably the most important distinguishing factor with regard to the minimum wage. 24 Not only is it the only factor by which the NMW varies (in terms of the rate paid), but both young people and older workers each face distinctive challenges in the labour market, and are likely to be more vulnerable as a result. 25 The Low Pay Commission asserts that the minimum wage has had a positive impact on the earnings of older workers, with no evidence of an adverse effect on their employment prospects. They point to the rise in employment rates for those over state retirement age, as exemplified by the chart below: 21 ibid, p ibid, p ibid, p ibid, p ibid, p
13 Employment and Unemployment Rates for Workers Over State Pension Age, UK, Source: LPC estimates based on LFS Microdata, quarterly, four-quarter moving average, UK, The relationship between the NMW and younger workers is perhaps more complicated. As the Low Pay Commission points out, young people often lack experience in the workplace and are therefore more likely to be on lower earnings than older workers, and they are also more likely to gain employment in low-paying sectors than their older counterparts. The result, the Commission reports, is that high proportions of young people in employment are paid at the youth and adult minimum wage rates. 26 The labour market position of young people has worsened in recent years. However both the Low Pay Commission and the Government argue that this is not the result of a detrimental impact of the NMW. The Commission suggest that is difficult to distinguish between a possible impact from the minimum wage and that from the recession, and that younger workers are particularly vulnerable in an economic downturn. The Commission concludes that lower National Minimum Wage rates for young people are still justified, in order to protect employment and at the same time reflect the training element attached to younger workers ibid, p In its 2009 report, the Commission also recommended that the starting age for the adult NMW should be 21 (in comparison with 22 currently). This has been accepted by the Government, who have committed to moving 21 year olds onto the adult rate in October 2010; Department for Business, Innovation and Skills, Government evidence to the Low Pay Commission on the economic effects of the National Minimum Wage (January 2010), p 33. 9
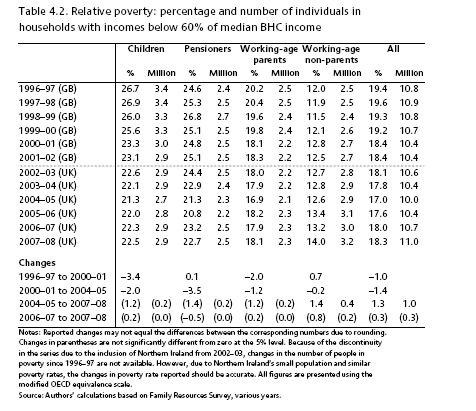
14 3. Measuring Poverty As stated at the beginning of this paper, the causes of poverty are multiple and complex, therefore this section is an examination of levels and trends in poverty over the period during which the National Minimum Wage has been in force, but intentionally draws or infers no conclusions regarding the impact of the NMW on either individual or household poverty. A month before the NMW came into force, in his Beveridge Lecture in March 1999, the then Prime Minister, Tony Blair said that tackling poverty, particularly amongst families with children, would be a key element of the Labour Government s policy agenda. 28 In Poverty and Inequality in the UK: 2009, commentators from the Institute for Fiscal Studies examine how the extent and levels of poverty have changed since that announcement, and the election of the Labour Government in It provides the following summary of current levels of poverty in the UK (according to the most recently available figures), and how it has changed over different periods of the Labour administration: In the UK in , there were 13.5 million individuals in relative poverty measuring incomes after housing costs (AHC) and 11.0 million measuring them before housing costs (BHC), using a poverty line equal to 60% of median income. On this indicator, between and , Labour oversaw the longest decline in poverty since the start of our consistent time series in However, this decline in poverty came to an end in , and poverty has now risen for three consecutive years. Between and , poverty rose by 300,000 measuring incomes BHC and 200,000 measuring incomes AHC, or both by 0.3 percentage points. Combining these with rises in the two previous years means that since , poverty has risen by 1.0 million or 1.3 percentage points (BHC) and by 1.4 million or 2.0 percentage points (AHC). 29 These trends are further exemplified in the charts below, also taken from the IFS report Tony Blair, Beveridge Lecture, Toynbee Hall, London, 18th March 1999: 29 Bevan, M., Muriel A., Phillips, D. and Sibieta, L. (2009) Poverty and Inequality in the UK: 2009, Institute for Fiscal Studies. 30 ibid, p
15 Relative poverty among different groups The following tables, again taken from the IFS Poverty and Inequality 2009 report, use the same measures to illustrate the relative levels of poverty between different groups within society, including those of working age with and without children M Bevan, A Muriel, D Phillips and L Sibieta, Poverty and Inequality in the UK: 2009, Institute for Fiscal Studies (2009), p

16 12
17 Absolute Poverty The data cited above are all measurements of relative poverty. The IFS Poverty and Inequality report 2009 also provides the following illustrations of how absolute levels of poverty have changed since the Labour Government came to power Bevan, M., Muriel A., Phillips, D. and Sibieta, L. (2009) Poverty and Inequality in the UK: 2009, Institute for Fiscal Studies, p
18 Further information on the number and proportion of families living in poverty, which draws together information both before and after housing costs for the period to , was given in answer to a Written Parliamentary Question by Department for Work and Pensions Minister Helen Goodman on 25th February 2010: Total number of families, and number and proportion of families living in households with less than 60 per cent. of contemporary median income, to , Great Britain Proportion living in low income households Number living in low income households Number of Before housing After housing Before housing After housing families costs costs costs (million) costs (million) (million) (percentage) (percentage) Notes: 1. These statistics are based on Households Below Average Income, sourced from the Family Resources Survey. Both of these documents are available in the Library. 2. Small changes should be treated with caution as these will be affected by sampling error and variability in non-response. 3. The reference period for Households Below Average Income figures are single financial years. 4. Figures correspond to Great Britain only, because prior to 2002 these are the only figures available and so this shows the full run on a consistent basis. 5. The income measures used to derive the estimates shown employ the same methodology as the Department for Work and Pensions publication Households Below Average Income (HBAI) series, which uses disposable household income, adjusted (or equivalised ) for household size and composition, as an income measure as a proxy for standard of living.. 6. For the Households Below Average Income series, incomes have been equivalised using Organisation for Economic Co-operation and Development (OECD) equivalisation factors. 7. A family is defined as a single adult or couple living as married (including same sex partners from January 2006) and any dependent children. 8. Number of families in low-income households have been rounded to the nearest hundred thousand families and proportion of families have been rounded to the nearest per cent. Source: Households Below Average Income, DWP Source: HC Hansard, 25th February 2010, col 737W: 14
19 3.1 Cycles of poverty, unemployment and low pay report from the Joseph Rowntree Foundation The Joseph Rowntree Foundation has conducted four projects to examine the extent and cycles of poverty, unemployment and low pay, each examining different strands and areas of interest. In February 2010 Chris Goulden from the Joseph Rowntree Foundation outlined the following key conclusions from across those research projects regarding poverty in the UK: Key points Incomes are dynamic, with households moving in and out of poverty over time, and policy and practice needs to reflect this. About a fifth of poverty is recurrent, where people escape from poverty only temporarily. Having a job, and the conditions of that job, relates strongly to recurrent poverty but other important factors included family change, qualifications, occupation, age and how the benefits system works. The issue of people moving repeatedly between work and unemployment is an endemic problem in the UK and has risen by 60 per cent since 2006, mostly as a result of the recession. Entering work cannot provide a sustainable route out of poverty if job security, low pay and lack of progression are not also addressed. Distinctions in effectiveness between employers who used more permanent or more flexible and temporary workforces were hard to detect. Improvements to employment conditions could be made relatively easily if, as it appears, the choice of human resource model is mainly due to differences in ethos. There are a number of implications for employers, governments and those providing support to individuals trapped in cycles of poverty. These relate to job security and wage levels: - improving rights and conditions for agency workers; - raising pay through living wage campaigns or the national minimum wage; - addressing the issues within public-sector purchasing decisions; - ensuring job and careers advice covers security, pay and progression; and - making childcare available and affordable for parents on low incomes Joseph Rowntree Foundation & Chris Goulden, Cycles of Poverty, Unemployment and Low Pay (February 2010): 15
20
The Low Pay Commission and the National Minimum Wage
 The Low Pay Commission and the National Minimum Wage Presentation to NEDLAC Saturday 20 th June 2015 Richard Dickens Independent Member of UK Low Pay Commission Professor of Economics, University of Sussex
Poverty and Income Inequality in Scotland: 2013/14 A National Statistics publication for Scotland
 Poverty and Income Inequality in Scotland: 2013/14 A National Statistics publication for Scotland EQUALITY, POVERTY AND SOCIAL SECURITY This publication presents annual estimates of the percentage and
The Changing UK Labour Market for Young People: Trends Since Yi Zhang Low Pay Commission
 The Changing UK Labour Market for Young People: Trends Since 1992 Yi Zhang Low Pay Commission Outline Introduction to the LPC and why we are interested in the youth labour market Trends in the labour market
Child Poverty Strategy 2014/17 Consultation
 Child Poverty Strategy 2014/17 Consultation Joseph Rowntree Foundation response, May 2014 Key points: The strategy requires much greater detail of its likely impact and outcomes in order to be effective.
Welfare isn t working
 Welfare isn t working Child Poverty Frank Field MP Ben Cackett June 2007 The authors Frank Field has been the Member of Parliament for Birkenhead since 1979. He accepted the position of Minister for Welfare
RESTRICTED: STATISTICS
 Households Below Average Income 2008/09 Peter Matejic (DWP) HBAI Publication Private households in United Kingdom Main source DWP Family Resources Survey Measurement of living standards as determined by
Poverty. David Phillips, p, IFS May 21 st, Institute for Fiscal Studies
 Poverty David Phillips, p, IFS May 21 st, 2010 Poverty: the story under Labour After poverty rose between 2004/5 and 2007/8 200,000000 for each of pensioners and children 200,000 for working age adults
Income Poverty. Chris Belfield 16 th July Institute for Fiscal Studies
 Income Poverty Chris Belfield 16 th July 2015 Outline Recent trends in income poverty how has poverty changed since the recession and why? how have different groups been affected? Relationship between
NATIONAL MINIMUM WAGE. Final government evidence to the Low Pay Commission 2012 JANUARY 2013
 NATIONAL MINIMUM WAGE Final government evidence to the Low Pay Commission 2012 JANUARY 2013 MINISTERIAL FOREWORD The Coalition Government is fully committed to the National Minimum Wage. We believe that
Pensioners Incomes Series: An analysis of trends in Pensioner Incomes: 1994/ /16
 Pensioners Incomes Series: An analysis of trends in Pensioner Incomes: 1994/95-215/16 Annual Financial year 215/16 Published: 16 March 217 United Kingdom This report examines how much money pensioners
Age, Demographics and Employment
 Key Facts Age, Demographics and Employment This document summarises key facts about demographic change, age, employment, training, retirement, pensions and savings. 1 Demographic change The population
Incomes and inequality: the last decade and the next parliament
 Incomes and inequality: the last decade and the next parliament IFS Briefing Note BN202 Andrew Hood and Tom Waters Incomes and inequality: the last decade and the next parliament Andrew Hood and Tom Waters
MONITORING POVERTY AND SOCIAL EXCLUSION 2013
 MONITORING POVERTY AND SOCIAL EXCLUSION 213 The latest annual report from the New Policy Institute brings together the most recent data to present a comprehensive picture of poverty in the UK. Key points
A NEW POVERTY BENCHMARK FOR BASIC INCOME SCHEMES by ANNIE MILLER
 ABSTRACT A NEW POVERTY BENCHMARK FOR BASIC INCOME SCHEMES by ANNIE MILLER (AnnieMillerBI@gmail.com) The official EU poverty benchmark, defined as 0.6 median household equivalised income, (with two versions
PENSIONS POLICY INSTITUTE. Automatic enrolment changes
 Automatic enrolment changes This report is based upon modelling commissioned by NOW: Pensions Limited. A Technical Modelling Report by Silene Capparotto and Tim Pike. Published by the Pensions Policy
Welfare Reform Bill. Parliamentary Briefing: Second Reading, 9 March 2011
 Welfare Reform Bill Parliamentary Briefing: Second Reading, 9 March 2011 Full Fact Full Fact is an independent, non-profit organisation that campaigns for more accurate and informed public debate. We work
The economic impact of increasing the National Minimum Wage and National Living Wage to 10 per hour
 The economic impact of increasing the National Minimum Wage and National Living Wage to 10 per hour A report for Unite by Howard Reed (Director, Landman Economics) June 2018 Acknowledgements This research
Patterns of Pay: results of the Annual Survey of Hours and Earnings
 Patterns of Pay: results of the Annual Survey of Hours and Earnings 1997-2007 By Hywel Daniels, Employment, Earnings and Innovation Division, Office for National Statistics Key points In April 2007 median
Public economics: Inequality and Poverty
 Public economics: Inequality and Poverty Chris Belfield Overview Measuring living standards Why do we use income? Accounting for inflation and family composition Income Inequality The UK income distribution
The minimum wage in 2018 Low Pay Commission analysis
 The minimum wage in 2018 Low Pay Commission analysis The Low Pay Commission is the independent body that advises the Government on the rates of the minimum wage, including the National Living Wage. This
Public economics: inequality and poverty
 Agnes Norris Keiller agnes_nk@ifs.org.uk 1961 1964 1967 1970 1973 1976 1979 1982 1985 1988 1991 1994 1997 2000 2003 2006 2009 2012 2015 Real median income (2007 08 = 100) Average income at an all-time
Differentials in pension prospects for minority ethnic groups in the UK
 Differentials in pension prospects for minority ethnic groups in the UK Vlachantoni, A., Evandrou, M., Falkingham, J. and Feng, Z. Centre for Research on Ageing and ESRC Centre for Population Change Faculty
A Minimum Income Standard for London Matt Padley
 A Minimum Income Standard for London 2017 Matt Padley December 2017 About Trust for London Trust for London is the largest independent charitable foundation funding work which tackles poverty and inequality
Britain s War on Poverty
 Britain s War on Poverty Jane Waldfogel Presentation to OECD, The Directorate for Employment, Labour and Social Affairs July 8, 2010 In 1964 US President Lyndon Johnson declared war on poverty This administration,
REGULATORY IMPACT STATEMENT FOR MINIMUM WAGE REVIEW 2012
 REGULATORY IMPACT STATEMENT FOR MINIMUM WAGE REVIEW 2012 Ministry of Business, Innovation and Employment February 2013 1 Agency Disclosure Statement 1 This Regulatory Impact Statement has been prepared
TRADE UNION MEMBERSHIP Statistical Bulletin
 TRADE UNION MEMBERSHIP 2016 Statistical Bulletin May 2017 Contents Introduction 3 Key findings 5 1. Long Term and Recent Trends 6 2. Private and Public Sectors 13 3. Personal and job characteristics 16
Poverty and income inequality in Scotland:
 A National Statistics Publication for Scotland Poverty and income inequality in Scotland: 2008-09 20 May 2010 This publication presents annual estimates of the proportion and number of children, working
Open Seminar Tackling Child Poverty: Lessons from the UK and New Frontiers in Japan Doshisha University Kyoto January
 Open Seminar Tackling Child Poverty: Lessons from the UK and New Frontiers in Japan Doshisha University Kyoto January 9 2012 Until 1945 financial needs of children not recognised by the state poor law,
Report of the National Equality Panel: Executive summary
 Report of the National Equality Panel: Executive summary January 2010 The independent National Equality Panel was set up to examine how inequalities in people s economic outcomes such as earnings, incomes
ANNEX ANNEX. to the. Proposal for a COUNCIL DECISION. on guidelines for the employment policies of the Member States
 EUROPEAN COMMISSION Brussels, 22.11.2017 COM(2017) 677 final to the Proposal for a COUNCIL DECISION on guidelines for the employment policies of the Member States EN EN Guideline 5: Boosting the demand
2013 Benefit Uprating
 2013 Benefit Uprating Standard Note: SN/SG 6512 Last updated: 19 December 2012 Author: Richard Cracknell Section Social and General Statistics This note sets out the main benefit and tax credit rates for
WORK IS THE BEST FORM OF WELFARE (SAVINGS): THE PROCESS IS THE POLICY. BILL WELLS
: THE PROCESS IS THE POLICY. BILL WELLS") WORK IS THE BEST FORM OF WELFARE (SAVINGS): THE PROCESS IS THE POLICY. BILL WELLS BEVERIDGEAN WELFARE STATE PRINCIPLES: in SOCIAL INSURANCE AND ALLIED SERVICES. [1944] The first principle is that any proposals
WORK IS THE BEST FORM OF WELFARE (SAVINGS): THE PROCESS IS THE POLICY. BILL WELLS BEVERIDGEAN WELFARE STATE PRINCIPLES: in SOCIAL INSURANCE AND ALLIED SERVICES. [1944] The first principle is that any proposals
Living standards during the recession
 Living standards during the recession IFS Briefing Note 117 James Browne 1. Introduction Living standards during the recession James Browne Institute for Fiscal Studies 1 We are used to our incomes rising
1. How are indicators chosen at national level to reflect the multidimensional nature of poverty and how do these relate to the EU indicators?
 The setting of national poverty targets United Kingdom 1. How are indicators chosen at national level to reflect the multidimensional nature of poverty and how do these relate to the EU indicators? The
Impact on households: distributional analysis to accompany Budget 2018
 Impact on households: distributional analysis to accompany Budget 2018 October 2018 Impact on households: distributional analysis to accompany Budget 2018 October 2018 Crown copyright 2018 This publication
Poverty and Inequality in the UK: 2010
 Poverty and Inequality in the UK: 2010 Robert Joyce Alastair Muriel David Phillips Luke Sibieta Institute for Fiscal Studies Copy-edited by Judith Payne The Institute for Fiscal Studies 7 Ridgmount Street
Monitoring poverty and social exclusion
 Monitoring poverty and social exclusion The New Policy Institute has constructed the first set of indicators to present a wide view of poverty and social exclusion in Britain. Forty-six indicators show
Fianna Fáil s Submission to the Low Pay Commission on the National Minimum Wage
 1 Fianna Fáil s Submission to the Low Pay Commission on the National Minimum Wage April 2015 2 Executive Summary Fianna Fáil welcomes the Low Pay Commission s request for submissions on the National Minimum
Chair, Cabinet Economic Growth and Infrastructure Committee
 In Confidence Office of the Minister for Workplace Relations and Safety Chair, Cabinet Economic Growth and Infrastructure Committee Annual Minimum Wage Review 2016 Proposal 1. This paper proposes: 1.1
UK Minimum Wage. Presentation to the DGB conference in Berlin. 20 June Heather Wakefield
 UK Minimum Wage Presentation to the DGB conference in Berlin 20 June 2008 Heather Wakefield Low Pay Commissioner and UNISON Head of Local Government Overview Background and History Process Impact Issues
ANNUAL REPORT for the Child Poverty Strategy for Scotland
 ANNUAL REPORT for the Child Poverty Strategy for Scotland 2016 ANNUAL REPORT FOR THE CHILD POVERTY STRATEGY FOR SCOTLAND 2016 1 CONTENTS MINISTERIAL FOREWORD 02 1. INTRODUCTION 04 2. CHILD POVERTY IN SCOTLAND
Family Resources Survey and related series update. Surveys Branch Department for Work and Pensions
 Family Resources Survey and related series update Surveys Branch Department for Work and Pensions Family Resources Survey Donncha Burke Households Below Average Income John Shale Pensioners Incomes Series
Data Management and Analysis Group. Child Poverty in London Income and Labour Market Indicators
 Data Management and Analysis Group Child Poverty in Income and Labour Market Indicators 60 50 40 30 1995 1996 1997 1998 1999 2000 2001 2002 2003 2004 2005 DMAG Briefing 2006/19 June 2006 Social Exclusion
Civil Service Statistics 2008: a focus on gross annual earnings
 FEATURE David Matthews and Andrew Taylor Civil Service Statistics 2008: a focus on gross annual earnings SUMMARY This article presents a summary of annual Civil Service statistics for the year ending 31
Impact Assessment (IA)
") Title: Power to set the National minimum wage financial penalty on a per worker basis IA No: BISLM004 Lead department or agency: Department for Business Innovation and Skills (BIS) Other departments or
Title: Power to set the National minimum wage financial penalty on a per worker basis IA No: BISLM004 Lead department or agency: Department for Business Innovation and Skills (BIS) Other departments or
ANNUAL WAGE REVIEW APRIL Ai Group Reply Submission to the Fair Work Commission
 ANNUAL WAGE REVIEW 2013-14 15 APRIL 2014 Introduction On 28 March 2014, the Australian Industry Group (Ai Group) filed its main submission for the Annual Wage Review 2013-14. In our submission we urged
Living standards, poverty and inequality in the UK: Jonathan Cribb Agnes Norris Keiller Tom Waters
 Living standards, poverty and inequality in the UK: 2018 Jonathan Cribb Agnes Norris Keiller Tom Waters Living standards, poverty and inequality in the UK: 2018 Jonathan Cribb Agnes Norris Keiller Tom
Monitoring poverty and social exclusion 2009
 Monitoring poverty and social exclusion 29 December 29 Findings Informing change The New Policy Institute has produced its twelfth annual report of indicators of poverty and social exclusion in the United
MONITORING POVERTY AND SOCIAL EXCLUSION 2016
 MONITORING POVERTY AND SOCIAL EXCLUSION 2016 This latest annual report from the New Policy Institute brings together the most recent data to present a comprehensive picture of poverty in the UK. Key points
METROPOLITAN POLICE SERVICE: GENDER PAY GAP ANALYSIS 2018
 EXECUTIVE SUMMARY METROPOLITAN POLICE SERVICE: GENDER PAY GAP ANALYSIS 2018 1. As an organisation with more than 250 employees, we are required by law to publish our gender pay figures. This is the third
Review of the Automatic Enrolment Earnings Trigger and Qualifying Earnings Band for 2019/20: Supporting Analysis
 Review of the Automatic Enrolment Earnings Trigger and Qualifying Earnings Band for 2019/20: Supporting Analysis December 2018 Contents Background... 3 Annual Review... 4 Results of This Year s Review...
The use of linked administrative data to tackle non response and attrition in longitudinal studies
 The use of linked administrative data to tackle non response and attrition in longitudinal studies Andrew Ledger & James Halse Department for Children, Schools & Families (UK) Andrew.Ledger@dcsf.gsi.gov.uk
Public economics: Income Inequality
 Public economics: Income Inequality Chris Belfield Overview Measuring living standards Why do we use income? Accounting for inflation and family composition Income Inequality The UK income distribution
PRESS RELEASE EMBARGOED TILL 00.01AM Tuesday 1 March 2016
 Although state pension income for disadvantaged groups is improving, differences in private pension income will remain without further intervention says Pensions Policy Institute The Pensions Policy Institute
The Economic Impact of a 1.50/hour increase in the National Minimum Wage
 6654_MinimumWageReport_A4_Final_Layout 1 24/09/2014 11:49 Page 1 The Economic Impact of a 1.50/hour increase in the National Minimum Wage A report for Unite by Howard Reed (Director, Landman Economics)
Labour market statistics: UK regions and countries
 BRIEFING PAPER Number 7950, 7 February 2018 Labour market statistics: UK regions and countries By Andrew Powell Contents: 1. Employment 2. Unemployment 3. Types of employment 4. Average Earnings 5. Notes
What should policy do about low earnings?
 What should policy do about low earnings? Chair: Ben Chu, The Independent Sir Richard Blundell, IFS/UCL Tito Boeri, Bocconi and FRDB Hilary Hoynes, UC Berkeley Philippe Martin, Sciences Po and Chair, Council
METROPOLITAN POLICE SERVICE: ETHNICITY PAY GAP ANALYSIS Executive Summary
 Executive Summary METROPOLITAN POLICE SERVICE: ETHNICITY PAY GAP ANALYSIS 2017 1. This is our first formal report examining how pay systems, people processes and management decisions impact on average
Scottish Parliament Gender Pay Gap Report
 2017 Scottish Parliament Gender Pay Gap Report Published in Scotland by the Scottish Parliamentary Corporate Body. For information on the Scottish Parliament contact Public Information on: Telephone: 0131
Minimum Wages: Possible Effects on the Distribution of Income
 Fiscal Studies (1996) vol. 17no. c4 pp. 31 48 Minimum Wages: Possible Effects on the Distribution of Income AMANDA GOSLING 1 I. INTRODUCTION Since the 1980s, there has been increased interest among unions
Pre Budget Submission 2010:
 Pre Budget Submission 2010: Introduction: Respond! is Ireland's largest not for profit Housing Association. We seek to create a positive future for people by alleviating poverty and creating vibrant, socially
Poverty figures for London: 2010/11 Intelligence Update
 Poverty figures for London: 2010/11 Intelligence Update 11-2012 Key points The number of Londoners living in poverty has seen little change. Children, particularly those in workless households, remain
The cost of a child in Donald Hirsch
 The cost of a child in 2013 Donald Hirsch August 2013 The cost of a child in 2013 Donald Hirsch August 2013 CPAG promotes action for the prevention and relief of poverty among children and families with
THE IMPACT OF TAX AND BENEFIT CHANGES BETWEEN APRIL 2000 AND APRIL 2003 ON PARENTS LABOUR SUPPLY
 THE IMPACT OF TAX AND BENEFIT CHANGES BETWEEN APRIL 2000 AND APRIL 2003 ON PARENTS LABOUR SUPPLY Richard Blundell Mike Brewer Andrew Shepherd THE INSTITUTE FOR FISCAL STUDIES Briefing Note No. 52 The Impact
IFS. Poverty and Inequality in Britain: The Institute for Fiscal Studies. Mike Brewer Alissa Goodman Jonathan Shaw Andrew Shephard
 IFS Poverty and Inequality in Britain: 2005 Mike Brewer Alissa Goodman Jonathan Shaw Andrew Shephard The Institute for Fiscal Studies Commentary No. 99 Poverty and Inequality in Britain: 2005 Mike Brewer
Tackling poverty from the DWP: a briefing for the Secretary of State
 Tackling poverty from the DWP: a briefing for the Secretary of State Julia Unwin: Chief Executive, Joseph Rowntree Foundation Julia.unwin@jrf.org.uk Key points To substantially reduce poverty levels in
Fair Work Commission Fair Work Act Annual Wage Review Submission in Reply by the Australian Catholic Council for Employment Relations
 Fair Work Commission Fair Work Act 2009 Annual Wage Review 2016-17 Submission in Reply by the Australian Catholic Council for Employment Relations 13 April 2017 Table of Contents Paragraph A. INTRODUCTION
Women and Men in Education and Training
 Facts about and in Great Britain 1999 and...... in Education and Training At age 16, 51 per cent of girls and 41 per cent of boys had gained five or more passes at grades A*-C of GCSE or grades 1-3 of
INEQUALITY UNDER THE LABOUR GOVERNMENT
 INEQUALITY UNDER THE LABOUR GOVERNMENT Andrew Shephard THE INSTITUTE FOR FISCAL STUDIES Briefing Note No. 33 Income Inequality under the Labour Government Andrew Shephard a.shephard@ifs.org.uk Institute
PENSIONS POLICY INSTITUTE
 The under-pensioned 2016 This report is sponsored by Age UK, the Joseph Rowntree Foundation, The People s Pension and The Trades Union Congress. The PPI is grateful for the support of the sponsors of
Higher ground REPORT. Who gains from the National Living Wage? Conor D Arcy, Adam Corlett, Laura Gardiner. September 2015
 REPORT Higher ground Who gains from the National Living Wage? Conor D Arcy, Adam Corlett, Laura Gardiner September 2015 resolutionfoundation.org info@resolutionfoundation.org +44 (0)203 372 2960 Acknowledgements
Changes to work and income around state pension age
 Changes to work and income around state pension age Analysis of the English Longitudinal Study of Ageing Authors: Jenny Chanfreau, Matt Barnes and Carl Cullinane Date: December 2013 Prepared for: Age UK
METROPOLITAN POLICE SERVICE: ETHNICITY PAY GAP ANALYSIS 2018
 EXECUTIVE SUMMARY METROPOLITAN POLICE SERVICE: ETHNICITY PAY GAP ANALYSIS 2018 1. This is our second formal report examining how pay systems, people processes and management decisions impact on average
SUBMISSION FROM SCOTTISH LIVING WAGE CAMPAIGN
 SUBMISSION FROM SCOTTISH LIVING WAGE CAMPAIGN The Scottish Living Wage Campaign (SLWC) is led by the Poverty Alliance and the STUC and supported by the Church of Scotland, Unison, Unite, GMB, PCS, Oxfam
Public sector pay and pensions
 Public sector pay and pensions Jonathan Cribb (IFS) OME Reward in the Public Sector: Research Seminar Friday 10 th July 2015 For more details see: Cribb, Emmerson and Sibieta (2014) Public sector pay in
Quarterly Labour Market Report. September 2016
 Quarterly Labour Market Report September 2016 MB13809 Sept 2016 Ministry of Business, Innovation and Employment (MBIE) Hikina Whakatutuki - Lifting to make successful MBIE develops and delivers policy,
Poverty and income inequality
 Poverty and income inequality Jonathan Cribb Public Economics Lectures, Institute for Fiscal Studies 17 th December 2012 Overview The standard of living in the UK Income Inequality The UK income distribution
PENSIONS POLICY INSTITUTE THE PENSIONS LANDSCAPE
 PENSIONS POLICY INSTITUTE THE PENSIONS LANDSCAPE 1 2 The Pensions Landscape Foreword 1 Summary of conclusions 2 Introduction to the UK pension system 4 Chapter 1: Current pensioners incomes 7 Chapter 2:
Minimum Wage: Maximum Impact. Alan Manning London School of Economics
 Minimum Wage: Maximum Impact Alan Manning London School of Economics The National Minimum Wage First introduced in April 1999 Initially controversial dire warnings of massive job losses Now widespread
Michelle Jones, Stephanie Tipping
 Economy READER INFORMATION Need Identified Lead Author Date completed Director approved Economy Michelle Jones, Stephanie Tipping To be signed off To be signed off Key needs Economic inactivity The employment
The State of Working Florida 2011
 The State of Working Florida 2011 Labor Day, September 5, 2011 By Emily Eisenhauer and Carlos A. Sanchez Contact: Emily Eisenhauer Center for Labor Research and Studies Florida International University
Equality impact assessment Universal Credit: welfare that works. 19 November 2010
 Equality impact assessment Universal Credit: welfare that works 19 November 2010 Equality impact assessment for Universal Credit: welfare that works (Cm 7957) 1. Introduction The Department for Work and
Multiple Jeopardy? The impacts of the UK Government s proposed welfare reforms on women in Scotland
 Multiple Jeopardy? The impacts of the UK Government s proposed welfare reforms on women in Scotland An Engender Briefing Paper January 2012 1. Introduction Since the June 2010 emergency budget the UK government
Means- testing universal benefits for pensioners
 Means- testing universal benefits for pensioners Key Points: The government currently spends over 4bn every year on Winter Fuel Payments, concessionary bus travel and free TV licences for the over- 75s.
Trends in Retirement and in Working at Older Ages
 Pensions at a Glance 211 Retirement-income Systems in OECD and G2 Countries OECD 211 I PART I Chapter 2 Trends in Retirement and in Working at Older Ages This chapter examines labour-market behaviour of
Economic Standard of Living
 DESIRED OUTCOMES New Zealand is a prosperous society, reflecting the value of both paid and unpaid work. All people have access to adequate incomes and decent, affordable housing that meets their needs.
Women s pay and employment update: a public/private sector comparison
 Women s pay and employment update: a public/private sector comparison Report for Women s Conference 01 Women s pay and employment update: a public/private sector comparison Women s employment has been
The Female Face of Poverty. Examining the cause and consequences of economic deprivation for women
 The Female Face of Poverty Examining the cause and consequences of economic deprivation for women July 2018 Table of Contents 1. Executive Summary 4 1.1. Recommendations... 4 1.2. Poverty with a female
A minimum income standard for the UK in 2011
 A minimum income standard for the UK in 2011 Donald Hirsch www.jrf.org.uk A minimum income standard for the UK in 2011 Donald Hirsch July 2011 This is the 2011 update of the Minimum Income Standard for
Tax credits: reforming financial support for families
 Tax credits: reforming financial support for families The modernisation of Britain s Tax and Benefit System Number Eleven March 2005 Tax credits: reforming financial support for families March 2005 Crown
WELFARE REFORM IN THE UK:
 WELFARE REFORM IN THE UK: 1997-2007 Mike Brewer THE INSTITUTE FOR FISCAL STUDIES WP20/07 Welfare Reform in the UK: 1997-2007 Mike Brewer * Institute for Fiscal Studies, London, UK 17 May 2007 Abstract
Academic physics staff in UK higher education institutions
 A report prepared for the Institute of Physics by Oxford Research & Policy December 213 Academic physics staff in UK higher education institutions Updated with data for 21/11 and 211/12 The Institute of
Public sector pay: still time for restraint?
 Public sector pay: still time for restraint? IFS Briefing Note BN216 Jonathan Cribb Public sector pay: still time for restraint? Jonathan Cribb Copy-edited by Judith Payne Published by The Institute for
GAO GENDER PAY DIFFERENCES. Progress Made, but Women Remain Overrepresented among Low-Wage Workers. Report to Congressional Requesters
 GAO United States Government Accountability Office Report to Congressional Requesters October 2011 GENDER PAY DIFFERENCES Progress Made, but Women Remain Overrepresented among Low-Wage Workers GAO-12-10
Labour s cost-of-living contract with hardworking Britain 1
 Labour s cost-of-living contract with hardworking Britain 1 Foreword Ed Miliband The record of this government is simple: hardworking Britain is worse off month after month, year after year. Since David
CHILD POVERTY (SCOTLAND) BILL
 BILL") CHILD POVERTY (SCOTLAND) BILL POLICY MEMORANDUM INTRODUCTION 1. As required under Rule 9.3.3 of the Parliament s Standing Orders, this Policy Memorandum is published to accompany the Child Poverty (Scotland)
CHILD POVERTY (SCOTLAND) BILL POLICY MEMORANDUM INTRODUCTION 1. As required under Rule 9.3.3 of the Parliament s Standing Orders, this Policy Memorandum is published to accompany the Child Poverty (Scotland)
Women in the Labor Force: A Databook
 Cornell University ILR School DigitalCommons@ILR Federal Publications Key Workplace Documents 9-2007 Women in the Labor Force: A Databook Bureau of Labor Statistics Follow this and additional works at:
Characteristics of people employed in the public sector
 489 Characteristics of people employed in the public sector By Daniel Heap, Labour Market Division, Office for National Statistics Key points In 24 65 per cent of people employed in the public sector were
MONITORING POVERTY AND SOCIAL EXCLUSION IN SCOTLAND 2015
 MONITORING POVERTY AND SOCIAL EXCLUSION IN SCOTLAND 2015 This study is the seventh in a series of reports monitoring poverty and social exclusion in Scotland since 2002. The analysis combines evidence
POVERTY IN AUSTRALIA: NEW ESTIMATES AND RECENT TRENDS RESEARCH METHODOLOGY FOR THE 2016 REPORT
 POVERTY IN AUSTRALIA: NEW ESTIMATES AND RECENT TRENDS RESEARCH METHODOLOGY FOR THE 2016 REPORT Peter Saunders, Melissa Wong and Bruce Bradbury Social Policy Research Centre University of New South Wales