Content. Main figures for five years 3 Report of the Board of Directors 4 Corporate governance 16 Social responsibility 22
|
|
|
- Raymond Underwood
- 6 years ago
- Views:
Transcription

1 ANNUAL REPORT 2015
2 Content Main figures for five years 3 Report of the Board of Directors 4 Corporate governance 16 Social responsibility 22 Group Key figures 30 Income statement 31 Statement of financial position 32 Statement of changes in equity 34 Cash flow statement 35 Notes 36 ASA Profit and loss account 80 Balance sheet 81 Cash flow statement 83 Notes 84 Independent auditor`s report 98 Statement by the Corporate Assembly 100 Financial calender 101 2
3 Main figures Amounts in NOK million THE GROUP Operating revenues 9 690, , , , ,9 Depreciation 291,2 286,5 271,6 250,9 225,9 Impairment 47,9 0,0 0,0 0,0 0,0 Operating profit 214,8 203,6-44,7 16,9 12,9 Financial items -56,3-88,2-72,4-81,2-125,4 Profit before tax 158,5 115,3-117,1-64,3-112,4 Total assets 4 778, , , , ,9 Equity in per cent 36,8 34,2 33,4 35,5 35,6 Operating margin in per cent 2,2 2,3-0,6 0,2 0,2 Cash flow from operating profit 553,9 490,0 226,9 267,8 238,8 Investments 215,8 195,1 351,2 339,4 386,6 Number of employees TIMBER Operating revenues 3 010, , , , ,1 Depreciation 121,1 116,5 116,0 99,9 90,3 Impairment 47,9 0,0 0,0 0 0 Operating profit -23,9 83,0-11,6-74,6-52,4 Financial items -9,0-25,8-29,3-23,35-25,7 Profit before tax -32,9 56,7-40,9-97,97-78,1 Total assets 1 664, , , , ,2 Operating margin in per cent -0,8 2,9-0,5-3,1-2,2 Cash flow from operating profit 145,1 199,5 104,4 25,3 37,9 Investments 75,9 67,6 119,5 151,6 144,2 Number of employees WOOD Operating revenues 3 275, , , , ,4 Depreciation and impairment 113,7 114,4 104,9 99,1 89,5 Operating profit 123,7 110,9 23,5 29,6 57,6 Financial items -27,1-23,6-30,8-28,9-27,959 Profit before tax 96,6 87,3-7,4 0,8 29,6 Total assets 2 134, , , , ,7 Operating margin in per cent 3,8 3,6 0,8 1,0 2,0 Cash flow from operating profit 237,4 225,3 128,4 128,7 147,1 Investments 96,8 82,4 174,7 132,7 169,5 Number of employees BUILDING SYSTEMS Operating revenues 3 375, , , , ,8 Depreciation and impairment 44,4 41,6 38,0 38,1 36,0 Operating profit 140,8 57,2-19,1 97,0 50,8 Financial items -0,1 6,4 0,1 1,95 4,47 Profit before taxes 140,7 63,5-19,0 98,9 55,3 Total assets 1 616, , ,9 1243,3 1217,9 Operating margin in per cent 4,2 2,0-0,8 3,5 1,9 Cash flow from operating profit 185,2 98,8 18,9 135,1 86,798 Investments 40,2 37,9 43,4 46,3 38,3 Number of employees OTHER OPERATIONS Operating revenues 3 003, ,4 2623,7 2616,7 2677,2 Depreciation and impairment 12,0 13,9 12,8 13,8 10 Operating profit -25,9-47,5-37,5-35,1-43 Financial items -20,1-44,7-12,4-30,9-76,2 Profit before tax -45,9-92,2-49,9-66,1-119,2 Cash flow from operating profit -13,9-33,6-24,7-21,3-33 Investments 3,0 7, Number of employees
4 2015 in brief The combined demand for the Group's products and services was satisfactory throughout the year, and the Group increased its revenues by NOK million to NOK 9,690.4 million. The operating profit improved from NOK million to NOK million and return on capital employed improved from 6.8 to 7.4 per cent. For the Moelven Group 2015 was a year with great emphasis on internal improvement work and restructuring in line with the strategy that was drawn up in the autumn of Both sales of plants in the wood processing part of the Group and acquisitions of operations in Building Systems are results of this strategy. With sales in more than 30 countries and on several continents, the Moelven Group is obviously dependent on developments in the global economy. However, the spread is broad enough to have a diversifying effect. Combined, approx. 15 per cent of the Group's turnover is in markets beyond Scandinavia. Overall, demand has been satisfactory throughout Moelven has very little exports to the United States, but the improvement in the US economy contributes to improve the market balance in other markets where Moelven has a presence. Export is primarily from the units that use sawlogs as a raw material in their production, which is to say the sawmills in Timber division and the combined sawmills and planing mills in Wood division. It is mainly sawn timber products that is exported. For Timber in isolation the export share outside of Scandinavia is 45 per cent, and for Wood it is 10 per cent. Both price developments on the international market for sawn timber and exchange rate developments therefore have a major impact on the business. International price levels rapidly impact the home market in Scandinavia. In 2015 the prices for sawn timber have been dropping, but in the export markets the change in the currency situation has contributed to preserve margins. Access to raw material for the sawlogs-consuming units was satisfactory for the year as a whole. Price levels forsawlogs dropped slightly through the year and were overall somewhat lower than in Prices for chip and fibre products were also lower than in the preceding year. The decline was initially noticeable on the Swedish side, but also made itself felt in Norway as the year progressed. The Wood division mainly sells its processed wood products on the building materials market in Scandinavia. Demand in this market has been satisfactory, but price levels declined somewhat during the year. The Building Systems division operates exclusively in building and construction in Scandinavia. Deliveries are to professional players in both the new building and renovations and remodelling markets. Demand for the division's products and services have been satisfactory overall for the year, and the combined order backlog at year end was NOK 272 million higher than for the previous year. However, market conditions saw very different developments in Norway and Sweden as the year progressed. While the units with operations in Sweden enjoyed high levels of activity in the Swedish economy, Norwegian units have had to adapt to dropping activity levels. The decline has been particularly pronounced in south-west Norway as a result of developments in the petroleum industry. Corporate governance At the Corporate Assembly meeting after the annual general meeting on 26 April 2015, a new Board was elected. The new members of the Board are Olav Fjell (chairman), Mari Wilhelmsen and Asbjørn Bjørnstad. The Board additionally comprises Trond Stangeby (deputy), Elisabeth Krokeide, Lars-Håkan Karlsson (employee representative) and Martin Fauchald (employee representative). Comprehensive information on the Group's governing bodies is available at and on page 16. In September 2015 Morten Kristiansen, who had served as acting CEO since September 2014, was appointed CEO. Kristiansen holds a degree in structural engineering and is a graduate economist from the Norwegian Business School. He was employed by Moelven from 1981 to 1994 and subsequently from the year When he was made acting CEO last autumn, he came from the position as vice president in Moelven Industrier ASA with responsibility for timber supply and fibre products. Corporate structure In February the company Moelven Modus Prosjekt AS merged with Moelven Modus AS. In August Moelven and Västvärmlands LBC established the transport company Woodtrans AS. Moelven's ownership interest in Woodtrans AS is 34%. The new company will take over the chip and timber transport from Pedersens Lastebiltransport AS, and will initially consist of 16 heavy goods vehicles operating in the combination market (chip, sawn timber and planed timber) in South Norway. For Moelven the establishment of the company represents an opportunity for synergies through more efficient transport management within a greater geographical area. Operations in Woodtrans AS commenced on 1 September. On 1 October Moelven acquired module manufacturer Hedalm AS at Hjellum in Hamar municipality. The company continues to operate as an independent company, coordinated with other module production in the Group, under the name Moelven Byggmodul Hjellum AS. The acquisition provides the Group with greater specialization, capacity and ability to deliver large orders with a short production time in all three segments in module operations a) construction, b) projects, and c) housing. The acquisition thus strengthens the 4


5 Group's position as the leading module manufacturer in the Nordic region. Coordination between the module companies will also provide synergies in that production to a greater extent than previously can be cultivated at each production site. In December an agreement was reached with the Vida group for the sale of the property, production equipment and movable property from Moelven Nössemark Trä AB. All production activity in the company was discontinued in the fourth quarter, and the transaction was completed on 30 December. The accumulated operating result for 2015 has been charged with impairment and loss through the sale of fixed assets totalling NOK 54.1 million. This is the Moelven Group Ownership structure The Moelven Group is owned by Glommen Skog SA (29.1 %), Eidsiva Vekst AS (23.8%), Felleskjøpet Agri SA (15.8%), Viken Skog SA (11.9%), Mjøsen Skog SA (11.7%) and AT Skog SA (7.3%). Most of the remaining 0.4 per cent is owned by private individuals. Vision Moelven is a Scandinavian Group. All production units are located in Scandinavia, which is also the primary market. The business is based on the prerequisites dictated by Scandinavian society and builds on these. Moelven's vision is to be the natural choice for people who wish to build and live Scandinavian, and the Group shall take the lead in developing buildings that are based on Scandinavian building traditions. Within this framework, activities are based on a desire and an ability to contribute to creating good spaces good environments to live and work in, and for all social functions. Good Scandinavian environments are often close to nature in their form and content. Wood and other natural materials are essential parts of what Moelven makes and are dominant in the greater part of the product range. Natural materials are environmentally friendly building materials and building solutions when it comes to houses and modules, bridges and interior products. Location The Group has its headquarters in Moelv in Norway and consists of 43 production companies in 49 production locations, and 32 offices for sales, service and fitting. Most of the production units are companies and workplaces with a strong local presence in rural communities in South East Norway and the western part of Central Sweden. The offices for sales, service and fitting are located in larger population centres around Norway, Sweden, Denmark, the United Kingdom, Germany and the Netherlands. Production in Norway and Sweden is of approximately the same volume, but the Swedish units export a greater proportion of their production than the Norwegian. Out of a total of 3,426 (3,326) employees at the end of 2015, 1,777 (1,697) work in Norway, 1621 (1,597) in Sweden, 20 (19) in Denmark and 8 (13) in other countries. The Divisions Moelven offers a wide range of building products and building systems and associated services. The Scandinavian market accounts for 85 per cent of sales revenues, and 85 per cent of the Group's products and services are used for new building or renovation of homes and commercial property. A large part of the remaining operation consists of sales of biomass for biofuel and for pulp, paper and particle board production. The Group also supplies wood products to the furniture, interior and packaging sectors. Customers are divided into three main segments: industry, trade and projects. These segments are based on the nature of their business. The Group is divided into three divisions: Timber, Wood and Building Systems, each of which focuses on one of the main segments. There is also an Other Businesses reporting area, which consists of the holding companies, supply businesses fibre products and bioenergy companies. 5
6 Timber The Timber division consists of 14 production companies and 4 sales offices, supplying sawn timber products, components and chip products made from local spruce and pine. The customers are mainly industrial companies that buy intermediate products for their own production of construction timber, glulam, panels, flooring, mouldings, windows, packaging, board and paper products and for bioenergy. About 55 per cent of operating revenues come from Scandinavian customers. At the end of 2015, there were 679 (703) employees, 237 (245) of them in Norway, 434 (450) in Sweden and 8 (8) in other countries. Wood The Wood division comprises 19 production companies, 3 customer centres and one project sales company. The main products are white and impregnated building wood, external cladding, boards, components and chip products and interior products such as mouldings, flooring and interior panels. Wood also sells products produced by other companies. Almost 80 per cent of production is sold through the building goods trade. Wood is one of the leading suppliers to the Scandinavian market and about 90 per cent of its operating revenues come from Scandinavian customers. At the end of 2015, there were 1,009 (993) employees, 564 (522) of them in Norway, 425 (452) in Sweden and 20 (19) in Denmark. Building systems The Building Systems division consists of 8 production companies at 13 production locations and 24 sales, service and fitting offices. Building Systems is divided into the business areas Glulam, Building Modules and System Interiors, all three of which are market leaders in Norway and Sweden, as well as Electrical Services in Norway. The division's building and contracting customers buy customised building modules, flexible interior solutions systems and associated services, advanced glulam structures and electrical installation services. In addition to bridges and load-bearing structures, the glulam unit also has considerable sales of standard laminated timber beams through the building products trade, as well as components for the prefabricated house industry. Operating revenues come from Scandinavian customers. At the end of 2015, there were 1,607 (1,498) employees, 927 (837) of them in Norway, 680 (656) in Sweden and 0 (5) in the United Kingdom. In order to ensure adequate flexibility in production capacity to meet seasonal and economic fluctuations in the market, the divisions use hired workers. Hired workers are not included in the employee figures. However work is carried out on the principle that work contracts, rights and obligations, as well as time limits in the employment relationship, should be the same as for permanent employees. Other businesses Other businesses include Moelven Industrier ASA, with common services in economics, finance, insurance, communications, HR, ICT and procurement. Timber supply and sales of wood chips and energy products are organised as a common function for the Group's timber processing industry and are included through the companies Moelven Skog AB, Moelven Virke AS and Vänerbränsle AB. Moelven Bioenergi AS is also included. At the end of 2015, there were 131 (132) employees, 49 (45) of them in Norway and 82 (87) in Sweden. SOCIAL RESPONSIBILITY The Board has processed and approved the Groups general strategy and guidelines relating to HSE, social responsibility, the environment and competition law. The discussion of these areas are included in the Board's explanation of principles and practice concerning social responsibility pursuant to the Accounting Act Section 3-3c on page 22. OPERATING REVENUES AND RESULTS Operating revenues increased by 9.8 per cent compared to the previous year, including acquisitions. The operating result increased by 5.5 per cent. EBITDA, which doesn't include impairment and loss through the sale of fixed assets, increased by 13.0 per cent compared to Overall delivery volumes in 2015 were higher than the preceding year, but at lower prices. For the sawlogconsuming units reduced market prices for sawn timber products, chip and fibre products has partly been compensated by lower prices on sawn timber. The inventory estimates, which are prepared according to the FIFO principle, are reviewed regularly to correct for developments in raw material costs. Along with an update of real value assessments of inventory, this formed the basis for price adjustments totalling NOK million in 2015 and NOK 48.6 million in The items do not have any impact on cash flow. The internal improvement work and restructuring that has been given high priority throughout 2015 is resource-intensive, but has yielded good results has been the first year in a three-year plan to bring the Group's profitability up to the targeted level. Work will therefore proceed in the same manner in 2016 and The result for 2015 has been charged with impairment and loss through the sale of fixed assets totalling NOK 54.1 million. The item is in its entirety related to the sale and discontinuation of operations at Moelven Nössemark Trä AB. The property, including production equipment and movable property was sold in December. In connection with follow-up of the project portfolio in the Electrical Installations business, in 2015 a provision has been recognised for possible losses totalling NOK 40 million. The corresponding provision in 2014 comprised NOK 9 million. In the course of the autumn of 2015 the Group's remaining defined-benefit pension schemes in Norway were converted to definedcontribution pension schemes. The change resulted in a positive non-recurring effect on the operating result of NOK 26.5 million. 6


7 In 2014 the operating result for the fourth quarter and the year as a whole saw positive effect from the recognition of reimbursements from group health insurance plans in Sweden totalling NOK 6.7 million. Net financial expenses excluding changes in the value of financial instruments were somewhat higher in 2015 than in Net interest-bearing debt has been lower throughout 2015, but the overall borrowing cost has been higher following refinancing carried out in mid The Group employs financial instruments to hedge foreign exchange rates, interest rates and power prices. Noncash items associated with this totalled NOK 5.6 million (NOK million) The market value of both currency and interest hedges improved compared to the previous year, while falling energy prices entailed a negative development for the power contracts. Timber Amounts in NOK million Operating revenue 3 010, ,3 EBITDA 145,1 199,5 Depreciation and impairment 169,0 116,5 Operating profit -23,9 83,0 Profit before tax -32,9 56,7 In market terms the start of 2015 was characterized by some uncertainty and a wait-and-see attitude among customers in the international market for sawn timber products. Combined with high producer stocks this contributed to falling prices, particularly for pine products. This development continued for large parts of the year, and gradually spread from its origin in the export markets in Europe, the Middle East and North Africa, and into the Swedish domestic market. However, in the course of the fourth quarter there was a certain positive development for spruce products, while the declining trend for pine products levelled off. The underlying demand was satisfactory throughout 2015, despite difficult financial conditions in certain export markets in the Middle East and North Africa making export to these markets more resource-intensive than usual. Weak exchange rates for both Swedish krona and Norwegian kroner have contributed to reduce the price drop in these home currencies, while also maintaining competitiveness in export markets to a certain extent. For the year as a whole delivery volumes were higher than in 2014, but at somewhat lower prices. Access to raw material has been satisfactory, and the prices for sawlogs were somewhat lower than in Overall the prices for chip and fibre products were also somewhat lower than in the previous year. Due to price developments, the profits have been charged with price adjustments to inventories totalling NOK million The corresponding adjustment in 2014 had a positive effect of NOK 17.2 million. Although several units can boast good results as a consequence of internal improvement work, too many units remain with excess units costs. The ongoing improvement work continues unabated to reduce unit costs and bring the companies with poor earnings up to an acceptable profitability level. At the end of the year an agreement was reached with the Vida group for the sale of the property, production equipment and movable property from Moelven Nössemark Trä AB. All production activity in the company was discontinued in the fourth quarter, and the transaction was completed on 30 December. The accumulated operating result for 2015 has been charged with impairment and loss through the sale of fixed assets totalling NOK 54.1 million. The conversion of the remaining defined-benefit pension schemes in Norway to defined-contribution pension schemes provided a positive non-recurring effect on the operating result of NOK 2.1 million in In 2014 the operating result has seen a positive effect from the recognition of reimbursements from group health insurance plans in Sweden totalling NOK 3.4 million. 7
8 Wood Amounts in NOK million Operating revenue 3 275, ,2 EBITDA 237,4 225,3 Depreciation and impairment 113,7 114,4 Operating profit 123,7 110,9 Profit before tax 96,6 87,3 Market activities in 2015 were satisfactory in both Sweden and Norway, and complied with the normal seasonal variations throughout the year. In Denmark the organization is tailored according to market activities, which have been at a stable low level. For the division overall delivery volumes were higher than in 2014, but at prices that were somewhat lower in total. Several units saw good progress in 2015 as a result of the ongoing improvement work. This work continues unabated in the entire division in order to maintain competitiveness and to bring the remaining units with poor earnings up to an acceptable profitability level. In addition to operational improvements, the Wood division has had good success with its HSE work. In the course of 2015 the number of injuries per million worked hours (LTI) has dropped from 18.2 to 8.9. For the division's planing mills, who use sawn timber products as a raw material, raw material costs for the year as a whole were on a par with For the division's sawlog-consuming units access to sawlogs was satisfactory in 2015 and prices were somewhat lower. Overall, the prices for chip and fibre products were also somewhat lower. Due to price developments, the profits for the quarter have been charged with price adjustments to inventories of NOK 22.6 million (31.4). The conversion of the remaining defined-benefit pension schemes in Norway to defined-contribution pension schemes provided a positive non-recurring effect on the operating result of NOK 4.6 million in In 2014 the operating result has seen a positive effect from the recognition of reimbursements from group health insurance plans in Sweden totalling NOK 1.3 million. Building systems Amounts in NOK million Operating revenue 3 375, ,7 EBITDA 185,2 98,8 Depreciation and impairment 44,4 41,6 Operating profit 140,8 57,2 Profit before tax 140,7 63,5 Following progress for all business areas, both revenue and operating results increased compared to the same period the previous year for the division as a whole. At the end of the quarter the order backlog was NOK 272 million higher that for the same period the previous year. The conversion of the remaining defined-benefit pension schemes in Norway to defined-contribution pension schemes provided a positive non-recurring effect on the operating result of NOK 17.2 million. In 2014 the operating result has seen a positive effect from the recognition of reimbursements from group health insurance plans in Sweden totalling NOK 2.0 million. In 2015 the glulam business in Norway had a satisfactory activity level in both standard glulam and projects, in a market where competition from foreign players has declined somewhat due to the currency situation. For the business in Sweden activity levels were below par for the first six months, but positive developments in the second half of the year and an increasing market share resulted in a satisfactory level at year end. It is primarily standard glulam for small buildings, but also the project market that have picked up compared to the previous year. In terms of volume, deliveries to the Swedish market were among the highest ever in the year's final quarter. Operations in Sweden have, following unsatisfactory results in 2014, carried out restructuring and rationalization measures, and had at year end improved profitability significantly compared to the situation a year previously. The full effect of the recently implemented measures will however not be achieved until the first quarter of Besides obligations related to the completion of older, long-term projects, the Electrical Installations business has been restructured in In the core business area of the restructured part of the Electrical Installations business, i.e. smaller projects and service assignments, activity levels were good in 2015 and results developed satisfactorily through the year. The order backlog at the end of 2015 was good. For the part of the company responsible for the completion of older, larger projects, a further devaluation of the project portfolio was required. The 2015 result has been charged with a total of NOK 40.0 million following valuation allowances of NOK 6.0 million in the first quarter, NOK 22.0 million in the second quarter and NOK 12.0 million in the fourth quarter. 8
9 For the Building Module business in Sweden market activities and new orders were very good throughout The 2015 result was the best recorded. The main reasons are an increased share of projects with a high level of standardisation, as well as improved factory productivity. On the market for module based buildings in Norway activity was somewhat better than in 2014 in the first three quarter, but dropped back to the level of a year previously in the final quarter. The combined activity for Moelven's module production in Norway increased as a result of the acquisition of module manufacturer Hedalm AS at Hjellum in Hamar municipality. The transaction was completed on 1 October. The company continues to operate as an independent company, coordinated with other module production in the Group, under the name Moelven Byggmodul Hjellum AS. The acquisition provides the Group with greater specialization, capacity and ability to deliver large orders in the short term in all three segments in module operations a) construction, b) projects, and c) housing. The acquisition thus strengthens the Group's position as the leading module manufacturer in the Nordic region. At the end of 2015 a number of measures were ongoing to streamline production and cultivate the production concepts according to plant. This will be completed in the first quarter of All Norwegian module production for housing purposes will take place in the factory at Hjellum, while other modules will be produced in Moelv. For the Modular System Interiors companies, the level of activity for new construction was good in the Swedish part of the business, especially in the major cities of Stockholm, Gothenburg and Malmø. The renovation and remodelling market had a stable and high level of activity throughout the quarter. Market activities in Norway were, despite some improvement in central areas of eastern Norway, still declining compared to The decline is significant in south-western Norway, and particularly applies to new buildings to a greater extent than the renovation, conversion and extension market, although activities have also declined somewhat in this segment too. Other businesses Amounts in NOK million Operating revenue 3 003, ,4 EBITDA -13,9-33,6 Depreciation and impairment 12,0 13,9 Operating profit -25,9-47,5 Profit before tax -45,9-92,2 Fluctuations in operating revenues within the area of Other businesses are largely due to fluctuations in the level of activity within timber supply and sales of chips and energy products. The main activity is internal sales, which do not materially affect the results within the business area. In order to safeguard the supply of timber and market opportunities for wood chip and energy products in regions without local demand for these products, train solutions have been established for transport. The arrangement entails increased external sales due to pulp wood now being purchased and subsequently sold externally. The business is based on fixed agreements on both the customer and supplier sides, and the risk is limited. The result for 2015 includes a positive net result of NOK 5.0 million from badwill related to acquisitions and the elimination of internal profit from inventory. In addition there is a positive non-recurring effect of NOK 3.5 million as a result of the group's remaining defined-benefit pension schemes in Norway being converted to defined contribution pension schemes. A provision for 18 months' salary for the former CEO was charged to the operating profit for 2014 in accordance with the guidelines described in note 28 in the consolidated financial statements. INVESTMENTS, BALANCE SHEET AND FINANCING During 2015, total investments were NOK million (NOK million). The investments were aimed primarily at necessary repairs and maintenance. Investment projects of a strategic nature have been initiated to a greater degree than in In order to realize the improvement of the Group's profitability described in the strategy plan, the share of strategic investments will increase further in Depreciation in 2015 was NOK million (286.5). Additionally, Moelven Nössemark Trä AB's fixed assets were written down by NOK 47.9 million in the second quarter and subsequently sold in the fourth quarter. At the end of the year, the book value of the Group's total assets was NOK 4,778.1 million (NOK 4,653.2 million). Cash flow from operating activities was NOK million (351,5). The improvement over 2014 is mainly due to underlying profitability and less accumulation of working capital in the final six months. Cash flow from working capital items was NOK million (-72.2). Net interest-bearing liabilities were NOK 1,110.4 million (NOK 1,353.1 million) at the end of the year. Financial leases are included in net interest-bearing liabilities, amounting to NOK 31.5 million (NOK 27.1 million). The liquidity reserve was NOK million (NOK million). In the Group's main financing the available loan facility varies in time with the natural fluctuations in the Group's tied-up capital through the year. 9
10 The Group's long-term financing consists of two loan facilities with a credit ceiling totalling NOK 1,575 million. NOK 225 million is due in September 2016 and the primary facility is due at the end of the first six months of The process for refinancing both facilities was initiated in January Current liabilities at year end are due to credit in the loan facility that matures in This credit may be covered by unused credit limits in the main facility. Equity at the end of the year amounted to NOK 1,756.9 million (NOK 1,592.3 million), equivalent to NOK (NOK 12.29) per share. The conversion of the remaining defined-benefit pension schemes in Norway to defined-contribution pension schemes provided, in addition to recognition in the results, a direct increase in equity of NOK 37.5 million. The decision to disburse a dividend for 2014 totalling NOK 51.8 million was made in December, and was thus charged to equity in the fourth quarter. At the end of the year the equity ratio was 36.8 per cent (34.2 per cent). Parts of the Group's equity are linked to ownership interests in foreign subsidiaries, principally in Sweden, and are thereby exposed to exchange rate fluctuations. The extent and consequences of likely variations in exchange rates are within acceptable risk limits. For the year as a whole there has been an increase in equity related to currency fluctuations of NOK 61.7 million (12.3). Approximately half of the Group's assets are recognized in SEK. The total assets thus also change based on the exchange rate. The equity ratio in percent is therefore less impacted by exchange rate fluctuations than the nominal equity. RISK The Group's profits and balance sheet are affected by several external factors that can be influenced by Moelven to a greater or lesser extent. For some of the risk areas that affect the Group, there are functioning financial markets where the risk of fluctuations can be reduced. This applies, for example, to interest rates, exchange rates and electricity. The Group's position on financial risk is that it is the industrial activities rather than financial transactions that shall create the conditions necessary for profitability. The main aim of the guidelines for the use of financial instruments is to reduce fluctuations and create more predictability. In other areas, such as raw materials, finished goods and projects, other methods of hedging risk must be used. As far as possible, fixed price contracts or index linking of contracts is used, for example. The Group's composition of units directed at different primary markets also has the effect of reducing risk. The primary markets are seldom affected by economic fluctuations at the same time, while the cost side can still benefit from economies of scale. Prices of finished goods The units of the Moelven Group operate in markets with free competition and many players. The creation of prices therefore occurs freely in the marketplace, and assuming unchanged volumes a change in process will affect the group as shown on the sensitivity table. Sawn timber prices In 2015, the Group produced and processed 4.0 million cubic metres of sawn spruce and pine at a value of about NOK 2,500 million, including transport costs. Spruce and pine account for approximately equal portions of the round timber. Moelven does not own any forest, but buys all its timber from external suppliers. These suppliers are in turn dependent on functioning markets within an acceptable transport distance, as well as satisfactory price levels for both sawn timber and pulpwood. The cost of timber is by far the biggest single cost for the Group, and changes in timber prices have an immediate and substantial impact on margins. This involves both a price risk and a volume risk. The Group therefore focuses on entering into price agreements that as far as possible correlate timber prices with documented changes in the price of finished goods. Prices of chips and biomass The price of cellulose chips and biomass, which come from saw and planing production in Timber and Wood, is of great significance for the Group's revenues. Even though work is constantly going on to improve the utilisation of raw material, only about half of each log becomes industrial timber after passing through a sawmill. The remaining half is made up of bark, shavings, cellulose chips and biomass. Part of this is used for our own energy production, while the rest is sold to the particle board, bioenergy and paper industries. Since a change in the profit margin for these products has a direct influence on the Group's results, the distance to the customers and access to efficient logistics solutions for road and rail transport are of great importance. Electricity prices The price of electric power is another important factor that affects the Group's profitability. Through the Group's electricity suppliers an annual 185 GWh of electricity is purchased on Nasdaq OMX Commodities. According to the Group's finance policy, the need for electric power shall be secured against price fluctuations so as to ensure stability and predictability. The anticipated power requirement is hedged within stated maximum and minimum levels by trading futures on Nasdaq OMX with a 5 year maximum horizon. Interest rate risk The Group's net interest-bearing debt is subject to interest rate risk. The bulk of the debt in SEK, which is why interest rates in Sweden are most important for the development of the Group's interest expense. The Group companies will be financed with loans 10
11 from the parent company. All external borrowing is done by the parent company, which also makes hedging in accordance with financial policy. The hedging instruments that can be used are ordinary interest rate swaps, FRAs and composite swaps of types that are normally used for such purposes. The extent of hedging is measured in terms of the combined duration of outstanding debt and hedging arrangements. The combined duration shall be between 12 and 60 months. No interest rate hedging agreements shall be entered into over more than 10 years. Exchange rate risk About 15 per cent of the Group's operating revenues come from markets outside Scandinavia and carry exchange rate risks. Additionally, there is significant internal and external trade within the group with both raw materials and finished products between Sweden and Norway. The most important currency crosses are EUR/SEK, GBP/SEK, SEK/NOK and EUR/NOK. Moelven uses forward contracts to counteract large cash flow fluctuations as a result of variations in exchange rates. Because of the hedging strategy that has been chosen, changes must be long-term so as to have the full effect on the Group's profitability, and during the hedging period operational adaptations may be made to compensate for the external changes. During the hedging period, operational adaptations may be made to compensate for the external changes.. About half of the Group's total balance sheet is connected to activities in Sweden. The balance sheet figures will therefore be affected by the prevailing exchange rate between the Swedish and Norwegian kroner. The equity is partially hedged against this by financing the share investments in most of the Group's Swedish subsidiaries in Swedish krona. At the end of 2015, the total equity that is exposed to exchange rate risk amounted to SEK million (SEK million). Credit risk It is the Group's policy that credit sales over a certain size shall be secured in the form of either guarantees or credit insurance. In practice, credit insurance is used most. There are internal guidelines and follow-up routines for unsecured sales, which only occur when no other security is possible. Liquidity risk The Group's foreign capital financing consists of two long-term credit facilities with ceilings of NOK 1,350 million, which expires in June 2017, and NOK 225 million, which is due in full in September The loan agreements include normal default clauses with regard to equity, net equity value and debt ratio. As at 31 December 2015, the Group's key figures were better than the levels at which the default clauses are triggered. In addition to the long-term credit facilities, the Group also has available credit in its banking systems, amounting altogether to about NOK 312 million, which is renewed annually. Risk of damage and interruption to production The Group has a policy for industrial insurance that is centrally managed and which is followed by all companies. This policy gives guidelines for insurance cover, preventive measures, risk review and preparation of continuity plans. The continuity plans become key plans if a fire/damage should occur. The plans cover immediate efforts, disaster management and the ability to continue deliveries to customers. Through its industrial insurance, the Group is covered for financial loss exceeding NOK 3 million per individual claim. Risk of loss of reputation Moelven places great emphasis on maintaining a good reputation. This is measured regularly using a brand survey that is conducted by external partners. There is financial risk linked to any loss of Moelven's reputation. The reputation risk is not quantified. Openness is what characterises the way the Group relates outwardly to society and the media and inwardly to employees of the Group. This applies whether it concerns positive or negative circumstances for Moelven, in line with Moelven's brand platform. Risk of loss of environmental costs The activities of the Moelven Group follow the prevailing legislation and regulations with regard to emissions and waste management. The Group has made provisions in the accounts for all known obligations in connection with environmental protection. The purpose of the Group's environmental policies is to minimize the risk of negative impact on the natural environment and thus the potential environmental cost as well. 11
12 Sensitivity analysis Estimated change in operating Profit and profit per share for one per cent change in price Operating profit NOK Factor million Division Nok per share: 1% change +/- Saw log price - spruce and pine 25 Timber/Wood (30%) 0,19 Price of sawn timber, spruce 11 Timber/Wood (10%) 0,08 Price of sawn timber, pine 10 Timber/Wood (10%) 0,08 Price for chips, pulp/paper 5 Timber/Wood (25%) 0,04 Price of planed wood in Scandinavia 18 Wood 0,14 Price of std. Dimensions laminated timber 2 Building Systems 0,02 EMPLOYEES, HEALTH, SAFETY AND THE ENVIRONMENT For a detailed description of the HSE area, please refer to the Board's explanation of principles and practice concerning social responsibility pursuant to the Accounting Act Section 3-3c on page 22. EFFECT ON THE EXTERNAL ENVIRONMENT For a detailed description of how the group's activities impact the external environment, please refer to the Board's explanation of principles and practice concerning social responsibility pursuant to the Accounting Act Section 3-3c on page 22. INNOVATION Moelven's innovation focus is to engage in development and innovation linked to a specific application of a product or in a production process. Responsibility for is with corporate management. The innovation processes take place mainly within each business area, where the greatest competence exists. Where there are larger parts of Moelven that drive and benefit from an area of innovation, this takes place in joint projects. The group must facilitate innovation and provide resources, support and coordination. Research and development at Moelven takes place primarily at the project level, linked to commercial operations. Product innovation For the building module companies, the development of cost-effective concepts adapted to the market for modular buildings of several storeys has been a prerequisite for the operations as they are today. The functional and aesthetic aspects change continuously in accordance with the technological developments and market trends. In order to maintain the market position in current markets and develop further in other segments, focus on innovation and developing new solutions in essential. The newly-developed housing concept in Norway with accompanying specialization of the processes is a good example of this. The building interiors companies are aimed at a market where trends move rapidly. Product development and innovation are therefore a high priority and a continuous process. Glulam operations have for several years been at the forefront in the development of new products and technical solutions, and have both in own account and in cooperation with costumers completed several major innovation projects in recent years. The development of the hub technology forms the basis for glulam bridges and halls with large spans, as well as buildings with multiple storeys. 12
13 The new Mjøsa Bridge Source: The Norwegian Public Roads Administration At Moelven Wood product development is of great importance in order for the choice of products to both follow the shifting market trends and satisfy requirements toward quality and functionality. The goal is to offer customers the market's best, most diverse and most modern product range. Innovation work is divided into two main directions. One aims to develop modern products that contribute towards inspiration and new trends at the end-user. The other main direction aims to simplify work with the products at the building site. Examples of such solutions are preprocessed internal panels with concealed nails, various floor solutions, sheet products with reduced widths to ease handling, ready cut lengths, etc. Process innovation For the project part of the glulam business, the use of new technology to process individual elements in the load-bearing structures is a precondition to provide complex, high-quality systems. For the part of Glulam that is directed at the building products trade and for the processing units at Wood, the logistics systems are of great significance for reducing the cost and environmental effects of transport and for ensuring the customers' access to a wide range of products with short delivery times. Work on optimising the logistics systems is therefore continuous. For the sawlog-consuming units in Timber and Wood, it is primarily the optimisation of the production processes that is of key importance. The objective is to safeguard the values inherent in the raw material. The use of X-ray photography, camera sorting and mechanical strength sorting are tools that contribute to this. For the Module and Interior operations, the development and refinement of technical solutions for production, connection of technical installations and assembly at the building site have been important to operate profitable industrial production of modulebased building solutions, as well as to exploit the competitive advantage inherent in fast completion at the building site. CORPORATE GOVERNANCE Corporate governance at the Moelven Group is based on the Norwegian recommendations for corporate governance of October The Board's report on the Group's policies and practice for corporate governance in accordance with section 3-3b of the Norwegian Accounting Act has been incorporated into the report on corporate governance. For further information about the Board and senior executives, refer to note 28. ALLOCATION OF THE NET PROFIT/LOSS FOR THE YEAR The Board of Directors' dividend policy is based on Moelven's shareholders receiving a predictable and satisfactory cash return on their share investment. The policy provides guidelines for how much of the profit, or of distributable equity in years with a loss, shall be distributed as a dividend. The Group's net profit for 2015 was NOK million (88.4). The equity ratio is 36.8 per cent (34.2 per cent). The Group has adequate equity to disburse a dividend in accordance with the applicable dividend policy. Based on the 2015 result this amounts to NOK 0.45 per share. The normal seasonal variations in the Group's tied-up capital and equity ratio means that the Board asks the annual general meeting to delegate authority to pay dividends to the Board, with an upward limit of NOK 58,294,072. Distribution of dividends assumes that the company has sufficient capital and liquidity at the time the dividend is approved by the Board. The parent company Moelven Industrier ASA, which distributes a dividend for the Group, had a net loss of NOK 7.5 million for the year in 2015 after the receipt of group contributions and share dividends from subsidiaries. It is proposed that the negative net income and provision for dividend is covered by a transfer from retained earnings in its entirety. The company has sufficient 13
14 distributable equity and liquidity for the distribution of the dividend at the adjusted time for the decision on dividends. EVENTS AFTER THE BALANCE SHEET DATE No events have occurred after the balance sheet date that affects the accounts that have been presented. GOING CONCERN ASSUMPTION In accordance with the requirements in the Norwegian accounting legislation, the Board of Directors confirms that the prerequisites have been met for preparation of the accounts under the assumption that the Company will continue as a going concern and that the annual accounts have been prepared under this assumption. OUTLOOK While Norway is experiencing a situation where the downturn in the petroleum industry to a greater extent is making itself felt in relation to economic activity, other and less oil-dependent markets are in a different stage of their economic cycles. In Sweden activity levels are higher than in a long time, and the US economy is on the mend. The growth rate In China is decreasing, while the Middle East and North Africa are characterized by unrest and regulations from public authorities that complicate international trade. However, the underlying demand is good in the latter markets. We expect to see a positive change in international market prices for sawn timber in the first quarter. This particularly applies to core products and better qualities of spruce. For pine the situation remains challenging in some export markets, which may require that production is limited. The currency situation continues to contribute to maintain competitive ability in export markets, particularly in markets where trading is in EUR or USD. In Norway demand for processed products is expected to remain on a par with the previous year, albeit with regional differences. Building activity in and around the major cities, with the exception of south-west Norway, is expected to remain high. Competition from foreign players is declining due to the weak Norwegian currency. In Sweden changes in regulations related to the renovation and remodelling deduction may cause a certain drop-off in the renovation and remodelling market. However, the need for new homes remains great and contributes to drive activities in the new building market. Overall, the Swedish market is expected to maintain the same level as in Sawlog inventory at the start of the year are satisfactory with regard to planned production for the first six months. It is expected that there will be good access to sawn timber throughout the winter. For glulam the positive trend of choosing wood for load bearing structures looks set to continue in In both Norway and Sweden demand is good for module-based buildings for housing purposes. Demands toward short construction times are increasing. This applies equally to homes, schools, care facilities and not least refugee reception centres. The market for system interior fitting is experiencing a very high level of activity in Sweden, primarily in connection with Stockholm, Gothenburg and Malmø. The Norwegian market is declining, and capacity adjustments will be required. In both Norway and Sweden the renovation, conversion and extension market may see a certain increase in activities as a result of the need to remodel empty premises into refugee and asylum seeker reception centres. For the Group as a whole revenues are expected to increase somewhat. The programme for operational improvement and structuring of the group in line with the long-term strategy plan continues unabated and will contribute to improved profitability for the underlying operations. The Group's composition, with divisions that experience different impacts from economic fluctuations and units that operate in different markets, yet who are capable of realizing synergies across divisions, provides the Group with a good starting point for The result is expected to be somewhat better than for The group has a long-term goal of a return on capital employed of 13 per cent. To ensure that the Group has sufficient long-term access to liquidity in order to implement the restructuring and improvement projects required to reach this goal, the process to refinance the Group's long-term debt was initiated in January
15 Moelv 03 March 2016 The Board of Directors of Moelven Industrier ASA Olav Fjell Trond Stangeby Elisabeth Krokeide Chairman of the Board Deputy chair Mari Wilhelmsen Asbjørn Bjørnstad Martin Fauchald Lars Håkan Karlsson Morten Kristiansen CEO 15
16 Corporate governance Corporate governance at the Moelven Group is based on the current Norwegian recommendation for corporate governance of October The recommendation has not been changed in 2015, and is available in its entirety at The list below gives references to where the points required by section 3-3b of the Norwegian Accounting Act may be found. Requirements in accordance with section 3-3b of the Norwegian Accounting Act 1: A statement of the recommendation and regulations on corporate governance that the company is comprised of or otherwise chooses to follow. 2: Information about where the recommendations and regulations mentioned in No. 1 are publicly available. 3: Reasons for any deviations from the recommendations and regulations mentioned in No. 1. 4: A description of the main elements in the company's, and for accountants who prepare consolidated accounts also the group's, systems for internal control and risk management connected to the accounts reporting process. 5: Clauses in the articles of association that wholly or partly extend or deviate from the provisions of chapter 5 of the Public Limited Company Act. 6: Composition of the board, Corporate Assembly, supervisory council and audit committee, any working groups for these bodies, as well as a description of the main elements of prevailing instructions and guidelines for the work of these bodies and any working groups. 7: Clauses that regulate the appointment and replacement of board members. Reference to Report on corporate governance at Moelven 1: Introduction to the report Point 1. Report on corporate governance Point 1 Report on corporate governance: There are two deviations from the recommendations. These are described in Points 7 and 9. Point 10 Risk management and internal control No such clauses exist. The articles of association are published on and are also included in the notice of the annual general meeting as an attachment. Point 8 Corporate Assembly and board, composition and impartiality. Point 9 The work of the board Point 8 Corporate Assembly and board, composition and impartiality. 8: Clauses and authorities that enable the board to decide that the company shall buy back or issue own shares or capital certificates. Point 3 Share capital and dividends 1. Report on corporate governance In accordance with the Public Limited Company Act it is the board of the company that is responsible for ensuring the proper organisation of the business and administration of the company. Moelven has a number of independent legal entities that are organised as limited companies in several countries. In accordance with company law in the respective companies, the boards of these companies have a corresponding responsibility for the individual entity as the board of directors has for the parent company and the group as a whole. The groups activities are based on Scandinavian values. The basic values sustainability, reliability and using the opportunities that arise have become over time a natural part of the company culture. They also form the basis for the company's guidelines on social responsibility, ethics, anticorruption, HSE, employment conditions etc. A complete summary of the guidelines adopted by the board is given in point Business activities In accordance with the company's articles of association, the company's purpose is fabrication and activities that are associated with this, trade and other financial activities, as well as participation in other companies by means of share subscription and other means. The board emphasises long-term, sustainable development and lays down in the group's strategic plan that the main focus in future shall be the improvement and further development of existing activities. The 16
17 group has passed the critical size that is necessary to assert itself in competition. Quality shall be prioritised ahead of size and is an essential basis for both profitability and further growth. Both solidity and financing are satisfactory and give the necessary room for manoeuvre. The company's activities, objectives and main strategies are described in detail in the board's annual report. 3. Share capital and dividends At the end of 2015, equity in the parent company Moelven Industrier ASA was NOK million (NOK million). For the group as a whole, equity was NOK 1,756.9 million (NOK 1,592.3 million). The equity ratio was 36.8 per cent (34.2 per cent). The board's objective is a minimum of 40 per cent, a level that in the opinion of the board is appropriate in light of the economic fluctuations that have been seen in recent years. The board has adopted a dividend policy that is in line with the provisions of the shareholders' agreement between the company's six largest owners, who together represent 99.6 per cent of all shares. Given that considerations of the company's financial position and other sources of capital are satisfactorily safeguarded, the main rule of dividend policy is a cash dividend corresponding to 50 per cent of profit after tax, although a minimum of NOK 0.40 per share. The board is not authorised to perform capital increases or buy own shares. On 23 April 2015 the general meeting decided to delegate authority to disburse dividends to the Board. The Board's competence to disburse dividends was limited to NOK 51,816,952, assuming that the company had sufficient capital and liquidity at the time the dividend was to be approved by the Board. The authorization is valid until the next annual general meeting, but as the Board resolved to pay a dividend equivalent to the upper limit in December 2015, the authorization was used. The Board can therefore not resolve further distribution under this authorization. 4. Equal treatment of shareholders and transactions with related parties The share capital of Moelven Industrier ASA consists of 129,542,384 shares with a face value of NOK 5. The company owns 1,100 of its own shares. The company is not listed on the stock exchange. In total, the shares are distributed among approximately 940 shareholders. The six largest shareholders, Glommen Skog SA (29.1 per cent), Eidsiva Vekst AS (23.8 per cent), Felleskjøpet Agri SA (15.8 per cent), Viken Skog SA (11.9 per cent), Mjøsen Skog SA (11.7 per cent) and AT Skog SA (7.3 per cent) together control 99.6 per cent. Most of the remaining 0.4 per cent is owned by private individuals. A number of shareholders' agreements have been entered into between the six largest shareholders. Among other things, these determine that the company must be run as an independent unit with a long-term perspective and with continued focus on Scandinavia as the main market. The agreements also contain clauses regarding the composition of the board, dividend policy, strategic focus areas and share transfer. Transactions with the owners are performed in some areas of the ordinary activities. Among other things, this relates to purchase of timber, where the Norwegian forest owner cooperatives are suppliers. Of Moelven's total purchasing requirement of approximately four million m³ measured under bark, approximately 40 per cent comes from the Norwegian forest owner cooperatives that are also shareholders. The Moelven group also supplies biofuel to a bioenergy plant owned by Eidsiva Energi AS. Eidsiva Energi Marked AS trades electric power to Moelven's Norwegian industrial operations. All these transactions are performed in areas where there are observable market prices and the arm's length principle is applied. Where other suppliers can offer better prices or terms, these will be chosen. Moelven's supply of energy raw materials to Eidsiva's bioenergy plant represents between 60 and 70 GWh on an annual basis, while buying back energy represents between 20 and 30 GWh. Net delivery of energy raw materials is around 40 GWh. The extent of the sale of electrical power corresponds to about 40 per cent of Moelven's total consumption of 185 GWh. Moelven has a long tradition of running its operations in accordance with the laws and ethical guidelines of the industry with the opinion that competition is positive for all parties in industry. In order to ensure that this culture is maintained, ethical guidelines and guidelines for complying with legislation on competition have been devised. 5. Free marketability The articles of association do not place any form of limitation on trading in the company's shares. The shares may be freely traded to the extent that individual shareholders have not made undertakings to other shareholders. The shareholder's agreements contain clauses regarding first option and tag-along rights. Since the company is not listed and the six largest shareholders together own 99.6 per cent of the shares, there is little trading in shares. 6. Annual General Meeting The notice of the general meeting, the content of the notification and accessibility of documentation follow the requirements set by the Public Limited Company Act and the regulations on general meetings. Facilitation is made for the general meeting to be able to vote for every single candidate to be elected by the shareholders to the Corporate Assembly. The employees of the group hold their own election of employee representatives on the Corporate Assembly. The chairman of the board, the chairman of the Corporate Assembly and the auditor attend the general meeting. Traditionally, the chairman of the Corporate Assembly has been elected to chair the general meeting. The procedures for attending and voting by proxy are described in the notification. Since 99.6 per cent of the shares are controlled by the six largest shareholders, there has not be a need to prepare guidelines to ensure 17
18 an independent chair of the annual general meeting or to appoint a person who can vote for the shareholders as a proxy. 7. Nominating committee and compensation committee The annual general meeting annually elects a nominating committee consisting of four representatives of the shareholders and adopts guidelines for the nominating committee's work. The annual general meeting has adopted guidelines for the nomination committee that regulate the committee's composition and period of service. The members of the nominating committee must be independent of the company's board and senior executives, but the guidelines differ from NUES in that there is no requirement for the nominating committee to have at least one member who is not a member of the corporate assembly. The nominating committee keeps the corporate assembly informed of its work on a regular basis. It is thereby considered that sufficient facilitation is in place to allow shareholders to propose candidates to the nominating committee. The nominating committee submits the following proposals: - Proposal to the annual general meeting regarding the election of shareholder-elected members and deputy members to the Corporate Assembly and remuneration to the members and deputy members of the Corporate Assembly. - Proposal to the Corporate Assembly regarding the election of the chairman and deputy of the Corporate Assembly. to the Corporate Assembly regarding the election of the chairman and deputy of the Board of Directors. - Proposal to shareholder-elected members of the Corporate Assembly regarding election of shareholderelected members and deputy members to the Board of Directors. The proposals must include information about the candidates' expertise, capacity and impartiality. The guidelines for the nominating committee specify that the governing bodies must be composed based on an overall assessment of the company's need for expertise, capacity and balanced decisions that safeguard the interests of shareholders. The remuneration committee consists of the nominating committee, complemented by a representative designated by the employee-elected members of the Corporate Assembly. The remuneration committee submits a proposal to the annual general meeting on determining remuneration for the members of the Corporate Assembly and to the Corporate Assembly on determining remuneration for the Board of Directors. Remuneration to the Board and Corporate Assembly shall not be performance-based. 8. Corporate Assembly and board, composition and impartiality. The Corporate Assembly has 12 members, four of whom are elected among and by the employees. The company's six largest shareholders, who together control 99.6 per cent of the shares, are all represented in the Corporate Assembly. The members of the board of Moelven Industrier ASA are elected by the Corporate Assembly, normally for 1 year at a time. Four Corporate Assembly meetings are held annually. The board has seven members, five of them shareholderelected and two representatives of the employees. The employees also elect one deputy representative, who attends board meetings. The chair and deputy chair of the board are independent of the company's main shareholders and are appointed by the Corporate Assembly. One of the other four shareholder-elected board members is connected with the company's main shareholders. The shareholder's agreements include provisions relating to the election of the chair and shareholder-elected board members. The representatives of the employees are independent of the company's general management. No senior executives are members of the board. Two of the five shareholder-elected board members are women. The proportion of female employees in the group is 10.8 per cent (11.0). The rules on gender representation do not therefore apply to the employees' representatives. The composition of the board thereby satisfies the requirements regarding gender representation on the board. Apart from the employees' representatives on the board, only one board member receives remuneration other than directors' fees from the company. This amounts to NOK 50,000 and relates to winding up an appointment in France. Contact information for the board members is published on the company's website. Through the guidelines for the work of the nominating committee, which are described under point 7, the main shareholders are assured good knowledge of the board members' background and general competence. With the existing ownership structure, therefore, no further information is given. From experience, non-attendance at board meetings is exceptional. 9. The work of the board The board's administration of the company follows the provisions of the Public Limited Company Act. Instructions have been determined for the board of Moelven Industrier ASA that give guidelines for the board's work. Every meeting reviews the monthly reporting of operational developments, financial data and HSE statistics for the group. There is also the following schedule of work for every calendar year: January: Report for fourth quarter of preceding year. Review and evaluation of group guidelines and policies, including risk management and internal control. 18
19 March: Annual accounts with notes and annual report for preceding year. April: Report for first quarter and preparation for ordinary general meeting. June: Status reporting and strategic discussions. August: Report for first six months, recapitulation of strategic discussions with summary of ongoing strategic discussions throughout the year. October: Report for third quarter and strategy plan as finished document. December: Business plan and budget for the coming year. The chair of the board is independent of the company's main shareholders. The board has not addressed issues of a material nature in which the chair is or has been a party. According to the rules of procedure, the board members must not participate in the consideration or decision of issues that are of particular importance to themselves or to any related parties that must be considered to have major personal or financial interest in the matter. The same applies to the CEO. By related parties it is also understood companies in which the board member represents ownership interests. Self-evaluation of the work of the board is normally performed at the beginning of every year. The board uses committees as needed. Based on an assessment of risk conditions and the need for control, as well as ownership structure, it has been decided to deviate from the NUES recommendation and allow the complete board function as an audit committee. The board only determines remuneration for the President and CEO. Remuneration for the remainder of management is determined by the President and CEO in line with guidelines adopted by the board. There are no option programmes or share-based payments for senior executives. The task of the board in respect of compensation is therefore limited and no separate compensation committee has been set up in the board. In addition to board members, the CEO, CFO and board secretary normally also attend normal board meetings. Other representatives of the administration, the divisions or auditor attend as needed. The board has determined instructions for the work of the CEO. Group management consists of the CEO and the managing director of each division. Group management and the directors of the group's shared services attend group management meetings. For more information about governing bodies and group management, refer to the notes to the annual accounts. 10. Risk management and internal control All units within the group have individual, local profit responsibility and operate as independent parts of a coordinated network that is characterised by openness and cooperation. Risk management and internal control are tailored for the organisational model. The local company management and the boards of the individual companies follow up on risk management and internal control in accordance with prevailing laws and regulations. There are also control functions at divisional and group level, as well as in individual companies where the nature of the business leads to increased risk of faults, non-compliance or irregularities. Because of the scope of activities, it has been decided to limit reporting to the board to a focus on group, divisions and competitive arenas, as well as selected key figures and non-compliance reporting by unit. In connection with annual strategy and budget activities, the board reviews the group's most important risk areas. If needed, and based on the annual risk assessment, the group's reporting and control routines are adapted so that identified risks can be satisfactorily covered. In addition to established internal rules and routines, the internal control is largely based on the internal control environment. This environment includes people at all levels of the company. It covers integrity, ethical values, competence, management philosophy, form of operation, organisational structure, distribution of responsibility and authority and personnel policy. The board and management place great emphasis on communicating the established basic position to risk management out in the organisation. All units close their accounts monthly and report to the parent company on the third working day of the following month. Reporting occurs in accordance with standardised systems and common guidelines so as to ensure consistency and the greatest possible comparability right across all units. An important control measure that follows naturally from the management and organisational model is the monthly benchmark and consolidated data report from the group to the reporting units. The same monthly report that is sent to the board is also sent back to company management in each individual company. In this way, many are involved in control and follow-up of management and governing data. The reporting cycle supports the feeling of responsibility, not just for the results of one's own unit, but also for the divisions and group as a whole. The board considers that this reporting and control environment gives satisfactory control of the business. The board has reviewed and approved the following general guidelines: Instructions to the board and general manager of Moelven Industrier ASA Moelven's finance policy Moelven's dividend policy Moelven's guidelines for compliance with competition law Moelven's insurance and risk strategy - general insurance Moelven's environmental policy Moelven's policy for social responsibility 19
20 The Board is also informed of the group's other guidelines, which combined with the guidelines adopted by the Board, comprise the basis for the Group's code of conduct: Moelven's brand platform HSE manual Staff regulations Policy for an open company culture Policy on alcohol and drugs Data discipline instructions Policy for social media Brand and communication strategy Guidelines for transfer pricing between companies Dealing with internal irregularities 11. Remuneration to the board Remuneration to the board is decided annually by the Corporate Assembly. The remuneration to board members is a fixed amount that is determined in advance and is independent of profits. No option or share based remuneration is used and neither are there any other incentive schemes. For further information about directors' fees and any remuneration other than fees to board members, refer to the notes to the accounts. 12. Remuneration to senior executives The board determines the CEO's salary. There are no option or share based payments. Principles and ceilings have been determined for profits-related payment within the group. Among other things, it has been determined that agreements of profits-related remuneration shall have a duration of a maximum of one year at a time and that such remuneration shall have an upper ceiling. The board's declaration on management salaries, including guidelines for determining remuneration to senior executives, is presented to the annual general meeting as a separate document. The annual general meeting adopts each of the guidelines separately. For further information about remuneration to group management, refer to the notes to the annual accounts. 13. Information and communication The board determines the group's financial calendar annually; this is published in the annual report and on the company's website. The group's quarterly and annual reports are primarily published on the internet, but are also sent by post on request. The board has established a practice of organising annual owners' meetings so as to create an arena for the exchange of information and discussion between the owners. It has not been found necessary to establish guidelines for these. 14. Company takeover The company is not listed and there is a shareholders' agreement between the six largest shareholders, who together own 99.6 per cent of the shares, that regulates the transfer of shares, among other things. No guidelines have therefore been prepared for the board in connection with any takeover bid. 15. Auditor The auditor has annual meetings with the board without administration being present. The auditor also participates in board meetings when the annual accounts are discussed. The auditor also presents the audit plan, summaries following interim audits of the subsidiaries and central risk areas and the group's handling of these. Remuneration to the auditor, expressed as statutory audit and other services, appears in a separate note to the annual accounts. 20
21 Moelv 03 March 2016 The Board of Directors of Moelven Industrier ASA Olav Fjell Trond Stangeby Elisabeth Krokeide Chairman of the Board Deputy chair Mari Wilhelmsen Asbjørn Bjørnstad Martin Fauchald Lars Håkan Karlsson Morten Kristiansen CEO 21
22 SOCIAL RESPONSIBILITY Moelven defines social responsibility as the company's integration of social and environmental considerations in its day-to-day operations on a voluntary basis, beyond compliance with existing statutes and regulations in the country in which one operates. The Moelven Group operates a wide range of undertakings in several countries and in many local communities. The Group companies are often cornerstone companies, which in addition to creating value for our owners, often create significant value for the local community as employer, taxpayer and buyer of local goods and services. The Group therefore plays a responsible role in helping to create vigorous businesses, rural communities, towns and regions. Core values Moelven's core values, which are the foremost management tool to coordinate activities, also provide guidelines for how the Group shall contribute towards positive social development: Sustainability Moelven has respect for both people and the environment. We base our activities on renewable resources and have turned sustainability and the long-term view into our competitive advantage. We have a strong desire to take responsibility for our environment. Reliable You can trust Moelven. We deliver on time and with the right quality. There is a strong focus on openness and honesty being able to admit to weaknesses and mistakes is the basis for progress and trust. Seeking opportunities Moelven seeks solutions. The Group has the ability and resources to be a leader in product development and creativity. We wish to always be a leading company and to make use of the opportunities we are given over time. Guidelines for employees of the Moelven Group Moelven has drawn up several central guidelines that apply to all employees of the Group, to hired workers and to those who act on behalf of the Group, for example board members. Individuals are themselves responsible for familiarizing themselves with the guidelines and statutes that apply to their areas of work. The line manager is responsible for communicating the guidelines and ensuring compliance with them. As a supplement to Moelven's guidelines, special guidelines may be stipulated or special statutes may apply to certain parts of the operations. In addition there may be rules for professional conduct for some professions that relevant employees may have to abide by. The Group's most important central guidelines and policy documents related to social responsibility are: HSE Handbook Environmental policy Insurance and risk strategy - general insurance Work regulations Policy for an open company culture Dealing with internal irregularities Policy on alcohol and drugs Data discipline instructions Policy for social media Legislation on competition in a Moelven context Guidelines for transfer pricing between companies Policy for social responsibility The documents are available in their entirety on Moelven's intranet. They additionally also form the basis of the group's ethical guidelines. Several of the guidelines are aimed at issues that should not occur, for example irregularities or breaches of competition law. In these cases the guidelines are also a description of procedures that must be followed when such incidents nevertheless arise. Senior executives have the guidelines as a part of their employment contract. Apart from this, no specific control procedures have been implemented for such guidelines beyond communicating them in the organization. For guidelines that are linked to areas where there are statutory requirements and regulations from public authorities, control of compliance is primarily by way of mandatory reporting to the authorities. One examples of such reporting is environmental reporting in connection with impregnation activities, waste handling, emissions, dust and noise. A final main category of guidelines is where the Group has separate targets and where reporting and control procedures have been established to monitor achievement of targets. One example of this is the HSE area. In the following chapters the main areas concerning social responsibility and the Moelven Group's approach to these are described. Compliance with existing statutes and regulations must be a matter of course for everyone at Moelven, and in the description of measures for implementing social responsibility in day-to-day operations focus is therefore on measures related to social responsibility beyond what is statutory. Where relevant, excerpts from applicable Group policy on the area are included. 22
23 Human resources, employee rights and social conditions Openness Openness characterizes Moelven's corporate culture and is a part of the Group's identity. Openness creates a culture that ensures well though-out choices and good solutions for the business, our employees and the communities in which we operate. Human resources ideal The Group's human resources ideal is to "Provide opportunities for people with the drive to succeed". This ideal establishes guidelines for the Group's objectives in terms of which persons are recruited, what expertise is demanded, what pay and working conditions are offered, how new employees are introduced, what development and career opportunities are offered and how downsizing is handled. Recruitment and personal development Moelven acts strategically in both internal and external recruitment. Competent employees are vital to the Group's competitive ability and it is important for Moelven to emerge as an attractive employer. Moelven focuses on long-term employment relationships and strives to offer its employees the opportunity to develop in their jobs. Motivated and competent employees are encouraged to take their personal development further, including through internal management programmes. Employee representation and committees Moelven views trade unions as important partners, and there is therefore a stable and open dialogue between the company and the employee representatives. Moelven has employee representatives on both the Group board, the parent company's corporate assembly and subsidiary company boards in compliance with national legislation and regulations related to employee participation and representation in governing bodies. Additionally the master agreement / collective agreement between the employee and employer organizations in both Norway and Sweden regulate matters concerning information, cooperation and employee participation. The agreements support the parties' desire and requirement that employee participation through cooperation should give employees the opportunity to contribute with their experience and insights to establish financial conditions for the company's continued development, through secure and good employment relationships to the benefit of both the company and the employees. Beyond the master agreements, cooperation is regulated through accords and collective agreements for the individual disciplines within the Group. In accordance with the master agreement between LO and NHO, Moelven has established a group committee for employee representatives. Together with a corresponding committee for Swedish subsidiaries, Samarbetskommittén, this group constitutes a good partner in discussion with group and division management. Pursuant to the Master Agreement between LO NHO and the Swedish act relating to European Enterprise Committees, a European Working Committee has been established between the parties in Moelven. This agreement has been entered into to cover relevant dialogue, regular information and consultation at the European level. At the individual units in Moelven working environment committees have been established with a basis in legislation and master agreements/collective agreements. Cooperation with the employees and employee committees works well, and no special measures have been implemented to strengthen this in Working environment training Moelven annually organizes its own courses in Better Working Environment (BAM). The courses provide basic training in handling health, safety and environment issues, and cover the requirements toward HSE training for both executives, safety representatives and members of working environment committees. Besides employees with mandatory requirements for such training, the course is open to anyone who works with and/or wants to know more about HSE work. Absence due to illness The Group's long-term goal is absence due to illness of maximum 4 per cent for the entire Group. In 2015 combined absence due to illness was stable at 5.5 per cent. A high rate of absence due to illness is not compatible with Moelven's values. A reduction in and stabilisation of absence at a low level is thus a priority. In the past year short-term absence has remained stable at the same level as Long-term absence has increased somewhat in Norway, and dropped somewhat in Sweden. 23
24 The Group's companies report monthly key figures for absence due to illness to the Group, and the information is included in the Group's reports. Work to reduce absence due to illness is mainly related to three primary areas: close follow-up of the employee who is ill, well-being and health-promoting measures of a preventive nature, as well as emphasis on the HSE aspect in the case of investment in new production equipment. Follow-up of employees takes place in accordance with applicable rules in those countries in which the Group operates. There is much emphasis on maintaining dialogue with employees on sick leave with a view to making the absence period as short as possible. In addition, Moelven's health insurance also functions well as an HSE measure to get those employees who need health services and treatment back to work faster. The health insurance scheme has been a successful measure from the start in The scheme has proven to be particularly favourable for employees with muscular-skeletal disorders. Safety for employees The Group's goal is that no one is injured when at work at Moelven. A safe working environment for employees, hired staff, customers and suppliers is essential for sustainable added value. Operations should therefore be organized such that it may take place without risk to life and health. In the target of 0 injuries there is an idea that all injuries can be prevented. Work to prevent injuries therefore has a high priority in the entire organization. The campaign Hel Hjem II (Home in One Piece II) commenced in 2014 and continued in Here employee involvement/commitment and management focus have been central instruments. To reduce the number of injuries, it is important to improve the knowledge of both near accidents and hazardous conditions or risks. In 2015 there were 88 injuries with subsequent absence, which is an increase from 86 in In 2015 a total of 410 (314) accidents, 270 (247) incidents and 360 (341) dangerous conditions related to persons were recorded. The injury rate remains unacceptably high, and efforts to achieve the objective of 0 injuries was therefore intensified in 2015, including through the establishment of a safety committee comprising the corporate management and employee representatives and a HSE forum where the divisions' HSE resources and the HR department discuss corporate-wide HSE issues and exchange experience. Moelven's system for recording accidents, incidents and dangerous conditions, fportal, was deployed in the group in In December 2015 the group launched an upgraded version of fportal, which enables reporting via a smartphone and tablet app, for easier access for all employees. The number of injuries with absence per million worked hours (Injury rate LTI) was marginally reduced in 2015, while the number of days of absence due to injury per million worked hours (Severity rate - F) dropped significantly in the past year. Although the severity rate has dropped significantly, the levels for both injury rate and severity remain unacceptably high. This is shown in the below figure. The figure above shows the relation between reported hazards and incidents, and the level of injury frequency and severity. Regular risk analyses are conducted at all plants. Investments and measures have brought factories up to speed in terms of applicable safety regulations. Safety procedures and equipment are in place, and information and conduct campaigns have been organized. 24
25 Despite increased focus on safety and not least on attitudes toward safety at the workplace, one has not succeeded in reducing the number of injuries. However, developments in reported near accidents and hazards indicate that the ongoing HSE work has succeeded in raising awareness on safety at the workplace and provides a good basis for planning further work. In the autumn of 2015 the safety campaign Hel Hjem II was evaluated, and more new measures will be implemented in the time ahead to achieve the group's objectives. These included courses and follow-up for supervisors, clarification of responsibilities and dedicated HSE resources in each division. Human rights Moelven does not accept conditions in suppliers' or customers' operations that constitute breaches of the UN declaration of human rights or other unethical conditions such as for example child labour. Discrimination Within the activities of the Moelven Group, there shall not be any differential treatment on account of gender, ethnic origin, national origin, descent, skin colour, language, religion, philosophy or sexual orientation. Job descriptions, areas of responsibility, expertise and work effort form the basis for determining pay, promotion and recruitment. A need to implement measures to eliminate discrimination has not been registered in Equality of opportunity The combined share of women in the Moelven Group has been stable in recent years at approx. 11 per cent. It is a goal for the Group to further increase the share of women among staff further. However, most of those who complete education in the trades and professions the Group needs in its industrial activities are men. Often, when jobs are advertised, no women apply. For officers and managers the situation is different, and the share of women in areas such as economy, administration and management is significantly higher than for operators in the industrial activities. Child labour The Moelven Group's units operate their activities in geographical areas where child labour very rarely occurs. In relation to our own production activities no control procedures have therefore been established on the area. Certain units purchase raw materials for their production from continents where child labour may be a relevant issue. In such cases factory visits where the surveying of possible child labour is included as one of the control items. A need to implement further measures has not been registered in Working conditions All hired workers regardless of nationality, are salaried in accordance with a centrally agreed agreement/tariff agreement. The Group also follows the provisions of the EU's staffing directive. The level of minimum wages in the agreements that are used are such that they in themselves are a guarantee against social dumping. In those cases where Moelven has subcontractors/contractors in deliveries, it is contractually stipulated that these are obliged to pay salaries at least equivalent to the applicable tariff agreement for the relevant industry. A need to implement further measures in the area has not been registered in

26 External environment Sustainability is one of Moelven's basic values. Environmental considerations are a natural part of day-to-day work and work is constantly going on to reduce effects on the environment. Moelven takes responsibility for the environment through sustainable and long-term exploitation of renewable resources. Responsibility for the environment also includes past influence from activities on the ground, water, air and/or surroundings from watering, heating, transport, the depositing of bark, handling of oils, adhesives and chemicals, as well as activities producing noise and dust. Industrial production is largely based on the use of wood and the wood content of the finished products is very high in most operations. Wood as a material has many positive environmental aspects, including that it binds carbon dioxide. The vast majority of the forest raw materials that are used in Moelven's production end up as products or biofuel. The Group therefore produces little waste. The aim is that all fractions of wood shall be treated as potential input factors and contribute to overall value creation. Cellulose chips, dry chips, shavings and bark from the sawmills have ever increasing financial and environmental significance. District heating systems use dry chips, shavings and bark as fuel and the Group's own heating systems use chips and bark. For those companies in the Group that make less use of forest raw materials in their production, the industrialised building process helps to limit the environmental impact in comparison with traditional building methods. The carbon cycle The trees in the forest capture carbon dioxide from the air, the through the process of photosynthesis, carbon is stored in the tree until it is burned or decomposes biologically. Carbon dioxide then returns to the atmosphere and may once more be captured by the growing forest. Source: Treteknisk. Raw materials from responsible forestry All of the companies in the Group's timber processing operations are organized for and work to meet applicable requirements for PEFC (Programme for the Endorsement of Forest Certification) and FSC (Forest Stewardship Council) traceability and Controlled Wood standard. This means that Moelven buys round timber from suppliers who engage in responsible forestry. Through this certification, Moelven has established control routines and a tracing system that can trace the raw materials up the supply chain. The exploitation of raw materials must be maximized through optimizing production and utilizing the residual products Raw material purchases must not occur from: o Illegal harvests. o Forests with a high preservation value. o Forests where time-honoured or social rights are violated. o Forests with genetically manipulated trees. o Natural forests that have been harvested with the intention of using the area for plantations or non-forestry applications. Suppliers who fail to comply with the International Labour Organization's core conventions. o 26
27 Environmental standards and certifications related to operations The Moelven Group operates within sectors and product areas where a number of different environmental standards exist, and where new ones are constantly introduced. It is both Moelven's desire based on its own values and an increasing demand from the market that these standards are followed. Examples of relevant standards and certifications are: FDV documentation. Life cycle assessments (LCA) Environmental declarations (EDP) BREEAM (Environmental classification of buildings) ISO certifications CE certifications Moelven continually works at all times to provide the correct and relevant documentation for all products and in being at the forefront of developments in terms of environmental requirements toward the products. Transport Moelven strives to ensure that the negative impact on the environment from heavy transport to and from our plants is minimized by using environmentally classified trucks. Minimum EURO-5 and EURO-6 will now be standard on all new trucks, and we will also to the greatest possible degree use transporters who strive for an environmentally friendly driving pattern. In the course of the past year the Group has initiated several transport optimization projects to better exploit the vehicle fleet. Through a combination solution for the transport finished goods and by-products, driving without cargo has been significantly reduced. The Group has also taken ownership of a transport company to ensure that this process gains full effect. Obtaining raw materials, intermediate transport and delivery of finished products all generate a considerable need for transport. In 2015, Timber and Wood transported more than nine million cubic metres of sawlogs, biomass and finished products by truck. In addition to this, there is transport for the laminated timber, building module and interiors companies, as well as rail and sea transport. Transport is therefore a considerable challenge for the Group, in terms of both the environment and finance. Moelven is continuously working to reduce transport needs and optimise the utilisation of means of transport. The geographical location, with the production units near the raw material areas, helps to reduce transport needs in that the volume of finished goods transported out is considerably less than that of the raw materials transported in. Influencing transporters to use eco-friendly means of transport is another important way of reducing the effects of transport on the environment. In the collaboration agreements with providers of transport services in both Norway and Sweden, requirements that the vehicles are at least classified in accordance with the EURO-5 standard have been included. Improved road standards, and thus increased axle load limits, are measures on the part of the authorities that will help to reduce the environmental effects of road transport. Work is also being done to open a greater road network in Norway for the use of metre heavy goods vehicles with a total weight of 60 tons for finished products and by-products. This contributes to reduce the number of loads driven and thus has a positive environmental effect. In 2015 the Group has also increased the use of railway to transport chips and energy products in both Norway and Sweden. The Group's work on optimising its transport will continue in 2016, and the goal is fewer kilometres driven without cargo. Additionally, work is being done to develop railway solutions where this is financially and practically viable. Energy At least 95 per cent of the energy requirements for heating premises and drying, must be retrieved from self-produced bioenergy. Moelven must actively participate in the technological and market-related development of the bioenergy sector. Moelven's energy and heating consumption in 2015 was approx GWh, across approx. 215 GWh electric power, approx. 845 GWh thermal energy and 3.5 million litres of diesel for rolling stock. About 90 per cent of the thermal energy was produced in the Group's own plants. The energy potential of the Group's chip and bark products, including cellulose chips, is a little under 5 TWh, which means that it has a considerable potential, both for increasing our own energy production and also for increasing the market for bioenergy in general. It is Moelven's aim to be able to use our own bioenergy to cover at least 95 per cent of the need for heating our own premises and drying timber products. Moelven takes an active part in the technological and market-related development of the bioenergy sector. In parallel with this, we are developing a growing external market for biofuels. Moelven's own energy efficiency activities mean that we increasingly have eco-friendly energy surpluses that can be sold to others and help strengthen our competitive position. Emissions to air Moelven has prepared CO 2 accounts since This is based on the ISO standard for calculating emissions from Moelven's units. In 2015 Moelven's production and service units generated about 432 tons of CO2. About 86 per cent of this represents CO 2 in the natural circulation of carbon. The combined emissions have increased by 3.5 per cent compared to 2014, which is related to increased activity. 27
28 CO2 emission Emission CO2 emission (tonn) type Fossil/bio (tonn) Percentage Percentage Direct Indirect Fossil Fossil ,73 % 10,33 % ,70 % 10,50 % Bio Bio ,57 % 3,37 % ,30 % 3,50 % Total ,00 % ,0 % Chemicals, oils, adhesives Moelven aims to minimize the effect on ground and water by using environmentally friendly products to the greatest possible extent. The handling of chemicals, oils and adhesives must only take place at designated places with approved enclosure or similar installations to reduce the impact of eventual spills. For waste oil and chemicals there are recycling systems with approved recycling centres or reception facilities. All units that use chemicals in their operations must have an summary of these. The summary must include an accurate description of the chemicals in question, which amounts that are used, which persons that are exposed, etc. No conditions have been revealed in 2015 that require remedial measures in the area. Watering and runoff Moelven aims to recycle wastewater from timber storage as far as this is technically and practically possible. Watering systems at the timber warehouses must be climate-controlled. There must only be withdrawals of water from lakes and river, as well as runoff to surface following permission from the authorities. No conditions have been revealed in 2015 that require remedial measures in the area. Pollution to ground In connection with restructuring, modification or liquidation, potentially polluted areas at the plants must be identified, investigated and remedied as required. All objects classified by the authorities as potentially polluted must be identified. Based on risk classification and existing information, an action plan must be drawn up for any investigation and remedial measures. No conditions have been revealed in 2015 that require remedial measures in the area. Landfills It must be ensured that any depositing of bark and other waste takes place at only approved landfills. It must be possible to document that any landfills comply with applicable statutes and regulations concerning covering, control programmes, handling of runoff, plans for termination and modification. No conditions have been revealed in 2015 that require remedial measures in the area. Waste handling Moelven sorts and recycles waste as far as technically possible and annually follows up waste volumes per ton of final product. The share of waste in approved landfills must be minimized in accordance with results from registration and the action plan for the waste system. Sorting at the source is practised at all units, and contracts on required return schemes have been drawn up with suppliers. No conditions have been revealed in 2015 that require remedial measures in the area. Dust and noise Moelven must implement measures to adapt noise levels and dust formation at plants in accordance with the targets at the respective plants. The main noise sources related to Moelven's activities are the handling of timber, the operation of fan systems and transport. When needs are identified, measures are implemented to reduce noise to stipulated threshold values. No conditions have been revealed in 2015 that require remedial measures in the area. Anti-corruption Employees of Moelven must neither accept nor provide gifts or bribes that tarnish integrity. The Group dissociates itself from all forms of corruption and improper actions that impede free competition and market balance. In the Group's business activities we must always maintain a healthy ethical and moral profile towards associates, customers, suppliers and other business associates. Moelven's code of conduct and Moelven's relation to competition law has been presented and discussed at meetings for both general managers in the Group and for finance managers. Moelven's compilation of ethical guidelines has been made available to employees. No separate control procedures have been established beyond this. 28
29 Moelv 03 March 2016 The Board of Directors of Moelven Industrier ASA Olav Fjell Trond Stangeby Elisabeth Krokeide Chairman of the Board Deputy chair Mari Wilhelmsen Asbjørn Bjørnstad Martin Fauchald Lars Håkan Karlsson Morten Kristiansen CEO 29
30 FINANCIAL KEY FIGURES Amounts in NOK million Explanation RESULTS Operating revenues 9 690, , , , ,9 Gross operating profit (EBITDA) 553,9 490,0 226,9 267,8 238,8 Depreciation and impairment 339,1 286,5 271,6 250,9 225,9 Operating profit 214,8 203,6-44,7 16,9 12,9 Net interest and financial items -56,3-88,2-72,4-81,2-125,4 Profit before tax 158,5 115,3-117,1-64,3-112,4 Net profit 117,0 88,4-92,6-36,2-85,8 BALANCE SHEET Investments in production equipment A 215,8 195,1 351,2 339,4 386,6 Total assets 4 778, , , , ,9 Equity 1 756, , , , ,0 Net interest-bearing liabilities 1 110, , , , ,9 Capital employed B 2 870, , , , ,1 EARNINGS/RETURN Net operating margin C 2,2 % 2,3 % -0,6 % 0,2 % 0,2 % Gross operating margin D 5,7 % 5,6 % 2,8 % 3,3 % 3,0 % Return on equity E 7,0 % 3,8 % -6,1 % -2,3 % -5,2 % Return on capital employed F 7,4 % 6,8 % -1,5 % 0,5 % 0,5 % Return on total assets G 4,6 % 4,4 % -0,6 % 0,2 % 0,3 % Interest cover H 2,3 1,9-0,1 0,2 0,2 CAPITAL STRUCTURE Equity ratio I 36,8 % 34,2 % 33,4 % 35,5 % 35,6 % Asset turnover J 2,1 1,9 1,8 1,9 1,9 Debt-equity ratio K 0,63 0,85 0,97 0,78 0,70 Net interest bearing debt / EBITDA 2,00 2,76 6,50 4,52 4,54 LIQUIDITY Liquid ratio I L 1,59 1,56 1,68 1,74 1,85 Liquid ratio II M 0,68 0,60 0,70 0,70 0,75 Cash flow from operational activities N 584,6 351,5 86,2 183,5 264,6 SHARES Profit per share in NOK O 0,91 0,68-0,70-0,28-0,64 Average number of shares (mill) 129,5 129,5 129,5 129,5 129,5 Cash flow from operational activities, in NOK per share P 4,51 2,71 0,67 1,49 2,04 Equity per share Q 13,56 12,29 11,72 11,92 11,88 Assessment value in NOK as at ,06 12,28 13,22 12,72 13,98 Dividend per share in NOK R 0,00 0,40 0,00 0,00 0,00 PERSONNEL Number of employees as at Sick leave percentage S 5,5 % 5,5 % 5,3 % 5,4 % 5,2 % Frequency of accidents with absence, H1 value T 15,7 15,9 16, ,4 30
31 Consolidated accounts Income statement for the group Amounts in NOK million Note Sales revenue 6, , ,8 Other operating revenues 47,5 69,4 Operating revenues 9 690, ,2 Product expenses 6 163, ,5 Changes in inventory raw materials, goods under manufacture and finished goods 43,7-237,4 Payroll expenses , ,6 Depreciation on tangible and intangible fixed assets 8, ,2 286,5 Impairment on fixed assets 8, 10 47,9 0,0 Other operating expenses ,9 929,5 Operating expenses 9 475, ,6 Operating profit 214,8 203,6 Income from associates 16 0,0 0,0 Value increase of financial instruments to fair value 11,1 16,4 Other financial income 12 51,2 28,2 Value reduction of financial instruments to fair value -5,5-46,8 Other financial costs ,0-86,0 Net financial items -56,3-88,2 Profit before tax 158,5 115,3 Income tax 13 41,5 27,0 Net profit 117,0 88,4 Profit assigned to: Non-controlling interests -0,5 0,0 Owners of parent company 117,6 88,4 Annual profit transferred to/from other equity 117,0 88,4 Total allocation 117,0 88,4 Earnings per share (in NOK) Earnings per share assigned to Moelven's shareholders 21 0,91 0,68 Statement of comprehensive income Amounts in NOK million Note Net profit 117,0 88,4 Other comprehensive income Items that are not reclassified subsequently to profit or loss Actuarial gains (losses) on defined-benefit pension schemes 23 50,0-40,0 Income tax on items that are not reclassified to profit or loss 13-12,5 10,8 37,5-29,2 Items that may be reclassified subsequently to profit or loss Translation differences 61,7 12,3 Proportion of other income and costs in associated companies 16 0,0 0,0 Other changes 0,1-1,2 Income tax on items that may be reclassified to profit or loss 13 0,0 0,0 61,8 11,1 Other comprehensive income, net of tax 99,3-18,1 Total comprehensive income for the period 216,4 70,3 Comprehensive income assigned to: Owners of parent company 216,9 70,3 Non-controlling interests -0,5 0 31
32 Consolidated statement of financial position Amounts in NOK million Note ASSETS Deferred tax assets 14 10,6 11,4 Goodwill 10 16,9 16,9 Other intangible assets 10 8,0 12,9 Total intangible assets 35,5 41,2 Land 100,4 96,0 Buildings and other property 426,6 443,9 Machinery and plant 1 199, ,4 Fixtures and fittings, tools, office machinery etc. 39,2 37,2 Total tangible fixed assets , ,5 Investments in associated companies 16 3,3 2,6 Investments in other shares 15 1,4 1,3 Bonds and other receivables 1,7 0,3 Net pension funds 23 2,5 3,3 Total financial fixed assets 8,9 7,6 Total fixed assets 1 809, ,3 Inventory , ,9 Accounts receivable 18, , ,0 Other receivables ,7 200,1 Total receivables 1 433, ,1 Financial derivatives 26 4,5 6,6 Bank deposits, cash etc. 20 3,6 14,4 Total current assets 2 968, ,0 Total assets 4 778, ,2 32
33 Amounts in NOK million Note LIABILITIES AND EQUITY Share capital ,7 647,7 Own shares 0,0 0,0 Share premium reserve 180,7 180,7 Retained earnings 917,4 752,5 Total equity assigned to owners of parent company 1 745, ,9 Non-controlling interests 11,1 11,4 Total equity 1 756, ,3 Pension liabilities 23 24,8 125,2 Deferred tax 14 69,5 49,8 Other provisions 17,6 14,8 Total provisions 111,9 189,8 Liabilities to credit institutions , ,7 Other long term liabilities 5 43,9 29,6 Total long term liabilities 1 046, ,2 Liabilities to credit institutions 5 79,7 144,3 Financial derivatives 26 93,7 101,4 Accounts payable 555,2 516,8 Public duties payable 173,5 157,2 Tax payable 22,6 0,4 Other short term liabilities 19, ,1 875,7 Total short term liabilities 1 863, ,8 Total liabilities 3 021, ,9 Total equity and liabilities 4 778, ,2 Guarantees 24 23,9 12,5 Mortgages 5 5,5 10,0 Number of shares (Face value per share NOK 5.-) Moelv, 3. mars 2016 Moelven Industrier ASA Olav Fjell Trond Stangeby Elisabeth Krokeide Chairman of the Board Deputy chair Mari Wilhelmsen Asbjørn Bjørnstad Martin Fauchald Lars Håkan Karlsson Morten Kristiansen CEO 33
34 Consolidated statement of changes in equity Equity assigned to owners of parent company Share Share premium Own Other Noncontrolling Total Amounts in NOK million capital funds shares equity Total interests equity Total as at ,7 180,7 0,0 682, ,6 7, ,2 Comprehensive income for the period Net profit 0,0 0,0 0,0 88,4 88,4 0,0 88,4 Other comprehensive income Translation differences 0,0 0,0 0,0 12,3 12,3 0,0 12,3 Other changes 0,0 0,0 0,0-1,2-1,2 3,8 2,6 Actuarial gains (losses) on defined-benefit pension schemes 0,0 0,0 0,0-40,0-40,0 0,0-40,0 Income tax on other comprehensive income 0,0 0,0 0,0 10,8 10,8 0,0 10,8 Other comprehensive income (net of tax) 0,0 0,0 0,0-18,1-18,1 3,8-14,2 Transactions with owners, entered directly against equity Purchase of non-controlling interests 0,0 0,0 0,0 0,0 0,0 0,0 0,0 Effect of acquisition 0,0 0,0 0,0 0,0 0,0 0,0 0,0 Dividend to owners 0,0 0,0 0,0 0,0 0,0 0,0 0,0 Share based payment transactions 0,0 0,0 0,0 0,0 0,0 0,0 0,0 Total transactions with owners 0,0 0,0 0,0 0,0 0,0 0,0 0,0 Total as at ,7 180,7 0,0 752, ,0 11, ,3 Total as at ,7 180,7 0,0 752, ,0 11, ,3 Comprehensive income for the period Net profit 0,0 0,0 0,0 117,6 117,6-0,5 117,0 Other comprehensive income Translation differences 0,0 0,0 0,0 61,5 61,5 0,2 61,7 Other changes 0,0 0,0 0,0 0,1 0,1 0,0 0,1 Actuarial gains (losses) on defined-benefit pension schemes 0,0 0,0 0,0 50,0 50,0 0,0 50,0 Income tax on other comprehensive income 0,0 0,0 0,0-12,5-12,5 0,0-12,5 Other comprehensive income (net of tax) 0,0 0,0 0,0 99,1 99,1 0,2 99,3 Transactions with owners, entered directly against equity Purchase of non-controlling interests 0,0 0,0 0,0 0,0 0,0 0,0 0,0 Effect of acquisition 0,0 0,0 0,0 0,0 0,0 0,0 0,0 Dividend to owners 0,0 0,0 0,0-51,8-51,8 0,0-51,8 Share based payment transactions 0,0 0,0 0,0 0,0 0,0 0,0 0,0 Total transactions with owners 0,0 0,0 0,0-51,8-51,8 0,0-51,8 Total as at ,7 180,7 0,0 917, ,9 11, ,9 34
35 Consolidated cash flow statement Amounts in NOK million Note CASH FLOW FROM OPERATIONAL ACTIVITIES: Net profit 117,0 88,4 Adjustments to reconcile net profit with net cash flow from operations: Depreciation 8, ,2 286,5 Impairment 8, 10 47,9 0,0 Income from associated companies 16 0,0 0,0 Tax paid 0,0 0,0 Unpaid pension costs entered as costs and unreceived pension funds entered as income -10,3-8,4 Loss (profit) on sale of fixed assets 2,1 0,0 Net value change of financial instruments to fair value -5,6 30,4 Non cash financial items 56,8 58,9 Interest payments received 0,2 0,2 Interest paid -57,0-59,1 Income tax 13 41,5 27,0 Changes in operating assets and liabilities: Changes in inventory -2,8-258,0 Changes in accounts receivable and other receivables -180,6 60,0 Changes in trade accounts payable 38,4 87,7 Changes in provisions and benefits to employees -9,6 47,8 Changes in short-term liabilities excluding borrowing 255,2-9,7 Cash flow from operational activities 584,6 351,5 CASH FLOW FROM INVESTMENT ACTIVITIES: Investment in plant and equipment exc. acquisition 8, ,8-195,1 Net cash outlay on acquisition 0,0 0,0 Receipts from sale of fixed assets 45,1 0,5 Sale of other long-term investments 0,0 0,0 Purchase of subsidiaries, reduced by cash in company -11,8 0,0 Cash flow from investment activities 8-182,5-194,6 CASH FLOW FROM FINANCING ACTIVITIES: Short term borrowing 0,0 229,0 Payment of short term debt 0,0-229,0 Changes in short-term loans and overdraft -63,7 36,2 Purchase of non-controlling interests 0,0 0,0 Change in long term debt facility -297,3-193,5 Payment of other long term debt 0,0-11,1 Payment of dividend -51,8 0,0 Cash flow from financial activities -412,8-168,4 Net increase (reduction) in liquid assets during year -10,8-11,5 Liquid assets ,4 25,9 Effect of exchange rate changes on liquid assets 0,0 0,0 Liquid assets ,6 14,4 Cash and cash equivalents Liquid assets ,6 14,4 Unused drawing rights ,4 224,3 Restricted bank deposits 0,0 0,0 Cash and cash equivalents ,0 238,7 35
36 Note 1 - General information Moelven Industrier ASA is a public limited company registered in Norway. The company s headquarters are located at Industriveien Moelv. Norway. The group's activities are described in the report of the board. Note 2 - Basis for preparing the annual accounts The consolidated accounts of the Moelven have been prepared in accordance with the International Financial Reporting Standards (IFRS) and the interpretations of the IFRS interpretations committee (IFRIC). as determined by the EU. The consolidated accounts were presented by the board on 3 March 2016 and the ordinary general meeting to discuss the annual accounts has been fixed for 26 April The consolidated accounts are based on the principles of historic cost accounting with the exception of the following items: Defined-benefit pension schemes are valued at present value of the future pension benefits that have been earned on the date of balance. Pension funds are valued at fair value. Financial instruments at fair value through profit or loss. These include derivatives for hedging interest rates. foreign exchange and electric power. The consolidated accounts have been prepared with uniform accounting principles for similar transactions and events under otherwise similar conditions. Note 3 - Significant accounting principles Presented below are the most important accounting principles that have been used in preparing the consolidated accounts. These principles have been used in the same way for the comparison figures in the consolidated accounts. 3.1 Consolidation principles The consolidated accounts include Moelven Industrier ASA and companies over which Moelven Industrier ASA has a controlling influence. Determining influence is normally achieved when the group owns more than 50% of the shares in the company and the group is enabled to exercise actual control over the company. Important factors when assessing de-facto control are whether or not the group can choose the board of directors and wheteher the group s voting rights give the group the power to govern the financial and operating policies. Minority interests are included in group equity. The acquisition method is used for recognising company mergers on the income statement. Companies which are bought or sold during the course of the year are included in the group accounts from the date on which control is achieved until the date on which it ceases. Changes in holdings in the subsidiaries that do not lead to loss of control are entered as an equity transaction. The remuneration is entered at fair value and the difference between remuneration and the value of the holding entered on the balance sheet is entered against the majority owner's equity. With changes in holdings that lead to loss of control. remuneration is measured at fair value. The balance sheet value of holdings and obligations in the subsidiary and the minority interests are deducted on the date of loss of control. The difference between the remuneration and the balance sheet value of the holding is included on the income statement as a gain or loss. Any remaining holding is measured at fair value and any gain or loss included on the income statement as part of the gain/loss on the sale of the subsidiary. Amounts included in other income and costs are entered on the income statement. 36
37 Associated companies are enterprises in which the group has significant influence. but not control. over the financial and operational management. We have holdings between 20% and 50% in our associated companies. The Group accounts include the Group s share of profits from associated companies entered by equity method from the time significant control was achieved and until such control ceases. When the group's losses exceed the investment in an associated company. the group's balance sheet value is reduced to zero and further loss is not entered unless the group has an obligation to cover this loss. All other investments are entered in accordance with IAS 39. Financial instruments: Recognition and measurement more detailed information on which is given in note 26. Internal group transactions and intra group balances. including internal earnings and unrealised gains and losses are eliminated. Unrealised earnings in respect of transactions with associated companies and jointly controlled enterprises are eliminated with the group's share of the company/enterprise. Unrealised losses are eliminated in the same way. but only to the extent that there are indications of depreciation of value of assets that are sold internally. 3.2 New standards and interpretations Below is a summary of new and revised standards that have been decided. but which have not come into force as at 3 March Based on a preliminary analysis. the effect of the changes otherwise is not believed to have great significance for the annual accounts. Date of entry into force Planned implementation date New standards and interpretations IFRS 9 Financial Instruments Accounting year 2018 IFRS 15 Revenue from contracts with custumers Accounting year 2018 IFRS 16 Leasing Accounting year Functional currency and presentation currency The group's presentation currency is NOK. This is also the functional currency of the parent company. Subsidiaries with other functional currencies are converted to the day rate for balance items and to the transaction rate for income statement items. Average monthly exchange rate is used as an approximation of transaction rate. Translation differences are entered against other income and costs ("OCI"). In any future sale of investments in foreign subsidiaries. accumulated translation differences that are referred to the majority owners will be entered on the income statement. 3.4 Use of estimates in preparing the annual accounts Management has used estimates and assumptions which have affected assets. liabilities. income. costs and information regarding potential obligations. This applies in particular to depreciation of fixed assets. assessment of added value and goodwill in connection with acquisitions. inventory. project assessments and pension commitments. Future events may cause the estimates to change. Estimates and the underlying assumptions are continually assessed. Changes in accounting estimates are entered into the accounts during the period in which the changes occur. Where changes also affect future periods. the effect is distributed across the current and future periods. See also note 4. 37
38 3.5 Foreign currency Foreign exchange transactions Foreign exchange transactions are calculated at the exchange rate prevailing at the time of the transaction. Monetary items in foreign currency are converted to Norwegian kroner by using the rate of exchange on the balance date. Non-monetary items which are measured at historical exchange rates expressed in foreign currency are converted to Norwegian kroner by using the exchange rate at the time of transaction. Non-monetary items which are measured at fair value expressed in foreign currency are converted to the exchange rate determined at the time of the balance. Foreign currency fluctuations are recognised on the income statement continuously over the accounting period. Activities abroad Assets and liabilities in foreign companies including goodwill and fair value adjustments which arise on consolidation are converted to Norwegian kroner by using the exchange rate on the balance date. Income and expenses in foreign enterprises are converted to Norwegian kroner by using the average exchange rate. Exchange rate differences are entered in other income and costs ("OCI"). 3.6 Income Income is recognised on the income statement when it is probable that transactions will generate future financial benefit which will accrue to the company and the size of the amount can be reliably estimated. Sales income is presented after deduction of value added tax and discounts. Internal sales within the group are eliminated. Income from sale of goods is entered on the income statement once delivery has taken place and most of the risk and profit have been transferred. Income from sale of services and long-term manufacturing projects is entered on the income statement as the project progresses. when the outcome of the transaction can be reliably estimated. In some of the companies. progress is measured as accrued costs in relation to total estimated costs. while in other companies. progress is measured on invoicing in relation to the contract total. When the result of the transaction cannot be reliably estimated. only income corresponding to accrued project costs will be recognised as income. In the period in which a project is identified as giving a negative result. the estimated loss on the contract will be recognised on the income statement in its entirety. The group produces and sells energy to end customers. The sales is entered as income when the energy has been delivered and is read off at the customer's premises. Sales are entered based on the prices achieved. which are contract prices. but which can also be subject to price guarantee for the delivery period. Not including the financing element in sales is being considered. Otherwise. payment terms correspond to those that are normal in the market. Interest earnings are recognised on the income statement as they are earned. Dividends are entered when the shareholders' rights to receive dividends have been adopted by the general meeting. 3.7 Segments For management purposes the group is organised into four different divisions according to products and range of services. The divisions represent the basis for the primary report segments. Financial information regarding segments and geographical distribution is presented in note 6. 38
39 In segment reporting. internal earnings on sales between the segments are eliminated. 3.8 Loan costs Loan costs are entered on the income statement when the cost arises. Loan costs are entered on the balance sheet to the extent that they are directly related to the purchase manufacture of an asset and where the manufacturing period is long. A long manufacturing period means close to 12 months. Interest rate costs accrue during the build period until the asset is entered on the balance sheet. Balance entry of the loan costs is done until the point when the asset is ready for use. If the cost price exceeds the asset's fair value. it is written down. 3.9 Income tax Tax costs consist of payable tax and changes in deferred tax. Deferred tax/tax benefits are calculated on all differences between book and taxable values of assets and liabilities. with the exception of: goodwill on group level temporary differences relating to investment in subsidiaries. associated companies or jointly controlled enterprises that the group controls. when the temporary differences will be reversed and this is not expected to occur in the foreseeable future Deferred tax advantage is recognised on the income statement when it is probable that the company will have sufficient tax surplus in later periods to utilise the tax advantage. The companies enter deferred tax benefits that have not been previously entered to the extent that it has become probable that the company may make use of the deferred tax benefit. Likewise the company will reduce deferred tax advantages to the extent that the company no longer regards it as probable that it can utilise the deferred tax advantage. Deferred tax and deferred tax advantages are measured based on anticipated future tax rates for the companies in the group where temporary differences have previously arisen. Deferred tax and deferred tax advantages are recognised at nominal value and are classified as financial capital expenditure (long-term liability) on the balance sheet. Payable tax and deferred tax are entered directly against equity to the extent that the tax entries relate to equity transactions Research and development Expenses associated with research activities are recognised on the income statement when they arise. Costs relating to development activities are entered on the balance sheet to the extent to which the product or process is technically and commercially realisable and the group has sufficient resources to complete the development. The costs that are entered include material costs. direct payroll costs and a proportion of directly attributable joint expenses. Development costs entered on the balance sheet are entered as acquisition costs minus accumulated depreciation and write-down. Development costs entered on the balance sheet are depreciated on a straight line basis over the estimated lifetime of the asset Tangible fixed assets Tangible fixed assets are measured at acquisition cost. less accumulated depreciations and write downs. When assets are sold or disposed of. the value on the balance sheet is deducted and any profit or loss is entered on the income statement. 39
40 Acquisition price for fixed assets is the purchase price including duties/taxes and costs directly associated with preparing the fixed assets for use. Costs after the fixed asset has been taken into use. such as continuous maintenance. are entered on the income statement. while other costs that are expected to provide future financial benefit are entered on the balance sheet. Depreciation is calculated on a straight-line basis over subsequent decomposition and useful life: Type of asset Significant components Depreciation period Office building Building Sprinkling Fire detection Technical installations years 10 years 10 years 7 10 years Stores Building alone years Drier Machines Production premises Boiler house Fixtures and fittings. tools. office machinery etc. The driers are a construction that should be viewed together Depreciation should be the same for all elements of the drier: Building Machine Control Culvert Machine Control systems Foundation Building Technical installation Water and sewage Sprinkler system Building Culvert Heating unit No decomposition years years years years years years years years c. 10 years c. 10 years c. 10 years years years years 4-7 years Means of transport No decomposition 4 7 years Plots of land No depreciation Depreciation period and method are reviewed annually. Scrap value is estimated at each year end and changes in estimated scrap value are entered as estimate changes. Plant under manufacture is classified as a fixed asset and is entered as cost until manufacture or development is completed. Plant under manufacture is not depreciated until the asset is taken into use. 40
41 3.12 Leasing Financial lease agreements Lease agreements for which the group assumes the main risk and profit involved in ownership of the asset are financial lease agreements. At the beginning of the lease period. financial lease agreements are recognised at an amount corresponding to the lower of either fair value or the present value of the minimum lease. For calculation of the lease agreement s present value the implicit interest cost in the lease agreement is used if it is possible to calculate this. If not. the company s marginal borrowing interest is used. Direct expenses relating to establishing the lease contract are included in the asset's cost price. The same depreciation period is used as for the company's other depreciable assets. Where reasonable certainty that the company will assume ownership at the end of the lease period does not exist. the asset is depreciated over the shorter of the duration of the lease agreement and the asset's economic life cycle. Operational lease agreements Lease agreements where the main risk and profit associated with ownership of the asset are not transferred are classified as operational lease agreements. Lease payments are classified as operating expenses and are recognised on a straight-line basis over the contract period Intangible assets Intangible assets acquired separately are entered on the balance sheet at cost. The cost of intangible assets obtained through acquisitions are entered on the group s balance sheet at fair value at the time of the acquisition. Intangible assets entered on the balance sheet are entered in the accounts at cost less any depreciation or write down. Internally generated intangible assets. with the exception of recognised development costs. are not entered on the balance sheet but are entered as costs on an ongoing basis. Useful lifetime is either predetermined or non-predetermined. Intangible assets with a predetermined useful life are depreciated over this period and tested for write down if so indicated. Depreciation method and period are assessed at least annually. Changes in depreciation method and/or period are treated as estimate changes. Intangible assets with a non-predetermined useful life are tested for depreciation at least annually. either individually or by cash flow generating unit. Intangible assets with a non-predetermined useful life are not depreciated. The useful life is assessed annually to determine whether the assumption of nonpredetermined useful life is reasonable. If not. a change is made to predetermined useful life. Software Costs relating to the purchase of new software are entered on the balance sheet as an intangible asset if these costs are not part of the acquisition cost of hardware. Software is normally depreciated on a straight line basis over 3 years. Costs arising as a result of maintaining the future usefulness of software are entered as costs if the changes to the software do not increase the future financial benefit of the software Business combinations and goodwill Business combinations are entered in accordance with the acquisition method. Refer to note 3.24 with regard to the measurement of minority interests. Transaction costs are entered on the income statement as they occur. Remuneration for the purchase of a company is measured at fair value on the date of acquisition. 41
42 When a company is purchased. all assets and obligations taken over are assessed for classification and assignment in accordance with contract conditions. economic circumstances and relevant conditions on the date of acquisition. Assets and debts taken over are entered on the balance sheet at fair value on the consolidated opening balance unless IFRS 3 indicates that other measurement rules shall be used. Allocation of added value in company amalgamations is amended if new information arises regarding fair value on the date of taking control. Allocation can be changed up to 12 months after the date of acquisition if this is specified at the time of acquisition. The minority interests are calculated as the minorities' percentage of identifiable assets and debts. In the case of step by step acquisition. earlier assets are measured at fair value on the date of acquisition. Changes in the value of earlier assets are entered on the income statement. Goodwill is calculated as the sum of the remuneration and book value of the minority interests and fair value of previously owned assets. less the net value of identifiable assets and obligations calculated on the date of acquisition. Goodwill is not depreciated but tested at least annually for loss in value. The part of the fair value of the equity that exceeds the remuneration (negative goodwill) is immediately entered on the income statement on the date of acquisition Public grants Public grants are entered in the accounts when there is reasonable certainty that the company will fulfil the conditions associated with the grant. Recognition of operational grants is calculated systematically over the grant period. Grants are recognised as deductions from the cost that the grant is intended to cover. Investment subsidy is entered on the balance sheet in a systematic way over the life cycle of the asset. Investment subsidy is entered either as deferred income or as a deduction when determining the value of the asset on the balance sheet Financial instruments According to IAS 39 Financial Instruments recognition and measurement. financial instruments within the scope of IAS 39 are classified in the following categories: financial assets at fair value through profit or loss. held to maturity. loans and receivables. available for sale and other obligations. Financial instruments that are primarily held for the purpose of selling or buying back in the short term. financial instruments in a portfolio of identified instruments that are controlled together and where there are clear signs of short term realisation of gains and derivatives that have not been designated as hedging instruments are classified as held for trading purposes. These instruments are included in the category financial assets at fair value through profit or loss. together with financial instruments that qualify as. and have been designated as. instruments at fair value through profit or loss. Financial guarantee contracts are measured at the higher of what follows from IAS 37 Provisions. Contingent Liabilities and Contingent Assets and IAS 18 Revenue. unless the contracts qualify as. and have been designated as. instruments at fair value through profit or loss. Financial assets with fixed or determinable cash flows and fixed redemption dates. where the group has the intention of and the ability to hold the investment to maturity. are classified as investments held to maturity. with the exception of those instruments that the company designates as instruments at fair value through profit or loss or available for sale. or which meet the criteria for inclusion in the category loans and receivables. 42
43 Financial assets with fixed or determinable cash flows that are not listed in an active market are classified as loans and receivables. with the exception of instruments that the group has designated as instruments at fair value through profit or loss or available for sale. All other financial assets are classified as available for sale. Financial obligations that due not fall into the category held for trading purposes and that have not been designated as instruments at fair value through profit or loss are classified as other obligations. Financial instruments held to maturity are included in financial fixed assets. unless the redemption date is within 12 months of the balance date. Financial instruments in the group that are held for trading purposes are classified as current assets. Financial instruments available for sale are presented as current assets if management has decided to dispose of the instrument within 12 months of the balance date. Investments held to maturity. loans and receivables and other obligations are recognised at amortised cost. Financial instruments classed as available for sale and held for trading purposes are recognised at fair value. as observed in the market on the balance date. without deduction for costs connected with sale. Gains or losses resulting from changes in the fair value of financial investments classified as available for sale are recognised as other income and costs until the investment is realised. On realisation. accumulated gains or losses on the financial instrument that have previously been recognised against equity are reversed and the gain or loss is entered on the income statement. Gains or losses resulting from changes in the fair value of financial investments classified as held for trading purposes or that have been designated as instruments at fair value through profit or loss are entered on the income statement and presented as financial income or cost. The fair value of financial instruments that are traded in active markets is determined at the end of the reporting period by referring to the listed market price from traders of financial instruments (buying rate for long positions and selling rate for short positions). without deduction for transaction costs. For financial instruments that are not traded in an active market. the fair value is determined with the aid of a suitable valuation method. Such valuation methods involve the use of recent market transactions at arm's length between well-informed and voluntary parties. if such are available. referral to the current fair value of another instrument that is practically the same. discounted cash flow calculation or other valuation model. An analysis of fair value of financial instruments and other details regarding the measurement of these is given in the note Hedging The group performs financial hedging transactions. However on the basis of an assessment of cost and benefit of hedge accounting in accordance with IAS 39. it has been decided that the group does not perform hedge accounting Derivatives that are not hedging instruments Financial derivatives that are not recognised as hedging instruments are assessed at fair value. Changes in fair value are entered on the income statement on an ongoing basis. An inbuilt derivative is separated from the host contract and recognised as a derivative if and only if all the following conditions are fulfilled: 43
44 The financial characteristics and the financial risk of an inbuilt derivative are not closely related to the financial characteristics and the financial risk of the host contract. A separate instrument with the same conditions as the inbuilt derivative would have satisfied the definition of a derivative. The combined instrument (main contract and inbuilt derivative) is not measured at fair value through profit or loss Impairment of financial assets Financial assets valued at amortised cost are written down when it is probable based on objective evidence that the instrument s cash flow has been affected negatively by one or more events occurring after the initial recognition of the instrument. The write-down amount is entered on the income statement. If the cause of the write down later ceases and the cessation can be objectively associated with an event taking place after the inclusion of the write-down. the previous write-down is reversed. This reversal must not result in the balance value of the financial asset exceeding the amount of what the amortised cost would have been. if the loss in value had not been included at the time when the write-down was reversed. Reversal of earlier write down is presented as income. Financial assets classified as available for sale are written down when there are objective indications that the value of the asset has fallen. The accumulated loss that has been entered directly to equity (the difference between acquisition cost and current fair value less write-down that has previously been included on the income statement and any amortisation amount) is removed from equity and entered on the income statement. If the fair value of a debt instrument classified as available for sale increases at a later date. and the increase can be objectively linked to an event that occurred after the write-down was entered on the income statement. the write-down shall be reversed on the income statement. Write down of an investment in an equity instrument is not reversed on the income statement Inventory Inventory is recognised on the income statement at the lower of acquisition cost or net sales price. Net sales price is an estimated sales price for ordinary operations minus estimated costs for completion. marketing and distribution. Acquisition cost is allocated by use of the FIFO method and includes expenses accrued when acquiring the goods and the costs of bringing the goods to their current condition and location. Proprietary goods include variable and fixed costs that can be allocated based on normal capacity utilisation Projects The Building Systems division primarily performs contract assignments (projects). Revenue from projects are recognised by the degree of completion. based primarily on a comparison of accrued project costs and estimated total costs of the project. Additional claims and disputed amounts are not normally entered until agreement has been reached or there is a court judgement. However part of the claim is entered if there is an overwhelming probability of the anticipated outcome. Provision is made for claims activities based on historical experience and identified risks. Guarantee periods are normally from three to five years. For projects that are expected to result in a loss. the entire loss is entered on the income statement as soon as it is identified. Costs of tendering and other preparatory work are entered as they arise. For projects that are directed by outside companies. invoicing is performed monthly with 30 day payment terms. Invoicing is normally done in line with the completion of the work. but there are also payment schedules that do not correspond to progress. 44
45 For projects. both income and costs are scheduled. Income that has been earned but not yet invoiced is entered under the item "Completed. not invoiced". Invoiced income that has not yet been earned (forward payment plans) is entered under the item "Prepayments from customers" under other short term liabilities; see note 19. Scheduling of costs (accrued. not entered) is recognised as trade accounts payable. while provisions for claims activities on concluded projects are entered as claims provisions etc. Part of the outstanding receivables is secured in the form of bank guarantees or other forms of security. There is not considered to be any credit risk associated with public sector customers. Refer to note 5 on financial risk. Refer to note 19 Projects in progress. note 18 Accounts receivable. note 25 Other short term liabilities and note 24 Claims provisions etc. When the result of the transaction cannot be reliably estimated. only income corresponding to accrued project costs will be recognised as income Cash and cash equivalents Cash includes cash holdings and bank deposits. Cash equivalents are short term liquid investments that can be immediately converted into a known amount of cash and that have a maximum of 3 months to maturity. In the cash flow statement. the bank overdraft has been subtracted from the balance of cash and cash equivalents Equity Own shares On repurchase of own shares. the purchase price including immediate costs is entered as a change in equity. Nominal value of own shares are presented in a separate accounting line while paid amounts beyond nominal value as a reduction of equity. Losses or gains on own share transactions are not entered on the income statement. but is recognised in equity. Costs of equity transactions Transaction costs directly associated with equity transactions are entered directly to equity after deduction for tax. Other equity Translation differences Translation differences arise in conjunction with currency differences on consolidation of foreign units. Currency differences on monetary items (liability or receivable) that are in reality part of a company's net investment in a foreign unit are also entered as translation differences. For disposal of foreign units the accumulated translation difference associated with the unit is reversed and entered on the income statement for the same period as the profit or loss on the disposal is entered on the income statement. 45
46 3.24 Non-controlling interests (minority interests) Minority interests in the consolidated accounts represent the minority's holding of the balance sheet value of equity. With acquisitions. minority interests are measured according to their proportionate share of identified assets. The subsidiary company's results. as well as the individual components of other income and costs. are attributable to owners of the parent company and the minority interests. The total result is attributed to the parent company's owners and to the minority interests. even if this leads to a negative minority interest Employee contributions The group's Norwegian companies All the Norwegian companies have collective contribution-based pension schemes. These are schemes with a savings portion and a risk portion with earnings right. Pension premiums are entered as costs as they occur. The collective contributory pension was ended in All new employees will now attend the collective contributory pension. The closed schemes are defined benefit plans that give a few employees entitlement to agreed future pension benefits. The benefits are based on the number of years of earning and pay level on retirement. The group's foreign companies Many of the group's foreign companies offer their employees pensions based on agreed individual contribution-based pension schemes. In Sweden. most employees are covered by a collective occupational pension agreement. The scheme is defined as a multi-employer plan. Salaried staff born before 1979 are included in an individual occupational pension scheme that is also defined as a defined benefit plan. Because of the difficulty of reliably measuring the benefit level of these plans. there is insufficient information on an individual basis to enter the plans in the accounts as defined benefit schemes. The plans are entered as if they were contribution-based schemes. Salaried staff born after 1979 are included in an occupational pension scheme that is premium based and is therefore treated in the accounts as contribution-based. Defined-benefit pension schemes Defined-benefit pension schemes are valued at present value of the future pension benefits that have been earned on the date of balance. Pension funds are valued at fair value. Changes in defined-benefit pension commitments that are due to changes in pension plans are distributed over the estimated average remaining earnings period. Estimate changes and changes in financial and actuarial assumptions (actuarial gains and losses) are entered in other income and costs (OCI). The period s net pension costs are classified as payroll and personnel costs. Gains and losses on the curtailment or settlement of a defined-benefit pension scheme are recognised on the income statement on the date the curtailment or settlement occurs. Curtailment occurs when the group decides on a significant reduction in the number of employees covered by a scheme or changes the conditions for a defined-benefit pension scheme so that a considerable part of the present employees' future earning no longer qualifies for benefits or only qualifies for reduced benefits. 46
47 Contributory pension scheme All Norwegian employees are now a part of the group's contribution-based pension schemes. Contributions are given to the pension plan for full-time employees and represent from 3.6 % to 21.7 % of pay. Pension premiums are entered as costs as they occur Provisions A provision is recognised when the group has an obligation (legal or self-imposed) as a result of an earlier event. it is probable (more probable than not) that a financial settlement will take place as a result of this obligation and the amount can be reliably measured. If the effect is considerable. the provision is limited by discounting anticipated future cash flow by using a discount rate before tax that reflects the market price of the monetary value and. if relevant. the risk associated with the specific provision. A provision for guarantees is included when the underlying products or services are sold. The provision is based on historical information about guarantees and a weighting of possible outcomes according to the probability of their occurrence. Restructuring provisions are included when the group has approved a detailed and formal restructuring plan and the restructuring has already started or has been made public Conditional liabilities and assets Conditional liabilities are not recognised in the annual accounts. Significant conditional liabilities are reported. with the exception of conditional liabilities where the probability of the liability is low. A conditional asset is not recognised in the annual accounts. but is reported where it is probable that a benefit will accrue to the group Subsequent events New information about the company s financial position on the balance date that arises after the balance date is taken in to consideration in the annual accounts. Events after the balance date that do not affect the company s financial position on the balance date. but which will influence the company s financial position in the future. are reported if they are significant. Currency exchange rates The following exchange rates against the Norwegian kroner (NOK) have been used in consolidating the accounts Swedish krone (SEK) Income statement rate Balance sheet rate Danish krone (DKK) Income statement rate Balance sheet rate Euro (EUR) Income statement rate Balance sheet rate British pound (GBP) Income statement rate Balance sheet rate
48 Note 4 Critical accounting estimates and judgements In preparing the annual accounts in accordance with IFRS, the company's management have used estimates based on good faith and assumptions which are believed to be realistic. Situations or changes may arise which may mean that such estimates require adjustment and thereby affect the company s assets, debt, equity or profit and loss. The company s most important accounting estimates relate to the following: Depreciation on tangible fixed assets. Valuation of inventory Fair value of assets and obligations in acquisitions. Net pension commitments Project valuations Anticipated useful life of the company's production equipment is affected by the technological development and profitability of the plant. Choice of depreciation period is an estimate. If there are indications of a fall in value, the inventory in the subsidiaries must be tested for value loss. Book value is then compared with estimated net sales value. Management must take many things into account when making this estimate. The company's recognised goodwill and intangible assets are assessed for write down annually. The company is greatly affected by economic cycles that lead to considerable fluctuations in fair value in the company. The group is particularly affected by developments in the export markets in Europe and Africa, as well as fluctuations in the building industry in Scandinavia. Exchange rates and market interest rates also affect valuation. Valuations of the various established segments will naturally vary within a range of +/- 20%. For businesses in less mature markets, the range may be even greater. Moelven must distribute the cost price of acquired companies over acquired assets and acquired debt based on estimated fair value. The valuation estimates require management to make considerable assessments in the choice of method, estimates and assumptions. Significant acquired intangible assets that Moelven has included comprise customer base and goodwill. The assumptions made for the assessment of intangible assets include, but are not limited to, estimated average lifetime of customer relationships based on natural loss of customers. The assumptions made for the assessment of assets include, but are not limited to, the reacquisition costs of fixed assets. Management's assessments of fair value are based on assumptions that are deemed to be reasonable, but that have a built in uncertainty, and as a result of this the actual results may differ from the calculations. Pension commitments are calculated by actuaries. The actuary calculates the commitments based on assumptions provided by Moelven's management. These assumptions are the best estimate of the market situation as at Moelven largely follows the recommendations of the Norwegian Accounting Standards Board, but management reviews the assumptions to ensure that they are in accord with the situation in the group. Changes in the assumptions could have a significant effect of pension commitments and equity. Sensitivity calculations are shown in note 23. Project assessment is dependent on estimates of degree of completion, anticipated final status, any loss projects, guarantee obligations and claims. The managements of the subsidiaries within Building Systems use figures based on experience, among others, in preparing the estimates. 48
49 Note 5 Financial Risk Assessment Risk management principles and processes The Moelven group is exposed to several types of financial risk in its activities. The main objective of the group's financial policy is to ensure a predictable and cost-effective financial framework for industrial operations and to minimise the potential negative effects that unforeseen events in the financial markets might have on the group's cash flow. The group's position on financial risk is that it is the industrial activities rather than financial transactions that shall create the conditions for profitability. In accordance with the financial policy, which is adopted by the board, financial risk management of the group's central finance department is done in collaboration with the various operational units. The most important financial risks and the way they are managed are described below: 5.1 Market risk Market risk is the risk that a financial instruments fair value or future cash flow will fluctuate as a result of changes in market prices. Market risk includes three types of risk: exchange rate risk, interest rate risk and other price risk Foreign currency - transaction risk In this context, transaction risk means the exchange rate risk that is caused by the possibility of exchange rate changes in the period between the time a transaction in foreign currency is agreed and the time of settlement. About 15 per cent of the group's operating revenues come from markets outside Scandinavia and carry exchange rate risks. Both raw materials and finished goods are also imported into Norway from Sweden. The most important foreign currencies are EUR, SEK and GBP. Moelven uses forward buying of currency to counteract large profit fluctuations as a result of variations in exchange rates. The group companies shall perform all currency hedging with the group's central finance department, which hedges the group's total net exposure externally. Norwegian subsidiaries hedge against NOK, Swedish ones against SEK. Results from Swedish subsidiaries are included as part of net investment in foreign subsidiaries and hedged for exchange rate fluctuations together with other equity. In accordance with the financial policy, net exposure in foreign currency shall be hedged against rate fluctuations according to the following main principles: - At least 80 per cent of obligations in foreign currency shall be hedged when entering into the contract. This relates mainly to investment projects where machinery and equipment is bought from abroad. - Anticipated net exposure for the next 3 months shall be hedged. - Anticipated net exposure from 4 to 18 months ahead can be hedged within defined limits. Because of the hedging strategy that has been chosen, changes must be long-term so as to have the full effect on the group's profitability, and during the hedging period operational adaptations may be made to compensate for the external changes. Sensitivities - foreign currency The table shows the transaction volume for the main currencies in 2015 and Transactions and hedging in the main currency NOK million EUR GBP DKK Other Total Operating revenues Operating expenses Net exposure Estimated annual net exposure Hedging volume pas at maturing <12 md Hedging ratio as at for the next 12 Months 27 % 17 % 0 % 11 % 0 % Transactions and hedging in the main currency NOK million EUR GBP DKK Other Total Operating revenues Operating expenses Net exposure Estimated annual net exposure Hedging volume pas at maturing <12 md Hedging ratio as at for the next 12 Months 43 % 27 % 17 % 14 % 0 % Added to the exposure in the table above, the Group has ha net exposure in SEKNOK of approx. NOK 240 million. Estimated annual net exposure probably consists primarily of Norwegian unit's import of timber from Sweden, and Swedish units' exports of finished goods to Norway. Since a large proportion of the Group's total production takes place in Sweden, the Group has significant costs in Sweden. However, only Norwegian entities' operating costs in SEK currency hedged. Net income from the Swedish subsidiaries are included in retained earnings, and the currency risk arising in connection with these units' operating income and expenses are taken into account the risk related with the risk of conversion to equity. The table below shows sensitivity in the results before tax to exchange rate changes when all other conditions remain unchanged. The calculations are on the basis of rate changes being constant for the whole year. The effects of currency hedging, changes in the market value of financial hedging instruments and revaluing of balance sheet items have not been taken into account. NOK decline by 1 % Average rate Annual net Rate after Income Rate after Income Rate after Income Rate after Income 2015 exposure i NOK change effect +/- change effect +/- change effect +/- change effect +/- Change in EURNOK 8, ,03 3,56 9,84 35,60 8,85-3,56 8,05-35,60 Change in GBPNOK 12, ,45 3,50 13,56 34,95 12,20-3,50 11,09-34,95 Change in DKKNOK 1, ,21 0,34 0,32 3,37 1,19-0,34 1,08-3,37 Change in SEKNOK 0, ,97 2,44 1,05 24,40 0,95-2,44 0,86-24,40 The market value of financial instruments depends on the balance sheet exchange rate in relation to safety courses that have been achieved. Changes in market value will result in an unrealized gain or loss is recognized as finance costs. The table below shows how the profit before tax would have been affected by a change in the balance sheet date. The calculation is made on the basis of actual hedging volumes in the specified currencies per NOK decline by 10 % NOK strenghtening by 1 % NOK strengthening by 10 % NOK decline by 1 % NOK decline by 10 % NOK strenghtening by 1 % NOK strengthening by 10 % Rate per Hedging volume Rate after change Income effect +/- Rate after change Income effect +/- Rate after change Income effect +/- Rate after change Income effect +/- Change in EURNOK 9, ,72-0,10 10,58-0,96 9,52 0,10 8,66 0,96 Change in GBPNOK 13, ,20-0,13 14,38-1,31 12,94 0,13 11,76 1,31 Change in DKKNOK 1,29-1, ,28-1,16 - Change in SEKNOK 1,05 4 1,06 0,01 1,15 0,10 1,04-1,01 0,94-0,10 49
50 5.1.2 Foreign currency - translation risk In this context, translation risk means exchange rate risk due to the balance sheet including items that are denominated in a foreign currency. For the group companies, this translation risk is eliminated in that financing shall occur in the same currency as the asset is entered in the accounts. About half of the group's total balance sheet is connected to activities in Sweden. The balance sheet figures will therefore be affected by the prevailing exchange rate between the Swedish and Norwegian kroner. A large part of equity is secured against this in that share investment in most of the group's Swedish subsidiaries is financed in Swedish kroner. The table below shows the effect on consolidated equity by a change in the exchange rate of +/- 10 percent: Amount in NOK million % change i SEK/NOK 70,1 63,23 10 % change i EUR/NOK 0,1-0, % change i DKK/NOK 1,5 1, % change i GBP/NOK 0,1 0,086 Total effect 71,7 64, Interest rate risk Interest rate risk is the risk that a financial instrument's fair value or future cash flows will fluctuate because of changes in market interest rates. Net interest bearing debt provide the basis for interest rate risk. The bulk of the debt in SEK, which is why interest rates in Sweden are most important for the development of the Group's interest expense. The Group companies will be financed with loans from the parent company. All external borrowing is done by the parent company, which also makes hedging in accordance with financial policy. Hedging instruments that can be used is the ordinary interest rate swaps, FRAs and complex swap basis, of a kind normally used for such purposes. As a measure of the extent that interest rate lock duration is used computed the total of outstanding debt and hedging transactions. The total duration should be minimum of 12 md and maximum 60 months shall not be entered into hedging agreements with a maturity of more than 10 years. The Group's average net debt in 2015 was NOK million. If the debt had been without hedging would a one percentage point change in interest rates led to a change in the Group's financing costs of NOK 12.9 million. According to financial policy, however, was 56.4 per cent of Group net debt secured by the use of financial hedging instruments, primarily interest rate swaps, where floating rate swapped to fixed rate. Market value changes of interest rate instruments are recognized in the profit and loss account and will have an opposite effect, but do not affect cash flow. The unrealized item from interest rate instruments will normally be greater than they realized the records, because market value is related to the maturity of the instrument. Estimated effect on profit before tax by a change in interest rates and yield curves in the future are shown in the table below. Interest rate change - 50 bp Interest rate change + 50 bp Amount in NOK million Average NIBD 2015 Average secured part The estimated interest cost, 100% floating rate 1 271,1 12,9-12,9 Secured portion not affected by market fluctuations 50,5 % -6,5 6,5 Net effect on annual interest expenses before unrealized items 6,4-6,4 Unrealized gains / losses on hedging instruments that are recognized -42,9 41,4 The total effect including unrealized valuechange -36,5 35, Other price risk Other price risk is the risk that a financial instrument's fair value or future cash flow will fluctuate because of changes in market prices (apart from changes that are due to interest rate risk or exchange rate risk), regardless of whether these changes are caused by factors that are specific for the individual financial instrument or the instrument's issuer, or by factors that affect all corresponding financial instruments that are traded in the market. The price of electric power is another important factor that affects the group's profitability. About 185 GWh of electric power a year is bought via the group's electricity suppliers on the Nasdaq OMX exchange. According to the group's finance policy, the need for electric power shall be secured against price fluctuations so as to ensure stability and predictability. The anticipated power requirement is hedged within stated maximum and minimum levels by forward buying on Nasdaq OMX with a 5 year maximum horizon. The price of electric power is denominated in EUR. The group's power costs are therefore affected by both price changes and exchange rate changes. The group's annual electricity consumption has been relatively stable, apart from increases caused by business combinations. The table below illustrates the effects on results before tax of a change in the electricity price of +/- 1 EUR per MWh at different exchange rate levels for EURNOK. The indirect exchange rate exposure is not considered to be a built in derivative, since the electricity price is denominate in EUR. Consumption P/L effect in EUR in GWh EURNOK Amount in NOK million 9,50 9,75 10,00 Increase in the price of 1 EUR/MWh ,00-1,78-1,82-1,87 Proportion secured acc. Policy 0, ,56 1,40 1,43 1,47 Sensitivity taking into account hedging -39,44-0,38-0,39-0,40 The effect on profit before tax of exchange rate changes on the total consumption per year is shown in the table below: Consumption in GWh Price EUR/MWh EURNOK Amount in NOK million 9,50 9,75 10,00 Yearly cosumption ,41 45,58 46,75 Changes in the cost of currency change EURNOK from ,17 2,34 The indirect exchange rate exposure is not considered an embedded derivative since electricity prices are denominated in EUR. The exposure is taken into account when calculating the net foreign currency exposure for the group. The table below shows the sensitivity to changes in the price level for el.terminer at Nasdaq OMX. The starting point in secured volume per and provided that the price curve for futures contracts changed with 1 EUR / MWh. Secured volume in MWh Sensitivity in EUR EURNOK Amount in NOK million 9,50 9,75 10,00 Hedging according to IAS 39 relating to own use (consumption in Norway) ,10 27,23 27,94 28,66 Hedging where market value are recognized according to IAS ,10 43,19 44,32 45,46 Total ,20 70,42 72,27 74,12 50
51 5.1.5 Liquidity risk Liquidity risk is risk that the company will run into difficulties in fulfilling obligations connected with financial commitments that are settled with cash or another financial asset. The group's foreign capital financing consists of two long-term drawing facilities. One facility of NOK 225 mill which has maturity in September The other facility has maturity in June 2017.The loan agreements include normal default clauses with regard to equity, net equity value and debt ratio. As at 31 December 2015, the group's key figures were better than the agreed levels. In addition to the long-term drawing facilities, the also group has unused available credit in its bank systems, amounting altogether to about NOK 312 million. Credit facilities that are renewed annually. Long-term cash flow forecasts are prepared in connection with the strategy and budget process. The finance department monitors the use of drawing facilities against the long-term liquidity needs so as to ensure that the group has sufficient long-term financing. Short-term cash flow forecasts are prepared in the different group companies and reported weekly to the group's finance department, which aggregates the forecasts and monitors the group's total forecast liquidity needs. Based on these forecast, the finance department ensures that the group has sufficient cash equivalents to meet operational obligations. Surplus liquidity is used to pay off long-term liabilities. Short-term investments are only made exceptionally. As a result of seasonal variations in raw materials supplies and market activity, the group's working capital varies by NOK million between the highest point in May/June and the lowest in November/December. Installment plan Amounts in NOK million Total Syndicated loan withdrawals 225,2 771,7 0,0 996,9 Bilateral loans 4,4 1,1 0,0 5,5 Financial leasing 14,2 9,6 5,2 1,1 0,9 0,5 31,5 Other long term loans 0,4 0,4 Long term interst bearing debt 261,4 772,8 895,6 2,4 0,1 0, ,2 Short term interest bearing debt 0,0 0,0 Bank overdraft 76,2 76,2 Sum agreements with yearly renewal 76,2 76,2 Short term interest bearing debt (to be paid in next 12 months) 320,4 Long term interst bearing debt (to be paid in 12 months time or later) 790,1 Long term liabilities by currency Amounts in NOK million as at 31 December NOK 217,6 267,7 SEK 816,6 955,5 Total 1 034, ,2 Mortgages - Secured loans: Amounts in NOK million Bank overdraft 0,0 0,0 Long-term loans 5,5 10,0 Total 5,5 10,0 Book value of pledged assets: Amounts in NOK million Machinary and plants 14,3 15,2 Buildings 5,9 6,9 Land 2,3 2,3 Inventory 23,7 26,6 Accounts receivable 3,1 2,1 Total 49,3 53, Refinancing risk Refinancing risk is the risk of difficulties arising in refinancing the group's long-term liabilities. In accordance with the group's financial policy, the remaining time to maturity of financing shall be a minimum of 1 year. The group bases its long-term financing on syndicated loans from a few selected financial institutions with which the group has cooperated closely for an extended period. The background to this is the significance of these financial institutions' focus on the mechanised wood industry, combined with industry competence and knowledge of risk profiles and seasonal and other fluctuations. The present financing has been taken up with negative pledge declaration and default clauses linked with key figures on the balance sheet. The loan agreements do not contain any profitrelated default clauses Credit risk Credit risk arises in transactions with derivatives, bank deposits and financial institutions, as well as transactions with customers, including outstanding receivables and fixed agreements. As a general rule, the group only enters into financial transactions with financial institutions that participate in the long-term financing of the group. None of these has a credit rating poorer than A with the major credit rating agencies. The group has corresponding principles in relation to bank deposits and investments. In accordance with the group's financial policy, credit sales shall only occur against satisfactory security in the form of credit insurance or guarantees. The group's framework agreement for credit insurance has been drawn up with a third party that is acknowledged in the market and has a credit rating of A. In some cases it is not possible to obtain satisfactory security for credit sales. A function has therefore been established for determining internal credit limits and follow-up of credit sales. 5.2 Risk in connection with asset management The group's objectives for asset management are: - Ensuring continued good operations for the group so as to give a satisfactory and predictable return for the owners - Ensuring sufficient financial room for manoeuvre to achieve the established targets for growth - Giving sufficient confidence in the foreign capital markets to keep capital costs low The board's dividend policy is based on facilitating a predictable and satisfactory cash yield on investments made by Moelven's shareholders. The main rule of the group's dividend policy indicates a cash dividend corresponding to 50 per cent of profit after tax, assuming that considerations of the company's financial position and other capital sources are satisfactorily safeguarded. The board's objective for equity ratio is a minimum of 40 per cent, a level that is appropriate in light of the economic fluctuations that have been seen in recent years. In addition, Moelven's operations have a seasonal requirement for working capital that cause great variations in the equity ratio. The board has an objective of a debt ratio of 0.50 for a normal seasonal balance. The debt ratio is arrived at by dividing net interest-bearing debt by equity. Amounts in NOK million Interest-bearing debt 1 113, ,5 Interest-bearing assets 3,6 14,4 Net interest-bearing debt 1 110, ,1 Total equity 1 756, ,3 Liabilities / equity 0,63 0,85 51
52 Note 6 - Operating segments 6.1 Main figures for the group and operating segments Criteria for division The divisions are divided in accordance with Moelven's three core activities: Timber, Wood and Building Systems. There is also a division named "Other" in which the remaining units are placed. The divisions are built up around independent subsidiaries with activities clearly defined within the divisions. All transactions between the divisions are conducted on normal commercial terms. The split into divisions differs from the formal legal ownership structure. Group management represents the group's decision maker. The operating segments are based on the reporting; group management controls and assigns resources and assesses profitability. The segments are divided in accordance with who the customers are. Timber has mainly industrial customers, Wood has mainly end users and building product chains as customers and Building Systems has customers in the contracting sector. The others are the remaining companies, mainly the parent company, timber supply and bioenergy. In Timber and Wood especially, there is a great deal of collaboration between segments, but there are internal transactions between all four segments. Transactions between the segments are agreed on the arm's length principle. Income from customers outside the segment is reported to group management according to the same principles as the consolidated income statement. Group management is mostly focused on the following key figures: Sales income, profit margins, net operating capital, employed capital and returns on employed capital, interest-bearing debt and investments. The accounting principles that form the basis for segment reporting are the same as those used for consolidated accounting and are described in note 3. Principal figures Group Timber Wood Building Systems Other Amounts in NOK million Sales to external customers 9 690, , , , , , , ,2 763,4 721,6 Sales to internal customers 0,0 0,0 522,7 480,4 121,9 111,9 4,1 4, , ,8 Operating revenues 9 690, , , , , , , , , ,4 Depreciation and impairment 339,1 286,5 169,0 116,5 113,7 114,4 44,4 41,6 12,0 13,9 Operating profit 214,8 203,6-23,9 83,0 123,7 110,9 140,8 57,2-25,9-47,5 Income from associates 0,0 0,0 0,0 0,0 0,0 0,0 0,0 0,0 0,0 0,0 Financial income 51,2 28,2 10,1 0,0 16,3 6,4 4,3 10,6 70,5 68,2 Value change financial instruments 5,6-30,4 0,0 0,0 0,0 0,0 0,0 0,0 0,0 0,0 Financial costs -113,0-86,0-19,2-26,3-43,4-30,1-4,3-4,2-90,5-112,8 Profit before tax 158,5 115,3-32,9 56,7 96,6 87,3 140,7 63,5-45,9-92,2 Operating margin in per cent 2,2 % 2,3 % -0,8 % 2,9 % 3,8 % 3,6 % 4,2 % 2,0 % -0,9 % -1,5 % Cash flow from operating profit 553,9 490,0 145,1 199,5 237,4 225,3 185,2 98,8-13,9-33,6 Fixed assets 1 765, ,5 681,7 777,8 719,5 706,2 290,1 246,1 73,9 78,4 Inventory 1 526, ,9 471,5 496,9 784,1 780,6 170,6 154,9 100,5 91,4 Accounts receivable 1 070,7 993,5 291,0 284,5 335,6 295,5 443,1 385,0 292,2 318,1 Accounts payable 555,2 516,8 199,8 211,9 211,4 197,3 218,9 160,3 216,7 241,9 Projects net 39,0-67,3 0,0 0,0 0,0 0,0 39,0-67,3 0,0 0,0 Net operating capital (% of operating revenues) 21,5 % 21,8 % 18,7 % 19,8 % 27,7 % 28,7 % 12,9 % 11,0 % 5,9 % 5,2 % Total assets 4 778, , , , , , , , , ,7 Interest bearing liabilities 1 113, ,5 381,2 468,7 606,0 627,9 77,7 76,2 969, ,1 Interest free liabilities 1 907, ,4 442,3 472,3 621,1 590,9 873,5 656,3 491,4 597,9 Capital employed 2 870, , , , , ,9 743,2 600, , ,8 Return on capital employed 7,4 % 6,8 % -1,9 % 6,5 % 8,4 % 7,9 % 21,4 % 10,6 % 0,4 % -0,8 % Equity 1 756, ,3 841,0 813,5 907,7 815,1 665,5 523, , ,7 Equity ratio 36,8 % 34,2 % 50,5 % 46,4 % 42,5 % 40,1 % 41,2 % 41,7 % 40,8 % 37,2 % Investments 215,8 195,1 75,9 67,6 96,6 82,1 40,2 37,9 3,0 7,5 Number of full-time equivalents Sick leave in % 5,5 % 5,5 % 4,2 % 4,3 % 5,3 % 5,7 % 6,3 % 6,1 % 3,0 % 2,4 % H1 value 15,7 15,9 23,8 14,7 8,9 18,2 17,8 15,8 0,0 4,7 Reconciliation between reported segments operating revenues, profit before tax, assets and liabilities and other significant conditions Operating revenues Operating revenues for reported segments , ,6 Elimination of internal transactions , ,4 Consolidated operating revenues 9 690, ,2 Profit before tax Annual profit from reported segments 158,5 115,3 Elimination of internal transactions 0,0 0,0 Consolidated profit before tax 158,5 115,3 Assets Total assets from reported segments 7 884, ,5 Elimination of internal transactions , ,3 Consolidated total assets 4 778, ,2 Liabilities Total liabilities from reported segments 4 462, ,3 Elimination of internal transactions , ,4 Consolidated total liabilities 3 021, ,9 52
53 6.2 Geographical segments The presentation of geographical segments shows operating revenues based on the geographical location of the customers. Operating revenues Amounts in NOK million Norway 4 010, ,7 Sweden 3 974, ,6 Denmark 294,7 307,0 United Kingdom 333,1 341,3 Germany 177,7 156,1 Other Europe 456,8 476,9 Asia 165,4 162,8 Africa 250,6 271,7 Other countries 27,9 40,1 Total 9 690, ,2 No customers represents more than 10 % of income. Presentation of number of employees, fixed assets, employed capital and investments is shown based on geographical location of the assets. Number of employees Fixed assets Capital employed Investments Amounts in NOK million Norway ,0 797,7 919, ,8 123,0 101,4 Sweden , , , ,1 92,8 93,7 Denmark ,1 0,3 23,8 22,1 0,0 0,0 England 4 9 0,0 0,2-4,8-3,4 0,0 0,0 Germany 3 3 0,1 0,1 3,7 3,2 0,0 0,0 Netherlands 1 1 0,0 0,0 1,2 1,1 0,0 0,0 Total , , , ,9 215,8 195,1 53
54 Note 7 - Sales income Amounts in NOK million Sale of goods 6 673, ,0 Sale of services - service contracts 118,5 118,2 Income from construction contracts 2 851, ,6 Sales income 9 643, ,8 In sales income for the group, internal deliveries and services between the group companies amounting to NOK million have been eliminated (NOK million). 54
55 Note 8 - Fixed assets Amounts in NOK million Plots Buildings and other property Machinery and plant Fixtures and fittings, tools etc. Total Acquisition value as at , , ,8 225, ,4 Acquisitions 0,2 39,3 139,2 13,1 191,8 Disposals 0,0 0,0-0,5 0,0-0,5 Transfers 0,0 0,7-3,0 0,1-2,2 Translation differences 0,1 2,9 15,5 0,1 18,6 Acquisition value as at , , ,0 239, ,0 Accumulated ordinary depreciations ,0 565, ,6 191, ,8 Disposals accumulated depreciations 0,0 0,0 0,0 0,0 0,0 Depreciation and write downs for the year 0,0 43,2 222,0 10,6 275,8 Accumulated ordinary depreciations ,0 609, ,6 201, ,6 Book value ,7 444, ,2 34, ,6 Book value ,0 443, ,4 37, ,5 Ordinary depreciation rates are given in note 3.11 Acquisition value as at , , ,0 239, ,0 Acquisitions 2,8 21,5 221,4 12,9 258,6 Disposals -1,6-3,3-76,3-2,7-83,9 Transfers 0,0 0,0-6,1 1,4-4,7 Translation differences 3,2 21,9 42,4 1,9 69,3 Acquisition value as at , , ,4 252, ,5 Accumulated ordinary depreciations ,0 609, ,6 201, ,6 Disposals accumulated depreciations 0,0 9,5 39,2 0,8 49,4 Depreciation and write downs for the year 0,0 66,9 252,9 12,4 332,2 Accumulated ordinary depreciations ,0 666, ,4 213, ,4 Book value ,0 443, ,4 37, ,5 Book value ,4 426, ,0 39, ,2 Ordinary depreciation rates are given in note
56 Note 9 - Leasing Operating lease The group recognised expenses of NOK 23,3 million in relation to operating leases in The equivalent expense in 2014 was NOK 20,4 million. Minimum lease payments relating to operating leases year 25,1 20,1 1-2 years 19,4 15,9 2-4 years 20,4 11,8 > 4 years 12,0 10,6 Sum 76,9 58,4 Finance leases Leases where cotrol and substantially all the risks have been transferred to the group are classified as finance leases. Further information are given in note 3. Minimum lease payments relating to finance leases year 14,1 12,4 1-2 years 10,4 8,3 2-4 years 5,9 6,6 > 4 years 1,4 1,0 Sum 31,8 28,3 Capitalised value of leased assets 29,2 24,5 56
57 Note 10 a - Intangible assets Amounts in NOK million Goodwill Other intangible assets Total Acquisition value as at ,9 54,2 71,1 Acquisitions through purchase 0,0 3,3 3,3 Disposals 0,0 0,0 0,0 Transfers 0,0 0,0 0,0 Translation differences 0,0 0,0 0,0 Acquisition value as at ,9 57,4 74,3 Accumulated ordinary depreciations ,0 33,9 33,9 Disposals accumulated depreciations 0,0 0,0 0,0 Depreciation for the year 0,0 10,7 10,7 Accumulated ordinary depreciations ,0 44,6 44,6 Book value ,9 20,3 37,2 Book value ,9 12,9 29,8 Ordinary depreciation rates in per cent 0 % 20 % Acquisition value as at ,9 57,4 74,3 Acquisitions through purchase 0,0 1,9 1,9 Disposals 0,0 0,0 0,0 Transfers 0,0 0,0 0,0 Translation differences 0,0 0,1 0,1 Acquisition value as at ,9 59,4 76,3 Accumulated ordinary depreciations ,0 44,6 44,6 Disposals accumulated depreciations 0,0 0,0 0,0 Depreciation for the year 0,0 6,9 6,9 Accumulated ordinary depreciations ,0 51,5 51,5 Book value ,9 12,9 29,8 Book value ,9 8,0 24,9 Ordinary depreciation rates in per cent 0 % 20 % 57
58 Note 10 b - Impairment test of goodwill As at goodwill in the group entered on the balance sheet amounted to NOK 16.9 million. This is mainly linked to the acquisitions of Sør-Tre Bruk AS, Granvin Bruk AS and Eco Timber AS that were completed in These three acquired companies are all in the Wood division and it is the division's operation that is deemed to be the cash flow generating group that goodwill shall be tested against. Amounts in NOK million Book value of goodwill: Sør-Tre/Granvin/Eco Timber 13,3 13,3 Other units 3,6 3,6 Total 16,9 16,9 Goodwill is tested at the level monitored by group management, which means that there are groups of cash flow generating units (CGUs). The recoverable amount of CGU is arrived at by taking the historical figures for the CGUs as a basis, but with an allowance for an expected moderate growth in the total market, Moelven's market share and the prices of the products. In management's opinion it is reasonable to assume that considerable development of new products and technologies will occur in these areas. The rate used for discounting cash flows is 8,0 %. This is based on a risk-free rate of 1,6 % with an added risk premium of 5.9 %. The risk premium is based on observations of comparable companies. The write down test is according to the going concern assumption for the CGU and with the following estimates: - Sales price estimates are based on internal and external analyses - Inflation is estimated as 2% a year - The present cost bases is assumed to reflect the future - For goodwill testing, management has used a 4 year period without growth estimate on the term There was no write down of goodwill in either 2015 or Maximum exposure to possible write down of goodwill is NOK 16.9 million. This is not a significant amount for the group. We have calculated sensitivity for the write down assessments and a 3 % change in discount rate would lead to write down of the goodwill in the Wood division in the consolidated accounts. The goodwill regarding other units are considered as immaterial and a sensitivity analysis is not performed. Segments - Groups of cash flow generating units (CGUs): Amounts in NOK million Goodwill at year end Impairment Goodwill at year end Impairment Timber 0,0 0,0 0,0 0,0 Wood 13,3 0,0 13,3 0,0 Building Systems 3,6 0,0 3,6 0,0 Total goodwill 16,9 0,0 16,9 0,0 58
59 Note 11 a - Payroll expenses Amounts in NOK million Payroll cost 1 564, ,2 Social security cost 329,3 295,2 Pension costs - contribution-based pension schemes 54,6 42,5 Pension costs - defined-benefit pension schemes -5,0 24,7 Total 1 943, ,6 11 b Average number of employees Average number of employees in 2015 was and in 2014 it was Moelven had employees at the end of 2015 compared to employees at the end of c Remuneration to auditor Amounts in NOK million, paid during the financial year Legally required audit 4,2 3,9 Other attestation services 0,1 0,2 Tax consultancy 0,1 0,2 Other, non auditing services 0,1 1,2 Total 4,5 5,6 Note 12 - Financial income and costs Amounts in NOK million Financial income 51,2 28,2 Financial costs -113,0-86,0 Financial income Interest income, bank 0,2 0,2 Foreign currency gains 47,6 25,2 Other financial income 3,4 2,8 Total financial income 51,2 28,2 Financial costs Interest and commission costs, bank -5,0-1,8 Interest on long term loan financing -51,9-62,8 Foreign currency losses -46,5-19,6 Other financial costs -9,6-1,9 Total financial costs -113,0-86,0 59
60 Note 13 - Tax costs Amounts in NOK million Tax payable 22,6 0,4 Deferred tax changes 18,9 26,6 Tax costs 41,5 27, Tax payable for the year 22,6 0,4 Total tax payable 22,6 0,4 Reconciliation of tax calculated with the group's weighted average tax rate and tax costs as they appear on the income statement: Amounts in NOK million Profit before tax 158,5 115,3 Tax calculated with the group's tax rate 28 % 42,8 31,1 Tax effects of: Difference due to different tax rates -3,1-5,9 Change of tax rate in Sweden -3,4 0,0 Contribution from associated companies 0,0 0,0 Permanent differences 2,1 2,1 Other 3,1-0,3 Tax cost on the income statement 41,5 27, Weighted average tax rate 26,2 % 23,4 % Amounts in NOK million Before tax 2015 Tax costs Before tax 2014 Tax costs Tax on items entered against other income and expenses After tax After tax Elements not later reclassified to earnings Actuarial gains (losses) on defined-benefit pension schemes 50,0-12,5 37,5-40,0 10,8-29,2 Elements that can be later reclassified to earnings Translation differences 61,5 0,0 61,5 12,3 0,0 12,3 Other changes 0,1 0,0 0,1-1,2 0,0-1,2 Other income and expenses during the period (after tax) 111,6-12,5 99,1-28,9 10,8-18,1 60
61 Note 14 - Deferred tax Deferred tax benefits and deferred tax are netted when there is a legal right to give and receive group contribution between the entities. The table below shows the basis that has resulted in recognised deferred tax benefits and deferred tax Assets and obligations with deferred tax consist of:: Amounts in NOK million Temporary differences Asset reserves -5,2-3,8 Inventory 66,9 46,8 Cost provisions 23,1 13,9 Other short-term temporary differences -89,2-96,1 Sub-total short-term differences -4,5-39,2 Fixed assets 85,8 42,6 Profit and loss account 0,9 4,0 Pension funds 0,0 0,0 Pension commitments 6,3-93,3 Other long-term items 417,7 421,1 Sub-total long-term items 510,7 374,5 Tax-assessed loss carry-forward. -219,1-118,1 Net temporary differences 287,1 217,2 Deferred tax asset 10,6 11,4 Deferred tax 69,5 49,8 Net deferred tax 58,8 38, Assets with deferred tax from loss carry-forward Amounts in NOK million Norway 56,1 29,1 Sweden 0,0 0,0 Denmark 0,0 0,0 Total deferred tax benefit from loss carry-forward 56,1 29,1 The group has a total of NOK 219,1 million in loss carry-forward as at NOK 173,3 million of this is from Norwegian companies with an ownership holding of more than 90%. The group will make use of this loss carry-forward in future group contributions. NOK 34,4 million of the total loss carry-forward refers to a Norwegian company where the ownership holding is below the limit for group contributions. The management of this company is in the process of reviewing possible production measures to improve profitability. The group has no recorded deferred tax regarding carry-forward losses in other countries than Norway Analysis of deferred tax through the year Net deferred tax obligation 1 January 38,4 20,8 Included on income statement 11,8 26,6 Other income and costs pensions -12,5-10,8 Included in equity 20,9 0,0 Translation differences and other 0,2 1,8 Net deferred tax obligation 31 December 58,8 38,4 61
62 Note 15 - Other shares The company s share capital Number of shares in Moelven's ownership Total face value Book value Amounts in NOK 1,000 Holding % Owned by Moelven Industrier ASA: Tretorget AS 26,5 % Others 31 Total Moelven Industrier ASA 831 Owned by other group companies Transportfellesskapet Østlandet AS 25,0 % Transportselskapet Nord AS 12,5 % Svenskt Limträ AB 33,0 % SEK SEK Others 292 Total others 535 Total group Note 16 - Investments in associated companies Amounts in NOK million Book value as ate ,6 2,6 Proportion of annual profit 0,0 0,0 Additions 0,7 0,0 Disposals 0,0 0,0 Translation differences 0,0 0,0 Proportion of other income and expenses 0,0 0,0 Book value as at ,3 2,6 Amounts in NOK million 2014 Name Home country Assets Liabilities Income Profit Book value Holding Weda Skog AB Sweden 32,3 29,6 248,8 0,0 2,6 30,0 % 32,3 29,6 248,8 0,0 2, Name Home country Assets Liabilities Income Profit Book value Holding Weda Skog AB Sweden 37,2 34,5 298,9 0,0 2,6 30,0 % Woodtrans AS Norway 0,7 34,0 % 37,2 34,5 298,9 0,0 3,2 62
63 Note 17 - Inventory Amounts in NOK million Raw materials and purchased semi finished goods 557,1 591,9 Goods in processing 186,5 191,1 Finished own products 782,1 738,4 Prepayments to supplier 1,1 2,4 Total inventory 1 526, ,9 Amounts in NOK million Inventory valued at acquisition cost 1 007, ,1 Inventory valued at fair value. 519,1 410,8 Total inventory 1 526, ,9 Write down of inventory to fair value in 2015 is included in profit and loss with NOK 22,6 million. The equivalent value in 2014 was NOK 22,2 million. The book value of inventories pledged as security in 2015 was NOK 5,5 million and NOK 10,0 million in
64 Note 18 - Accounts receivable and other receivables Amounts in NOK million Note Accounts receivable Accounts receivable gross 1077,5 993,5 Provision for loss on accounts receivable -6,8-5,0 Earned not invoiced ,2 62,5 Accounts receivable entered on the balance sheet 1 259, ,0 The year's confirmed losses on receivables 0,5 0,3 Changes in provision for loss 1,9 0,9 Losses on receivables on income statement 2,4 1,2 Other receivables VAT in credit 80,2 79,5 Other receivables 94,5 120,7 Total other receivables 174,7 200,1 Part of the outstanding receivables is secured in the form of bank guarantees or other forms of security. There is not considered to be any credit risk associated with public sector customers. Refer to note 5 on financial risk. Other receivables consist of other deferred income, prepayments and operations-related items. The groups accounts receivable are mainly secured through credit insurance. Currency breakdown of accounts receivable before provision for loss Amounts in NOK million NOK 491,6 429,5 SEK 468,8 421,2 EUR 58,1 79,4 DKK 11,4 14,1 GBP 31,5 36,6 Other currencies 16,1 12,6 Total 1 077,5 993,5 Age distribution of outstanding accounts receivable Amounts in NOK million Accounts receivable within credit terms 813,0 757,7 Under 30 days beyond due date 189,9 178,7 31 to 60 days beyond due date 23,7 12,3 61 to 90 days beyond due date 8,2 20,1 91 to 180 days beyond due date 9,4 4,7 Over 180 days beyond due date 33,2 19,9 Total 1 077,5 993,5 64
65 Note 19 - Projects in progress Amounts in NOK million Note Distribution of sales Project sales 2 893, ,6 Service contracts 118,5 118,2 Sale of goods 284,6 380,5 Total 3 297, ,3 Projects in progress entered on the income statement *) Accumulated income 1 562, ,7 Accumulated accrued expenses 1 312,1 967,1 Accumulated contributions 250,8 175,6 Loss projects in progress **) 4,0 15,0 Earned not invoiced income ,2 62,5 Prepayments from customers ,8 75,8 Deferment of costs (+ liability/ - receivable) -20,1 14,5 *) Projects in production, not handed over to customer **) Anticipated losses on these projects have been entered on the income statement For projects that are directed by outside companies, invoicing is performed monthly with 30 day payment terms. Invoicing is normally done in line with the completion of the work, but there are also payment schedules that do not correspond to progress. For projects, both income and costs are scheduled. Income that has been earned but not yet invoiced is entered under the item "Completed, not invoiced". Invoiced income that has not yet been earned (forward payment plans) is entered under the item "Prepayments from customers" under other short term liabilities; see note 25. Only one of these items is used per project. Thus each project shows either a net receivable for the customer or a net liability to the customer. Scheduling of costs (accrued, not entered) is recognised as trade accounts payable, while provisions for claims activities on concluded projects are entered as claims provisions etc. 65
66 Note 20 - Cash and cash equivalents Amounts in NOK million Bank deposits ,6 14,4 Unused drawing rights ,4 224,3 Restricted bank deposits 0,0 0,0 Cash and cash equivalents ,0 238,7 Note 21 - Earnings per share and equity per share Earnings per share Earnings per share is calculated by dividing the share of the annual profits allocated to the company s shareholders by a weighted average of the number of ordinary shares issued over the year, less own shares Annual profit assigned to Moelven s shareholders 117,6 88,4 Average number of shares 129,5 129,5 Earnings per share 0,91 0,68 Equity per share Equity per share is calculated by dividing the share of equity assigned to the company s shareholders by a weighted average of the number of ordinary shares issued over the year, less own shares Total equity assigned to owners of parent company 1 745, ,9 Average number of shares 129,5 129,5 Equity per share 13,48 12,20 66
67 Note 22 - Group companies The following companies are included in the Group. The list is group accordring to division structure. Book value shows the bookvalue in the separate financial statement of the owner of the company. Amounts in NOK 1,000 Holding % The company's share capital Number of shares in Moelven's ownership Book value Organization number Timber Moelven Våler AS 100,0 % * Moelven Numedal AS 100,0 % * Moelven Løten AS 100,0 % * Moelven Mjøsbruket AS 100,0 % * Moelven Telemarksbruket AS 51,0 % * Moelven Valåsen AB 100,0 % SEK ** Moelven Dalaträ AB 100,0 % SEK ** Moelven Nössemark Trä AB 100,0 % 300 SEK ** Moelven Årjäng Såg AB 100,0 % 300 SEK ** Moelven Notnäs AB 100,0 % SEK ** Moelven Norsälven AB 100,0 % SEK ** Moelven Ransbysågen AB 100,0 % SEK ** Moelven Component AB 100,0 % SEK ** Moelven Profil AS 100,0 % * Moelven Tom Heurlin AB 100,0 % SEK ** UJ-Trading AB 100,0 % SEK ** Moelven U.K. Ltd 100,0 % 50 GBP * Moelven Deutschland GmbH 100,0 % 110 EUR * Moelven Nederland B.V. 100,0 % 36 EUR * Wood Moelven Wood AS 100,0 % * Moelven Wood AB 100,0 % SEK ** Moelven Van Severen AS 100,0 % * Moelven Østerdalsbruket AS 100,0 % * Moelven Soknabruket AS 100,0 % * Moelven Langmoen AS 100,0 % * Moelven Eidsvoll AS 100,0 % * Moelven Treinteriør AS 100,0 % * Moelven Danmark A/S 100,0 % DKK * Moelven Are AS 100,0 % * Moelven Eidsvold Værk AS 100,0 % * Moelven Trysil AS 100,0 % * Moelven Sør Tre AS 100,0 % * Moelven Granvin Bruk AS 99,3 % * Moelven List AB 100,0 % SEK ** Moelven Värmlands Trä AB 100,0 % SEK ** Moelven Notnäs Wood AB 100,0 % SEK ** Moelven Valåsen Wood AB 100,0 % SEK ** Moelven Edanesågen AB 100,0 % SEK ** Moelven Lovene AB 100,0 % SEK ** Moelven Vänerply AB 100,0 % SEK ** Moelven Wood Prosjekt AS 100,0 % * Moelven Malmö AB 100,0 % SEK *** Moelven Multi3 AS 100,0 % NOK *
68 Amounts in NOK 1,000 Holding % The company's share capital Number of shares in Moelven's ownership Book value Organization number Building Systems Moelven Limtre AS 100,0 % * Moelven Töreboda AB 100,0 % SEK ** Moelven ByggModul AS 100,0 % * Moelven Byggmodul Hjellum AS 100,0 % * Moelven Byggmodul AB 100,0 % SEK ** Moelven Modus AS 100,0 % * Moelven Modus AB 100,0 % SEK ** Moelven Elektro AS 100,0 % * Moelven Elektro AB 100,0 % 100 SEK ** Others Moelven Industrier AB 100,0 % SEK * Moelven Skog AB 100,0 % 5000 SEK ,5 ** Moelven Virke AS 100,0 % * Moelven Bioenergi AS 100,0 % * Vänerbränsle AB 82,3 % 336 SEK ** Skåre Kontorshotell AB 100,0 % 100 SEK ** Moelven Malmö Holding AB 100,0 % SEK ** Moelven Portefølje AS 100,0 % * *) Company owned by Moelven Industrier ASA **) Company owned by Moelven Industrier AB ***) Company owned by Moelven Malmö Holding AB 68
69 Note 23 - Pension costs and pension commitments Pension schemes The pension funds and commitments on the balance sheet mainly relate to the group's Norwegian companies. Secured schemes The group's defined benefit scheme regarding the norwegian companies was ended in New employees will be affiliated a contributions based pension scheme. The Group is required to have an occupational shceme by legislation on compulsory orrupational pensions. The pension schemes fulfil the reqiurements of this legislation. Unsecured schemes Unsecured schemes mainly relate to contractual pension (AFP) and are calculated in accordance with the Norwegian accounting standard on pension costs. It was decided to wind up the old AFP scheme in As a result of the change in legislation, AFP commitments were reduced by about NOK 25 million in There are no unsecured pension commitments that have not been included in the calculation mentioned above. The new AFP scheme was established by an agreement between the Confederation of Trade Unions (LO) and the Confederation of Norwegian Enterprise (NHO) on 2 April 2008, as part of the wage settlement. The agreement was on the assumption that the state should contribute so that the pension level (total of National Insurance and the new AFP) would at least correspond to the level of the old AFP. The scheme was established by the regulations for the joint scheme for contractual pensions (AFP). The new AFP is calculated as a lifelong supplement to the retirement pension from National Insurance, with the opportunity to combine pension and work income without reduction of pension. The new AFP scheme in the private sector has been established as a joint scheme by combining the three schemes (LO, Spekter financial services industry). The new AFP scheme is defined as a defined-benefit multi-employer plan in an accounting context. The company has given its employees a promise of a lifelong pension at a fixed level. There is not yet sufficient information for a calculation to be completed. The group's foreign companies Many of the group's foreign companies offer their employees pensions based on agreed individual contribution-based pension schemes. In Sweden, most employees are covered by a collective occupational pension agreement. The scheme is defined as a multi-employer plan. Salaried staff born before 1979 are included in an individual occupational pension scheme that is also defined as a defined benefit plan. Because of the difficulty of reliably measuring the benefit level of these plans, there is insufficient information on an individual basis to enter the plans in the accounts as defined benefit schemes. The plans are accounted for as if they were contribution-based, in accordance with good accounting practice. Salaried staff born after 1979 are included in an occupational pension scheme that is premium based and is therefore treated in the accounts as contribution-based Economic and actuarial assumptions The following economic assumptions have been made: Return on pension funds 2,50 % 3,00 % Discount rate 2,50 % 3,00 % Annual pay increase 2,50 % 3,00 % Annual G adjustment (National Insurance Scheme's amount) 2,25 % 3,00 % Annual adjustment of pensions being paid 0,00 % 1,50 % Average employer's contribution factor 14,10 % 14,10 % Pension commitments entered in the accounts Amounts in NOK million Present value of the secured pension commitments 23,6 471,4 Present value of the unsecured pension commitments 18,6 17,6 Total present value of pension commitments 42,3 489,0 Fair value of pension funds -21,8-368,0 Net pension liability outside Norway 1,8 0,9 Pension commitments entered 22,3 121,8 In the balance sheet the pension commitments are entered gross with the following amounts: Net pension funds 2,5 3,3 Pension liabilities 24,8 125,2 69
70 23.3 Pension costs Amounts in NOK million Pension entitlements accrued in the year 16,1 15,0 Administration costs 2,3 2,3 Change in pension plans -35,9 0,0 Net financial costs/income 3,1 3,2 Pension costs secured and unsecured defined benefit schemes -14,4 20,6 Contribution pension costs and other pension costs 64,0 46,7 Pension cost (net) entered on the income statement 49,6 67,3 Of which, the pension cost for contractual pensions (AFP) 0,0 0, Pension commitments and pension funds Amounts in NOK million Unsecured Secured Un-secured Total Secured Total Changes in gross pension commitments Pension commitments ,1 15,3 486,4 412,8 20,6 433,4 Employer's contribution in gross pension commitments 0,2 2,3 2,5 12,4 2,2 14,6 Present value of the year s pension contribution 16,0 0,1 16,1 15,0 0,1 15,0 Interest costs on the pension commitments 14,1 0,5 14,6 17,3 0,8 18,1 Change in pension plans -394,6 0,0-394,6 0,0 0,0 0,0 Employer's contribution receipts -3,9 0,0-3,9-3,1 0,0-3,1 Actuarial gains and losses -62,9 4,5-58,4 32,5 1,2 33,8 Pension payments -16,5-4,0-20,5-15,5-7,2-22,7 Commitments taken over in company mergers 0,0 0,0 0,0 0,0 0,0 0,0 Gross pension commitments ,6 18,6 42,3 471,4 17,6 489,0 Changes in gross pension funds Fair value pension funds ,1 368,1 353,9 353,9 Projected return on pension funds 9,1 9,1 12,6 12,6 Actuarial gains and losses -8,4-8,4-6,3-6,3 Premium payments 32,0 32,0 26,5 26,5 Employer's contribution receipts -3,9-3,9-3,1-3,1 Payment of pensions/paid-up policies -16,5-16,5-15,5-15,5 Change in pension plans -358,7-358,7 0,0 0,0 Fair value pension funds ,8 21,8 368,0 368, The actual return on pension funds was 4,7 % 4,4 % Investment profile pension funds at year end (weighted average) Main category Shares 4,5 % 7,1 % Bank market 24,3 % 22,4 % Bonds 61,0 % 53,4 % Property 9,9 % 15,0 % Other 0,3 % 2,1 % Total 100,0 % 100,0 % Sensitivity analysis: The table below shows estimates of the potential effect of a change in certain assumptions for defined-benefit pension plans in Norway. The estimates are based on facts and circumstances as at 31 December Actual results may deviate substantially from these estimates. Pension Amounts in NOK million Discount rate Pay adjustment G adjustment adjustment Inflation Change in pension: +1% -1% +1% -1% +1% -1% +1% -1% +1% -1% Pension commitment (PBO) -2,6 3,2 0,0 0,0 0,0 0,0 2,7-0,5 0,1 3,7 Net pension cost for the period 0,4 0,4 0,4 0,4 0,4 0,4 0,4 0,4 0,8 0,8 Pension Discount rate Pay adjustment G adjustment adjustment Change in pension: +1% -1% +1% -1% +1% -1% +1% -1% Pension commitment (PBO) -11 % 13 % 0 % 0 % 0 % 0 % 11 % -2 % 70
71 Note 24 - Provisions Guarantee liability on projects Guarantee provisions Guarantee provisions as at ,2 15,7 Used during the year -0,2-1,7 Reversed during the year 0,0-1,5 New provisions during the year 3,2 3,7 Guarantee provisions ,1 16,2 Other guarantee liability Loan guarantees/financial guarantees 23,9 12,5 Moelven Industrier is operating business that can effect the external environment. Moelven performs periodical mapping of the environmeltal effect of our production. Based on these mappings, Moelven has assessed that the recognition criteria of a reliable estimate is not fulfilled. There is therefore not recognized any provisions regarding environmental effects. Note 25 - Other short-term liabilities Other short term liabilities Note Prepayments from customers ,8 75,8 Accrued holiday pay 195,1 163,4 Bonus provisions 133,1 105,6 Accrued costs and other short term liabilities 499,1 530,9 Total other short term liabilities 938,1 875,7 Prepayments from customers relates to invoiced income on projects that has not been earned (invoiced, not performed) Refer to note 19 Projects. 71
72 Note 26 - Financial instruments 26.1 Book value of financial assets and obligations by category: Fair value through profit or loss Book value Amounts in NOK million Receivables Fair value Financial receivables Accounts receivable 1259,0 0,0 1259,0 1259,0 Other receivables 174,7 0,0 174,7 174,7 Financial instruments 4,5 4,5 4,5 4,5 Bank deposits etc. 3,6 0,0 3,6 3,6 Total 1 441,8 4, , ,8 Financial liabilities entered as amortised cost Fair value through profit or loss Book value Amounts in NOK million Fair value Financial liabilities Liabilities to credit institutions 1 002,4 0, , ,4 Financial leasing liabilities 31,5 0,0 31,5 31,5 Other long term liabilities 12,4 0,0 12,4 12,4 Financial instruments 0,0 93,7 93,7 93,7 Liabilities to suppliers 555,2 0,0 555,2 555,2 Overdrafts 79,7 0,0 79,7 79,7 Total 1 681,2 93, , ,9 Book value of financial assets and obligations by category: Fair value through profit or loss Book value Amounts in NOK million Receivables Fair value Financial receivables Accounts receivable 1051,0 0,0 1051,0 1051,0 Other receivables 200,1 0,0 200,1 200,1 Financial instruments 6,6 6,6 6,6 6,6 Bank deposits etc. 14,4 0,0 14,4 14,4 Total 1 272,1 6, , ,1 Financial liabilities entered as amortised cost Fair value through profit or loss Book value Amounts in NOK million Fair value Financial liabilities Liabilities to credit institutions 1 196,6 0, , ,6 Financial leasing liabilities 27,2 0,0 27,2 27,2 Other long term liabilities 2,4 0,0 2,4 2,4 Financial instruments 0,0 101,4 101,4 101,4 Liabilities to suppliers 516,8 0,0 516,8 516,8 Overdrafts 143,3 0,0 143,3 143,3 Total 1 886,3 101, , ,7 72
73 26.2 Nominal value of financial instruments As at 31 December Amounts in NOK million Interest rate derivatives Maturing under 1 year 0,0 0,0 Maturing 2-5 years 128,6 289,9 Maturing 6-10 years 498,0 315,9 Total 626,6 605,9 Currency derivatives, forward contracts for sale of foreign currency Maturing 0-6 months 151,2 248,5 Maturing 7-12 months 21,4 60,0 Maturing >12 months 0,0 5,3 Total 172,6 313,8 Currency derivatives, forward contracts for purchase of foreign currency Maturing 0-6 months 14,0 87,1 Maturing 7-12 months 0,0 14,0 Maturing >12 months 0,0 0,0 Total 14,0 101,1 Power derivatives Maturing under 1 year 15,7 23,8 Maturing 1-2 years 13,2 18,9 Maturing 3-4 years 7,3 11,5 Total 36,2 54,2 Power derivatives accounted accordring to IAS 39 as purchace for own use Maturing under 1 year 18,0 22,4 Maturing 1-2 years 9,8 11,5 Maturing 3-4 years 3,3 6,5 Total 31,1 40,5 The table shows the nominal gross value in NOK. Sales of foreign currency is sales against NOK and SEK. Calculation of nominal value in NOK is done by using the nominal value of SEK converted to NOK by using the balance sheet date rate. Kjøp av foreign currency are mainly sales of SEk against NOK and SEK against EUR. Power contracts are bought forward contracts for electicity Fair value levels Level 1: Listed price in an active market for an identical asset or obligation Level 2: Valuation based on observable factors other than listed price (used in level 1) either direct or indirect (derived from prices) for the asset or obligation. Level 3: Valuation based on factors that are not obtained from observable markets. (non-observable assumptions) 73
74 26.4 Fair value measurements entered in the statement of financial position The table below shows financial instruments at fair value according to the valuation method Amounts in NOK million Level 1 Level 2 Level 3 Total Assets Financiel instruments - currency derivative 0,0 4,5 0,0 4,5 Total assets 0,0 4,5 0,0 4,5 Liabilities Financiel instruments - currency derivative 0,0 0,9 0,0 0,9 Financial instruments - interest derivative 0,0 76,2 0,0 76,2 Financial instruments - power derivative 16,6 0,0 0,0 16,6 Total liabilities 16,6 77,1 0,0 93,7 Liabilities after exception in IAS 39 * Financial instruments - power derivative 8,9 0,0 0,0 8,9 Total liabilities outside balance sheet 8,9 0,0 0,0 8, Amounts in NOK million Level 1 Level 2 Level 3 Total Assets Financiel instruments - currency derivative 0,0 6,6 0,0 6,6 Total assets 0,0 6,6 0,0 6,6 Liabilities Financiel instruments - currency derivative 0,0 10,2 0,0 10,2 Financial instruments - interest derivative 0,0 80,1 0,0 80,1 Financial instruments - power derivative 11,1 0,0 0,0 11,1 Total liabilities 11,1 90,3 0,0 101,4 Assets after exception in IAS 39 Financial instruments - power derivative 5,8 0,0 0,0 5,8 Total assets outside balance sheet 5,8 0,0 0,0 5,8 74
75 Note 27 - Share capital and share premium reserve The last capital increase was in 2004 when Moelven aquired the Are Group. The share capital was increased by NOK 52,5 million Summary of shareholders as at Number of shares Number of own shares Number of voting shares Face value NOK 5 Share capital Number of shares on average Summary of shareholders as at Number of shares Number of own shares Number of voting shares Face value NOK 5 Share capital Number of shares on average Ownership of Shareholders Number of shares voting shares in per cent Glommen Skog SA Norway ,10 % Eidsiva Vekst AS Norway ,78 % Felleskjøpet Agri SA Norway ,85 % Viken Skog SA Norway ,87 % Mjøsen Skog SA Norway ,75 % AT Skog SA Norway ,29 % 6 largest owners ,64 % Other 935 shareholders ,36 % Total 941 shareholders ,00 % 75
76 Note 28 - Remuneration to group management, board and corporate assembly 28.1 Shares in Moelven Industrier ASA owned by members of the group management, board and corporate assembly The Corporate assembly Deputy members The board of Directors Group Executive Board Egil Magnar Stubsjøen 0 Helge Urstrømmen 0 Olav Fjell 0 Morten Kristiansen 500 Terje Uggen 0 Erik A. Dahl 0 Trond Stangeby 0 Ole Helge Aalstad 1000 Maren Kyllingstad 0 Anne Sagstuen Nysæther 0 Elisabeth Krokeide 0 Bjarne Hønningstad 2700 Thor Svegården 0 Leif Henning Asla 0 Mari Wilhelmsen 0 Marcus Johansson 1012 John Arne Ulvan 0 Jan Kollsgård 0 Asbjørn Bjørnstad 0 Olav A. Veum 0 Knut Aas 0 Martin Fauchald *) 0 Group shared services Gudbrand Gulsvik 0 Tor Henrik Kristiansen 0 Lars Håkan Karlsson *) 0 Rolf Th. Holm 0 Thorvald Grini 0 Kristin Vitsø Bjørnstad 750 Jan Arve Sinnerud *) 0 Trond Sønes *) 0 Deputy members Morten Sveiverud 2350 John-Inge Lorentsen *) 0 Leif Bjarne Undem *) 0 Even Rognan Lutnæs 0 Ann Christine Löfborg *) 0 Ove Gunarsson *) 0 Terje Johansen 0 Fredrik Rajala 0 Lennart Perez *) 0 Jörgen Weman *) 0 Olav Breivik 0 Iver Melby *) 74 Aud Ingvild Storås 0 *) Employee's representatives *) Employee's representatives *) Employee's representatives 28.2 Declaration of determination of remuneration for the Group Executive Board Background In accordance with section 6-16a of the Public Limited Company Act, the board of Moelven Industrier ASA has prepared a declaration on the fixing of pay and other remuneration for senior executives within the group. The declaration, which was adopted by the general meeting of 23 April 2015, has been the guideline for the 2015 financial year. An identical declaration, which will be presented to the general meeting of 26 April 2016, will be the guideline for the 2016 financial year. The following persons are involved The declaration covers the group management of Moelven Industrier ASA. Group management means the CEO and the heads of the divisions. General Moelven shall have a level of pay and other terms of employment that is necessary in order to be able to keep and recruit managers with good competence and the capacity to achieve the objectives that are set. Salary Moelven's main principle is that senior executives shall have fixed salary. Salary is adjusted annually, normally with effect from 1 July. Other benefits in kind Moelven shall have other benefits, in the form of free car, free newspapers and free telephony for example, where this makes work easier and is deemed to be reasonable in relation to general practice in the market. Bonuses and other variable elements of the remuneration Over and above the main principle of fixed pay, the board wishes it to be possible to offer other variable forms of remuneration in cases where this is found to be appropriate. Bonuses may be used to a limited extent and by special agreement and shall be directly dependent on operating profit. Remuneration linked to shares etc. Moelven has no form of remuneration for companies within the group that is linked to shares or the development of the share price, including shares, subscription rights and options. In the event of the establishment of such a scheme, it shall cover a large number of employees and such remuneration shall represent a smaller proportion than the fixed pay. Pension schemes Moelven shall have pension conditions that are on a level with the general market in the home country. New employees shall join contributory pension schemes. Pay after termination of employment In the event of immediate termination of employment by the company, management shall as a standard be entitled to pay for 18 months, less pay earned by any new employer during this period. Previous financial years Management pay policy in previous financial years has been in line with the content of this declaration. The board reserves the right to deviate from these guidelines if there are serious grounds for doing so in individual cases. If the board should deviate from these guidelines, their reasons for doing so must appear in the minutes of the meeting. 76
77 Note 28 - Remuneration to group management, board and corporate assembly contd Remuneration to senior executives etc. Amounts in NOK 1,000 paid during the financial year Pension Other Pension costs benefits Salaries costs Other benefits Salaries Remuneration to: CEO Morten Kristiansen 3 132,0 842,0 172, Former CEO Hans Rindal 0,0 0,0 0, ,1 270,6 16,8 Ole Helge Aalstad, Managing Director Timber 1 798,1 184,1 184, ,9 186,6 168,6 Bjarne Hønningstad, Managing Director Wood 1 798,1 182,3 164, ,9 181,1 154,1 Marcus Johansson, Managin Director Building Systems from ,4 552,4 106, ,4 416,6 53,1 Total 8 489, ,8 628, , ,3 441,2 On termination of employment, the President and CEO and the Managing Directors of Timber and Wood have 18 month's pay after termination, less pay from new position/employer. The Managing Director of Building Systems has a similar agreement for 6 months Remuneration to the board and corporate assembly Amounts in NOK 1,000 paid during the financial year Remuneration to the board of Directors 1 254, ,0 Remuneration to the corporate assembly 451,3 418,5 The chairman of the board of directors receives NOK and the board members NOK in annual remuneration. Deputy members of the board receive NOK per meeting. The chairman of the corporate assembly receives NOK in annual remuneration. The members and deputy members of the corporate assembly receive NOK per meeting. 77
78 Note 29 - Shareholders' agreement and related parties 29.1 Shareholders' agreement The share capital of Moelven Industrier ASA consists of 129,542,384 shares with a face value of NOK 5 and there is only one share class. In total the shares are distributed among 941 shareholders, of which the six largest, Eidsiva Vekst AS, Felleskjøpet Agri SA and the forest owner cooperatives Glommen Skog SA, Mjøsen Skog SA, AT Skog SA and Viken Skog SA, control a total of 99.6 per cent. There is several shareholders' agreements between these shareholders. Among other things, this shareholders' agreement has clauses that determine that the company shall be run as an independent unit with a long-term perspective and with continued focus on Scandinavia as the main market. The agreement also contains clauses regarding the composition of the board, dividend policy, strategic focus areas and share transfer Related parties Transactions with the owners are performed in some areas of the ordinary activities. Among other things, this relates to purchase of timber, where the Norwegian forest owner cooperatives are suppliers. There will also be deliveries of biofuel from the Moelven group to a bioenergy plant owned by Eidsiva Energi AS, with possible buyback of bioenergy for Moelven's industries in connection with the energy plant. Also, Eidsiva Energi Marked AS sells electric power to Moelven's Norwegian industrial operations. All these transactions have in common that the arm's length principle shall be applied. Where other suppliers can offer better prices or terms, these will be used. About 40 per cent of Moelven's total purchasing requirement for timber of 4 million cubic metres comes via the Norwegian forest owner cooperatives. Moelven' supply of energy raw materials to Eidsiva's bioenergy plant represents between 40 and 50 GWh on an annual basis, while buying back energy represents between 20 and 30 GWh. Net delivery of energy raw materials is 20 GWh. The extent of the sale of electrical power corresponds to about 40 per cent of Moelven's total consumption of 185 GWh. Moelven has a long tradition of running its operations in accordance with all the laws and ethical guidelines of the industry and is of the opinion that competition is positive for all parties in industry. In order to ensure that this culture is maintained, ethical guidelines and guidelines for complying with legislation on competition have been devised. 78
79 Note 30 - Events after the date of balance No subsequent events have taken place that should have any effect on the 2015 annual report. 79
80 Annual accounts for Moelven Industrier ASA INCOME STATEMENT Moelven Industrier ASA Amounts in NOK million Note Other operating revenue 17 96,0 88,5 Operating revenue 2 96,0 88,5 Payroll expenses 12,16 51,5 59,6 Depreciation on tangible and intangible fixed assets 10,11 7,2 7,5 Other operating expenses 16 80,8 78,9 Operating expenses 139,5 146,0 Operating profit -43,5-57,5 Income from investment in subsidiaries 1) 35,5 92,7 Income from associates 0,0 0,0 Dividends 0,0 0,0 Value change financial instruments, gain 9 3,9 6,6 Interest income from group companies 73,3 77,2 Other interest income 0,0 0,0 Other financial income 45,9 21,5 Value change financial instruments, loss 9-12,0-38,9 Impairment of financial assets 0,0-33,5 Interest costs to companies in same group -5,0-8,0 Other interest costs -51,8-56,5 Other financial costs -52,3-23,5 Net financial items 37,5 37,6 Result before tax -6,0-19,9 Tax on ordinary result 3,4 1,5-5,1 Annual profit -7,5-14,8 Allocated to dividend, NOK 0.40 per share 0,0-51,8 To/from other equity 16 7,5 66,6 Total 7,5 14,8 1) Including group contribution 80
81 BALANCE AT Moelven Industrier ASA Amounts in NOK million Note ASSETS Deferred tax assets 4 36,0 39,2 Other intangible assets 10 6,8 8,5 Total intangible assets 42,8 47,7 Land 3,7 3,7 Buildings and other property 6,1 6,6 Machinery and plant 6,3 8,4 Fixtures and fittings, tools, office machinery etc. 7,3 6,7 Total tangible fixed assets 11 23,4 25,4 Investments in subsidiaries ,1 986,7 Investments in associated companies 15 3,3 2,6 Loans to group companies , ,1 Investments in other shares 14 0,8 0,8 Net pension funds 1,4 0,0 Total financial fixed assets 2 514, ,2 Total fixed assets 2 580, ,3 Accounts receivable 0,1 0,3 Accounts receivable group companies 17 1,1 2,2 Receivables group contributions/dividend 17 35,5 59,2 Other receivables 17,7 17,4 Total receivables 54,4 79,1 Financial derivatives 9 6,8 18,9 Bank deposits, cash etc. 6 0,0 12,1 Total current assets 61,2 110,1 Total assets 2 642, ,4 81
82 Moelven Industrier ASA Amounts in NOK million Note LIABILITIES AND EQUITY Share capital 647,7 647,7 Own shares 0,0 0,0 Share premium reserve 180,7 180,7 Total contributed equity 828,4 828,4 Retained earnings 36,1 38,8 Total equity ,5 867,2 Pension liabilities 12 19,5 33,2 Total provision for commitments 19,5 33,2 Liabilities to credit institutions 6 996, ,7 Other short term debt 10,3 0,0 Total long term liabilities 1 007, ,7 Liabilities to credit institutions 6 610,0 469,2 Financial derivatives 9 109,4 114,5 Liabilities to suppliers 7,7 8,8 Trade accounts payable to group companies 17 3,8 2,2 Payable public duties 4,1 4,0 Dividends 0,0 51,8 Tax payable 3 0,0 0,0 Other short term debt 5 15,8 20,8 Total short term liabilities 750,8 671,3 Total liabilities 1 777, ,2 Total equity and liabilities 2 642, ,4 Guarantee liability 8 630,7 576,1 Number of shares (Face value per share NOK 5.-) Moelv 03 March 2016 The Board of Directors of Moelven Industrier ASA 82
83 CASH FLOW STATEMENT Moelven Industrier ASA Amounts in NOK million Note CASH FLOW FROM OPERATIONAL ACTIVITIES: Profit before tax -6,0-19,9 Tax paid this year 3 0,0 0,0 Ordinary depreciation 10,11 7,2 7,5 Loss on associates 0,0 0,0 Correction items - financial derivatives 7,0 31,4 Unpaid pension costs entered as costs and unreceived pension funds entered as income 12-7,2-0,6 Changes in current assets excluding liquids and loans 1,0-0,9 Changes in short-term liabilities excluding borrowing -4,4 5,9 Cash flow from operational activities -2,4 23,4 CASH FLOW FROM INVESTMENT ACTIVITIES: Investment in plant and equipment exc. acquisition 10,11-3,5-6,8 Net cash flow from investments in shares -16,0 28,0 Net cash outlay on acquisition 0,0 0,0 Long-term investments, financial -74,4-11,1 Short term loans 23,7-36,8 Cash flow from investment activities -70,2-26,7 CASH FLOW FROM FINANCING ACTIVITIES: Changes in short-term loans and overdraft 140,8 244,0 Changes in long-term liabilities -28,5-229,9 Payment of dividend -51,8 0,0 Cash flow from financial activities 60,5 14,1 CASH HOLDINGS Net change in liquidity through year -12,1 10,8 Cash holdings ,1 1,3 Cash holdings ,0 12,1 83
84 Note 1 - Accounting principles The annual accounts have been prepared in accordance with the provisions of the Norwegian Accounting Act and with generally accepted accou 1.1 Use of estimates Management has used estimates and assumptions that have affected the income statement and the valuation of assets and liabilities, as well as uncertain assets and obligations on the date of balance in the preparation of the annual accounts in accordance with good accounting practice. 1.2 Foreign currency Foreign exchange transactions are calculated at the exchange rate prevailing at the time of the transaction. Monetary items in foreign currency are converted to Norwegian kroner by using the rate of exchange on the balance date. Non-monetary items which are measured at historical exchange rates expressed in foreign currency are converted to Norwegian kroner by using the exchange rate at the time of transaction. Nonmonetary items which are measured at fair value expressed in foreign currency are converted to the exchange rate determined at the time of measurement. Exchange rate changes are entered on the income statement as they occur during the accounting period under other financial items. 1.3 Operating revenues The operating revenues consist mainly of division of joint costs among the subsidiaries. Sales are invoiced as the services occur. 1.4 Tax Tax costs consist of payable tax and changes in deferred tax. Deferred tax/tax benefits are calculated on all differences between book and taxable values of assets and liabilities. Deferred tax is calculated at 25% of the temporary differences between the book and taxable values, as well as tax losses carried forward at the end of the reporting year. Net deferred tax benefits are entered on the balance sheet to the extent that it is probable they can be utilised. Payable tax and deferred tax are entered directly against equity to the extent that the tax entries relate to equity items. 1.5 Classification and valuation of balance sheet items Current assets and short-term debt include items which become due for payment within a year after the date of acquisition and items associated with the goods cycle. Other items are classified as fixed assets/long-term liabilities. Current assets are valued at the lower of acquisition cost and fair value. Short-term debt is recognised on the balance sheet at the nominal amount at the time it is taken out. Fixed assets are measured at acquisition cost, less depreciations and write downs. Long-term debt is recognised in the balance sheet at the nominal amount at the time of establishment. 1.6 Research & Development Research and development expenses are entered on the balance sheet to the extent to which a future financial benefit can be identified that is linked to the development of an identifiable intangible asset and the expenses can be reliably measured. Otherwise, such expenses are recognised as costs on an ongoing basis. Development that is entered on the balance sheet is depreciated on a straight line basis over the financial lifetime. Research expenses are recognised as costs on an ongoing basis. 1.7 Tangible fixed assets Tangible fixed assets are entered on the balance sheet and depreciated on a straight line basis over the asset's expected lifetime. Major assets that consist of significant components having different lifetimes are depreciated with different depreciation times for the different components. Direct maintenance of equipment is recognised continuously as an expense under operating expenses, while increased costs or improvements are added to the equipment's price and amortised concurrently. If the recoverable value of the asset is lower than book value, it is written down to recoverable value. Recoverable value is the higher of net sales value and value in use. Value in use is the present value of the future cash flow that the asset is expected to generate. 1.8 Subsidiaries/associated companies Subsidiary and associated companies are assessed by the cost method in the company accounts. The investment is valued at acquisition cost for the shares unless write down has been necessary. Write down to fair value is been done when the decrease in value is due to causes that cannot be considered to be transitory and where this must be considered necessary according to good accounting practice. Write downs are reversed when the reason for write down no longer exists. Dividends, group contributions and other payments from subsidiaries are entered as revenue during the same year as provision is made for them in the subsidiary's accounts. If the dividend/group contribution exceeds the proportion of earned profit after the date of acquisition, the surplus represents part repayment of invested capital and is deducted from the value of the investment on the parent company's balance sheet. 1.9 Receivables Trade accounts receivable and other receivables are recognised in the balance sheet at their nominal value after deductions for provision for expected loss. Provision for losses is made on the basis of individual assessment of each debt. In addition, an unspecified provision is made for the remaining trade accounts receivable to cover assumed loss. 84
85 1.10 Short-term investments Short-term investments (shares assessed as current assets) are valued at the lower of acquisition cost and fair value on the date of balance. Dividends received and other payments from the companies are entered as other financial income Pensions The company has collective, contribution-based pension schemes. These are schemes with a savings portion and a risk portion with earnings right. Pension premiums are entered as costs as they occur. The company`s contributory pension was ended during 2015 and replaced with a contributory pension. Defined-benefit pension schemes Defined-benefit pension schemes are valued at present value of the future pension benefits that have been earned on the date of balance. Pension funds are valued at fair value. Changes in defined-benefit pension commitments that are due to changes in pension plans are distributed over the estimated average remaining earnings period. Estimate changes and changes in financial and actuarial assumptions (actuarial gains and losses) are entered against equity (OCI). The period's net pension costs are classified as payroll and personnel costs. The company entered all accumulated net actuarial losses and gains (estimated deviations) against equity as per 1 January This was done since the company began to use IAS 19 for accounting for pension commitments. Gains and losses on the curtailment or settlement of a defined-benefit pension scheme are recognised on the income statement on the date the curtailment or settlement occurs Cash flow statement The cash flow statement has been prepared according to the indirect method. Cash and cash equivalents comprise cash, bank deposits and 85
86 Note 2 - Operating revenues Amounts in NOK million Subsidiaries' proportion of joint costs 50,6 47,7 Subsidiaries' proportion of IT services 35,2 30,0 Rent income - outside the group 0,7 0,6 Rent income - inside the group 2,7 2,7 Other 6,8 7,5 Total other operating income 96,0 88,5 Note 3 - Tax expense Amounts in NOK million Ordinary result before tax -6,0-19,9 Nominal tax 27 % 2015, 27 % ,6-5,4 Tax effect from change in tax percent from 27 % to 25 % 3,0 0,0 Tax effect of permanent differences 0,1 0,3 Total tax costs 1,5-5,1 Ordinary result after tax -7,5-14,8 Tax percentage -25,0 % 25,6 % Tax costs consist of payable tax in Total tax payable 0,0 0,0 Changes in deferred tax from income statement 1,5-5,1 Total tax costs 1,5-5,1 Changes in deferred tax from OCI item pension 1,6-2,5 Changes in deferred tax from income statement 1,5-5,1 Total changes in deferred tax 3,1-7,6 Note 4 - Deferred tax Deferred tax /deferred tax assets The table below shows the tax effects of the various temporary differences between accounting and tax Amounts in NOK million Temporary differences Asset reserves 0,0 0,0 Cost provisions according to good accounting practice -0,3-0,3 Other short-term temporary differences -30,4-29,7 Sub-total short-term differences -30,7-30,0 Plant and equipment reserves -0,7-0,7 Profit and loss account 0,3 0,5 Pension funds 0,0 0,0 Pension commitments -4,9-9,0 Sub-total long-term items -5,3-9,2 Tax-reducing differences (-), tax-increasing (+) -36,0-39,2 Deferred tax assets -36,0-39,2 Note 5 - Other short-term liabilities Other short-term liabilities consist mainly of accrued costs not yet due for payment. 86
87 Note 6 - Liquid holdings and debt 6.1 Interest-bearing holdings and debt Amounts in NOK million Average rate Restricted bank deposits 0,0 0,0 Other bank deposits 0,0 12,1 Total bank deposits 0,0 12,1 Overdraft and interest-bearing debt 610,0 469,2 Long-term interest-bearing liabilities in NOK 4,84 % 200,0 100,0 SEK 3,96 % 796,9 935,7 DKK 0,0 0,0 EUR 0,0 0,0 Total long-term interest-bearing debt 996, ,7 Net interest-bearing debt 1 606, ,8 6.2 Repayment schedule long-term liabilities Amounts in NOK million Long-term liabilities that fall due for payment in 1 year 330,8 0,0 2 years 666,1 146,0 3 years 0,0 889,7 4 years 0,0 0,0 5 years 0,0 0,0 6 years and over 0,0 0,0 6.3 Ceilings and withdrawals in syndicated loan market Amounts in NOK million Ceiling 1 575, ,0 Withdrawal 991, ,7 Remaining term in months 9/18 17/30 The loans have been taken with negative security declaration and have normal clauses relating to equity, equity ratio and debt ratio. 6.4 Future access to liquidity Long financing Amounts in NOK million as at , ,0 in 1 year 1 350, ,0 in 2 years 0, ,0 in 3 years 0,0 0,0 in 4 years 0,0 0,0 in 5 years 0,0 0,0 in 6 years or later 0,0 0,0 Short financing In addition to the long-term access to liquidity, the group has loan facilities that are renewed each year. As at these were NOK 312 million. As a result of normal seasonal variations, the group's net interest-bearing debt was at its highest in spring 2015, NOK million. The long term loan facilities as at are expected to be sufficient to cover liquidity needs for the coming one to two years. 87
88 Note 7 - Financial market risk Assets with associated financial market risk consist of loans in foreign currency to subsidiaries, mainly in SEK. Exchange rate exposure is eliminated in that the loans are financed with debts in the same currency. Interest rate risk connected with the same receivables and liabilities is reduced by using rate swaps. In order to assist subsidiaries in covering risks associated with buying and selling currency, and within limits defined by the board, currency positions are taken for use with internal exchange. Note 8 - Guarantee liability Amounts in NOK million Loan guarantees/financial guarantees 144,3 156,2 Unconditional guarantees 442,7 370,3 Tax deduction guarantees 43,6 49,7 Total 630,7 576,1 The company has no restricted bank deposits. The company's cash credit accounts are included in the group's account systems. The company can thus be collectively responsible for more than the company's withdrawals. The employees' tax deduction funds are secured with guarantees furnished by an external credit institution. 88
89 Note 9 - Financial instruments The following types of hedging are used: Rate swaps Currency future contracts Structured forward buying of currency Future contracts for electric power Financial assets entered at fair value Interest rate derivatives 0,0 0,0 Exchange rate derivatives 6,8 18,9 Total assets presented on the financial derivatives line 6,8 18, Financial obligations entered at fair value Interest rate derivatives 76,2 80,1 Exchange rate derivatives 7,7 17,6 Power derivatives *) 25,5 16,8 Total obligations presented on the financial derivatives line 109,4 114,5 *) Power derivatives are entered on the lowest value principle in the parent company and with hedge accounting and deferred entry on the income statement in the group Value changes of financial instruments recognised in the profit and loss account Value change financial instruments, gain 3,9 6,6 Value change financial instruments, loss -12,0-38,9 Net result of financial instruments -8,1-32,3 Fair value of hedging instruments and hedged items are set as follows: The Group has no hedging instruments not traded in functional markets. Fair value is calculated based on observable market prices for similar instruments. 89
90 Nominal value of financial instruments As at 31 December Amounts in NOK million Interest rate derivatives Maturing under 1 year 0,0 0,0 Maturing 2-5 years 128,6 289,9 Maturing 6-10 years 498,0 315,9 Total 626,6 605,8 Interest rate derivatives that is hedge accounted in local GAAP Maturing under 1 year 0,0 0,0 Maturing 2-5 years 0,0 0,0 Maturing 6-10 years 0,0 0,0 Total 0,0 0,0 Currency derivatives, forward contracts for sale of foreign currency Maturing 0-6 months 239,1 356,1 Maturing 7-12 months 28,9 74,0 Maturing >12 months 4,4 5,3 Total 272,4 435,3 Currency derivatives, forward contracts for purchase of foreign currency Maturing 0-6 months 216,5 367,5 Maturing 7-12 months 25,9 82,0 Maturing >12 months 3,9 7,2 Total 246,3 456,7 Power derivatives Maturing under 1 year 33,7 46,2 Maturing 1-2 years 23,0 30,4 Maturing 3-4 years 10,7 18,0 Total 67,4 94,7 90
91 Note 10 Intangible assets Amounts in NOK million Other intangible assets Total Acquisition value as at ,1 22,1 Acquisitions 3,3 3,3 Disposal acquisition value 0,0 0,0 Acquisition value as at ,4 25,4 Accumulated ordinary depreciations ,8 12,8 Disposals accumulated depreciations 0,0 0,0 Depreciation and write downs for the year 4,1 4,1 Accumulated ordinary depreciations ,9 16,9 Book value ,3 9,3 Book value ,5 8,5 Ordinary depreciation rates in per cent 20/33% Amounts in NOK million Other intangible assets Total Acquisition value as at ,4 25,4 Acquisitions 1,9 1,9 Disposal acquisition value 0,0 0,0 Acquisition value as at ,3 27,3 Accumulated ordinary depreciations ,9 16,9 Disposals accumulated depreciations 0,0 0,0 Depreciation and write downs for the year 3,5 3,5 Accumulated ordinary depreciations ,4 20,4 Book value ,5 8,5 Book value ,9 6,9 Ordinary depreciation rates in per cent 20/33% 91
92 Note 11 - Tangible fixed assets Amounts in NOK million Land Buildings and other property Machinery and plant Fixtures and fittings, tools, office machinery etc. Total Acquisition value as at ,7 29,6 11,5 29,2 74,0 Acquisitions 0,0 0,0 1,1 2,4 3,5 Disposal acquisition value 0,0 0,0 0,0 0,0 0,0 Acquisition value as at ,7 29,6 12,6 31,6 77,5 Accumulated ordinary depreciations ,0 22,5 3,5 22,7 48,7 Disposals accumulated depreciations 0,0 0,0 0,0 0,0 0,0 Depreciation and write downs for the year 0,0 0,5 0,7 2,2 3,4 Accumulated ordinary depreciations ,0 23,0 4,2 24,9 52,1 Book value ,7 7,1 8,0 6,5 25,3 Book value ,7 6,6 8,4 6,7 25,4 Ordinary depreciation rates in per cent 0 2,5-10 % 5-10 % % Amounts in NOK million Land Buildings and other property Machinery and plant Fixtures and fittings, tools, office machinery etc. Total Acquisition value as at ,7 29,6 12,6 31,6 77,5 Acquisitions 0,0 0,0 0,0 1,6 1,6 Disposal acquisition value 0,0 0,0-1,4 1,4 0,0 Acquisition value as at ,7 29,6 11,2 34,6 79,1 Accumulated ordinary depreciations ,0 23,0 4,2 24,9 52,1 Disposals accumulated depreciations 0,0 0,0 0,0 0,0 0,0 Depreciation and write downs for the year 0,0 0,5 0,7 2,4 3,6 Accumulated ordinary depreciations ,0 23,5 4,9 27,3 55,7 Book value ,7 6,6 8,4 6,7 25,4 Book value ,7 6,1 6,3 7,3 23,4 Ordinary depreciation rates in per cent 0 2,5-10 % 5-10 % % 92
93 Note 12 - Payroll costs and pension costs/pension liabilities 12.1 Payroll costs Amounts in NOK million Salaries 43,8 48,7 Employer contribution and social costs 7,7 7,0 Pension costs ref. defined benefit and contribution based pension schemes -0,3 3,4 Other benefits/other personnel costs inc. proportion charged to subsidiaries 0,3 0,5 Total 51,5 59,6 Number of man years 52,0 53,0 Pension schemes The group's defined benefit scheme was closed in 2005 and ended in The defined benefit scheme which had a pension coverage of about 60% of final pay at age 67 and a full earning period of 30 years is replaced with a contribution based pension scheme. The contribution scheme has a risk coverage with disability of about 60 per cent (with paid-up pension) and is a solution that is better than the statutory minimum pension solution. Over half of the company's employees are now covered by the contribution based scheme. Unsecured schemes Unsecured schemes are related to the contractual pension scheme (AFP) and other guaranteed pension commitments. These are calculated in accordance with IFRS on pension costs. It was decided to wind up the old AFP scheme in As a result of the change in legislation, contractual pension (AFP) commitments were greatly reduced in 2010 and somewhat reduced in There are no unsecured pension commitments that have not been included in the calculation mentioned above Economic and actuarial assumptions Return on pension funds 2,50 % 3,00 % Discount rate 2,50 % 3,00 % Annual pay increase 2,25 % 3,00 % Annual G adjustment (National Insurance Scheme's basic amount) 2,25 % 3,00 % Annual adjustment of pensions being paid 1,50 % 1,50 % 93
94 12.3 Pension costs Amounts in NOK million Pension entitlements accrued in the year -1,9 1,7 Interest costs on the pension commitments 2,2 2,7 Pension cost (gross) 0,3 4,4 Expected return on pension funds -1,3-1,8 Plan changes and reductions entered on the income statement 0,0 0,0 Administration costs 0,1 0,1 Accrued employers' national insurance contribution -0,2 0,4 Pension costs secured and unsecured defined benefit schemes -1,1 3,1 Contribution pension costs and other pension costs 0,8 0,3 Pension cost (net) entered on the income statement -0,3 3,4 Of which, the pension cost for contractual pensions (AFP) 0,0 0, Pension liabilities Amounts in NOK million Balance as at Accrual of future pensions 83,8 75,9 Pension commitments (gross) 83,8 75,9 Pension funds -54,7-52,7 Employer contributions 4,1 3,3 Pension commitments (net) 33,2 26,5 Balance as at Pension commitments (gross) 19,8 83,8 Pension funds (anticipated) -2,7-54,7 Employer contributions 2,4 4,1 Pension commitments (net) 19,5 33,2 Net pension funds, secured schemes that can be netted 0,0 0,0 Pension commitments, secured (and unsecured) schemes that cannot be netted 19,5 33,2 Pension commitments, contractual pension (AFP) 0,0 0,0 Total pension commitments 19,5 33, Key figures Number of active members secured schemes 4 21 Number of pensioners secured schemes
95 Note 13 - Shares in subsidiaries Amounts in NOK 1,000 Holding % The company s share capital The company s total equity The company s net profit in 2015 Number of shares in Moelven's ownership Total face value Book value Moelven Industrier ASA owns Moelven Van Severen AS 100,0 % Moelven Østerdalsbruket AS 100,0 % Moelven Våler AS 100,0 % Moelven Soknabruket AS 100,0 % Moelven Numedal AS 100,0 % Moelven Løten AS 100,0 % Moelven Telemarksbruket AS 51,0 % Moelven Wood AS 100,0 % Moelven Langmoen AS 100,0 % Moelven Portefølje AS 100,0 % Moelven Eidsvoll AS 100,0 % Moelven Treinteriør AS 100,0 % Moelven Modus AS 100,0 % Moelven ByggModul AS 100,0 % Moelven Bioenergi AS 100,0 % Moelven Elektro AS 100,0 % Moelven Limtre AS 100,0 % Moelven Industrier AB 100,0 % SEK Moelven Danmark A/S 100,0 % DKK Moelven U.K. Ltd 100,0 % 50 GBP Moelven Deutschland GmbH 100,0 % 110 EUR Moelven Nederland B.V. 100,0 % 36 EUR Moelven Are AS 100,0 % Moelven Mjøsbruket AS 100,0 % Moelven Eidsvold Værk AS 100,0 % Moelven Trysil AS 100,0 % Moelven Multi3 AS 100,0 % Moelven Virke AS 100,0 % Moelven Sør Tre AS 100,0 % Moelven Granvin Bruk AS 99,3 % Moelven Wood Prosjekt AS 100,0 % Moelven Profil AS 100,0 % Moelven ByggModul Hjellum AS 100,0 % Total Moelven Industrier ASA Note 14 - Investments in other shares Holding % The company s share capital Number of shares in Moelven's ownership Total face value Book value Amounts in NOK 1,000 Owned by Moelven Industrier ASA: Tretorget AS 26,5 % Others 31 Total Moelven Industrier ASA 831 Note 15 - Investments in associated companies Amounts in NOK 1,000 Holding % The company s share capital The company s total equity The company s net profit in 2015 Number of shares in Moelven's ownership Total face value Book value Owned by Moelven Industrier ASA: Weda Skog AB 30,0 % SEK , Woodtrans AS 34,0 % 750 NOK , Total
96 Note 16 - Equity 16.1 Change in equity Amounts in NOK million Share capital Share premium funds Own shares Other equity Total equity Equity ,7 180,7 0,0 38,8 867,2 Annual profit -7,5-7,5 Actuarial gains and losses pensions 2011 and other direct to equity 4,8 4,8 Allocated to dividend 0,0 0,0 Equity ,7 180,7 0,0 36,1 864,5 For information regarding developments in share capital, summary of shareholders, shareholder agreements and closely related parties, shares owned by members of the board of Directors, corporate assembly and group management, declaration on fixing of salary and other remuneration to group management and also remuneration to the board of directors and corporate assembly, see notes 27, 28 and 29 to the consolidated accounts Remuneration to President and CEO Amounts in NOK 1,000 paid during the financial year Pension costs Other benefits Salary Remuneration to: CEO Morten Kristiansen 3 132,0 842,0 172,5 See note 28 to the consolidated accounts for fixing of salary and other benefits for group management Remuneration to auditor Amounts in NOK million paid during the financial year Amount ex VAT Legally mandated account audit 0,4 0,5 Other services related to certification 0,0 0,0 Tax advisory services 0,1 0,0 For services other than audit 0,1 0,1 Sum 0,6 0,6 96
97 Note 17 - Transactions with related parties Amounts in NOK million Holding % Other operating revenue Interests from group companies Loans to group companies Receivables group contributions Accounts receivable group companies Trade accounts payable to group companies Moelven Industrier ASA Moelven Van Severen AS 100,0 % 1,2 2,5 54,0 Moelven Østerdalsbruket AS 100,0 % 1,0 1,0 22,0 1,5 Moelven Våler AS 100,0 % 3,9 1,1 23,0 1,7 Moelven Soknabruket AS 100,0 % 1,5 3,7 90,0 Moelven Numedal AS 100,0 % 1,6 0,7 15,0 7,0 Moelven Løten AS 100,0 % 1,2 0,2 4,4 Moelven Telemarksbruket AS 51,0 % 1,0 0,5 10,0 Moelven Wood AS 100,0 % 6,3 0,1 1,0 Moelven Langmoen AS 100,0 % 0,8 0,5 10,0 Moelven Eidsvoll AS 100,0 % 0,5 0,4 9,0 Moelven Treinteriør AS 100,0 % 0,5 0,1 3,0 Moelven Modus AS 100,0 % 3,7 14,5 0,3 Moelven Modus Prosjekt AS 100,0 % Moelven ByggModul AS 100,0 % 5,1 0,7 Moelven ByggModul Hjellum AS 100,0 % Moelven Bioenergi AS 100,0 % 0,2 0,7 12,0 Moelven Elektro AS 100,0 % 2,8 0,1 Moelven Limtre AS 100,0 % 5,0 0,1 Moelven Industrier AB 100,0 % 0,1 19,8 524,0 1,2 Moelven Are AS 100,0 % 0,4 Moelven Mjøsbruket AS 100,0 % 1,9 0,7 15,0 8,8 Moelven Eidsvold Værk AS 100,0 % 1,3 2,9 62,0 Moelven Trysil AS 100,0 % 0,8 Moelven Multi3 AS 100,0 % 1,0 0,3 6,7 0,1 Moelven Virke AS 100,0 % 0,5 1,9 0,3 Moelven Sør Tre AS 100,0 % 0,4 0,8 15,7 Moelven Granvin Bruk AS 99,3 % 0,6 0,5 11,4 Moelven Wood Prosjekt AS 100,0 % 0,2 Moelven Profil AS 100,0 % 1,6 1,4 30,0 Moelven Danmark AS 100,0 % 0,8 0,1 0,3 Moelven UK Ltd. 100,0 % 6,0 Swedish companies owned by Moelven Industrier AB Moelven Notnäs AB 100,0 % 4,3 1,6 41,9 0,0 Moelven List AB 100,0 % 0,7 0,4 10,7 Moelven ByggModul AB 100,0 % 4,2 Moelven Norsälven AB 100,0 % 2,2 0,4 9,7 Moelven Ransbysågen AB 100,0 % 1,6 0,6 14,1 Moelven Värmlands Trä AB 100,0 % 0,6 0,4 10,9 Moelven Component AB 100,0 % 1,1 0,5 12,6 Skåre Kontorshotell AB 100,0 % 0,1 1,7 Moelven Wood AB 100,0 % 5,3 Moelven Notnäs Wood AB 100,0 % 0,5 Moelve Valåsen Wood AB 100,0 % 1,0 1,7 45,5 Moelven Valåsen AB 100,0 % 7,1 2,3 56,5 Moelven Dalaträ AB 100,0 % 3,6 1,0 26,0 0,0 Moelven Modus AB 100,0 % 2,3 0,0 Moelven Edanesågen AB 100,0 % 1,7 2,6 69,0 Moelven Nössemark Trä AB 100,0 % 2,4 3,1 81,7 Moelven Årjäng Såg AB 100,0 % 3,0 0,0 Moelven Tom Heurlin AB 100,0 % 1,7 1,6 39,8 0,0 0,1 Moelven Skog AB 100,0 % 1,5 1,2 33,1 Moelven Töreboda AB 100,0 % 2,1 1,0 24,0 Vänerbränsle AB 82,3 % Moelven Lovene AB 100,0 % 0,1 0,5 7,0 Moelven Vänerply AB 100,0 % 1,7 3,9 89,6 UJ Trading AB 100,0 % 0,2 Other companies Various companies not specified 1) 0,1 0,4 Total 94, ,0 35,5 1,1 3,8 1) Included to show the total amounts 97
98 To the Annual Shareholders Meeting of Moelven Industrier ASA INDEPENDENT AUDITOR S REPORT Report on the Financial Statements We have audited the accompanying financial statements of Moelven Industrier ASA, which comprise the financial statements of the parent company Moelven Industrier ASA and the consolidated financial statements of Moelven Industrier ASA and its subsidiaries. The parent company s financial statements comprise the balance sheet as at 31 December 2015, the income statement, statement of changes in equity and cash flow statement for the year then ended, and a summary of significant accounting policies and other explanatory information. The consolidated financial statements comprise the balance sheet as at 31 December 2015, and the income statement and the statement of other comprehensive income, statement of changes in equity and cash flow statement for the year then ended, and a summary of significant accounting policies and other explanatory information. The Board of Directors and the Managing Director s Responsibility for the Financial Statements The Board of Directors and the Managing Director are responsible for the preparation and fair presentation of the parent company financial statements in accordance with the Norwegian Accounting Act and accounting standards and practices generally accepted in Norway and for the consolidated financial statements in accordance with International Financial Reporting Standards as adopted by the EU, and for such internal control as the Board of Directors and the Managing Director determine is necessary to enable the preparation of financial statements that are free from material misstatement, whether due to fraud or error. Auditor s Responsibility Our responsibility is to express an opinion on these financial statements based on our audit. We conducted our audit in accordance with laws, regulations, and auditing standards and practices generally accepted in Norway, including International Standards on Auditing. Those standards require that we comply with ethical requirements and plan and perform the audit to obtain reasonable assurance about whether the financial statements are free from material misstatement. An audit involves performing procedures to obtain audit evidence about the amounts and disclosures in the financial statements. The procedures selected depend on the auditor s judgment, including the assessment of the risks of material misstatement of the financial statements, whether due to fraud or error. In making those risk assessments, the auditor considers internal control relevant to the entity s preparation and fair presentation of the financial statements in order to design audit procedures that are appropriate in the circumstances, but not for the purpose of expressing an opinion on the effectiveness of the entity s internal control. An audit also includes evaluating the appropriateness of accounting policies used and the 98
99 reasonableness of accounting estimates made by management, as well as evaluating the overall presentation of the financial statements. We believe that the audit evidence we have obtained is sufficient and appropriate to provide a basis for our audit opinion. Opinion on the separate financial statements In our opinion, the parent company s financial statements are prepared in accordance with the law and regulations and give a true and fair view of the financial position of Moelven Industrier ASA as at 31 December 2015, and of its financial performance and its cash flows for the year then ended in accordance with the Norwegian Accounting Act and accounting standards and practices generally accepted in Norway. Opinion on the consolidated financial statements In our opinion, the consolidated financial statements are prepared in accordance with the law and regulations and give a true and fair view of the financial position of Moelven Industrier ASA and its subsidiaries as at 31 December 2015, and of its financial performance and its cash flows for the year then ended in accordance with International Financial Reporting Standards as adopted by the EU. Report on Other Legal and Regulatory Requirements Opinion on the Board of Directors report and the statements on Corporate Governance and Corporate Social Responsibility Based on our audit of the financial statements as described above, it is our opinion that the information presented in the Board of Directors report and in the statements on Corporate Governance and Corporate Social Responsibility concerning the financial statements, the going concern assumption and the coverage of the loss is consistent with the financial statements and complies with the law and regulations. Opinion on Accounting Registration and Documentation Based on our audit of the financial statements as described above, and control procedures we have considered necessary in accordance with the International Standard on Assurance Engagements (ISAE) 3000, «Assurance Engagements Other than Audits or Reviews of Historical Financial Information», it is our opinion that the management has fulfilled its duty to produce a proper and clearly set out registration and documentation of the company s accounting information in accordance with the law and bookkeeping standards and practices generally accepted in Norway. Tynset, 3 March 2016 KPMG AS Halvor Hektoen State authorized public accountant [Translation has been made for information purposes only] 99
100 Statement by the Corporate Assembly The following items were discussed at the meeting of the Corporate Assembly held on 17 March 2016: Annual report and proposed Annual Financial Statement by the Board of Directors and President/CEO for the 2015 accounting year for Moelven Industrier ASA and group. Board s proposed allocation of profit for year in Moelven Industrier ASA. Board s determination of remuneration to Group Executive Board. The Statement by the Corporate Assembly to the general meeing. The Corporate Assembly recommends that the general meeting approve the Board of Directors and CEO s annual report and accounts for Moelven Industrier ASA and group in 2015, including allocation of the result for the year in Moelven Industrier ASA. The Corporate Assembly also recommends that the general meeting approve the Board of Directors proposal for remuneration to corporate management. 17 March 2016 Egil Magnar Stubsjøen Chairman of the Corporate Assembly 100
101 Financial calendar January 2016 Fourth Quarter report 2015 / Preliminary annual result April 2016 General meeting Annual Accounts 2015 Publishing Quarterly 27 April 2016 First Quarter Report August 2016 Second Quarter Report October 2016 Third Quarter Report January 2017 Fourth Quarter report 2016 / Preliminary annual result 2016 Head office: Moelven Industrier ASA Org.nr. NO MVA P.O. Box 134, NO-2391 Moelv Tel Fax moelven.com post@moelven.com Frontcover: Sjöterrassen Foto: David Bicho/Kjellander + Sjöberg Architects 101
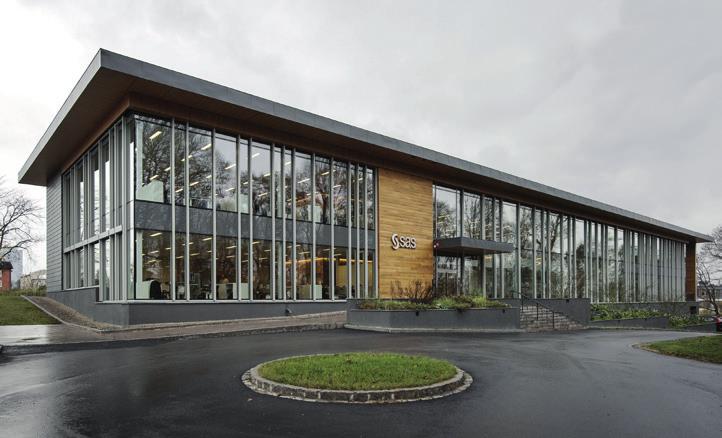
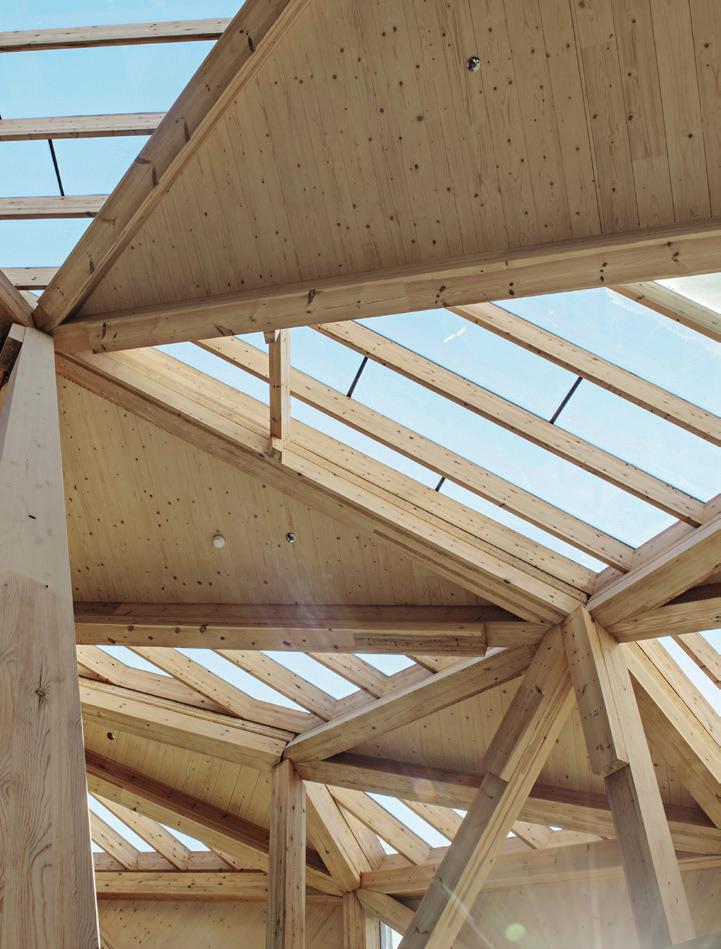
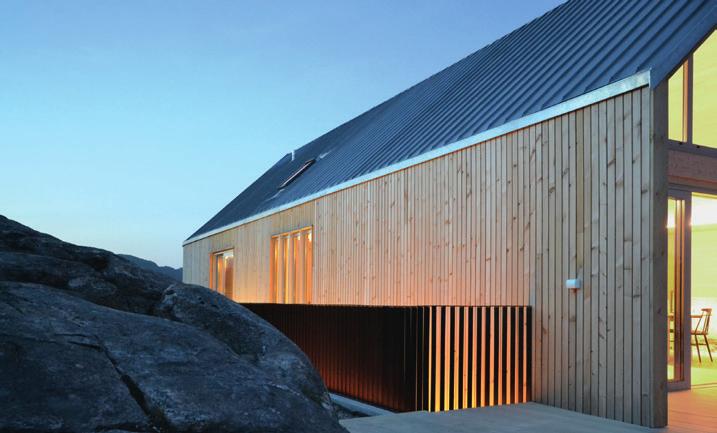
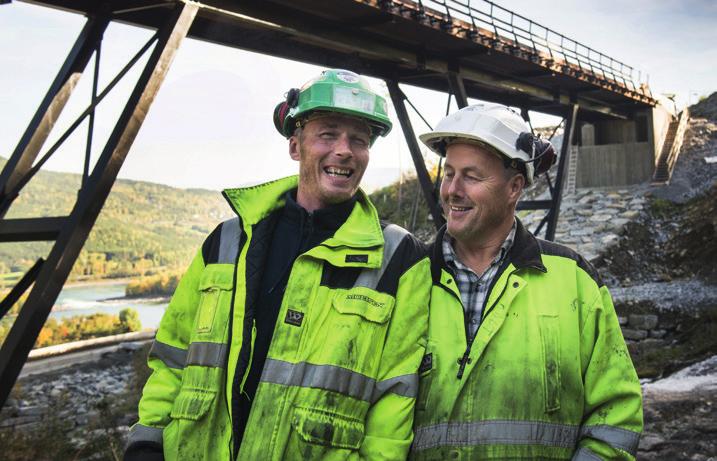
102
Quarterly Report 2/2015
 Gode rom Quarterly Report 2/2015 Sognefjellshytta. A unique design made of laminated timber, delivered as pre cut from Moelven Limtre AS. Jan Olav Jensen, Jensen og Skodvin Arkitekter. Photographer : Hampus
Quarterly Report 3/2015
 Quarterly Report 3/2015 Moelven ByggModul will deliver 52 apartments in Fjeldsetlia Park in Elverum. Production will be done at Moelven ByggModul Hjellum AS and is the company s first residential concept
Quarterly Report 3/2016
 Quarterly Report 3/2016 Kimen Kulturhus. Moelven Wood Prosjekt has supplied fire resistant wood of spruce. Photo: Lene M. Prøven. Architect: Reiulf Ramstad Arkitekter/JSTArkitekter/Lusparken Arkitekter
Quarterly Report 1/2018
 Quarterly Report 1/2018 Grilstad Marina, Havseilerveien, Trondheim. Untreated cedarwood facades delivered by Moelven Wood Prosjekt AS. Photo: Matthias Christoph Herzog. Amounts in NOK million First quarter
Oiled wood based interior products in the same color range provide a warm atmosphere. Delivered by Moelven Wood AS. Photo: Einar Breen.
 Oiled wood based interior products in the same color range provide a warm atmosphere. Delivered by Moelven Wood AS. Photo: Einar Breen. Quarterly Report 4/2017 Amounts in NOK million Fourth quarter 12
ANNUAL REPORT Mjøstårnet, Brumunddal. Photo: Moelven
 ANNUAL REPORT 2017 Mjøstårnet, Brumunddal. Photo: Moelven This document contains the formal requirements for annual reporting. The annual report for Moelven 2017 with complementary information about the
Quarterly Report 1/2011. Quality Rooms
 Quarterly Report 1/2011 Quality Rooms Profit and Loss Account 1 st Quarter Operating revenues 1,953.4 1,476.8 1,456.2 7,184.5 6,247.8 Depreciation 56.1 51.4 46.9 212.8 202.5 Cost of goods sold 1,300.3
Quarterly Report 1/2010. Quality Rooms
 Quarterly Report 1/2010 Quality Rooms Profit and Loss Account 1 st Quarter Total Operating revenues 1,476.8 1,456.2 1,951.3 6,247.8 7,657.7 Depreciation 51.4 46.9 46.7 202.5 199.2 Cost of goods sold 878.9
Quality rooms. Quarterly report 1/2013. Architect: AG Arkitekter. Photo: Carl Swensson.
 Quality rooms Quarterly report 1/2013 Architect: AG Arkitekter. Photo: Carl Swensson. Amounts in NOK million First quarter 12 months 2013 2012 2012 2011 Operating revenues 1 848.7 2 165.4 8 121.5 8 059.9
Quality rooms. Quarterly report 4/2013
 Quality rooms Quarterly report 4/2013 Strandparken in Sundbyberg is the Stockholm area s first eight storey house built entirely of wood. The house facade is shavings of Western Red Cedar (WRC) from Moelven.
Quarterly report 3/2006
 Quarterly report 3/2006 Laminated timber from Moelven has been used both as load-bearing beams and external, fire-resistant panelling at Midtbyen in Trondheim. Profit and Loss Account Change in 3 r d Quarter
Quarterly Report 1/2017
 Quarterly Report 1/2017 Herrestaskolan in Järfälla. Interior products from Moelven Töreboda AB. Photo: Hampus Lundgren. Amounts in NOK million First quarter Total 2017 2016 2016 2015 Operating revenues
Quality rooms. Quarterly report 2/2012. Photo: Moelven Wood AS supplies thermo-treated ash decking.
 Quality rooms Quarterly report 2/2012 Photo: Moelven Wood AS supplies thermo-treated ash decking. Amounts in NOK million Second quarter 6 months Total 2012 2011 2012 2011 2011 2010 Operating revenues 2
Quality Rooms. Quarterly Report 2/2011. Moelven ByggModul AS supplied apartments for Castbergtunet, Oslo Architect: Incudo. Client: Skanska Bolig AS.
 Quality Rooms Quarterly Report 2/2011 Moelven ByggModul AS supplied apartments for Castbergtunet, Oslo Architect: Incudo. Client: Skanska Bolig AS. Profit and Loss Account Balance Sheet NOK mill. 2 nd
Quarterly Report 1/2009. Quality Rooms
 Quarterly Report 1/2009 Quality Rooms Profit and Loss Account 1 st Quarter Total Operating revenues 1,456.2 1,951.3 1,988.5 7,657.7 7,944.0 Depreciation 46.9 46.7 44.0 199.2 177.0 Cost of goods sold 959.1
Quarterly report 1/2006
 Quarterly report 1/2006 Profit and Loss Account Operating revenues 1,557.0 1,411.2 1,407.0 6,004.9 5,773.2 Depreciation 42.9 46.3 42.5 178.0 177.5 Cost of goods sold 975.4 893.1 885.1 3,809.4 3,667.3 Operating
Quarterly report 4/2007. Moelven Wood AS supplies flooring, panelling and moulding for quality rooms.
 Quarterly report 4/2007 Moelven Wood AS supplies flooring, panelling and moulding for quality rooms. Profit and Loss Account 4 th Quarter Operating revenues 1,983.2 1,830.8 1,528.1 7,944.0 6,692.4 6,004.9
Quarterly Report 3/011. Quality rooms
 Quality rooms Quarterly Report 3/011 The Moelven S-beam (S-bjelken) is a new laminated timber product, the optimal beam for rafters and joists. The beam has been technically certified and comes in several
Quarterly Report 2/2010. Quality Rooms
 Quality Rooms Quarterly Report 2/2010 At Slemmestad outside of Oslo, Moelven ByggModul AS has built three apartment blocks containing 50 apartments. Romerike Arkitekter AS. Rortunet Eiendom AS, Slemmestad
Quarterly report 2/2008
 Quarterly report 2/2008 Moelven Nordia AS has supplied the interior layout for Smedvik Eiendom's new building outside of Stavanger. Product: Nordia Flush Front. Building architect: Petter Giske at Multiconsult
Quarterly Report 2/2009. Quality Rooms
 Quality Rooms Quarterly Report 2/2009 Iso3 is an insulated framework materiel that contributes to reducing energy needs in buildings. The new product prevents thermal bridges and is specially developed
Quarterly report 3/2007
 Quarterly report 3/2007 Moelven's stand at this year's builders' trade fair Bygg Reis Deg attracted a wide audience, and both staff and visitors appreciated our "Quality Rooms". Profit and Loss Account
Quarterly report 3/2005. The publishing house Bonnier s office layout from Moelven Eurowand AB in the restaurant area of kv. Moraset in Stockholm.
 Quarterly report 3/2005 The publishing house Bonnier s office layout from Moelven Eurowand AB in the restaurant area of kv. Moraset in Stockholm. Profit and Loss Account Change in 3 rd Quarter Nine months
Quarterly report 2/2005. Thirty 3D BoKlok apartments have been built at Fagerstrand outside of Oslo.
 Quarterly report 2/2005 Thirty 3D BoKlok apartments have been built at Fagerstrand outside of Oslo. Profit and Loss Account 2 nd Quarter 1 st half-year Total Operating revenues 1,674.4 1,573.4 1,306.7
Interim report January March 2015
 Interim report January March 215 Photo: Bengt Alm 1 January 31 March 215 Net sales decreased by 1% to SEK 1,548 million (1,564). The change is due to a 1% reduction in delivery volumes and a 1% average
Interim report January June 2015
 Interim report January June 215 Photo: Shutterstock 1 April 3 June 215 Net sales decreased by 1% to SEK 1,7 million (1,718). Delivery volumes increased by 1% and the prices fell in average by 1%. Operating
3 months 12 months Setra Group Group Oct.-Dec. Oct.-Dec. Jan.-Dec. Jan.-Dec.
 Year-End Report 28 SETRA GROUP AB (publ), Box 327, 169 3 Solna, Sweden, tel. +46 8 75 3, www.setragroup.se, corp. reg. no. 55634-8483 Page 1 of 13 Year-End Report 28 Consolidated net sales for 28 amounted
January March. Earnings per share
 January March Q1 First quarter Net sales amounted to SEK 1,583 million (1 666). Prices fell by an average of 11% while delivery volumes rose 3% compared with the fi rst quarter in the previous year. Operating
Interim Report for Duni AB (publ) 1 January 30 June 2009
 1 January 30 June 2009") Interim Report for Duni AB (publ) 1 January 30 2009 (compared with the same period of the previous year) 29 July 2009 Strong cash flow and stable profitability 1 January 30 2009 Net sales increased by
Interim Report for Duni AB (publ) 1 January 30 2009 (compared with the same period of the previous year) 29 July 2009 Strong cash flow and stable profitability 1 January 30 2009 Net sales increased by
Holmen s interim report January June 2016
 Holmen s interim report January June 216 2-16 1-16 2-15 216 215 215 Net sales 3 937 3 828 4 139 7 765 8 293 16 14 Operating profit excl. items affecting comparability 483 58 435 1 63 831 1 7 Operating
Year-end report 2009
 Year-end report 2009 Year-end report 2009 Fourth quarter Year ended on a strong note with increased sales. Good demand for wood raw material, primarily sawlogs and biofuel, with rising prices. Net sales
Clas Ohlson: Year-end report 1 May April 2013
 Clas Ohlson: Year-end report 1 May 2012 30 April 2013 Fourth quarter * Sales totalled SEK 1,274 M (1,272). In local currencies, growth was 3%. * Operating loss of SEK 19 M reported (profit: 10). * Loss
Interim report January June 2010
 Interim report January June 2010 Interim report January June 2010 Second quarter Net sales rose to SEK 1,970 million (1,679), as a result of both increased volumes and higher prices. Operating profit from
Interim report January June 2008
 Interim report January June 2008 Interim report January June 2008 Second quarter Prices for fibre continues to increase while prices for sawlogs are stable. Agreement signed for biofuel production based
Interim Report January June Cash flow from operating activities was SEK 323 million (107)
") Interim Report January June 2014 NET SALES WERE SEK 5,840 MILLION (5,535) OPERATING PROFIT WAS SEK 296 MILLION (253) Cash flow from operating activities was SEK 323 million (107) Highlights of the period
Interim Report January June 2014 NET SALES WERE SEK 5,840 MILLION (5,535) OPERATING PROFIT WAS SEK 296 MILLION (253) Cash flow from operating activities was SEK 323 million (107) Highlights of the period
Interim Report for Duni AB (publ) 1 January 31 December 2010 (compared with the same period of the previous year)
 1 January 31 December 2010 (compared with the same period of the previous year)") Interim Report for Duni AB (publ) 1 January 31 (compared with the same period of the previous year) 16 February 2011 Improved operating margin of 14.8% for the quarter 1 January 31 Net sales amounted to
Interim Report for Duni AB (publ) 1 January 31 (compared with the same period of the previous year) 16 February 2011 Improved operating margin of 14.8% for the quarter 1 January 31 Net sales amounted to
Q JANUARY 1 MARCH 31, 2018 (compared with the year-earlier period) EARNINGS TREND
 EARNINGS TREND") Q1 218 JANUARY 1 MARCH 31, 218 (compared with the year-earlier period) Net sales increased 11% to SEK 4,4m (3,972). Sales growth was mainly related to higher prices in the industrial units. EBITDA rose
Q1 218 JANUARY 1 MARCH 31, 218 (compared with the year-earlier period) Net sales increased 11% to SEK 4,4m (3,972). Sales growth was mainly related to higher prices in the industrial units. EBITDA rose
EBITDA margin Earnings per share SEK Operating cash flow ,751 2,273
 Q4 218 FULL YEAR 218 (217) Net sales increased 13% to SEK 18,755m (16,664). Sales grew in all segments. EBITDA increased 44% to SEK 5,252m (3,648). The improvement in EBITDA was mainly related to higher
JANUARY 1 SEPTEMBER 30, 2018 (compared with the year-earlier period)
") Q3 218 JANUARY 1 SEPTEMBER 3, 218 (compared with the year-earlier period) Net sales increased 11% to SEK 13,829m (12,422). The growth was primarily attributable to Paper and Wood. EBITDA increased 46%
Q3 218 JANUARY 1 SEPTEMBER 3, 218 (compared with the year-earlier period) Net sales increased 11% to SEK 13,829m (12,422). The growth was primarily attributable to Paper and Wood. EBITDA increased 46%
Interim report January March 2009
 Interim report January March 2009 Interim report January March 2009 First quarter Low sales volume to sawmills and the pulp and paper industry. Further reductions in timber prices. Good demand for biofuel
INTERIM REPORT JANUARY-MARCH 2011
 INTERIM REPORT JANUARY-MARCH 2011 SoliQ, a unique service concept for the Global Produce Supply Chain Billerud s subsidiary, Billerud Fresh Services, is now launching SoliQ, an optimised corrugated packaging
Interim Report Q3 2017
 Interim Report Q3 217 JANUARY 1 SEPTEMBER 3, 217* (compared with the year-earlier period, continuing operations) Net sales increased 9% to SEK 12,422m (11,434) Adjusted EBITDA improved 1% to SEK 2,683m
Interim report 1 January 30 September 2016
 This English translation is for the information purposes only. In case of any discrepancies between this version and the Swedish, the Swedish version shall prevail. Interim report 1 January 30 September
Profit after tax for January June 2010 was SEK 312 million (January June 2009: SEK 501 million).
.") 2-1 1-1 2-9 21 29 29 Net turnover 4 227 4 4 4 496 8 628 9 25 18 71 Operating profit 268 32 372 588 787 1 62 Profit after tax 133 178 256 312 51 1 6 Earnings per share, SEK 1.6 2.1 3. 3.7 6. 12. Return
2-1 1-1 2-9 21 29 29 Net turnover 4 227 4 4 4 496 8 628 9 25 18 71 Operating profit 268 32 372 588 787 1 62 Profit after tax 133 178 256 312 51 1 6 Earnings per share, SEK 1.6 2.1 3. 3.7 6. 12. Return
60 Kärnhem. 348 BWG Homes AB. 643 Block Watne 2 QUARTER NEW ORDERS NOK million OPERATIONAL REVENUES NOK million 1 053
 2 QUARTER 2013 NEW ORDERS NOK million 1 088 OPERATIONAL REVENUES NOK million 1 053 OPERATIONAL EBITDA MARGIN Per cent 12.3 OPERATIONAL REVENUE PER BUSINESS AREA NOK million 60 Kärnhem 643 Block Watne 348
Interim Report Jan June, 2017
 Interim Report Jan June, 217 Sundsvall, July 21, 217 JANUARY 1 JUNE 3, 217 (compared with the year-earlier period) During the period, shares in the discontinued operation Essity (the hygiene business)
Interim report. 1 January 31 March I n t e r i m r e p o r t Q JANUARY 31 MARCH 2008 (compared with the same period previous year)
") I n t e r i m r e p o r t Q 1 2 0 0 8 Interim report 1 January 31 March 2008 1 JANUARY 31 MARCH 2008 (compared with the same period previous year) Net sales rose 7% to SEK 27,513m (25,615). Profit before
I n t e r i m r e p o r t Q 1 2 0 0 8 Interim report 1 January 31 March 2008 1 JANUARY 31 MARCH 2008 (compared with the same period previous year) Net sales rose 7% to SEK 27,513m (25,615). Profit before
THIRD QUARTER Strong performance in Collection Technology Deposit. Improved performance and outlook in Industrial Processing Technology
 THIRD QUARTER 2009 Highlights from third quarter 2009 include: Strong performance in Collection Technology Deposit Improved performance and outlook in Industrial Processing Technology California negatively
Strong online sales and improved margins
 FIRST QUARTER SEPTEMBER 1, 2016 NOVEMBER 30, 2016 Strong online sales and improved margins Interim Report September November 2016 First quarter Net sales for the quarter increased 7.5 per cent to SEK 2,284
Interim Report 1 January 30 September 2013
 Interim Report 1 January 30 September 2013 Board of Directors 31 October 2013 1 VAPO OY INTERIM REPORT 1 JANUARY 30 SEPTEMBER 2013 July-September Group turnover in the July-September period was EUR 107.9
Interim Report 4th quarter 2017 and preliminary report. Gjensidige Forsikring Group
 Interim Report 4th quarter 2017 and preliminary report Gjensidige Forsikring Group Group highlights Fourth quarter and preliminary result 2017 In the following, figures in brackets indicate the amount
Metsä Group Interim Report Q3/2016
 Metsä Group Interim Report Q3/2016 Kari Jordan President and CEO Metsä Group Q3 Business developed as expected Sales EUR 3,483 million (1 9/2016: EUR 3,811 million) Comparable operating result EUR 332
UPM-KYMMENE INTERIM REVIEW 1 JANUARY 31 MARCH 2001
 U P M - K y m m e n e I N T E R I M R E V I E W 1 3 / 2 0 0 1 UPM-KYMMENE INTERIM REVIEW 1 JANUARY 31 MARCH 2001 Profit before extraordinary items and capital gains EUR 351 million (331 million for 1 3/2000).
Q third quarter of Solør Bioenergy Group Interim report for the
 Q3 2016 Solør Bioenergy Group Interim report for the third quarter of 2016 January September 2016 Solör Bioenergi Holding AB (publ), Corp. Reg. No. 556907 9535 Stockholm, October 28, 2016 www.solorbioenergi.com
The Group s net turnover increased by 11 per cent to SEK 287 M (323)
") 1 VBG GROUP AB (publ) in Vänersborg is the Parent Company of an international engineering Group with wholly-owned manufacturing and sales companies in Europe, India and the USA. The Group s operations
1 VBG GROUP AB (publ) in Vänersborg is the Parent Company of an international engineering Group with wholly-owned manufacturing and sales companies in Europe, India and the USA. The Group s operations
Func Food Group Financial Release / Q1 2018
 Func Food Group Financial Release / Q1 2018 Func Food Group Financial Release / Q1 2018 Func Food Group / Q1 2018 3 FUNC FOOD GROUP IN BRIEF Func Food Group ( FFG ) is a Nordic wellness company, which
Interim report Q3 2014
 Interim report Q3 2014 Contents Management report 3 Highlights 4 Key figures and financial ratios 5 Developments in Q3 2014 7 Outlook 8 Risk factors 9 Management statement 20 Hartmann at a glance Interim
NYNAS Interim report 1 january 30 June 2014
 NYNAS Interim report 1 january 30 June 2014 2 Interim report 1 january 30 June 2014Q2 Nynas AB (Publ.), corporate re. no 556029-2509, parent company for Nynas. Nynas is a leading international group specialised
REPORT 1ST QUARTER NRC GROUP ASA / Q1 REPORT 2018
 REPORT 1ST QUARTER 2018 NRC GROUP ASA / Q1 REPORT 2018 Highlights 1 st quarter 2018 / KEY EVENTS Record-high order intake of NOK 1,727 million, an increase of 126% compared to 1 st quarter 2017 Appointed
UPM-KYMMENE INTERIM REVIEW 1 JANUARY 30 JUNE 2001
 UPM-KYMMENE INTERIM REVIEW 1 JANUARY 30 JUNE 2001 Earnings per share, excluding net capital gains, improved to EUR 1.91 (1 6/2000: 1.80). Profit before extraordinary items and net capital gains was EUR
INTERIM REPORT 1 JANUARY 30 SEPTEMBER 2011
 INTERIM REPORT 1 JANUARY 30 SEPTEMBER 2011 1 2 3 4 UPM INTERIM REPORT 1 JANUARY 30 SEPTEMBER 2011 Q3/2011 Earnings per share excluding special items were EUR 0.19 (0.28), and reported EUR 0.21 (0.34) EBITDA
Interim report January to June 2017
 Interim report January to June 2017 High and profitable growth Second quarter Net sales increased during the second quarter by 145,0% to 50,5 MSEK (20,6) Result before depreciation (EBITDA) increased during
ANNUAL REPORT Statement of comprehensive income. Page 17 Notes to the financial statements
 ANNUAL REPORT 2017 The Board of Directors and CEO of Nordic Guarantee Försäkringsaktiebolag hereby present the Annual Report for the financial year ended 31 December 2017. Page 1 Page 3 Page 4 Page 5 Page
press release Report for the first quarter of 2011 First quarter
 press release 3 May 2011 Report for the first quarter of 2011 First quarter Net turnover amounted to SEK 4,344 M (3,742). Operating profit was SEK 98 M (83) and the margin was 2.3 per cent (2.2). Profit
press release Report for the first six months of 2010 First six months Second quarter
 press release 28 July 2010 Report for the first six months of 2010 First six months Net turnover amounted to SEK 7,900 M (6,609). Operating profit was SEK 212 M (23) and the operating margin was 2.7 per
INTERIM REPORT JANUARY SEPTEMBER * Net turnover amounted to MSEK 11,107 (10,772 excluding divested activities).
.") INTERIM REPORT JANUARY SEPTEMBER 2000 Highlights * Profit after financial items amounted to MSEK 4,317 (corresponding period 1999: 1,778). The third quarter profit amounted to MSEK 2,508 (second quarter:
INTERIM REPORT JANUARY SEPTEMBER 2000 Highlights * Profit after financial items amounted to MSEK 4,317 (corresponding period 1999: 1,778). The third quarter profit amounted to MSEK 2,508 (second quarter:
Cash flow from operations in the quarter of NOK 51.5 million
 Revenues of NOK 436.2 million, an increase of 5.1 %. EBITDA of NOK 46.1 million down from NOK 62.5 million. One-off costs for recruitment and severance of NOK 3.7 million taken in the quarter. EBITDA margin
Holmen s year-end report 2016
 Holmen s year-end report 216 Full Year 4-16 3-16 4-15 216 215 Net sales 3 937 3 81 3 689 15 513 16 14 Operating profit excl. items affecting comparability 579 52 376 2 162 1 7 Operating profit 579 52-555
interim report fourth quarter and preliminary Gjensidige insurance group
 interim report fourth quarter and preliminary 2009 Gjensidige insurance group GROUP HIGHLIGHTS FOURTH QUARTER 2009 The Group had a solid profit performance in the quarter. The profit before tax expense
Interim report Q3, July September 2017 Stockholm, 25 October 2017
 Interim report Q3, July September Stockholm, 25 October As of the second quarter of, Cloetta Italia S.r.l. is accounted for as discontinued operation. The comparative figures in the consolidated profit
FOURTH QUARTER NORSKE SKOG NORWEGIAN PAPER TRADITION
 2011 FOURTH QUARTER NORSKE SKOG NORWEGIAN PAPER TRADITION 1 INTERIM FINANCIAL REPORT NORSKE SKOG OUR BUSINESS Norske Skog is a world leading producer of newsprint and magazine paper. The group has 14 fully
During the first quarter, the revenue and the operating result improved slightly on last year.
 1 (12) MARTELA CORPORATION INTERIM REPORT 29 April 2016 at 8.30 a.m. MARTELA CORPORATION INTERIM REPORT, 1 January 31 March 2016 During the first quarter, the revenue and the operating result improved
Economic Activity Report
 Economic Activity Report FOR THE SCANDINAVIAN COUNTRIES October 2007 New developments since June highlights Some unrest in the financial markets, but it will pass International economy In the spring and
New record results for a third quarter
 New record results for a third quarter The third quarter of 2018 Net turnover amounted to SEK 6,119 M (6,302), a decrease of 3 per cent. Operational earnings amounted to SEK 221 M (200). The improved profit
INTERIM REPORT 1 JANUARY 31 MARCH 2015
 INTERIM REPORT 1 JANUARY 31 MARCH 2015 Quarterly period January-March, continuing Reported revenue, earnings, cash flow and financial ratios relate to continuing, and do not include Poolia UK. Revenue
Interim financial report 2 nd Quarter
 2018 Interim financial report 2 nd Quarter Cembrit Group A/S - Sohngårdsholmsvej 2-9000 Aalborg - Denmark - www.cembrit.com - Central Business Reg. No. 36477199 Table of contents Presentation of the group...
EMPOWERING INNOVATION
 EMPOWERING INNOVATION INTERIM REPORT THIRD QUARTER 2017 This English translation is for information purposes only. In case of any discrepancies between this version and the Swedish, the Swedish version
Read the full CEO statement on the next page.
 Sales for the quarter were marked by a more balanced offer in which both the Christmas trade and subsequent clearance sales had a good structure. Full-price sales at the start of the season were also satisfactory,
Interim Report January September
 DELÅRSRAPPORT JANUARI SEPTEMBER 20 10 Interim Report January September 1 Handelsbanken INTERIM REPORT JANUARY SEPTEMBER Handelsbanken s Interim Report January September Sammanfattning january september,
Interim report Q1 2017
 Interim report Q1 2017 MANAGEMENT REPORT FINANCIAL STATEMENTS Contents Management report 3 Highlights 4 Key figures and financial ratios 5 Developments in Q1 2017 8 Outlook 9 Risk Financial statements
Interim Report January - March 2015
 Interim Report January - March 2015 The period January - March 2015* Net sales increased by 23% in the period to SEK 1,848 (1,508) m. Adjusted EBITA improved by SEK 19 m, and amounted to SEK 100 (81) m.
Proffice grows on a stagnating market
 Proffice grows on a stagnating market Q1 2012 year-on-year comparison Net sales increased 9 per cent to SEK 1,200 million (1,096) EBITA and operating profit declined 13 per cent to SEK 40 million (46)
Boule Diagnostics AB (publ)
") Boule Diagnostics AB (publ) Year-end report January ember 2011 Continued positive growth in Asia Record delivery to India Quarter October ember 2011 * Net sales amounted to SEK 67.7 (67.0) million, corresponding
Boule Diagnostics AB (publ) Year-end report January ember 2011 Continued positive growth in Asia Record delivery to India Quarter October ember 2011 * Net sales amounted to SEK 67.7 (67.0) million, corresponding
interim report Q1 2007
 interim report 27 2 Key items Figures in brackets refer to the first quarter of 26 unless otherwise stated. Profit before tax slightly reduced NOK 15.7 million (NOK 16.1 million). Profit before tax amounted
Fredrik Börjesson. Stefan Hedelius
 15995949.1 Extraordinary General Meeting in Momentum Group AB (publ) on 28 November 2017. Account of the Board of Directors of Momentum Group AB (publ) in accordance with Chapter 19, Section 24, Paragraph
Operating earnings (EBIT) were SEK 118 million (95), which corresponds to an operating margin of 5.8% (5.3).
 were SEK 118 million (95), which corresponds to an operating margin of 5.8% (5.3).") JANUARY SEPTEMBER 2015 INTERIM REPORT Growth, improved earnings and strong order bookings third quarter Net sales reached SEK 618 million (593), up 4.1% on the same period last year. Operating earnings
JANUARY SEPTEMBER 2015 INTERIM REPORT Growth, improved earnings and strong order bookings third quarter Net sales reached SEK 618 million (593), up 4.1% on the same period last year. Operating earnings
FREJA Transport & Logistics Holding A/S
 FREJA Transport & Logistics Holding A/S Annual Report 2016 Viborgvej 52 DK-7800 Skive CVR nr. 35839224 www.freja.com Contents FINANCIAL HIGHLIGHTS 2 MANAGEMENT COMMENTARY 3 STATEMENTS AND REPORTS Statement
Net interest-bearing debt at 30 September 2016 was DKK million (30 September 2015: DKK 476 million).
.") H+H International A/S Interim financial report Company Announcement No. 343, 2016 H+H International A/S Dampfærgevej 3, 3rd Floor 2100 Copenhagen Ø Denmark Tel. +45 35 27 02 00 info@hplush.com www.hplush.com
H+H International A/S Interim financial report Company Announcement No. 343, 2016 H+H International A/S Dampfærgevej 3, 3rd Floor 2100 Copenhagen Ø Denmark Tel. +45 35 27 02 00 info@hplush.com www.hplush.com
Holmen Excl. Items affecting comparability. Holmen
 Full Year MSEK 4-1 3-1 4-9 21 29 Net turnover 4 747 4 25 4 659 17 581 18 71 Operating profit 625 383 392 1 596 1 62 Operating profit excl. items affecting comp. * 361 383 392 1 332 1 62 Profit after tax
INTERIM REPORT. 1 January 31 March THE FIRST QUARTER. Net revenue totalled SEK 504 million (410) Operating profit amounted to SEK 61 million (52)
 Operating profit amounted to SEK 61 million (52)") INTERIM REPORT 1 January 31 March 2018 THE FIRST QUARTER Net revenue totalled SEK 504 million (410) Operating profit amounted to SEK 61 million (52) Profit before tax amounted to SEK 56 million (48) Profit
INTERIM REPORT 1 January 31 March 2018 THE FIRST QUARTER Net revenue totalled SEK 504 million (410) Operating profit amounted to SEK 61 million (52) Profit before tax amounted to SEK 56 million (48) Profit
Q U A R T E R L Y R E P O R T 2018 FIRST QUARTER
 Q U A R T E R L Y R E P O R T 2018 FIRST QUARTER Contents Highlights 3 Group summary 5 Business areas 6 Other matters 7 Outlook 7 Financial statements 8 Notes to the financial statements 13 Definitions
INTERIM REPORT JANUARY MARCH 2018
 24 April 2018 INTERIM REPORT JANUARY MARCH 2018 Reporting period January March Net sales increased by 10.4 per cent to SEK 2,674 (2,423) million. Organically, net sales decreased by 0.6 per cent EBITA*
TeliaSonera Försäkring AB
 Annual Report 2015 Table of contents Table of contents... 2 Administration Report... 3 Proposed appropriation of earnings... 5 Five-year summary and KPIs... 6 Performance analysis... 7 Income statement...
Q Report. Comments from Torbjörn Magnusson, CEO: November 13, 2002
 Q3 2002 Report If P&C Insurance * 106 80 Stockholm Sweden www.if-insurance.com November 13, 2002 Continued improvement in core business performance Combined ratio YTD 106.3% (108.7% ), Q3 103.6% (107.5%
Proffice year-end financial report
 Proffice year-end financial report JANUARY DECEMBER 2010 Strong fourth quarter October December 2010 Revenue amounted to SEK 1,136 million (963) Operating profit amounted to SEK 45 million (30) Operating
STOCK EXCHANGE RELEASE 1(12) April 27, 2010 at 9.00 a.m.
 April 27, 2010 at 9.00 a.m.") STOCK EXCHANGE RELEASE 1(12) INTERIM REPORT FOR JANUARY TO MARCH 2010: RECORD NET SALES WITH STRONG PROFITABILITY AND CASH FLOW Net sales for the first quarter increased 9% and reached a record level at
STOCK EXCHANGE RELEASE 1(12) INTERIM REPORT FOR JANUARY TO MARCH 2010: RECORD NET SALES WITH STRONG PROFITABILITY AND CASH FLOW Net sales for the first quarter increased 9% and reached a record level at
DNB Group FACT BOOK. Second quarter 2013 (UNAUDITED) - ADJUSTED ACCORDING TO NEW CUSTOMER SEGMENTS -
 - ADJUSTED ACCORDING TO NEW CUSTOMER SEGMENTS -") 2 DNB Group FACT BOOK Second quarter 2013 (UNAUDITED) - ADJUSTED ACCORDING TO NEW CUSTOMER SEGMENTS - Chapter 1 - Financial results DNB Group 0 Group business structure and financial governance 0.1 Legal
2 DNB Group FACT BOOK Second quarter 2013 (UNAUDITED) - ADJUSTED ACCORDING TO NEW CUSTOMER SEGMENTS - Chapter 1 - Financial results DNB Group 0 Group business structure and financial governance 0.1 Legal
Q1 Q Q3 Q EUR million Jan-Mar 2018 Jan-Mar 2017 Change, % EUR million Jan-Dec 2017
 Stockholm, Sweden, 4 May Eltel Group Interim report January March January March Group net sales decreased 10.5% to EUR 266.6 million (297.8), mainly as a result of divestments and on-going discontinuation
A d d i t i o n a l c o s t c u t t i n g b y s i m p l i f y i n g t h e s t r u c t u r e
 Interim report A d d i t i o n a l c o s t c u t t i n g b y s i m p l i f y i n g t h e s t r u c t u r e Kitron showed a slight loss for the third quarter. Group sales proved to be lower than expected,
AFFECTO PLC INTERIM REPORT 5 MAY 2009 at 9.30
 1 INTERIM REPORT 1-3/2009 AFFECTO PLC INTERIM REPORT 5 MAY 2009 at 9.30 AFFECTO PLC'S INTERIM REPORT 1-3/2009 GROUP KEY FIGURES MEUR 1-3/09 1-3/08 2008 Net sales 27.5 33.6 131.6 Operational segment result