Quarterly Report 1/2017
|
|
|
- Dustin Bates
- 6 years ago
- Views:
Transcription

1 Quarterly Report 1/2017 Herrestaskolan in Järfälla. Interior products from Moelven Töreboda AB. Photo: Hampus Lundgren.
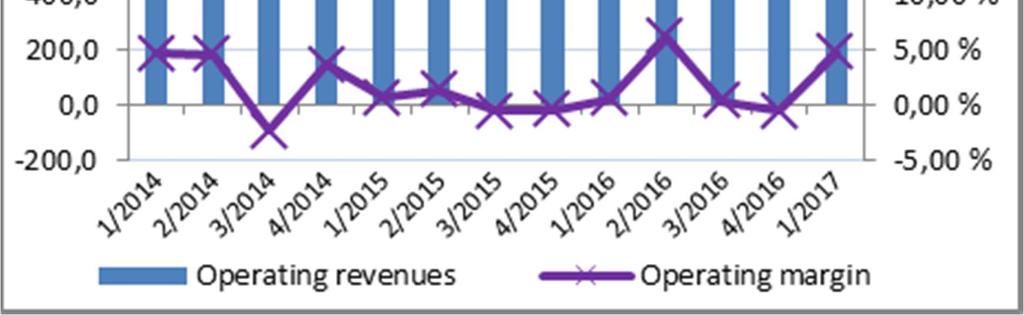
2 Amounts in NOK million First quarter Total Operating revenues 2, , , ,690.4 EBITDA Gross operating margin/ebitda 6.3 % 3.8 % 5.8 % 5.7 % Depreciation and impairment Operating profit Net operating margin/ebit 3.8 % 1.2 % 2.9 % 2.2 % Value change of financial instruments to fair value Profit before tax Profit per share in NOK Cash flow from operational activities, in NOK per share Total equity 1, , , ,756.9 Equity ratio 36.4 % 33.5 % 38.0 % 36.8 % Total assets 5, , , ,778.1 Investments Return on capital employed 13.8 % 4.0 % 11.7 % 7.4 % Capital employed 3, , , ,870.8 Net interest-bearing liabilities 1, , , ,110.4 Net working capital 2, , , ,081.2 Number of employees 3,519 3,456 3,492 3,426 Sick leave percentage 5.8 % 6.1 % 5.6 % 5.5 % Frequency of accidents with absence, rolling LTI value Number of shareholders Average number of shares (mill) Increased revenues and the best result for the first quarter since 2008 Operating revenues in the first quarter increased by 2.8 per cent to NOK 2,677.5 million (2,604.6). The operating result increased to NOK million (NOK 30.0 million). The group's rate of return on employed capital improved to reach 13.8 per cent (4.0). Satisfactory demand for sawn timber for the quarter. High delivery volumes to the building products trade in Scandinavia. A good level of activity and a continued healthy and well-composed order backlog for Building Systems. In brief Demand for products from the Group's timber processing operations was normal for the season. Compared to previous years, activity levels in the first quarter are positively affected by a greater number of production days due to Easter in 2017 falling in April. In general, demand for sawn timber has been good, but deliveries to the Middle East, North Africa and Asia have been somewhat reduced due to problems related to container shipments. The currency situation continues to make a positive contribution to competitive ability in export markets. For the Wood division, demand came from the building materials market in Scandinavia. Delivery volumes increased, and prices were on a par with or slightly above the same period in For the sawlog consuming operations a milder winter has resulted in better operating conditions this year compared to the corresponding period last year. Overall, access to sawlogs has been normal for the season, Moelven Industrier ASA Quarterly report 1/2017 Page 1
3 and sawlog inventories are satisfactory at the end of the quarter. For the Norwegian units prices of sawlogs have been slightly higher than during the same period last year, while price levels in Sweden have been at the same level as last year. In both countries prices for wood chip and fibre products have been at the same level as the first quarter of has also started well for Building Systems, with good market activity and improved results for all business areas. On 13 February key players in the forestry-industry-building value chain signed an agreement where the objective is to develop the Interior region into an international power centre for industrial construction with wood. The new cluster is called Norwegian Wood Cluster. The cluster comprises Hunton Fiber AS, Forestia AS, Boligpartner AS, Moelven Industrier ASA, Gausdal Bruvoll SA, Mjøsen Skog SA, Glommen Skog SA, Statskog SF and NTNU. The players have identified key focus areas for cooperation. The first is to increase the degree of industrialization in the entire value chain, the second is to increase capacity for innovation, and the third is to improve expertise. The cluster will also focus on building the reputation of an industry that is traditional but which is undergoing positive developments. In February Moelven Limtre AS signed a contract with HENT AS in connection with construction of the world's tallest wooden building in Brumunddal. Moelven Limtre AS will be the turnkey subcontractor and will supply glulam, Kerto and solid wood structures for the tower structure and swimming hall in the project. Mjøstårnet will have an overall size of around 15,000 m 2, and will span 18 storeys and include apartments, a hotel, offices, a restaurant and associated common areas. The total height will be more than 80 metres. At Bygge-galan in Stockholm on 27 March, Moelven Byggmodul AB was named Lean Builder of the year in Sweden. The award, which is presented by Lean Forum Bygg and industry periodical Byggindustrin, was awarded to Moelven Byggmodul AB in connection with the company's remodelling of the production facility at Värmlandsbro in Säffle. New and improved production equipment has been developed in cooperation with local suppliers. Besides capacity and efficiency improvements, the utilization of robot technology has enabled major improvements in HSE and logistics. Moelven Multi3 AS will supply the Iso3-stud for the development of Campus Ås in connection with the Norwegian Veterinary Institute and veterinary training now merging with the Norwegian University of Life Sciences. Use of the unique, thermal bridge-breaking Iso3-stud in the external walls enables passive house walls to be built with fewer layers, thus making them thinner. By using normal solid wood supports, the walls would occupy a huge 600 m² more of the gross area if the construction boundaries remained the same. The project's overall gross area is approx. 65,000 m². Moelven Industrier ASA Quarterly report 1/2017 Page 2


4 Revenues and results Amounts in NOK million First quarter Total Operating revenues Timber , ,010.1 Wood , ,275.7 Building Systems , ,375.2 Other businesses , ,003.8 Internal , ,974.5 The Group 2, , , ,690.4 EBITDA Timber Wood Building Systems Other businesses The Group Operating profit Timber Wood Building Systems Other businesses The Group Revenues increased compared to the same period last year as a result of increased volumes in all divisions. In addition to this, internal improvement measures are the main reasons for major improvements in results and cash flow as well. The FIFO principle requires that inventory calculations are adjusted in line with developments in raw material costs. Along with an update of real value assessments of inventory, this has provided a positive effect totalling NOK 7.0 million in the quarter. In the same period in 2016 the corresponding amount was NOK 4.4 million. The items do not have any impact on cash flow. The Group employs financial instruments as a hedge against short-term fluctuations in foreign exchange rates, interest rates and power prices. Non-cash items connected to fair value adjustments on unrealised hedging instruments comprised minus NOK 4.1 million (minus NOK 6.8 million) Moelven Industrier ASA Quarterly report 1/2017 Page 3
.")
, corresponding to minus NOK 0.67 per share (minus 1.75).")
. Net interest-bearing liabilities were NOK 1,159.9 million (NOK 1,368.7 million) at the end of the quarter.")
5 Investments, balance sheet and funding During the first quarter, total investments were NOK 60.3 million (NOK 36.5 million). Investments in 2017 will increase compared to 2016, partly due to projects that have been postponed. Depreciation in the quarter was NOK 66.8 million (70.0). At the end of the first quarter, the book value of the Group's total assets was NOK 5,183.0 million (NOK 5,209.0 million). Cash flow from operating activities in the first quarter was minus NOK 87.7 million (minus NOK million), corresponding to minus NOK 0.67 per share (minus 1.75). The change compared to the same period last year is due to improved earnings and reduced employed capital in inventory and accounts receivable. Cash flow from working capital items was minus NOK million (minus 311.2). Net interest-bearing liabilities were NOK 1,159.9 million (NOK 1,368.7 million) at the end of the quarter. Financial leases are included in net interest-bearing liabilities, amounting to NOK 22.3 million (NOK 31.5 million). The liquidity reserve was NOK million (NOK million). In the Group's main financing the available loan facility varies in time with the natural fluctuations in the Group's tied-up capital through the year. Equity at the end of the quarter amounted to NOK 1,888.6 million (NOK 1,813.4 million), which is equivalent to NOK (NOK 13.46) per share. The equity ratio was 36.4 per cent (33.5 per cent). The proposed dividend for 2016 of NOK 0.48 per share, totalling NOK 62.2 million, will, assuming approval at the Annual General Meeting, be charged to equity in the second quarter. Parts of the Group's equity are linked to ownership interests in foreign subsidiaries, principally in Sweden, and are thereby exposed to exchange rate fluctuations. The extent and consequences of likely variations in exchange rates are within acceptable risk limits. In the first quarter, exchange rate fluctuations resulted in an unrealised change in equity of NOK 9.9 million (minus NOK 18.7 million). Approximately half of the Group's assets are recognized in SEK. The total assets thus also change based on the exchange rate. The equity ratio in percent is therefore less impacted by exchange rate fluctuations than the nominal equity. Moelven Industrier ASA Quarterly report 1/2017 Page 4
6 Divisions Timber First quarter Total Amounts in NOK million Sales to external customers , ,487.4 Sales to internal customers Operating revenues , ,010.1 Depreciation and impairment Operating profit Operating margin in per cent 4.7 % 0.5 % 1.8 % 0.8 % Net operating capital (% of operating revenues) 16.9 % 18.2 % 16.3 % 18.7 % Total assets 1, , , ,664.5 Equity Capital employed 1, , , ,222.2 Return on capital employed 14.1 % 1.2 % 4.7 % 1.9 % Investments Number of employees Demand for sawn timber was good in the quarter. Compared to the same period in 2016, both deliveries and production volumes rose. Deliveries to the Middle East, North Africa and Asia have however been somewhat reduced due to issues related to container shipments. Average prices, without adjustment for market mix, were somewhat higher than in the first quarter of The currency situation continues to make a positive contribution to competitive ability in export markets. Due to price developments the profits for the quarter have seen a positive effect of a price adjustment to inventories totalling NOK 1.2 million. The corresponding adjustment in Q resulted in a charge of NOK 5.5 million. Access to sawlogs has been normal for the season, and sawlog inventories are satisfactory at the end of the quarter. For the Norwegian units prices of sawlogs have been slightly higher than during the same period last year, while price levels in Sweden have been at the same level as last year. In both countries prices for wood chip and fibre products have been at the same level as the first quarter of A milder winter provided better operating conditions this year compared to the corresponding period last year. In addition, several units have improved efficiency through the ongoing improvement work, and overall processing costs for the division were reduced compared to the first quarter of In January 2017 a decision was made to transfer operations at Moelven Tom Heurlin AB from the Timber division to the Wood division as of 1 January The company has failed to achieve satisfactory profitability through its strategic focus on exports, and will instead coordinate with the Wood division's focus on the Scandinavian home market. Coordination will entail a need to scale back capacity, and negotiations with trade unions have been concluded. Moelven Våler AS and Moelven Løten AS will come under joint management and administration. The main reason for the two companies to enter into an administrative partnership is to save costs and strengthen both companies' competitive ability. This is not a merger, but rather administrative coordination, and the companies will both continue as separate legal entities. Further, a report has been developed related to a possible merger between Moelven Ransbysågen AB and Moelven Notnäs AB. The matter has been put before both of the companies' boards, and a decision has been made to proceed with the process with an aim to complete the merger. Moelven Industrier ASA Quarterly report 1/2017 Page 5


7 Moelven Industrier ASA Quarterly report 1/2017 Page 6


8 Wood First quarter Total Amounts in NOK million Sales to external customers , ,153.8 Sales to internal customers Operating revenues , ,275.7 Depreciation and impairment Operating profit Operating margin in per cent 3.2 % 0.5 % 4.5 % 3.8 % Net operating capital (% of operating revenues) 32.8 % 32.9 % 27.6 % 27.7 % Total assets 2, , , ,134.8 Equity Capital employed 1, , , ,513.7 Return on capital employed 7.5 % 1.2 % 10.5 % 8.4 % Investments Number of employees 1,054 1,018 1,039 1,009 The winter season saw normal developments. Both delivery volumes and production volumes were higher than in the first quarter of Overall, average prices were higher than for the same period in The planing mills in the division use mainly sawn timber as raw material, and raw material costs for these units has therefore increased due to the price developments for sawn timber. Access to sawlogs has, with certain regional exceptions, been normal for the season, and sawlog inventories are satisfactory at the end of the quarter. For the Norwegian units prices of sawlogs have been slightly higher than during the same period last year, while price levels in Sweden have been at the same level as last year. In both countries prices for wood chip and fibre products have been at the same level as the first quarter of Due to price developments since the turn of the year, the profits for the quarter have seen a positive effect of a price adjustment to inventories totalling NOK 5.8 million. The corresponding adjustment in Q had a positive effect of NOK 9.9 million. Operating conditions in the period were good, and along with concluded improvement measures this has contributed to the improvement in results compared to the first quarter in The takeover of Moelven Tom Heurlin AB from the Timber division is going according to plan. Improvement work continues unabated in the entire division in order to maintain competitiveness and to bring the remaining units with poor earnings up to an acceptable profitability level. Moelven Industrier ASA Quarterly report 1/2017 Page 7


9 Building systems First quarter Total Amounts in NOK million Sales to external customers , ,371.2 Sales to internal customers Operating revenues , ,375.2 Depreciation and impairment Operating profit Operating margin in per cent 4.3 % 3.1 % 3.2 % 4.2 % Net operating capital (% of operating revenues) 12.2 % 14.4 % 12.5 % 12.9 % Total assets 1, , , ,616.8 Equity Capital employed Return on capital employed 21.7 % 17.4 % 15.4 % 21.4 % Investments Number of employees 1,670 1,631 1,647 1,607 Both activity levels and operating results improved compared to the first quarter of At the end of the quarter the order backlog was NOK 76 million more than at the same time last year. Revenues for the first quarter in 2016 include around NOK 90 million from the part of the electrical installations business that was transferred to the Other businesses reporting area in the second quarter and subsequently sold off by the group in the fourth quarter of For the Glulam business the first quarter has been characterized by a healthy market with good sales in both Norway and Sweden. The use of glulam is experiencing a good trend, with increasing demand for loadbearing structures for various building purposes. In Building modules demand has been good for all market segments in Sweden, and price trends are positive. In Norway the picture is more complex, but the market for Moelven's housing concept has been good. For Modus the market situation continued with high demand in connection with major cities. In Norway market activity is less pronounced, but developments are positive, particularly in eastern Norway. Electrical installation operations in the Building Systems division has now concluded all projects on building sites, but clarification on the final settlement related to a major project remains. Moelven Industrier ASA Quarterly report 1/2017 Page 8


10 Other businesses First quarter Total Amounts in NOK million Sales to external customers , Sales to internal customers , ,240.4 Operating revenues , ,003.8 Depreciation and impairment Operating profit Operating margin in per cent -0.8 % -0.9 % -1.0 % -0.9 % Net operating capital (% of operating revenues) 4.9 % 7.1 % 4.9 % 5.9 % Total assets 2, , , ,468.5 Equity 1, , ,007.9 Capital employed 1, , , ,977.1 Return on capital employed 0.8 % 0.0 % -0.2 % 0.4 % Investments Number of employees Other businesses include Moelven Industrier ASA, with Group shared services in economics, finance, insurance, communications, HR, ICT and procurement. Timber supply and sales of wood chips and energy products are organised as a common function for the Group's timber processing industry and are included with the companies Moelven Skog AB, Moelven Virke AS, Vänerbränsle AB and Moelven Bioenergi AS. Year-to-date figures for 2016 also include Moelven Elektro AS. As of 1 June 2016, this company, which focused exclusively on maintenance contracts and small and medium size projects, was transferred to the Other businesses reporting area. On 1 December 2016 Moelven Elektro AS was sold to Bravida Norge AS, and was therefore no longer a part of the group at year end. Apart from this reorganization and sale of operations, fluctuations in operating revenues within the area of Other businesses are largely due to fluctuations in the level of activity within timber supply and sales of chips and energy products. The main activity is internal sales, which do not materially affect the results within the business area. In order to safeguard the supply of timber and market opportunities for wood chip and energy products in regions without local demand for pulp wood and wood chips, train solutions have been established for the transport of these. The business is based on fixed agreements on both the customer and supplier sides. Moelven Industrier ASA Quarterly report 1/2017 Page 9
11 Employees Employees Per first quarter 2017 Per first quarter 2016 Male Female % Female Total Male Female % Female Total Timber % % 677 Wood % 1, % 1,018 Building Systems 1, % 1,670 1, % 1,631 Others % % 130 The Group 3, % 3,519 3, % 3,456 Per first quarter Sickness absence rate in % Timber 4.40 % 5.60 % Wood 5.40 % 5.60 % Building Systems 6.70 % 6.90 % Others 3.30 % 1.90 % The Group 5.80 % 6.10 % Per first quarter Rolling LTI Value Timber Wood Building Systems Others The Group The increase in the number of employees compared to the same time in 2016 is due to increased activity in the Building Modules operations in Sweden. In the first quarter, absence due to illness was 5.8 per cent (6.1), where 2.1 per cent (2.7) represents long-term absence. A number of Moelven's operations already have sickness absence levels lower than the target of 4.5 per cent, but work continues to further reduce sickness absence for the group as a whole. Efforts, which include employee surveys, close follow-up of sickness absence and cooperation with the occupational health services, are particularly directed at those businesses with the highest sickness absence levels. There were 23 (22) personal injuries with subsequent sick leave during the quarter. A higher activity level and thus a higher number of hours worked, nevertheless resulted in the LTI rate (number of personal injuries with sick leave per million worked hours) dropping significantly for the quarter compared to the same period last year. Moelven's goal is that no one is injured at work, and injury rates are thus still unacceptably high. HSE work has a high priority in the work of the board, the corporate management and the safety committee. The latter comprises the CEO, division managers, the HR Director and two employee representatives for the building and timber processing parts of the group respectively, and is the governing body for HSE work. Work on training and awareness-raising is constantly ongoing in order to establish a culture for safety at all levels. All of Moelven's subsidiaries have completed the course Clear HSE management for everyone with operational and personnel responsibility, in addition to employee representatives and safety representatives. Moelven Industrier ASA Quarterly report 1/2017 Page 10
12 Outlook Global economic growth continues to show signs of improvement. In Norway the mainland economy is growing following a slow period, and in Sweden the strong growth from the previous years is continuing. The rest of Europe continues with a marginal positive growth rate. In USA the economy is still on the mend. Growth in China continues to slightly drop, while there are indications of higher activity in the rest of Asia. The Middle East and North Africa are still characterized by unrest and regulations from public authorities that complicate international trade. However, the underlying demand is good in the latter markets. Positive and stable developments in the international market for sawn timber are expected. The currency situation continues to contribute to maintain competitive ability in export markets, particularly for the Group's Swedish businesses where trading is in EUR or USD. Prices in GBP have increased, and thus compensate some of the margin shortfall as a result of the depreciation of the pound following the Brexit referendum. In Norway demand for processed products is expected to remain on a par with the previous year, albeit with regional differences. Building activity in and around the major cities, with the exception of Southwest Norway, is expected to remain high. In Sweden the need for new homes remains high and activity in the new building market is strong. The renovation, conversion and extension market is also experiencing good levels of activity, although the changes in the renovation, conversion and extension deduction have slowed activities somewhat. No major changes are expected in the markets, and the Swedish market is expected to be at the same level as the previous year. Sawlog inventories and access to sawlogs at the start of the second quarter are satisfactory with regard to planned production. For glulam it is expected that the positive trend of choosing wood for load bearing structures will continue. In both Norway and Sweden demand is good for module-based buildings for housing purposes. Demands toward short construction times are increasing. This applies equally to homes, schools and care facilities. The market for System Interior is strong in Sweden, primarily in the Stockholm, Gothenburg and Malmö areas. After a period of decline in the Norwegian new build market there are clear signs of improvement, but pressure on prices remains high. Good activity is expected to continue in Norway and Sweden in renovation, conversion and extension. For the Group as a whole revenues are expected to increase somewhat. The programme for operational improvement and structuring of the Group in line with the long-term strategy plan continues unabated and will contribute to improved profitability for the underlying operations. The Group's composition, with divisions that experience different impacts from economic fluctuations and units that operate in different markets, provides the Group with a good starting point for further improvements. The result for 2017 is expected to be somewhat better than for The Group has a longterm goal of a return on capital employed of 13 per cent over an economic cycle. The Board is of the opinion that the Group has sufficient solidity and long-term access to liquidity to implement the restructuring and improvement projects required to achieve this goal. Moelven Industrier ASA Quarterly report 1/2017 Page 11
13 Summary quarterly accounts for the Moelven Group for the first quarter 2017 Earnings and comprehensive income Amounts in NOK million First quarter Total Operating revenues 2, , , ,690.4 Cost of goods sold 1, , , ,207.3 Payroll expenses , ,943.3 Depreciation and impairment Other operating expenses , Operarting profit Income from associates Value change of financial instruments to fair value Other financial income Other financial expenses Profit before tax Estimate income tax Net profit Non-controlling interest share Owner of parent company share Earings per share (in NOK) Statement of comprehensive income Net profit Other comprehensive income Items that are not reclassified subsequently to profit or loss Actuarial gains (losses) on defined-benefit pension schemes Income tax on items that are not reclassified to profit or loss Items that may be reclassified subsequently to profit or loss Translation differences Proportion of other income and costs in associated companies Other changes Income tax on items that may be reclassified to profit or loss Other comprehensive income, net of tax Total comprehensive income for the period Comprehensive income assigned to: Owners of parent company Non-controlling interests Moelven Industrier ASA Quarterly report 1/2017 Page 12
14 Consolidated balance sheet Amounts in NOK million Per Per Intangible assets Tangible fixed assets 1, , ,637.2 Financial fixed assets Total fixed assets 1, , ,718.7 Inventory 1, , ,464.1 Receivables 1, , ,568.5 Liquid assets Total current assets 3, , ,048.1 Total assets 5, , ,766.8 Share capital* Other equity 1, , ,165.7 Total equity 1, , ,813.4 Provisions Long term interest-bearing liabilities 1, , Long term interest-free liabilities Total long term liabilities 1, , ,097.4 Short term interest-bearing liabilities Short term liabilities 1, , ,743.7 Total short term liabilities 1, , ,856.1 Total liabilities 3, , ,953.4 Total equity and liabilities 5, , ,766.8 * shares á NOK 5,-, adjusted for ow n shares. Moelven Industrier ASA Quarterly report 1/2017 Page 13
15 Consolidated statement of changes in equity Amounts in NOK million Equity assigned to owners of parent company Share Share capital premium funds Own shares Other equity Total Noncontrolling interests Total equity Total per , ,756.9 Comprehensive income for the period Net profit Other comprehensive income Translation differences Other changes Actuarial gains (losses) on defined-benefit pension schemes Income tax on other comprehensive income Other comprehensive income (net of tax) Transactions with owners, entered directly against equity Purchase of non-controlling interests Effect of acquisition Dividend to owners Share based payment transactions Total transactions with owners Total as at , ,743.4 Total per , ,813.4 Comprehensive income for the period Net profit Other comprehensive income Translation differences Other changes Actuarial gains (losses) on defined-benefit pension schemes Income tax on other comprehensive income Other comprehensive income (net of tax) Transactions with owners, entered directly against equity Purchase of non-controlling interests Effect of acquisition Dividend to owners Share based payment transactions Total transactions with owners Total as at , , ,888.6 Moelven Industrier ASA Quarterly report 1/2017 Page 14
16 Consolidated statement of cash flow Amounts in NOK million Per CASH FLOW FROM OPERATIONAL ACTIVITIES: Net profit Adjustments to reconcile net profit with net cash flow from operations: Depreciation Impairment Income from associated companies Tax paid Unpaid pension costs entered as costs and unreceived pension funds entered as income Loss (profit) on sale of fixed assets Net value change of financial instruments to fair value Income tax Changes in operating assets and liabilities: Changes in inventory Changes in accounts receivable and other receivables Changes in trade accounts payable Changes in provisions and benefits to employees Changes in short-term liabilities excluding borrowing Cash flow from operational activities CASH FLOW FROM INVESTMENT ACTIVITIES: Investment in plant and equipment exc. acquisition Net cash outlay on acquisition Receipts from sale of fixed assets Sale of other long-term investments Acquisition of subsidiary, net of cash Cash flow from investment activities CASH FLOW FROM FINANCING ACTIVITIES: Raising short term debt Repayment of short term debt Change in bank overdrafts Purchase of non-controlling interests Change in long term debt (borrowing facility) Changes in other long-term liabilities Payment of dividend Cash flow from financial activities Net increase (reduction) in liquid assets during year Liquid assets start of period Effect of exchange rate changes on liquid assets Liquid assets end of period Cash and cash equivalents Liquid assets Unused drawing rights Restricted bank deposits Cash and cash equivalents Moelven Industrier ASA Quarterly report 1/2017 Page 15
17 Notes to the summary consolidated quarterly financial statements Note 1 General information Moelven Industrier ASA is a public limited liability company, registered in Norway. The company's head office is at Industriveien 2, 2390 Moelv, Norway. The summary consolidated financial statements for the first quarter of 2017 ended 31 March 2017 include Moelven Industrier ASA and its subsidiaries (collectively referred to as the Group ) and the Group's interests in associated companies. The annual accounts for 2016 are available at Note 2 Statement of conformity The consolidated financial statements for the fourth quarter of 2016 have been prepared in accordance with the requirements of IAS 34 Interim Financial Reporting which have been approved by the EU. The interim financial statements do not include all the information required in a complete annual report and ought to be read in conjunction with the consolidated financial statements for The summary consolidated quarterly financial statements were approved by the Board on 26 April Note 3 Accounting policies The accounting policies adopted in the quarterly financial statements are the same as those in the consolidated financial statements for Currency exchange rates in the consolidation are retrieved from Norges Bank. Note 4 Critical judgements and estimates The preparation of quarterly financial statements requires management to make judgements, estimates and assumptions that affect both which accounting policies are applied and the reported amounts of assets, liabilities, revenues and expenses. Actual amounts may differ from the estimated amounts. In preparing these summary quarterly financial statements management has applied the same critical judgements in applying the accounting policies as it made when preparing the consolidated financial statements for 2016 and the principal sources of estimate uncertainty are the same when preparing these summary quarterly accounts as for the consolidated accounts for Note 5 Pensions and taxes The calculations of pension costs and pension liabilities are undertaken annually by actuaries. In the quarterly accounts pension costs and pension liabilities are based on forecasts from actuaries. The income tax expense is determined in each quarter on the basis of the expected annual income tax expense. Note 6 Seasonal fluctuations Demand for the Group's products and services is normally subject to variability throughout the year. This involves a low season during the first quarter, increasing activity and a peak season over the second and third quarters, and diminishing activity in the final part of the fourth quarter. Due to the annual seasonal variation in raw material access and market activity, the Group's working capital varies by NOK 300 million to NOK 400 million from its highest level in May/June to its lowest in November/December. Moelven Industrier ASA Quarterly report 1/2017 Page 16
18 Note 7 Fixed assets, intangible assets and goodwill Amounts in NOK million Per Book value per 1.1 1, ,790.1 Acguisitions Business combinations Disposals 2, Depreciations Impairment losses Transfers Translation differences Book value per , ,731.1 Note 8 - Financial instruments Per first quarter Amounts in NOK million Positive Negative Net fair Positive Negative Net fair fair value fair value value fair value fair value value Currency derivatives Interest rate derivatives Power derivatives Total Per first quarter Amounts in NOK million Positive Negative Net fair Positive Negative Net fair fair value fair value value fair value fair value value Currency derivatives Interest rate derivatives Power derivatives Total Note 9 Operating segments The divisions are divided in accordance with Moelven's three core activities: Timber (industrial goods), Wood (building products) and Building Systems (projects). There is also a division named "Other" in which the remaining units are placed. The divisions are built up around independent subsidiaries with activities clearly defined within the divisions. All transactions between the divisions are conducted on normal commercial terms. The split into divisions differs from the formal legal ownership structure. See the consolidated financial statements for 2016 for further information about segments. Below is a reconciliation of the profit before taxes in the reporting segments with the company's profit before taxes. Amounts in NOK million Per Timber Wood Building Systems Other Profit before tax in segments Eliminations Profit before tax in Group Accounts Moelven Industrier ASA Quarterly report 1/2017 Page 17
19 Note 10 Related parties Transactions with the owners are performed in some areas of the ordinary activities. Among other things, this relates to purchase of timber, where the Norwegian forest owner cooperatives are suppliers. There will also be deliveries of biofuel from the Moelven Group to a bioenergy plant owned by Eidsiva Energi AS, with possible buy-back of bioenergy for Moelven's industries in connection with the energy plant. Eidsiva Marked AS also trades electric power to Moelven's Norwegian industrial operations. All these transactions have in common that the arm's length principle shall be applied. Where other suppliers can offer better prices or terms, these will be used. About 40 per cent of Moelven's total purchasing requirement for timber of 4.3 million cubic metres comes via the Norwegian forest owner cooperatives. Moelven' supply of energy raw materials to Eidsiva's bioenergy plant represents between 40 and 50 GWh on an annual basis, while buying back energy represents between 20 and 30 GWh. Net delivery of energy raw materials is 20 GWh. The extent of the sale of electrical power corresponds to about 40 per cent of Moelven's total consumption of 210 GWh. Moelven has a long tradition of running its operations in accordance with all the laws and ethical guidelines of the industry and is of the opinion that competition is positive for all parties in industry. In order to ensure that this culture is maintained, ethical guidelines and guidelines for complying with legislation on competition have been devised. Note 11 - Events after the balance sheet date There have not been any events after the balance sheet date which would have an impact on the income, expenses, assets and liabilities disclosed in the quarterly financial statements. Moelven Industrier ASA Quarterly report 1/2017 Page 18
20 Moelven is organised into three divisions: Timber, Wood and Building Systems. There is also an Other Businesses reporting area, which consists of the holding companies, supply businesses and bioenergy companies. The sawmills in Timber supply sawn wood products and components to industrial customers in Scandinavia and the rest of Europe, the Middle East and North Africa. The industrial customers use the products as intermediate goods in their own production. Shavings, chip and bark products are also supplied and are used in the pulp, chipboard and biofuel industry. The companies in Wood supply the building products trade in Scandinavia with a broad range of building and interior products. A critical competitive advantage is the division's efficient distribution system, which offers customers rapid and precise deliveries of a broad range of products. The companies within Building Systems deliver flexible system solutions for interior walls, modular buildings and load-bearing structures in glulam to projects and contractor clients, principally in Norway and Sweden. The division focuses on developing concepts and systems in collaboration with the customers and experts within architecture, design and construction. In total, the Group is composed of 44 production companies in Norway and Sweden and has 3,519 employees. Moelven also has its own sales offices in Denmark, England, Germany and the Netherlands. The Moelven Group is owned by Glommen Skog SA (29.1 per cent), Eidsiva Vekst AS (23.8 per cent), Felleskjøpet Agri SA (15.8 per cent), Viken Skog SA (11.9 per cent), Mjøsen Skog SA (11.8 per cent) and AT Skog SA (7.3 per cent). Most of the remaining 0.4 per cent is owned by private individuals. Head office Moelven Industrier ASA Org.no. NO VAT P.O. Box 134, NO-2391 Moelv Tel Fax post@moelven.com Moelven Industrier ASA Quarterly report 1/2017 Page 19
Oiled wood based interior products in the same color range provide a warm atmosphere. Delivered by Moelven Wood AS. Photo: Einar Breen.
 Oiled wood based interior products in the same color range provide a warm atmosphere. Delivered by Moelven Wood AS. Photo: Einar Breen. Quarterly Report 4/2017 Amounts in NOK million Fourth quarter 12
Quarterly Report 1/2018
 Quarterly Report 1/2018 Grilstad Marina, Havseilerveien, Trondheim. Untreated cedarwood facades delivered by Moelven Wood Prosjekt AS. Photo: Matthias Christoph Herzog. Amounts in NOK million First quarter
Quarterly Report 3/2015
 Quarterly Report 3/2015 Moelven ByggModul will deliver 52 apartments in Fjeldsetlia Park in Elverum. Production will be done at Moelven ByggModul Hjellum AS and is the company s first residential concept
Quarterly Report 3/2016
 Quarterly Report 3/2016 Kimen Kulturhus. Moelven Wood Prosjekt has supplied fire resistant wood of spruce. Photo: Lene M. Prøven. Architect: Reiulf Ramstad Arkitekter/JSTArkitekter/Lusparken Arkitekter
Quality rooms. Quarterly report 4/2013
 Quality rooms Quarterly report 4/2013 Strandparken in Sundbyberg is the Stockholm area s first eight storey house built entirely of wood. The house facade is shavings of Western Red Cedar (WRC) from Moelven.
Quality rooms. Quarterly report 1/2013. Architect: AG Arkitekter. Photo: Carl Swensson.
 Quality rooms Quarterly report 1/2013 Architect: AG Arkitekter. Photo: Carl Swensson. Amounts in NOK million First quarter 12 months 2013 2012 2012 2011 Operating revenues 1 848.7 2 165.4 8 121.5 8 059.9
Quarterly Report 2/2015
 Gode rom Quarterly Report 2/2015 Sognefjellshytta. A unique design made of laminated timber, delivered as pre cut from Moelven Limtre AS. Jan Olav Jensen, Jensen og Skodvin Arkitekter. Photographer : Hampus
Quarterly Report 1/2011. Quality Rooms
 Quarterly Report 1/2011 Quality Rooms Profit and Loss Account 1 st Quarter Operating revenues 1,953.4 1,476.8 1,456.2 7,184.5 6,247.8 Depreciation 56.1 51.4 46.9 212.8 202.5 Cost of goods sold 1,300.3
Quality rooms. Quarterly report 2/2012. Photo: Moelven Wood AS supplies thermo-treated ash decking.
 Quality rooms Quarterly report 2/2012 Photo: Moelven Wood AS supplies thermo-treated ash decking. Amounts in NOK million Second quarter 6 months Total 2012 2011 2012 2011 2011 2010 Operating revenues 2
Quarterly Report 1/2010. Quality Rooms
 Quarterly Report 1/2010 Quality Rooms Profit and Loss Account 1 st Quarter Total Operating revenues 1,476.8 1,456.2 1,951.3 6,247.8 7,657.7 Depreciation 51.4 46.9 46.7 202.5 199.2 Cost of goods sold 878.9
Quarterly Report 1/2009. Quality Rooms
 Quarterly Report 1/2009 Quality Rooms Profit and Loss Account 1 st Quarter Total Operating revenues 1,456.2 1,951.3 1,988.5 7,657.7 7,944.0 Depreciation 46.9 46.7 44.0 199.2 177.0 Cost of goods sold 959.1
Quarterly report 4/2007. Moelven Wood AS supplies flooring, panelling and moulding for quality rooms.
 Quarterly report 4/2007 Moelven Wood AS supplies flooring, panelling and moulding for quality rooms. Profit and Loss Account 4 th Quarter Operating revenues 1,983.2 1,830.8 1,528.1 7,944.0 6,692.4 6,004.9
Quality Rooms. Quarterly Report 2/2011. Moelven ByggModul AS supplied apartments for Castbergtunet, Oslo Architect: Incudo. Client: Skanska Bolig AS.
 Quality Rooms Quarterly Report 2/2011 Moelven ByggModul AS supplied apartments for Castbergtunet, Oslo Architect: Incudo. Client: Skanska Bolig AS. Profit and Loss Account Balance Sheet NOK mill. 2 nd
Quarterly Report 3/011. Quality rooms
 Quality rooms Quarterly Report 3/011 The Moelven S-beam (S-bjelken) is a new laminated timber product, the optimal beam for rafters and joists. The beam has been technically certified and comes in several
Quarterly Report 2/2010. Quality Rooms
 Quality Rooms Quarterly Report 2/2010 At Slemmestad outside of Oslo, Moelven ByggModul AS has built three apartment blocks containing 50 apartments. Romerike Arkitekter AS. Rortunet Eiendom AS, Slemmestad
Quarterly report 3/2007
 Quarterly report 3/2007 Moelven's stand at this year's builders' trade fair Bygg Reis Deg attracted a wide audience, and both staff and visitors appreciated our "Quality Rooms". Profit and Loss Account
Quarterly report 1/2006
 Quarterly report 1/2006 Profit and Loss Account Operating revenues 1,557.0 1,411.2 1,407.0 6,004.9 5,773.2 Depreciation 42.9 46.3 42.5 178.0 177.5 Cost of goods sold 975.4 893.1 885.1 3,809.4 3,667.3 Operating
Quarterly report 3/2006
 Quarterly report 3/2006 Laminated timber from Moelven has been used both as load-bearing beams and external, fire-resistant panelling at Midtbyen in Trondheim. Profit and Loss Account Change in 3 r d Quarter
Content. Main figures for five years 3 Report of the Board of Directors 4 Corporate governance 16 Social responsibility 22
 ANNUAL REPORT 2015 Content Main figures for five years 3 Report of the Board of Directors 4 Corporate governance 16 Social responsibility 22 Group Key figures 30 Income statement 31 Statement of financial
Quarterly report 2/2008
 Quarterly report 2/2008 Moelven Nordia AS has supplied the interior layout for Smedvik Eiendom's new building outside of Stavanger. Product: Nordia Flush Front. Building architect: Petter Giske at Multiconsult
ANNUAL REPORT Mjøstårnet, Brumunddal. Photo: Moelven
 ANNUAL REPORT 2017 Mjøstårnet, Brumunddal. Photo: Moelven This document contains the formal requirements for annual reporting. The annual report for Moelven 2017 with complementary information about the
Quarterly report 3/2005. The publishing house Bonnier s office layout from Moelven Eurowand AB in the restaurant area of kv. Moraset in Stockholm.
 Quarterly report 3/2005 The publishing house Bonnier s office layout from Moelven Eurowand AB in the restaurant area of kv. Moraset in Stockholm. Profit and Loss Account Change in 3 rd Quarter Nine months
Quarterly report 2/2005. Thirty 3D BoKlok apartments have been built at Fagerstrand outside of Oslo.
 Quarterly report 2/2005 Thirty 3D BoKlok apartments have been built at Fagerstrand outside of Oslo. Profit and Loss Account 2 nd Quarter 1 st half-year Total Operating revenues 1,674.4 1,573.4 1,306.7
Quarterly Report 2/2009. Quality Rooms
 Quality Rooms Quarterly Report 2/2009 Iso3 is an insulated framework materiel that contributes to reducing energy needs in buildings. The new product prevents thermal bridges and is specially developed
Interim report January March 2015
 Interim report January March 215 Photo: Bengt Alm 1 January 31 March 215 Net sales decreased by 1% to SEK 1,548 million (1,564). The change is due to a 1% reduction in delivery volumes and a 1% average
THIRD QUARTER REPORT 2018 Q3
 THIRD QUARTER REPORT 218 Q3 Defence/Aerospace Energy/Telecoms Industry Medical devices Offshore/Marine Norway Sweden Lithuania Germany USA China Report third quarter 218 Strong order growth, including
Interim Report Jan June, 2017
 Interim Report Jan June, 217 Sundsvall, July 21, 217 JANUARY 1 JUNE 3, 217 (compared with the year-earlier period) During the period, shares in the discontinued operation Essity (the hygiene business)
Interim report January June 2015
 Interim report January June 215 Photo: Shutterstock 1 April 3 June 215 Net sales decreased by 1% to SEK 1,7 million (1,718). Delivery volumes increased by 1% and the prices fell in average by 1%. Operating
FIRST QUARTER REPORT 2018 Q1
 FIRST QUARTER REPORT 2018 Q1 Defence/Aerospace Energy/Telecoms Industry Medical devices Offshore/Marine Norway Sweden Lithuania Germany USA China Report first quarter 2018 Solid growth and improved profitability
Interim Report January June Cash flow from operating activities was SEK 323 million (107)
") Interim Report January June 2014 NET SALES WERE SEK 5,840 MILLION (5,535) OPERATING PROFIT WAS SEK 296 MILLION (253) Cash flow from operating activities was SEK 323 million (107) Highlights of the period
Interim Report January June 2014 NET SALES WERE SEK 5,840 MILLION (5,535) OPERATING PROFIT WAS SEK 296 MILLION (253) Cash flow from operating activities was SEK 323 million (107) Highlights of the period
QUARTERLY REPORT
 QUARTERLY REPORT 01-2018 QUARTERLY REPORT 1 ST QUARTER 2018 1 Q1 2018 HIGHLIGHTS Agder Energi s first quarter net income under IFRS was NOK 71 million (controlling interest s share), compared with NOK
January March. Earnings per share
 January March Q1 First quarter Net sales amounted to SEK 1,583 million (1 666). Prices fell by an average of 11% while delivery volumes rose 3% compared with the fi rst quarter in the previous year. Operating
INTERIM FINANCIAL REPORT First quarter 2016 Company announcement No. 634
 INTERIM FINANCIAL REPORT First quarter 2016 Company announcement No. 634 12 May 2016 Selected financial and operating data for the period 1 January 31 March 2016 (DKKm) Q1 2016 Q1 2015 Net revenue 15,319
INTERIM REPORT 1 JANUARY 30 SEPTEMBER 2011
 INTERIM REPORT 1 JANUARY 30 SEPTEMBER 2011 1 2 3 4 UPM INTERIM REPORT 1 JANUARY 30 SEPTEMBER 2011 Q3/2011 Earnings per share excluding special items were EUR 0.19 (0.28), and reported EUR 0.21 (0.34) EBITDA
Interim report. 1 January 31 March I n t e r i m r e p o r t Q JANUARY 31 MARCH 2008 (compared with the same period previous year)
") I n t e r i m r e p o r t Q 1 2 0 0 8 Interim report 1 January 31 March 2008 1 JANUARY 31 MARCH 2008 (compared with the same period previous year) Net sales rose 7% to SEK 27,513m (25,615). Profit before
I n t e r i m r e p o r t Q 1 2 0 0 8 Interim report 1 January 31 March 2008 1 JANUARY 31 MARCH 2008 (compared with the same period previous year) Net sales rose 7% to SEK 27,513m (25,615). Profit before
Q JANUARY 1 MARCH 31, 2018 (compared with the year-earlier period) EARNINGS TREND
 EARNINGS TREND") Q1 218 JANUARY 1 MARCH 31, 218 (compared with the year-earlier period) Net sales increased 11% to SEK 4,4m (3,972). Sales growth was mainly related to higher prices in the industrial units. EBITDA rose
Q1 218 JANUARY 1 MARCH 31, 218 (compared with the year-earlier period) Net sales increased 11% to SEK 4,4m (3,972). Sales growth was mainly related to higher prices in the industrial units. EBITDA rose
JANUARY 1 SEPTEMBER 30, 2018 (compared with the year-earlier period)
") Q3 218 JANUARY 1 SEPTEMBER 3, 218 (compared with the year-earlier period) Net sales increased 11% to SEK 13,829m (12,422). The growth was primarily attributable to Paper and Wood. EBITDA increased 46%
Q3 218 JANUARY 1 SEPTEMBER 3, 218 (compared with the year-earlier period) Net sales increased 11% to SEK 13,829m (12,422). The growth was primarily attributable to Paper and Wood. EBITDA increased 46%
Your ambition. Our passion. Third quarter
 Your ambition. Our passion. 14 Third quarter Q3 Continued growth outside Norway * Important defence orders for Kitron Inc., USA * Continued revenue growth * Growth and improved profitability outside Scandinavia
Interim Report Q Self Storage Group ASA
 Interim Report Q2 2018 Self Storage Group ASA Contents Highlights 2 Key Figures 2 Subsequent events 2 Financial development 3 Strategy 6 Corporate developments 8 Risks and uncertainty factors 8 Outlook
EBITDA margin Earnings per share SEK Operating cash flow ,751 2,273
 Q4 218 FULL YEAR 218 (217) Net sales increased 13% to SEK 18,755m (16,664). Sales grew in all segments. EBITDA increased 44% to SEK 5,252m (3,648). The improvement in EBITDA was mainly related to higher
Your ambition. Our passion. Fourth quarter
 Q4 Your ambition. Our passion. 14 Fourth quarter Initiatives yield improved profitability * Important orders in the fourth quarter * Improved profitability in the fourth quarter * Full year profitability
INTERIM FINANCIAL REPORT Third quarter 2013 Company Announcement No. 521
 INTERIM FINANCIAL REPORT Third quarter 2013 Company Announcement No. 521 29 October 2013 Selected financial and operating data for the period 1 January - 30 September 2013 Q3 2013 Q3 2012 YTD 2013 YTD
Profit after tax for January June 2010 was SEK 312 million (January June 2009: SEK 501 million).
.") 2-1 1-1 2-9 21 29 29 Net turnover 4 227 4 4 4 496 8 628 9 25 18 71 Operating profit 268 32 372 588 787 1 62 Profit after tax 133 178 256 312 51 1 6 Earnings per share, SEK 1.6 2.1 3. 3.7 6. 12. Return
2-1 1-1 2-9 21 29 29 Net turnover 4 227 4 4 4 496 8 628 9 25 18 71 Operating profit 268 32 372 588 787 1 62 Profit after tax 133 178 256 312 51 1 6 Earnings per share, SEK 1.6 2.1 3. 3.7 6. 12. Return
INTERIM REPORT Q1 2015
 INTERIM REPORT Q1 2015 HIGHLIGHTS Robust earnings with solid underlying EBITDA in the quarter Strong order intake during the quarter Good project execution and cost control Successful Initial Public Offering
Interim report January March 2018
 Interim report January March 218 Strong growth and stable margin First quarter 218 Net sales rose by percent to SEK 945 million (815). Organic growth was 9 percent. Order intake was in line with net sales.
QUARTERLY REPORT
 QUARTERLY REPORT 01-2014 2014 HIGHLIGHTS The Group s operating revenues in the first quarter amounted to NOK 2,650 million, compared with NOK 2,725 million in the same period in 2013 1). Revenues mainly
Defence/Aerospace Energy/Telecoms Industry Medical devices Offshore/Marine. Fourth quarter report. Norway Sweden Lithuania Germany USA China
 Defence/Aerospace Energy/Telecoms Industry Medical devices Offshore/Marine Fourth quarter report Norway Sweden Lithuania Germany USA China Report fourth quarter Strong growth and profitability High order
INTERIM REPORT JANUARY MARCH 2018
 24 April 2018 INTERIM REPORT JANUARY MARCH 2018 Reporting period January March Net sales increased by 10.4 per cent to SEK 2,674 (2,423) million. Organically, net sales decreased by 0.6 per cent EBITA*
Interim Report Q3 2017
 Interim Report Q3 217 JANUARY 1 SEPTEMBER 3, 217* (compared with the year-earlier period, continuing operations) Net sales increased 9% to SEK 12,422m (11,434) Adjusted EBITDA improved 1% to SEK 2,683m
60 Kärnhem. 348 BWG Homes AB. 643 Block Watne 2 QUARTER NEW ORDERS NOK million OPERATIONAL REVENUES NOK million 1 053
 2 QUARTER 2013 NEW ORDERS NOK million 1 088 OPERATIONAL REVENUES NOK million 1 053 OPERATIONAL EBITDA MARGIN Per cent 12.3 OPERATIONAL REVENUE PER BUSINESS AREA NOK million 60 Kärnhem 643 Block Watne 348
Interim Report January March 2003
 Interim Report January March 2003 23 April 2003 January-March Jan.-Dec. April-March Key figures 2003 2002 2002 2002/03 Net sales, SEK m 2,346 2,404 9,594 9,536 Operating income before depreciation, SEK
INTERIM REPORT Q XXL ASA HIGHLIGHTS. Q2 Growth
 INTERIM REPORT Q2 2014 XXL ASA HIGHLIGHTS Total revenues of NOK 1 246 million (NOK 945 million), up 32 per cent EBITDA increased by 47 per cent to NOK 184 million Successful opening in Finland One new
INTERIM FINANCIAL REPORT First quarter 2013 Company Announcement No. 493
 INTERIM FINANCIAL REPORT First quarter 2013 Company Announcement No. 493 30 April 2013 Selected financial and operating data for the period 1 January 31 March 2013 2013 2012 Revenue 10,981 10,819 Gross
Interim report January June 2008
 Interim report January June 2008 Interim report January June 2008 Second quarter Prices for fibre continues to increase while prices for sawlogs are stable. Agreement signed for biofuel production based
Interim Report 1 January 30 September 2013
 Interim Report 1 January 30 September 2013 Board of Directors 31 October 2013 1 VAPO OY INTERIM REPORT 1 JANUARY 30 SEPTEMBER 2013 July-September Group turnover in the July-September period was EUR 107.9
First quarter report 2012 Q 2012
 report 2012 Q 2012 page 2 FIRST QUARTER Contents Contents Financial review 3 Overview 3 Market developments and outlook 5 Additional factors impacting Hydro 7 Underlying EBIT 8 Items excluded from underlying
Year-end Report 2016 January - December YEAR-END REPORT 2016 OCTOBER DECEMBER 2016 JANUARY DECEMBER 2016 TROAX GROUP FIGURES
 Year-end Report 2016 January - December Troax Group AB (publ) Hillerstorp 14th February, 2017 YEAR-END REPORT 2016 OCTOBER DECEMBER 2016 Order intake increased by 21 per cent, or 26 per cent adjusted for
UPM-KYMMENE INTERIM REVIEW 1 JANUARY 30 JUNE 2001
 UPM-KYMMENE INTERIM REVIEW 1 JANUARY 30 JUNE 2001 Earnings per share, excluding net capital gains, improved to EUR 1.91 (1 6/2000: 1.80). Profit before extraordinary items and net capital gains was EUR
P R E S S R E L E A S E
 P R E S S R E L E A S E from ASSA ABLOY AB (publ) 27 April 2005 No. 8/05 STRONG GROWTH IN USA BUT WEAKER IN EUROPE FOR ASSA ABLOY Sales for the first quarter of 2005 increased organically by 2% to SEK
P R E S S R E L E A S E
 P R E S S R E L E A S E from ASSA ABLOY AB (publ) 6 February 2003 No. 03/03 REPORT FOR THE FOURTH QUARTER OF 2002 (YEAR-END REPORT) Sales increased 3% for the quarter, 12% in local currencies, 2% organic
Second quarter report 2012 Q 2012
 report Q page 2 SECOND QUARTER Contents Contents Financial review 3 Overview 3 Market developments and outlook 5 Additional factors impacting Hydro 7 Underlying EBIT 7 Finance 12 Tax 12 Items excluded
Interim report Q3, July September 2017 Stockholm, 25 October 2017
 Interim report Q3, July September Stockholm, 25 October As of the second quarter of, Cloetta Italia S.r.l. is accounted for as discontinued operation. The comparative figures in the consolidated profit
Year-end report 2009
 Year-end report 2009 Year-end report 2009 Fourth quarter Year ended on a strong note with increased sales. Good demand for wood raw material, primarily sawlogs and biofuel, with rising prices. Net sales
Clas Ohlson: Year-end report 1 May April 2013
 Clas Ohlson: Year-end report 1 May 2012 30 April 2013 Fourth quarter * Sales totalled SEK 1,274 M (1,272). In local currencies, growth was 3%. * Operating loss of SEK 19 M reported (profit: 10). * Loss
Interim Report Polygon AB
 Interim Report Polygon AB January - March 2017 FIRST QUARTER 2017 Sales + 21% 132.8 million (109.4) Strong organic growth of 21% as a result of healthy backlog levels also fuelled by an increased share
Highlights and key figures third quarter 2016
 Report for 3rd quarter 2016 Highlights and key figures third quarter 2016 Highlights All-time high revenue and profit for the quarter High activity, particularly in Sweden Strong order backlog of NOK 1,444
Func Food Group Financial Release / Q1 2018
 Func Food Group Financial Release / Q1 2018 Func Food Group Financial Release / Q1 2018 Func Food Group / Q1 2018 3 FUNC FOOD GROUP IN BRIEF Func Food Group ( FFG ) is a Nordic wellness company, which
3 months 12 months Setra Group Group Oct.-Dec. Oct.-Dec. Jan.-Dec. Jan.-Dec.
 Year-End Report 28 SETRA GROUP AB (publ), Box 327, 169 3 Solna, Sweden, tel. +46 8 75 3, www.setragroup.se, corp. reg. no. 55634-8483 Page 1 of 13 Year-End Report 28 Consolidated net sales for 28 amounted
First quarter report 1
 report 1 2 FIRST QUARTER REPORT Contents Contents Financial review 3 Overview 3 Market developments and outlook 5 Additional factors impacting Hydro 7 Underlying EBIT 8 Finance 12 Tax 12 Items excluded
Half year financial report
 Half year financial report Six-month period ended June 30, 2016 Condensed Consolidated Financial Statements Management Report CEO Attestation Statutory Auditors Review Report Table of contents Condensed
Report first half year and second quarter
 Defence/Aerospace Energy/Telecoms Industry Medical devices Offshore/Marine Report first half year and second quarter Norway Sweden Lithuania Germany USA China Report first half year and second quarter
Holmen s interim report January June 2016
 Holmen s interim report January June 216 2-16 1-16 2-15 216 215 215 Net sales 3 937 3 828 4 139 7 765 8 293 16 14 Operating profit excl. items affecting comparability 483 58 435 1 63 831 1 7 Operating
Metsä Group Interim Report Q3/2016
 Metsä Group Interim Report Q3/2016 Kari Jordan President and CEO Metsä Group Q3 Business developed as expected Sales EUR 3,483 million (1 9/2016: EUR 3,811 million) Comparable operating result EUR 332
UPM-Kymmene. Interim Review
 UPM-Kymmene Interim Review 1 6/2002 UPM-Kymmene Interim Review 1 January 30 June 2002 Second-quarter earnings per share, excluding capital gains/losses, were 0.49 (0.60 for the first quarter). Operating
Highlights. 3 rd quarter 2017 / KEY EVENTS
 NRC GROUP ASA / Q3 REPORT 2017 Highlights 3 rd quarter 2017 / KEY EVENTS All time high quarterly revenue and EBITDA Record EBITDA margin driven by strong project execution Closed acquisitions of ALTi and
Holmen Excl. Items affecting comparability. Holmen
 Full Year MSEK 4-1 3-1 4-9 21 29 Net turnover 4 747 4 25 4 659 17 581 18 71 Operating profit 625 383 392 1 596 1 62 Operating profit excl. items affecting comp. * 361 383 392 1 332 1 62 Profit after tax
Interim Report Q1 2013
 Interim Report Q1 2013 1 JANUARY 31 MARCH 2013 (compared with same period a year ago) Net sales rose 15% (20% excluding exchange rate effects and divestments) to SEK 22,386m (19,490) Operating profit excluding
Interim report May July 2009/10
 Interim report May July 2009/10 Order bookings rose 19* percent. Net sales increased by 15* percent. Operating profit rose to SEK 89 M (13). Profit after taxes increased to SEK 56 M (1). Earnings per share
P R E S S R E L E A S E
 P R E S S R E L E A S E from ASSA ABLOY AB (publ) 16 February 2005 No. 3/05 GOOD END TO A STRONG YEAR FOR ASSA ABLOY Sales for the fourth quarter increased organically by 4% to SEK 6,263 M (6,096) after
Scania Interim Report January September 2017
 30 October 2017 Scania Interim Report January September 2017 Summary of the first nine months of 2017 Operating income, excluding items affecting comparability, amounted to SEK 9,080 m. (7,492) Operating
AINMT Scandinavia Holdings AS. Quarterly Report January - June
 Quarterly Report January - June 2 0 1 6 Quarterly report SECOND QUARTER SUMMARY - Service revenue of NOK 194,257 thousands; 19% y-o-y growth - EBITDA* of NOK -76,232 thousands - Book equity of NOK 534
hms networks JANUARY - DECEMBER 2013 Fourth quarter
 hms networks Y E A R - E N D R E P O R T 2 0 1 3 JANUARY - DECEMBER q Net sales for the full year reached SEK 501 m (382), corresponding to a 31 % increase. The revaluation of the Swedish currency had
INTERIM FINANCIAL REPORT H Company announcement no. 637
 INTERIM FINANCIAL REPORT H1 2016 Company announcement no. 637 5 August 2016 Selected financial and operating data for the period 1 January 30 June 2016 (DKKm) Q2 2016 Q2 2015 YTD 2016 YTD 2015 Net revenue
Scania Interim Report January-March 2017
 5 May 2017 Scania Interim Report January-March 2017 Summary of the first three months of 2017 Operating income rose by 35 percent to SEK 3,081 m. (2,275) Net sales increased by 23 percent to SEK 28,411
Holmen s year-end report 2016
 Holmen s year-end report 216 Full Year 4-16 3-16 4-15 216 215 Net sales 3 937 3 81 3 689 15 513 16 14 Operating profit excl. items affecting comparability 579 52 376 2 162 1 7 Operating profit 579 52-555
INTERIM REPORT JANUARY JUNE 2017
 18 July 2017 INTERIM REPORT JANUARY JUNE 2017 Reporting period January June Net sales increased by 10.2 per cent to SEK 4,876 (4,424) million. Organically, net sales grew by 0.5 per cent EBITA* increased
January-September 2016
 January-September Third Quarter Like-for-like ( L/L ) RevPAR for leased and managed hotels was up by 5.3%. The growth is mainly due to an increase in average room rate. Revenue decreased by 3.9% to 251.3
Strong online sales and improved margins
 FIRST QUARTER SEPTEMBER 1, 2016 NOVEMBER 30, 2016 Strong online sales and improved margins Interim Report September November 2016 First quarter Net sales for the quarter increased 7.5 per cent to SEK 2,284
New record results for a third quarter
 New record results for a third quarter The third quarter of 2018 Net turnover amounted to SEK 6,119 M (6,302), a decrease of 3 per cent. Operational earnings amounted to SEK 221 M (200). The improved profit
Q third quarter of Solør Bioenergy Group Interim report for the
 Q3 2016 Solør Bioenergy Group Interim report for the third quarter of 2016 January September 2016 Solör Bioenergi Holding AB (publ), Corp. Reg. No. 556907 9535 Stockholm, October 28, 2016 www.solorbioenergi.com
Earnings before tax NOK 336 million Profit margin 5.5%
 FOURTH QUARTER REPORT 2013 VEIDEKKE ASA 1 Report Q4 2013 HIGHLIGHTS, FOURTH QUARTER Operating revenues NOK 6,146 million Earnings before tax NOK 336 million (5.5% profit margin) Order backlog NOK 18.3
QUARTERLY REPORT
 QUARTERLY REPORT 03-2018 QUARTERLY REPORT 3 RD QUARTER 2018 1 Q3 2018 HIGHLIGHTS In the first nine months of the year, Agder Energi made an underlying¹ operating profit based on IFRS of NOK 1,701 million
Highlights. 2 nd quarter and first half 2018 / KEY FIGURES Q2 2018
 Highlights 2 nd quarter and first half 2018 / KEY FIGURES Q2 2018 Revenues of NOK 827 million in 2018, an increase of 42% EBITDA of NOK 65 million in 2018, an increase of 51% Order backlog of NOK 3,178
Fourth quarter of 2010
 Fourth quarter of 2010 Main features of the fourth quarter of 2010 Operating revenue NOK 3,363 million, 2% organic growth EBITA before synergy costs NOK 171 million (NOK 283 million) Revenue growth and
Interim report January March 2009
 Interim report January March 2009 Interim report January March 2009 First quarter Low sales volume to sawmills and the pulp and paper industry. Further reductions in timber prices. Good demand for biofuel
BUSINESS REVIEW Q3/2018 / CRAMO PLC Q3
 BUSINESS REVIEW /2018 / CRAMO PLC 1 PROFITABLE GROWTH CONTINUED BUSINESS REVIEW /2018 / CRAMO PLC JULY SEPTEMBER 2018 Sales EUR 197.9 (191.9) million, up by 3.1%. In local currencies, sales grew by 7.5%.
Interim Report Q4/2015 Statkraft AS
 Q4 Interim Report Q4/2015 Statkraft AS Key figures NOK million 2015 2014 Change 2015 2014 Change From income statement 1) Gross operating revenues, underlying 15 101 13 754 1 346 50 578 48 348 2 230 Net
YEAR-END REPORT 2014 Stockholm February 6, 2015
 YEAR-END REPORT Stockholm February 6, 2015 Kai Wärn, President and CEO: I am pleased to conclude that the fourth quarter continued the strong trend of improvements that we have seen throughout the year.
HIGHLIGHT AND KEY FIGURES Q4 2015
 Interim report Q4 2015 HIGHLIGHT AND KEY FIGURES Q4 2015 HIGHLIGHTS Completion of the acquisition of 49.9% ownership in ADLER Solar Revenues of USD 8.8 million in Q4 2015 vs USD 10.6 million in Q4 2014
Everything to do with our finances. And then some. Report for the first quarter of 2013
 Everything to do with our finances. And then some. Report for the first quarter of 2013 Report for the first quarter of 2013 First quarter Net turnover amounted to SEK 4,048 M (4,562). Operating profit