ANNUAL REPORT Mjøstårnet, Brumunddal. Photo: Moelven
|
|
|
- Cuthbert Horn
- 5 years ago
- Views:
Transcription

1 ANNUAL REPORT 2017 Mjøstårnet, Brumunddal. Photo: Moelven
2
3 This document contains the formal requirements for annual reporting. The annual report for Moelven 2017 with complementary information about the year, is available at 2017.moelven.com Content CEO Comments 4 Main figures for five years 6 Report of the Board of Directors 7 Corporate governance 20 Social responsibility 25 Group Key figures 80 Income statement 82 Statement of financial position 83 Statement of changes in equity 85 Cash flow statement 86 Financing activities 87 Notes 88 ASA Profit and loss account 125 Balance sheet 126 Cash flow statement 128 Notes 129 Independent auditor`s report 142 Statement by the Corporate Assembly 145 Financial calendar 146

4 COMMENTS BY THE CEO Positive development for Moelven Moelven earned NOK 420 million from operations in This is an improvement of NOK 125 million compared with the previous year. Operating revenues for the full year increased by 4.5 per cent to NOK 10,768 million. For Moelven, 2017 was a year in which the positive development from 2016 continued. Internally, we have continued to improve underlying operations and, externally, we have benefited from good market conditions. The restructuring work we started in 2014 has produced results. During the last year, we have reduced our net interest-bearing debt and increased our equityratio to 41.5 per cent. The return on capital employed (ROCE) is now at 14.2 per cent. All of this is well within the target we set ourselves in It gives a good basis for being able to provide our owners with a good return on investment over time. The improvement and restructuring measures aimed at achieving our long-term goals will continue in 2018 as well. Efforts aimed at reducing injuries has been given high priority for several years. When one looks at Moelven's progress on HSE, the figures tell us two things. The number of reports of hazardous situations and near accidents has risen in the last year. This shows there is a greater focus on HSE. However, there are still far too many injuries at Moelven, and the development during 2017 has not been satisfactory. We are more than 3,500 employees and all of us should "come home safe". We have a shared responsibility here, and the effort to reduce injuries will be important in the time to come. How have Moelven's divisions done in 2017? All three og Moelven s divisions have shown clear improvements in profitability, despite the fact that they operate in different markets that are impacted differently by economic cycles. The improvement work in the Timber division continued in The main tasks involves primarily developing and improving its competitiveness in the global markets. During the year, it has been pleasing to see the improvements in profitability that have taken place, amongst others at Moelven Dalaträ AB and at Moelven Årjäng Såg AB. The Wood division continues to benefit from a growing market for building materials. In particular, there is an increase in the demand for products that require minimal processing after assembly. 4

5 Moelven Vänerply AB is Scandinavia s only plywood producer, and is another company in the Wood division with a positive development. We have invested more than NOK 100 million in modernising its machinery since we acquired the company in The investmens has increased capacity and productivity, which in turn has produced a good return. In order to further improve the technical standard and increase the share of prefabricated products, additional investments will be made. Moelven's Building Systems division is experiencing a higher level of activity, especially within Modular Buildings and Laminated Timber. The glulam-technology, which took off 30 years ago in connection with the Olympic Winter Games in Lillehammer in 1994, has been a great journey so far. Since the Lillehammer Winter Olympics, we have developed technology that has taken us from the Vikingship arena to the construction of Gardermoen international airport and onwards, via innumerable wooden bridges, to the "Treet" apartment block in Bergen and now the worlds tallest wooden building, Mjøstårnet in Brumunddal. At just above 80 metres tall, Mjøstårnet will be an international landmark building. Moelven is proving that the high rises of the future can be built of wood. We are very proud of this. The building and technology are being noticed far beyond the borders of Norway and the Nordic region. What does the future look like for Moelven? Sustainability and the environment are gaining more attention in society. Wood and its characteristics are often emphasized in order to meet both public requirements and, not least, end-users' expectations for environmentally friendly products. This contributes to an increase in the demand for wood products. With solid, well-run operating units and a positive market development with a focus on sustainable business, we believe that Moelven is facing a positive future. We must continue our internal improvements for increased efficiency and profitability, but ensure that we deliver products and solutions that are sought in the market. We must continue to focus on quality and reliability and further develop our competitive edge. Technology brings Moelven into Industry the fourth industrial revolution, The development is fast and provides exciting opportunities for the Group. "The smart digital sawmill" is a two-year project at our largest sawmill, Moelven Valåsen AB. The purpose is to use technology that enables increased yield and increased capacity by reducing the number of production stops and reducing energy consumption. We are looking forward to following the project and the results in the year to come. The technological development has also been implemented, among other things, by increasing the level of robotization in the production of modules. At Moelven Byggmodul AB in Säffle, a new production line has been built with a high degree of robotization. The production line has contributed to an increase in capacity of 80%. This has meant that the need for employees by the way has increased, and in total we have created 40 new jobs. We are now well in the process of transferring experience and knowledge to other units in Moelven. We must also be more forward-thinking in the way we work. For example, we must be better at thinking holistically, also regarding the working careers of our employees. We are now entering a time when continuous learning will be a natural part of the job. Global changes affect us faster than before. This means that in the future, skills must be learned, unlearned and learned again several times. Internally, we have developed education programs for our employees so that they can further develop the skills they possess. The digitization of the value chain continues, and places great demands on new skills. In order to meet the future need of skilled personnel resources, we have also established our own trainee programme. We strongly believe in this. We notice that more and more people want to work in Moelven. our employees so that they can further develop the skills they possess. Our industry is forward-looking, and with framework conditions in line with those of our international competitors, we will be well-equipped for the future. The infrastructure is of great importance to our business. Looking at our colleagues in Sweden, they have better framework conditions regarding infrastructure than we have in Norway. If the domestic industry is to be a driver for Norway in the future, a cost-effective infrastructure must be facilitated. We will continue to focus on continuous operational improvements. If our in-house work is successful and we seize opportunities in the market, then we will have a good starting point for the future. Morten Kristiansen CEO Moelven Industrier AS 5
6 Main figures YTD YTD YTD YTD YTD Q4 Q4 Q4 Q4 Q4 Amounts in NOK million REG REG REG REG REG THE GROUP Operating revenues 10, , , , ,009.4 Gross operating profit (EBITDA) Depreciation Impairment Operating profit Financial items Profit before tax Total assets 5, , , , ,539.8 Equity in per cent Operating margin in per cent Investments Number of employees 3,546 3,492 3,426 3,326 3,276 TIMBER Operating revenues 3, , , , ,543.9 Gross operating profit (EBITDA) Depreciation Impairment Operating profit Financial items Profit before tax Total assets 1, , , , ,684.3 Operating margin in per cent Investments Number of employees WOOD Operating revenues 3, , , , ,820.4 Gross operating profit (EBITDA) Depreciation and impairment Operating profit Financial items Profit before tax Total assets 2, , , , ,966.7 Operating margin in per cent Investments Number of employees 1,079 1,039 1, ,011 BUILDING SYSTEMS Operating revenues 3, , , , ,514.1 Gross operating profit (EBITDA) Depreciation and impairment Operating profit Financial items Profit before taxes Total assets 1, , , , ,189.9 Operating margin in per cent Investments Number of employees 1,687 1,647 1,607 1,498 1,460 OTHER OPERATIONS Operating revenues 3, , , , ,623.7 Gross operating profit (EBITDA) Depreciation and impairment Operating profit Financial items Profit before tax Investments Number of employees


 For the Timber division in isolation the export share outside of Scandinavia is 45 per cent, and for the Wood division it is 10 per cent.")
7 Report of the Board of Directors in brief 2017 was another good year for Moelven, operating revenues increased to NOK 10.8 billion and operating profit improved to NOK million compared to NOK million in The Group's rate of return on employed capital increased to 14.2%, from 9.9% in With exports to more than 40 countries and on several continents, Moelven is dependent on developments in the global economy. Combined, approximately 15 per cent of the Group's turnover is in markets beyond Scandinavia. The geographical spread is broad enough to have a diversifying effect. It is mainly sawn timber that is exported. The demand for sawn timber was very good in (Photo: Moelven) For the Timber division in isolation the export share outside of Scandinavia is 45 per cent, and for the Wood division it is 10 per cent. Both price developments on the international market for sawn timber and exchange rate developments therefore have a major impact on the business. International price levels are rapidly transferred to the domestic market in Scandinavia. In 2017 there has been good international demand for sawn timber. The delivery rate to the Middle East, North Africa and Asia was somewhat reduced in the first six months. This was however not related to the underlying demand for sawn timber, but was due to issues in connection with sea transport and public regulations. These were resolved in the second half of the year. Prices for sawn timber internationally increased compared to the previous year, while currency conditions, in particular against the EUR, contributed to good competitiveness for the exportoriented units. The UK is an important export market for Moelven. Prices in GBP have increased, and compensate the majority of the margin shortfall as a result of the depreciation of the pound following the Brexit referendum. The Wood division mainly sells its processed wood products on the building materials market in Scandinavia. Demand from this market has been satisfactory, although activity in rehabilitation, conversion and extension (RCE) in Sweden dropped somewhat and stabilised at a lower level after changes to the tax rules related to deductions in Price levels for the division as a whole increased for both finished goods and raw materials compared to the previous year. Timber stocks at the start of the year were satisfactory with regard to planned production levels for the winter of Access to timber in the first half of the year was normal for the season. In the second half of the year access was somewhat reduced in certain areas as a result of the wet autumn. The situation towards the end of the year, and at the end of 2017 timber stocks were satisfactory and on a par with the same time in For the Swedish units sawlog prices have been on a par with the previous year throughout 2017, while the Norwegian units have seen a slight increase in sawlog prices. Prices for wood chip and fibre products for the Swedish units have been at the same level as For the Norwegian units currency conditions and costs related to logistics had a certain negative effect in the second half of the year. Building Systems operates exclusively in building and construction in Scandinavia. Deliveries are to professional players in both the new building and RCEmarkets. Demand for the division's products and services have been satisfactory through the year as a whole. The combined order backlog at the end of the year was NOK 105 million lower than the previous year. Market conditions saw somewhat different developments in Norway and Sweden as the year progressed. In Sweden activity levels have remained high, but with signs of a certain slowdown after some years of very high activity. On the Norwegian side the oil slowdown is a thing of the past and market activity has been increasing. Climate smart construction and architectural innovation in the project Ängsnäs Terrass in Huddinge. Building modules supplied by Moelven Byggmodul AB. Moelven Wood Prosjekt AS supplied the facades in untreated cedar to the project Grilstad Marina in Trondheim. (Photo: Matthias Herzog) 7

8 Strategy Sustainability and the climate challenges the world is facing are attracting more and more attention. This, in combination with increased knowledge and awareness of wood s properties and opportunities, have led to greater interest in environmentally friendly building with wood as a building material. Among the Moelven Group s products and services, the deliveries from Wood and Building systems are most visible to the outside world. This concerns both processed wood building materials, bridges and other load-bearing structures in glulam and module-based apartment buildings. In addition, activity in infrastructure is high. Use of wood in connection with this is also on the increase, and is an important cause of the good demand for sawn timber, which is the main product of the Timber companies. For the Moelven Group sustainability and environmental impact have been central topics for a long time, and are a natural part of the culture and mindset in a business based on wood as a raw material. In the annual strategy work, the board has nevertheless placed even greater emphasis on sustainability in Starting from 2017, sustainability reporting in accordance with the GRI standards (Global Reporting Initiative) and climate accounts according to the GHG protocol (GreenHouse Gas) are included in public reporting. Moelven s mechanical wood business uses raw materials from sustainable forestry. Read more about this in the Group's Sustainability Report for (Photo: Johan Alp) Besides the environmental and sustainability theme, HSE has become steadily more important in the strategy work. The Group has a long-term target of zero injuries it should be safe to work at Moelven. However, the development in the injury rate has not been satisfactory, with only a marginal improvement in H1 value from 12.8 in 2016 to 12.4 in In the strategy plan a subsidiary goal has been established for 2020 that the number of lost time injuries per million worked hours (LTI rate) shall be below five and that the number of reported hazardous conditions / near accidents shall be at least 3,500 (one per employee). The goal for sick leave is to reduce this to below four per cent within the end of the strategy period. The health, safety and environment strategy can be summarized in nine points: Clear goals Clear leadership Increased use of resources Clear sharing of responsibility Increased expertise Underpinning systems Unambiguous processes and rules Incentives and consequences Frequent information. With regard to business, the Group is in a phase where large parts of operations are doing well and with improving results, while other parts of operations still fail to meet the requirements to profitability and returns that have been defined. It is thus important that the right priorities and choices are made, to have the best possible foundation for sustained profitability. The shareholder values in Moelven are best ensured and developed by the organization focusing on developing the units the company currently possesses, which in all likelihood will reach profitability targets in the course of an economic cycle. New investments must be adjusted to the strategic choices that have been made and take place within the applicable financial framework. Investments and growth will mainly take place on the basis of existing business areas. Efforts on internal improvement work and restructuring in accordance with the action plan that was drawn up in the autumn of 2014 have proceeded with full strength in 2017, and are the main cause of the improved results. In addition, several organizational changes are being implemented, as well as major investment projects that will improve efficiency and profitability. At the Group's two largest sawmills in Sweden, Moelven Valåsen AB and Moelven Notnäs AB, investment projects are being carried out with an overall framework of around SEK 164 million. Besides exploiting the opportunities afforded by new technology, competence development and organizational rationalization have high priority in these projects. Investments will be made in stages, and will be completed by the summer of At Moelven Byggmodul AB s factory in Säffle, the investment project for a robotized production line was completed according to plan in the second quarter of The project, which had a framework of SEK 72 million, almost doubled the overall capacity at the factory and provided more rational production solutions. 8
9 CORPORATE GOVERNANCE At the Corporate Assembly meeting after the annual general meeting on 26 April 2017, Aud Ingvild Storås was elected as new member of the board of directors to replace Mari Wilhelmsen. Beyond this, there have been no changes to the board in As of 26 April the board has consisted of Olav Fjell (chairman), Trond Stangeby (deputy chairman), Elisabeth Krokeide, Aud Ingvild Storås, Asbjørn Bjørnstad, Martin Fauchald and Lars Håkan Karlsson. Corporate governance at the Moelven Group is based on the current Norwegian recommendation for corporate governance of October The Board's report on the Group's policies and practice for corporate governance in accordance with section 3-3b of the Norwegian Accounting Act has been incorporated into the board s account of corporate governance on page XX. Comprehensive information on the Group s governing bodies is published at and in note 28. Corporate structure Moelven acquired DLH s Swedish operations in Hässleholm on 21 November The acquisition included inventory, warehouses and office premises, and gave Moelven improved market access in southern Sweden and strengthened logistics. In March 2017 it was decided to move the entire storage and processing activity in Malmö to Hässleholm. In connection with the move, Malmö AB, which owned the old warehouse building in Malmö, was sold. The company had no employees. Moelven Wood retains a sales office in Malmö. management and market organization. The operations will continue with two production locations. With effect from 1 January Moelven Tom Heurlin AB in Ånimskog was transferred from Timber to Wood. In the course of 2017, the company s activities have been restructured and adapted to Wood s market strategy within Scandinavia. The company s planing activities are included in the production and processing of interior panels together with the sister companies Moelven Värmlands Trä AB (Säffle) and Moelven Notnäs Wood AB (Notnäs). The structure process entails downsizing of 16 employees in Ånimskog and 9 in Säffle. The merger between the companies was completed with effect from 27 December, with Moelven Notnäs Wood AB as the acquiring company. Operations continue at three production locations under the company name Moelven Wood Interiör AB. Moelven Polska Sp. z o.o was established in the fourth quarter of 2017 as a wholly-owned subsidiary of Moelven Industrier ASA. The company is a sales company and will have no production of its own. Moelven Polska Sp. z o.o. will serve the Polish market, primarily with sales of Timber s products. This is the Moelven Group Ownership structure is owned by Glommen Skog SA (29.1 %), Eidsiva Vekst AS (23.8%), Felleskjøpet Agri SA (15.9%), Viken Skog SA (11.9%), Mjøsen Skog SA (11.8%) and AT Skog SA (7.3%). Most of the remaining 0.4 per cent is owned by private individuals. On 25 September the Board of Moelven Norsälven AB decided to discontinue sawmill operations. This is because the plant s technical condition is so poor that even significant investments would most likely fail to turn it into a future-oriented and profitable plant. The closing of Moelven Norsälven is part of a structural overall assessment required to create better overall profitability in the Moelven Group. A total of 42 employees are affected by the closure. Production at the facility stopped at the turn of the year, and liquidation will largely be completed in the first quarter of % 11.8 % 15.9 % Moelven shareholders 7.3 % 0.4 % 29.1 % Glommen Skog SA Eidsiva Vekst AS Felleskjøpet Agri SA Viken Skog SA Mjøsen Skog SA AT Skog SA Other (896 owners) 23.8 % Moelven Våler AS and Moelven Løten AS have established joint management and administration. The main reason for the two companies to enter into an administrative partnership is to save costs and strengthen both companies' competitiveness. The companies will both continue as separate legal entities, but with administrative coordination. On 10 October the two wholly-owned Timber companies Moelven Ransbysågen AB and Moelven Notnäs AB were merged into one company with the latter as the acquiring company. The merged company is called Moelven Notnäs Ransby AB. The companies have for an extended period shared Vision Moelven is a Scandinavian Group. All production units are located in Scandinavia, which is also the primary market. Moelven's vision is to be the natural choice for people who wish to build and live Scandinavian, and the Group shall take the lead in developing buildings that are based on Scandinavian building traditions. Within this framework, activities are based on a desire and an ability to contribute to creating good spaces good environments to live and work in, and for all social functions. Good Scandinavian environments are often 9
10 close to nature in their form and content. Wood and other natural materials are essential parts of what Moelven makes and are dominant in the greater part of the product range. Natural materials are environmentally friendly building materials and building solutions when it comes to houses, modules, bridges and interior products. Moelven offers a wide range of building products and building systems and associated services. The Scandinavian market accounts for 85 per cent of sales revenues and 85 per cent of the Group's products and services are used for new building or renovation, conversion and extension of homes and commercial property. A large part of the remaining operation consists of sales of biomass for biofuel and for pulp, paper and particle board production. The Group also supplies wood products to the furniture, interior and packaging sectors. Location The Group has its headquarters in Moelv in Norway and consists of 37 production companies in 46 production locations, and a number of offices for sales, service and fitting. Most of the production units are companies and workplaces with a strong local presence in rural communities in South East Norway and the western part of Central Sweden. The offices for sales, service and fitting are located in larger population centres around Norway, Sweden, Denmark, the United Kingdom, Germany, the Netherlands and Poland. Production in Norway and Sweden is of approximately the same volume, but the Swedish units export a greater proportion of their production than the Norwegian. Out of a total of (3,492) employees at the end of 2017, 1,662 (1,625) work in Norway, (1,839) in Sweden, 20 (19) in Denmark and 8 (9) in other countries. Divisions The Group is divided into three divisions: Timber, Wood and Building Systems, each of which focuses on one of the main segments of industry, trade and project. There is also an Other Businesses reporting area, which consists of the holding companies with group functions, supply businesses, fibre products and bioenergy companies. Timber The Timber division consists of 11 production companies and 5 sales offices, supplying industrial timber, components and chip products made from local spruce and pine. The customers are mainly industrial companies that buy intermediate products for their own production of construction timber, glulam, panels, flooring, mouldings, windows, packaging, board and paper products and for bioenergy. About 55 per cent of operating revenues come from Scandinavian customers. At the end of 2017, there were 650 (674) employees, 242 (235) of them in Norway, 400 (430) in Sweden and 8 (9) in other countries. Wood The Wood division comprises 18 production companies, 3 customer centres and one project sales company. The main products are white and impregnated building wood, external cladding, boards, length-adapted products and chip products, as well as interior products such as mouldings, flooring and interior panels. Wood also trades in purchased products. Around 75 per cent of timber and board production is sold through the building products trade and wood processing industry. Wood is one of the leading suppliers to the Scandinavian market and about 90 per cent of its operating revenues come from Scandinavian customers. At the end of 2017, there were (1,039) employees, 586 (581) of them in Norway, 473 (439) in Sweden and 20 (19) in Denmark. Building Systems The Building Systems division consists of 7 production companies at 12 production locations and a number of sales, service and fitting offices. Building Systems is divided into the business areas Glulam, Building Modules and Interior System, all three of which are market leaders in Norway and Sweden. The division's building and contracting customers buy customised building modules, flexible interior solutions systems and associated services and advanced glulam structures. In addition to bridges and load-bearing structures, the glulam unit also has considerable sales of standard laminated timber beams through the building products trade, as well as components for the prefabricated house industry. Operating revenues are primarily from Scandinavian customers. At the end of 2017, there were (1 647) employees, 783 (757) of them in Norway and 904 (890) in Sweden. In order to ensure adequate flexibility in production capacity to meet seasonal and economic fluctuations in the market, the divisions use hired workers to some extent. Hired workers are not included in the employee figures. Hiring is from staffing companies who comply with the EU temporary agency work directive, and this entails that hired personnel are ensured the same terms as if they were employed by Moelven. Other Businesses Other businesses include Moelven Industrier ASA, with shared services for finance, accounting, insurance, communications, HR and ICT. Timber supply and sales of wood chips and energy products are organised as a common function for the Group's timber processing industry and comprises the Group companies Moelven Skog AB, Moelven Virke AS, Vänerbränsle AB and Moelven Bioenergi AS. In addition there is the affiliate Weda Skog AB. At the end of 2017, there were 130 (132) employees, 51 (52) of them in Norway and 79 (80) in Sweden. 10


11 CORPORATE SOCIAL RESPONSIBILITY The Board has processed and approved the Groups general strategy and guidelines relating to HSE, social responsibility, the environment and competition law. The discussion of these areas is included in the Board's explanation of principles and practice concerning social responsibility pursuant to the Accounting Act Section 3-3c. OPERATING REVENUES AND RESULTS Amounts in NOK million Operating revenue 10, ,309.7 EBITDA Avskrivninger and impairment Driftsresultat Profit before tax the Timber division amounting to NOK 16.5 million and a disparagement of the project portfolio in Building Systems amounting to NOK 40.0 million. Corrected for this, the increase in operating income was 32.7 per cent. The operating margin was improved to 3.9 per cent (2.9). Overall, delivery volumes have been somewhat higher than the previous year. Increased prices for sawn timber and a change product mix to the building products trade further contributed to the increase in operating revenues compared to the previous year. In addition to its own production, the Group buys sawn timber externally. Price developments for sawn timber have thus also affected the Group s raw material costs. For the timber-consuming part of the Group, raw material costs in Sweden have been at the same level as the previous year throughout 2017, while the Norwegian units saw a certain increase in sawlog prices. Prices for wood chip and fibre products for the Swedish units have been at the same level as For the Norwegian units currency conditions and costs related to logistics had a certain negative effect in the second half of the year. The FIFO principle requires that inventory calculations are adjusted in line with developments in raw material costs. Along with an update of real value assessments of inventory, this has provided a positive effect totalling NOK 39.7 million (9.0) for the year. The items do not have any impact on cash flow. The accumulated financial result for 2017 is positively impacted by NOK 9.6 million as a result of a reversal of previously allocated warranty costs. The Group employs financial instruments as a hedge against short-term fluctuations in foreign exchange rates, interest rates and power prices. Non-cash items connected to fair value adjustments on unrealised hedging instruments comprised NOK 4.7 million (14.6) Net financial expenses excluding changes in the value of financial instruments and recognized guarantee provisions were NOK 51,7 million in 2017, compared to NOK 57.0 million the previous year. Lower average net interest-bearing liabilities are the main reason for this. Operating revenues in 2017 increased by 4.5 per cent compared to The main causes are increased sawn timber prices, a changed product mix in Wood, and a higher level of activity in Building Modules and Glulam. Operating income for the year including restructurings, increased by 42.4 per cent. The operating result for 2017 includes a charge from the third quarter of NOK 46.1million. The background for the item is the decision to close Moelven Norsälven AB from the turn of the year, in addition to a resolved dispute related to a larger project in Building Systems. In 2016 a write-down of fixed assets was completed in Timber Amounts in NOK million Operating revenue 3, ,020.6 EBITDA Avskrivninger and impairment Driftsresultat Profit before tax Activity and demand in the Timber division s main markets was consistently good in 2017, with normal seasonal variations throughout the year. Both deliveries and production volumes increased compared to The figures for 2017 are affected both by production at Moelven Norsälven AB closing down in the fourth quarter, and that Moelven Tom Heurlin AB 11
12 was transferred to Wood as of 1 January Average prices also increased in Most of the exports take place from the division's Swedish units, and the bulk is settled in EUR. For 2017 as a whole, EUR has been stronger against SEK than in The UK is an important export market for Timber. Prices in GBP have increased, and compensate the majority of the margin shortfall as a result of the depreciation of the pound following the Brexit referendum. Deliveries to the Middle East, North Africa and Asia were somewhat reduced due to challenges related to sea transport and public regulations. The situation was largely resolved in the course of the second half of the year. Operating conditions in 2017 were generally good, particularly in the first quarter with a milder winter than in Several units have improved efficiency as a result of the ongoing improvement work. In Sweden both Moelven Notnäs AB and Moelven Valåsen AB have completed investment projects in 2017 to ensure competitive and future-oriented cost efficiency, and have achieved good results. On the Norwegian side, Moelven Våler AS and Moelven Løten AS have been administratively coordinated into one unit. Several units remain that fail to generate satisfactory results, and improvement work to bring these up to acceptable profitability levels is central in the division s action and strategy plans. In all improvement work, as for the projects at Notnäs and Valåsen, much emphasis is on assessing how new technology may be adopted to ensure future-oriented development opportunities for the company with regard to capacity and value creation. Timber stocks at the start of the year were satisfactory with regard to planned production levels for the winter of Access to timber in the first half of the year was normal for the season. In the second half of the year access was somewhat reduced in certain areas as a result of the wet autumn. The situation improved towards the end of the year, and at the end of 2017 timber stocks were satisfactory and on a par with the same time in For the Swedish units timber prices have been on a par with the previous year throughout 2017, while the Norwegian units have seen a slight increase in sawlog prices. Prices for wood chip and fibre products for the Swedish units have been at the same level as For the Norwegian units, currency conditions and costs related to logistics had a certain negative effect in the second half of the year. Due to price developments the profits have seen a positive effect of a value adjustment to inventories totalling NOK 15.1 million. The corresponding price adjustment in 2016 was NOK -1.6 million. The result for 2017 includes impairment of fixed assets and cost provisions from the third quarter related to the closure of Moelven Norsälven AB totalling NOK 29.0 million. In 2016 an impairment of NOK 16.5 million was carried out as a consequence of the restructuring of Moelven Tom Heurlin AB prior to transfer to the Wood division in the fourth quarter of Wood Amounts in NOK million Operating revenue 3, ,529.9 EBITDA Avskrivninger and impairment Driftsresultat Profit before tax Around 80 per cent of the sawn timber and building products production of Wood is sold through the building products trade in Scandinavia. The remainder is mainly sold to industrial customers, both in the form of sawn timber, chip products and processed goods. Sales of custom products such as surface-treated or cut-to-length products are on the increase. Commissioning and building of new homes is at a high level in both countries. The same applies in renovation, conversion and extension, even after a certain decline related to the oil slowdown in Norway and changed tax rules for renovation, conversion and extension deductions in Sweden. In 2017 demand from the building products trade in Scandinavia was satisfactory. The increase in operating revenues is mainly due to a change in product mix and increased finished product prices. Raw material costs have also increased, and have made rationalization measures necessary in order to maintain results. The planing mills in the division use mainly sawlogs as raw material, and raw material costs for these units have therefore increased as a result of the price developments for sawlogs. Timber stocks at the start of the year were satisfactory with regard to planned production levels for the winter of Access to timber in the first half of the year was normal for the season. In the second half of the year access was somewhat reduced in certain areas as a result of the wet autumn. The situation improved towards the end of the year, and at the end of 2017 timber stocks were satisfactory and on a par with the same time in For the Swedish units sawlog prices have been on a par with the previous year throughout 2017, while the Norwegian units have seen a slight increase in sawlog prices. Prices for wood chip and fibre products for the Swedish units have been at the same level as For the Norwegian units, currency conditions and costs related to logistics had a certain negative effect in the second half of the year. Due to price developments, the profits for 2017 have been credited with a price adjustment to inventories totalling NOK 24.6 million. The corresponding price adjustment in 2016 amounted to NOK 10.6 million. 12
13 Building Systems Amounts in NOK million Operating revenue 3, ,616.8 EBITDA Avskrivninger and impairment Driftsresultat Profit before tax Both activity levels and operating results improved compared to At the end of the year the order backlog for the division was good overall, but NOK 105 million less than at the same time the previous year. The increase in operating revenues compared to 2016 is due to increased activity in Glulam and Building Modules in both Norway and Sweden. The operating revenues for 2016 include NOK 268 million from the electrical installations business, which now has been completely discontinued. The improvement in operating income compared to the previous year is mainly due to an improved result in Building Modules, in addition to income and expense corrections related to certain larger projects. Operating income for 2017 is charged with expense corrections totalling NOK 17.2 million as a result of a concluded dispute, and the operating income for 2016 is charged with income corrections totalling NOK 40 million as a result of a review of the project portfolio. For Glulam 2017 has been a year of high activity and good demand for both standard glulam and projects in both Norway and Sweden. Delivery volumes increased compared to the corresponding period last year, and production capacity with the current business model is practically fully utilised. Partly due to increased emphasis on sustainability and increased knowledge about the fire properties of glulam and the opportunities it provides, demand for glulam for load bearing structures in different types of buildings is increasing. On the Swedish market there has nevertheless been significant pressure on prices due to strong competition. For Interior system Moelven Modus in 2017 the Norwegian market has been characterized by increased demand after the oil slowdown had braked the activity the previous year. In Sweden market activity has generally been high for some time, but the boom has led to the increased establishment of competing companies and pressure on prices. At the end of the year demand was good in both the new building and RCE- market, but with strong competition. The particularly applies to the major cities of Oslo, Stockholm, Gothenburg and Malmø. Increased focus and emphasis on sustainable and climate-smart solutions has contributed to an increase of interest in using wood as a building material and having visible wood in the finished projects among both architects and customers. Other Businesses Amounts in NOK million Operating revenue 3, ,388.9 EBITDA Avskrivninger and impairment Driftsresultat Profit before tax Fluctuations in operating revenues in the area of Other Businesses are largely fluctuations in the level of activity within timber supply and sales of wood chips and energy products. The main activity is internal sales, which do not materially affect the results within the business area. In order to safeguard the supply of timber and market opportunities for wood chip and energy products in regions without local demand for pulp wood and wood chips, train solutions have been established for the transport of these. The business is based on fixed agreements on both the customer and supplier sides. In Building Modules activity has been good in all market segments in Sweden. Towards the end of the year there was a certain reduction in demand, but the level remains high. This applies in particular to the residential and project markets, although the demand for housing has dropped to more normal levels. Demand is also good for rental modules, but competition from foreign players is on the increase and contributes to pressure on prices. In Norway the picture has been more complex. The market for Moelven s residential concept was consistently good throughout the year, while the market for projects and standard modules picked up in the course of the year as a consequence of increasing investment in infrastructure. In 2017 the operations in both Norway and Sweden have undertaken investments for continued specialization and industrialization of wood module production. 13
14 INVESTMENTS, BALANCE SHEET AND FINANCING In the course of 2017 development and improvement investments of NOK 126 million (71) have been made. Upgrades and maintenance investments were NOK 231 million (204), and overall investments for the year were NOK 357 million (275). The increase in investments in 2017 compared to 2016 is partly due to the investment program in the group s current strategy plan, and partly that postponed projects have been implemented. For the year as a whole depreciation amounted to NOK million (306.6). The year s depreciations include an impairment of the fixed assets at Moelven Norsälven AB of NOK 17.6 million. The depreciations for 2016 include an impairment of the fixed assets at Moelven Tom Heurlin AB which was completed in the fourth quarter of NOK 16.5 million. At the turn of the year the book value of the group s total assets was NOK 5,044.6 million (4,766.8). Cash flow from operating activities was NOK million (NOK million), corresponding to NOK 5.22 per share (NOK 3.25). Beyond the result and normal fluctuations in working capital items, the improvements compared to last year are mainly due to reduced working capital in projects. Cash flow from working capital items was NOK 48.7 million ( ). Net interest-bearing liabilities were NOK million (NOK million) at the turn of the year. Financial leases are included in net interest-bearing liabilities in the amount of NOK 19.8 million (NOK 22.3 million). Cash reserves including short-term credit facilities were NOK million (NOK million). In the Group's main financing the available loan facility varies in time with the natural fluctuations in the Group's tiedup capital through the year. Equity at the end of the year amounted to NOK 2,092.5 million (NOK 1,813.4 million), equivalent to NOK (NOK 13.95) per share. The equity ratio was 41.5 per cent (38.0 per cent). The dividend for 2016 of NOK 0.48 per share, totalling NOK 62.2 million, was paid and charged to equity in the second quarter. Parts of the Group's equity are linked to ownership interests in foreign subsidiaries, principally in Sweden, and are thereby exposed to exchange rate fluctuations. The extent and consequences of likely variations in exchange rates are within acceptable risk limits. Year to date the change is NOK 41.1 million (-67.3). Approximately half of the Group's assets are recognized in SEK. The total assets thus also change based on the exchange rate, and the equity ratio in percent is therefore less impacted by exchange rate fluctuations than the nominal equity. RISK The Group's profits and balance sheet are affected by several external factors that can be influenced by Moelven to a greater or lesser extent. For some of the risk areas that affect the Group, there are functioning financial markets where the risk of fluctuations can be reduced. This applies, for example, to interest rates, exchange rates and electricity. The Group's financial policy is that it is the industrial activities rather than financial transactions that shall create the conditions necessary for profitability. The main aim of the guidelines for the use of financial instruments is to reduce fluctuations and create more predictability. In other areas, such as raw materials, finished goods and projects, other methods of hedging risk must be used. As far as possible, fixed price contracts or index linking of contracts is used, for example. The Group's composition of units directed at different primary markets also has the effect of reducing risk. The primary markets are seldom affected by economic fluctuations at the same time, while the cost side can still benefit from economies of scale. Sensitivity analysis Estimated change in operating profit and profit per share for one per cent change in price Operating profit Factor Operating profit NOK mill NOK per share Sawlog price - spruce and pine 25 0,19 Sawn timber price - spruce 11 0,08 Sawn timber price - pine 10 0,08 Chip and fibre product prices 5 0,04 Planed wood prices in Scandinavia 18 0,14 Laminated timber prices, standard dimensions 2 0,02 Electricity prices change 1 /MWh 0,7 0,01 Financial items Permanent change in NOK and SEK 7 0,05 Interest rate change +/- 100 b.p. 6 0,05 Ref. Note 5 to the financial statements for more information on financial items. Prices of finished goods The units of the Moelven Group operate in markets with free competition and many players. The creation of prices therefore occurs freely in the marketplace, and assuming unchanged volumes a change in process will affect the group as shown on the sensitivity table. Sawlog prices 's units annually use around 4.2 million cubic metres sawn spruce and pine in production. The total value is approximately NOK 2,500 million, including transport costs. Spruce and pine account for approximately equal portions of the round timber. Moelven does not own any forest, but buys all its timber from external suppliers. These suppliers are in turn dependent on functioning markets within an acceptable transport distance, as well as satisfactory price levels for both sawlogs and pulpwood. The cost of timber is by far the biggest single cost for the Group, and changes in timber prices have an immediate and substantial impact on margins. This involves both a price risk and a volume risk. The Group therefore focuses on entering into price agreements that as far 14
15 as possible correlate timber prices with expected changes in the price of finished goods. Prices of chips and biomass The price of cellulose chips and biomass, which come from saw and planing production in Timber and Wood, is of great significance for the Group's revenues. Even though work is constantly going on to improve the utilisation of raw material, only about half of each log becomes industrial timber after passing through a sawmill. The remaining half is cellulose chipping and sawdust, in addition to various dry fractions. Part of this is used for our own energy production, while the rest is sold to the particle board, bioenergy and fibre industries. Since a change in the profit margin for these products has a direct influence on the Group's results, the distance to the customers and access to efficient logistics solutions for road and rail transport are of great importance. Electricity prices The price of electric power is another important factor that affects the Group's profitability. About 230 GWh of electric power a year is bought via the Group's electricity suppliers on the Nasdaq OMX Commodities exchange. According to the Group's finance policy, the need for electric power shall be secured against price fluctuations so as to ensure stability and predictability. The anticipated power requirement is hedged within stated maximum and minimum levels by trading futures on Nasdaq OMX with a 5 year maximum horizon. Interest rate risk The Group's net interest-bearing debt is subject to interest rate risk. The bulk of the debt in SEK, which is why interest rates in Sweden are most important for the development of the Group's interest expense. The Group companies will be financed with loans from the parent company. All external borrowing is done by the parent company, which also makes hedging in accordance with financial policy. The hedging instruments that can be used are ordinary interest rate swaps, FRAs and composite swaps of types that are normally used for such purposes. The extent of hedging is measured in terms of the combined duration of outstanding debt and hedging arrangements. The total duration should be minimum 12 months and maximum 60 months and shall not be entered into hedging agreements with a maturity of more than 10 years. Exchange rate risk About 15 per cent of the Group's operating revenues come from markets outside Scandinavia and carry exchange rate risks. Additionally, there is significant internal and external trade within the group with both raw materials and finished products between Sweden and Norway. The most important currency crosses are EUR/SEK, GBP/SEK, SEK/NOK and EUR/NOK. Moelven uses forward contracts to counteract large cash flow fluctuations as a result of variations in exchange rates. Because of the hedging strategy that has been chosen, changes must be long-term so as to have the full effect on the Group's profitability, and during the hedging period operational adaptations may be made to compensate for the external changes. During the hedging period, operational adaptations may be made to compensate for the external changes. About half of the Group's total balance sheet is connected to activities in Sweden. The balance sheet figures will therefore be affected by the prevailing exchange rate between the Swedish and Norwegian kroner. A large part of equity is secured against this in that share investment in most of the Group's Swedish subsidiaries is financed in Swedish krona. At the end of 2017, the total equity that is exposed to exchange rate risk amounted to SEK 1,028.7 million (SEK million). Credit risk It is the Group's policy that credit sales over a certain size shall be secured in the form of either guarantees or credit insurance. In practice, credit insurance is used most. There are internal guidelines and follow-up routines for unsecured sales, which only occur when no other security is possible. Liquidity risk The Group's foreign capital financing consists of the long-term credit facility with a total ceiling of NOK 850 million and SEK 750 million. Once the loan agreement s option to extend the term was used in the second quarter of 2017, maturity is in June 2020 with the possibility for a further extension of one year until June The loan agreement includes normal default clauses with regard to dividends, equity, net equity value and debt ratio. As at 31 December 2017, the Group's key figures were better than the levels at which the default clauses are triggered. In addition to the long-term drawing facilities, the group also has short term credit facilities in its bank systems, amounting altogether to about NOK 312 million, which is renewed annually. Risk of damage and interruption to production The Group has a policy for industrial insurance that is centrally managed and which is followed by all companies. This policy gives guidelines for insurance cover, preventive measures, risk review and preparation of continuity plans. The continuity plans become key plans if a fire/damage should occur. The plans cover immediate efforts, disaster management and the ability to continue deliveries to customers. Through its industrial insurance, the Group is covered for financial loss exceeding NOK 3 million per individual claim. IT In an increasingly connected world with increasing digitization both in general in society but also in businesses like Moelven, an ongoing assessment of IT risk is important. Interconnected value chains increase efficiency, productivity and quality, but also increase 15
16 vulnerability to digital service outages. With increasing threats both domestically and internationally and recent years media reported incidents following IT attacks against businesses and public institutions, Moelven devoted extra attention to IT security and risk last year. Moelven follows basic principles of IT security, and constantly works to identify and monitor risks, protect systems and data, maintain IT security and prepare and manage any incidents and recover from these. Risk of loss of reputation Moelven places great emphasis on maintaining a good reputation. This is measured regularly using a brand survey that is conducted by external partners. There is financial risk linked to any loss of Moelven's reputation. The reputation risk is not quantified. Openness is what characterises the way the Group relates outwardly to society and the media and inwardly to employees of the Group. This applies whether it concerns positive or negative circumstances for Moelven, in line with Moelven's brand platform. Risk of loss of environmental costs The activities of the Moelven Group follow the prevailing legislation and regulations with regard to emissions and waste management. The Group has made provisions in the accounts for all known obligations in connection with environmental protection. The purpose of the Group's environmental policies is to minimize the risk of negative impact on the natural environment and thus the potential environmental cost as well. From 2017 the group has intensified focus on sustainability with an aim to be climate positive. EMPLOYEES, HEALTH, SAFETY AND THE ENVIRONMENT For a detailed description of the HSE area, please refer to the Board's explanation of principles and practice concerning social responsibility pursuant to the Accounting Act Section 3-3c. EFFECT ON THE EXTERNAL ENVIRONMENT For a detailed description of how the group's activities impact the external environment, please refer to the Board's explanation of principles and practice concerning social responsibility pursuant to the Accounting Act Section 3-3c. INNOVATION Innovation is defined as the entire process from an idea arises until the customer has bought a new product that represents an added value, or a new production process is implemented. Moelven's innovation focus is mainly to engage in development and innovation linked to a specific application of a product or in a production process. The group does itself engage in basic research, but participates in projects where this is deemed appropriate. The R&D projects must contribute to strengthen the various business areas in the group and reduce business risk. This may also entail participation in innovation projects outside of our own value chain, but in projects that support Moelven s operations and opportunities for growth. One example is the ongoing project at Moelven Töreboda AB to develop and improve building systems and acoustics in tall wooden buildings. The project is being carried out in cooperation with Företagsforskarskolen Prowood, where the purpose is to support and increase the competitive strength of the Swedish timber industry. Two doctoral fellows have been hired for the project, which gives the business unique access to the remaining academic community. In order for the group s mission statement to give people good rooms is to be upheld over time, it is essential that products and processes continuously develop in step with the outside world. Responsibility for is with corporate management. The group must facilitate innovation and provide resources, support and coordination. The innovation processes are conducted in the individual business areas where expertise is greatest. Where there are larger parts of the Moelven group that will benefit from the innovation area, joint projects are carried out. Norwegian Wood Cluster SA (NWC) is a newlyestablished industrial cluster in the forestry and timber industry value chain. NWC is owned by Hunton Fiber AS, Forestia AS, Boligpartner AS, Moelven Industrier ASA, Gausdal Bruvoll SA, Mjøsen Skog SA, Glommen Skog SA, Statskog SF and NTNU. Operations started up on 1 September 2017 when the newly-appointed cluster manager Engebret Dæhlin took up position. NWC has offices in Mustad Industrial Park in Gjøvik. In the start-up phase a significant proportion of the cluster manager s activity and focus has been to get to know and build relations among both the cluster members and prioritized external stakeholders, as well as within the timber industry in general. A strategy has been adopted for NWC with the following prioritized target areas: Strengthened employee expertise Strengthened R&D expertise Increased degree of advanced industrialization More research- and market-based innovation This forms the basis of the cluster s activities and projects that will be implemented throughout Moelven s participation in Norwegian Wood Cluster will provide us with a platform for development along with other players and be an important contribution to the group s R&D work going forward. 16
17 Product development and innovation The laminated timber area has been at the forefront of developing new products and technical solutions for many years. The more than 80 meters tall Mjøstårnet is under construction in Brumunddal. Mjøstårnet will be the world s tallest wooden building, and is a result of expertise that has been developed through many years in joints, oscillation, dynamics and fire resistance. The Trä8 system, which is a key component of Mjøstårnet, has been under development at Moelven Töreboda AB for several years. Trä8 is a glulam-based building system for tall wooden buildings. In addition to the actual glulam structure, the system takes into account modern requirements with regard to fire safety, acoustics and engineering methods. The structures in Mjøstårnet are scaled to withstand a full fire in a fire cell without causing the building to collapse. «Mjøstårnet» in Brumunddal is already before completion the world s tallest wooden building. When completed, the building will be more than 80 meters tall and an international landmark building. (Photo: Rune F. Andersen) In Timber the company Moelven Profil AS produces parts for door and window systems from pine and spruce. In recent years demand for heartwood parts has increased by 30%. In order to accommodate the market, the company has established the heartwood project. The heartwood project is a pilot project that aims to apply new X-ray technology to determine the heartwood proportion in pine. The project has received financial support from Innovation Norway. In Wood product development is of great importance in order for the choice of products to both follow the shifting market trends and satisfy requirements toward quality and functionality. The goal is to offer customers the market's best, most diverse and most modern product range in wood. Innovation work is divided into two main directions. One aims to develop modern products that contribute towards inspiration and new trends at the end-user. Development may focus both on design, use of material, environmental properties and degree of processing. One example is surface-treated cladding where demand has increased rapidly. Because surface treatment takes place industrially and in a controlled environment, the production process becomes more environmentally sustainable while also providing more added values for the end user. The other main direction aims to simplify work with the products at the building site. Examples of such solutions are preprocessed internal panels with concealed nails, various floor solutions, sheet products with reduced widths to ease handling, ready cut lengths, etc. Product development and innovation The Moelven group continually works to rationalize and improve processes at all stages from purchasing to finished product. For the project part of the glulam business, the use of new technology to process individual elements in the load-bearing structures is a precondition to provide complex, high-quality systems. For the part of glulam that is directed at the building products trade and for the processing units in Wood, the logistics systems are of great importance. Reduced costs and the environmental impact of efficient transport are important. The customers access to a wide range of products with short delivery times must be ensured. For the timber-consuming units in Timber and Wood, it is primarily the optimisation of the production processes that is of key importance. The goal of safeguarding the values inherent in the raw materials is the key with regard to both environmental and financial sustainability. The use of X-ray photography, camera sorting and mechanical strength sorting are tools that contribute to optimizing raw material utilization. At Moelven Valåsen AB a two year project is ongoing called The smart digital sawmill, where the objective is to increase the level of digitization in the sawmill to increase the recovery factor, increase capacity by reducing the number of production stops and reduce energy consumption. This is done by increasing the number of sensors in production and connecting these in order to further utilize data. In the project at Valåsen, Moelven has actively focused on ensuring that infrastructure, systems, data and patterns that are developed and put into operation are documented, centralized and owned by Moelven such that these may be developed by ourselves and not least deployed at other units in Moelven Industrier. The group has therefore chosen to use sensor technology and tools for capture, advanced analysis and machine learning from well-known and market leading manufacturers. This thus supports an architecture and strategy where all of Moelven s companies may benefit from and take part in the results and technology the project has built the first stage of. Further development and deployment is planned for the second half of In 2017 a new control system was employed at several units for operator visualization and control. This has resulted in improved efficiency and productivity. The Moelven-Group 17

18 Furthermore, a pilot project has been established for the implementation of a common maintenance system. Here too, the purpose is to standardize and coordinate this type of work to a greater extent. Next to profitability improvements from the actual improvement work at each individual unit, this work is about exploiting the overall expertise the group possesses, to share this across units and standardize the solutions that provide the best result. For the module and interior businesses it is important to exploit the competitive advantage inherent in the module concept rather than traditional building concepts: Industrial production of the modules indoors and shorter overall building time because several processes can take place simultaneously, and the modules can be quickly assembled at the building site. Development and refinement of technical solutions for production, connection of technical installations and assembly at the building site is important to operate profitable industrial production of module-based building solutions, and to exploit the advantages the concept provides. In connection with the conversion of Moelven Byggmodul AB's production facility in Säffle, new and improved production equipment was developed in cooperation with local suppliers. Besides capacity and efficiency improvements, the utilization of robot technology has enabled major improvements in HSE and logistics. The project, which has been very successful, was completed in the spring of 2017 and was the reason Moelven Byggmodul AB was named Lean builder of the year at Byggegalan in Stockholm on 27 March. The award is presented by Lean Forum Bygg and the Byggindustrin journal. The industrial mindset that has formed the basis of the project in Säffle is used as a template for future similar investment projects. Moelven Byggmodul AB in Säffle was named «Lean builder of the year» at Byggegalan in Stockholm on 27 March. The award is presented by Lean Forum Bygg and the Byggindustrin journal. (Photo: Tommy Hellström) ALLOCATION OF THE NET PROFIT FOR THE YEAR The Board of Directors' dividend policy is based on Moelven's shareholders receiving a predictable and satisfactory cash return on their share investment. The policy provides guidelines for how much of the profit, or of distributable equity in years with a loss, shall be distributed as a dividend. The Group's net profit for 2017 was NOK million (179.1). The equity ratio was 41.5 per cent (38.0 per cent). The Group has adequate equity to disburse a dividend in accordance with the applicable dividend policy. Based on the results for 2017 and taking into account the normal seasonal variations in the Group's employed capital and equity ratio, the Board proposes a dividend of NOK 0.68 per share to the annual general meeting. This totals NOK 88,088,073. The parent company Moelven Industrier ASA, which distributes a dividend for the Group, had a net profit of NOK million for the year in 2017 after the receipt of group contributions and share dividends from subsidiaries. The company will have sufficient distributable equity and liquidity for the distribution of the dividend at the adjusted time for the decision on dividends. EVENTS AFTER THE BALANCE SHEET DATE No events have occurred after the balance sheet date that affects the accounts that have been presented. GOING CONCERN ASSUMPTION In accordance with the requirements in the Norwegian accounting legislation, the Board of Directors confirms that the prerequisites have been met for preparation of the accounts under the assumption that the Company will continue as a going concern and that the annual accounts have been prepared under this assumption. OUTLOOK The growth in the global economy is continuing. In Norway the mainland economy is approaching normal levels after a period of poor developments. In Sweden activity levels remain high, even though the strong growth is showing signs of levelling off in certain markets. The rest of Europe continues with a marginal positive growth rate. In the USA the economy is still improving, although the growth rate is somewhat lower than previously. Moelven has only occasional deliveries to the United States, but the group nevertheless sees a positive effect from an improved global market balance. Growth in China is declining, while there are indications of higher activity in the rest of Asia. The Middle East and North Africa are still characterized by unrest and regulations from public authorities that complicate international trade. However, the underlying demand is good in the latter markets. Positive and stable developments in the international market for industrial wood are expected. The currency situation continues to contribute to maintain competitive ability in export markets, particularly for the Group's Swedish businesses where trading is in EUR or USD. Prices in GBP have increased, and thus compensate some of the margin shortfall as a result of the depreciation of the pound following the Brexit referendum. In Norway demand for processed products is expected to remain on a par with 2017, albeit with regional 18
19 differences. Building activity in and around the major cities, with the exception of south-west Norway, is expected to remain high. In Sweden the need for new homes remains high and activity in the new building market is strong, but growth is showing signs of levelling off. Activity in the renovation, conversion and extension market remains good. No major changes are expected in the markets, and the Swedish market is expected to be at the same level as 2017 overall. Timber inventories and access to timber at the start 2018 are acceptable with regard to planned production. For glulam it is expected that the positive trend of choosing wood for load bearing structures will continue. In both Norway and Sweden demand is good for module-based buildings for housing purposes. Demands toward short construction times are increasing. This applies equally to homes, schools and care facilities. In Sweden the market for system interiors is strong in the areas around Stockholm, Gothenburg and Malmø. On the Norwegian side of the border the market in the Oslo region is strong. In the rest of the country the market for new commercial buildings is showing signs of improvement following a slow period. Good activity is expected to continue in Norway and Sweden in renovation, conversion and extension. The Group's composition, with divisions that experience different impacts from economic fluctuations and units that operate in different markets, provides the Group with a good starting point for further improvements. For 2018 the board expects activity levels and results comparable to Return on employed capital was 14.2 per cent in 2017, which is a marked improvement from 9.9 per cent in The group has a long-term goal of a return on capital employed of 13 per cent over an economic cycle. The programme for operational improvement and structuring of the Group in line with the long-term strategy plan therefore continues unabated and will contribute to continued improved profitability for the underlying operations. The Board is of the opinion that the Group has adequate solvency and access to liquidity over the long term to develop the Group in line with the strategy plan. Moelv, 14 March 2018 The Board of Moelven Industrier ASA Olav Fjell Ingvild Storås Trond Stangeby Chairman of the Board Deputy chair Elisabeth Krokeide Asbjørn Bjørnstad Martin Fauchald Lars Håkan Karlsson Morten Kristiansen CEO 19
20 Corporate governance Corporate governance at the Moelven Group is based on the current Norwegian recommendation for corporate governance of October The recommendation is available in its entirety at The list below gives references to where the points required by section 3-3b of the Norwegian Accounting Act may be found. Requirements in accordance with section 3-3b of the Norwegian Accounting Act 1: A statement of the recommendation and regulations on corporate governance that the company is comprised of or otherwise chooses to follow. 2: Information about where the recommendations and regulations mentioned in No. 1 are publicly available. 3: Reasons for any deviations from the recommendations and regulations mentioned in No. 1. 4: A description of the main elements in the company's, and for accountants who prepare consolidated accounts also the group's, systems for internal control and risk management connected to the accounts reporting process. 5: Clauses in the articles of association that wholly or partly extend or deviate from the provisions of chapter 5 of the Public Limited Company Act. 6: Composition of the board, Corporate Assembly, supervisory council and audit committee, any working groups for these bodies, as well as a description of the main elements of prevailing instructions and guidelines for the work of these bodies and any working groups. 7: Clauses that regulate the appointment and replacement of board members. Reference to Report on corporate governance at Moelven 1: Introduction to the report Point 1. Report on corporate governance Point 1 Report on corporate governance: There is one deviation from the recommendation. This is described in Points 9. Point 10 Risk management and internal control No such clauses exist. The articles of association are published on and are also included in the notice of the annual general meeting as an attachment. Point 8 Corporate Assembly and board, composition and impartiality. Point 9 The work of the board Point 8 Corporate Assembly and board, composition and impartiality. 8: Clauses and authorities that enable the board to decide that the company shall buy back or issue own shares or capital certificates. Point 3 Share capital and dividends 1. Report on corporate governance In accordance with the Public Limited Company Act it is the board of the company that is responsible for ensuring the proper organisation of the business and administration of the company. Moelven has a number of independent legal entities that are organised as limited companies in several countries. In accordance with company law in the respective companies, the boards of these companies have a corresponding responsibility for the individual entity as the board of directors has for the parent company and the group as a whole. The groups activities are based on Scandinavian values. The basic values sustainability, reliability and using the opportunities that arise have become over time a natural part of the company culture. They also form the basis for the company's guidelines on social responsibility, ethics, anticorruption, HSE, employment conditions etc. A complete summary of the guidelines adopted by the board is given in point Business activities In accordance with the company's articles of association, the company's purpose is fabrication and activities that are associated with this, trade and other financial activities, as well as participation in other companies by means of share subscription and other means. The board emphasises long-term, sustainable development and lays down in the group's strategic plan that the main focus in future shall be the improvement and further development of existing activities. The group has passed the critical size that is necessary to assert itself in competition. Quality shall be prioritised ahead of size and is an essential basis for both profitability and further growth. Both solidity and financing are satisfactory and give the necessary room for manoeuvre. The company's activities, objectives and main strategies are described in detail in the board's annual report. 20
21 3. Share capital and dividends At the end of 2017, equity in the parent company Moelven Industrier ASA was NOK million (NOK million). For the group as a whole, equity was NOK 2,092.5 million (NOK 1,813.4 million). The equity ratio was 41.5 per cent (38.0 per cent). The board's objective is a minimum of 40 per cent, a level that in the opinion of the board is appropriate in light of the economic fluctuations that have been seen in recent years. The board has adopted a dividend policy that is in line with the provisions of the shareholders' agreement between the company's six largest owners, who together represent 99.6 per cent of all shares. Given that considerations of the company's financial position and other sources of capital are satisfactorily safeguarded, the main rule of dividend policy is a cash dividend corresponding to 50 per cent of profit after tax, although a minimum of NOK 0.40 per share. The board is not authorised to perform capital increases or buy own shares. On 26 April 2016 the General Meeting decided to issue a dividend of NOK 0.48 per share, or NOK 62,179,816 in total. The dividend was paid out prime May Based on the annual net profit for 2017 and having considered the normal seasonal variations in the Group s working capital needs and equity ratio, the board proposes to issue a dividend of NOK 0.68 per share, or NOK 88,088,073 in total. The parent company, Moelven Industrier ASA, which will distribute the dividend on behalf of the Group, posted annual net profit of NOK million in 2017, including group contributions and dividends from subsidiaries. 4. Equal treatment of shareholders and transactions with related parties The share capital of Moelven Industrier ASA consists of 129,542,384 shares with a face value of NOK 5. The company owns 1,100 of its own shares. The company is not listed on the stock exchange. In total, the shares are distributed among approximately 900 shareholders. The six largest shareholders, Glommen Skog SA (29.1 per cent), Eidsiva Vekst AS (23.8 per cent), Felleskjøpet Agri SA (15.8 per cent), Viken Skog SA (11.9 per cent), Mjøsen Skog SA (11.8 per cent) and AT Skog SA (7.3 per cent) together control 99.6 per cent. Most of the remaining 0.4 per cent is owned by private individuals. A number of shareholders' agreements have been entered into between the six largest shareholders. Among other things, these determine that the company must be run as an independent unit with a long-term perspective and with continued focus on Scandinavia as the main market. The agreements also contain clauses regarding the composition of the board, dividend policy, strategic focus areas and share transfer. Transactions with the owners are performed in some areas of the ordinary activities. Among other things, this relates to purchase of timber, where the Norwegian forest owner cooperatives are suppliers. Of Moelven's total purchasing requirement of approximately 4.2 million m³ measured under bark, approximately 40 per cent comes from the Norwegian forest owner cooperatives that are also shareholders. The Moelven group also supplies biofuel to a bioenergy plant owned by Eidsiva Energi AS. Eidsiva Energi Marked AS trades electric power to Moelven's Norwegian industrial operations. All these transactions are performed in areas where there are observable market prices and the arm's length principle is applied. Where other suppliers can offer better prices or terms, these will be chosen. Moelven's supply of energy raw materials to Eidsiva's bioenergy plant represents between 60 and 70 GWh on an annual basis, while buying back energy represents between 20 and 30 GWh. Net delivery of energy raw materials is around 40 GWh. The extent of the sale of electrical power corresponds to about 40 per cent of Moelven's total consumption of 230 GWh. Moelven has a long tradition of running its operations in accordance with the laws and ethical guidelines of the industry with the opinion that competition is positive for all parties in industry. In order to ensure that this culture is maintained, ethical guidelines and guidelines for complying with legislation on competition have been devised. 5. Free marketability The articles of association do not place any form of limitation on trading in the company's shares. The shares may be freely traded to the extent that individual shareholders have not made undertakings to other shareholders. The shareholder's agreements contain clauses regarding first option and tag-along rights. Since the company is not listed and the six largest shareholders together own 99.6 per cent of the shares, there is little trading in shares. 6. Annual General Meeting The notice of the general meeting, the content of the notification and accessibility of documentation follow the requirements set by the Public Limited Company Act and the regulations on general meetings. Facilitation is made for the general meeting to be able to vote for every single candidate to be elected by the shareholders to the Corporate Assembly. The employees of the group hold their own election of employee representatives on the Corporate Assembly. The chairman of the board, the chairman of the Corporate Assembly and the auditor attend the general meeting. Traditionally, the chairman of the Corporate Assembly has been elected to chair the general meeting. The procedures for attending and voting by proxy are described in the notification. Since 99.6 per cent of the shares are controlled by the six largest shareholders, there has not be a need to prepare guidelines to ensure an independent chair of the annual general meeting or to appoint a person who can vote for the shareholders as a proxy. 7. Nominating committee and compensation committee The annual general meeting annually elects a nominating committee consisting of up to five representatives of the shareholders and adopts guidelines for the nominating committee's work. The 21
22 annual general meeting has adopted guidelines for the nomination committee that regulate the committee's composition and period of service. The members of the nominating committee must be independent of the company's board and senior executives. The nominating committee keeps the corporate assembly informed of its work on a regular basis. It is thereby considered that sufficient facilitation is in place to allow shareholders to propose candidates to the nominating committee. The nominating committee submits the following proposals: - Proposal to the annual general meeting regarding the election of shareholder-elected members and deputy members to the Corporate Assembly and remuneration to the members and deputy members of the Corporate Assembly. - Proposal to the Corporate Assembly regarding the election of the chairman and deputy of the Corporate Assembly. to the Corporate Assembly regarding the election of the chairman and deputy of the Board of Directors. - Proposal to the Corporate Assembly regarding election of shareholder-elected members and deputy members to the Board of Directors. The proposals must include information about the candidates' expertise, capacity and impartiality. The guidelines for the nominating committee specify that the governing bodies must be composed based on an overall assessment of the company's need for expertise, capacity and balanced decisions that safeguard the interests of shareholders. The remuneration committee consists of the nominating committee, complemented by a representative designated by the employee-elected members of the Corporate Assembly. The remuneration committee submits a proposal to the annual general meeting on determining remuneration for the members of the Corporate Assembly and to the Corporate Assembly on determining remuneration for the Board of Directors. Remuneration to the Board and Corporate Assembly shall not be performance-based. 8. Corporate Assembly and board, composition and impartiality. The Corporate Assembly has 12 members, four of whom are elected among and by the employees. The company's six largest shareholders, who together control 99.6 per cent of the shares, are all represented in the Corporate Assembly. The members of the board of Moelven Industrier ASA are elected by the Corporate Assembly, normally for 1 year at a time. Three Corporate Assembly meetings are held annually. The board has seven members, five of them shareholderelected and two representatives of the employees. The employees also elect one deputy representative, who attends board meetings. The chair and deputy chair of the board are independent of the company's main shareholders and are appointed by the Corporate Assembly. One of the other three shareholder-elected board members is connected with the company's main shareholders. The shareholder's agreements include provisions relating to the election of the chair and shareholder-elected board members. The representatives of the employees are independent of the company's general management. No senior executives are members of the board. Two of the five shareholder-elected board members are women. The proportion of female employees in the group is 11.0 per cent (11.0). The rules on gender representation do not therefore apply to the employees' representatives. The composition of the board thereby satisfies the requirements regarding gender representation on the board. Apart from the employees' representatives on the board, only one board member receives remuneration other than directors' fees from the company. This amounts to NOK 50,000 and relates to winding up an appointment in France. Contact information for the board members is published on the company's website. Through the guidelines for the work of the nominating committee, which are described under point 7, the main shareholders are assured good knowledge of the board members' background and general competence. With the existing ownership structure, therefore, no further information is given. From experience, non-attendance at board meetings is exceptional. 9. The work of the board The board's administration of the company follows the provisions of the Public Limited Company Act. Instructions have been determined for the board of Moelven Industrier ASA that give guidelines for the board's work. Every meeting reviews the monthly reporting of operational developments, financial data and HSE statistics for the group. There is also the following schedule of work for every calendar year: January: Report for fourth quarter of preceding year. Review and evaluation of group guidelines and policies, including risk management and internal control. March: Annual accounts with notes and annual report for preceding year. April: Report for first quarter and preparation for ordinary general meeting. June: Status reporting and strategic discussions. August: Report for first six months. Recapitulation of strategic discussions with summary of ongoing strategic discussions throughout the year. October: Report for third quarter and strategy plan as finished document. December: Business plan and budget for the coming year. 22
23 The chair of the board is independent of the company's main shareholders. The board has not addressed issues of a material nature in which the chair is or has been a party. According to the rules of procedure, the board members must not participate in the consideration or decision of issues that are of particular importance to themselves or to any related parties that must be considered to have major personal or financial interest in the matter. The same applies to the CEO. By related parties it is also understood companies in which the board member represents ownership interests. Self-evaluation of the work of the board is normally performed at the beginning of every year. The board uses committees as needed. Based on an assessment of risk conditions and the need for control, as well as ownership structure, it has been decided to deviate from the NUES recommendation and allow the complete board function as an audit committee. The board only determines remuneration for the President and CEO. Remuneration for the remainder of management is determined by the President and CEO in line with guidelines adopted by the board. There are no option programmes or share-based payments for senior executives. The task of the board in respect of compensation is therefore limited and no separate compensation committee has been set up in the board. In addition to board members, the CEO, CFO and board secretary normally also attend normal board meetings. Other representatives of the administration, the divisions or auditor attend as needed. The board has determined instructions for the work of the CEO. Group management consists of the CEO and the managing director of each division. Group management and the directors of the group's shared services attend group management meetings. For more information about governing bodies and group management, refer to the notes to the annual accounts. 10. Risk management and internal control All units within the group have individual, local profit responsibility and operate as independent parts of a coordinated network that is characterised by openness and cooperation. Risk management and internal control are tailored for the organisational model. The local company management and the boards of the individual companies follow up on risk management and internal control in accordance with prevailing laws and regulations. There are also control functions at divisional and group level, as well as in individual companies where the nature of the business leads to increased risk of faults, non-compliance or irregularities. Because of the scope of activities, it has been decided to limit reporting to the board to a focus on group, divisions and competitive arenas, as well as selected key figures and non-compliance reporting by unit. In connection with annual strategy and budget activities, the board reviews the group's most important risk areas. If needed, and based on the annual risk assessment, the group's reporting and control routines are adapted so that identified risks can be satisfactorily covered. In addition to established internal rules and routines, the internal control is largely based on the internal control environment. This environment includes people at all levels of the company. It covers integrity, ethical values, competence, management philosophy, form of operation, organisational structure, distribution of responsibility and authority and personnel policy. The board and management place great emphasis on communicating the established basic position to risk management out in the organisation. All units close their accounts monthly and report to the parent company on the third working day of the following month. Reporting occurs in accordance with standardised systems and common guidelines so as to ensure consistency and the greatest possible comparability right across all units. An important control measure that follows naturally from the management and organisational model is the monthly benchmark and consolidated data report from the group to the reporting units. The same monthly report that is sent to the board is also sent back to company management in each individual company. In this way, many are involved in control and follow-up of management and governing data. The reporting cycle supports the feeling of responsibility, not just for the results of one's own unit, but also for the divisions and group as a whole. The board considers that this reporting and control environment gives satisfactory control of the business. The board has reviewed and approved the following general guidelines: Instructions to the board and general manager of Moelven Industrier ASA Moelven's financial policy Moelven's dividend policy Moelven's guidelines for compliance with competition law Moelven's insurance and risk strategy - general insurance Moelven's environmental policy Moelven's code of conduct The Board is also informed of the group's other guidelines, which combined with the guidelines adopted by the Board, comprise the basis for the Group's code of conduct: Moelven's brand platform HSE manual Staff regulations Policy for an open company culture Policy on alcohol and drugs Data discipline instructions Policy for social media Brand and communication strategy Guidelines for transfer pricing between companies Dealing with internal irregularities 11. Remuneration to the board Remuneration to the board is decided annually by the Corporate Assembly. The remuneration to board 23
24 members is a fixed amount that is determined in advance and is independent of profits. No option or share based remuneration is used and neither are there any other incentive schemes. For further information about directors' fees and any remuneration other than fees to board members, refer to the notes to the accounts. 12. Remuneration to senior executives The board determines the CEO's salary. There are no option or share based payments. Principles and ceilings have been determined for profits-related payment within the group. Among other things, it has been determined that agreements of profits-related remuneration shall have a duration of a maximum of one year at a time and that such remuneration shall have an upper ceiling. The board's declaration on management salaries, including guidelines for determining remuneration to senior executives, is presented to the annual general meeting as a separate document. The annual general meeting adopts each of the guidelines separately. For further information about remuneration to group management, refer to the notes to the annual accounts. 13. Information and communication The board determines the group's financial calendar annually; this is published in the annual report and on the company's website. The group's quarterly and annual reports are primarily published on the internet, but are also sent by post on request. The board has established a practice of organising annual owners' meetings so as to create an arena for the exchange of information and discussion between the owners. It has not been found necessary to establish guidelines for these. 14. Company takeover The company is not listed and there is a shareholders' agreement between the six largest shareholders, who together own 99.6 per cent of the shares, that regulates the transfer of shares, among other things. No guidelines have therefore been prepared for the board in connection with any takeover bid. 15. Auditor The auditor has annual meetings with the board without administration being present. The auditor also participates in board meetings when the annual accounts are discussed. The auditor also presents the audit plan, summaries following interim audits of the subsidiaries and central risk areas and the group's handling of these. Remuneration to the auditor, expressed as statutory audit and other services, appears in a separate note to the annual accounts. Moelv 14 March 2018 The Board of Directors of Moelven Industrier ASA Olav Fjell Ingvild Storås Elisabeth Krokeide Chairman of the Board Trond Stangeby Asbjørn Bjørnstad Martin Fauchald Deputy chair Lars Håkan Karlsson Morten Kristiansen CEO 24


25 The future is built from wood SustainaS ability Report
26 Sustainability the recurring theme from vision to strategy The natural choice for people building and living the Scandinavian way - Moelven s vision Moelven s operations are based on managing forestry resources and producing sustainable products and renewable energy. Moelven s basis is that all development, construction and operations must be sustainable, and that stringent requirements apply towards health, safety and the environment for all of our employees and those who are affected by our operations. Moelven s vision, mission, values and human resource ideal are the foundation for all of our employees and the strategic choices that are taken. Sustainability permeates this from the top down. Sustainability is one of our values, and a new Group strategy established in 2017 further emphasizes that sustainability must permeate all strategic efforts. Our vision The natural choice for people building and living the Scandinavian way Our mission Supplying quality rooms Our values Sustainable, reliable, uses opportunities Our human resources ideal Moelven provides opportunities for people with the drive to succeed A growing global market which comes with constantly more stringent environmental requirements, gives Moelven s wood-based products excellent prospects for future growth. Moelven s main activities are based on managing forestry resources and producing sustainable products and renewable energy. Moelven has a presence in the entire value chain through harvesting, processing, energy production, product development, infrastructure development and construction and housing projects. The Group therefore has the possibility to ensure that the supplied products are manufactured in a sustainable manner throughout the value chain. Sustainability throughout the value chain The forest grows using energy from the sun The sawmill transforms the raw materials to products Bioenergy is produced from the residual materials The consumer gets sustainable products and renewable energy 26

27 Moelven s values SUSTAINABLE RELIABLE EXPLOITING OPPORTUNITIES Moelven has respect for people and the environment. We base our activities on renewable resources and have turned sustainability and the longterm view into our competitive advantage. There is a strong desire to take responsibility for our environment. Moelven can be trusted. We deliver at the agreed time and with the right quality. There is a strong focus on openness and honesty being able to admit to weaknesses and mistakes is the basis for progress and trust. Moelven seeks solutions. The Group has the abilities and resources to be a leader in product development and creativity. We have always been a company at the forefront, exploiting opportunities that changing times afford. 27

28 Mission Give people quality spaces Since 1899 Moelven has successively produced cartwheels, barracks, ship cranes, agricultural appliances, homes, modules and a number of different input factors for both new buildings and renovation. Looking back, we see a wide range of products and services, but a recurring feature is the use of wood in combination with engineering expertise, innovation and sustainability. But what do we see when we look ahead? What will we produce next year in 5 years or in 10 years? There are some products we are fairly certain that we will be producing in 10 years too. Just as surely, there are some products that will be gone, and new products will arrive. Products that we currently are unaware of, but which will be important to us. In many ways, this is Moelven: We develop products ourselves and are driven by customers and partners who see new needs and new challenges. This is why we don t know what we ll be producing a few years ahead in time. What we can say is this: We want to contribute to build good spaces indoors and outdoors. Good spaces come into being through cooperation between customers, architects designers and not least end users. We shall supply quality products that contribute to creating these spaces. Our market is primarily Scandinavia it is here we source our raw materials and here we meet our customers. Moelven is not only wood but wood is a key component in our production, in the same way that it is a key component in Scandinavian tradition and Scandinavian building traditions. And regardless of what we produce in 2017 or 2027; we will contribute to creating good spaces. 28


29 Moelven and the UN s sustainable development goals The UN s sustainable development goals are a global plan to eradicate poverty, combat inequality and stop climate change by Sustainable development is about taking care of the needs of people living today without harming future generations opportunities to meet theirs. The sustainable development goals reflect the three dimensions in sustainable development: climate and environment, economy and social conditions. Moelven wishes to contribute to a sustainable world, and therefore uses the UN s sustainable development goals as a starting point. Moelven has identified the four main sustainable development goals that are impacted both positively and potentially negatively by the Group s activities. These sustainable development goals help orient work on sustainability in Moelven, while also placing it in a global context. Climate action Take urgent action to combat climate change and its impacts Moelven can contribute to stopping climate change by reducing its climate impact and contribute to renewable bioenergy production. Moelven s wood products also store carbon, and can also contribute to increase absorption of carbon from the atmosphere by forests. Life on land Sustainably manage forests, combat desertification, halt and reverse land degradation, halt biodiversity loss. As a customer of the forestry industry, Moelven is responsible for to promoting sustainable forestry. Moelven achieves this through communication with the forest owners, as well as certification schemes such as PEFC and FSC. Good health and wellbeing Ensure healthy lives and promote well-being for all at all ages. Moelven has responsibility to contribute to a safe and secure workplace for its employees, suppliers and customers. Consumers are also affected by Moelven s products, and Moelven therefore focuses on creating good spaces by using non-harmful chemicals, among other things. Decent work and economic growth Promote inclusive and sustainable economic growth, employment and decent work for all. Moelven contributes to create economic growth and workplaces by way of its operations. Through tax, salary payments and purchases from suppliers, Moelven contributes in particular to local value creation. 29

30 Our focus areas for sustainability Focus on long term value creation For Moelven sustainability is not only about making the right choices for the outside world, but also making choices that contribute to create long-term value for the company. Sustainability is thus a natural part of the company strategy, through vision, values and policies. The timber is as old as we are The company A/S Moelven Brug was established in 1899, and has been involved in long-term value creation for almost 120 years. Depending on species, growth conditions and site quality, a forest is ready for harvest after approximately years. This means that some of the timber Moelven currently uses as a raw material is as old as the company itself. This is a good example of why longterm value creation is a natural part of Moelven. We need to think of value creation holistically Raw material from the forest is Moelven s primary resource, but sustainability means far more than this to Moelven. It also concerns the climate, the people, the local communities, nature and the local environment. Sustainability is thus about creating long-term value through proper management of resources. Moelven s four main focus areas and basic premise for sustainability. 30

31 Goal of continuous improvement Moelven takes responsibility for the environment through sustainable and long-term exploitation of renewable resources. Our goal is continuous environmental improvement in our projects, products and services. We actively seek opportunities to reduce negative environmental impacts in a life cycle perspective. Moelven shall conduct its business in compliance with applicable statutes, regulations and rules. Moelven works towards a sustainable development of society and to constantly improve the business s impact on the internal and external environment. Four focus areas, one basic premise In 2017 analyses have been conducted to identify focus areas and long-term ambitions for sustainability that ensure that we meet our stakeholders expectations, are prepared for future requirements and demand, and that may contribute to increased market shares and reduced costs. Moelven s strategy for sustainability is based on 4 key focus areas and a basic premise (also see illustration): We have climate-smart products and solutions We safeguard natural resources We focus on people We create local values Ethical business practices are the foundation of our corporate strategy; we are a reliable partner. Systematic prioritization The analysis that forms the basis for choice of focus areas and important topics related to the focus areas, has been conducted in accordance with the Global Reporting Initiative s guidelines. It includes an assessment of environmental and social impact through the value chain, stakeholder expectations now and in the future, and market-related changes. The key focus areas have been chosen on the basis of what is important for long-term value creation in Moelven, and how the company affects and is affected by its stakeholders. This also constitutes the basis where Moelven has the greatest positive and negative impact on the outside world, while also emphasizing those areas where Moelven has the greatest possible impact. 31


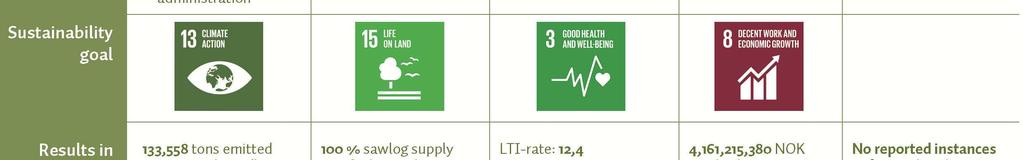
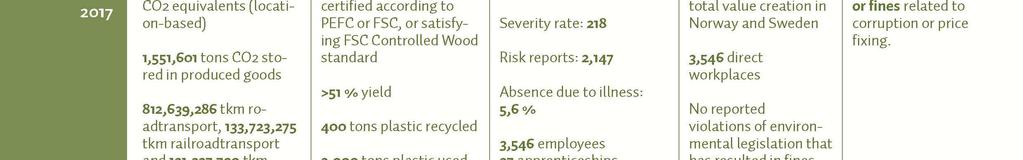
32 Summary: Focus areas, ambitions,, results and goals 32
33 We listen to our stakeholders Moelven s strategy for sustainability, and the analysis of importance, is defined on the basis of an assessment of the stakeholders opinions. The following groups are defined as Moelven s stakeholders: Summary of stakeholder dialogue and expectations Stakeholder group What do they care about How do we communicate with them Customers The employees of the future and today Authorities Local community Owners Suppliers (incl. forest owners) Special interest organizations Capital markets Price and quality Certification Sustainable forestry Climate Waste Working conditions Vision Corporate social responsibility Environment Personal development Innovation Cooperation Climate Forestry Reporting Environment Jobs Local value creation Transparency Long-term strategy Resource optimization Climate and environment Sustainable financial operations Resource optimization Sustainable forestry Resource optimization Biofuel Certification Biodiversity Long-term strategy Risk and opportunities Transparency Sales and marketing Digital media Customer surveys Meetings and conversations Quarterly and annual reporting Meetings and conversations Digital media Trade fairs Advertising Meetings and conversations Cluster collaborations Quarterly and annual reporting Marketing Digital media Meetings and conversations Quarterly and annual reporting Meetings and conversations Quarterly and annual reporting Meetings and conversations Cluster collaborations Digital media Meetings and conversations Conferences Cluster collaboration Digital media Meetings and conversations Quarterly and annual reporting 33

34 Climate-smart products and solutions 34

35 We have climate smart products and solutions Moelven affects the climate through many of the company s operations. The forest absorbs CO 2 from the atmosphere through the photosynthesis process, and stores this as carbon in the tree. The timber log is processed into high-quality products and materials that last a long time, while the residual products such as bark and chips can be used to produce bioenergy. At a sawmill more than half of the log is turned into sawn timber. Sawn timber is then processed into other products, and can in many cases replace competing materials with a greater climate impact than wood. At the same time, storage of carbon in wood products contributes to extending the storage capacity of the carbon cycle. Production and longterm use of wood products can thus have a positive climate impact. The other half of the log ends up as chips and bark. This is used in industrial processes such as raw material for bioenergy or for paper and cardboard production. Bioenergy produced using biomass from forests is defined as renewable, as it is part of the natural carbon cycle. Moelven produces bioenergy that we ourselves use in production, or sell to external customers. Moelven also sells a large proportion of biomass, which is used for energy production, for example in district heating plants. Moelven also has a negative impact in the climate through the use of energy based on fossil fuels. Sawmills and production consume electricity and fuel to power their operations. Moelven also contributes to greenhouse gas emissions at suppliers through its purchases. It is particularly transport that has a negative climate impact. Forests absorb CO 2 from the CO 2 CO 2 CO [CO 2 2 ] Timber from the forest stores CO 2 as carbon in the product Renewable bioenergy emits CO 2 from chips and bark Production consumes renewable energy and electricity Wood products store CO 2, and keep it outside of the cycle Norway s first energy-plus house The kindergarten "Kistefossdammen" at Heggedal in Asker is Norway's first official energy-plus house. Moelven has delivered the facade in untreated Malm100. Malm 100 is very maintenancefriendly, and untreated it quickly gets a light gray or silver gray patina. In order to be regarded as a energy-plus house, the building must produce 2 kwh per m² per year. This is achieved through 320 m² solar panels, three wells for geothermal energy and use of climate-friendly building materials. Expected consumption versus expected production suggests an overproduction of energy of 7,600 kwh a year. (Source and photo: Byggeindustrien) 35
36 Climate account results For the first time, in 2017 Moelven is reporting its climate accounts in accordance with the GHG protocol. This is the most widely recognized method for greenhouse gas reporting that provides a transparent and clear result. In 2016 Moelven reported in accordance with ISO14064, where other system limits, emission factors and conversion values were used. The results for 2016 and 2017 are thus not directly comparable, and the 2016 figures are therefore not presented (tons CO 2 equivalents) Scope 1 (Emissions in Moelven) 10,741 Fuel oil 532 Diesel 8,829 Petrol 18 Moelven-owned transport of products (to customer) 1,246 Moelven-owned transport of products (from supplier) 69 Direct bio-based emissions (beyond scope) 409,859 Bark 282,600 Sawdust 21,254 Chopping chips 79,556 Cutting chips 21,106 Cellulose chips 4,003 Pellets 739 Biodiesel 331 Scope 2 (Emissions related to electricity consumption) Location-based calculation 14,079 Market-based calculation 80,899 Scope 3 (Emissions outside of Moelven) 108,737 Transport of products to customers performed by third parties 63,208 Third party transport of products (from supplier) 44,639 Air travel 296 Work-related car transport 595 Total emissions (scope 1, scope 2 location-based, scope 3) 133,558 Total emissions (scope 1, scope 2 market-based, scope 3) 200,377 The climate accounts are based on emissions of CO 2, as no emissions of other greenhouse gases have been identified or quantified, such as CH 4, N 2O, HFC, PFC, SF 6 or NF 3. As 2017 is the first year of reporting in accordance with the GHG protocol, 2017 has been set as the base year for future comparisons. Emission factors are largely taken from Defra (Department for Environment, Food & Rural Affairs). Emission factors for electricity are based on NVE s factors in Norway, while Energimarknadsinspektionen and Reddis et al s factors have been used for Sweden. For calculations of bio-based emission, EN has been used, based on values from Tretekniskinstitutt and Erik Eid Hohle (Bioenergi). For system delimitation, the principle for ownership and where Moelven is the invoice recipient for the activity forms the basis. 36

37 The wooden Mjøsa bridge a good climate choice 23,500 tons of CO 2 saved 25 years of CO 2 neutral operation The Norwegian Public Roads Administration has conducted a research project where they have assessed the impacts of building a new Mjøsa bridge from wood, concrete or steel. The report concludes that: It is technically, financially, aesthetically and architecturally fully justifiable to build the new Mjøsa bridge from wood It has also been estimated that by building the Mjøsa bridge from wood, one may spare the environment of emissions of approx. 23,500 tons of CO 2, compared to the options. This means that with today s traffic, cars may cross the Mjøsa bridge CO 2 -neutrally for 25 years if the bridge is built from wood rather than concrete (assumed emissions of CO g/km per car). A new wood Mjøsa bridge is thus a good example of Moelven s climate-smart products, which exploit all of the good characteristics of wood in interaction with other materials. Source: The Norwegian Public Roads Administration 37
38 Energy use in own production IMPORTANCE: MOST IMPORTANT Where and why is it important? Moelven has significant energy consumption in production, which at the same time is one of the greatest drivers of greenhouse gas emissions. It is therefore a key component in the Group s ability to supply climate-smart products and services. Energy consumption in own production is important both to Moelven and stakeholders as it represents an environmental challenge while also constituting a major expense. Moelven produces a large proportion of its own energy consumption through the incineration of biomass. Policy and approach Moelven s environmental policy states that the company must reduce energy consumption at its plants. This will be done by actively participating in technology and market developments in the bioenergy sector, and by investigating alternative energy use at those plants that use fossil fuel for heating. To achieve this, Moelven has therefore set a target of covering at least 95 % of requirements toward heating premises and drying from self-produced bioenergy in the timber industry. Moelven also actively works with innovation, and an example of this is the Moelven Valåsen AB sawmill in Karlskoga in Sweden. Here a major innovation project is being implemented where digital technology has been applied to increase efficiency and reduce the sawmill s energy consumption. Among other things, a detailed energy survey has been carried out. More details on the energy survey and Valåsen are available on the next page. Evaluation of results Approximately two thirds of the Moelven Group s overall energy consumption is self-produced from the incineration of biomass, but there is also significant consumption of electricity. The bioenergy is used mainly for the heating of premises and drying of wood, and represents approximately 80 % on average of the combined energy consumption at a sawmill. Electricity is used to operate production lines, debarking, operating saws and lighting. Smaller amounts of fossil fuel are also used, mainly for vehicles, but also at certain locations and in certain operating circumstances such as heating. Category Volume (GWh) Total fossil energy consumption (fuel) 44 Total bioenergy production (lower calorific value) 622 Total electricity consumption 231 Total sales of bioenergy 66 Purchase of district heating 1,249 Ambitions: Moelven shall be climate-positive Moelven shall reduce energy consumption 95 per cent of the requirements for heating premises and drying from selfproduced bioenergy in the timber industry. Results: 44 GWh fossil energy consumption 622 GWh bioenergy production 231 GWh electricity consumption 78 % of the energy survey in Sweden is completed Measures: Reduce electricity consumption by 8% by 2020 Establish indicators to measure energy consumption for the heating of premises and drying in the timber industry Extend existing targets 38

39 Total energy consumption Energy survey at Moelven 1,159 Moelven is in the process of conducting a comprehensive energy survey of operations in Sweden. The project is being conducted pursuant to the act relating to energy surveys in major enterprises, and is staggered across a four year period. As at March 2018 two steps have been completed, and 78 per cent of operations in Sweden are covered. The results from the survey so far form an important part of the basis for the measures that will be implemented to reach the target of reducing electricity consumption by 8 per cent by In addition to the energy survey, a project is being carried out at Moelven Valåsen AB in Karlskoga in Sweden to assess, identify and test new technologies in the development of The digital sawmill. As early as two years ago, Moelven Valåsen installed an X-ray machine that takes pictures of each individual log before sawing. A number of sensors have also been installed to both increase the recovery factor for timber and provide increased traceability. A survey of energy consumption at the factory has been carried out since 2016, where one has taken a closer look at which type of energy that is used in different parts of operations. The division included buildings and processes, production and storage facilities, such as offices and workshop premises.. Since 2016 around 400 sensors have been installed, which continuously register energy data for heat, electricity and renewable fuel. With these data, the operation can maintain an overview of energy levels at all times. This provides a good basis for improvement and rationalization work. In the project at Valåsen Moelven has actively focused on ensuring that infrastructure, systems, data and patterns that are developed and deployed are documented, centralized and owned by Moelven, such that these may be developed by ourselves and not least deployed at other units in Moelven Industrier. Along with experience from the energy survey, this is decisive to reach the target of an 8% reduction of electricity consumption by The results from the survey show that energy consumption at the sawmill is distributed among heat (80%), electricity (18%) and fossil fuel (2%). Of the energy related to heating, it is the drying process that uses the majority of the energy with 98%. The remainder is used for heating premises, heat for ventilation and hot water. It is the actual sawing process the uses the most electrical energy, with a share of 37% of the overall electricity consumption. 39
40 Transport of goods IMPORTANCE: MOST IMPORTANT Where and why is it important? The timber industry is a transport-intensive industry where large volumes of materials must be transported across great distances. This applies both to transport from suppliers to Moelven, internally at Moelven and from Moelven to the markets. Transport is a considerable challenge for the Group, in terms of both the environment and economy. Both raw material procurement, intermediate transport and delivery of finished products is a major cost driver that affects the company s strategy and decisions. It can also be a burden for several stakeholders, as transport can have a negative impact on the climate and local community. Policy and approach Moelven is a co-owner and member of several transport cooperatives that carry out a large proportion of transport in Moelven. These transport cooperatives enable Moelven to have a strong impact with the transporters and allows us to set requirements. Examples of this are Transportfelleskapet Østlandet AS (TFØ) Transportselskapet Nord AS (TSN) and Woodtrans AS. These transport cooperatives also enable rationalization through a reduction in empty loads by combining the transport of finished products and byproducts. Moelven also uses rail and sea transport to safeguard the supply of timber and market opportunities for wood chip and energy products in regions without local demand for pulp wood and wood chips. Rail in particular is used for the delivery of biomass in Norway and Sweden. Moelven s environmental policy sets targets and guidelines for transport at Moelven: Moelven shall minimize the negative effect on the environment (noise and dust from heavy transport by using environmentally classified trucks, minimum EURO-5 or EURO-6, and also by to the greatest possible degree using transporters who strive for an environmentally friendly driving pattern. The environmental impact of transport shall be minimized through coordination and optimization of the product flow. These targets and guidelines have been implemented in the partnership agreements with providers of truck transport services in both Norway and Sweden. Moelven also actively works with the framework conditions for transport. An example of this is the initiative Godspakke Innlandet, where Moelven has joined forces with other industry partners to quantify the costs and benefits of different initiatives from the authorities. Improved road standards, and thus the opportunity for increased axle load limits, are measures on the part of the authorities that will help to reduce the environmental impacts of road transport. Work is also being done to open a greater road network in Norway for the use of metre heavy goods vehicles with a total weight of 60 tons for finished products and by-products. In Sweden the permitted total weight for heavy goods vehicles has been increased from 60 to 64 tons in general, and in 2017 the Swedish parliament adopted a resolution to allow a total weight of 74 tons on roads that can sustain such loads from 1 July. In Norway trial schemes have started for permitting heavy goods vehicles with a corresponding total weight for timber transport. These changed framework conditions contribute to reduce the number of transport loads and thus to a positive environmental effect. 40
 Sea transport (tkm) 408,897,874 129,770,775 121,337,790 275,738,298 3,952,500-76,078,321 - - 812,639,286 133,723,275 121,337,790 Ambitions: Environmental impacts from transport must be")
41 Evaluation of results Transport of products to customer (where Moelven is the invoice recipient) Transport of timber to Moelven Transport of other goods to Moelven Total Road transport (tkm) Rail (tkm) Sea transport (tkm) 408,897, ,770, ,337, ,738,298 3,952,500-76,078, ,639, ,723, ,337,790 Ambitions: Environmental impacts from transport must be minimised Use of Euro 5 and Euro 6 trucks only Results: KPIs for transport are established at the company and division levels. Measures: Assess the use of Euro 5 and Euro 6 trucks Improve reporting of transport, including the transport of products to customers Moelven Virke AS, which is responsible for the raw material supply and fibre trade for the mechanised wood operations in Norway, uses rail transport extensively. The transport concerns both raw materials to Moelven s industry, and pulpwood and fibre products to customers. Depending on the contract with the customer, Moelven Virke is in some cases responsible for transport, while in other cases the customer is responsible for transport. The latter transport is beyond Moelven s climate accounts, but is included below to illustrate the extent. Total annual train transport linked to timber supply and fibre trade comprise 2,738,311,125 tkm in 515 train departures. Transporting all or parts of this volume by road would not be sustainable either in terms of environmental impact or economy. In addition there are the positive environmental effects of the products being transported. Substantial volumes of bioenergy raw materials are supplied, which has a positive climate impact in that bioenergy replaces oil heating. One of Moelven s customers, Stockholm Xergy (formerly Fortum Värme), has calculated that the heat production from the company s bioenergy plant outside Stockholm alone can contribute to reduce CO 2 emissions by 650,000 tons annually by phasing out fossil power. 41

42 Besides being a very important topic with regard to environmental impact and costs, the transport of goods is the single area that leads to most activity within the industry areas. This entails a significant risk of accidents and harm to personnel and equipment. Moelven therefore has clear safety procedures to ensure safety: High visibility clothing, protective goggles, helmets and protective footwear are mandatory. (Applies to occupation on industrial areas in general.) The driver is given the loading or unloading location from the office or forklift driver. Any passengers must not leave the vehicle. Before unloading, the load must always be checked for any displacement before straps are loosened, and if necessary loads must be secured using a forklift before straps are released. Handling of straps must only take place when forklift is stationary or at a safe distance. Forklifts always have right of way in the area. The driver must stay within sight of the forklift operator to achieve eye contact. It is strictly forbidden to occupy spaces next to or underneath loads during loading/unloading. Loads must be secured in accordance with regulations before leaving the loading area. 42

43 Godspakke Innlandet a partnership for better framework conditions Godspakke Innlandet is a part of input to the National Transport plan and a part of the Norwegian Railway Directorate s drive within combination transport, industrial cargo, forestry and international goods flows. Among other things, the package proposes electrification of the section Kongsvinger Elverum Hamar, new connecting tracks in Kongsvinger, Elverum and Hamar, and new multi-purpose terminals. Efficient transport systems are a precondition for exploiting forest resources, and in order for Norwegian businesses to be competitive in European markets. Godspakke Innlandet is a comprehensive package of measures for the rail network in the interior to strengthen freight transport by rail. The initiative will make the railway far more competitive for north-south transport from Nordland, Trøndelag, Nord-Vestlandet and the region towards Sweden and the continent, and correspondingly in the opposite direction. Among other things, the package will reduce transport times for trains between Kvam in Gudbrandsdalen and Karlstad by 24 hours, reduce the forestry and wood industries transport costs by NOK 57 million a year, and give industry in Nordland improved competitive ability through the opportunity for faster deliveries. Godspakken Innlandet will contribute to reduce greenhouse gas emissions through transporting timber by rail instead of road, replacing diesel locomotives with electric locomotives, and reduce CO 2 emissions on longer distances by using trains instead of trucks by 70%. 43

44 Climate benefits from the forest Importance: IMPORTANT Where and why is it important? A large proportion of Moelven s climate smart products use timber as a raw material. The forest is a part of the natural carbon cycle, and stores large amounts of CO 2 from the atmosphere through photosynthesis. By contributing to efficient and sustainable forestry, in addition to efficient utilization of the timber, Moelven can contribute to increase the forest s ability to absorb CO 2 from the atmosphere and store it in products. The climate impact is thus positive. Policy and approach Moelven Skog AB is responsible for purchasing timber in Sweden and is one of the companies that has the greatest opportunity to impact the climate benefits Moelven has in the forest. They work in accordance with the vision Mer TIMMER i skogen. The vision concerns how the forest owners can maximize the potential of the forest. It gives Moelven more and better raw materials, while also providing forest owners with good returns. Through communication, seminars and one-on-one meetings with the forest owners, Moelven contributes to advise and guide forest owners to increase yields in the forest. Moelven Skog AB thus works directly with the forest owners to increase the climate benefits in the forest. In Norway it is Moelven Virke AS, who is responsible for the purchasing of timber. Due to a different form of organization among forest owners in Norway, Moelven Virke AS is not directly involved in harvesting or managing forests in the same manner as Moelven Skog AB. As a corporation, Moelven nevertheless has a responsibility towards its suppliers to treat and process the products in a sustainable manner. In Moelven s environmental policy it is stated that through energy recovery (incineration) after end of use, wood products must return at least 3 times as much energy than is consumed throughout the life cycle. Raw materials from sustainable forestry Sustainable and long-term forestry are keywords for Moelven Skog AB. The company is responsible for the supply of raw materials to the Group s timber consuming units in Sweden, and buys timber from more than 10,000 forest owners in Värmland, Västra Götaland and Örebro län. Moelven Skog AB continuously works to develop and improve work methods and procedures with an aim of ensuring that harvesting takes place at the right place in the right season, and of minimizing the environmental impact of heavy logging equipment. Among other things, this happens through the proprietary training programme P3 (planning, production and precision). Within the programme own personnel are trained in addition to those contractors who regularly use it. However, every year incidents occur that cause alarm among the general public, for example logging close to waterways or damage to forest roads. This often leads to mention in newspapers, on the Internet, radio or TV. In some cases criticism is justified, but more often than not the reason is a Photo: Johan Alp lack of insight into modern forestry. In those cases media coverage does not necessarily provide sober and fair picture of the actual circumstances. In the case of larger logging operations Moelven Skog AB therefore greatly emphasizes training personnel and providing information to the general public on how logging will be carried out. The company also continuously works on certification of forest owners in order for them to be active and aware of rules, for example related to planting of new forest after logging. The goal is to operate long-term and sustainable forestry and that the general public should have an understanding of the framework conditions for forestry. 44

45 Evaluation of results Large amounts of CO 2 from the atmosphere are stored in Moelven s products as carbon. Through sustainable forestry and long use of the products, Moelven will contribute to increase the carbon cycle s absorption of CO 2, which may reduce the CO 2 concentration in the atmosphere when compared to leaving the forest untouched. It is important to be aware that there are several uncertainties that affect the overall picture, for example greenhouse gas emissions from the soil after deforestation. By comparing Moelven s climate accounts with the overall amount of CO 2 stored in the products, it becomes clear that the amount of CO 2 stored in the products in 2017 is several times greater that Moelven s greenhouse gas emissions. This may indicate that Moelven, and the materials we produce, are climate positive. In order to conclude, it is necessary to have a better understanding of and insight into forestry operations after deforestation. Moelven s sales of pulp wood to bioenergy industry and direct sales of district heating based on biomass can replace fossil energy sources and thus reduce society s climate impact. Description Volume (m³) CO 2 stored (tons) Total purchased volume 4,915,000 3,518,730 Produced sawn timber 2,160,000 1,551,601 Chips for renewable energy 325,700 NA production (incl. smelters) Overall CO 2 emissions (locationbased) Overall CO 2 emissions (marketbased) Emissions (tons CO 2 ) 134, ,538 Calculation basis: Source for calculation of CO 2 is EN Source for density is Bramming et al. (2006). Physical and mechanical properties of Norwegian spruce and pine. An activity in the SSFF project. Treteknisk Rapport 65, It is assumed that a cubic metre saw timber of spruce has a basic density of 363 kg/m 3, and pine has a basic density of 418 kg/m 3. Basic density is dry weight of wet volume (>30% wood humidity). The carbon content is assumed at 50% of the dry weight. Equal proportions of spruce and pine are assumed. Spruce: 363*0.5*44/12= kg CO 2 / m 3 saw timber Pine: 418*0.5*44/12= kg CO 2 / m 3 saw timber Ambitions: We and the materials we produce shall be climate positive Results: 3.5 million tons of CO 2 stored in purchased timber 1.5 million tons CO 2 stored in sawn timber Measures: Develop a better understanding of Moelven s role in the carbon cycle and prove that Moelven is climate positive Waste management and recycling in Moelven Modus Moelven also has operations that are primarily based on other raw materials than wood. Moelven Modus undertakes around 2,000 office projects every year. The office solutions are designed to be possible to dismantle and reconfigure according to the user s needs. Moelven Modus greatly emphasizes reducing its impact on the environment and strives to have a circular mindset to minimize environmental impact, CO 2 footprint and waste. In partnership with GC Rieber Eiendom AS, Nordea Liv and Rasmussen Eiendom, Moelven Modus has established a recycling warehouse in Bergen. Calculations for a single project have shown that recycling could reduce CO 2 emission by eleven tons. Moelven Modus is active in several government-funded development projects in Sweden. Several recycling projects are also ongoing in partnership with customers in Norway and Sweden, including SE Banken in Oslo and Uppsala municipality in Sweden. 45


46 The forest in Norway captures approximately 70% of anthropogenic CO 2 emission in the country, according to Trefokus. How can it then be positive to chop down the forest to use the materials in wooden buildings and other wood products? Photosynthesis is an important reason for this. The tree consumes the most carbon dioxide (CO 2 ) when it s growing, and absorbs less CO 2 when fully grown. When the tree dies in the forest and rots, the carbon dioxide is returned into the environment. However, if the tree is felled, the tree remains a carbon repository. Why should we harvest forests? For each tree that is felled in Scandinavia, two new trees are planted, which when growing consume more CO 2 than grown trees. A spruce is fully grown and ready for harvesting after years, depending on how fast the forest grows. This means that active forestry contributes to capture more CO 2 than if the forest gradually dies by itself. According to Trefokus, increased forest production would make it fully possible to increase the amount of captured CO 2 from around 1.2 billion tons of CO 2 in 2013 to 1.5 billion tons in years. Which benefit does the forest have as a building material? Wood as a building material is renewable and environmentally friendly. Little energy is required to fell and process wood. Energy from renewable sources is largely used when timber is processed, rather than energy from oil. This results in low emissions in the production phase. Building with wood rather than other building materials reduces greenhouse gas emissions. 46
47 Climate smart design Importance: IMPORTANT Where and why is it important? Moelven produces climate smart products and materials, which have a lower climate impact then competing materials. The products may have a climate impact in both production and use, and it is therefore important to consider the product s entire life cycle. Certification is important in order to communicate this to the market and to give customers the opportunity to make sustainable product and material choices. As many of the certification schemes cover more than just the climate, this chapter will also cover other environmental impacts Buildings and the construction industry represent approximately 40% of the world s energy consumption and 33% of the world s greenhouse gas emissions. Moelven therefore plays an important role in producing and developing climate smart products and services. Customers and consumers are to an increasing extent concerned about the environmental impact. Particularly the climate impact of different products and services is of great significance, which makes this topic difficult Policy and approach Certification allows customers and consumers to make informed choices and compare different products and materials. Moelven s products therefore have a number of different certifications that cover the customers various requirements and needs. The raw material certification schemes PEFC and FSC are key certifications that guarantee that the wood material comes from sustainable forestry. See more about PEFC and FSC certification in the Sustainable Materials chapter. Moelven is also subject to several regulatory requirements for certification. In particular, there are three different EU directives that apply for Moelven s products, Construction Products Regulations (CPR), Registration, Evaluation, Authorisation and Restriction of Chemicals (REACH) and Biocidal Products Regulations (BPR). These regulatory requirements are integrated in Moelven s procedures, and all products that Moelven produces must comply with the requirements that follow from these directives. In Norway, BREEAM-NOR is the Norwegian adaptation of BREEAM, the biggest driver in the choice of climate-friendly products. This is the industry's own environmental certification tool for buildings. The purpose is to motivate sustainable design and construction throughout the entire construction project, from early phase to finished building. BREEAM-NOR is an effective tool for coordinating the various players in a construction project and integrating sustainable thinking at all stages. BREEAM-NOR sets the requirements for material selection, such as the delivery of certified products in PEFC-CoC / FSC-CoC, EPD (Environmental Declaration), Eco Product, Emission Testing on Interior Products (Hea2 with M1 Certificate or Agbb). Beyond certifications and regulatory requirements, Moelven also works with the marketing of its products and materials, and is a key player in promoting wood as a climate smart product and building material. Here Moelven has a responsibility and an opportunity to influence the consumer to make climate smart choices by choosing Moelven s products. Among other things, Moelven has interior designers actively working on this issue. Evaluation of results A large proportion of Moelven s products and materials are certified under various certification schemes. The next page includes a summary of relevant environmental certifications and tools that are relevant for Moelven s products and materials. Ambitions: Moelven s products and materials should be climate positive Results: More than 64% of Moelven Wood AB s products have an environmental assessment or a product certification Measures: Survey environmental assessments and product certifications in the Group 47
48 Environmental certifications and tools There are a number of different players who have separate certification and documentation schemes related to environment and health. These tools and certification schemes can either cover a product alone, or an entire building or a project. A large proportion of Moelven s products and materials are covered by one or more tools and certification schemes, which give customers and users the opportunity to make informed choices based on sustainability criteria. Environmental Product Declaration (EPD): An EPD is a brief third party-verified and registered document with transparent and comparable information about products environmental performance throughout the life cycle. Both the underlying LCA (Life-Cycle Assessment) and EPD are always based on international standards Building Product Declaration (BPD) Byggvaredeklarasjon is a standardized way of describing a product. Information concerning the material s origin, chemical content, environmental impact, certifications and a description of the product s installation, use and how to handle it after use. BREEAM-NOR BREEAM-NOR is an environmental certification system for buildings. The system is effective tool for coordinating the various actors in a construction project and integrating sustainable thinking in all aspects. See also the mention on the previous page. Byggvarubedömning (BVB) BVB is a Swedish association that has developed a system for assessing building materials based on sustainability. The assessments are based on the environmental impact throughout the life cycle and the chemical content in building materials. BVB is also working on establishing an assessment system for social conditions in the value chain. BASTA Bedömningar BASTA is a Swedish product certification scheme for chemical content in products. The EU requirements in the REACH directive are at the core of BASTA s product certification. SundaHus SundaHus Miljödata is a tool that assesses the environmental properties of different products in the construction industry. This tool provides Moelven s customers with the opportunity to compare different products based on a standardized assessment model. 48

49 Production of bioenergy Importance: MOST Where and why is it important? Bioenergy is energy that is produced from materials formed in continuous biological processes. Unlike fossil energy, bioenergy is considered to have climate neutral emissions as it is a part of the carbon cycle, and assumes net positive forest growth. Bioenergy can also replace fossil energy sources and therefore makes a positive contribution to the zero emission society. At Moelven the energy is utilized as heat, and is sold externally as district heating. Biomass is also sold to external customers, who use this to produce bioenergy either in the form of heat for own industry, district heating or electricity In order to ensure good financial operations, Moelven is dependent on exploiting the entire log, and bioenergy is thus an important resource to Policy and approach The energy potential of the Group's chip and bark products, including cellulose chips, is approximately 2,7 TWh (60% humidity), which means that it has a considerable potential, both for increasing our own energy production and also for increasing the market for bioenergy in general. In Moelven s environmental policy the following goals and guidelines are given: heating. Evaluation of results Moelven has conducted a survey of bioenergy consumption internally, and the sale of bioenergy and the sale of chips to external bioenergy industry. The results show that Moelven has a consumption of 388 GWh bioenergy in the shape of heat. As described in the chapter Energy us in own production, this is mainly used for drying. Moelven shall reduce energy consumption at its plants and obtain at least 95% of the need for heating of premises and drying from selfproduced bioenergy (wood industry). Moelven shall actively participate in technology and market developments in the bioenergy sector, and by investigating alternative energy use at those plants who use fossil fuel for Moelven also purchases significant amounts of bioenergy from external companies. This is because there often are different relationships between owners, operators and supplier of biomass for combustion boilers. Moelven Bioenergi AS and Langmoen Energisentral Langmoen Energisentral with a 10MW bioenergy plant opened in Moelven Bioenergi AS owns and operates this plant, which uses energy raw materials supplied by Moelven and Mjøsen Skog. The plant s largest customer is the TINE SA s plant in Brumunddal, which receives approximately 40 GWh of process steam per year. At TINE the investment has led to the phasing out of old, polluting oil furnaces and the transition to renewable bio-based energy. Moelven is thus contributing to TINE s goal of reducing greenhouse gas emissions by 30% by
 72 % Transportation of chips from Moelven Soknabruket AS by train.")

50 Description Energy GWh Chips to external bioenergy 349 industry (lower calorific value) Bioenergy produced in Moelven 622 (lower calorific value) Consumed bioenergy 388 (supplied energy) Bioenergy sold to companies outside the Group Calculated average efficiency in combustion boiler 66 (supplied energy) 72 % Transportation of chips from Moelven Soknabruket AS by train. Read more about the extent of railroadtransport in the chapter «Transport of goods» Ambitions: Moelven shall reduce energy its consumption Results: 349 GWh (lower calorific value) of energy raw material sold to the bioenergy industry. 622 GWh (lower calorific value) energy raw material used in own production Measures: Improve measurement and reporting of bioenergy consumption and production at the Group level 50

51 Safeguard natural resources 51

52 We safeguard natural resources Moelven seeks solutions. The Group has the abilities and resources to be a leader in product development and innovation. We have always been a company at the forefront, exploiting opportunities that changing times afford. - Exploiting opportunities is one of Moelven s basic values Moelven does not own any forest, but buys all its timber from external suppliers. Moelven has thus no right to decide how the forest is managed, but can influence forest owners by imposing requirements, for example through certifications. Moelven also has an important task in seeking solutions and using the opportunities in processing raw materials by having efficient operations and exploiting the full potential of the raw material, in order to ensure that the customer buys a sustainable product. * Only a selection of input factors are included 52
53 Sustainable materials Importance: MOST Where and why is it important? Moelven s environmental policy describes how Moelven shall use, as far as possible, natural choices that come from the forest. To ensure that these raw materials come from sustainable forestry, Moelven buys certified timber Moelven is a major purchaser of timber, and is thus responsible for contributing to sustainable forestry. Sustainable forestry is important to both Moelven and many of Moelven s stakeholders. It contributes to the forest being managed with consideration toward the basis for sustained use of the forest, including considerations to biological diversity in the forest and the conditions for engaging in outdoor activities. Policy and approach Moelven s environmental policy describes the following: Moelven must maintain and develop its systems for certified purchases, and maximise purchases and utilization of environmentally certified raw materials from certified forestry. Moelven must maximise the exploitation of raw materials through optimizing production and utilizing the residual products Moelven shall not buy raw materials from: - Illegal harvests - Forests with a high preservation value - Forests where time-honoured or social rights are violated - Forests with genetically manipulated trees. - Natural forests that have been harvested with the intention of using the area for plantations or non-forestry applications. All of the companies in the Group's timber processing operations are organized for and work to meet applicable requirements for PEFC (Programme for the Endorsement of Forest Certification), FSC (Forest Stewardship Council) and FSC Controlled Wood s traceability standard. The mass balance principle is applied to purchased timber and sold products to ensure traceability Sustainable forestry is certified Purchased timber is checked and registered Certified products that are traceable to the forest are sold The customer and consumer is ensured of the origin of the products Moelven transforms the timber to products as a certified link in the value chain 53

54 PEFC is an international NGO that works for responsible forestry, and issues certificates to players who meet the criteria they have defined. The organization promotes sustainable forestry through third-party certification. Moelven is a link in the value chain through processing the timber, and is thus responsible to ensure traceability, in order to label its products as PEFC certified. Like PEFC, FSC is also an international NGO that works for responsible forestry, and issues certificates to players who meet their requirements to sustainable forestry. The difference between these two certifications lies mainly in the story of how these were developed. FSC issues two different certifications, FSC certification and FSC Controlled Wood. The difference between these two is that FSC certification applies to the actual forestry operations, while FSC Controlled Wood is a certification that merely verifies that the forest the timber comes from is not an unacceptable source. In the certification Moelven operates as an intermediary in the value chain, and the company is thus responsible for securing traceability. As traceability at the unit level is not possible through the sawmill, Moelven practices the mass balance principle to ensure that all products that are sold are correctly certified. This means that Moelven cannot sell more products with certification than it buys. This is checked at the invoice level, where the reference to the certification in the sales invoice refers to certification in the purchasing invoice Evaluation of results 100% of all timber Moelven purchases are certified in accordance with either PEFC, FSC or FSC Controlled Wood. In Norway there is a requirement that all harvesting of forests must take place in accordance with PEFC s rules. In Sweden rules are different, and most of the timber is certified in accordance with either FSC or FSC Controlled Wood. The system Moelven currently has for purchasing timber is satisfactory in relation to ensuring that it comes from sustainable forestry. Moelven also purchases processed wood products that are a part of Moelven s product range. These products are purchased by several different players who operate in different countries. Moelven s aims to determine where these products originate and define how it can contribute to ensure that the products are from sustainable forestry. Ambitions: Moelven shall contribute to sustainable forestry, and not purchase raw materials from illegal harvesting Results: 100 % of the sawlog supply controlled in accordance with FSC Controlled Wood, and a high share of PEFC and FSC certifications. Measures: Assess certification in traded products 54


55 Moelven A natural partner in BREEAM projects BREEAM is Europe s leading environmental certification tool for buildings. The purpose of the tool is to motivate sustainable design and building throughout the construction project, from the beginning to finished building. The tool may be used for new building or rehabilitation projects in the industry, retail, office, education and residential building categories. For other types of buildings one can develop an adapted set of criteria. BREEAM is currently developed and tailored to fit in to markets in several countries. Through BREEAM-NOR, the Norwegian Green Building Council (NGBC) and the construction and property industry in Norway have adapted BREEAM for the Norwegian market. Here construction projects can achieve certification through an authorised BREEAM-NOR auditor based on environmental performance in nine categories management, health and indoor environment, energy, transport, water, materials, waste, land use and ecology and pollution. Five levels of BREEAM-NOR certificates are issued; Pass, Good, Very Good, Excellent and Outstanding. BREEAM has proven to be an effective tool to coordinate the various parties in a building project and integrate a sustainable mindset at all levels. International studies show that BREEAM buildings have a higher market value, lower operating costs and increased user satisfaction, among other benefits. Today Moelven has contributed to the process of developing more buildings with BREEAM certification, and Moelven actively works on adapting its products and materials in order to simplify the process for customers in the development of BREEAM projects. This is done through focusing on continuous improvement in the production process, but also through Moelven s climate smart design. An example of BREEAM certification is the outdoor kindergarten Haukåsen Barnehage (pictured), which has Very good certification. The building thus has a clear environmentally friendly profile, both with regard to materials, heating source, energy consumption and 55

56 Resource optimization Importance: MOST Where and why is it important? Moelven is a resource-intensive industrial company, with overall purchases of 4,915,000 m 3 sawn timber and pulpwood. There is thus a huge potential in resource rationalization and optimization through even small production changes. In order to secure economic operations, Moelven is therefore dependent on exploiting resources optimally and using all by-products. This is an important issue for Moelven, as it affects the operating margin. Policy and approach Moelven focuses on resource optimization throughout the value chain. This applies not only to raw materials, but also in transport and among employees. See more about this in the chapters Transport of goods and Involved and competent employees. At the sawmills all logs are analysed to perform an optimal extraction of material. This means that each individual log is analysed with regard to size, twisting and position of knots. The saw is then set based on this. Moelven Valåsen AB actively works with this issue and has installed an X-ray machine that analyses all logs prior to sawing. The technique used in the further process provides full traceability up to finished lumber. There are significant opportunities for improvement and development in advanced data analysis, which may improve selection on the basis of historical measurements and results. This is a part of the innovation project at Moelven Valåsen AB, in development of the digital sawmill. The LEAN principles also form the basis for operations at several of Moelven s locations that aim to reduce waste and increase efficiency. One of the focus areas is to visualize real time production data for the operators involved, so that they have the opportunity to improve the work processes directly. LEAN is also important with regard to safety at the plants. Experience shows that many workplace accidents happen outside of ordinary operations, and it has been proven that order and tidiness are important to reduce risk. More about this can be found in the Health, safety and the environment chapter. Evaluation of results Resource optimization through selection of logs is not only based on maximizing the recovery factor, but also for maximizing the product value. This is because the market value of certain selections can vary in relation to the volume of the selection. An important principle for Moelven is to exploit the whole log. Regardless of how the selection is made, Moelven therefore ensures that all by-products, including chips and bark, are used internally or sold. Ambitions: We shall exploit the whole log Results: Yield > 51% Measures: Survey LEAN projects in the Group 56
57 Resource-efficient efficient design and packaging Where and why is it important? Moelven not only impacts the environment through production, but also in the usage phase. In the usage phase two areas have been identified as particularly important; design and packaging. Importance: IMPORTANT Through resource-efficient design and industrial production, Moelven has the opportunity to reduce the need for processing materials at building sites. In industrial production there is greater control, and there is the opportunity to reduce waste and environmental impact through efficient production. Moelven also uses plastic extensively for packaging, which may have and environmental impact. Plastic takes a long time to break down in nature, and unnecessary packaging can potentially impact a customer s certification Policy and approach Moelven s environmental policy provides the following guideline: The exploitation of raw materials must be maximized through product optimization and utilizing the residual products. Moelven produces several types of products that are designed to provide and environmental benefit. Through resource-efficient design Moelven can produce more from less while also reducing production costs. Packaging is also another cost driver, which is of limited visible value to the customer. Moelven has therefore set a goal to survey plastic consumption across the company to identify opportunities to reduce the company s environmental impact, while also reducing costs. Evaluation of results A survey of Moelven s use of plastic was carried out in This survey shows that Moelven had a consumption of 2,000 tons of plastic in tons of plastic were delivered for recycling. These are significant volumes. Moelven will therefore conduct a more detailed survey in order to identify opportunities to reduce plastic consumption and replace this with more environmentally friendly options in the course of Through its industrial production of composite building materials, Moelven can reduce waste and increase efficiency at the building site. An example of this is Moelven Byggmodul, which makes readymade factory built modules with full sanitary, electrical and ventilation systems. Through efficient mass production with good planning, building modules will reduce time and waste at the building site, which results in good, resource efficient design. Ambitions: We have climate-smart products and materials The exploitation of raw materials must be maximized through product optimization and utilizing the residual products. Results: 2,000 tons of plastic consumed 407 tons of plastic recycled 9,000 building modules delivered Measures: Identify resource efficient products in the Group Moelven shall identify opportunities to reduce waste and the use of packaging 57
58 Waste management Importance: IMPORTANT Where and why is it important? As a production business, Moelven produces significant waste volumes. A large proportion of this is waste that is either recyclable or may be used for energy recovery. Waste management is an important matter to Moelven and its stakeholders. In addition to a negative environmental impact, the amount of waste is an indication of inefficient production that impacts the operating result and the price of the finished product. Policy and approach Moelven s environmental policy describes the following guidelines and targets for waste: Sort and recycle waste as far as technically possible and annually follow up waste volumes per ton of final product. Minimize the share of waste in approved landfills in accordance with results from registration and the action plan for the waste system. Ensure that any depositing of bark and other waste takes place at only approved disposal sites. Be able to document that any of the company s disposal sites comply with applicable statutes and regulations concerning covering, control programmes, handling of runoff, plans for termination and modification. The various units in the Moelven Group are themselves responsible for waste management. This is carried out in cooperation with local waste management businesses, who have different opportunities for handling waste. Several of Moelven s location apply LEAN production methods. These are based on continuous improvement and a reduction of wasting in the organization. Waste is a form of wasting that impacts the cost of production, and should therefore be reduced to a minimum. Evaluation of results In 2017 Moelven conducted a groupwide survey of waste for the first time. Waste statistics were retrieved from all waste handling companies and compiled. However, some uncertainty has been identified in the data presented as different methods are used by the different companies for compiling data. In 2017 Moelven had a total waste volume of 11,532 tons. This includes 1,894 tons of hazardous waste, mainly ash from incinerators and chemicals such as paint. The remainder consists of wood, plastic and mixed waste. The sorting ratio has been measured at 65%, but this figure is very uncertain as it has been calculated in arrears by the waste management companies. Different methods have also been used for calculating the sorting ratio by the different companies, and a weighted average has not been used for calculating the overall sorting ratio. The figure should therefore only be considered to be guiding. Several of Moelven s locations have a sorting ratio of more than 90%, which satisfies the most stringent BREEAM requirement. 58

 at the Bygge-galan building fair in Stockholm on 27 March.")
59 Waste management at Moelven Byggmodul AB At Moelven Byggmodul AB in Säffle one has strongly emphasized waste management when rebuilding assembly line 2. The goal has been to simplify sorting at the source in production. Several recycling stations have therefore been established that all offer good opportunities to sort waste directly. The stations are clearly indicated by signs both on and above each individual container, and the stations look the same regardless of where they are located in the business. This measure is one of several that led to the company being named Årets Leanbyggare (Lean builder of the year) at the Bygge-galan building fair in Stockholm on 27 March. The award is presented by Lean Forum Bygg and the Byggindustrin journal. Category Volume Total waste volume (tons) 11,532 Total hazardous waste volume (tons) 1,894 Total volume other waste (tons) 9,733 Mixed waste (tons) 3,957 Wood (tons) 4,266 Plastic (tons) 407 Other recyclable waste (tons) 1,582 Sorting ratio (%) 65% A sorting ratio of 65% is not consistent with Moelven s goal of sorting and recycling waste as far as technically possible. Because of this, throughout 2018 Moelven will actively cooperate with local waste handling companies to improve this statistic. The company will also establish an overarching goal of 90% sorting, which meets the most stringent BREEAM requirement. Moelven Modus is one of the Moelven companies which has a conscious attitude to waste and who has transformed this into a competitive advantage. It supplies modifiable office landscape solutions where the product they supply may be reused, as opposed to installation built in place. By applying principles from circular economy, Moelven Modus s products are designed for reuse. Moelven Modus therefore measures its remodelling projects based on both recycling and reuse. This gives the customer lower costs, and reduces environmental impact. Ambitions: Sorting and recycling waste as far as technically possible Results: 11,532 tons of waste 1,894 tons of hazardous waste 407 tons of plastic 65% sorting ratio. Measures: Continue surveying waste Establish a new ambition of a 90% sorting ratio 59

60 Focus on people 60


61 Focus on people Supplying quality rooms - Moelven s mission Moelven s mission is to focus on the customer and end-user of Moelven s products and services. The mission means that Moelven creates both indoor and outdoor spaces that are aesthetically pleasing, while also being functional and safe. It is not only the customers and end-users Moelven is accountable to. Moelven is also accountable to employees, suppliers, partners and the local community. of conduct and HSE work are key. Involved and competent employees are important for Moelven s strategy for long-term value creation. Moelven s products are largely based on renewable forests, but other products and chemicals are also used in the processing of the material. Added products and chemicals can potentially impact people, and this is covered in more detail in the chapter Health friendly chemical use. Employees, suppliers and customers are entitled to a safe and secure workplace. Here, Moelven s code Moelven supports Save the Children Moelven has extended its partnership with Save the Children and donated NOK 500,000 in 2017, as in 2016, to help children and young people with schooling and eduction in some of the world s poorest countries. 61
62 Health, safety and the environment Importance: MOST Where and why is it important? Health, safety and the environment (HSE) is a collective term for work with health protection, environmental protection, the working environment, safety and security for employees and users. This chapter mainly deals with those parts of HSE that concern people, while the environment is covered in the chapters We have climate-smart products and services, Healthfriendly chemical use and Local community. A safe working environment for employees, hired staff, customers and suppliers is essential for sustainable added value. It is of course one of the areas of greatest importance to both Moelven and its stakeholders. We shall be an attractive and safe workplace - Moelven s ambition Policy and approach The overarching responsibility for HSE is with the management of the individual subsidiary. HSE is therefore on the agenda in all board meetings and executive management meetings. Moelven also has a dedicated safety committee comprising executive management, the HR director and employee representatives. In addition, the divisions HSE resources and the HR department meet regularly during the year in the HSE forum. These forums process and discuss corporate HSE issues, exchange experience and develop proposals for new procedures and guidelines. The Group has developed a HSE manual that is tailored for each individual unit and accessible to all employees. The manual describes relevant procedures and guidelines for the HSE area. Moelven has a common system, fportal, for recording accidents, near accidents and hazardous conditions. This system ensures that the Group has a central overview of all reported incidents, and is an important aid for each individual company in the work to identify, implement and follow up relevant improvement measures to reach the long-term goal of 0 injuries. Work to reduce absence due to illness is mainly related to three primary areas: close follow-up of the employee, including focus on and follow up of residual capacity for work, measures to promote well-being and health, as well as emphasis on HSE when investing in new production equipment. Follow-up of employees is done by each individual company in accordance with applicable rules in the countries in which they operate. There is much emphasis on maintaining dialogue with employees on sick leave with a view to making the absence period as short as possible. Moelven has health insurance for all employees, and this works as a good HSE measure to get those employees who need health services and treatment back to work faster. Health insurance was established in 2007 and has seen good effect, particularly for employees with musculoskeletal ailments. Evaluation of results In order to reduce the number of accidents, Moelven has a strong focus on near accidents and hazardous conditions. Through high levels of reporting of near accidents and hazardous conditions, the company has the opportunity to identify HSE risks and implement risk-reducing measures before an eventual injury or incident occurs. In 2017 a total of 360 (329) accidents, 813 (488) near accidents and (920) hazardous 62

 was reduced by more than 20%. the Group s goal of 4.5%.")

63 conditions related to persons were recorded. It is positive that the number of reported near accidents and hazardous conditions has increased, as this gives the Group a better basis for implementing good improvement measures.the number of injuries with absence per million hours worked (LTI rate) saw a small reduction in The number of days of absence due to injury per million hours worked (injury rate) was reduced by more than 20%. the Group s goal of 4.5%. A high rate of absence due to illness is not compatible with Moelven's values. A reduction in and stabilisation of absence at a low level is thus a priority. For the Group as a whole both short and long term absence has remained stable at the same level as previous years, but with some variations between Norway and Sweden. In Norway long-term absence has dropped by 7.5%, while in Sweden it has increased by 10.2%. Short-term absence has been stable in Sweden, while in Norway it has increased by 10.8%. Absence due to illness Long-term absence 3,19 % 3,45 % Norway Short-term absence 2,76 % 2,50 % Total sickleave 5,95 % 5,95 % Long-term absence 2,26 % 2,06 % Sweden Short-term absence 2,72 % 2,66 % Total sickleave 4,98 % 4,72 % Long-term absence 2,67 % 2,71 % Total Short-term absence 2,88 % 2,89 % Total sickleave 5,55 % 5,60 % There are still too many who are injured when working at Moelven, and work to reduce the number of injuries continues unabated in The most frequent injuries are falls, twisting/spraining and crushing injuries. In 2017, overall absence due to illness remained stable, and was 5.55 per cent, which is higher than In 2017 a new e-learning programme was developed for HSE training. All employees must complete the course by the end of the first quarter of All new employees must complete the course shortly after employment. Moelven organizes annual Better working environment courses as a part of continuous work on HSE. The courses provide basic training in handling health, safety and environment issues, and cover the requirements toward HSE training for both executives, safety representatives and members of working environment committees. Besides employees with mandatory requirements for such training, the course is open to anyone who works with and/or wants to know more about HSE work. In employees completed the course. Number of employees Men 1,510 1,480 Norway Women Women % 9,1 % 8,9 % Total 1,662 1,625 Men 1,629 1,609 Sweden Women Women % 12,2 % 12,5 % Total 1,856 1,839 Men Other Women Women % 39,3 % 34,5 % Total Ambitions: LTI < 5 in 2020 Absence due to illness < 4 % i ,500 risk reports Results: LTI = 12.4 Absence due to illness = 5.6% 2,147 risk reports Measures: Increased use of resources HSE training Consequences of violations 63

64 Involved and competent employees Importance: MOST Where and why is it important? Moelven is a large employer with 3,546 employees, and it is important that the employees have a workplace where they are happy and have the opportunity to challenge themselves. This is of course important to the employees, but it is also important to Moelven, as there is a clear link between employee satisfaction and Moelven s results. Moelven is also dependent on attracting tomorrow s talent to ensure long term value creation in a sector that is undergoing continuous change through rationalization and the development of existing and new products and services. Involved and competent employees is therefore also an important factor that affects Moelven s attractiveness as an employer Provide opportunities to people with a drive to succeed - Moelven s human resources ideal Policy and approach The Group's human resources ideal is to provide opportunities to people with a drive to succeed. This ideal establishes guidelines for the Group's objectives in terms of which persons are recruited, what expertise is demanded, how new employees are introduced, and which development and career opportunities are offered. Moelven focuses on long-term employment relationships and strives to offer its employees the opportunity to develop in their jobs. Motivated and competent employees are encouraged to take their personal development further, including through internal management programmes at several management levels. Moelven will continue to focus on increased management expertise. Good managers are one of the most important factors for employees to enjoy work, and for the business to do well financially. This ideal establishes guidelines for the Group's objectives in terms of which persons are recruited, what expertise is demanded, how new employees are introduced, and which development and career opportunities are offered. The two young, newly graduated construction engineers Karoline Røste Omdahl and Dennis Afonso Pettersen are a part of the construction team at Moelven Limtre AS, and are proud to work at the company many consider to be world leaders in large load-bearing wood structures. You feel privileged to come straight from school and being given opportunities like this. Rumour has it in the university college community that expertise is top-notch at Moelven Limtre. Being new in the game and having the opportunity to work with people who know so much is not only great, it s also reassuring and instructive, Karoline says. 64

65 Moelven will continue to focus on increased management expertise. In 2017 Moelven participated in two regional trainee schemes; Trainee Innlandet in Norway and the Higher ambition programme in Sweden. The purpose of both programmes is to attract and retain competent employees with master s degree educations in the Interior region in Norway and Värmland in Sweden. In 2018 Moelven will start its own trainee programme to effectively attract, develop and retain graduates with bachelor-level degrees or technical vocational school educations. managers, and a continued strengthening of this role is important. Moelven has a dedicated management development programme for corporate executives, members of the companies executive teams and key employees in the Group. In employees took part in this programme. Good skilled worker expertise is essential for Moelven. In order to systematically recruit new employees, even more attention will be given to apprenticeships. At the same time there are efforts to improve the expertise of the existing workforce through several measures that are currently being planned. There is also focus on a good process to welcome new employees so that they have a good introduction both to their tasks and Moelven as an employer. Employee surveys are regularly conducted in all of Moelven s businesses. These surveys take the temperature of how the employees experience their work situation. The survey is an aid to develop a good and health-promoting work environment, and to create a good feedback and improvement culture. In short, the survey says something about employee satisfaction. Evaluation of results In 2017 Moelven had 27 apprentice contracts in Norway. The apprentice is a good scheme that provides value to both the employees and Moelven. The apprentices have the opportunity to train for a profession by working at the company, while Moelven has access to competent labour that develops successively throughout the period. No apprentices were hired in other countries than Norway in 2017, as this scheme is not established in the same way in Sweden. In 2017 Moelven recruited a total of 4 trainee candidates; 3 in Norway and 1 in Sweden. All candidates have a master s degree and participate in regional trainee programmes. In the course of employees took part in development programmes for supervisors. Supervisors play a very important role as first line Ambitions: Involved and competent employees Results: Trainee scheme established in Norway 27 apprentices Measures: Start up of trainee scheme in Sweden 65

66 Health-friendly chemical use Importance: IMPORTANT Where and why is it important? Moelven uses chemical and products in its production to increase the life of the products and materials, and to create good spaces. Some of these products may have a potential impact on health and the environment, but correct use should not pose any risks. This is an important topic for Moelven, as these products may entail a risk during production in the event of improper handling. It is also a topic many customers and consumers are concerned with, and it is therefore important to Moelven to be transparent in the use of these chemicals to establish peace of mind and confidence with the customer. Policy and approach The following is stated in Moelven s environmental policy and code of conduct: Moelven must minimize the effect on ground and water by using environmentally friendly chemical, oils and adhesives to the greatest possible extent. Moelven must only handle of chemicals, oils and adhesives at designated places with approved enclosure or similar installations to reduce the impact of eventual spills. Moelven is also subject to several regulatory requirements related to chemical use. In particular, there are three different EU directives that apply for Moelven s products, Construction Products Regulations (CPR), Registration, Evaluation, Authorisation and Restriction of Chemicals (REACH) and Biocidal Products Regulations (BPR). These regulatory requirements are integrated in Moelven s procedures, and all products that Moelven produces must comply with the requirements that follow from these directives. Evaluation of results In 2017 Moelven conducted the first groupwide survey of selected chemicals and treatment products that are used in the wood industry. These chemicals and treatment products were chosen based on consumption, potential health impacts and stakeholder dialogue. Moelven Limtre has for more than 20 years developed, produced and assembled large, load-bearing glulam structures. Glulam for bridges is largely produced using impregnated pine. In some cases the bridges are additionally impregnated with creosote after all processing is completed. This is done at the customer s request, and is carried out by subcontractors. Creosote is a distillation product of coaltar, and glulam impregnated with creosote will therefore smell of tar. The treatment provides excellent durability and satisfies the Norwegian Public Road Administration s requirement that bridges must have a 100-year lifespan with a minimum of maintenance. Creosote can be harmful to health. The risk is mainly present during the actual application of the substance, as the risk increases by exposure through skin contact in combination with sunlight. Moelven therefore recommends that everyone who works with and near creosote uses sunscreen to reduce health risk. There are also other health and environmental risks linked to creosote, but at the volumes and with the applications the substance has in connection with glulam bridges, these risks are negligible. 66
67 Name Description Consumption Impregnation fluid Paint, primer and stain Fire impregnation Adhesive Osmo Area of application: Provides resistance to moisture, rot and fungus attacks and increases the product s lifetime. Potential health impacts: Moelven s impregnation fluid does not contain heavy metals and consists of biodegradable antifungicides. No negative health impacts have been identified through proper use of the chemical or product. Area of application: Paint, primer and stain are both aesthetically pleasing and provide resistance to moisture, rot and fungus attacks and increase the product s lifetime. Potential health impacts: Moelven can paint, prime and stain products more efficiently and in a safer environment compared to treatment after installations. It is therefore considered that industrial application of pain, primer and stain reduces health impacts compared to treatment in place. Area of application: Moelven s unique Fireguard impregnation provides resistance and passive protection against fire. Used for both internal and external products. Potential health impacts: The product has been documented to be an environmentally friendly impregnation agent and meets the requirements of EUs Building Product directive, and waste is handled as ordinary timber. The Fireguard liquid does not contain bromine compounds or boric acid, which is on the priority list under Reach. No hazardous chemicals are emitted during use or in the event of fire. Area of application: Adhesives are used as a binding agent in many products, for example glulam. Moelven uses mainly MUF (melamineurea-formaldehyde) and some PRF (phenol-resorcinolformaldehyde) in glulam. All glulam is labeled in accordance with which type of adhesive that has been used. Potential health impacts: Moelven largely uses adhesives produced from oil that does not originate from fossil sources, and thus has a low environmental impact. Proper use of glulam has no health impacts for the user. Area of application: Osmo is a wood treatment product based on natural oil and waxes. The oil penetrates the wood and protects it from within. The wax creates and elastic, microporous surface that protects the wood from external impacts, and the wood thus preserves its natural appearance and is protected. Potential health impacts: There are no known potential health impacts from using Osmo. It consists of sunflower, soya, lentil and thistle oil, and is approved for use in contact with foodstuffs. 1,040,860 (litres) 2,357,627 (litres) 147,580 (litres) 6,801,258 (litres) 81,319 (litres) Ambitions: Moelven must as far as possible use healthfriendly and environmentally friendly Results: The main categories of chemicals have been surveyed Measures: Continue survey of chemical use and explore alternatives 67
68 We create quality rooms Importance: IMPORTANT Where and why is it important? Quality rooms permeate all activities in Moelven, from care for the employees working environment and encounters with customers and suppliers to the finished product: A building to live in or for commercial activity. Supplying quality rooms - Moelven s mission Policy and approach Moelven shall supply solutions that are characterized by quality, efficiency and contemporary design. We shall also supply products and services that cover the purposes and needs of customers and end-users. These can be spaces for pleasure, playing, work or contemplation. These may be public spaces or private rooms, outdoors or indoors. Good spaces should also apply to actions and choices that concern suppliers and subcontractors. Moelven enables good collaboration with suppliers by acting in an honest and professional manner. At the same time there are requirements that partners also operate in a sustainable and ethically justifiable manner. The people who work at Moelven are also subject to these requirements. Moelven creates good spaces for employees by providing well organized working conditions, contemporary and good premises, a clear code of conduct and procedures for health, safety and the environment. By creating quality rooms for the employees, a good foundation is established to create value for customers and end-users. Moelven provides quality rooms for customers by being aware of what the customer seeks, focusing on how materials are extracted and the product is developed, and an approach to ensuring that customer experience a good buying process with Moelven. Moelven achieves this through a clearly established company strategy and brand strategy. Evaluation of results Whether Moelven manages to provide good spaces to its employees, customers and suppliers is reflected in the financial log-term results, customer surveys and employee surveys. The financial results and description of future prospects are presented in the annual accounts and the report of the Board of Directors, while involvement and expertise are described in the chapter Involved and competent employees. The different units at Moelven conduct customer surveys, but this is not centrally coordinated through the Group, and different methods are used. In the course of 2018 Moelven will therefore assess the customer survey results with an aim of reporting on this collectively in Ambitions: Moelven shall contribute to create quality rooms Results: Quality Rooms are established as a part of the company s marketing communication Measures: Survey customer satisfaction across the company Document that the Group complies with the mission through sustainability work. 68
69 Safeguards local values 69
70 Economic value creating in the local community Where and why is it important? Importance: MOST Moelven operates in numerous small communities in Norway and Sweden where we often are a key employer and contributor in the local economy. How we choose to operate will have direct impacts on the local communities, and we are also dependent on having good relationships with our local communities to attract the right people and work with our surroundings. It is important that we have a conscious attitude to recruitment, financial contributions and local purchases and contracts. This aspect is particularly important where we are a major contributor in the local community. Policy and approach Moelven consists of 37 production companies across 46 production locations in Norway and Sweden. Most of the production companies have in common that they are located in geographically rural areas in close proximity to the forest and historical ports for timber. This means that the companies are often large in a local context, and that they become a significant contributor to local businesses. Both directly and indirectly. Several of Moelven s companies are important cornerstone businesses in their areas. Moelven s businesses create ripple effects for subcontractors and the rest of the economy in the shape of turnover and added value. Moelven pays company tax and an employer s contribution, and the employees pay income tax. Together this makes up the companies and group s contribution to society. Evaluation of results If one uses the Federation of Norwegian Enterprises calculation for social contribution one can find the companies direct contribution of taxes and duties. The calculation shows that in 2017 Moelven s Norwegian businesses contributed NOK 1,931,538,000 in overall added value*. The tax and duty accounts for the Norwegian companies amounted to NOK 376,658,000, after deduction of public grants. This corresponds to the cost of 3,570 pupils in Norwegian elementary school, 9,416 days of hospital stays or 3,964 metres of two-lane road. The tax and duty accounts for the Swedish companies amounted to 476,548,000, and the indirect local economic added value in the Swedish economy comes in addition to the Norwegian added value. There are also several other ripple effects around a business, not least in the local community, that this estimate does not show. Among other things, we focus on local buying whenever possible, and on creating local job opportunities. Country Norway Sweden Others* Total Revenue 8,370,190 9,019, ,307 17,540,545 Corporate tax 24,637 42, ,695 Total paid AGA 124, ,505 9, ,836 Tax paid on wages 230, , ,622 Public grants 2,921 2, ,473 Number of employees 1,662 1, ,546 70

71 The calculations in the figure to the right have been performed using the Federation of Norwegian Enterprises social contribution calculator. The calculation has been carried out by compiling Moelven s overall turnover, product inputs, tax on ordinary income, paid employer s contribution, overall paid income tax from employee salaries, and deducted government grants. The figures have been collected from Moelven s Norwegian and Swedish companies, and is in the Swedish companies converted to NOK (as at ) Because the two countries have different tax and duty systems, and access to different markets, there is some uncertainty regarding the figures. The calculation shows only the direct taxes and duties the Group contributes. The model does not include the secondary and tertiary effects (ripple effects) that Moelven contributes. For Moelven the multiplicator effect is significant as the group s individual companies, particularly in the Timber and Wood division, mainly belong to smaller communities in rural areas. Several of Moelven s companies are important cornerstone companies that make a significant contribution to jobs and business in these areas. Here the significance of the ripple effect is reinforced, as it is difficult to redistribute the added value locally. Ambitions: Create more local jobs Results: Estimated tax and fee contributions of NOK 861,322,472 in Measures: Further develop assessments of economic value creation in local communities 71
72 Local communities Importance: MOST Where and why is it important? Moelven has more than 20 incinerator plants that produce energy for production and sale from biomass. This is defined as renewable energy, but nevertheless affects the local environment through emission of particulate matter, NOx and CO. Moelven also impacts the local environment through transport and water consumption. Water is used to sprinkle timber to prevent it from drying out and becoming damaged during storage. Policy and approach Moelven also affects the local environment through several activities, such as energy production in incinerator plants, transport, waste handling and water consumption. Moelven s environmental policy describes the following: Moelven s responsibility includes past influence from activities on the ground, water, air and/or surroundings from watering (runoff), heating, transport to and from the plants, the depositing of bark, handling of oils, adhesives, handling of chemicals for impregnation storage, use, waste), as well as activities producing noise and dust. Moelven must reduce emissions of substances such as NOx, SOx and CO to air from boilers at the plant in accordance with the results from registration and plans of action for the relevant plant. Moelven must implement measures to adapt noise levels and dust formation at plants in accordance with the targets at the respective plants. Evaluation of results Moelven has 24 of its own bioenergy plants that produce energy used in our own production, and sells surplus energy to external customers. The incineration plants vary in size from 1 MW to 15 MW, with an average of 5 MW installed capacity. These plants are subject to national emission permits, and exhaust gases are regularly checked in accordance with local registration and action plans. The table below shows an average of the measured concentrations of significant emissions from the incineration plants that may affect the local environment. Emissions Average concentration (PPM) NOx 136 PM / Dust 99 CO 1,327 Moelven has had no violations of the pollution act or similar legislation in 2017 that have led to fines Ambitions: Reduce emission of NOx, SOx and CO Results: No violations of the pollution act or similar legislation in 2017 that have led to fines Measures: Extend assessments of local environmental impacts. 72


73 A reliable partner 73
74 We are a reliable partner Importance: MOST IMPORTANT Where and why is it important? Moelven shall, as described in our values, be a company one can trust. Moelven being a reliable partner is therefore established as a basic assumption for the sustainability strategy and must form the basis of all activities. Moelven is conscious of its attitude to anti-corruption. This applies both in dealings with suppliers and customers at the corporate level, and in the individual business. Moelven considers anti-corruption work to be an important part of efforts to achieve long-term sustainable development. Anti-corruption work minimizes the risk of getting into situations that have a negative effect on reputation or finances. Reliable Moelven can be trusted. We deliver at the agreed time and with the right quality. There is a strong focus on openness and honesty - being able to admit to weaknesses and mistakes is the basis for progress and trust. - Reliability is one of Moelven s basic values Policy and approach a Anti-corruption and ethics are key components of Moelven s corporate strategy. A good and reliable reputation is decisive for our business activities and must ensure credibility towards our customers, suppliers and other stakeholders, and contributes to us being perceived as an attractive employer. Moelven dissociates itself from all forms of corruption and improper actions that impede free competition and market balance. In the Group s business activities there must always be a sound, ethical and moral attitude towards employees, customers, suppliers and other business partners, which entails that employees must neither accept nor offer bribes or other benefits for business or personal gain. In the work on underpinning a comprehensive approach to anti-corruption in Moelven, a code of conduct and a description of procedures that must be followed in the event of undesired incidents have been developed at the corporate level, which must be complied with. The code of conduct and Moelven s attitude towards competition law have been communicated to company executives, the sales and marketing organization and financial managers in physical meetings, and has also been communicated to other employees. Within the activities of the Moelven group, there shall not be any differential treatment on account of gender, ethnic origin, language, sexual orientation, religion or philosophy. Job descriptions, areas of responsibility, expertise and work effort form the basis for determining pay, promotion and recruitment. It is only expertise that matters. Further, 74


75 Moelven shall adapt conditions for people with reduced functional abilities. Nor does Moelven accept conditions at suppliers' or customers' operations that constitute breaches of the UN declaration of human rights or other unethical conditions such as child labour. From 2016 the code of conduct was included as a part of the employment contract for new employees. This ensures that new employees familiarize themselves with the code of conduct from the first day. As a supplement to the work on establishing a common platform for ethics among the employees, some companies in the group have also established their own guidelines with local adjustments. Moelven Modus has for example developed its own e-learning programme with accompanying tests. Moelven has also established guidelines and procedures for whistleblowing. Moelven wants to make clear to all employees that the Group wants a corporate culture based on transparency. It must be acceptable to raise concerns and blameworthy conditions, and they shall be discussed and resolved. The guidelines also provide for anonymity, and it is described. Evaluation of results In 2017 there were no reported instances of corruption or price fixing in the Moelven Group. These are of course satisfactory results, but continuous focus on the topic is necessary, and current work must continue. One instance of sexual harassment recorded in the Group in The case was pursued locally in accordance with existing guidelines, and has been fully processed and clarified. In light of events in society at large, the board, before the aforementioned case became known, decided that the guidelines should be updated with particular emphasis on whistleblowing procedures and sexual harassment. Beyond this, no need has been registered to implement special measures to ensure compliance with the code of conduct Ambitions: No instances of corruption or price fixing Results: No reported instances of corruption or price fixing in 2017 Measures: Pursue existing work on anti-corruption an ethics 75
76 Moelven GRI Index 2017 Global Reporting Initiative (GRI) is a network based organization, and is behind the development of the world's most widely used sustainability reporting framework. The GRI framework contains principles, themes and indicators that can be used by organizations to measure and report economic, environmental and social performance. Moelven reports according to the framework GRI Standards: Core option. The table below presents Moelven's reporting in relation to the guidelines of GRI Standards. For more details about GRI, see GRI 102 Management Approach GRI Description Source Organisational profile Name of the reporting organization Annual report, Note 1 (p.88) Activities, brands, products and services Annual report, Directors Report (p. 9-10) Location of company headquarters Annual report, Note 1 (p.88) Countries where the organization operates Annual report, Directors Report (p. 9-10), Note 6.2 (p.106) Ownership structure and legal form Annual report, Directors Report (p. 9-10) Markets served Annual report, Directors Report (p. 9-10), Note 6.2 (p.106) Scale of the organization Annual report, Hovedtall (p.6) Information on the workforce Annual report, Directors Report (p. 9-10), Focus on people (p.60-65) Supply chain Safeguards natural resources (p.51-59) Significant changes in scale, structure, ownership or supply chain during the reporting period Annual report,directors Report (p. 9-10) Precautionary principle External initiatives "Moelven applies the precautionary principle", See also the group s Sustainability Report 2017 Annual report, Directors Report - Innovation (p. 16), Sustainability Report 2017: Moelven and UN s sustainability goals (p.29), A reliable partner (p.73-75) Strategi Membership of industry associations/advocacy organisations Annual report, Directors Report - Innovation (p. 16), Sustainability Report CEO s comments Annual report: Positive development for Moelven (p.4.-5) Ethics and integrity Core values, principles, standards and code of conduct Sustainability the recurring theme from vision to strategy (p.2), A reliable partner (p.73-75) Governance Governance Annual report: Corporate governance (p.20-24) Stakeholder engagement Stakeholders We listen to our stakeholders (p.33) Collective agreements Annual report: Note 3.25 (p.97) Definition and selection of stakeholders We listen to our stakeholders (p.33) Stakeholder dialogue We listen to our stakeholders (p.33) Key topics We listen to our stakeholders (p.33) Report profile Entities included in the consolidated accounts Annual report: Note 22 (p.116) Definition of report content av aspect boundaries Our focus areas for sustainability (p. 30) List of material aspects Summary: Focus areas, ambitions, results and goals (p.32) Correction of previously disclosed information N/A Change of reporting "2017 is the first year reported according to GRI Standards" Reporting period Date of most recent previous report Reporting cycle Calendar year 76
77 Contact point for questions regarding report Rune F. Andersen - rune-f.andersen@moelven.com Claims of reporting in accordance with the GRI Standards Moelven GRI Index GRI Index Moelven GRI Index Material aspects Description Source ref. Exception Reason Description of exception Climate smart products and solutions Energy consumption in production GRI 103 Management approach Description of aspect and boundaries p NA Description of methodology and results p NA Evaluation of methodology and results p NA GRI 302 Energy Energy consumption in own production p. 38, 50 NA Reduction of energy consumption NA Not reported GRI 305 Emissions Direkte GHG emisions (scope 1) p. 36 NA Indirect GHG emissions - energy (scope 2) p. 36 NA Other indirect GHG emissions (scope 3) p. 36 NA Reduction of GHG emissions NA Not reported Climate smart products and solutions Transportation of goods GRI 103 Management approach Description of aspect and boundaries p NA Description of methodology and results p NA Evaluation of methodology and results p NA Moelven indicator M1 Transport summary p. 41 NA GRI 305 Utslipp Direkte GHG emisions (scope 1) p. 36 NA Indirect GHG emissions - energy (scope 2) p. 36 NA Other indirect GHG emissions (scope 3) p. 36 NA Reduction of GHG emissions NA Not reported Climate smart products and solutions Climate benefits from the forest GRI 103 Management approach Description of aspect and boundaries p NA Description of methodology and results p NA Evaluation of methodology and results p NA Moelven indicator M2 CO 2 in purchased timber p. 45 NA Climate smart products and solutions Climate smart design and marketing GRI 103 Management approach Description of aspect and boundaries p NA Description of methodology and results p NA Evaluation of methodology and results p NA Moelven indicator Information not available Information not available Information not available Comparable figures for 2016 are not available. Comparable figures for 2016 are not available. Comparable figures for 2016 are not available. M3 Textindicator description of certification schemes p. 48 NA M4 Certification of finished goods p. 47 Data for Norway not reported Information not available Reporting routines will be implemented in Climate smart products and solutions Production of bioenergy GRI 103 Management approach Description of aspect and boundaries p NA Description of methodology and results p NA Evaluation of methodology and results p NA 77
78 GRI Energy Energy consumption p. 38, 50 NA Safeguards natural resources- Sustainable materials GRI 103 Management approach Description of aspect and boundaries p NA Description of methodology and results p NA Evaluation of methodology and results p NA Moelven indicator M5 PEFC and FSC certification p Details on certification Information not available Reporting routines will be implemented in Safeguards natural resources Resource optimization GRI 103 Management approach Description of aspect and boundaries p. 56 NA Description of methodology and results p. 56 NA Evaluation of methodology and results p. 56 NA GRI 301 Materialer Materialforbruk p. 52, 56 NA Moelven indicator M6 Yield p.56 NA Safeguards natural resources- Resource efficient design and packaging GRI 103 Management approach Description of aspect and boundaries p. 57 NA Description of methodology and results p. 57 NA Evaluation of methodology and results p. 57 NA Moelven indicatorer M7 Interior projects including reuse NA Not reported Safeguards natural resources Waste management GRI 103 Management approach Description of aspect and boundaries p NA Description of methodology and results p NA Evaluation of methodology and results p NA GRI 306 Avfall Waste statistics p. 59 Focus on people HES GRI 103 Management approach Description of aspect and boundaries p NA Description of methodology and results p NA Evaluation of methodology and results p NA GRI 403 HMS HES-statistics p Focus on people Involved and competent employees GRI 103 Management approach Description of aspect and boundaries p NA Description of methodology and results p NA Evaluation of methodology and results p NA Moelven indicator M8 Webrecruiter-statistikk p. 65 NA Waste management methodology not reported Occupational diseases and statisticsper gender not reported Information not available Information not available. Information not available Reporting routines will be implemented in Waste management methodology varies. Standard reporting routines will be implemented during Reporting routines will be implemented in
79 Focus on people Health-friendly use of chemicals GRI 103 Management approach Description of aspect and boundaries p NA Description of methodology and results p NA Evaluation of methodology and results p NA Moelven indicator M9 Consumption of chemicals p. 67 NA Focus on people Supplying quality rooms GRI 103 Management approach Description of aspect and boundaries p. 68 NA Description of methodology and results p. 68 NA Evaluation of methodology and results p. 68 NA Moelven indicator M10 Customer satisfaction NA Not reported Local values Economic value creating in the local community GRI 103 Management approach Description of aspect and boundaries p NA Description of methodology and results p NA Evaluation of methodology and results p NA Moelven indicator M11 Tax and fee contributions p. 70 NA M12 Economic value creating in the local community p. 71 NA Local values Local environment GRI 103 Management approach Description of aspect and boundaries p. 72 NA Description of methodology and results p. 72 NA Evaluation of methodology and results p. 72 NA GRI Environmental compliance Deviations from environmental legislation p. 72 NA Moelven indicator M13 Average concentration in emissions to air p. 72 NA A reliable partner Ethics and integrity GRI 103 Management approach Description of aspect and boundaries p NA Description of methodology and results p NA Evaluation of methodology and results p NA GRI 205 Anti-corruption Confirmed corruption incidents p. 75 NA Confirmed price fixing incidents p. 75 NA Information not available The information cannot be aggregated. An indicator for measuring customer satisfaction across units and divisions will be established. 79
80 Annual account for the Moelven Group Financial key figures REG REG REG REG REG Amounts in NOK million Explanations* RESULTS Operating revenues 10, , , , ,009.4 Gross operating profit (EBITDA) Depreciation and impairment Operating profit Net interest and financial items Profit before tax Net profit BALANCE SHEET Investments in production equipment A Total assets 5, , , , ,539.8 Equity 2, , , , ,518.2 Net interest-bearing liabilities , , , ,476.1 Capital employed B 2, , , , ,020.1 EARNINGS/RETURN Net operating margin C 3.9 % 2.9 % 2.2 % 2.3 % -0.6 % Gross operating margin D 6.6 % 5.8 % 5.7 % 5.6 % 2.8 % Return on equity E 15.0 % 10.0 % 7.0 % 5.7 % -6.0 % Return on capital employed, 12 months rolling F 14.2 % 9.9 % 7.2 % 5.4 % -1.2 % Return on total assets G 8.6 % 6.2 % 4.6 % 4.4 % -0.6 % Interest cover H CAPITAL STRUCTURE Equity ratio I 41.5 % 38.0 % 36.8 % 34.2 % 33.4 % Asset turnover J Debt-equity ratio K Net interest bearing debt / EBITDA LIQUIDITY Liquid ratio I L Liquid ratio II M Cash flow from operational activities N SHARES Profit per share in NOK O Average number of shares (mill) Cash flow from operational activities, in NOK per share P Equity per share Q Assessment value in NOK as at Dividend per share in NOK R PERSONNEL Number of employees as at ,546 3,492 3,426 3,326 3,276 Sick leave percentage S 5.6 % 5.6 % 5.5 % 5.5 % 5.4 % absence, H1 value T * Explanations of key figures are presented on the following page 80
81 Formulas for the key figures A: Capitalized investments - goodwill B: Equity + interest bearing debt C: Operating profit Operating revenues D: Operating profit + depreciation and impairments Operating revenues E: Net profit Average equity F: Operating profit + interest income Average capital employed, 12 months G: Operating profit + interest income Average total capital H: Profit before tax + finance cost Finance cost I: Equity Total capital J: Operating revenues Average total capital K: Net interest bearing debt Equity L: Current assets Short term debt M: Liquid funds + financial assets + receivables Short term debt N: Result after tax payable + depreciation - non controlling interest and correction regarding non liquid items from result and working capital O: Earnings assigned to Moelven's shareholders Average number of shares P: Cash flow from operations Average number of shares Q: Total equity assigned to Moelven's shareholders Average number of shares R: Dividend proposal S: Sickness absence Available hours - overtime T: Number of injuries absence per million working hours, 12 months rolling 81
82 Consolidated accounts Income statement for the group Amounts in NOK million Note Sales revenue 7 10, ,273.8 Other operating revenues Operating revenues 6 10, ,309.7 Product expenses 6, ,539.5 Changes in inventory raw materials, goods under manufacture and finished goods Payroll expenses 11, 23, 28 2, ,113.2 Depreciation of tangible and intangible assets 8, Impairment of tangible assets 8, Other operating expenses 11 1, ,042.5 Operating expenses 10, ,014.8 Operating profit Income from associates Value increase of financial instruments to fair value Other financial income Value reduction of financial instruments to fair value Other financial costs Net financial items Profit before tax Income tax Net profit Profit assigned to: Non-controlling interests Owners of parent company Annual profit transferred to/from other equity Total allocation Earnings per share (in NOK) Earnings per share assigned to Moelven's shareholders Statement of comprehensive income Amounts in NOK million Note Net profit Other comprehensive income Items that are not reclassified subsequently to profit or loss Actuarial gains (losses) on defined-benefit pension schemes Income tax on items that are not reclassified to profit or loss Items that may be reclassified subsequently to profit or loss Translation differences Proportion of other income and costs in associated companies Other changes Income tax on items that may be reclassified to profit or loss Other comprehensive income, net of tax Total comprehensive income for the period Comprehensive income assigned to: Owners of parent company Non-controlling interests
83 Consolidated statement of financial position Amounts in NOK million Note ASSETS Deferred tax assets Goodwill Other intangible assets Total intangible assets Land Buildings and other property Machinery and plant 1, ,063.4 Fixtures and fittings, tools, office machines etc Total fixed assets 8 1, ,637.2 Investments in associated companies Investments in other shares Bonds and other receivables Net pension funds Total financial fixed assets Total assets 1, ,718.7 Inventory 17 1, ,464.1 Accounts receivable 18, 19 1, ,358.5 Other receivables Total receivables 1, ,568.5 Financial derivatives Bank deposits, cash etc Total current assets 3, ,048.1 Total assets 5, ,
84 Amounts in NOK million Note LIABILITIES AND EQUITY Share capital Own shares Share premium reserve Retained earnings 1, Total equity assigned to owners of parent company 2, ,806.6 Non-controlling interests Total equity 2, ,813.4 Pension liabilities Deferred tax Other provisions Total provisions Liabilities to credit institutions Other long term liabilities 5, Other long term liabilities - non interest-bearing Total long term liabilities Liabilities to credit institutions Financial derivatives Accounts payable Public duties payable Tax payable Other short term liabilities 19, 24, Total short term liabilities 1, ,856.1 Total liabilities 2, ,953.4 Total equity and liabilities 5, ,766.8 Guarantees Mortgages Number of shares (Face value per share NOK 5.-) ,541, ,541,284 Moelv, 14. March 2018 Moelven Industrier ASA Olav Fjell Trond Stangeby Elisabeth Krokeide Chairman of the Board Deputy chair Aud Ingvild Storås Asbjørn Bjørnstad Martin Fauchald Lars Håkan Karlsson Morten Kristiansen CEO 84
85 Consolidated statement of changes in equity Equity assigned to owners of parent company Amounts in NOK million Share capital Share premium Own shares Other equity Total Noncontrolling interests Total equity Total as at , ,756.9 Comprehensive income for the period Net profit Other comprehensive income Translation differences Other changes Actuarial gains (losses) on defined-benefit pension schemes Income tax on other comprehensive income Other comprehensive income (net of tax) Transactions with owners, entered directly against equity Purchase of non-controlling interests Effect of acquisition Dividend to owners Share based payment transactions Total transactions with owners Total as at , ,813.4 Total as at , ,813.4 Comprehensive income for the period Net profit Other comprehensive income Translation differences Other changes Actuarial gains (losses) on defined-benefit pension schemes Income tax on other comprehensive income Other comprehensive income (net of tax) Transactions with owners, entered directly against equity Purchase of non-controlling interests Effect of acquisition Dividend to owners Share based payment transactions Total transactions with owners Total as at , , ,
86 Consolidated cash flow statement Amounts in NOK million Note CASH FLOW FROM OPERATIONAL ACTIVITIES: Net profit Adjustments to reconcile net profit with net cash flow from operations: Depreciation Impairment Income from associated companies Tax paid entered as income Profit / loss on sale of fixed assets Net value change of financial instruments to fair value Non cash financial items Interest payments received Interest paid Income tax Changes in operating assets and liabilities: Changes in inventory Changes in accounts receivable and other receivables Changes in trade accounts payable Changes in provisions and benefits to employees , , Changes in short-term liabilities excluding borrowing Cash flow from operational activities CASH FLOW FROM INVESTMENT ACTIVITIES: Investment in plant and equipment exc. acquisition 8, Net cash outlay on acquisition Receipts from sale of fixed assets Sale of other long-term investments Purchase of subsidiaries, reduced by cash in company Cash flow from investment activities CASH FLOW FROM FINANCING ACTIVITIES: Short term borrowing Payment of short term debt Changes in short-term loans and overdraft Purchase of non-controlling interests Change in long term debt facility - loan payments ,428.5 Change in long term debt facility - new loans ,288.5 Payment of other long term debt Payment of dividend Cash flow from financial activities Net increase (reduction) in liquid assets during year Liquid assets Effect of exchange rate changes on liquid assets Liquid assets Cash and cash equivalents Liquid assets Unused drawing rights , Restricted bank deposits Cash and cash equivalents ,
87 Changes in liabilities arising from financing activities Liabilities Cash management Hedging instruments Net Other Finance Currency and Interest borrowings leases Deposit Overdraft Assets Liabilities Liabilities Restated balance at ,097.2 Changes form financing cash flows: Proceeds from loans and borrowings Installments and other changes in bank overdrafts Changes arising from obtaining and losing control of subsidaries or other businesses: The effect of changes in foreign exchange rates: Changes in fair value: Other changes: Changes in bank overdraft 14.1 Capitalized borrowing costs - long term Capitalized interest costs - long term Capitalized net interest derivatives Capitalized borrowing costs - cash mangagement -2.4 Capitalized interest costs - cash management 0.3 Changes in finance leases -3.3 Interest leases 0.8 Balance at
88 Note 1 General information Moelven Industrier ASA is a public limited liability company, registered in Norway. The company's head office is at Industriveien 2, 2390 Moelv, Norway. The Group's activities are described in the board's annual report. Note 2 - Basis for preparing the annual accounts The consolidated accounts of the Moelven have been prepared in accordance with the International Financial Reporting Standards (IFRS) and the interpretations of the IFRS interpretations committee (IFRIC), as determined by the EU. The consolidated accounts were presented by the board on 14 March 2018 and the ordinary general meeting to discuss the annual accounts has been fixed for 25 April The consolidated accounts are based on the principles of historic cost accounting with the exception of the following items: Defined-benefit pension schemes are valued at present value of the future pension benefits that have been earned on the date of balance. Pension funds are valued at fair value. Financial instruments at fair value through profit or loss. These include derivatives for hedging interest rates, foreign exchange and electric power. The consolidated accounts have been prepared with uniform accounting principles for similar transactions and events under otherwise similar conditions. Note 3 - Significant accounting principles Presented below are the most important accounting principles that have been used in preparing the consolidated accounts. These principles have been used in the same way for the comparison figures in the consolidated accounts. 3.1 Consolidation principles The consolidated accounts include Moelven Industrier ASA and companies over which Moelven Industrier ASA has control of. Control is ordinarily achieved when the Group owns more than 50% of the shares in the company, but annual assessments are carried out of whether the Group also has control of companies where the stake is less than 50%. An investor controls an undertaking in which an investment is made when the investor is exposed to or has rights to variable returns from its involvement in that undertaking, and has the opportunity to influence these returns through its power over the undertaking. Non-controlling interest are included in group equity. The acquisition method is used for recognising company mergers on the income statement. Companies which are bought or sold during the course of the year are included in the Group accounts from the date on which control is achieved until the date on which it ceases. Changes in holdings in the subsidiaries that do not lead to loss of control are entered as an equity transaction. The remuneration is entered at fair value and the difference between remuneration and the value of the holding entered on the balance sheet is entered against the majority owner's equity. With changes in holdings that lead to loss of control, remuneration is measured at fair value. The balance sheet value of holdings and obligations in the subsidiary and the non-controlling interest are deducted on the date of loss of control. The difference between the remuneration and the balance sheet value of the holding is included on the income statement as a gain or loss. Any remaining holding is measured at fair value and any gain or loss included on the income statement as part of the gain/loss on the sale of the subsidiary. Amounts included in other income and costs are entered on the income statement. Associates are enterprises in which the Group has significant influence, but not control, over the financial and operational management. We have holdings between 20 per cent and 50 per cent in our associates. The Group accounts include the Group's share of profits from associates entered by equity method from the time significant control was achieved and until such control ceases. When the Group's losses exceed the investment in an associated company, the Group's balance sheet value is reduced to zero and further loss is not entered unless the Group has an obligation to cover this loss. All other investments are entered in accordance with IAS 39, Financial instruments: Recognition and measurement more detailed information on which is given in note
89 Intercompany transactions and intercompany balances, including internal earnings and unrealised gains and losses are eliminated. Unrealised earnings in respect of transactions with associates and joint ventures are eliminated against the investment to the extent of the Group s interest in the investee. Unrealised losses are eliminated in the same way, but only to the extent that there are indications of depreciation of value of assets that are sold internally. 3.2 New standards and interpretations Below is a summary of new and revised standards that have been decided, but which have not come into force as at 14 March New standards and interpretations Date of entry into force Implementation date IFRS 9 Financial Instruments 1 January 2018 Fiscal year 2018 IFRS 15 Revenue from Contracts with Customers 1 January 2018 Fiscal year 2018 IFRS 16 Leases 1 January 2019 Fiscal year 2019 IFRS 9 Financial instruments The standard regulates the classification, measurement and accounting of financial assets and financial obligations. Compulsory effective date is 1 January In comparison to IAS 39, IFRS 9 includes new principles for the classification and measurement of financial instruments, impairment of financial assets and hedge accounting. It is not expected that the transition to an expected loss model according to IFRS 9 will result in significant changes. The Group has a very restrictive credit policy, and has as a result of this historically had very low losses on receivables. In project operations, projects with expected losses have been isolated and are shown separately in the accounts for See note 19. The actual implementation effect related to financial instruments will depend on which instruments the Group has and the macroeconomic conditions that apply at the time of implementation, in addition to considerations that the Group will make in the future. employs only simple financial instruments and does not use hedge accounting. Based on the assessments that have been carried out, the new standard is not expected to affect the consolidated accounts at the time of implementation to any material degree. IFRS 15 Revenue from contracts with customers IFRS 15 Revenue from contracts from customers, which replaces the current revenue recognition standards (IAS11 and IAS 18) and interpretations, introduces a new model for recognition and measurement of revenue from sales contracts with customers. The standard takes effect for fiscal years that start on 1 January 2018 or later. The new model is based on a five stage process, which must be followed for all sales contracts with customers to determine when and how revenue should be recognized on the income statement. The most significant changes in IFRS 15 in relation to current practice are: - A sales transaction should be recognized as revenue in the profit and loss accounts as control (which can either take place at a certain time or over time) of the product or service transfers to the customer (the current "risk and rewards" concept is thus replaced by a control concept) - New and more detailed guidance on how part transactions in a sales contract are identified, and how the individual components are recognized and measured - New and more detailed guidance for recognition of revenue over time has performed an analysis of the new standard s expected significance for the Group. Based on analyses of the Group s current product mix and contract types within the divisions in both Timber, Wood and Building, the Moelven Group is of the opinion that the new standard will have minor significance on the following areas: - The new requirements to discretion and assessments of for example variable consideration, identification of sales contracts sub-components, etc., can impact the amount and/or timing for recognition of revenue. 89
90 This applies in particular in relation to larger construction contracts. It is considered that the impact based on the existing product mix is minimal. In 2017 no contracts have been identified that will have such effect. The Group has concluded that IFRS 15 will not impact recognition and measurement of the Group s other revenues, including the sale of retail goods, produced goods, services and rental income. Overall, the assessment based on the conducted analyses is that the impact on recognition and measurement is insignificant for the current product mix and contract types. IFRS 16 Leases IFRS 16 Leases supersedes the current standard IAS 17 Leases, and must be used from the 2019 fiscal year. The new standard will change the Moelven Group s recognition of leases for the agreements which under IAS 17 have been recognized as operational leases. As at the Moelven Group has entered 52% of posted rental costs as financial leases, with capitalization of right of use of rent as an asset and the payment obligation as a financial obligation. The overall financial obligation for leases at the turn of the year was NOK 19.8 million. Correspondingly, the right of use of rent as an asset was entered at NOK 18.9 million. For more information on the Group s leases, see note 9. According to the new standard, there is no longer a distinction between financial and operational rent. The new standard requires capitalization of all leases as a financial asset and financial obligation. There are exceptions for short leases and leases where the underlying asset is of low value. The purpose of the accounting standard is to provide better information on a company s rights and obligations, and to ensure better comparability between companies that themselves own their operating assets and those that lease these. For the Moelven Group the new standard will have an impact on the posting of leases for vehicles and premises, and require a new evaluation of forklift agreements that currently are posted as operational leases. Moelven largely owns all buildings and associated machinery used in operations, with a limited exception at individual units where leases must be adjusted to the new standard. Some leases include several components such as right of use and services. These must be split into the individual components and each component must be assessed independently. The effect of the new standard will affect EBITDA and operating profit, as a result of rent costs being moved from operating expenses to depreciation and interest charge. Earnings before tax will not be affected over time, but at the start of the lease period costs from depreciation and interest will exceed the actual rental costs. Towards the end of the tenancy depreciation and interest will be less than the rental costs. On the balance sheet assets and total assets will increase by the current value of the right of use to the leased objects. Correspondingly, debt will increase by the current value of the financial obligations. The equity ratio will be reduced as a result of increased total assets. Cash flow from operating activities will increase as the assets are depreciated, while the cash flow from financial activities is reduced as debt is written down. The Group s overall cash flow is not affected. The Group will use retroactive application of IFRS 16 without reworking comparative figures and with effect on the equity s opening balance in the transition year. The entire impact of the transition to IFRS 16 will be taken against the opening balance for equity in Functional currency and presentation currency The Group's presentation currency is NOK. This is also the functional currency of the parent company. Subsidiaries with other functional currencies are converted to the day rate for balance items and to the transaction rate for income statement items. Average monthly exchange rate is used as an approximation of transaction rate. Translation differences are entered against other income and costs ("OCI"). In any future sale of investments in foreign subsidiaries, accumulated translation differences that are referred to the majority owners will be entered on the income statement. 3.4 Use of estimates in preparing the annual accounts Management has used estimates and assumptions which have affected assets, liabilities, income, costs and information regarding potential obligations. This applies in particular to depreciation of fixed assets, assessment of added value and goodwill in connection with acquisitions, inventory, project assessments and pension commitments. Future events may cause the estimates to change. Estimates and the underlying assumptions are continually assessed. Changes in 90
91 accounting estimates are entered into the accounts during the period in which the changes occur. Where changes also affect future periods, the effect is distributed across the current and future periods. Also see note Foreign currency Foreign exchange transactions Foreign exchange transactions are calculated at the exchange rate prevailing at the time of the transaction. Monetary items in foreign currency are converted to Norwegian kroner by using the rate of exchange on the balance date. Nonmonetary items which are measured at historical exchange rates expressed in foreign currency are converted to Norwegian kroner by using the exchange rate at the time of transaction. Non-monetary items which are measured at fair value expressed in foreign currency are converted to the exchange rate determined at the time of the balance. Foreign currency fluctuations are recognised on the income statement continuously over the accounting period. Activities abroad Assets and liabilities in foreign companies including goodwill and fair value adjustments which arise on consolidation are converted to Norwegian kroner by using the exchange rate on the balance date. Income and expenses in foreign enterprises are converted to Norwegian kroner by using the average exchange rate. Exchange rate differences are entered in other income and costs ("OCI"). 3.6 Income Income is recognised on the income statement when it is probable that transactions will generate future financial benefit which will accrue to the company and the size of the amount can be reliably estimated. Sales income is presented after deduction of value added tax and discounts. Internal sales within the Group are eliminated. Income from sale of goods is entered on the income statement once delivery has taken place and most of the risk and profit have been transferred. Income from sale of services and long-term manufacturing projects is entered on the income statement as the project progresses, when the outcome of the transaction can be reliably estimated. Whether a project is classified as a manufacturing project is determined by whether the project to a significant degree is tailored to the customer's needs and that it is difficult to sell to others without major adjustments. In some of the companies, progress is measured as accrued costs in relation to total estimated costs, while in other companies; progress is measured on invoicing in relation to the contract total. When the result of the transaction cannot be reliably estimated, only income corresponding to accrued project costs will be recognised as income. In the period in which a project is identified as giving a negative result, the estimated loss on the contract will be recognised on the income statement in its entirety. The Group produces and sells energy to end customers. The sale is entered as income when the energy has been delivered and is read off at the customer's premises. Sales are entered based on the prices achieved, which are contract prices, but which can also be subject to price guarantee for the delivery period. Not including the financing element in sales is being considered. Otherwise, payment terms correspond to those that are normal in the market. Interest earnings are recognised as they are earned. Dividends are entered when the shareholders' rights to receive dividends have been adopted by the general meeting. IFRS 15 Revenue from contracts with customers will be implemented from the 2018 fiscal year, replacing IAS 18 Revenue. Information on the implementation period and consequences for the Group is described in section Segments For management purposes the Group is organised into four different divisions according to products and range of services. The divisions represent the basis for the primary report segments. In segment reporting, internal earnings on sales between the segments are eliminated. Financial information regarding segments and geographical distribution is presented in Note 6. In segment reporting, internal earnings on sales between the segments are eliminated. 3.8 Loan costs Loan costs are entered on the income statement when the cost arises. Loan costs are entered on the balance sheet to the extent that they are directly related to the purchase and manufacture of an asset and where the manufacturing period is long. A long manufacturing period means close to 12 months. Interest rate costs accrue during the build period until the asset is entered on the balance sheet. Balance entry of the loan costs is done until the point when the asset is ready for use. If the cost price exceeds the asset's fair value, it is written down. 91
92 3.9 Income tax Tax costs consist of payable tax and changes in deferred tax. Deferred tax/tax benefits are calculated on all differences between book and taxable values of assets and liabilities, with the exception of: group goodwill temporary differences related to affiliated companies the Group controls when the temporary differences will be reversed and it is not assumed to occur in the foreseeable future. Deferred tax advantage is recognised on the income statement when it is probable that the company will have sufficient tax surplus in later periods to utilise the tax advantage. The companies enter deferred tax benefits that have not been previously entered to the extent that it has become probable that the company may make use of the deferred tax benefit. Likewise the company will reduce deferred tax advantages to the extent that the company no longer regards it as probable that it can utilise the deferred tax advantage. Deferred tax and deferred tax advantages are measured based on anticipated future tax rates for the companies in the Group where temporary differences have previously arisen. Deferred tax and deferred tax advantages are recognised at nominal value and are classified as financial capital expenditure (long-term liability) on the balance sheet. Payable tax and deferred tax are entered directly against equity to the extent that the tax entries relate to equity transactions Research & Development Expenses associated with research activities are recognised on the income statement when they arise. Costs relating to development activities are entered on the balance sheet to the extent to which the product or process is technically and commercially realisable and the Group has sufficient resources to complete the development. The costs that are entered include material costs, direct payroll costs and a proportion of directly attributable joint expenses. Development costs entered on the balance sheet are entered as acquisition costs minus accumulated depreciation and write-down. Development costs entered on the balance sheet are depreciated on a straight line basis over the estimated lifetime of the asset Tangible fixed assets Tangible fixed assets are measured at acquisition cost, less accumulated depreciations and write downs. When assets are sold or disposed of, the value on the balance sheet is deducted and any profit or loss is entered on the income statement. Acquisition price for fixed assets is the purchase price including duties/taxes and costs directly associated with preparing the fixed assets for use. Costs after the fixed asset has been taken into use, such as continuous maintenance, are entered on the income statement, while other costs that are expected to provide future financial benefit are entered on the balance sheet. Depreciation is calculated on a straight-line basis with the following decomposition and depreciation period: Type of asset Significant components Depreciation period Office buildings Building Sprinkling Fire alarm Technical installations years 10 year 10 year 7-10 years Warehouse Building only years Dryer Machines Production premises Dryers are structured that should be viewed as a whole. Depreciation should be the same for all dryer elements: Building Machine Control Culvert Machine Control systems Foundation Building Technical installation years years years years years years years years Approx. 10 years 92
93 Boiler house Fixtures and fittings, tools, office machinery, etc. Water and drainage Sprinkler system Building Culvert Boiler unit No decomposition Approx. 10 years Approx. 10 years years years years 4-7 years Vehicles No decomposition 4-7 years Plots No depreciation Depreciation period and method are reviewed annually. Scrap value is estimated at each year end and changes to estimates of scrap value are recognized as a change in estimate. Plants under construction are classified as fixed assets and are recorded at cost until manufacture or development is completed. Plant under manufacture is not depreciated until the asset is taken into use Leasing Financial lease agreements Lease agreements for which the Group assumes the main risk and profit involved in ownership of the asset are financial lease agreements. At the beginning of the lease period, financial lease agreements are recognised at an amount corresponding to the lower of either fair value or the present value of the minimum lease. For calculation of the lease agreement's present value the implicit interest cost in the lease agreement is used if it is possible to calculate this. If not, the company's marginal borrowing interest is used. Direct expenses relating to establishing the lease contract are included in the asset's cost price. The same depreciation time is used as for the company's other depreciable assets. Where reasonable certainty that the company will assume ownership at the end of the lease period does not exist, the asset is depreciated over the shorter of the duration of the lease agreement and the asset's economic life cycle. Operational lease agreements Lease agreements where the main risk and profit associated with ownership of the asset are not transferred are classified as operational lease agreements. Lease payments are classified as operating expenses and are recognised on a straight-line basis over the contract period. IFRS 16 Leases will be implemented from the 2019 fiscal year, replacing IAS 17 Leases. Information on the implementation period and consequences for the Group is described in section Intangible assets Intangible assets acquired separately are entered on the balance sheet at cost. The costs of intangible assets acquired through acquisitions are recognized in the consolidated financial statements at fair value at the acquisition date. Intangible assets entered on the balance sheet are entered in the accounts at cost less any depreciation or write down. Internally generated intangible assets, with the exception of recognised development costs, are not entered on the balance sheet but are entered as costs on an ongoing basis. Useful lifetime is either predetermined or non-predetermined. Intangible assets with a predetermined limited economic useful life are depreciated over this period and tested for write down if there are indications of impairment. Depreciation method and period are assessed at least annually. Changes in depreciation method and/or period are treated as estimate changes. Intangible assets with indefinite useful lives are tested for impairment at least yearly. Intangible assets with indefinite useful life are not depreciated. The useful life is assessed annually to determine whether the assumption of indefinite useful life is reasonable. If not, a change is made to predetermine useful life prospectively. Software 93
94 Costs relating to the purchase of new software are entered on the balance sheet as an intangible asset as long as these costs are not part of the acquisition cost of hardware. Software is normally depreciated on a straight line basis over 3 years. Costs arising as a result of maintaining the future usefulness of software are entered as costs if the changes to the software do not increase the future financial benefit of the software Business combinations and goodwill Business combinations are entered in accordance with the acquisition method. Refer to note 3.24 with regard to the measurement of non-controlling interest. Transaction costs are entered on the income statement as they occur. Remuneration for the purchase of a company is measured at fair value on the date of acquisition. When a company is purchased, all assets and obligations taken over are assessed for classification and assignment in accordance with contract conditions, economic circumstances and relevant conditions on the date of acquisition. Assets and debts taken over are recogniced on the balance sheet at fair value on the consolidated opening balance unless IFRS 3 indicates that other measurement rules shall be used. Allocation of added value in business combinations is amended if new information arises regarding fair value on the date of taking control. Allocation can be changed up to 12 months after the date of acquisition if this is specified at the time of acquisition. The non-controlling interests are calculated as the minorities' percentage of identifiable assets and debts. In the case of step by step acquisition, earlier assets are measured at fair value on the date of acquisition. Changes in the value of earlier assets are entered on the income statement. Goodwill is calculated as the sum of the remuneration and book value of the non-controlling interest and fair value of previously owned assets, less the net value of identifiable assets and obligations calculated on the date of acquisition. Goodwill is not depreciated but tested at least annually for loss in value. If the net value of identifiable assets and obligations calculated on the date of acquisition exceeds the remuneration (negative goodwill), the difference will be recognized at the acquisition date Public grants Public grants are entered in the accounts when there is reasonable certainty that the company will fulfil the conditions associated with the grants. Recognition of operational grants is calculated systematically over the grant period. Grants are recognised as deductions from the cost that the grant is intended to cover. Investment subsidy is entered on the balance sheet in a systematic way over the life cycle of the asset. Investment subsidy is entered either as deferred income or as a deduction when determining the value of the asset on the balance sheet Financial instruments According to IAS 39 Financial Instruments - recognition and measurement, financial instruments within the scope of IAS 39 are classified in the following categories: financial assets at fair value through profit or loss, held to maturity, loans and receivables, available for sale and other obligations. Financial instruments that are primarily held for the purpose of selling or buying back in the short term, financial instruments in a portfolio of identified instruments that are controlled together and where there are clear signs of short term realisation of gains and derivatives that have not been designated as hedging instruments are classified as held for trading purposes. These instruments are included in the category financial assets at fair value through profit or loss, together with financial instruments that qualify as, and have been designated as, instruments at fair value through profit or loss. Financial guarantee contracts are measured at the higher of what follows from IAS 37 Provisions, Contingent Liabilities and Contingent Assets and IAS 18 Revenue, unless the contracts qualify as, and have been designated as, instruments at fair value through profit or loss. Financial assets with fixed or determinable cash flows and fixed redemption dates, where the Group has the intention of and the ability to hold the investment to maturity, are classified as investments held to maturity, with the exception of those instruments that the company designates as instruments at fair value through profit or loss or available for sale, or which meet the criteria for inclusion in the category loans and receivables. Financial assets with fixed or determinable cash flows that are not listed in an active market are classified as loans and receivables, with the exception of instruments that the Group has designated as instruments at fair value through profit or loss or available for sale. All other financial assets are classified as available for sale. 94
95 Financial obligations that due not fall into the category held for trading purposes and that have not been designated as instruments at fair value through profit or loss are classified as other obligations. Financial instruments held to maturity are included in financial fixed assets, unless the redemption date is within 12 months of the balance date. Financial instruments in the Group that are held for trading purposes are classified as current assets. Financial instruments available for sale are presented as current assets if management has decided to dispose of the instrument within 12 months of the balance date. Investments held to maturity, loans and receivables and other obligations are recognised at amortised cost. Financial instruments classed as available for sale and held for trading purposes are recognised at fair value, as observed in the market on the balance date, without deduction for costs connected with sale. Gains or losses resulting from changes in the fair value of financial investments classified as available for sale are recognised as other income and costs until the investment is realised. On realisation, accumulated gains or losses on the financial instrument that have previously been recognised against equity are reversed and the gain or loss is entered on the income statement. Gains or losses resulting from changes in the fair value of financial investments classified as held for trading purposes or that have been designated as instruments at fair value through profit or loss are entered on the income statement and presented as financial income or cost. The fair value of financial instruments that are traded in active markets is determined at the end of the reporting period by referring to the listed market price from traders of financial instruments (buying rate for long positions and selling rate for short positions), without deduction for transaction costs. For financial instruments that are not traded in an active market, the fair value is determined with the aid of a suitable valuation method. Such valuation methods involve the use of recent market transactions at arm's length between wellinformed and voluntary parties, if such are available, referral to the current fair value of another instrument that is practically the same, discounted cash flow calculation or other valuation model. An analysis of fair value of financial instruments and other details regarding the measurement of these is given in the note 26. IFRS 9 Financial instruments will be implemented from the 2018 fiscal year, replacing IAS 39 Financial instruments - Recognition and measurement. Information on the implementation period and consequences for the Group is described in section Hedging The Group performs financial hedging transactions. However on the basis of an assessment of cost and benefit of hedge accounting in accordance with IAS 39, it has been decided that the Group does not perform hedge accounting Derivatives that are not hedging instruments Financial derivatives that are not recognised as hedging instruments are assessed at fair value. Changes in fair value are entered on the income statement on an ongoing basis. An inbuilt derivative is separated from the host contract and recognised as a derivative if and only if all the following conditions are fulfilled: The financial characteristics and the financial risk of an inbuilt derivative are not closely related to the financial characteristics and the financial risk of the host contract. A separate instrument with the same conditions as the inbuilt derivative would have satisfied the definition of a derivative. The combined instrument (main contract and inbuilt derivative) is not measured at fair value through profit or loss Impairment of financial assets Financial assets valued at amortised cost are written down when it is probable based on objective evidence that the instrument's cash flow has been affected negatively by one or more events occurring after the initial recognition of the instrument. The write-down amount is entered on the income statement. If the cause of the write down later ceases and the cessation can be objectively associated with an event taking place after the inclusion of the write-down, the previous write-down is reversed. This reversal must not result in the balance value of the financial asset exceeding the amount of 95
96 what the amortised cost would have been, if the loss in value had not been included at the time when the write-down was reversed. Reversal of earlier write down is presented as income. Financial assets classified as available for sale are written down when there are objective indications that the value of the asset has fallen. The accumulated loss that has been entered directly to equity (the difference between acquisition cost and current fair value less write-down that has previously been included on the income statement and any amortisation amount) is removed from equity and entered on the income statement. If the fair value of a debt instrument classified as available for sale increases at a later date, and the increase can be objectively linked to an event that occurred after the write-down was entered on the income statement, the write-down shall be reversed on the income statement. Write down of an investment in an equity instrument is not reversed on the income statement Inventory Inventory is recognised on the income statement at the lower of acquisition cost or net sales price. Net sales price is an estimated sales price for ordinary operations minus estimated costs for completion, marketing and distribution. Acquisition cost is allocated by use of the FIFO method and includes expenses accrued when acquiring the goods and the costs of bringing the goods to their current condition and location. Proprietary goods include variable and fixed costs that can be allocated based on normal capacity utilisation Projects The Building Systems division primarily performs contract assignments (projects). For projects, Moelven mainly uses current income entry based on the anticipated end result. This means that income is entered in line with the execution of the work, based on the degree of completion. Additional claims and disputed amounts are not normally entered until agreement has been reached or there is a court judgement. However part of the claim is entered if there is an overwhelming probability of the anticipated outcome. Provision is made for claims activities based on historical experience and identified risks. Guarantee periods are normally from three to five years. For projects that are expected to result in a loss, the entire loss is entered on the income statement as soon as it is identified. Costs of tendering and other preparatory work are entered as they arise. For projects that are directed by outside companies, invoicing is performed monthly with 30 day payment terms. Invoicing is normally done in line with the completion of the work, but there are also payment schedules that do not correspond to progress. For projects, both income and costs are scheduled. Income that has been earned but not yet invoiced is entered under the item "Completed, not invoiced". Invoiced income that has not yet been earned (forward payment plans) is entered under the item "Prepayments from customers" under other short term liabilities; see note 19. Only one of these items is used per project. Scheduling of costs (accrued, not entered) is recognised as trade accounts payable, while provisions for claims activities on concluded projects are entered as claims provisions etc. Part of the outstanding receivables is secured in the form of bank guarantees or other forms of security. There is not considered to be any credit risk associated with public sector customers. Refer to note 5 on financial risk. Refer to note 19 Projects in progress, note 18 Accounts receivable, note 25 A Other short term liabilities and note 24 Claims provisions etc. When the result of the transaction cannot be reliably estimated, only income corresponding to accrued project costs will be recognised as income. IFRS 15 Revenue from contracts with customers will be implemented from the 2018 fiscal year, replacing IAS 18 Revenue. Information on the implementation period and consequences for the Group is described in section Cash and cash equivalents Cash includes cash holdings and bank deposits. Cash equivalents are short term liquid investments that can be immediately converted into a known amount of cash and that have a maximum of 3 months to maturity. In the cash flow statement, the bank overdraft has been subtracted from the balance of cash and cash equivalents Equity Own shares 96
97 On repurchase of own shares, the purchase price including immediate costs is entered as a change in equity. The nominal value of treasury shares is presented on a separate line below share capital, while payment in excess of nominal value reduces other equity. Losses or gains on own share transactions are not entered on the income statement, but are offset against equity. Costs of equity transactions Transaction costs directly associated with equity transactions are entered directly to equity after deduction for tax. Other equity Translation differences Translation differences arise in conjunction with currency differences on consolidation of foreign units. Currency differences on monetary items (liability or receivable) that are in reality part of a company's net investment in a foreign unit are also entered as translation differences. For disposal of foreign units the accumulated translation difference associated with the unit is reversed and entered on the income statement for the same period as the profit or loss on the disposal is entered on the income statement Non-controlling interests (minority interests) Minority interests in the consolidated financial statements represent the minority's share of the carrying value of equity. In a business combination, non-controlling interest are measured according to their proportionate share of identified assets and debt. The subsidiary company's results, as well as the individual components of other income and costs, are attributable to owners of the parent company and the non-controlling interest. The total result is attributed to the parent company's owners and to the non-controlling interest, even if this leads to a negative minority interest Employee benefits The Group's Norwegian companies: All Norwegian companies have collective, contribution-based pension schemes. The contribution-based scheme provides coverage for disability. Pension premiums are entered as costs as they occur. The company's collective defined benefit scheme was terminated in 2015 by issuing paid-up policies. All new employees are included in the defined contribution scheme. A few defined benefit schemes remain for a limited number of individuals. The closed schemes are defined benefit plans that give the employees entitlement to agreed future pension benefits. The benefits are based on the number of years of earning and pay level on retirement. The Group's foreign companies: Many of the Group's foreign companies offer their employees pensions based on agreed individual contribution-based pension schemes. In Sweden, most employees are covered by a collective occupational pension agreement. The scheme is defined as a multi-employer plan. Salaried staffs born before 1979 are included in an individual occupational pension scheme that is also defined as a defined benefit plan. Because of the difficulty of reliably measuring the benefit level of these plans, there is insufficient information on an individual basis to enter the plans in the accounts as defined benefit schemes. The plans are entered as if they were contribution-based schemes. The salaried staff, born after 1979, are included in an occupational pension scheme that is premium based and is therefore treated in the accounts as contribution-based. Defined-benefit pension schemes Defined-benefit pension schemes are valued at present value of the future pension benefits that have been earned on the date of balance. Pension funds are valued at fair value. Changes in defined-benefit pension commitments that are due to changes in pension plans are distributed over the estimated average remaining earnings period. Pension funds are valued at fair value. Changes in defined-benefit pension commitments that are due to changes in pension plans are distributed over the estimated average remaining earnings period. The period's net pension costs are classified as payroll and personnel costs. Gains and losses on the curtailment or settlement of a defined-benefit pension scheme are recognised on the income statement on the date the curtailment or settlement occurs. 97
98 Curtailment occurs when the Group decides on a significant reduction in the number of employees covered by a scheme or changes the conditions for a defined-benefit pension scheme so that a considerable part of the present employees' future earning no longer qualifies for benefits or only qualifies for reduced benefits. Defined contribution pension scheme In 2015 defined contribution schemes were converted to defined benefit schemes for all Norwegian employees of Moelven. The contribution to the pension scheme comprises from 3.6% to 21.7% of salary. Pension premiums are entered as costs as they occur Provisions A provision is recognised when the Group has an obligation (legal or self-imposed) as a result of an earlier event, it is probable (more probable than not) that a financial settlement will take place as a result of this obligation and the amount can be reliably measured. If the effect is considerable, the provision is limited by discounting anticipated future cash flow by using a discount rate before tax that reflects the market price of the monetary value and, if relevant, the risk associated with the specific provision. A provision for guarantees is included when the underlying products or services are sold. Calculation of the provision is based on historical information on guarantees and a probability weighting of possible outcomes. Provisions for restructuring costs are included when the Group has approved a detailed and formal restructuring plan and the restructuring has already started or has been made public Conditional liabilities and assets Conditional liabilities are not recognised in the annual accounts. Significant conditional liabilities are noted, with the exception of conditional liabilities where the probability of the liability is low. A conditional asset is not recognised in the annual accounts, but is reported where it is probable that a benefit will accrue to the Group Events after the balance sheet date New information about the company's financial position on the balance date that arises after the balance date is taken in to consideration in the annual accounts. Events after the balance date that do not affect the company's financial position on the balance date, but which will influence the company's financial position in the future, are reported if they are significant. Currency exchange rates The following exchange rates against the Norwegian kroner (NOK) have been used in consolidating the accounts Swedish krone (SEK) Income statement rate Balance sheet rate Danish krone (DKK) Income statement rate Balance sheet rate Euro (EUR) Income statement rate Balance sheet rate British pound (GBP) Income statement rate Balance sheet rate The income statement rate is an average rate for the year. Balance sheet rate is the closing rates
99 Note 4 Critical accounting estimates and judgements In preparing the annual accounts in accordance with IFRS, the company's management have used estimates based on good faith and assumptions which are believed to be realistic. Situations or changes may arise which may mean that such estimates require adjustment and thereby affect the company s assets, debt, equity or profit and loss. The company s most important accounting estimates relate to the following: Valuation and depreciation on tangible fixed assets. Valuation of inventory Fair value of assets and obligations in acquisitions. Project valuations Anticipated useful life of the company's production equipment is affected by the technological development and profitability of the plant. Choice of depreciation period is an estimate. If there are indications of a fall in value, the inventory in the subsidiaries must be tested for value loss. Book value is then compared with estimated net sales value. Management must take many things into account when making this estimate. The company's recognised goodwill and intangible assets are assessed for write down annually. Impairment testing of intangible assets are presented in Note 10b. The company is greatly affected by economic cycles that lead to considerable fluctuations in fair value in the company. The group is particularly affected by developments in the export markets in Europe and Africa, as well as fluctuations in the building industry in Scandinavia. Exchange rates and market interest rates also affect valuation. Valuations of the various established segments will naturally vary within a range of +/- 20%. For businesses in less mature markets, the range may be even greater. Moelven must distribute the cost price of acquired companies over acquired assets and acquired debt based on estimated fair value. The valuation estimates require management to make considerable assessments in the choice of method, estimates and assumptions. Significant acquired intangible assets that Moelven has included, comprise customer base and goodwill. The assumptions made for the assessment of intangible assets include, but are not limited to, estimated average lifetime of customer relationships based on natural loss of customers. The assumptions made for the assessment of assets include, but are not limited to, the reacquisition costs of fixed assets. Management's assessments of fair value are based on assumptions that are deemed to be reasonable, but that have a built in uncertainty, and as a result of this the actual results may differ from the calculations. Project assessment is dependent on estimates of degree of completion, anticipated final status, any loss projects, guarantee obligations and claims. The managements of the subsidiaries within Building Systems use figures based on experience, among others, in preparing the estimates. Projects under construction is presented in note
100 Note 5 - Financial risk management Risk management principles and processes s operations entail various forms of financial risk. The group has designed a financial policy whose main purpose is to reduce risk and establish predictable financial framework for the industrial operations. Financial risk is managed by the finance department of Moelven Industrier ASA in collaboration with the various operational unit, in a cost-effective manner. The adopted policy should minimize the potentially negative effects the financial markets may have on the Group s cash flow. The financial guidelines are primarily based on the concept that it is the industrial operations, rather than financial transactions, that should ensure profitability. The most important financial risks and the principles for the finance department are described below. 5.1 Market risk The market risk is the risk that a financial instrument's fair value or future cash flow will fluctuate as a result of changes in market prices. Market risk includes three types of risk: currency exchange rate risk, interest rate risk and other price risk Foreign currency - transaction risk Transaction risk means the exchange rate risk that is caused by the possibility of exchange rate changes in the period between the time a transaction in foreign currency is agreed and the time of settlement. About 15 per cent of the Group's operating revenues comes from markets outside Scandinavia and carry exchange rate risks. The companies import raw materials and finished goods to both Sweden and Norway. There is also significant trade both within the group and externally between Sweden and Norway. The key currencies are EUR, GBP, DKK and SEK, but the Moelven Group is also exposed to USD, CAD and CHF. In accordance with the group s financial policy, cash flow fluctuations as a result of variation in exchange rates must be kept within a defined outcome area through the use of hedging instruments. Currency terms are primarily used. All hedging in the group shall be done by the group s central financial department in Moelv, both internally for the group companies and net exposure externally. Norwegian subsidiaries hedge against NOK, Swedish ones against SEK. Results from Swedish subsidiaries are included as part of net investment in foreign subsidiaries and are not hedged for exchange rate fluctuations in compliance with the current finance policy. In accordance with the financial policy, net exposure in foreign currency shall be hedged against rate fluctuations according to the following main principles: At least 90 per cent of obligations in foreign currency shall be hedged when entering into the contract. This relates mainly to investment projects where machinery and equipment is bought from abroad. Expected net exposure in the upcoming 24 months will be secured within the defined maximum and minimum limits. Because of the hedging strategy that has been chosen, changes in exchange rates must be long-term so as to have the full effect on the Group's profitability. During the hedging period, operational adaptations may be made to compensate for the external changes. Sensitivity - foreign currency The table below shows the transaction volume for the main currencies in 2017 and The group does not use hedge accounting, and the equity effect of changed market values for currency hedges therefore corresponds to the ordinary result after taxes. The effects of changed competitiveness due to exchange rate changes are not included in the sensitivity analysis. Transaction risk and hedges in the main currencies in 2017 NOK mill EUR GBP DKK USD Others Operating revenues Operating expenses Net exposure Estimated annual net exposure Hedging volume as at maturing <12 months Hedging ratio as at for the next 12 Months 75.4 % 24.1 % 15.4 % 11.1 % 8.4 % Transaction risk and hedges in the main currencies in 2016 NOK mill EUR GBP DKK USD Others Operating revenues Operating expenses Net exposure Estimated annual net exposure Hedging volume as at maturing <12 months Hedging ratio as at for the next 12 months 21.3 % 16.6 % 0.0 % 19.3 % 0.0 % 100
101 5.1.1 Currency - transaction risk (cont.) In addition to the exposure shown in the above tables, the group has an annual exposure in SEKNOK corresponding to approximately 132 million. The exposure is due to net export from Swedish group companies to Norway, and is currency hedged in the usual manner at the company level. Since a large proportion of the Group's total production takes place in Sweden, the Group also has significant costs in Sweden. Net profit from the Swedish subsidiaries are included in retained earnings, and the currency risk arising in connection with these units' operating income and expenses are taken into account the risk related with the risk of conversion to equity. The table below shows sensitivity in the results before tax to exchange rate changes when all other conditions remain unchanged. The calculations are on the basis of rate changes being constant for the whole year. The effects of currency hedging, changes in the market value of financial hedging instruments and revaluing of balance sheet items have not been taken into account. Avrage FX rate 2017 Net exposure in NOK NOK decrease 1 % NOK decrease 10 % NOK increase 1 % NOK increase 10 % FX rate after movement Net gain (losses) FX rate after movement Net gain (losses) FX rate after movement Net gain (losses) FX rate after movement Net gain (losses) Movement EURNOK 9, ,42 3,16 10,26 31,62 9,24-3,16 8,40-31,62 Movement GBPNOK 10, ,76 4,00 11,72 40,01 10,54-4,00 9,59-40,01 Movement DKKNOK 1, ,27 0,31 1,38 3,12 1,24-0,31 1,13-3,12 Movement SEKNOK 0, ,98 1,32 1,06 13,20 0,96-1,32 0,87-13,20 The market value of financial derivatives used for currency hedging depends on the balance sheet exchange rate in relation to the hedging rates that have been achieved. Changes in market value will result in an unrealized gain or loss and be recognized as financial cost. The table below shows how the ordinary result before taxes would have been affected by a change in the balance sheet date. The calculation is made on the basis of actual hedging volumes in the specified currencies per FX rate per volume NOK decrease 1 % NOK decrease 10 % NOK increase 1 % FX rate after movement Net gain (losses) FX rate after movement Net gain (losses) FX rate after movement Net gain (losses) Currency translation risk In this context, translation risk means exchange rate risk due to the balance sheet including items that are denominated in a foreign currency. For the group companies, this translation risk is eliminated in that financing shall occur in the same currency as the asset is entered in the accounts. About half of the Group's total balance sheet is connected to activities in Sweden. The balance sheet figures will therefore be affected by the prevailing exchange rate between the Swedish and Norwegian kroner. A large part of equity is secured against fluctuations as the share investment in most of the group's Swedish subsidiaries is financed in Swedish kroner. The table below shows the effect on consolidated equity by a change in the exchange rate of +/- 10 percent: NOK increase 10 % FX rate after Net gain movement (losses) Movement EURNOK 9,84 0 9,939-0,10 10,82-0,98 9,74 0,10 8,86 0,98 Movement GBPNOK 11, ,202-0,11 12,20-1,11 10,98 0,11 9,98 1,11 Movement DKKNOK 1,32 0 1,335 0,00 0,00 0,00 1,31 0,00 1,19 0,00 Movement SEKNOK 1, ,010 0,01 1,10 0,10 0,99-0,01 0,90-0,10 Amounts in NOK million % movement SEK/NOK 102,8 76,6 10 % movement EUR/NOK 6,2 0,4 10 % movement DKK/NOK 3,1 2,0 10 % movement GBP/NOK 6,1 0,3 Total effect 118,2 79, Interest rate risk Interest rate risk is the risk that a financial instrument's fair value or future cash flows will fluctuate because of changes in market interest rates. The Group's net interest-bearing debt is subject to interest rate risk. The group companies are to be funded with internal loans from the parent company in the currency that is the subsidiary s local currency. This essentially means either NOK or SEK. All external borrowing is done by the parent company, which also makes hedging in accordance with financial policy. Hedging instruments that can be used is interest rate swaps, FRAs and complex basis swap. The extent of hedging is measured in terms of the combined duration of outstanding debt and hedging activities. The total duration should be minimum of 12 months and maximum 60 months. Interest rate hedging agreements with a maturity of more than 10 years shall not be entered. The Group's average net debt in 2017 was NOK 940,9 million (1,143.0). If the entire debt had been without interest rate hedging, an interest rate change of one percentage point would lead to a change in the group s financing cost of NOK 9.5 million. However, pursuant to the financial policy, part of the debt is secured against interest rate fluctuations through the use of financial hedging instruments. Interest rate swaps are the main instrument. At the end of 2017 the hedge ratio was 63.5 per cent. Unrealized market value changes of interest rate instruments are recognized in the profit and loss account, but do not affect the cash flow. The unrealized market value of interest rate instruments is tied to the remaining term of the instrument, which according to the group s finance policy may be up to 10 years. 101
102 5.1.3 Interest rate risk (cont.) Estimated effect on profit before tax by a change in interest rates and yield curves in the future are shown in the table below. The group does not use hedge accounting, and the equity effect therefore equals the result after tax. Average NRBG 2017 Average hedged share Interest rate movement -100 bp Interest rate movement +100 bp Estimated interest cost, 100% floating rate Secured portion not affected by market fluctuations 63.5 % Net effect on annual interest expenses before unrealized items Unrealized gains / losses on hedging instruments that are recognized The total effect including unrealized value change Other price risk Other price risk is the risk that a financial instrument's fair value or future cash flow will fluctuate because of changes in market prices (apart from changes that are due to interest rate risk or exchange rate risk), regardless of whether these changes are caused by factors that are specific for the individual financial instrument or the instrument's issuer, or by factors that affect all corresponding financial instruments that are traded in the market. The price of electric power is an important factor that affects the Group's profitability. About 230 GWh of electric power a year is bought via the Group's electricity suppliers on the Nasdaq OMX exchange. According to the Group's financial policy, the need for electric power shall be secured against price fluctuations to ensure stability and predictability. The anticipated power requirement is hedged within stated maximum and minimum levels by forward buying on Nasdaq OMX with a 5 year maximum horizon. The price of electric power is denominated in EUR. The Group's power costs are therefore affected by both price changes and exchange rate changes. Based on the Financial Supervisory Authority s statements in 2016 concerning long-term supply contracts for energy, the proportion of the market value change for energy hedges that can be attributed to exchange rate changes is treated as a embedded currency derivative. The value is included in the group s accounts, while the actual supply contracts are kept outside pursuant to IAS 39. The value as at amounted to NOK -1.0 million (0.6 million) The group's annual electricity consumption has been relatively stable, apart from increases caused by business combinations. Accounting of energy hedging differs in Norway and Sweden. Hedging of power consumption in Norway is subject to the exception rules on purchasing for own consumption in IAS 39, and are only entered when the power delivery takes place. For the hedges in Sweden the market value is capitalized at the time of reporting, and the value change is entered against the result. The table below illustrates the effects on results before tax of a change in the electricity price of +/- 1 EUR per MWh at different exchange rate levels for EURNOK. Consumption Residual effect EURNOK Amount in NOK million in Gwh in EUR Increase in the price of 1 EUR / MWh Hedged share of consumption upcoming year 63.1 % Sensitivity taking into account hedging The effect on ordinary result before tax of exchange rate changes on the total consumption per year is shown in the table below: Consumption Price EURNOK Amount in NOK million in Gwh EUR/MWh Yearly consumption Changes in the cost of currency change EURNOK from The table below shows the sensitivity to changes in the price level for electricity forward contarcts at Nasdaq OMX. The starting point in secured volume per and provided that the price curve for futures contracts changed with 1 EUR / MWh. Hedged vol. Value in EURNOK Amount in NOK million in MWh EUR 1000* Hedging according to IAS 39 relating to own use (consumption in Norway) 143,662 4, Hedging where market value are recognized according to IAS ,051 5, Total 318,713 9, *) Assuming EUR 30/MWh 102
103 5.1.5 Liquidity risk Liquidity risk means risk that the company will have difficulties in fulfilling financial obligations that are settled with cash or another financial asset. The group s foreign capital funding consists of a long-term credit facility maturing in June 2020, in addition to short-term credit facilities in the banking systems. The long-term loan agreement was entered into in June 2016, and includes two credit limits of NOK 850 million and SEK 750 million respectively. The agreement initially had a 3 year term, with the option to request an extension of 1 year up to 2 times in the agreement s 2 first years. In the second quarter of 2017 the first of these two options was used, and the agreement s maturity was changed from June 2019 to June Any decision to request a further extension of the agreement will be made in the course of March/April The agreement includes general default clauses on minimum equity ratio of 33 per cent, net equity value of NOK 1.1 billion and debt ratio of a maximum 1.0. As at 31 December 2017, the Group's key figures were above the agreed levels. In addition to the long-term credit facility, the group also has available short-term credit of NOK 312 million, which is renewed annually. As at 31 December 2017, the group deposit amount was NOK 30.9 million. Long-term cash flow forecasts are prepared in connection with the strategy and budget process. The finance department monitors the utilisation of the credit facilities against the long-term liquidity needs, to ensure that the group has sufficient long-term financing to carry out operation and development of the group in accordance with the current strategy plan. Short-term cash flow forecasts are prepared at the company level and reported weekly to the Group's finance department, which aggregates the forecasts and monitors the group's total liquidity requirements. Based on these forecasts, the finance department ensures that the group has sufficient and reasonable cash equivalents available to meet operational obligations. Surplus liquidity is used to repay long-term debt. Short-term investments are thus only made exceptionally. Due to the annual seasonal variation in raw material access and market activity, the Group's working capital varies by NOK 300 million to NOK 400 million from its highest level in May/June to its lowest in November/December. Maturity structure Book value Cash flows per year NOK mill md 3-10 md Debt to credit institutions Interest rate derivatives Financial leasing Other long term debt, interest-bearing Other long term debt, non interest-bearing Long-term contracts Liabilities to suppliers Financial derivatives 89.5 Tax payable Public duties payable Other short term liabilities Total contracts with annual renewal 1, , The table above does not show cash flow from accounts payable, other interest-free debt and cash flow from currency derivatives. A summary of the nominal value of financial derivatives is presented in note Short term interest-bearing debt next 12 months - Long-term interest-bearing debt (payable in 12 months or later) Long-term interest-bearing debt by currency NOK million NOK SEK Total Loans secured with mortgages in assets: NOK million 2017* 2016 Overdrafts 0.0 Long-term loans 1.1 Total 1.1 *The loan was repaid in
104 Book value of mortgaged assets: NOK million 2017* 2016 Machinery and plant 17.6 Buildings 10.0 Plots 2.3 Inventory 18.7 Accounts receivable 2.5 Total 51.1 *The loan was repaid in Refinancing risk Refinancing risk is the risk of difficulties arising in refinancing the Group's long-term liabilities. In accordance with the group's financial policy, the remaining time to maturity of the group s main financing shall be a minimum of 1 year. The Group's long-term financing is syndicated loans from a few selected financial institutions which the Group has cooperated closely with for an extended period. The background for this is the significance of these financial institutions' focus on the mechanised wood industry, combined with industry competence and knowledge of risk profiles and seasonal and other fluctuations. The present financing has been taken up with negative pledge declaration and default clauses linked with key figures on the balance sheet. The loan agreements do not contain any profit-related default clauses Credit risk Credit risk arises in transactions with settlements ahead in time. For the Moelven Group this mainly concerns transactions with customers and suppliers, in addition to trading in financial derivatives and deposits in banks and financial institutions. As a general rule, the group only enters into financial transactions with financial institutions that participate in the long-term financing of the group. None of these has a credit rating poorer than A with the major credit rating agencies. The group has corresponding principles in relation to bank deposits and purchasing of financial services. In accordance with the group s financial policy, credit is only given against satisfactory security. This mainly means credit insurance or warranties, but letter of credit, advance payments and offsetting are also used. The group s framework agreements for credit insurance and guarantees are with counterparties recognized in the market and with an A credit rating. In certain cases it is not possible to obtain satisfactory security for credit sales. A function has therefore been established for determining internal credit limits and follow-up of credit sales. Of the group s total capitalized receivable, the use of the various forms of hedging against credit risk are distributed as follows: Credit insurance approx. 60% Guarantees approx. 8-10% Cash advances, offset agreements,etc. approx. 25% Letters of credit, etc. < 1% Unsecured acc, credit policy < 1% Other approx. 4-6% 5.2 Risk related to asset management The Group s goals for asset management are: - To ensure the basis for continued good operations to contribute a satisfactory and predictable return for the owners. - To ensure sufficient financial room for maneuver to achieve the established targets of profitable growth and development of the Group. - To keep capital costs as low as possible. The rule of thumb in the group s dividend policy indicates that a cash dividend corresponding to 50 per cent of net profit, albeit a minimum of 40 øre per share. Considerations to the company s financial position and other capital sources must always be satisfactorily maintained. The equity ratio goal is a minimum of 40 per cent, a level that is appropriate in light of the economic fluctuations that have been seen in recent years. In addition, Moelven's operations have a seasonal requirement for working capital that cause great variations in the equity ratio. The Group has an objective of a debt ratio of 0.50 for a normal seasonal balance. In accordance with the current loan agreement, the debt ration cannot exceed The debt ratio is calculated by dividing net interest-bearing debt by equity. NOK million Interest-bearing debt ,033.5 Interest-bearing assets Net interest-bearing liabilities ,026.9 Total equity 2, ,813.4 Liabilities/equity
105 Note 6 - Operating segments 6.1 Main figures for the group and operating segments Criteria for division The divisions are divided in accordance with Moelven's three core activities: Timber (industrial goods), Wood (construction materials) and Building Systems (projects). There is also a division named "Other" in which the remaining units are placed. The divisions are built up around independent subsidiaries with activities clearly defined within the divisions. All transactions between the divisions are conducted on normal commercial terms. The split into divisions differs from the formal legal ownership structure. Group management represents the group's decision maker. The operating segments are managed by their peculiarity. The segments are divided in accordance with who the customers are. Timber has mainly industrial customers, Wood has mainly end users and building product chains as customers and Building Systems has customers in the contracting sector. The others are the remaining companies, mainly the parent company, timber supply and bioenergy. In Timber and Wood especially, there is a great deal of collaboration between segments, but there are internal transactions between all four segments. Transactions between the segments are agreed on the arm's length principle. Income from customers outside the segment is reported to group management according to the same principles as the consolidated income statement. Group management is mostly focused on the following key figures: Sales income, profit margins, net operating capital, employed capital and returns on employed capital, interest-bearing debt and investments. In addition, the development of sickness absence and injury statistics is carefully monitored. The accounting principles that form the basis for segment reporting are the same as those used for consolidated accounting and are described in note 3. Principal figures Konsern Timber Wood Building Systems Other Amounts in NOK million Sales to external customers 10, , , , , , , , ,006.9 Sales to internal customers , ,382.0 Operating revenues 10, , , , , , , , , ,388.9 Gross operating profit (EBITDA) Depreciation and impairment Operating profit Income from associates Financial income Value change financial instr Financial costs Profit before tax Operating margin in per cent 3.9 % 2.9 % 4.7 % 1.8 % 4.1 % 4.5 % 4.0 % 3.2 % -1.0 % -1.0 % Cash flow from operating profit Fixed assets 1, , Inventory 1, , Accounts receivable 1, , Accounts payable Projects net Net operating capital (% of operating revenues) 19.2 % 20.2 % 17.5 % 16.3 % 27.4 % 27.6 % 11.3 % 12.5 % 1.4 % 4.9 % Total assets 5, , , , , , , , , ,453.6 Interest bearing liabilities , Interest free liabilities 2, , Capital employed 2, , , , , , ,890.5 Return on capital employed 14.2 % 9.9 % 14.3 % 4.6 % 9.3 % 10.3 % 17.8 % 14.4 % -0.4 % -0.2 % Equity 2, , , , ,044.8 Equity ratio 41.5 % 38.0 % 48.7 % 50.3 % 42.8 % 43.3 % 44.1 % 41.9 % 50.0 % 42.6 % Investments Number of full-time equivalents 3, , , , , , Sick leave in % 5.6 % 5.6 % 4.7 % 5.0 % 5.1 % 5.0 % 6.3 % 6.5 % 2.9 % 3.3 % H1 value
106 Reconciliation between reported segments operating revenues, profit before tax, assets and liabilities and other significant conditions Operating revenues Operating revenues for reported segments 14, ,556.2 Elimination of internal transactions -3, ,246.5 Consolidated operating revenues 10, ,309.7 Profit before tax Annual profit from reported segments Elimination of internal transactions Consolidated profit before tax Assets Total assets from reported segments 8, ,825.5 Elimination of internal transactions -3, ,058.7 Consolidated total assets 5, ,766.8 Liabilities Total liabilities from reported segments 4, ,368.7 Elimination of internal transactions -1, ,415.3 Consolidated total liabilities 2, , Geographical segments The presentation of geographical segments shows operating revenues based on the geographical location of the customers. Operating revenues Amounts in NOK million Norway 4, ,016.5 Sweden 4, ,406.4 Denmark United Kingdom Germany Other Europe Asia Africa Other countries Total 10, ,309.7 No customers represents more than 10 % of income. Presentation of number of employees, fixed assets, employed capital and investments is shown based on geographical location of the assets. Number of Fixed Assets Capital employed Investments Amounts in NOK million Norway 1,662 1, , , Sweden 1,856 1, , , Denmark England Germany Netherlands Internal -1, ,144.0 Total 3,546 3,492 1, , , ,
107 Note 7 - Sales income Amounts in NOK million Sale of goods 6, ,955.4 Sale of services - service contracts Income from construction contracts 3, ,229.1 Sales income 10, ,273.8 In sales income for the group, internal deliveries and services between the group companies amounting to NOK 6,540 million have been eliminated (NOK 6,365 million). Note 8 - Fixed assets Amounts in NOK million Plots Buildings and other property Machinery and plant Fixtures and fittings, tools etc. Total Acquisiton value as at , , ,176.4 Acquisitions Disposals Transfers Translation differences Acquisiton value as at , , ,350.3 Accumulated ordinary depreciations , ,411.4 Disposals accumulated depreciations Depreciation and write downs for the year Accumulated ordinary depreciations , ,713.0 Book value , ,765.2 Book value , ,637.2 Acquisiton value as at , , ,350.3 Acquisitions Disposals Transfers Translation differences Acquisiton value as at , , ,760.7 Accumulated ordinary depreciations , ,713.0 Disposals accumulated depreciations Depreciation and write downs for the year Accumulated ordinary depreciations , ,998.1 Book value , ,637.3 Book value , ,762.5 Ordinary depreciation rates are given in note Impairment The result for 2017 were impacted by an impairment loss of NOK 17.6 million as a result of the restructuring of Moelven Norsälven AB. The result for 2016 were impacted by an impairment loss of NOK 16.5 million as a result of the restructuring of Moelven Tom Heurlin AB.The impairment of the cash-generating entity's value is entirely recognized in profit and the recoverable amount is estimated to be the value in use. Temporarily out of order For 2017 there is a facility to book value of NOK 3.5 million temporarily out of service. The plant is not impaired as the entry into service is assessed on an on-going basis. 107
108 Note 9 - Leasing Operating leases The group recognised expenses of NOK 12.2 million in relation to operating leases in The equivalent expense in 2016 was NOK 18.4 million. Minimum lease payments relating to operating leases year year years years years years 23.7 > 5 years 19.6 > 4 years 20.7 Total Financial leases Leases where control and substantially all the risks have been transferred to the group are classified as finance leases. Further information are given in note 3. Minimum lease payments relating to finance leases year year years years years years 2.6 > 5 years 0.4 > 4 years 2.0 Total Capitalized value of leased assets Note 10 a - Intangible assets Beløp i NOK mill. Goodwill Other intangible assets Total Acquisiton value as at Acquisitions Disposals Transfers Translation differences Acquisiton value as at Accumulated ordinary depreciations Disposals accumulated depreciations Depreciation and write downs for the year Accumulated ordinary depreciations Book value Book value % 20 % Acquisiton value as at Acquisitions Disposals Transfers Translation differences Acquisiton value as at Accumulated ordinary depreciations Disposals accumulated depreciations Depreciation and write downs for the year Accumulated ordinary depreciations Book value Book value Ordinary depreciation rates in per cent 0 % 20 % 108
109 Note 10 b - Impairment test of goodwill As of 31 December 2017 goodwill in the group entered on the balance sheet amounted to NOK 13.3 million. This is linked to the acquisitions of Sør-Tre Bruk AS, Granvin Bruk AS and Eco Timber AS that were completed in These three acquired companies are all in the Wood division and it is the division's operation that is deemed to be the cash flow generating group that goodwill shall be tested against. Amounts in NOK million Book value of goodwill: Sør-Tre/Granvin/Eco Timber Other units Total Goodwill is tested at the level monitored by group management, which means that there are groups of cash flow generating units (CGUs). The recoverable amount of CGU is determined based on an assessment of the division's value in use. Value in use is estimated by discounting expected future cash flows after tax, discounted at an appropriate discount rate after tax that takes into account maturity and risk. The projections of cash flows based on budgets approved by management for the first four years. The cash flows are arrived at by taking the historical figures for the CGUs as a basis, but with an allowance for an expected moderate growth in the total market, Moelven's market share and the prices of the products. In management's opinion it is reasonable to assume that considerable development of new products and technologies will occur in these areas. Net expectations for operating margins are improvements. When it comes to fixed assets and production capacity, the management believes that these have the capacity needed to handle future growth. After four years, it is placed a conservative estimate of 2.5 per cent nominal growth in net cash flows. In the terminal period, investments and depreciation equal. The rate used for discounting cash flows is 8,0 per cent. This is based on a risk-free rate of 1,6 per cent, an added risk premium of 5.9 per cent, an equity beta of 1.2 and a liquidity premium of 3.0 per cent. In addition this is weighted up against the long-term borrowing rate of 3.2 per cent. The risk premium is based on observations of comparable companies. There was no write down of goodwill in either 2017 or In 2016, a company with a recorded goodwill of NOK 3.6 million was sold from Buildings Systems. Maximum exposure to possible write down of goodwill is NOK 13.3 million. We have calculated sensitivity for the write down assessments, and a 5.5 per cent change in discount rate would lead to write down of the goodwill in the Wood division in the consolidated accounts. Segments - Groups of cash-generating units (CGU): Amounts in NOK million Goodwill at Sales/ Goodwill at year end impairment year end Sales/ impairment Timber Wood Building Systems Total goodwill
110 Note 11 Payroll expenses, employees and remuneration to auditor 11 a Payroll expenses Amounts in NOK million Payroll cost 1, ,673.9 Social security cost Pension costs - contribution-based pension schemes Pension costs - defined-benefit pension schemes Total 2, , b Number of employees Average number of employees in 2017 was 3,536 and in 2016 it was 3,521. Moelven had 3,546 employees at the end of 2017 compared to 3,492 employees at the end of c Remuneration to auditor Amounts in NOK million, paid during the financial year Legally required audit Other attestation services Tax consultancy Other, non auditing services Total Note 12 - Financial income and costs Amounts in NOK million Financial income Financial costs Financial income Interest income from financial assets* Foreign currency gains Other financial income Value increase of financial instruments to fair value Total financial income Financial costs Interest costs of financial liabilities* Interest costs on long term financial liabilities* Foreign currency losses Other financial costs Value reduction of financial instruments to fair value Total financial costs Net financial items * measured at amortized cost 110
111 Note 13 - Tax expence Amounts in NOK million Tax payable Deferred tax changes Total tax expences Tax payable for the year Total tax payable Reconciliation of tax calculated against the Group's weighted average tax rate and tax expense as it appears in the Income Statement: Amounts in NOK million Profit before tax Tax calculated with the group's tax rate 19.6 per cent (29.0 per cent) Tax effects of: Difference due to different tax rates Change of tax rate in Norway Contribution from associated companies Permanent differences Other Tax cost on the income statement Weighted average tax rate 21.6 % 29.1 % Amounts in NOK million Tax on items entered against other income and expenses 2017 Before tax Tax costs After tax 2016 Before tax Tax costs After tax Elements not later reclassified to earnings Actuarial gains (losses) on defined-benefit pension schemes Elements that can be later reclassified to earnings Translation differences Other changes Other income and expenses during the period (after tax)
112 Note 14 - Deferred tax Deferred tax benefits and deferred tax are netted when there is a legal right to give and receive group contribution between the entities. The table below shows the basis that has resulted in recognised deferred tax benefits and deferred tax Assets and obligations with deferred tax consist of: Amounts in NOK million Temporary differences Asset reserves Inventory Cost provisions Other short-term temporary differences Sub-total short-term differences Fixed assets Profit and loss account Pension funds Pension commitments Other long-term items Sub-total long-term items Tax-assessed loss carry-forward Net temporary differences Deferred tax asset Deferred tax Net deferred tax Assets with deferred tax from loss carry-forward Amounts in NOK million Norway Sweden Denmark Total deferred tax benefit from loss carry-forward The group has no recorded deferred tax regarding carry-forward losses in other countries than Norway Analysis of deferred tax through the year Amounts in NOK million Net deferred tax obligation 1 January Included on income statement Other income and costs pensions Included in equity Translation differences and other Net deferred tax obligation 31 December
113 Note 15 - Other shares The company s share capital Number of shares owned by Moelven Total face value Book value Amounts in NOK million Holding % Owned by Moelven Industrier ASA: Various shares 31 Total Moelven Industrier ASA 31 Owned by other group companies Transportfellesskapet Østlandet AS 25.0 % Transportselskapet Nord AS 12.5 % Svenskt Limträ AB 33.0 % SEK SEK Others 228 Total others 469 Total group 500 Note 16 - Investments in associated companies Amounts in NOK million Book value as ate Proportion of annual profit Additions Disposals Translation differences Proportion of other income and expenses Book value as at Amounts in NOK million 2016 Home country Assets Liabilities Income Profit Book value Name Weda Skog AB 1) Sweden % Woodtrans AS Norway % Home country Assets Liabilities Income Profit Book value Shareholding Shareholding Name Weda Skog AB 1) Sweden % Woodtrans AS Norway % ) The company has deviating accounting with balance sheet date The result of four months will be insignificant for Moelven Group. It is therefore not prepared any interim balance. 113
114 Note 17 - Inventory Amounts in NOK million Raw materials and purchased semi finished goods Goods in processing Finished own products Prepayments to supplier Total inventory 1, ,464.1 Amounts in NOK million Inventory valued at acquisition cost 1, ,058.9 Inventory valued at fair value Total inventory 1, ,464.1 Write down of inventory to fair value in 2017 is included in profit and loss with NOK 16.9 million. The equivalent value in 2016 was NOK 18.0 million. The book value of inventories pledged as security in 2016 was NOK 1.1 million. The loan was redeemed in Note 18 - Accounts receivable and other receivables Amounts in NOK million Note Accounts receivable Accounts receivable gross 1, ,241.6 Provision for loss on accounts receivable Earned not invoiced Accounts receivable entered on the balance sheet 1, ,358.5 The year's confirmed losses on receivables Changes in provision for loss Losses on receivables on income statement Other receivables VAT in credit Other receivables Total other receivables Part of the outstanding receivables is secured in the form of bank guarantees or other forms of security. There is not considered to be any credit risk associated with public sector customers. Refer to note 5 on financial risk. Other receivables consist of other deferred income, prepayments and operations-related items. The groups accounts receivable are mainly secured through credit insurance. Currency breakdown of accounts receivable before provision for loss Amounts in NOK million NOK SEK EUR DKK GBP Other currencies Total 1, ,241.6 Age distribution of outstanding accounts receivable Amounts in NOK million Accounts receivable within credit terms 1, Under 30 days beyond due date to 60 days beyond due date to 90 days beyond due date to 180 days beyond due date Over 180 days beyond due date Total 1, ,
115 Note 19 - Projects in progress Amounts in NOK million Note Distribution of sales Project sales 3, ,229.1 Service contracts Sale of goods Total 3, ,632.0 Projects in progress entered on the income statement *) Accumulated income 1, ,462.8 Accumulated accrued expenses 1, ,256.5 Accumulated contributions Loss projects in progress **) Earned not invoiced income Prepayments from customers Deferment of costs (+ liability/ - receivable) *) Projects in production, not handed over to customer **) Anticipated losses on these projects have been entered on the income statement For projects that are directed by outside companies, invoicing is performed monthly with 30 day payment terms. Invoicing is normally done in line with the completion of the work, but there are also payment schedules that do not correspond to progress. For projects, both income and costs are scheduled. Income that has been earned but not yet invoiced is entered under the item "Completed, not invoiced". Invoiced income that has not yet been earned (forward payment plans) is entered under the item "Prepayments from customers" under other short term liabilities, see note 25. Only one of these items is used per project. Thus each project shows either a net receivable for the customer or a net liability to the customer. Scheduling of costs (accrued, not entered) is recognised as trade accounts payable, while provisions for claims activities on concluded projects are entered as claims provisions etc. Note 20 - Cash and cash equivalents Amounts in NOK million Bank deposits Unused drawing rights , Restricted bank deposits Cash and cash equivalents , Note 21 - Earnings per share and equity per share Earnings per share Earnings per share is calculated by dividing the share of the annual profits allocated to the company s shareholders by a weighted average of the number of ordinary shares issued over the year, less own shares Annual profit assigned to Moelven s shareholders Average number of shares Earnings per share Equity per share Equity per share is calculated by dividing the share of equity assigned to the company s shareholders by a weighted average of the number of ordinary shares issued over the year, less own shares Total equity assigned to owners of parent company 2, ,806.6 Average number of shares Equity per share
116 Note 22 - Group companies The following companies are included in the Group. The list is group according to division structure. Book value shows the book value in the separate financial statement of the owner of the company. Amounts in NOK 1,000 Holding % The company's share capital Number of shares in Moelven's ownership Book value Organization number Timber Moelven Våler AS 100 % 48,000 4,800 48,005 * 982,793,076 Moelven Numedal AS 100 % 10,000 1,000 10,005 * 982,792,991 Moelven Løten AS 100 % 12,000 1,200 12,005 * 982,792,932 Moelven Mjøsbruket AS 100 % 12,000 12,000 15,990 * 935,944,562 Moelven Telemarksbruket AS 51.0 % 14, ,550 * 983,188,397 Moelven Valåsen AB 100 % 50,000 SEK 500, ,940 ** Moelven Dalaträ AB 100 % 20,000 SEK 200,000 54,978 ** Moelven Nössemark Trä AB 100 % 300 SEK 3,000 26,211 ** Moelven Årjäng Såg AB 100 % 300 SEK 3,000 49,980 ** Moelven Notnäs Ransby AB 100 % 3,250 SEK 650,000 66,973 ** Moelven Norsälven AB 100 % 3,500 SEK 35,000 19,992 ** Moelven Component AB 100 % 2,580 SEK 25,800 7,793 ** Moelven Profil AS 100 % 15,000 15,000 15,030 * 997,404,165 UJ-Trading AB 100 % 1,500 SEK 15,000 8,996 ** Moelven U.K. Ltd 100 % 950 GBP 950,000 10,426 * Moelven Deutschland GmbH 100 % 110 EUR * Moelven Nederland B.V. 100 % 36 EUR * 32,123,165 Moelven Polska sp.z.o.o 100 % 450 PLN 9,000 1,068 * - Wood Moelven Wood AS 100 % 5,500 5,500 10,000 * 941,809,030 Moelven Wood AB 100 % 9,000 SEK 90,000 15,031 ** Moelven Van Severen AS 100 % 35,000 3,500 35,005 * 982,793,068 Moelven Østerdalsbruket AS 100 % 20,000 2,000 20,005 * 982,793,041 Moelven Soknabruket AS 100 % 30,000 3,000 32,511 * 982,793,017 Moelven Langmoen AS 100 % 18,000 1,800 37,156 * 882,792,862 Moelven Eidsvoll AS 100 % 8, ,500 * 951,278,017 Moelven Treinteriør AS 100 % 3,500 3,500 8,482 * 910,888,471 Moelven Danmark A/S 100 % 5,000 DKK 50,000 12,417 * 11,932,371 Moelven Are AS 100 % ,116 * 839,265,832 Moelven Eidsvold Værk AS 100 % 32,500 32,500 35,578 * 937,577,087 Moelven Trysil AS 100 % 15,600 15,600 35,634 * 984,029,497 Moelven Sør Tre AS 100 % 8,487 8,487 50,000 * 835,259,072 Moelven Granvin Bruk AS 99.3 % 1,490 2,959 16,672 * 881,146,312 Moelven List AB 100 % 5,500 SEK 55,000 22,025 ** Moelven Wood Interiör AB 100 % 3,800 SEK 38,000 68,273 ** Moelven Valåsen Wood AB 100 % 20,100 SEK 201,000 28,376 ** Moelven Edanesågen AB 100 % 4,000 SEK 4,000 77,895 ** Moelven Lovene AB 100 % 5,000 SEK 50,000 6,997 ** Moelven Vänerply AB 100 % 20,000 SEK 5,000 19,992 ** Moelven Wood Prosjekt AS 100 % 300 3,000 11,000 * 982,680,913 Moelven Malmö Holding AB 100 % 2,580 SEK 2,580 15,496 ** Moelven Multi3 AS 100 % 3,425 NOK 6,850 7,192 * 993,797,
117 Note 22 - Group companies (cont.) Amounts in NOK 1,000 Holding % company's Moelven's ownership number Building Systems Moelven Limtre AS 100 % 11,000 11,000 43,028 * 913,711,300 Moelven Töreboda AB 100 % 12,000 SEK 120,000 47,981 ** Moelven ByggModul AS 100 % 31, ,440 89,299 * 941,809,219 Moelven Byggmodul Hjellum AS 100 % 4,206 50,001 60,585 * 927,486,210 Moelven Byggmodul AB 100 % 5,000 SEK 50,000 89,964 ** Moelven Modus AS 100 % 22,000 2,200 95,000 * 951,269,778 Moelven Modus AB 100 % 4,000 SEK 40,000 45,582 ** Moelven Elprosjekt AS 100 % 10,000 50,000 12,000 * 980,342,182 Moelven Elektro AB 100 % 100 SEK 1,000 2,099 ** Others Moelven Industrier AB 100 % 197,046 SEK 19,704, ,406 * Moelven Skog AB 100 % 5,000 SEK ,990 ** Moelven Virke AS 100 % 5,000 50,000 4,546 * 975,924,955 Moelven Bioenergi AS 100 % 6,000 6,000,000 6,800 * 990,041,881 Vänerbränsle AB 82.3 % 336 SEK 2,613 2,806 ** Skåre Kontorshotell AB 100 % 100 SEK 1, ** Moelven Portefølje AS 100 % 1,000 1,000 1,155 * 982,792,835 *) Company owned by Moelven Industrier ASA **) Company owned by Moelven Industrier AB 117
118 Note 23 - Pension costs and pension commitments Pension schemes The pension funds and commitments on the balance sheet mainly relate to the group's Norwegian companies. Secured schemes The group's defined benefit scheme regarding the Norwegian companies was ended in New employees will be affiliated a contributions based pension scheme. The contribution scheme include a risk coverage in case of disability. The Group is required to have an occupational scheme by legislation on compulsory occupational pensions. The pension schemes fulfil the requirements of this legislation. Unsecured schemes Unsecured schemes relate to guaranteed pension liabilities. These are calculated in accordance to IFRS pension costs. There are no unsecured pension commitments that have not been included in the calculation mentioned above. The remaining pension commitments in balance sheet, are related to agreed arrangements for a small number of previous and current employees. A new AFP scheme from 01 January 2011 for the Group's Norwegian companies All employees in the Norwegian companies in the group should be comprised by the right to early retirement (AFP), early retirement schemes in the private sector from the age of 62 if they fulfil the requirements of this scheme. The new AFP scheme which came into force in 2011 is defined as a defined-benefit multi-employer plan, but accounted for as a defined contribution scheme until reliable and sufficient information enabling the companies to account for its proportionate share of pension costs, pension obligations and pension funds in the scheme. The company's obligations related to the new AFP scheme is therefore not recorded as a liability. The group's foreign companies Many of the group's foreign companies offer their employees pensions based on agreed individual contribution-based pension schemes. In Sweden, most employees are covered by a collective occupational pension agreement. The scheme is defined as a multiemployer plan. Salaried staff born before 1979 are included in an individual occupational pension scheme that is also defined as a defined benefit plan. Because of the difficulty of reliably measuring the benefit level of these plans, there is insufficient information on an individual basis to enter the plans in the accounts as defined benefit schemes. The plans are accounted for as if they were contribution-based, in accordance with good accounting practice. Salaried staff born after 1979 are included in an occupational pension scheme that is premium based and is therefore treated in the accounts as contribution-based Economic and actuarial assumptions The following economic assumptions have been made: Return on pension funds 0.00 % 2.10 % Discount rate 2.30 % 2.10 % Annual pay increase 2.50 % 2.25 % Annual G adjustment (National Insurance Scheme's amount) 2.25 % 2.00 % Annual adjustment of pensions being paid 2.25 % 2.00 % Average employer's contribution factor % % Pension commitments entered in the accounts Amounts in NOK million Present value of the secured pension commitments Present value of the unsecured pension commitments Total present value of pension commitments Fair value of pension funds Net pension liability outside Norway Pension commitments entered In the balance sheet the pension commitments are entered gross with the following amounts: Net pension funds Pension liabilities
119 23.3 Pension costs Amounts in NOK million Pension entitlements accrued in the year Administration costs 0,0 0,0 Change in pension plans 0,0 0,0 Net financial costs/income Pension costs secured and unsecured defined benefit schemes Contribution pension costs and other pension costs Pension cost (net) entered on the income statement Note 24 - Provisions Guarantee liability on projects Guarantee provisions Guarantee provisions as at Used during the year Reversed during the year New provisions during the year Guarantee provisions In the balance sheet the guarantee obligation is entered with the following Amount in the balance sheet Guarantee Amount in the balance sheet Guarantee Other provisions Other short term liabilities Other guarantee liability Loan guarantees/financial guarantees Loans with mortgages were redeemed in Moelven Industrier is operating business that can effect the external environment. Moelven performs periodical mapping of the environmental effect of our production. Based on these mappings, Moelven has assessed that the recognition criteria of a reliable estimate is not fulfilled. There is therefore not recognized any provisions regarding environmental effects. Note 25 - Other short-term liabilities Other short term liabilities Note Prepayments from customers Accrued holiday pay Bonus provisions Accrued costs and other short term liabilities Total other short term liabilities Prepayments from customers relates to invoiced income on projects that has not been earned (invoiced, not performed). Refer to note 19 Projects. 119
120 Note 26 - Financial instruments 26.1 Book value of financial assets and obligations by category Financial assets Amounts in NOK million Assets Recognized at fair value Book value Level 1* Level 2* Level 3* Total fair value Accounts receivable Other receivables Financial instruments - currency derivative Fin. instr. - emb. cur. derivative in hedg. of el.power Financial instruments - power derivative Bank deposits etc Investments in equities Total 1, ,673.9 *Description is presented on the next page Financial obligations Amounts in NOK million Assets Recognized at fair value Book value Level 1 Level 2 Level 3 Total fair value Liabilities to credit institutions Financial leases Other long term liabilities Financial instruments - currency derivative Fin. instr. - emb. cur. derivative in hedg. of el Financial instruments - interest derivative Payables Overdrafts Total Financial assets Amounts in NOK million Assets Recognized at fair value Book value Level 1 Level 2 Level 3 Total fair value Accounts receivable Other receivables Financial instruments - currency derivative Fin. instr. - emb. cur. derivative in hedg. of el.power Financial instruments - power derivative Bank deposits etc Investments in equities Total 1, ,585.3 Financial obligations Amounts in NOK million Assets Recognized at fair value Book value Level 1 Level 2 Level 3 Total fair value Liabilities to credit institutions Financial leases Other long term liabilities Financial instruments - currency derivative Fin. instr. - emb. cur. derivative in hedg. of el Financial instruments - interest derivative Payables Overdrafts Total
121 26.1 (Cont.) Level 1: Listed price in an active market for an identical asset or liability. Level 2: Valuation based on observable factors other than listed price (used in level 1) either directly or indirectly derived from prices for the asset or liability. Assets and liabilities valued according to this method are mainly financial instruments for hedging future cash flows in foreign currency, interest and electricity. Market value is the difference between the financial instrument's value according to the signed contract and how a similar financial instrument is priced at the balance sheet date. The balance sheet market prices are based on market data from Norges Bank, the ECB, Nasdaq OMX and the financial contract counterparty. Level 3: Valuation based on factors not obtained from observable markets (non-observable assumptions). The valuation method is used to a very small extent and only for unlisted shares. Since market value is not available, the expected future cash flow from the shares is used as an estimate Nominal value of financial derivatives As of 31 December Amounts in NOK million Interest rate derivatives Maturing under 1 year Maturing 2-5 years Maturing 6-10 years Total Currency derivatives, forward contracts for sale of foreign currency Maturing 0-6 months Maturing 7-12 months Maturing >12 months Total Currency derivatives, forward contracts for purchase of foreign currency Maturing 0-6 months Maturing 7-12 months Maturing >12 months Total Power derivatives Maturing less than 1 year Maturing 1-2 years Maturing 3-4 years Total Power derivatives accounted according to IAS 39 as purchase for own use* Maturing less than 1 year Maturing 1-2 years Maturing 3-4 years Total The table shows the nominal gross value in NOK. Sales of foreign currency is sales against NOK and SEK. Calculation of nominal value in NOK is done by using the nominal value of SEK converted to NOK by using the balance sheet date rate. Acquisitions of foreign currency are mainly sales of SEK against NOK and SEK against EUR. Power contracts are bought forward contracts for electricity. *The market value of power derivatives for own consumption was NOK 8.4 million in 2017 and NOK 5.9 million in
122 Note 27 - Share capital and share premium reserve The last capital increase was in 2004 when Moelven aquired the Are Group. The share capital was increased by NOK 52.5 million. Shareholders Number of shares shares in per cent Glommen Skog SA Norway 37,692, % Eidsiva Vekst AS Norway 30,803, % Felleskjøpet Agri SA Norway 20,535, % Viken Skog SA Norway 15,378, % Mjøsen Skog SA Norway 15,221, % AT Skog SA Norway 9,442, % 6 largest owners 129,073, % Other 896 shareholders 468, % Total 902 shareholders 129,541, % Summary of shareholders as at Summary of shareholders as at Number of shares 129,542,384 Number of shares 129,542,384 Number of own shares 1,100 Number of own shares 1,100 Number of voting shares 129,541,284 Number of voting shares 129,541,284 Face value NOK 5,- Face value NOK 5,- Share capital 647,711,920 Share capital 647,711,920 Number of shares on average 129,541,284 Number of shares on average 129,541,
123 Note 28 - Remuneration to group management, board and corporate assembly 28.1 Shares in Moelven Industrier ASA owned by members of the group management, board and corporate assembly The Corporate assembly Deputy members The board of Directors Group Executive Board Egil Magnar Stubsjøen 0 Gudmund Nordtun 0 Olav Fjell 0 Morten Kristiansen 500 Terje Uggen 0 Erik A. Dahl 0 Trond Stangeby 0 Anders Lindh 0 Maren Kyllingstad 0 Anne Sagstuen Nysæther 0 Elisabeth Krokeide 0 Bjarne Hønningstad Thor Svegården 0 Leif Henning Asla 0 Aud Ingvild Storås 0 Marcus Johansson John Arne Ulvan 0 Jan Kollsgård 0 Asbjørn Bjørnstad 0 Olav A. Veum 0 Anders Roger Øynes 0 Martin Fauchald *) 0 Group shared services Gudbrand Gulsvik 0 Tor Henrik Kristiansen 0 Lars Håkan Karlsson *) 0 Morten Sveiverud Rolf Th. Holm 0 Thorvald Grini 0 Even Rognan Lutnæs 0 Trond Sønes *) 0 Kim Arne Fjeld 0 Deputy members John Inge Lorentsen *) 0 Leif Bjarne Undem *) 0 Terje Johansen 0 Ann-Christine Löfborg *) 0 Ove Gunarsson *) 0 Ingrid Therese Tjøsvold 0 Lennart Perez *) 0 Jonas Andersson *) 0 Iver Melby *) 74 Jan Peter Olsson *) 0 Ole Magnus Vinna *) 0 *) Employee's representatives Keio Wedin *) Declaration of determination of remuneration for the Group Executive Board Background In accordance with section 6-16a of the Public Limited Company Act, the board of Moelven Industrier ASA has prepared a declaration on the fixing of pay and other remuneration for senior executives within the group. The declaration, which was adopted by the general meeting of 26 April 2016, has been the guideline for the 2016 financial year. An identical declaration, which will be presented to the general meeting of 26 April 2017, will be the guideline for the 2017 financial year. The following persons are involved The declaration covers the group management of Moelven Industrier ASA. Group management means the CEO and the heads of the divisions. General Moelven shall have a level of pay and other terms of employment that is necessary in order to be able to keep and recruit managers with good competence and the capacity to achieve the objectives that are set. Salary Moelven's main principle is that senior executives shall have fixed salary. Salary is adjusted annually, normally with effect from 1 July. Other benefits in kind Moelven shall have other benefits, in the form of free car, free newspapers and free telephony for example, where this makes work easier and is deemed to be reasonable in relation to general practice in the market. Bonuses and other variable elements of the remuneration Over and above the main principle of fixed pay, the board wishes it to be possible to offer other variable forms of remuneration in cases where this is found to be appropriate. Bonuses may be used to a limited extent and by special agreement and shall be directly dependent on operating profit. Remuneration linked to shares etc. Moelven has no form of remuneration for companies within the group that is linked to shares or the development of the share price, including shares, subscription rights and options. In the event of the establishment of such a scheme, it shall cover a large number of employees and such remuneration shall represent a smaller proportion than the fixed pay. Pension schemes Moelven shall have pension conditions that are on a level with the general market in the home country. New employees shall join contributory pension schemes. Pay after termination of employment In the event of immediate termination of employment by the company, management shall as a standard be entitled to pay for 18 months, less pay earned by any new employer during this period. Previous financial years Management pay policy in previous financial years has been in line with the content of this declaration. The board reserves the right to deviate from these guidelines if there are serious grounds for doing so in individual cases. If the board should deviate from these guidelines, their reasons for doing so must appear in the minutes of the meeting. 123
124 28.3 Remuneration to senior executives etc Pension Other Pension costs benefits Salaries costs Other benefits Amounts in NOK 1,000 paid during the financial year Salaries Remuneration to: CEO Morten Kristiansen 4, , Managing Director Timber, Anders Lindh - from , Managing Director Timber, Ole Helge Aalstad - until , Managing Director Wood, Bjarne Hønningstad 2, , Managing Director Building Systems, Marcus Johansson 1, , Total 10, , , , On termination of employment, the President and CEO and the Managing Directors of Timber and Wood have 18 month's pay after termination, less pay from new position/employer. The Managing Director of Building Systems has a similar agreement for 6 months Remuneration to the board and corporate assembly Amounts in NOK 1,000 paid during the financial year Remuneration to the board of Directors 1, ,256.5 Remuneration to the corporate assembly The chairman of the board of directors receives NOK 515,000 and the board members NOK 123,600 in annual remuneration. Deputy members of the board receive NOK 5,700 per meeting. The chairman of the corporate assembly receives NOK 61,800 in annual remuneration. The members and deputy members of the corporate assembly receive NOK 5,700 per meeting. Note 29 - Shareholders' agreement and related parties 29.1 Shareholders' agreement The share capital of Moelven Industrier ASA consists of 129,542,384 shares with a face value of NOK 5 and there is only one share class. In total the shares are distributed among 934 shareholders, of which the six largest, Eidsiva Vekst AS, Felleskjøpet Agri SA and the forest owner cooperatives Glommen Skog SA, Mjøsen Skog SA, AT Skog SA and Viken Skog SA, control a total of 99.6 per cent. There is several shareholders' agreements between these shareholders. Among other things, this shareholders' agreement has clauses that determine that the company shall be run as an independent unit with a long-term perspective and with continued focus on Scandinavia as the main market. The agreement also contains clauses regarding the composition of the board, dividend policy, strategic focus areas and share transfer Related parties Transactions with the owners are performed in some areas of the ordinary activities. Among other things, this relates to purchase of timber, where the Norwegian forest owner cooperatives are suppliers. There will also be deliveries of biofuel from the Moelven group to a bioenergy plant owned by Eidsiva Energi AS, with possible buy-back of bioenergy for Moelven's industries in connection with the energy plant. Also, Eidsiva Energi Marked AS sells electric power to Moelven's Norwegian industrial operations. All these transactions have in common that the arm's length principle shall be applied. Where other suppliers can offer better prices or terms, these will be used. About 45 per cent of Moelven's total purchasing requirement for timber of 4.2 million cubic metres comes via the Norwegian forest owner cooperatives. Moelven' supply of energy raw materials to Eidsiva's bioenergy plant represents between 40 and 50 GWh on an annual basis, while buying back energy represents between 20 and 30 GWh. Net delivery of energy raw materials is 20 GWh. The extent of the sale of electrical power corresponds to about 40 per cent of Moelven's total consumption of about 230 GWh. Moelven has a long tradition of running its operations in accordance with all the laws and ethical guidelines of the industry and is of the opinion that competition is positive for all parties in industry. In order to ensure that this culture is maintained, ethical guidelines and guidelines for complying with legislation on competition have been devised. Note 30 - Events after the date of balance No subsequent events have taken place that should have any effect on the 2017 annual report. 124
125 Annual accounts for Moelven Industrier ASA Income statement Moelven Industrier ASA Amounts in NOK million Note Other operating revenues Operating revenues Payroll expenses Depreciation on tangible and intangible fixed assets Other operating expenses Operating expenses Operating profit Income from investment in subsidiaries 1) Value increase of financial instruments to fair value Interest income from group companies Other financial income from group companies Other financial income Value reduction of financial instruments to fair value Impairment of financial assets Interest costs to group companies Other interest costs Other financial costs Net financial items Ordinary result before taxes Tax on ordinary result Net profit Dividend distributed, NOK 0.45 per share Allocated to dividend, NOK 0.68 / NOK 0.48 per share To/from other equity Total ) Including group contribution Moelven Industrier ASA 125
126 Balance as at Moelven Industrier ASA Amounts in NOK million Note ASSETS Deferred tax assets Other intangible assets Total intangible assets Land Buildings and other property Machinery and plant Fixtures and fittings, tools, office machinery etc Total tangible fixed assets Investments in subsidiaries 12 1, ,050.6 Investments in associated companies Loans to group companies 15 1, ,276.5 Investments in other shares Other long-term recivables Total financial fixed assets 2, ,333.1 Total fixed assets 2, ,388.8 Accounts receivable Accounts receivable group companies Receivables group contributions/dividend Other receivables Total receivables Financial derivatives Bank deposits, cash etc Total current assets Total assets 2, ,545.7 Moelven Industrier ASA 126
127 Moelven Industrier ASA Amounts in NOK million Note LIABILITIES AND EQUITY Share capital Own shares Share premium reserve Total contributed equity Retained earnings Total equity Pension liabilities Total allowances for liabilities Liabilities to credit institutions Other long-term not interest-bearing debt Total long term liabilities Liabilities to credit institutions Financial derivatives Trade accounts payable Trade accounts payable to group companies Public duties payable Dividends Tax payable Other short term liabilities Total short term liabilities Total liabilities 1, ,767.1 Total equity and liabilities 2, ,545.7 Guarantee liability Number of shares (Face value per share NOK 5.-) ,541, ,541,284 Moelv 14 March 2017 The Board of Directors of Moelven Industrier ASA Olav Fjell Trond Stangeby Elisabeth Krokeide Chairman of the Board Deputy chair Ingvild Storås Asbjørn Bjørnstad Martin Fauchald Lars Håkan Karlsson Morten Kristiansen CEO Moelven Industrier ASA 127
128 Cash flow statement Moelven Industrier ASA Amounts in NOK million Note CASH FLOW FROM OPERATIONAL ACTIVITIES: Ordinary result before taxes Tax paid this year Depreciation Value change investments Correction items - financial derivatives Unpaid pension costs entered as costs and unreceived pension funds entered as income Changes in accounts receivable and other receivables excluding group contribution Changes in trade accounts payable Changes in short-term liabilities excluding borrowing Cash flow from operational activities CASH FLOW FROM INVESTMENT ACTIVITIES: Investment in plant and equipment exc. acquisition Net cash flow from investments in shares Generated funds from mergers Long-term investments, financial Receivables from group contributions / dividends Cash flow from investment activities Profit before tax Changes in short-term loans and overdraft Changes in long-term liabilities Payment of dividend Cash flow from financial activities CASH HOLDINGS Net change in liquidity through year Cash holdings Cash holdings Moelven Industrier ASA 128
129 Note 1 - Accounting principles The annual accounts have been prepared in accordance with the provisions of the Norwegian Accounting Act and with generally accepted accounting principles. 1.1 Use of estimates Management has used estimates and assumptions that have affected the income statement and the valuation of assets and liabilities, as well as uncertain assets and obligations on the date of balance in the preparation of the annual accounts in accordance with good accounting practice. 1.2 Foreign currency Foreign exchange transactions are calculated at the exchange rate prevailing at the time of the transaction. Monetary items in foreign currency are converted to Norwegian kroner by using the rate of exchange on the balance date. Non-monetary items which are measured at historical exchange rates expressed in foreign currency, are converted to Norwegian kroner by using the exchange rate at the time of transaction. Non-monetary items which are measured at fair value expressed in foreign currency are converted to the exchange rate determined at the time of measurement. Exchange rate changes are entered on the income statement as they occur during the accounting period under other financial items. 1.3 Operating revenues The operating revenues consist mainly of division of joint costs among the subsidiaries. Sales are invoiced as the services occur. 1.4 Tax Tax costs consist of payable tax and changes in deferred tax. Deferred tax/tax benefits are calculated on all differences between the company's accounting and tax carrying values of assets and liabilities. Deferred tax is calculated at 23 per cent of the temporary differences between the book and taxable values, as well as tax losses carried forward at the end of the reporting year. Net deferred tax benefits are entered on the balance sheet to the extent that it is probable they can be utilised. Payable tax and deferred tax are entered directly against equity to the extent that the tax entries relate to equity items. 1.5 Classification and valuation of balance sheet items Current assets and short-term debt include items which become due for payment within a year after the date of acquisition and items associated with the goods cycle. Other items are classified as fixed assets/long-term liabilities. Current assets are valued at the lower of acquisition cost and fair value. Short-term debt is recognised on the balance sheet at the nominal amount at the time it is taken out. Fixed assets are measured at acquisition cost, less depreciations and write downs. Long-term debt is recognised in the balance sheet at the nominal amount at the time of establishment. 1.6 Research & Development Research and development expenses are entered on the balance sheet to the extent to which a future financial benefit can be identified that is linked to the development of an identifiable intangible asset, and the expenses can be reliably measured. Otherwise, such expenses are recognised as costs on an on-going basis. Development that is entered on the balance sheet is depreciated on a straight line basis over the financial lifetime. Research expenses are recognised as costs on an on-going basis. 1.7 Tangible fixed assets Tangible fixed assets are entered on the balance sheet and depreciated on a straight line basis over the asset's expected lifetime. Major assets that consist of significant components having different lifetimes are depreciated with different depreciation times for the different components. Direct maintenance of equipment is recognised continuously as an expense under operating expenses, while increased costs or improvements are added to the equipment's price and amortised concurrently. If the recoverable value of the asset is lower than book value, it is written down to recoverable value. Recoverable value is the higher of net sales value and value in use. Value in use is the present value of the future cash flow that the asset is expected to generate. Moelven Industrier ASA 129
130 1.8 Subsidiaries/associated companies Subsidiary and associates are assessed by the cost method in the company accounts. The investment is valued at acquisition cost for the shares unless write down has been necessary. Write down to fair value is been done when the decrease in value is due to causes that cannot be considered to be transitory and where this must be considered necessary according to good accounting practice. Write downs are reversed when the reason for write down no longer exists. Dividends, group contributions and other payments from subsidiaries are entered as revenue during the same year as provision is made for them in the subsidiary's accounts. If the dividend/group contribution exceeds the proportion of earned profit after the date of acquisition, the surplus represents part repayment of invested capital and is deducted from the value of the investment on the parent company's balance sheet. 1.9 Receivables Trade accounts receivable and other receivables are recognised in the balance sheet at their nominal value after deductions for provision for expected loss. Provision for losses is made on the basis of individual assessment of each debt Short-term investments Short-term investments (shares assessed as current assets) are valued at the lower of acquisition cost and fair value on the date of balance. Dividends received and other payments from the companies are entered as other financial income Pensions The company has collective, contribution-based pension schemes. These are schemes with a savings portion and a risk portion with earnings right. Pension premiums are entered as costs as they occur. Defined-benefit pension schemes Of defined benefit plans, the company still have an on-going taxable joint annuity policy valid for a limited number of people Defined-benefit pension schemes are valued at present value of the future pension benefits that have been earned on the date of balance. Pension funds are valued at fair value. Changes in defined-benefit pension commitments that are due to changes in pension plans are distributed over the estimated average remaining earnings period. Estimate changes and changes in financial and actuarial assumptions (actuarial gains and losses) are entered against equity (OCI). The period's net pension costs are classified as payroll and personnel costs Cash flow statement The cash flow statement has been prepared according to the indirect method. Cash and cash equivalents comprise cash, bank deposits, and other short-term liquid investments. Moelven Industrier ASA 130
131 Note 2 - Operating revenues Amounts in NOK million Subsidiaries' proportion of joint costs Subsidiaries' proportion of IT services Rent income - outside the group Rent income - inside the group Other Total other operating income In accordance with the company specification under note 15, a total of NOK million is operating income from our subsidiaries. Total Norwegian operating income amounts to NOK 48.4 million, Swedish NOK 53.1 million and Danish company NOK 0.7 million. Note 3 - Tax Amounts in NOK million Tax expense for the year Recognized tax on ordinary income: Total tax payable Changes in deferred tax from income statement Tax expence Taxable income: Ordinary result before taxes Permanent differences Actuarial losses entered against OCI Changes in temporary differences Use of tax loss carry forwards Taxable income: Tax payable in the balance sheet Tax on income Tax payable on received group contribution Tax payable in the balance sheet Calculation of effective tax rate Ordinary result before taxes Calculated tax on ordinary result before taxes Tax effect of permanent differences Effect on deferred tax from change in tax per cent from 24 % to 23 % Total Effective tax rate 7.2 % 27.1 % Tax effect of temporary differences and carried forwards giving rise to delayed or deferred tax advantages, specified on types of temporary differences: Changes Fixed assets Gains and losses Provisions Pensions commitments Other differences Total Shares and other securities Calculation base for deferred taxes Deferred tax assets / deferred tax (23% / 24 %) Effect on deferred tax from change in tax per cent from 24 % to 23 % Note 4 - Other short term liabilities Other short-term liabilities consist mainly of accrued costs not yet due for payment. Moelven Industrier ASA 131
132 Note 5 - Liquid holdings and debt 5.1 Interest-bearing holdings and debt Overdraft and interest-bearing debt Long-term interest-bearing liabilities in NOK 4.41 % SEK 4.15 % DKK EUR Total long-term interest-bearing debt Net interest-bearing debt 1, , Repayment schedule long-term liabilities Amounts in NOK million Long-term liabilities that fall due for payment in 1 year years years years years years or later Profit before tax 5.3 Ceilings and withdrawals in syndicated loan market Amounts in NOK million Ceiling 1, ,563.4 Withdrawal Remaining term in months 29 jan.00 The company's equity capital financing consists of a long-term credit facility maturing in June 2020, in addition to short-term credit facilities in the banking systems. The long-term loan agreement was entered into June 2016 and comprises two drawing frames of NOK 850 million and SEK 750 million respectively. The agreement initially had 3 years' maturity, with the option to request an extension of 1 year up to 2 times during the first 2 years of the agreement. In the second quarter of 2017, the first of these two options was used and the maturity of the agreement was changed from June 2019 to June Any decision to request further extension of the agreement will be made in the course of March / April The loans have been taken with negative security declaration and have normal clauses relating to equity, equity ratio and debt ratio. Moelven Industrier ASA 132
133 5.4 Future access to liquidity Long financing Amounts in NOK million as at , ,563.4 in 1 year 1, ,563.4 in 2 years 1, ,563.4 in 3 years in 4 years in 5 years in 6 years or later Short financing In addition to the long-term access to liquidity, the group has loan facilities that are renewed each year. As at these were NOK 312 million. As a result of normal seasonal variations, the group's net interest-bearing debt was at its highest in March 2017, NOK 1,159.9 million. The long term loan facilities as at will cover liquidity needs for the coming two and a half years. Note 6 - Financial market risk and impairment of financial assets 6.1 Financial market risk Assets with associated financial market risk consist of loans in foreign currency to subsidiaries, mainly in SEK. Exchange rate exposure is eliminated in that the loans are financed with debts in the same currency. Interest rate risk connected with the same receivables and liabilities is reduced by using rate swaps. In order to assist subsidiaries in covering risks associated with buying and selling currency, and within limits defined by the Board, currency positions are taken for internal exchange. The company also carry out the the hedging of the Group's consumption of electricity. For the Swedish part of the Group, this is done through trading financial contracts on the Nasdaq OMX Commodities. The realized hedging income is allocated to the subsidiaries according to consumption, resulting in no net impact for Moelven Industrier ASA. Hedge accounting is not used. 6.2.Impairment of financial assets Shares in subsidiaries are assessed with regard to indications of impairment. Net reversal of impairment of cost amounts NOK 3 mill. In addition, a provision made in 2016 for risks on loans and guarantee obligations to group companies with NOK 62,4 mill have been reversed following a settlement agreement. Note 7 - Guarantee liability Amounts in NOK million Unconditional guarantees Payment and contract guarantees Tax deduction guarantees Total The company has no restricted bank deposits. The company's cash credit accounts are included in the group's account systems. The company can thus be collectively responsible for more than the company's withdrawals. The employees' tax deduction funds are secured with guarantees furnished by an external credit institution. Moelven Industrier ASA 133
134 Note 8 - Financial instruments The following types of hedging are used: Rate swaps, currency future contracts, structured forward buying of currency, future contracts for electric power. Hedge accounting is not used. Financial assets entered at fair value Exchange rate derivatives Total assets presented on the financial derivatives line Financial obligations entered at fair value Interest rate derivatives Exchange rate derivatives Total obligations presented on the financial derivatives line Interest derivatives and power derivatives are entered in accordance with the lowest value principle. Aa at , power contracts had a positive market value of NOK 15.1 million (8.7). Value changes of financial instruments recognised in the profit and loss account Value change financial instruments, gain Value change financial instruments, loss Net result of financial instruments Profit before tax The Group has no hedging instruments not traded in functional markets. Fair value is calculated based on observable market prices for similar instruments. Presentation of nominal value and duration of financial instruments Amounts in NOK million Interest rate derivatives Maturing under 1 year Maturing 2-5 years Maturing 6-10 years Total Currency derivatives, forward contracts for sale of foreign currency Maturing 0-6 months Maturing 7-12 months Maturing >12 months Total Currency derivatives, forward contracts for purchase of foreign currency Maturing 0-6 months Maturing 7-12 months Maturing >12 months Total Power derivatives Maturing under 1 year Maturing 1-2 years Maturing 3-4 years Total Moelven Industrier ASA 134
135 Note 9 - Fixed assets and intangible assets Amounts in NOK million Land Buildings and other property Machinery and plant Fixtures and fittings, tools etc. Other intangible assets Total Acquisition value as at Acquisitions Disposal acquisition value Acquisition value as at Accumulated ordinary depreciations Disposals accumulated depreciations Depreciation and write downs for the year Accumulated ordinary depreciations Book value Book value Ordinary depreciation rates in per cent 0 2,5-10 % 5-10 % % Amounts in NOK million Land Buildings and other property Machinery and plant Fixtures and fittings, tools etc. Other intangible assets Total Acquisition value as at Acquisitions Disposal acquisition value Acquisition value as at Accumulated ordinary depreciations Profit before tax Depreciation and write downs for the year Accumulated ordinary depreciations Book value Book value Ordinary depreciation rates in per cent 0 2,5-10 % 5-10 % % 20/33% Moelven Industrier ASA 135
136 Note 10 - Payroll expenses, remuneration to group management, board and auditor 10.1 Payroll expences Amounts in NOK million Salaries Employer contribution and social costs Pension costs ref. defined benefit and contribution based pension schemes Other benefits/other personnel costs inc. proportion charged to subsidiaries Total Number of man years Remuneration to group management Amounts in NOK million Salary Pension Other Pension costs benefits Salary costs Other benefits CEO Morten Kristiansen 4, , Head of Timber division, Anders Lindh - from Dec.16 1, Head of Timber division, Ole Helge Aalstad up to Sept , Head of Wood division, Bjarne Hønningstad 2, , Head of Building Systems division, Marcus Johansson 1, , Total 10, , , , Profit before tax There is not given any loans or guarantees to the company management. See note 28 to the consolidated accounts for fixing of salary and other benefits for group management Remuneration to auditor Amounts in NOK million Amount ex VAT Legally mandated account audit Other services related to certification Tax advisory services For services other than audit Total Moelven Industrier ASA 136
137 Note 11 - Pension costs and pension liabilities Pension schemes The company is obliged to have an occupational pension scheme pursuant to the Act on Mandatory Occupational Pensions. The pension scheme complies with the law requirements, and is better than the minimum requirements in the law. With regard to defined-benefit pension shemes the company is still subject to taxable collective annuity scheme liabilities for a limited number of individuals. Unsecured schemes All obligations related to previous AFP schemes has ceased. Remaining uncecured schemes are related to other guaranteed obligations applicable to a limited number of people. A new AFP scheme from 01 January 2011 for the Group's Norwegian companies The new AFP scheme which came into force in 2011 is defined as a defined-benefit multi-company scheme, but is entered as a defined-contribution scheme until reliable and sufficient information enabling the companies to account for its proportionate share of pension costs, pension obligations and pension funds in the scheme. The company's obligations related to the new AFP scheme is therefore not recorded as a liability Economic and actuarial assumptions Return on pension funds 2.30 % 2.10 % Discount rate 2.30 % 2.10 % Annual pay increase 2.50 % 2.25 % Annual G adjustment (National Insurance Scheme's basic amount) 2.25 % 2.00 % Annual adjustment of pensions being paid 2.25 % 2.00 % 11.2 Pension costs Amounts in NOK million Pension entitlements accrued in the year Interest costs on the pension commitments Pension costs secured and unsecured defined benefit schemes Contribution pension costs and other pension costs Profit before tax Pension liabilities Amounts in NOK million Balance as at Accrual of future pensions Pension commitments (gross) Pension funds Employer contributions Pension commitments (net) Balance as at Pension commitments (gross) Pension funds (anticipated) Employer contributions Pension commitments (net) Net pension funds, secured schemes that can be netted Pension commitments, secured (and unsecured) schemes that cannot be netted Pension commitments, contractual pension (AFP) Total pension commitments Key figures Number of active members secured schemes 4 4 Number of pensioners secured schemes 9 9 Moelven Industrier ASA 137
138 Note 12 - Shares in subsidiaries Office, The municipality company s /country Holding % share capital The company s total equity The company s net profit in 2015 Number of shares in Moelven's ownership Total face value Amounts in NOK 1,000 Moelven Industrier ASA owns Moelven Van Severen AS Namsos % 35,000 49,550 3,234 3,500 35,000 35,005 Moelven Østerdalsbruket AS Stor-Elvdal % 20,000 41,138 5,749 2,000 20,000 20,005 Moelven Våler AS Våler % 48,000 99,685 37,167 4,800 48,000 48,005 Moelven Soknabruket AS Ringerike % 30,000 87,042 20,398 3,000 30,000 32,511 Moelven Numedal AS Flesberg % 10,000 29,074 5,705 1,000 10,000 10,005 Moelven Løten AS Løten % 12,000 24,929-1,138 1,200 12,000 12,005 Moelven Telemarksbruket AS Bø 51.0 % 14,059 10, ,059 5,550 Moelven Wood AS Eidsvoll % 5,500 15, ,500 5,500 10,000 Moelven Langmoen AS Ringsaker % 18,000 72,896 6,891 1,800 18,000 37,156 Moelven Portefølje AS Ringsaker % 1,000 9, ,000 1,000 1,155 Moelven Eidsvoll AS Eidsvoll % 8,500 28,303-12, ,500 18,500 Moelven Treinteriør AS Ringsaker % 3,500 15,172 3,932 3,500 3,500 8,482 Moelven Modus AS Ullensaker % 22, ,170 7,251 2,200 22,000 95,000 Moelven ByggModul AS Ringsaker % 31, ,784 10, ,440 31,688 89,299 Moelven Bioenergi AS Ringsaker % 6,000 18,627 3,095 6,000,000 6,000 6,800 Moelven Limtre AS Ringsaker % 11,000 66, ,000 11,000 43,028 Moelven Industrier AB Sverige % 197,046 SEK 408,589-33,657 19,704, , ,406 Moelven Danmark A/S Danmark % 5,000 DKK 17,659 1,235 50,000 5,000 12,417 Moelven U.K. Ltd Storbritannia % 950 GBP , ,426 Moelven Deutschland GmbH Tyskland % 110 EUR Moelven Nederland B.V. Nederland % 36 EUR Profit before tax Spydeberg % ,757 1, ,116 Moelven Mjøsbruket AS Gjøvik % 12,000 49,223 15,543 12,000 12,000 15,990 Moelven Eidsvold Værk AS Eidsvoll % 32,500 64,944-1,969 32,500 32,500 35,578 Moelven Trysil AS Trysil % 15,600 41,789 4,720 15,600 15,600 35,634 Moelven Multi3 AS Ringsaker % 3,425 6,924-2,544 6,850 3,425 7,192 Moelven Virke AS Ringsaker % 5,000 12,214 3,185 50,000 5,000 4,546 Moelven Sør Tre AS Kragerø % 8,487 19, ,487 8,487 50,000 Moelven Granvin Bruk AS Granvin 99.3 % 1,490 20,485 1,334 2,959 1,480 16,672 Moelven Wood Prosjekt AS Ringsaker % 300 4,253 2,720 3, ,000 Moelven Profil AS Grue % 15,000 22,551 1,117 15,000 15,000 15,030 Moelven ByggModul Hjellum AS Hamar % 4,206 84,193 11,159 50,001 4,206 60,585 Moelven Elprosjekt AS Ringsaker % 10,000 19,883-27,416 50,000 10,000 12,000 Moelven Polska sp.z.o.o Polen % 450 PLN 9, , ,068 Total Moelven Industrier ASA 1,052,700 *) Voting rights is equal to ownership share. Book value Moelven Industrier ASA 138
139 Note 13 - Investments in associated companies Amounts in NOK 1,000 Holding % The company s share capital The company s total equity The company s net profit in 2017 Number of shares in Moelven's ownership Total face value Book value Owned by Moelven Industrier ASA: Weda Skog AB, Sweden 30.0 % SEK 10,000 10, ,000,000 3,000 2,632 Woodtrans AS, Norway 34.0 % NOK 1,310 2,556 1, ,187 Total 3,819 *) Voting rights is equal to ownership share. Note 14 - Equity Amounts in NOK million Share capital Share premium funds Own shares Other equity Total equity Equity Annual profit Actuarial gains and losses, and other direct to equity Allocated to dividend Equity For information regarding developments in share capital, summary of shareholders, shareholder agreements and closely related parties, shares owned by members of the board of Directors, corporate assembly and group management, declaration on fixing of salary and other remuneration to group management and also remuneration to the board of directors and corporate assembly, see notes 27, 28 and 29 to the consolidated accounts. Moelven Industrier ASA 139
140 Note 15 - Transactions with related parties Amounts in NOK million Holding % Interests from Other group operating companies on revenue loans Loans to group companies Receivables group contributions Accounts receivable group companies Trade accounts payable group companies Moelven Industrier ASA Moelven Van Severen AS % Moelven Østerdalsbruket AS % Moelven Våler AS % Moelven Soknabruket AS % Moelven Numedal AS % Moelven Løten AS % Moelven Telemarksbruket AS 51.0 % Moelven Wood AS % Moelven Langmoen AS % Moelven Eidsvoll AS % Moelven Treinteriør AS % Moelven Modus AS % Moelven ByggModul AS % Moelven ByggModul Hjellum AS % Moelven Bioenergi AS % Moelven Elprosjekt AS % Moelven Limtre AS % Moelven Industrier AB % Moelven Are AS % 0.5 Moelven Mjøsbruket AS % Moelven Eidsvold Værk AS % Profit before tax % 0.9 Moelven Multi3 AS % Moelven Virke AS % Moelven Sør Tre AS % Moelven Granvin Bruk AS 99.3 % Moelven Wood Prosjekt AS % Moelven Profil AS % Moelven Danmark AS % Moelven UK Ltd % Moelven Industrier ASA 140
141 Note 15 - Transactions with related parties (cont.) Swedish companies owned by Moelven Industrier AB Amounts in NOK million Holding % Interests from Other group operating companies on revenue loans Loans to group companies Receivables group contributions Accounts receivable group companies Trade accounts payable group companies Moelven Notnäs Ransby AB % Moelven List AB % Moelven ByggModul AB % Moelven Norsälven AB % Moelven Värmlands Trä AB % Moelven Component AB % Skåre Kontorshotell AB % Moelven Wood AB % 5.1 Moelven Notnäs Wood AB % 0.5 Moelve Valåsen Wood AB % Moelven Valåsen AB % Moelven Dalaträ AB % Moelven Modus AB % Moelven Edanesågen AB % Moelven Nössemark Trä AB % Moelven Årjäng Såg AB % 3.1 Moelven Tom Heurlin AB % Moelven Skog AB % Moelven Töreboda AB % Vänerbränsle AB 82.3 % 0.1 Moelven Lovene AB % Moelven Vänerply AB % UJ Trading AB % 0.3 Total , Total , Moelven Industrier ASA 141

142 KPMG AS Vangsvegen Hamar Telephone Fax Internet Enterprise MVA To the General Meeting of Moelven Industrier ASA Independent auditor s report Report on the Audit of the Financial Statements Opinion We have audited the financial statements of Moelven Industrier ASA. The financial statements comprise: The financial statements of the parent company Moelven Industrier ASA (the Company), which comprise the balance sheet as at 31 December 2017, and the income statement and cash flow statement for the year then ended, and notes to the financial statements, including a summary of significant accounting policies, and The consolidated financial statements of Moelven Industrier ASA and its subsidiaries (the Group), which comprise the balance sheet as at 31 December 2017, and income statement, statement of comprehensive income, statement of changes in equity, cash flow for the year then ended, and notes to the financial statements, including a summary of significant accounting policies. In our opinion: The financial statements are prepared in accordance with the law and regulations. The accompanying financial statements give a true and fair view of the financial position of the Company as at 31 December 2017, and its financial performance and its cash flows for the year then ended in accordance with the Norwegian Accounting Act and accounting standards and practices generally accepted in Norway. The accompanying consolidated financial statements give a true and fair view of the financial position of the Group as at 31 December 2017, and its financial performance and its cash flows for the year then ended in accordance with International Financial Reporting Standards as adopted by the EU. Basis for Opinion We conducted our audit in accordance with laws, regulations, and auditing standards and practices generally accepted in Norway, including International Standards on Auditing (ISAs). Our responsibilities under those standards are further described in the Auditor s Responsibilities for the Audit of the Financial Statements section of our report. We are independent of the Company and the Group as required by laws and regulations, and we have fulfilled our other ethical responsibilities in accordance with these requirements. We believe that the audit evidence we have obtained is sufficient and appropriate to provide a basis for our opinion.
143 Auditor's Report Moelven Industrier ASA Other information Management is responsible for the other information. The other information comprises the Board of Directors report, the statements on Corporate Governance and Corporate Social Responsibility, but does not include the financial statements and our auditor's report thereon. Our opinion on the financial statements does not cover the other information and we do not express any form of assurance conclusion thereon. In connection with our audit of the financial statements, our responsibility is to read the other information and, in doing so, consider whether the other information is materially inconsistent with the financial statements or our knowledge obtained in the audit or otherwise appears to be materially misstated. If, based on the work we have performed, we conclude that there is a material misstatement of this other information; we are required to report that fact. We have nothing to report in this regard. Responsibilities of the Board of Directors and the Managing Director for the Financial Statements The Board of Directors and the Managing Director (Management) are responsible for the preparation in accordance with law and regulations, including fair presentation of the financial statements of the Company in accordance with the Norwegian Accounting Act and accounting standards and practices generally accepted in Norway, and for the preparation and fair presentation of the financial statements of the Group in accordance with International Financial Reporting Standards as adopted by the EU, and for such internal control as management determines is necessary to enable the preparation of financial statements that are free from material misstatement, whether due to fraud or error. In preparing the financial statements, management is responsible for assessing the Company s and the Group s ability to continue as a going concern, disclosing, as applicable, matters related to going concern. The financial statements of the Company use the going concern basis of accounting insofar as it is not likely that the enterprise will cease operations. The financial statements of the Group use the going concern basis of accounting unless management either intends to liquidate the Group or to cease operations, or has no realistic alternative but to do so. Auditor s Responsibilities for the Audit of the Financial Statements Our objectives are to obtain reasonable assurance about whether the financial statements as a whole are free from material misstatement, whether due to fraud or error, and to issue an auditor s report that includes our opinion. Reasonable assurance is a high level of assurance, but is not a guarantee that an audit conducted in accordance with laws, regulations, and auditing standards and practices generally accepted in Norway, including ISAs will always detect a material misstatement when it exists. Misstatements can arise from fraud or error and are considered material if, individually or in aggregate, they could reasonably be expected to influence the economic decisions of users taken on the basis of these financial statements. As part of an audit in accordance with laws, regulations, and auditing standards and practices generally accepted in Norway, including ISAs, we exercise professional judgment and maintain professional skepticism throughout the audit. We also: identify and assess the risks of material misstatement of the financial statements, whether due to fraud or error. We design and perform audit procedures responsive to those risks, and obtain audit evidence that is sufficient and appropriate to provide a basis for our opinion. The risk of not detecting a material misstatement resulting from fraud is higher than for one resulting from error, as fraud may involve collusion, forgery, intentional omissions, misrepresentations, or the override of internal control. obtain an understanding of internal control relevant to the audit in order to design audit procedures that are appropriate in the circumstances, but not for the purpose of expressing an opinion on the effectiveness of the Company's or the Group's internal control. evaluate the appropriateness of accounting policies used and the reasonableness of accounting estimates and related disclosures made by management. 2
144 Auditor's Report Moelven Industrier ASA conclude on the appropriateness of management s use of the going concern basis of accounting and, based on the audit evidence obtained, whether a material uncertainty exists related to events or conditions that may cast significant doubt on the Company and the Group's ability to continue as a going concern. If we conclude that a material uncertainty exists, we are required to draw attention in our auditor s report to the related disclosures in the financial statements or, if such disclosures are inadequate, to modify our opinion. Our conclusions are based on the audit evidence obtained up to the date of our auditor's report. However, future events or conditions may cause the Company and the Group to cease to continue as a going concern. evaluate the overall presentation, structure and content of the financial statements, including the disclosures, and whether the financial statements represent the underlying transactions and events in a manner that achieves fair presentation. obtain sufficient appropriate audit evidence regarding the financial information of the entities or business activities within the Group to express an opinion on the consolidated financial statements. We are responsible for the direction, supervision and performance of the group audit. We remain solely responsible for our audit opinion. We communicate with the Board of Directors regarding, among other matters, the planned scope and timing of the audit and significant audit findings, including any significant deficiencies in internal control that we identify during our audit. Report on Other Legal and Regulatory Requirements Opinion on the Board of Directors report Based on our audit of the financial statements as described above, it is our opinion that the information presented in the Board of Directors report and in the statements on Corporate Social Responsibility concerning the financial statements, the going concern assumption, and the proposal for the allocation of the profit is consistent with the financial statements and complies with the law and regulations. Opinion on Registration and Documentation Based on our audit of the financial statements as described above, and control procedures we have considered necessary in accordance with the International Standard on Assurance Engagements (ISAE) 3000, Assurance Engagements Other than Audits or Reviews of Historical Financial Information, it is our opinion that management has fulfilled its duty to produce a proper and clearly set out registration and documentation of the Company's accounting information in accordance with the law and bookkeeping standards and practices generally accepted in Norway. Hamar, March 14, 2018 KPMG AS Stein Erik Lund State Authorised Public Accountant Note: This translation from Norwegian has been prepared for information purposes only. 3
145 Statement by the Corporate Assembly The following items were discussed at the meeting of the Corporate Assembly held on 22 March 2018: Annual report and proposed Annual Financial Statement by the Board of Directors and President/CEO for the 2017 accounting year for Moelven Industrier ASA and group. Board s proposed allocation of profit for year in Moelven Industrier ASA. Board s determination of remuneration to Group Executive Board. The Statement by the Corporate Assembly to the General Meeting. The Corporate Assembly recommends that the general meeting approve the Board of Directors and CEO s annual report and accounts for Moelven Industrier ASA and group in 2017, including allocation of the result for the year in Moelven Industrier ASA. The Corporate Assembly also recommends that the general meeting approve the Board of Directors proposal for remuneration to corporate management. 22 March 2018 Egil Magnar Stubsjøen Chairman of the Corporate Assembly
146 Financial calendar February 2018 Fourth Quarter report April 2018 General meeting Annual Auccounts 2017 Publishing Quarterly 27. April 2018 First Quarter Report August 2018 Second Quarter Report October 2018 Third Quarter Report Jauary 2019 Fourth Quarter Report 2018 Head office Moelven Industrier ASA Org.nr. NO MVA P.O. Box 134, NO-2391 Moelv Tel Fax moelven.com Frontcover: Moelven
147
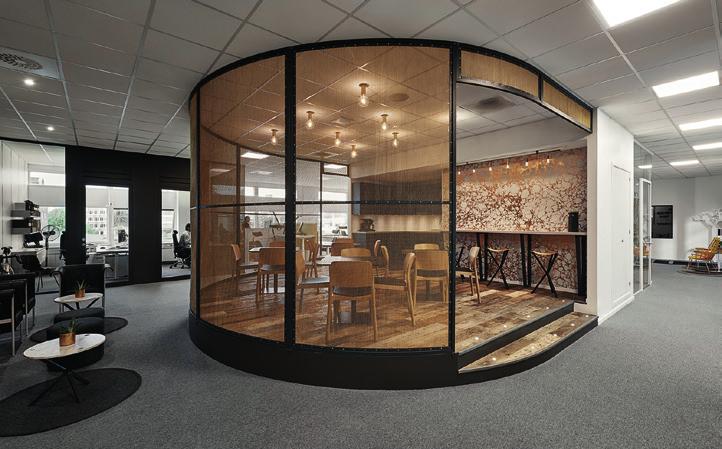


148
Oiled wood based interior products in the same color range provide a warm atmosphere. Delivered by Moelven Wood AS. Photo: Einar Breen.
 Oiled wood based interior products in the same color range provide a warm atmosphere. Delivered by Moelven Wood AS. Photo: Einar Breen. Quarterly Report 4/2017 Amounts in NOK million Fourth quarter 12
Content. Main figures for five years 3 Report of the Board of Directors 4 Corporate governance 16 Social responsibility 22
 ANNUAL REPORT 2015 Content Main figures for five years 3 Report of the Board of Directors 4 Corporate governance 16 Social responsibility 22 Group Key figures 30 Income statement 31 Statement of financial
Quarterly Report 1/2018
 Quarterly Report 1/2018 Grilstad Marina, Havseilerveien, Trondheim. Untreated cedarwood facades delivered by Moelven Wood Prosjekt AS. Photo: Matthias Christoph Herzog. Amounts in NOK million First quarter
Quarterly Report 3/2015
 Quarterly Report 3/2015 Moelven ByggModul will deliver 52 apartments in Fjeldsetlia Park in Elverum. Production will be done at Moelven ByggModul Hjellum AS and is the company s first residential concept
Quarterly Report 1/2017
 Quarterly Report 1/2017 Herrestaskolan in Järfälla. Interior products from Moelven Töreboda AB. Photo: Hampus Lundgren. Amounts in NOK million First quarter Total 2017 2016 2016 2015 Operating revenues
Quarterly Report 2/2015
 Gode rom Quarterly Report 2/2015 Sognefjellshytta. A unique design made of laminated timber, delivered as pre cut from Moelven Limtre AS. Jan Olav Jensen, Jensen og Skodvin Arkitekter. Photographer : Hampus
Quarterly Report 3/2016
 Quarterly Report 3/2016 Kimen Kulturhus. Moelven Wood Prosjekt has supplied fire resistant wood of spruce. Photo: Lene M. Prøven. Architect: Reiulf Ramstad Arkitekter/JSTArkitekter/Lusparken Arkitekter
Quality rooms. Quarterly report 4/2013
 Quality rooms Quarterly report 4/2013 Strandparken in Sundbyberg is the Stockholm area s first eight storey house built entirely of wood. The house facade is shavings of Western Red Cedar (WRC) from Moelven.
Quarterly report 3/2006
 Quarterly report 3/2006 Laminated timber from Moelven has been used both as load-bearing beams and external, fire-resistant panelling at Midtbyen in Trondheim. Profit and Loss Account Change in 3 r d Quarter
Quality Rooms. Quarterly Report 2/2011. Moelven ByggModul AS supplied apartments for Castbergtunet, Oslo Architect: Incudo. Client: Skanska Bolig AS.
 Quality Rooms Quarterly Report 2/2011 Moelven ByggModul AS supplied apartments for Castbergtunet, Oslo Architect: Incudo. Client: Skanska Bolig AS. Profit and Loss Account Balance Sheet NOK mill. 2 nd
Quarterly Report 1/2009. Quality Rooms
 Quarterly Report 1/2009 Quality Rooms Profit and Loss Account 1 st Quarter Total Operating revenues 1,456.2 1,951.3 1,988.5 7,657.7 7,944.0 Depreciation 46.9 46.7 44.0 199.2 177.0 Cost of goods sold 959.1
Quality rooms. Quarterly report 1/2013. Architect: AG Arkitekter. Photo: Carl Swensson.
 Quality rooms Quarterly report 1/2013 Architect: AG Arkitekter. Photo: Carl Swensson. Amounts in NOK million First quarter 12 months 2013 2012 2012 2011 Operating revenues 1 848.7 2 165.4 8 121.5 8 059.9
Quarterly Report 1/2011. Quality Rooms
 Quarterly Report 1/2011 Quality Rooms Profit and Loss Account 1 st Quarter Operating revenues 1,953.4 1,476.8 1,456.2 7,184.5 6,247.8 Depreciation 56.1 51.4 46.9 212.8 202.5 Cost of goods sold 1,300.3
Quarterly Report 1/2010. Quality Rooms
 Quarterly Report 1/2010 Quality Rooms Profit and Loss Account 1 st Quarter Total Operating revenues 1,476.8 1,456.2 1,951.3 6,247.8 7,657.7 Depreciation 51.4 46.9 46.7 202.5 199.2 Cost of goods sold 878.9
Quarterly Report 3/011. Quality rooms
 Quality rooms Quarterly Report 3/011 The Moelven S-beam (S-bjelken) is a new laminated timber product, the optimal beam for rafters and joists. The beam has been technically certified and comes in several
Quality rooms. Quarterly report 2/2012. Photo: Moelven Wood AS supplies thermo-treated ash decking.
 Quality rooms Quarterly report 2/2012 Photo: Moelven Wood AS supplies thermo-treated ash decking. Amounts in NOK million Second quarter 6 months Total 2012 2011 2012 2011 2011 2010 Operating revenues 2
Quarterly report 4/2007. Moelven Wood AS supplies flooring, panelling and moulding for quality rooms.
 Quarterly report 4/2007 Moelven Wood AS supplies flooring, panelling and moulding for quality rooms. Profit and Loss Account 4 th Quarter Operating revenues 1,983.2 1,830.8 1,528.1 7,944.0 6,692.4 6,004.9
Quarterly report 2/2008
 Quarterly report 2/2008 Moelven Nordia AS has supplied the interior layout for Smedvik Eiendom's new building outside of Stavanger. Product: Nordia Flush Front. Building architect: Petter Giske at Multiconsult
Quarterly report 3/2007
 Quarterly report 3/2007 Moelven's stand at this year's builders' trade fair Bygg Reis Deg attracted a wide audience, and both staff and visitors appreciated our "Quality Rooms". Profit and Loss Account
Quarterly Report 2/2010. Quality Rooms
 Quality Rooms Quarterly Report 2/2010 At Slemmestad outside of Oslo, Moelven ByggModul AS has built three apartment blocks containing 50 apartments. Romerike Arkitekter AS. Rortunet Eiendom AS, Slemmestad
Quarterly report 2/2005. Thirty 3D BoKlok apartments have been built at Fagerstrand outside of Oslo.
 Quarterly report 2/2005 Thirty 3D BoKlok apartments have been built at Fagerstrand outside of Oslo. Profit and Loss Account 2 nd Quarter 1 st half-year Total Operating revenues 1,674.4 1,573.4 1,306.7
Quarterly report 1/2006
 Quarterly report 1/2006 Profit and Loss Account Operating revenues 1,557.0 1,411.2 1,407.0 6,004.9 5,773.2 Depreciation 42.9 46.3 42.5 178.0 177.5 Cost of goods sold 975.4 893.1 885.1 3,809.4 3,667.3 Operating
Quarterly report 3/2005. The publishing house Bonnier s office layout from Moelven Eurowand AB in the restaurant area of kv. Moraset in Stockholm.
 Quarterly report 3/2005 The publishing house Bonnier s office layout from Moelven Eurowand AB in the restaurant area of kv. Moraset in Stockholm. Profit and Loss Account Change in 3 rd Quarter Nine months
Quarterly Report 2/2009. Quality Rooms
 Quality Rooms Quarterly Report 2/2009 Iso3 is an insulated framework materiel that contributes to reducing energy needs in buildings. The new product prevents thermal bridges and is specially developed
Interim report January March 2015
 Interim report January March 215 Photo: Bengt Alm 1 January 31 March 215 Net sales decreased by 1% to SEK 1,548 million (1,564). The change is due to a 1% reduction in delivery volumes and a 1% average
Year-end report 2009
 Year-end report 2009 Year-end report 2009 Fourth quarter Year ended on a strong note with increased sales. Good demand for wood raw material, primarily sawlogs and biofuel, with rising prices. Net sales
Interim report January June 2008
 Interim report January June 2008 Interim report January June 2008 Second quarter Prices for fibre continues to increase while prices for sawlogs are stable. Agreement signed for biofuel production based
3 months 12 months Setra Group Group Oct.-Dec. Oct.-Dec. Jan.-Dec. Jan.-Dec.
 Year-End Report 28 SETRA GROUP AB (publ), Box 327, 169 3 Solna, Sweden, tel. +46 8 75 3, www.setragroup.se, corp. reg. no. 55634-8483 Page 1 of 13 Year-End Report 28 Consolidated net sales for 28 amounted
Interim report January June 2015
 Interim report January June 215 Photo: Shutterstock 1 April 3 June 215 Net sales decreased by 1% to SEK 1,7 million (1,718). Delivery volumes increased by 1% and the prices fell in average by 1%. Operating
JANUARY 1 SEPTEMBER 30, 2018 (compared with the year-earlier period)
") Q3 218 JANUARY 1 SEPTEMBER 3, 218 (compared with the year-earlier period) Net sales increased 11% to SEK 13,829m (12,422). The growth was primarily attributable to Paper and Wood. EBITDA increased 46%
Q3 218 JANUARY 1 SEPTEMBER 3, 218 (compared with the year-earlier period) Net sales increased 11% to SEK 13,829m (12,422). The growth was primarily attributable to Paper and Wood. EBITDA increased 46%
60 Kärnhem. 348 BWG Homes AB. 643 Block Watne 2 QUARTER NEW ORDERS NOK million OPERATIONAL REVENUES NOK million 1 053
 2 QUARTER 2013 NEW ORDERS NOK million 1 088 OPERATIONAL REVENUES NOK million 1 053 OPERATIONAL EBITDA MARGIN Per cent 12.3 OPERATIONAL REVENUE PER BUSINESS AREA NOK million 60 Kärnhem 643 Block Watne 348
Interim report January March 2009
 Interim report January March 2009 Interim report January March 2009 First quarter Low sales volume to sawmills and the pulp and paper industry. Further reductions in timber prices. Good demand for biofuel
Holmen s interim report January June 2016
 Holmen s interim report January June 216 2-16 1-16 2-15 216 215 215 Net sales 3 937 3 828 4 139 7 765 8 293 16 14 Operating profit excl. items affecting comparability 483 58 435 1 63 831 1 7 Operating
Economic Activity Report
 Economic Activity Report FOR THE SCANDINAVIAN COUNTRIES October 2007 New developments since June highlights Some unrest in the financial markets, but it will pass International economy In the spring and
Profit after tax for January June 2010 was SEK 312 million (January June 2009: SEK 501 million).
.") 2-1 1-1 2-9 21 29 29 Net turnover 4 227 4 4 4 496 8 628 9 25 18 71 Operating profit 268 32 372 588 787 1 62 Profit after tax 133 178 256 312 51 1 6 Earnings per share, SEK 1.6 2.1 3. 3.7 6. 12. Return
2-1 1-1 2-9 21 29 29 Net turnover 4 227 4 4 4 496 8 628 9 25 18 71 Operating profit 268 32 372 588 787 1 62 Profit after tax 133 178 256 312 51 1 6 Earnings per share, SEK 1.6 2.1 3. 3.7 6. 12. Return
January March. Earnings per share
 January March Q1 First quarter Net sales amounted to SEK 1,583 million (1 666). Prices fell by an average of 11% while delivery volumes rose 3% compared with the fi rst quarter in the previous year. Operating
A d d i t i o n a l c o s t c u t t i n g b y s i m p l i f y i n g t h e s t r u c t u r e
 Interim report A d d i t i o n a l c o s t c u t t i n g b y s i m p l i f y i n g t h e s t r u c t u r e Kitron showed a slight loss for the third quarter. Group sales proved to be lower than expected,
Interim report January June 2010
 Interim report January June 2010 Interim report January June 2010 Second quarter Net sales rose to SEK 1,970 million (1,679), as a result of both increased volumes and higher prices. Operating profit from
Interim Report January September
 DELÅRSRAPPORT JANUARI SEPTEMBER 20 10 Interim Report January September 1 Handelsbanken INTERIM REPORT JANUARY SEPTEMBER Handelsbanken s Interim Report January September Sammanfattning january september,
Interim Report 1 January 30 September 2013
 Interim Report 1 January 30 September 2013 Board of Directors 31 October 2013 1 VAPO OY INTERIM REPORT 1 JANUARY 30 SEPTEMBER 2013 July-September Group turnover in the July-September period was EUR 107.9
EBITDA margin Earnings per share SEK Operating cash flow ,751 2,273
 Q4 218 FULL YEAR 218 (217) Net sales increased 13% to SEK 18,755m (16,664). Sales grew in all segments. EBITDA increased 44% to SEK 5,252m (3,648). The improvement in EBITDA was mainly related to higher
Interim Report for Duni AB (publ) 1 January 31 December 2010 (compared with the same period of the previous year)
 1 January 31 December 2010 (compared with the same period of the previous year)") Interim Report for Duni AB (publ) 1 January 31 (compared with the same period of the previous year) 16 February 2011 Improved operating margin of 14.8% for the quarter 1 January 31 Net sales amounted to
Interim Report for Duni AB (publ) 1 January 31 (compared with the same period of the previous year) 16 February 2011 Improved operating margin of 14.8% for the quarter 1 January 31 Net sales amounted to
Interim Report January June Cash flow from operating activities was SEK 323 million (107)
") Interim Report January June 2014 NET SALES WERE SEK 5,840 MILLION (5,535) OPERATING PROFIT WAS SEK 296 MILLION (253) Cash flow from operating activities was SEK 323 million (107) Highlights of the period
Interim Report January June 2014 NET SALES WERE SEK 5,840 MILLION (5,535) OPERATING PROFIT WAS SEK 296 MILLION (253) Cash flow from operating activities was SEK 323 million (107) Highlights of the period
Q JANUARY 1 MARCH 31, 2018 (compared with the year-earlier period) EARNINGS TREND
 EARNINGS TREND") Q1 218 JANUARY 1 MARCH 31, 218 (compared with the year-earlier period) Net sales increased 11% to SEK 4,4m (3,972). Sales growth was mainly related to higher prices in the industrial units. EBITDA rose
Q1 218 JANUARY 1 MARCH 31, 218 (compared with the year-earlier period) Net sales increased 11% to SEK 4,4m (3,972). Sales growth was mainly related to higher prices in the industrial units. EBITDA rose
Interim Report Q3 2017
 Interim Report Q3 217 JANUARY 1 SEPTEMBER 3, 217* (compared with the year-earlier period, continuing operations) Net sales increased 9% to SEK 12,422m (11,434) Adjusted EBITDA improved 1% to SEK 2,683m
Year-end report 2017 January - December YEAR-END REPORT 2017 OCTOBER DECEMBER 2017 JANUARY DECEMBER 2017
 Year-end report 2017 January - December Troax Group AB (publ) Hillerstorp 12th of February, 2018 YEAR-END REPORT 2017 OCTOBER DECEMBER 2017 Order intake increased by 17 per cent to 38,4 (32,8) MEUR. Adjusted
Interim Report for Duni AB (publ) 1 January 30 June 2009
 1 January 30 June 2009") Interim Report for Duni AB (publ) 1 January 30 2009 (compared with the same period of the previous year) 29 July 2009 Strong cash flow and stable profitability 1 January 30 2009 Net sales increased by
Interim Report for Duni AB (publ) 1 January 30 2009 (compared with the same period of the previous year) 29 July 2009 Strong cash flow and stable profitability 1 January 30 2009 Net sales increased by
Weak quarter, especially in Europe
 Interim report January March 2013 Weak quarter, especially in Europe Incoming orders amounted to SEK 683.2m (493.7), which adjusted is a decrease by 1.7 %*. Net sales amounted to SEK 614.5m (505.9), which
Improving profitability, solid financial position and updated financial targets
 Improving profitability, solid financial position and updated financial targets Jussi Noponen CFO Metsä Board Capital Markets Day 2017 Disclaimer This presentation includes forward-looking statements.
Interim report Q2 2017
 Q2 Strong results despite increased investments for future growth and profitability April June Total revenue increased 5 per cent to SEK 686m (655). Profit before tax excluding items affecting comparability
Interim report 1 January 30 September 2016
 This English translation is for the information purposes only. In case of any discrepancies between this version and the Swedish, the Swedish version shall prevail. Interim report 1 January 30 September
MoDo Tel (direct ) Group Public Relations Fax SE STOCKHOLM
 Group Public Relations Fax SE STOCKHOLM") MoDo Tel +46 8 666 21 00 (direct +46 8 666 21 15) Group Public Relations Fax +46 8 666 21 30 P.O. Box 5407 http://www.modogroup.com SE-114 84 STOCKHOLM e-mail: info@modogroup.com MoDo s reasons for creating
MoDo Tel +46 8 666 21 00 (direct +46 8 666 21 15) Group Public Relations Fax +46 8 666 21 30 P.O. Box 5407 http://www.modogroup.com SE-114 84 STOCKHOLM e-mail: info@modogroup.com MoDo s reasons for creating
Quarterly Report Q1 2018
 Quarterly Report Q1 2018 26 April 2018 The global leader in door opening solutions A good start to the year First quarter Net sales increased by 2% to SEK 18,550 M (18,142), with organic growth of 4% (6)
Financial Insights. Finnish and Swedish Forest Industry Q Tieto Forest Industry Consulting
 Financial Insights Finnish and Swedish Forest Industry Q3 Tieto Forest Industry Consulting www.tieto.com Executive summary In the manufacturing and forest sector, there is a strong digitalization trend
INTERIM REPORT 1 JANUARY 30 SEPTEMBER 2011
 INTERIM REPORT 1 JANUARY 30 SEPTEMBER 2011 1 2 3 4 UPM INTERIM REPORT 1 JANUARY 30 SEPTEMBER 2011 Q3/2011 Earnings per share excluding special items were EUR 0.19 (0.28), and reported EUR 0.21 (0.34) EBITDA
Interim Report Q Self Storage Group ASA
 Interim Report Q2 2018 Self Storage Group ASA Contents Highlights 2 Key Figures 2 Subsequent events 2 Financial development 3 Strategy 6 Corporate developments 8 Risks and uncertainty factors 8 Outlook
DNB Group FACT BOOK. Second quarter 2013 (UNAUDITED) - ADJUSTED ACCORDING TO NEW CUSTOMER SEGMENTS -
 - ADJUSTED ACCORDING TO NEW CUSTOMER SEGMENTS -") 2 DNB Group FACT BOOK Second quarter 2013 (UNAUDITED) - ADJUSTED ACCORDING TO NEW CUSTOMER SEGMENTS - Chapter 1 - Financial results DNB Group 0 Group business structure and financial governance 0.1 Legal
2 DNB Group FACT BOOK Second quarter 2013 (UNAUDITED) - ADJUSTED ACCORDING TO NEW CUSTOMER SEGMENTS - Chapter 1 - Financial results DNB Group 0 Group business structure and financial governance 0.1 Legal
Clas Ohlson: Year-end report 1 May April 2013
 Clas Ohlson: Year-end report 1 May 2012 30 April 2013 Fourth quarter * Sales totalled SEK 1,274 M (1,272). In local currencies, growth was 3%. * Operating loss of SEK 19 M reported (profit: 10). * Loss
Proffice year-end financial report
 Proffice year-end financial report JANUARY DECEMBER 2010 Strong fourth quarter October December 2010 Revenue amounted to SEK 1,136 million (963) Operating profit amounted to SEK 45 million (30) Operating
UPM-KYMMENE INTERIM REVIEW 1 JANUARY 30 JUNE 2001
 UPM-KYMMENE INTERIM REVIEW 1 JANUARY 30 JUNE 2001 Earnings per share, excluding net capital gains, improved to EUR 1.91 (1 6/2000: 1.80). Profit before extraordinary items and net capital gains was EUR
QUARTERLY REPORT
 QUARTERLY REPORT 04-2018 QUARTERLY REPORT 4TH QUARTER 2018 1 Q4 2018 HIGHLIGHTS In 2018, Agder Energi made an underlying 1 operating profit based on IFRS of NOK 2,298 million (2017: NOK 1,889 million),
Proffice grows on a stagnating market
 Proffice grows on a stagnating market Q1 2012 year-on-year comparison Net sales increased 9 per cent to SEK 1,200 million (1,096) EBITA and operating profit declined 13 per cent to SEK 40 million (46)
INTERIM REPORT JANUARY-MARCH 2011
 INTERIM REPORT JANUARY-MARCH 2011 SoliQ, a unique service concept for the Global Produce Supply Chain Billerud s subsidiary, Billerud Fresh Services, is now launching SoliQ, an optimised corrugated packaging
Year-end Report 2016 January - December YEAR-END REPORT 2016 OCTOBER DECEMBER 2016 JANUARY DECEMBER 2016 TROAX GROUP FIGURES
 Year-end Report 2016 January - December Troax Group AB (publ) Hillerstorp 14th February, 2017 YEAR-END REPORT 2016 OCTOBER DECEMBER 2016 Order intake increased by 21 per cent, or 26 per cent adjusted for
EMPOWERING INNOVATION
 EMPOWERING INNOVATION INTERIM REPORT THIRD QUARTER 2017 This English translation is for information purposes only. In case of any discrepancies between this version and the Swedish, the Swedish version
UPM-Kymmene. Interim Review
 UPM-Kymmene Interim Review 1 9/2002 UPM-Kymmene Interim Review 1 January - 30 September 2002 Third-quarter earnings per share were 0.72 (0.51 for the second quarter), and excluding capital gains/losses
Metsä Group Interim Report Q3/2016
 Metsä Group Interim Report Q3/2016 Kari Jordan President and CEO Metsä Group Q3 Business developed as expected Sales EUR 3,483 million (1 9/2016: EUR 3,811 million) Comparable operating result EUR 332
Holmen Excl. Items affecting comparability. Holmen
 Full Year MSEK 4-1 3-1 4-9 21 29 Net turnover 4 747 4 25 4 659 17 581 18 71 Operating profit 625 383 392 1 596 1 62 Operating profit excl. items affecting comp. * 361 383 392 1 332 1 62 Profit after tax
INTERIM REPORT JANUARY MARCH 2018
 24 April 2018 INTERIM REPORT JANUARY MARCH 2018 Reporting period January March Net sales increased by 10.4 per cent to SEK 2,674 (2,423) million. Organically, net sales decreased by 0.6 per cent EBITA*
Interim report. 1 January 31 March I n t e r i m r e p o r t Q JANUARY 31 MARCH 2008 (compared with the same period previous year)
") I n t e r i m r e p o r t Q 1 2 0 0 8 Interim report 1 January 31 March 2008 1 JANUARY 31 MARCH 2008 (compared with the same period previous year) Net sales rose 7% to SEK 27,513m (25,615). Profit before
I n t e r i m r e p o r t Q 1 2 0 0 8 Interim report 1 January 31 March 2008 1 JANUARY 31 MARCH 2008 (compared with the same period previous year) Net sales rose 7% to SEK 27,513m (25,615). Profit before
INTERIM FINANCIAL REPORT. 3rd quarter 2017
 INTERIM FINANCIAL REPORT 3rd quarter 2017 2 AVINOR AS Content Group main figures 3 Board of directors report 4 Income statement 10 Statement of comprehensive income 11 Balance sheet 12 Statement of changes
INTERIM REPORT 1 JANUARY 30 JUNE 2009
 1 2 3 4 INTERIM REPORT 1 JANUARY 30 JUNE 2009 UPM Interim Report 1 January 30 June 2009 Earnings per share for the second quarter were 0.02 (0.18), and excluding special items 0.03 (0.17) Operating profit
Troax Group AB (publ) Hillerstorp 13th of February, 2019
 Hillerstorp 13th of February, 2019") Troax Group AB (publ) Hillerstorp 13th of February, 2019 INTERIM REPORT JANUARY - DECEMBER 2018 OCTOBER - DECEMBER Order intake increased by 9 per cent to 41,7 (38,4) MEUR. Adjusted for currency the increase
Troax Group AB (publ) Hillerstorp 13th of February, 2019 INTERIM REPORT JANUARY - DECEMBER 2018 OCTOBER - DECEMBER Order intake increased by 9 per cent to 41,7 (38,4) MEUR. Adjusted for currency the increase
Year-end report. Earnings per share
 Year-end report 2013 Fourth quarter Net sales amounted to SEK 1,565 million (1,585). Prices increased by an average of 1% while delivery volumes decreased by 2%. Operating profi t from continuing operations
GUIDELINES FOR CENTRAL GOVERNMENT DEBT MANAGEMENT 2018
 GUIDELINES FOR CENTRAL GOVERNMENT DEBT MANAGEMENT 2018 Decision taken at the Cabinet meeting November 9 2017 2018 LONG-TERM PERSPECTIVES COST MINIMISATION FLEXIBILITY Contents Summary... 2 1 Decision on
NYNAS INTERIM REPORT JANUARY SEPTEMBER JANUARY 30 SEPTEMBER 2015
 Q 3 INTERIM REPORT 1 JANUARY 30 SEPTEMBER Nynas AB (Publ.), corporate reg.no 556029-2509, parent company for Nynas. Nynas is a leading international group specialised in naphthenic specialty oils and bitumen.
Interim report Q3 2014
 Interim report Q3 2014 Contents Management report 3 Highlights 4 Key figures and financial ratios 5 Developments in Q3 2014 7 Outlook 8 Risk factors 9 Management statement 20 Hartmann at a glance Interim
Norlandia Health & Care Group AS Q3 Interim Report 2017
 Norlandia Health & Care Group AS Q3 Interim Report 2017 CONTENT CONTENT... 2 KEY FIGURES... 3 Q3 2017 HIGHLIGHTS... 3 NORLANDIA HEALTH & CARE GROUP AS... 5 GROUP ACTIVITIES... 5 FINANCIALS... 6 GROUP FINANCIAL
Interim Report Jan June, 2017
 Interim Report Jan June, 217 Sundsvall, July 21, 217 JANUARY 1 JUNE 3, 217 (compared with the year-earlier period) During the period, shares in the discontinued operation Essity (the hygiene business)
// BLOCK WATNE GRUPPEN QUARTER //
 // BLOCK WATNE GRUPPEN QUARTER 3 2006 // Block Watne Gruppen ASA REPORT FOR THE THIRD QUARTER 2006 Strong profit Stable progress for margins Solid order intake and backlog Key figures Block Watne Gruppen
INTERIM REPORT Q XXL ASA HIGHLIGHTS. Q2 Growth
 INTERIM REPORT Q2 2014 XXL ASA HIGHLIGHTS Total revenues of NOK 1 246 million (NOK 945 million), up 32 per cent EBITDA increased by 47 per cent to NOK 184 million Successful opening in Finland One new
Holmen s year-end report 2016
 Holmen s year-end report 216 Full Year 4-16 3-16 4-15 216 215 Net sales 3 937 3 81 3 689 15 513 16 14 Operating profit excl. items affecting comparability 579 52 376 2 162 1 7 Operating profit 579 52-555
Interim report January to June 2017
 Interim report January to June 2017 High and profitable growth Second quarter Net sales increased during the second quarter by 145,0% to 50,5 MSEK (20,6) Result before depreciation (EBITDA) increased during
Q third quarter of Solør Bioenergy Group Interim report for the
 Q3 2016 Solør Bioenergy Group Interim report for the third quarter of 2016 January September 2016 Solör Bioenergi Holding AB (publ), Corp. Reg. No. 556907 9535 Stockholm, October 28, 2016 www.solorbioenergi.com
CELULOSA ARAUCO Y CONSTITUCIÓN S.A. Second Quarter 2018 Results August 21, 2018
 CELULOSA ARAUCO Y CONSTITUCIÓN S.A. Second Quarter 2018 Results August 21, 2018 1 HIGHLIGHTS REVENUES U.S.$ 1,559.3 MILLION Arauco s revenues reached U.S.$ 1,559.3 million during the second quarter of
NYNAS INTERIM REPORT JANUARY JUNE SEK million
 Q 2 INTERIM REPORT 1 JANUARY 30 JUNE 2015 Nynas AB (Publ.), corporate re.no 556029-2509, parent company for Nynas. Nynas is a leading international group specialised in naphthenic specialty oils and bitumen.
Fredrik Börjesson. Stefan Hedelius
 15995949.1 Extraordinary General Meeting in Momentum Group AB (publ) on 28 November 2017. Account of the Board of Directors of Momentum Group AB (publ) in accordance with Chapter 19, Section 24, Paragraph
Interim report January March 2015
 Interim report January March Gross cash collections SEK 791m Portfolio acquisitions SEK 273m January March (compared with the first quarter ) Gross cash collections increased by 48 per cent to SEK 791m
Q Continued positive development in Southern Europe
 Q 4 2 0 1 5 Continued positive development in Southern Europe the quarter in brief 13.2% Increase in sales 15.9% Increase in operating profit 6.6% Operating margin sek 84.0M Net profit sek 1.95 Profit
Q1 Q Q3 Q EUR million Jan-Mar 2018 Jan-Mar 2017 Change, % EUR million Jan-Dec 2017
 Stockholm, Sweden, 4 May Eltel Group Interim report January March January March Group net sales decreased 10.5% to EUR 266.6 million (297.8), mainly as a result of divestments and on-going discontinuation
Interim report for 3 rd quarter 2012
 Interim report for 3 rd quarter 2012 Scana Industrier ASA is a Nordic industrial group whose key business is supplying products and system solutions to energy-related businesses. This encompasses oil and
CONTINUED IMPROVED EARNINGS
 The leading hotel company in the Nordics January September 2018 CONTINUED IMPROVED EARNINGS THIRD QUARTER IN SUMMARY Net sales rose by 22.6% to 4,874 MSEK (3,974), driven by more rooms in operation, including
Highlights. 2 nd quarter and first half 2018 / KEY FIGURES Q2 2018
 Highlights 2 nd quarter and first half 2018 / KEY FIGURES Q2 2018 Revenues of NOK 827 million in 2018, an increase of 42% EBITDA of NOK 65 million in 2018, an increase of 51% Order backlog of NOK 3,178
INTERIM REPORT JANUARY - SEPTEMBER 2017
 Interim report Q3 2017 January - September Troax Group AB (publ) Hillerstorp 6th of November, 2017 INTERIM REPORT JANUARY - SEPTEMBER 2017 JULY SEPTEMBER 2017 Order intake increased by 30 per cent to 35,3
INTERIM REPORT JANUARY SEPTEMBER * Net turnover amounted to MSEK 11,107 (10,772 excluding divested activities).
.") INTERIM REPORT JANUARY SEPTEMBER 2000 Highlights * Profit after financial items amounted to MSEK 4,317 (corresponding period 1999: 1,778). The third quarter profit amounted to MSEK 2,508 (second quarter:
INTERIM REPORT JANUARY SEPTEMBER 2000 Highlights * Profit after financial items amounted to MSEK 4,317 (corresponding period 1999: 1,778). The third quarter profit amounted to MSEK 2,508 (second quarter:
9 May 2016 Interim Report Rejlers AB January - March 2016
 Rejlers is one of the Nordic region's largest technical consultants. 2,100 experts work on projects in construction and property, energy, industry and infrastructure. We have specialist engineers with
FOURTH QUARTER NORSKE SKOG NORWEGIAN PAPER TRADITION
 2011 FOURTH QUARTER NORSKE SKOG NORWEGIAN PAPER TRADITION 1 INTERIM FINANCIAL REPORT NORSKE SKOG OUR BUSINESS Norske Skog is a world leading producer of newsprint and magazine paper. The group has 14 fully
Interim Report 4th quarter 2017 and preliminary report. Gjensidige Forsikring Group
 Interim Report 4th quarter 2017 and preliminary report Gjensidige Forsikring Group Group highlights Fourth quarter and preliminary result 2017 In the following, figures in brackets indicate the amount
NYNAS Interim report 1 january 30 June 2014
 NYNAS Interim report 1 january 30 June 2014 2 Interim report 1 january 30 June 2014Q2 Nynas AB (Publ.), corporate re. no 556029-2509, parent company for Nynas. Nynas is a leading international group specialised
Highlights of Handelsbanken s Annual Report
 Highlights of Handelsbanken s Annual Report HIGHLIGHTS OF ANNUAL REPORT JANUARY DECEMBER Highlights of Handelsbanken s Annual Report January - December Summary January December, compared with January December