2019 HUMBOLDT COUNTY REGIONAL HOUSING NEEDS ASSESSMENT PLAN
|
|
|
- Philip Sullivan
- 5 years ago
- Views:
Transcription


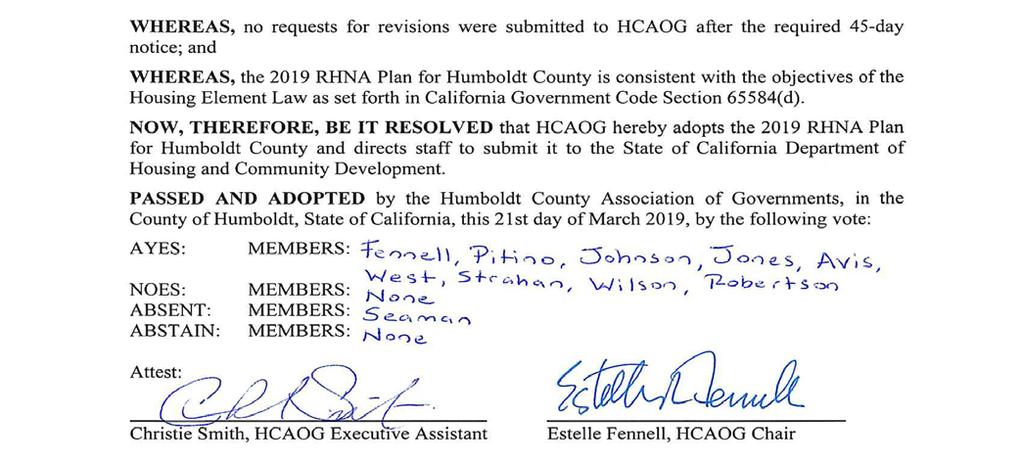
1 2019 HUMBOLDT COUNTY REGIONAL HOUSING NEEDS ASSESSMENT PLAN Sixth Housing Element Cycle Adopted March 21, 2019 HUMBOLDT COUNTY ASSOCIATION OF GOVERNMENTS Regional Transportation Planning Agency Humboldt County Local Transportation Authority Service Authority for Freeway Emergencies 611 I Street, Suite B, Eureka, CA
2
3 Table of Contents Introduction th RHNA Cycle s... 1 Comparisons... 2 RHNA Progress... 3 State Housing Law... 5 Methodology... 6 Appendix A Final Determination Letter from the State of California Department of Housing and Community Development Appendix B Housing Data provided by the State of California Department of Housing and Community Development... 18
4
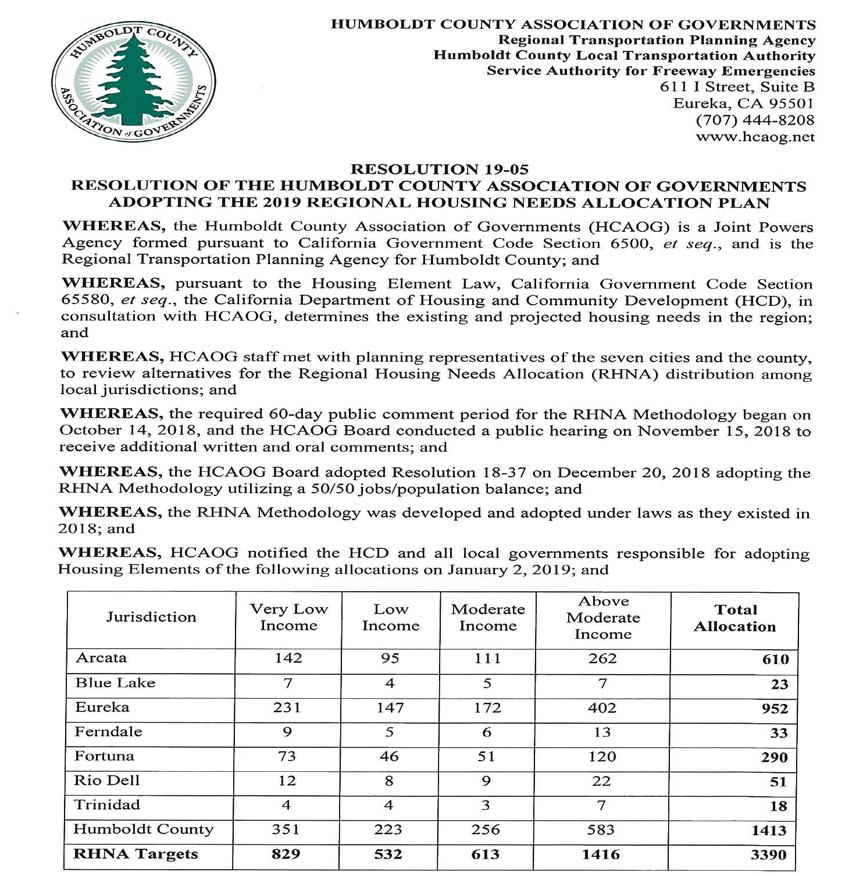
5 Introduction The Humboldt County Association of Governments (HCAOG) is a Joint Powers Authority (JPA). Membership includes Humboldt County and the cities of Arcata, Blue Lake, Eureka, Ferndale, Fortuna, Rio Dell and Trinidad. As directed in State Government Code Section 65584, the Department of Housing and Community Development (HCD) determines the existing and projected housing need for distinct regions in the state. In consultation with HCD, HCAOG is required to adopt a Regional Housing Needs Plan (RHNP) that allocates a share of the regional housing need to each city and county. HCAOG has prepared this Regional Housing Needs (RHNA) Plan to fulfill its mandated requirement to allocate by income category, each jurisdiction s fair share of projected housing needs for the period of December 31, 2018 through August 31, This period is the 6 th RHNA cycle since the requirements began in Housing allocations are important components of the Housing Element updates of the County and seven cities in Humboldt County. Cities and Counties are not required to provide housing designated by the RHNA process. The RHNA is a distribution of housing capacity that each city and county must zone for in a planning period. It is not a construction need allocation. 6 th RHNA Cycle s Development of this plan began with discussions with HCD in June of HCAOG received a final RHNA determination on August 27, 2018 (provided in Appendix A). HCAOG staff met with planning representatives on a regular basis from June through December. The HCAOG Board discussed the RHNA process and methodology in monthly meetings beginning in October. HCAOG s methodology was adopted at a public hearing on December 20, As indicated in the final determination from HCD, the 8.7year projection period begins December 31, 2018 and ends August 31, The allocation is based on the California Department of Finance projections. The statemandated RHNA process (Government Code Sections et seq.) requires HCAOG to develop a methodology that determines how to divide and allocate an overall allocation that the region receives from the state to local jurisdictions. HCD s housing need determination is as follows: HCD Final RHNA Determination for Humboldt County Income Category Percent Housing Unit Need Very Low* 24.4% 829 Low 15.7% 532 Moderate 18.1% 613 Above Moderate 41.8% 1,416 Total 100.0% 3,390 *ExtremelyLow 12.3% Included in VeryLow Category 1
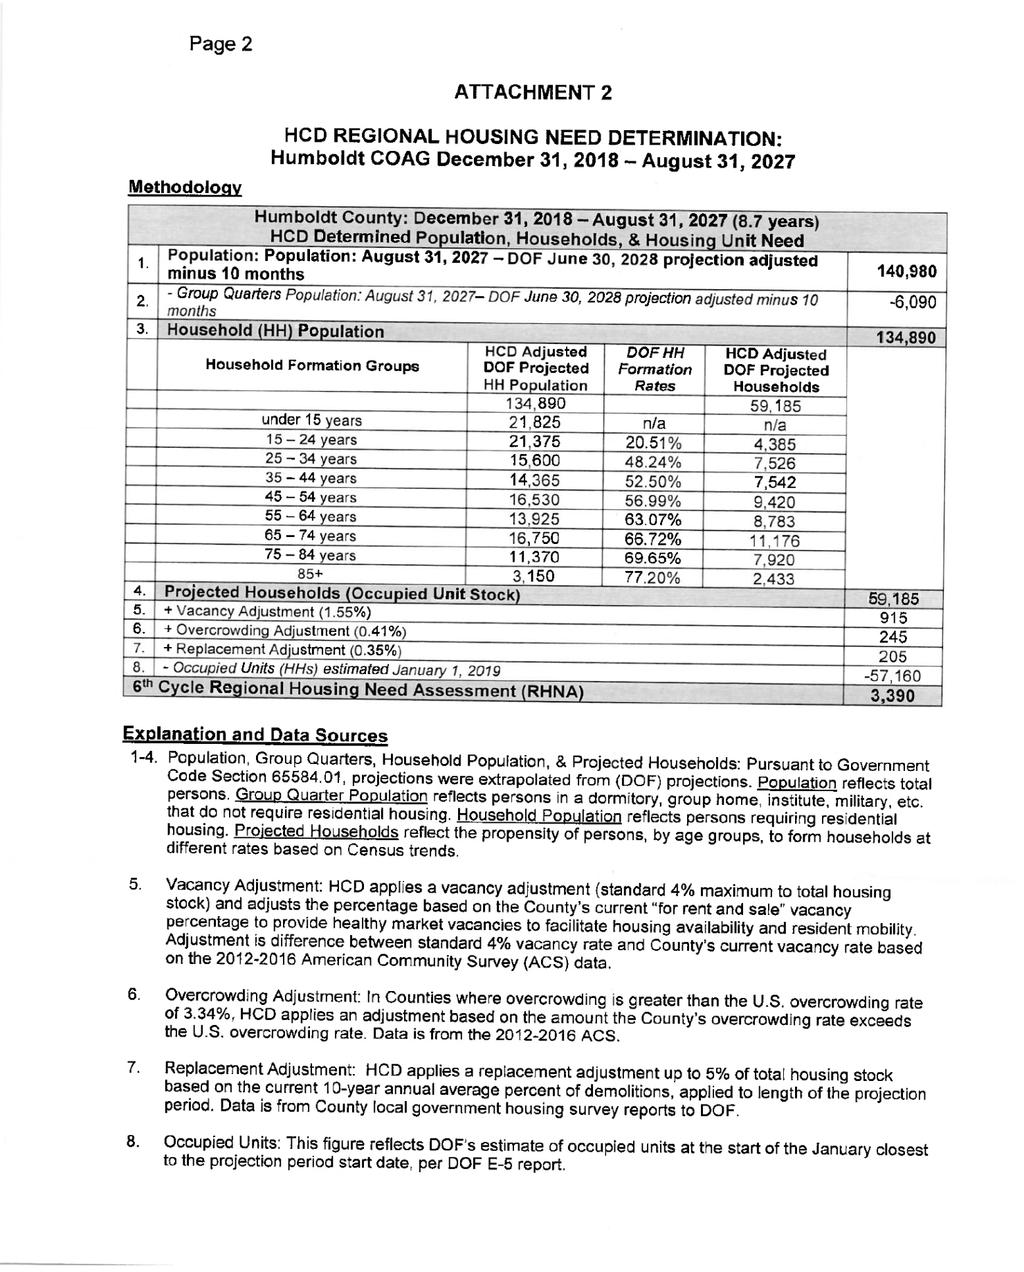
6 At a noticed public hearing, the HCAOG Board adopted a RHNA methodology at their December 20, 2019 Board meeting. The methodology utilized available population and employment data using equal weighting. The final allocations are summarized as follows: Final 2019 Overall RHNA Jurisdiction EDD DOF Jobs Population JobsPop RHNA Employment Data Population (1/1/2018) Distribution Distribution 5050 Split % Arcata 10,362 18, % 13.5% 18.0% 610 Blue Lake 182 1, % 0.9% 0.7% 23 Eureka 16,956 26, % 19.4% 28.1% 952 Ferndale 422 1, % 1.0% 1.0% 33 Fortuna 3,819 12, % 8.9% 8.6% 290 Rio Dell 246 3, % 2.5% 1.5% 51 Trinidad % 0.2% 0.5% 18 Unincorporated Area 13,754 72, % 53.6% 41.7% 1,414 Totals 46, , % 100.0% 100.0% 3,390 Final 2019 RHNA by Income Category Very Low Income Low Income Moderate Income Above Moderate Proposed Total RHNA Jurisdiction Arcata Blue Lake Eureka Ferndale Fortuna Rio Dell Trinidad Unincorporated Area RHNA TARGETS Comparisons The methodology used by HCD in determining the overall RHNA determination is based on projected population and projected households for Humboldt County. HCD applies additional units to correct for overcrowding, low vacancy rates, and demolition rates. A more detailed explanation is included in HCD s RHNA Determination letter provided in Appendix A. Of note, although HCD has cited a projected population increase of only 4,978 residents over the next 8.7 years, their methodology calls for the planning of 3,390 housing units in the planning period. HCD s required allocation percentage for Very Low Income and Low Income housing units have not changed since the 5 th cycle in 2013 and have slightly decreased since the 4 th cycle in A comparison of HCAOG s RHNA Determination for the last three cycles is provided below. 2
7 Comparison of HCAOG s RHNA s RHNA Very Low Low Moderate Above Moderate Total Cycle % % % % 4 th 24.8% % % % th 24.4% % % % th 24.4% % % % The sixth cycle allocation has not significantly increased since the 5 th cycle allocation on an annualized basis. Comparison of RHNA Cycle Planning Periods RHNA Cycle Planning Period (PP) HCD /PP Annualized RHNA Cycle 2 12/31/9006/30/97 5,984/6.5 years 921/year Cycle 3 12/31/0006/30/08 3,975/7.5 years 530/year Cycle 4 12/31/0606/30/14 4,747/7.5 years 633/year Cycle 5 12/31/1306/30/19 2,060/5.5 years 375/year Cycle 6 12/31/1808/31/27 3,390/8.7 years 390/year RHNA Progress HCAOG s RHNA Plan establishes housing development targets for member city and county statemandated Housing Element Updates. Each of the seven incorporated cities and the County of Humboldt unincorporated area are required to update their Housing Element to accommodate adequate general plan and zoning capacity for their allocation by income. It is up to each local government to plan where and how the allocated housing units will be developed in their communities. A look all of the housing elements previously submitted by Humboldt s local governments, only minor zoning and land use changes may be required for the cities of Arcata and Eureka. The information provided in the following tables were compiled by reviewing adopted or draft housing elements, in addition information readily available on HCD s website. Comparison of RHNA Cycle Planning Periods Jurisdiction Year of Housing Element Previously Reported Residential Housing Inventory Reported Permits Since 5 th RHNA Cycle as of 2017 Arcata 2014 (Adopted) Blue Lake 2018 (Draft) 95 No Reports Submitted Eureka 2014 (Adopted) Ferndale 2014 (Adopted) 256 No Reports Submitted Fortuna 2018 (Adopted) Rio Dell Due No Reports Submitted Trinidad Due No Reports Submitted Humboldt County 2014 (Adopted)
8 All California cities and counties are required by Government Code (Sections ) to adopt housing elements as part of their general plans. Two cities in Humboldt County are currently out of compliance. HCD is required to review RHNA plans and housing elements. Agencies found not in compliance at the time of assignment of the new RHNA allocation must accommodate both the current and prior allocations in their update. Housing elements must be revised and updated to reflect their assigned RHNA each cycle. A city or county that does not adopt its housing element within 120 days after the due date (August 31, 2019) will be required to revise its housing element every four years on time, rather than every eight for at least two consecutive revisions (Section 65588(e)(4). Cities and counties that have not yet adopted a housing element in the current cycle can also not disapprove an affordable housing development that does not comply with the general plan and zoning (Section (d)(5)). Progress made toward RHNA, by income category, since the last RHNA cycle is provided for those agencies that have reported their permit history to HCD, as of Four out of Humboldt s eight jurisdictions have reported permit history by income level to HCD. City of Arcata Permits 2013 RHNA Very Low Income Low Income 5 56 Moderate Income Above Moderate Income City of Eureka Permits 2013 RHNA Very Low Income Low Income Moderate Income Above Moderate Income City of Fortuna Permits 2013 RHNA Very Low Income 0 39 Low Income 0 24 Moderate Income 4 27 Above Moderate Income
9 County of Humboldt Permits 2013 RHNA Very Low Income Low Income Moderate Income Above Moderate Income State Housing Law State law requires each city and county to adopt a general plan. The housing element is one of the seven mandated elements of the local general plan. Housing element law, enacted in 1969, mandates that local governments adequately plan to meet the existing and projected housing needs of all economic segments of the community. The housing elements of all general plans are reviewed by HCD to ensure compliance with State law. The allocation of housing need to a jurisdiction is a key component of the housing element. The State is required to allocate the region s share of the statewide housing need to Councils of Governments (COG) based on Department of Finance population (DOF) projections and regional population forecasts used in preparing regional transportation plans. The region s COG, HCAOG in Humboldt County, is then required to develop a RHNA Plan to describe the region s allocation method and determine a final allocation of housing need to the jurisdictions in the region (Government Code, Sections et seq). Recently passed Assembly Bills 1771 and 2238, effective January 1, 2019, amended RHNA legislation that will affect the 7 th RHNA cycle. HCAOG s methodology was approved consistent with legislation of State law requires that the final RHNA Plan shall be consistent with the following objectives: 1. Increasing the housing supply and the mix of housing types, tenure, and affordability in all cities and counties within the region in an equitable manner, which shall result in each jurisdiction receiving an allocation of units for low and very lowincome households. 2. Promoting infill development and socioeconomic equity, the protection of environmental and agricultural resources, and the encouragement of efficient development patterns. 3. Promoting an improved intraregional relationship between jobs and housing. 4. Allocating a lower proportion of housing need to an income category when a jurisdiction already has a disproportionately high share of households in that income category, as compared to the countywide distribution of households in that category from the most recent decennial United States census. Consistent with these objectives, the adopted methodology utilized in this plan seeks to increase housing opportunity with a mix of housing types, tenure and affordability in all 5
10 jurisdictions within the region by allocating units to each jurisdiction in each income category. Each jurisdiction s allocation is trended towards the regional income category average, thus working to improve imbalances in the income distributions within the region. Existing data of income categories for each jurisdiction, compiled by HCD, is provided in Appendix B. Jurisdictions must plan and zone accordingly for different levels of density, thus making different product types available for development. Higher density zoning offers the option of providing more affordable units. Methodology The mandated 60day Public Notice for the 6 th Regional Housing Needs Methodology began on October 14, The HCAOG Board discussed the methodology at their meeting in October and held a noticed Public Hearing on November 15, Planning representative coordinated this cycle from June through December The final methodology was adopted at their December 20, 2018 meeting. All jurisdictions were notified of the draft RHNA on January 1, There were no appeals submitted during the appeal period. Consistent with California Government Code Section (b), HCAOG surveyed each member jurisdiction to request information regarding the factors listed in California Government Code Section (d), provided below. In accordance with the law, HCAOG sought to obtain the survey information in a manner and format that is comparable throughout the region and utilize readily available data to the extent possible. The law also states that none of the information received in response to the survey may be used as a basis for reducing the total housing need established for the region. Two out of the eight jurisdictions in the region (Ferndale and the County) responded to the survey. Discussions with planning staff from jurisdictions in the region emphasized that similar to prior RHNA cycles, the only readily available data comparable throughout the region are population and employment data. The source information for this data used in the methodology alternatives is posted on HCAOG s website and will be provided to anyone upon request. California Government Code Section (d) indicates that the following factors be considered in developing the methodology: (1) Each member jurisdiction's existing and projected jobs and housing relationship. The City of Ferndale has a high percentage of retirees which supports their comment that a high population does not necessarily indicate that a significant percentage is employed. This situation should be taken into account when considering the jobs/population balance with respect to the final methodology. The County of Humboldt commented that their higher density residential zoning is centered around the more urban areas of the unincorporated areas to plan for improved jobs/housing balances in the future. (2) The opportunities and constraints to development of additional housing in each member jurisdiction, including all of the following: (A) Lack of capacity for sewer or water service due to federal or state laws, regulations or regulatory actions, or supply and distribution decisions made by a sewer or water service provider other than the local jurisdiction that preclude the jurisdiction from providing necessary infrastructure for additional development during the planning period. 6
11 No jurisdiction cited lack of capacity for sewer or water service due to laws or regulations. In discussions, most cities have cited issues with increased capacity, but as stated above, there is no action that would preclude the jurisdiction from providing necessary infrastructure for additional development. (B) The availability of land suitable for urban development or for conversion to residential use, the availability of underutilized land, and opportunities for infill development and increased residential densities. The council of governments may not limit its consideration of suitable housing sites or land suitable for urban development to existing zoning ordinances and land use restrictions of a locality, but shall consider the potential for increased residential development under alternative zoning ordinances and land use restrictions. The determination of available land suitable for urban development may exclude lands where the Federal Emergency Management Agency (FEMA) or the Department of Water Resources has determined that the flood management infrastructure designed to protect that land is not adequate to avoid the risk of flooding. Both the City of Ferndale and the County of Humboldt cited significant limitations due to resource lands and prime agricultural soils. That being said, the high RHNA allocation in 2013 (1,357 more units than the current determination), lends to the fact that Humboldt s jurisdictions should have available residential land inventories. Of our eight jurisdictions, five are in compliance with HCD regarding their Housing Elements. Of the other three, one has submitted a draft this month and is currently being reviewed. (C) Lands preserved or protected from urban development under existing federal or state programs, or both, designed to protect open space, farmland, environmental habitats, and natural resources on a longterm basis. Jurisdictions currently exclude such lands in their housing element s residential land inventories. (D) County policies to preserve prime agricultural land, as defined pursuant to Section 56064, within an unincorporated area. To preserve prime agricultural land, the County s zoning ordinance and general plan limit the allowed uses and residential densities on prime agricultural land through its Agriculture Exclusive zoning designation. The County also implements a Williamson Act Agricultural Preserve program which keeps prime agricultural land in agricultural use. (3) The distribution of household growth assumed for purposes of a comparable period of regional transportation plans and opportunities to maximize the use of public transportation and existing transportation infrastructure. Transit systems serve seven of the region s eight jurisdictions. Infill development opportunities are along existing transit routes. The response from the City of Ferndale emphasized that their city limit boundary is one square mile, that most goods and services within the City are accessible by walking or biking. Although no adjustments to the methodology based on this factor were included in the methodology, HCAOG recommends that inclusion of this need be considered in all housing element updates. 7
12 (4) The market demand for housing. The City of Ferndale cited a healthy housing market trend. The County of Humboldt indicated that the market demand will continue to encourage less expensive, more affordable homes in areas with full urban services. (5) Agreements between a county and cities in a county to direct growth toward incorporated areas of the County. There are no formal agreements offered for the methodology, although Section does allow a transfer between a City and the County between adoption of the final RHNA Plan and the due date of the housing element under certain conditions. (6) The loss of units contained in assisted housing developments, as defined in paragraph (9) of subdivision (a) of Section 65583, that changed to nonlowincome use through mortgage prepayment, subsidy contract expirations, or termination of use restrictions. No jurisdiction submitted information regarding the number of units at risk for the next cycle. Each individual jurisdiction should consider this category of need in their respective housing elements. (7) Highhousing cost burdens. Highhousing cost burdens are a regionwide problem and therefore, no adjustments to the methodology based on this factor were considered. (8) The housing needs of farmworkers. As defined by the California Employment Development Department (EDD), regular (year round) farmworkers are those working 150 or more days for the same employer. Seasonal workers are those who work less than 150 days annually for the same employer. Migrant seasonal workers are defined as those who travel more than 50 miles across county lines to obtain agriculture employment. The RHNA Plan concentrates on determining a needed increase in housing available for year round occupancy. It is assumed that seasonal and migrant workers will continue to be housed in nonyear round units. No net increase in seasonal or migrant housing is anticipated. Regular farmworker housing has been addressed, in part, in the allocation for very low and lowincome housing. (9) The housing needs generated by the presence of a private university or a campus of the California State University or the University of California within any member jurisdiction. The City of Arcata accommodates the majority of the student housing needs based on its proximity to Humboldt State University (HSU). No data or statistical information was provided to be incorporated into the RHNA methodology. (10) Any other factors adopted by the council of governments. No additional factor has been considered this cycle. The HCAOG Board considered three methodology alternatives. Data used to determine the total share to each jurisdiction was developed by the Department of Finance (population projections) and by the Labor Market Information Division of the California Employment 8
13 Development Department (quarterly workforce indicators). The following table summarizes this data and outcome: Jurisdiction Alternative 1: Weighting jobs at 40% and population at 60% EDD DOF Jobs Population Employment Population Distribution Distribution Data (1/1/2018) JobsPop % RHNA Arcata 10,362 18, % 13.5% 17.1% 580 Blue Lake 182 1, % 0.9% 0.7% 24 Eureka 16,956 26, % 19.4% 26.3% 893 Ferndale 422 1, % 1.0% 1.0% 33 Fortuna 3,819 12, % 8.9% 8.6% 292 Rio Dell 246 3, % 2.5% 1.7% 57 Trinidad % 0.2% 0.5% 16 Unincorporated 13,754 72, % 53.6% 44.1% 1,494 Area Totals 46, , % 100.0% 100.0% 3,390 Jurisdiction Alternative 2: Weighting jobs at and population at 50% EDD DOF Jobs Employment Population Distribution Data (1/1/2018) Population Distribution JobsPop % RHNA Arcata 10,362 18, % 13.5% 18.0% 610 Blue Lake 182 1, % 0.9% 0.7% 23 Eureka 16,956 26, % 19.4% 28.1% 952 Ferndale 422 1, % 1.0% 1.0% 33 Fortuna 3,819 12, % 8.9% 8.6% 290 Rio Dell 246 3, % 2.5% 1.5% 51 Trinidad % 0.2% 0.5% 18 Unincorporated 13,754 72, % 53.6% 41.7% 1,414 Area Totals 46, , % 100.0% 100.0% 3,390 9
14 Jurisdiction Alternative 3: Weighting jobs at 60% and population at 40% EDD DOF Jobs Population Employment Population Distribution Distribution Data (1/1/2018) JobsPop % RHNA Arcata 10,362 18, % 13.5% 18.9% 640 Blue Lake 182 1, % 0.9% 0.6% 21 Eureka 16,956 26, % 19.4% 29.8% 1011 Ferndale 422 1, % 1.0% 1.0% 32 Fortuna 3,819 12, % 8.9% 8.5% 288 Rio Dell 246 3, % 2.5% 1.3% 44 Trinidad % 0.2% 0.6% 20 Unincorporated 13,754 72, % 53.6% 39.3% 1,333 Area Totals , % 100.0% 100.0% 3,390 The HCAOG Board fully considered Alternatives 2 and 3 at their November and December meetings. Alternative 2, the methodology utilizing an equal 50/50 jobs/population weighting was adopted as the methodology for the 6 th RHNA cycle. The following tables show the most recent data of income categories by jurisdiction (Appendix B), with the regional average at the bottom. The adopted methodology takes the differences into consideration in allocation the RHNA by income category to move all jurisdictions towards the regional averages. Percentage of Households by Income Category by Jurisdiction per Census Very Low Low Moderate Above Moderate TOTAL (<50% MHI) (5080% MHI) (80120% MHI) (>120% MHI) UNITS Arcata 36.99% 16.32% 16.57% 30.12% 610 Blue Lake 18.53% 19.27% 13.47% 48.73% 23 Eureka 25.85% 18.36% 18.31% 37.48% 952 Ferndale 21.84% 20.96% 22.76% 34.44% 33 Fortuna 21.32% 15.28% 22.60% 40.79% 290 Rio Dell 27.88% 13.96% 16.47% 41.70% 51 Trinidad 22.25% 8.11% 22.58% 47.06% 18 Unincorporated Area 21.27% 14.51% 17.70% 46.51% 1413 HCD Regional Targets 24.45% 15.69% 18.08% 41.77% 3390 Source: American Communities Survey Table DP03. Median Household Income (MHI) = $42,682 The following series of tables show the methodology proposed to bring each city closer to HCD s regional targets. Using the same methodology from the last RHNA cycle, each city s percentage was adjusted by 10% towards the regional target. When the total units ended up less than HCD s regional target, an additional unit was added to the agency with the ACS data farthest away from the regional target. The following examples show the methodology for both Arcata, with the highest percentage of very lowincome units, and Blue Lake, with the lowest percentage of very lowincome units in the region: 10
15 Very Low Income (<50% MHI) 110% Adjustment towards Regional Goal of 24.45% VERY LOW Income using adjusted % Arcata: 36.99% (36.99%24.45%) x 110% = 23.20% 23.20% of 610 units = 142 units Blue Lake: 18.53% (18.53%24.45%) x 110% = 25.04% 25.04% of 23 units = 7 units. A final adjustment of one unit was then added to Blue Lake s very lowincome category to meet HCD s Very Low Income RHNA target. Jurisdiction Low Income (5080% MHI) 110% Adjustment towards Regional Goal of 15.69% Income using adjusted % Jurisdictional adjustment to meet HCD target Income Level Arcata 16.32% 15.63% % 15.34% 4 4 Eureka 18.36% 15.43% Ferndale 20.96% 15.17% 5 5 Fortuna 15.28% 15.73% Rio Dell 13.96% 15.87% 8 8 Trinidad 8.11% 16.45% Unincorporated Area 14.51% 15.81% RHNA TARGETS 532 Units LOW Jurisdictional adjustment to meet HCD target Income Level Jurisdiction Arcata 36.99% 23.20% Blue Lake 18.53% 25.04% Eureka 25.85% 24.31% Ferndale 21.84% 24.71% Fortuna 21.32% 24.76% Rio Dell 27.88% 24.11% Trinidad 22.25% 24.67% 4 4 Unincorporated Area 21.27% 24.77% RHNA TARGETS 829 Units
16 110% Adjustment towards Regional Goal of 18.08% MODERATE Income Using Adjusted % Jurisdictional adjustment to meet HCD target Income Level Moderate Jurisdiction (80120% MHI) Arcata 16.57% 18.24% Blue Lake 13.47% 18.55% Eureka 18.31% 18.06% Ferndale 22.76% 17.62% 6 6 Fortuna 22.60% 17.64% Rio Dell 16.47% 18.25% 9 9 Trinidad 22.58% 17.64% 3 3 Unincorporated Area 17.70% 18.13% RHNA TARGETS 613 Units Above Moderate Income (>120% MHI) ABOVE MODERATE INCOME 110% Adjustment towards Regional Goal of 41.77% Income using adjusted % Jurisdictional adjustment to meet HCD target Income Level Jurisdiction Arcata 30.12% 42.93% Blue Lake 48.73% 41.07% Eureka 37.48% 42.20% Ferndale 34.44% 42.50% Fortuna 40.79% 41.87% Rio Dell 41.70% 41.77% Trinidad 47.06% 41.24% 7 7 Unincorporated Area 46.51% 41.29% RHNA TARGETS 1416 Units The jurisdictional adjustments in the Above Moderate Income table were applied to meet the total RHNA allocations by income category determined by HCD. The following table summarizes proposed 50/50 jobs/population split RHNA allocations by income category for the region: Very Low Income Moderate Income Proposed Total RHNA Low Income Above Moderate Jurisdiction Arcata Blue Lake Eureka Ferndale Fortuna Rio 5ell Trinidad Unincorporated Area RHNA TARGETS
17 Appendix A Final Determination Letter from the State of California Department of Housing and Community Development 13
18 14
19 15
20 16
21 17
22 Appendix B Housing Data provided by the State of California Department of Housing and Community Development 18
23 Income Limits in Each Category: Max % of Median Starting Highest Extremely low (30%) $ 12,806 Median Household Income 42,685 Very Low (50%) $ 12,807 $ 21,343 Low (80%) $ 21,344 $ 34,148 Moderate (120%) $ 34,149 $ 51,222 Households in Bracket Income Brackets Determination of County's Number/Percentage of Households By Income Category ACS Arcata Extreme Low carryover 19 $ 51,223 all else Very Low carryover Low carryover Moderate carryover Above Moderate 1,234 $ $ 10,000 1, $ 10,000 $ 14, $ 15,000 $ 24, $ 25,000 $ 34, ,061 $ 35,000 $ 49,999 1, $ 50,000 $ 74, $ 75,000 $ 99, $ 100,000 $ 149, $ 150,000 $ 199, $ 200,000 $ 999, Above Moderate 7,111 1,687 2,630 1,160 1,178 2, % 23.72% 36.99% 16.32% 16.57% 30.12% Note: "carryover" column reflects calculation of households (ratio) counted in next income group. Group Income is calculated by multiplying county median income against percentage (50%/80%/120%) representing income category Source: American Communities Survey DP03 Data
24 Income Limits in Each Category: Max % of Median Starting Highest Extremely low (30%) $ 12,806 Median Household Income 42,685 Very Low (50%) $ 12,807 $ 21,343 Low (80%) $ 21,344 $ 34,148 Moderate (120%) $ 34,149 $ 51,222 Households in Bracket Income Brackets Determination of County's Number/Percentage of Households By Income Category ACS Blue Lake Extreme Low carryover $ 51,223 all else Very Low carryover Low carryover Moderate carryover Above Moderate 36 $ $ 10, $ 10,000 $ 14, $ 15,000 $ 24, $ 25,000 $ 34, $ 35,000 $ 49, $ 50,000 $ 74, $ 75,000 $ 99, $ 100,000 $ 149, $ 150,000 $ 199, $ 200,000 $ 999,999 4 Above Moderate % 10.81% 18.53% 19.27% 13.47% 48.73% Note: "carryover" column reflects calculation of households (ratio) counted in next income group. Group Income is calculated by multiplying county median income against percentage (50%/80%/120%) representing income category Source: American Communities Survey DP03 Data 20
25 Income Limits in Each Category: Max % of Median Starting Highest Extremely low (30%) $ 12,806 Median Household Income 42,685 Very Low (50%) $ 12,807 $ 21,343 Low (80%) $ 21,344 $ 34,148 Moderate (120%) $ 34,149 $ 51,222 Households in Bracket Income Brackets Determination of County's Number/Percentage of Households By Income Category ACS Eureka Extreme Low carryover $ 51,223 all else Very Low carryover Low carryover Moderate carryover Above Moderate 657 $ $ 10, ,034 $ 10,000 $ 14, ,801 $ 15,000 $ 24,999 1, ,480 $ 25,000 $ 34,999 1, ,786 $ 35,000 $ 49,999 1,786 1,957 $ 50,000 $ 74, ,861 1,861 1,123 $ 75,000 $ 99,999 1, $ 100,000 $ 149, $ 150,000 $ 199, $ 200,000 $ 999, Above Moderate 10,962 1,237 2,833 2,013 2,008 4, % 11.29% 25.85% 18.36% 18.31% 37.48% Note: "carryover" column reflects calculation of households (ratio) counted in next income group. Group Income is calculated by multiplying county median income against percentage (50%/80%/120%) representing income category Source: American Communities Survey DP03 Data 21
26 Income Limits in Each Category: Max % of Median Starting Highest Extremely low (30%) $ 12,806 Median Household Income 42,685 Very Low (50%) $ 12,807 $ 21,343 Low (80%) $ 21,344 $ 34,148 Moderate (120%) $ 34,149 $ 51,222 Households in Bracket Income Brackets Determination of County's Number/Percentage of Households By Income Category ACS Ferndale Extreme Low carryover $ 51,223 all else Very Low carryover Low carryover Moderate carryover Above Moderate 44 $ $ 10, $ 10,000 $ 14, $ 15,000 $ 24, $ 25,000 $ 34, $ 35,000 $ 49, $ 50,000 $ 74, $ 75,000 $ 99, $ 100,000 $ 149, $ 150,000 $ 199, $ 200,000 $ 999, Above Moderate % 8.80% 21.84% 20.96% 22.76% 34.44% Note: "carryover" column reflects calculation of households (ratio) counted in next income group. Group Income is calculated by multiplying county median income against percentage (50%/80%/120%) representing income category Source: American Communities Survey DP03 Data 22
27 Income Limits in Each Category: Max % of Median Starting Highest Extremely low (30%) $ 12,806 Median Household Income 42,685 Very Low (50%) $ 12,807 $ 21,343 Low (80%) $ 21,344 $ 34,148 Moderate (120%) $ 34,149 $ 51,222 Households in Bracket Income Brackets Determination of County's Number/Percentage of Households By Income Category ACS Fortuna Extreme Low carryover $ 51,223 all else Very Low carryover Low carryover Moderate carryover Above Moderate 201 $ $ 10, $ 10,000 $ 14, $ 15,000 $ 24, $ 25,000 $ 34, $ 35,000 $ 49, $ 50,000 $ 74, $ 75,000 $ 99, $ 100,000 $ 149, $ 150,000 $ 199, $ 200,000 $ 999, Above Moderate 4, ,004 1, % 9.22% 21.32% 15.28% 22.60% 40.79% Note: "carryover" column reflects calculation of households (ratio) counted in next income group. Group Income is calculated by multiplying county median income against percentage (50%/80%/120%) representing income category Source: American Communities Survey DP03 Data 23
28 Income Limits in Each Category: Max % of Median Starting Highest Extremely low (30%) $ 12,806 Median Household Income 42,685 Very Low (50%) $ 12,807 $ 21,343 Low (80%) $ 21,344 $ 34,148 Moderate (120%) $ 34,149 $ 51,222 Households in Bracket Income Brackets Determination of County's Number/Percentage of Households By Income Category ACS Rio Dell Extreme Low carryover $ 51,223 all else Very Low carryover Low carryover Moderate carryover Above Moderate 92 $ $ 10, $ 10,000 $ 14, $ 15,000 $ 24, $ 25,000 $ 34, $ 35,000 $ 49, $ 50,000 $ 74, $ 75,000 $ 99, $ 100,000 $ 149, $ 150,000 $ 199, $ 200,000 $ 999,999 Above Moderate 1, % 12.85% 27.88% 13.96% 16.47% 41.70% Note: "carryover" column reflects calculation of households (ratio) counted in next income group. Group Income is calculated by multiplying county median income against percentage (50%/80%/120%) representing income category Source: American Communities Survey DP03 Data 24
29 Income Limits in Each Category: Max % of Median Starting Highest Extremely low (30%) $ 12,806 Median Household Income 42,685 Very Low (50%) $ 12,807 $ 21,343 Low (80%) $ 21,344 $ 34,148 Moderate (120%) $ 34,149 $ 51,222 Households in Bracket Income Brackets Determination of County's Number/Percentage of Households By Income Category ACS Trinidad Extreme Low carryover $ 51,223 all else Very Low carryover Low carryover Moderate carryover Above Moderate 4 $ $ 10, $ 10,000 $ 14, $ 15,000 $ 24, $ 25,000 $ 34, $ 35,000 $ 49, $ 50,000 $ 74, $ 75,000 $ 99, $ 100,000 $ 149, $ 150,000 $ 199, $ 200,000 $ 999, Above Moderate % 6.89% 22.25% 8.11% 22.58% 47.06% Note: "carryover" column reflects calculation of households (ratio) counted in next income group. Group Income is calculated by multiplying county median income against percentage (50%/80%/120%) representing income category Source: American Communities Survey DP03 Data 25
30 Income Limits in Each Category: Max % of Median Starting Highest Extremely low (30%) $ 12,806 Median Household Income 42,685 Very Low (50%) $ 12,807 $ 21,343 Low (80%) $ 21,344 $ 34,148 Moderate (120%) $ 34,149 $ 51,222 Households in Bracket Income Brackets Determination of County's Number/Percentage of Households By Income Category ACS Humboldt County Extreme Low carryover $ 51,223 all else Very Low carryover Low carryover Moderate carryover Above Moderate 1,926 $ $ 10,000 1, ,901 $ 10,000 $ 14,999 1, ,535 $ 15,000 $ 24,999 2,242 1,293 1,293 3,112 $ 25,000 $ 34,999 2, ,524 $ 35,000 $ 49,999 4,524 5,353 $ 50,000 $ 74, ,091 5,091 3,330 $ 75,000 $ 99,999 3,330 3,027 $ 100,000 $ 149,999 3, $ 150,000 $ 199, $ 200,000 $ 999, Above Moderate 28,528 2,993 6,069 4,140 5,051 13, % 10.49% 21.27% 14.51% 17.70% 46.51% Note: "carryover" column reflects calculation of households (ratio) counted in next income group. Group Income is calculated by multiplying county median income against percentage (50%/80%/120%) representing income category Source: American Communities Survey DP03 Data 26
Item #6 Information. Regional Planning Partnership. Subject: Introduction to Regional Housing Needs Allocation (RHNA)
") Item #6 Information Regional Planning Partnership January 23, 2019 Subject: Introduction to Regional Housing Needs Allocation (RHNA) Issue: What is the Regional Housing Needs Allocation, and what does
Item #6 Information Regional Planning Partnership January 23, 2019 Subject: Introduction to Regional Housing Needs Allocation (RHNA) Issue: What is the Regional Housing Needs Allocation, and what does
4.12 POPULATION AND HOUSING
 4.12 POPULATION AND HOUSING 4.12.1 INTRODUCTION This section describes the existing socioeconomic conditions, including population, housing, and employment, within the Specific Plan Area and provides an
4.6 POPULATION AND HOUSING
 L S A A S S O C I A T E S, I N C. D R A F T E N V I R O N M E N T A L I M P A C T R E P O R T 4.6 POPULATION AND HOUSING 4.6.1 Introduction This section provides a discussion of the existing population,
Population, Housing, and Employment Methodology
 Appendix O Population, Housing, and Employment Methodology Final EIR APPENDIX O Methodology Population, Housing, and Employment Methodology This appendix describes the data sources and methodologies employed
COMMUNITY REINVESTMENT ACT PERFORMANCE EVALUATION
 PUBLIC DISCLOSURE August 24, 2009 COMMUNITY REINVESTMENT ACT PERFORMANCE EVALUATION First State Bank of Red Bud RSSD # 356949 115 West Market Street Red Bud, Illinois 62278 Federal Reserve Bank of St.
ECONOMIC ISSUES AND OPPORTUNITIES PAPER
 ECONOMIC ISSUES AND OPPORTUNITIES PAPER Introduction The purpose of this paper is to identify important economic issues that need to be addressed in order to create policy options for the City of Simi
Sketch Plan Alternatives: Summary of Planning Commission and Board of Supervisors Recommendations
 HUMBOLDT COUNTY GENERAL PLAN UPDATE Sketch Plan Alternatives: Summary of Planning Commission and Board of Supervisors Recommendations September 2004 Prepared by Humboldt County Department of Community
78th OREGON LEGISLATIVE ASSEMBLY Regular Session. Enrolled. House Bill 2643
 78th OREGON LEGISLATIVE ASSEMBLY--2015 Regular Session Enrolled House Bill 2643 Sponsored by Representative LIVELY, Senator BEYER, Representative READ (Presession filed.) CHAPTER... AN ACT Relating to
Minimum Elements of a Local Comprehensive Plan
 Minimum Elements of a Local Comprehensive Plan Background OKI is an association of local governments, business organizations and community groups serving more than 180 cities, villages, and townships in
House Bill 3146 Ordered by the House July 1 Including House Amendments dated April 21 and July 1
 th OREGON LEGISLATIVE ASSEMBLY--0 Regular Session Sponsored by Representative SMITH G B-Engrossed House Bill Ordered by the House July Including House Amendments dated April and July SUMMARY The following
CITY OF PALM DESERT COMPREHENSIVE GENERAL PLAN
 Comprehensive General Plan/Administration and Implementation CITY OF PALM DESERT COMPREHENSIVE GENERAL PLAN CHAPTER II ADMINISTRATION AND IMPLEMENTATION This Chapter of the General Plan addresses the administration
UNMET TRANSIT NEEDS REPORT OF FINDINGS FY 19/20
 UNMET TRANSIT NEEDS REPORT OF FINDINGS FY 19/20 Humboldt County Association of Governments (HCAOG) 611 I Street, Suite B, Eureka, CA 95501 (707) 444-8208 www.hcaog.net 0 January 10, 2019 TABLE OF CONTENTS
PUBLIC DISCLOSURE. September 4, 2001 COMMUNITY REINVESTMENT ACT PERFORMANCE EVALUATION CITIZENS BANK OF EDMOND RSSD#
 PUBLIC DISCLOSURE COMMUNITY REINVESTMENT ACT PERFORMANCE EVALUATION CITIZENS BANK OF EDMOND RSSD# 172457 ONE EAST 1 st STREET, P.O. BOX 30 EDMOND, OKLAHOMA 73034 Federal Reserve Bank of Kansas City 925
Introduction P O L I C Y D O C U M E N T P A R T 1
 P O L I C Y D O C U M E N T P A R T 1 Introduction The 2035 General Plan for San Joaquin County presents a vision for the County's future and a strategy to make that vision a reality. The Plan is the result
SENATE, No. 846 STATE OF NEW JERSEY. 218th LEGISLATURE PRE-FILED FOR INTRODUCTION IN THE 2018 SESSION
 SENATE, No. STATE OF NEW JERSEY th LEGISLATURE PRE-FILED FOR INTRODUCTION IN THE 0 SESSION Sponsored by: Senator SHIRLEY K. TURNER District (Hunterdon and Mercer) Senator NILSA CRUZ-PEREZ District (Camden
IRC SECTION 42 IRC SECTION 42
 SUBTITLE A. INCOME TAXES CHAPTER 1. NORMAL TAXES AND SURTAXES SUBCHAPTER A. Determination of Tax Liability PART IV. CREDITS AGAINST TAX SUBPART D. Business Related Credits (a) In general. For purposes
INTRODUCTION INTRODUCTION 1
 INTRODUCTION The provides a blueprint for the future growth and development of the City in the coming decade. The Comprehensive Plan is long-range in scope and represents a comprehensive update of the
CITY OF SIGNAL HILL. California state law requires that each city adopt a General Plan. The General Plan must include:
 CITY OF SIGNAL HILL 2175 Cherry Avenue Signal Hill, CA 90755-3799 AGENDA ITEM TO: FROM: HONORABLE CHAIR AND MEMBERS OF THE CITY COUNCIL SCOTT CHARNEY DIRECTOR OF COMMUNITY DEVELOPMENT SUBJECT: 2014 GENERAL
Executive Summary 1/3/2018
 Executive Summary 1/3/2018 EXECUTIVE SUMMARY This comprehensive plan was prepared by the City of Langley in accordance with Section 36.70A.070 of the Growth Management Act (GMA). The plan guides future
Sec. 42. Low-income housing credit
 Sec. 42. Low-income housing credit STATUTE TITLE 26, Subtitle A, CHAPTER 1, Subchapter A, PART IV, Subpart D, Sec. 42 (a) (b) For purposes of section 38, the amount of the low-income housing credit determined
CURRENT DEMOGRAPHICS & CONTEXT GROWTH FORECAST SOUTHERN CALIFORNIA ASSOCIATION OF GOVERNMENTS APPENDIX
 CURRENT DEMOGRAPHICS & CONTEXT GROWTH FORECAST SOUTHERN CALIFORNIA ASSOCIATION OF GOVERNMENTS APPENDIX PROPOSED FINAL MARCH 2016 INTRODUCTION 1 FORECASTING PROCESS 1 GROWTH TRENDS 2 REGIONAL GROWTH FORECAST
Appendix A REAL ESTATE MARKET DEMAND ESTIMATE METHODOLOGY
 Appendix A REAL ESTATE MARKET DEMAND ESTIMATE METHODOLOGY This section provides information on the methodology that Bay Area Economics (BAE) used to quantify the potential market support for new residential,
Sewer Master Plan BCC Workshop November 15, 2016
 Updated 11/10/16 BOARD OF COUNTY COMMISSIONERS (BCC) CHARLOTTE COUNTY UTILITIES DEPARTMENT Sewer Master Plan BCC Workshop November 15, 2016 C h a r l otte Count y Utilities D e pt. 1 SEWER SYSTEM EXPANSION
City Services Appendix
 Technical vices 1.0 Introduction... 1 1.1 The Capital Facilities Plan... 1 1.2 Utilities Plan... 2 1.3 Key Principles Guiding Bremerton s Capital Investments... 3 1.4 Capital Facilities and Utilities Addressed
COMMUNITY REINVESTMENT ACT PERFORMANCE EVALUATION
 PUBLIC DISCLOSURE June 2, 2008 COMMUNITY REINVESTMENT ACT PERFORMANCE EVALUATION Legacy Bank & Trust Company RSSD # 397755 10603 Highway 32 P.O. Box D Plato, Missouri 65552 Federal Reserve Bank of St.
79th OREGON LEGISLATIVE ASSEMBLY Regular Session. House Bill 2520 SUMMARY
 th OREGON LEGISLATIVE ASSEMBLY--0 Regular Session House Bill 0 Sponsored by Representative BUEHLER (Presession filed.) SUMMARY The following summary is not prepared by the sponsors of the measure and is
Appendix C-5 Environmental Justice and Title VI Analysis Methodology
 Appendix C-5 Environmental Justice and Title VI Analysis Methodology Environmental Justice Analysis SACOG is required by law to conduct an Environmental Justice (EJ) analysis as part of the MTP/SCS, to
INTRODUCTION. Nearly one third of a million people call the 1,893 square miles of Clackamas County home.
 INTRODUCTION Nearly one third of a million people call the 1,893 square miles of Clackamas County home. The County's settlement pattern has resulted in small communities, most of which are clustered in
Planning Commission Meeting. March 2, 2016
 Planning Commission Meeting March 2, 2016 PRESENTATION Purpose of Planning Role of the Planning Commission Introduction of Madison County Comprehensive Plan Overview of Upcoming Meetings Overview of Existing
SELECTED ECONOMIC CHARACTERISTICS American Community Survey 5-Year Estimates
 DP03 SELECTED ECONOMIC CHARACTERISTICS 2008-2012 American Community Survey 5-Year Estimates Supporting documentation on code lists, subject definitions, data accuracy, and statistical testing can be found
Policy CIE The following are the minimum acceptable LOS standards to be utilized in planning for capital improvement needs:
 Vision Statement: Provide high quality public facilities that meet and exceed the minimum level of service standards. Goals, Objectives and Policies: Goal CIE-1. The City shall provide for facilities and
Staff Report. Staff requests Commission review, discussion and determination of a policy on Unincorporated Islands and Corridors
 SONOMA LOCAL AGENCY FORMATION COMMISSION 575 ADMINISTRATION DRIVE, ROOM 104A, SANTA ROSA, CA 95403 (707) 565-2577 FAX (707) 565-3778 www.sonoma-county.org/lafco Staff Report Meeting Date: April 4, 2012
1. I N T R O D U C T I O N
 INTRODUCTION The Chico 2030 General Plan is a statement of community priorities to guide public decisionmaking. It provides a comprehensive, long-range, and internally consistent policy framework for the
Administrative Code Chapter 31 Amendments
 t Administrative Code Chapter 31 Amendments Case Number: Ordinance No. 161-13 Initiated by: Supervisor Wiener Effective Date: September 25, 2013 1650 Mission St. Suite 400 San Francisco, CA 94103~2479
E APPENDIX METHODOLOGY FOR LAND USE PROJECTIONS IN THE BOSTON REGION INTRODUCTION
 E APPENDIX METHODOLOGY FOR LAND USE PROJECTIONS IN THE BOSTON REGION INTRODUCTION The Metropolitan Area Planning Council (MAPC), the region s land use planning agency, is responsible for preparing detailed
TAX INCREMENT PROJECT PLAN
 TAX INCREMENT PROJECT PLAN THE VILLAGE ON MONROE CITY OF RAPID CITY Prepared by the Rapid City Community Planning and Development Services Department May 2017 INTRODUCTION Tax Increment Financing is a
Township of Georgian Bay Water & Sewer Capacity Allocation Strategy. MacTier. November, Jointly prepared by the
 Appendix II Township of Georgian Bay 2008 Water & Sewer Capacity Allocation Strategy MacTier November, 2009 Jointly prepared by the Township of Georgian Bay and The District Municipality of Muskoka A.
HUMBOLDT COUNTY ASSOCIATION OF GOVERNMENTS COMMUNICATION WITH THOSE CHARGED WITH GOVERNANCE AND MANAGEMENT LETTER. FOR THE YEAR ENDED June 30, 2018
 HUMBOLDT COUNTY ASSOCIATION OF GOVERNMENTS COMMUNICATION WITH THOSE CHARGED WITH GOVERNANCE AND MANAGEMENT LETTER FOR THE YEAR ENDED June 30, 2018 COMMUNICATION WITH THOSE CHARGED WITH GOVERNANCE AND MANAGEMENT
Follow this and additional works at: Part of the Business Commons
 University of South Florida Scholar Commons College of Business Publications College of Business 9-1-2001 Economic patterns in Hillsborough County in 1997 : Hillsborough County zip code business, employment
4.3 Economic and Fiscal Impacts
 4.3 This section evaluates the potential economic, and fiscal impacts that could arise from the construction and long-term operation of the proposed East San Fernando Valley Transit Corridor Project. 4.3.1
Monte Vista Population, ,744 4,651 4,564 4,467 4,458 4,432 4,451
 1 Monte Vista 4,8 4,7 4,6 4,5 4,4 4,3 4,2 4,1 4,61 4,612 4,61 4,676 Monte Vista, 2-213 4,744 4,651 4,564 4,467 4,458 4,432 4,451 4,418 4,412 4,355 2 21 22 23 24 25 26 27 28 29 21 211 212 213 Year Monte
PUBLIC DISCLOSURE. June 4, 2012 COMMUNITY REINVESTMENT ACT PERFORMANCE EVALUATION. Utah Independent Bank RSSD #
 PUBLIC DISCLOSURE June 4, 2012 COMMUNITY REINVESTMENT ACT PERFORMANCE EVALUATION Utah Independent RSSD # 256179 55 South State Street Salina, Utah 84654 Federal Reserve of San Francisco 101 Market Street
Project Prattville : : The Next Chapter
 Welcome Introductions How Well Do You Know Prattville? Comp Planning 101 Schedule & Products Prattville in 2008 Questions & Answers The Planning Stations Next Steps Project Team Urban Collage Urban Design
CAPITAL IMPROVEMENTS ELEMENT
 Goals, Objectives and Policies CAPITAL IMPROVEMENTS ELEMENT GOAL 9.1.: USE SOUND FISCAL POLICIES TO PROVIDE ADEQUATE PUBLIC FACILITIES TO ALL RESIDENTS WITHIN THE CITY. FISCAL POLICIES MUST PROTECT INVESTMENTS
11 City of Morgan Hill
 11 City of Morgan Hill 11.1 Agency Overview The City of Morgan Hill was incorporated in November 1906. According to the California DOF 2015 estimates, the population of Morgan Hill is 41,779. As of 2015,
OVERVIEW OF THE SAN DIEGO REGION Current Conditions and Future Trends
 OVERVIEW OF THE SAN DIEGO REGION Current Conditions and Future Trends Why do we need a Regional Comprehensive Plan? Let s examine the facts. It helps to look at some objective statistical information that
APPLICATION FOR FUNDING 2018/2019 PROGRAM YEAR (JULY 1, 2018 TO JUNE 30, 2019)
") CITY OF EL CENTRO COMMUNITY DEVELOPMENT BLOCK GRANT PROGRAM APPLICATION FOR FUNDING 2018/2019 PROGRAM YEAR (JULY 1, 2018 TO JUNE 30, 2019) APPLICATION SUBMITTAL DEADLINE 5:00 PM, FRIDAY, JANUARY 5, 2018
CITY OF EL CENTRO COMMUNITY DEVELOPMENT BLOCK GRANT PROGRAM APPLICATION FOR FUNDING 2018/2019 PROGRAM YEAR (JULY 1, 2018 TO JUNE 30, 2019) APPLICATION SUBMITTAL DEADLINE 5:00 PM, FRIDAY, JANUARY 5, 2018
Economic Vitality and Fiscal Health6. Cabrillo College
 Economic Vitality and Fiscal Health6 Cabrillo College Economic Vitality and Fiscal Health A sustainable community has a vibrant local economy with good jobs and commercial services for area residents.
O.C.G.A GEORGIA CODE Copyright 2008 by The State of Georgia All rights reserved. *** Current through the 2008 Regular Session ***
 O.C.G.A. 36-70-20 GEORGIA CODE Copyright 2008 by The State of Georgia All rights reserved. *** Current through the 2008 Regular Session *** TITLE 36. LOCAL GOVERNMENT PROVISIONS APPLICABLE TO COUNTIES
County Service Area 53 Mosquito Abatement and Vector Control Service and Sphere of Influence Review
 Public Review Draft County Service Area 53 Mosquito Abatement and Vector Control Service and Sphere of Influence Review October 2018 Local Agency Formation Commission of Santa Cruz County 701 Ocean Street,
CHAPTER 16 POPULATION AND HOUSING, SOCIOECONOMICS, AND ENVIRONMENTAL JUSTICE 16.1 AFFECTED ENVIRONMENT/ENVIRONMENTAL SETTING
 CHAPTER 16 POPULATION AND HOUSING, SOCIOECONOMICS, AND ENVIRONMENTAL JUSTICE This chapter provides an overview of the existing social and economic conditions, demographics, and the characteristics of minority
[Business and Tax Regulations, Planning Codes - Central South of Market Housing Sustainability District]
![[Business and Tax Regulations, Planning Codes - Central South of Market Housing Sustainability District]](/thumbs/82/85819222.jpg "[Business and Tax Regulations, Planning Codes - Central South of Market Housing Sustainability District]") FILE NO. ORDINANCE NO. 1 [Business and Tax Regulations, Planning Codes - Central South of Market Housing Sustainability District] Ordinance amending the Business and Tax Regulations and Planning Codes
FILE NO. ORDINANCE NO. 1 [Business and Tax Regulations, Planning Codes - Central South of Market Housing Sustainability District] Ordinance amending the Business and Tax Regulations and Planning Codes
C8, Q3 9lr0981. Drafted by: Morton Typed by: Elise Stored 02/07/19 Proofread by Checked by By: Delegate Stewart A BILL ENTITLED
 C, Q lr0 Bill No.: Requested: Committee: Drafted by: Morton Typed by: Elise Stored 0/0/ Proofread by Checked by By: Delegate Stewart A BILL ENTITLED AN ACT concerning Department of Housing and Community
Fairfax County Federation of Citizens Associations Resolution Fairfax County Advertised FY 2006 Budget (Membership approved 3/31/05)
") Fairfax County Federation of Citizens Associations Resolution Fairfax County Advertised FY 2006 Budget (Membership approved 3/31/05) Background The County Executive s proposed FY 2006 Budget Plan totals
Fairfax County Federation of Citizens Associations Resolution Fairfax County Advertised FY 2006 Budget (Membership approved 3/31/05) Background The County Executive s proposed FY 2006 Budget Plan totals
University Link LRT Extension
 (November 2007) The Central Puget Sound Regional Transit Authority, commonly known as Sound Transit, is proposing to implement an extension of the Central Link light rail transit (LRT) Initial Segment
COMPREHENSIVE PLAN UPDATE EXECUTIVE SUMMARY. Plan Abstract
 Village of Swansea, Illinois 10/26/2017 Executive Summary COMPREHENSIVE PLAN UPDATE EXECUTIVE SUMMARY A Plan Abstract The following are excerpts from Swansea s 2017 Comprehensive Plan Update Comprehensive
79th OREGON LEGISLATIVE ASSEMBLY Regular Session. Enrolled. House Bill 4028
 79th OREGON LEGISLATIVE ASSEMBLY--2018 Regular Session Enrolled House Bill 4028 Introduced and printed pursuant to House Rule 12.00. Presession filed (at the request of House Interim Committee on Revenue)
GRASS VALLEY TRANSPORTATION IMPACT FEE PROGRAM NEXUS STUDY
 HEARING REPORT GRASS VALLEY TRANSPORTATION IMPACT FEE PROGRAM NEXUS STUDY Prepared for: City of Grass Valley Prepared by: Economic & Planning Systems, Inc. March 2008 EPS #17525 S A C R A M E N T O 2150
Demographic Future of the Southern California Region
 Demographic Future of the Southern California Region Simon Choi, Ph.D Chief of Research & Forecasting Southern California Association of Governments(SCAG) Southern California Water Dialogue, Metropolitan
REGIONAL GROWTH FORECAST 2050 SANTA BARBARA COUNTY POPULATION, JOB, AND HOUSEHOLD FORECASTS TO 2050
 REGIONAL GROWTH FORECAST 2050 SANTA BARBARA COUNTY POPULATION, JOB, AND HOUSEHOLD FORECASTS TO 2050 October 2018 2 Forecast 2050 Santa Barbara County Prepared by: Santa Barbara County Association of Governments
PUBLIC DISCLOSURE COMMUNITY REINVESTMENT ACT PERFORMANCE EVALUATION
 CapitalMark Bank & Trust CRA PUBLIC EVALUATION PUBLIC DISCLOSURE May 7, 2012 COMMUNITY REINVESTMENT ACT PERFORMANCE EVALUATION CapitalMark Bank &Trust 801 Broad Street Chattanooga, Tennessee 37402 RSSD
CITY OF SIGNAL HILL Cherry Avenue Signal Hill, CA March 4, 2014 AGENDA ITEM HONORABLE MAYOR AND MEMBERS OF THE CITY COUNCIL
 CITY OF SIGNAL HILL 2175 Cherry Avenue Signal Hill, CA 90755-3799 AGENDA ITEM TO: FROM: HONORABLE MAYOR AND MEMBERS OF THE CITY COUNCIL SCOTT CHARNEY DIRECTOR OF COMMUNITY DEVELOPMENT SUBJECT: 2013 GENERAL
Village of Blue Mounds Annex
 Village of Blue Mounds Annex Community Profile The Village of Blue Mounds is located in the southwest quadrant of the County, north of the town of Perry, west of the town of Springdale, and south of the
Workforce Homebuyer. Down Payment Loan Program. Program Guide and Disclosure. Housing Trust Fund of Santa Barbara County
 Housing Trust Fund of Santa Barbara County Workforce Homebuyer Down Payment Loan Program Program Guide and Disclosure 2013 Housing Trust Fund of Santa Barbara County P. O. Box 60909 Santa Barbara, CA 93160-0909
Coastal Counties Economic Overview
 Coastal Counties Economic Overview LEGISLATIVE MANDATE SECTION 14.22.(c) The Department of Commerce shall study and provide an executive summary of readily available economic data related to the 20 coastal
TAUSSIG DEVELOPMENT IMPACT FEE JUSTIFICATION STUDY CITY OF ESCALON. Public Finance Public Private Partnerships Urban Economics Clean Energy Bonds
 DAVID TAUSSIG & ASSOCIATES, INC. DEVELOPMENT IMPACT FEE JUSTIFICATION STUDY CITY OF ESCALON B. C. SEPTEMBER 12, 2016 Public Finance Public Private Partnerships Urban Economics Clean Energy Bonds Prepared
DRAFT ECONOMIC ANALYSIS OF THE PROPOSED RINCON DEL RIO SENIOR HOUSING PROJECT IN NEVADA COUNTY, CALIFORNIA MAY 28, 2009
 DRAFT ECONOMIC ANALYSIS OF THE PROPOSED RINCON DEL RIO SENIOR HOUSING PROJECT IN NEVADA COUNTY, CALIFORNIA MAY 28, 2009 Prepared for Jim and Carol Young Prepared by Applied Development Economics 100 Pringle
Butte County Long-Term Regional Growth Forecasts
 Butte County Long-Term Regional Growth Forecasts 2010 2035 Prepared by: January 26 th, 2011 2580 Sierra Sunrise Terrace, Suite 100 Chico, CA 95928 Phone: 530-879-2468 FAX: 530-879-244 www.bcag.org This
Water Quality Improvement Act Purpose and Need For Legislation
 Water Quality Improvement Act Purpose and Need For Legislation Sec. 1 Short Title: Water Quality Improvement Act. Sec. 2. Sewer Overflow Control Grants: The capital costs that cities bear to address combined
Salt Lake City 2010 Population by 5-Year Age Groups and Sex
 age Structure City has relatively more young adults (20- to 40- year-olds) and a greater share of elderly (75 years and older) in its 2010 population than does County. This means that, compared with the
MORVA COUNTY SERVICE AREA MUNICIPAL SERVICE REVIEW FINAL
 MUNICIPAL SERVICE REVIEW FINAL November 29, 2012 Prepared for the Local Agency Formation Commission of Alameda County by Baracco and Associates, Policy Consulting Associates, LLC TABLE OF CONTENTS 0 TABLE
Service and Fare Change Policies. Revised Draft
 Revised Draft June 19, 2013 1. INTRODUCTION It is the policy of the Sacramento Regional Transit District (RT) to provide quality service to all customers regardless of race, color, national origin, or
Corridors of Commerce DRAFT Scoring and Prioritization Process. Patrick Weidemann Director of Capital Planning and Programming November 1, 2017
 Corridors of Commerce DRAFT Scoring and Prioritization Process Patrick Weidemann Director of Capital Planning and Programming November 1, 2017 Project Purpose To develop and implement a scoring and project
A LOOK BEHIND THE NUMBERS
 KEY FINDINGS A LOOK BEHIND THE NUMBERS Home Lending in Cuyahoga County Neighborhoods Lisa Nelson Community Development Advisor Federal Reserve Bank of Cleveland Prior to the Great Recession, home mortgage
Lake County. Government Finance Study. Supplemental Material by Geography. Prepared by the Indiana Business Research Center
 County Government Finance Study Supplemental Material by Geography Prepared by the Indiana Business Research www.ibrc.indiana.edu for Sustainable Regional Vitality www.iun.edu/~csrv/index.shtml west Indiana
for higher-income residents to become regular users of transit. In other words, the carsharing connection would provide them with mobility insurance.
 Time-Banking Transit and Carsharing: Can it bring additional users to carsharing originations and increased mobility and access to low-income populations? Introduction and Overview Carsharing has been
Housing Needs Assessment Update 2016 Venturoni Surveys & Research
 Housing Needs Assessment Update 2016 Venturoni Surveys & Research! Linda Venturoni, President Jim Westkott, Senior Economist and Demographer! Eagle County Housing Needs Assessment Update 2016 Table of
Appendix A ~ Population and Employment Forecasts
 Appendix A ~ Population and Employment Forecasts Special Note: The city of Keizer completed and adopted an Economic Opportunity Analysis (EOA) and Housing Needs Analysis (HNA) in 2013. Both studies identified
7 ITEM 8 10:20 A.M. January 12, 2006 STAFF REPORT
 7 ITEM 8 10:20 A.M. January 12, 2006 STAFF REPORT TO: FROM: Planning Commission Mary Jane Fagalde, Community Development Department Director Prepared by: Richard Coel, Assistant Director DATE: January
PUBLIC RESOURCES CODE SECTION
 PUBLIC RESOURCES CODE SECTION 21000-21177 21000. The Legislature finds and declares as follows: (a) The maintenance of a quality environment for the people of this state now and in the future is a matter
Internal Revenue Code 42 Low-income housing credit.
 Internal Revenue Code 42 Low-income housing credit. (a) In general. For purposes of section 38, the amount of the low-income housing credit determined under this section for any taxable year in the credit
Regional Transportation Plan Checklist (Revised February 2010)
") Regional Transportation Plan Checklist (Revised February 2010) (To be completed electronically in Microsoft Word format by the MPO/RTPA and submitted along with the draft RTP to Caltrans) Name of MPO/RTPA:
Regional Transportation Plan Checklist (Revised February 2010) (To be completed electronically in Microsoft Word format by the MPO/RTPA and submitted along with the draft RTP to Caltrans) Name of MPO/RTPA:
PUBLIC DISCLOSURE. December 6, 2004 COMMUNITY REINVESTMENT ACT PERFORMANCE EVALUATION BANK OF EUFAULA RSSD#
 PUBLIC DISCLOSURE COMMUNITY REINVESTMENT ACT PERFORMANCE EVALUATION BANK OF EUFAULA RSSD# 343051 P.O. BOX 607 EUFAULA, OKLAHOMA 74432-0607 Federal Reserve Bank of Kansas City 925 Grand Boulevard Kansas
National Flood Insurance Program Final Nationwide Programmatic Environmental Impact Statement
 Final Nationwide Programmatic Environmental Impact Statement EXECUTIVE SUMMARY Action Agency: Federal Emergency Management Agency Cooperating Agency: U.S. Environmental Protection Agency September 2017
STAFF REPORT Regional Transportation Plan/Sustainable Communities Strategy (RTP/SCS) Scenario Performance Update for Board Direction
 Scenario Performance Update for Board Direction") November 2017 Board of Directors STAFF REPORT SUBJECT: RECOMMENDED ACTION: 2018 Regional Transportation Plan/Sustainable Communities Strategy (RTP/SCS) Scenario Performance Update for Board Direction Support
November 2017 Board of Directors STAFF REPORT SUBJECT: RECOMMENDED ACTION: 2018 Regional Transportation Plan/Sustainable Communities Strategy (RTP/SCS) Scenario Performance Update for Board Direction Support
Chapter 4 Capital Facilities 2 3
 Draft March 0 0 Chapter Four Capital Facilities Introduction Capital facilities as defined here, and for purposes of the plan, include facilities owned by Whatcom County and other public entities. Capital
Item #6B. September 17, 2014
 Regional Planning Partnership September 17, 2014 Item #6B 2016 MTP/SCS Update: Land Use Forecast Methodology Issue: How is the land use forecast methodology applied in the Metropolitan Transportation Plan/Sustainable
TABLE OF CONTENTS. Introduction to the Economic Development Element 1
 TABLE OF CONTENTS Section Page Introduction to the Economic Development Element 1 Purpose of the Economic Development Element 1 Economic Factors Affecting the City 1 Scope and Content of the Economic Development
Community Support Program and Targeted Community Lending Plan
 Community Support Program and Targeted Community Lending Plan December 14, 2018 Effective January 1, 2019 Policy Information Document Title: Content Owner: Community Support Program and Targeted Community
PUBLIC DISCLOSURE COMMUNITY REINVESTMENT ACT PERFORMANCE EVALUATION
 PUBLIC DISCLOSURE January 14, 2008 COMMUNITY REINVESTMENT ACT PERFORMANCE EVALUATION Orange County Trust Company RSSD No. 176101 212 Dolson Avenue Middletown, NY 10940 FEDERAL RESERVE BANK OF NEW YORK
Understanding the K-12 General Education Funding Program
 Understanding the K-12 General Education Funding Program 2002-03 Money Matters: Number 02.06 June 2002 Greg rowe, Fiscal Analyst, 296-7165 Fiscal Analysis Department Minnesota House of Representatives
The Index Leading Indicators
 Our Sponsors: Housing Sales Up, Wide Growth Professor Erick Eschker, Director Jonathan Ashbach, Assistant Editor Catherine Carter, Assistant Analyst While no especially dramatic records were broken in
Senate Bill 1533 Ordered by the Senate February 12 Including Senate Amendments dated February 12
 th OREGON LEGISLATIVE ASSEMBLY--0 Regular Session A-Engrossed Senate Bill Ordered by the Senate February Including Senate Amendments dated February Printed pursuant to Senate Interim Rule. by order of
HOUSE BILL 1220 A BILL ENTITLED. Chesapeake Bay Green Fund
 M HOUSE BILL lr CF SB 0 By: Delegates McIntosh, Beidle, Bobo, Bromwell, Bronrott, Cane, V. Clagett, Frush, Haynes, Healey, Holmes, Hubbard, Lafferty, Lawton, Love, Malone, Montgomery, Morhaim, Niemann,
Financing Floods in Chicago. Sephra Thomas. GIS for Water Resources C E 394K. Dr. David Maidment
 Financing Floods in Chicago Sephra Thomas GIS for Water Resources C E 394K Dr. David Maidment Fall 2018 Abstract The objective of this term paper is to study the hydrology and social vulnerability of Chicago,
LHTF Program Guidelines 1
 LHTF Program Guidelines 1 These guidelines apply to the Local Housing Trust Fund Program (LHTF Program) of the San Luis Obispo County Housing Trust Fund (HTF). The HTF s LHTF Program is based upon a $575,000
Central SoMa Area Plan:
 Central SoMa Area Plan: Economic Impact Report CITY & COUNTY OF SAN FRANCISCO Office of the Controller Office of Economic Analysis Items #180184 & #180185 07.24.2018 2 Introduction The proposed legislation
Inclusionary Affordable Housing Program
 Inclusionary Affordable Housing Program Material Modifications to Amendments San Francisco Planning Commission June 15, 2017 INCLUSIONARY PROGRAM and AMENDMENTS COMMISSION RECOMMENDATIONS (APRIL) PROPOSED
CITY OF SONORA HOMEBUYERS ASSISTANCE LOAN PROGRAM GUIDELINES
 CITY OF SONORA HOMEBUYERS ASSISTANCE LOAN PROGRAM GUIDELINES I. PURPOSE The City of Sonora s Homebuyers Assistance Loan Program provides deferred payment, silent second, mortgages to assist low-income
INSTRUCTIONS FOR 2017 PIT-CR NEW MEXICO BUSINESS-RELATED INCOME TAX CREDIT SCHEDULE
 INSTRUCTIONS FOR 2017 PIT-CR NEW MEXICO BUSINESS-RELATED INCOME TAX CREDIT SCHEDULE GENERAL INFORMATION New Mexico tax law offers the 23 business-related income tax s listed on 2017 PIT CR, New Mexico