Highlights and key messages for business and public policy
|
|
|
- Collin Barnett
- 5 years ago
- Views:
Transcription
1

2
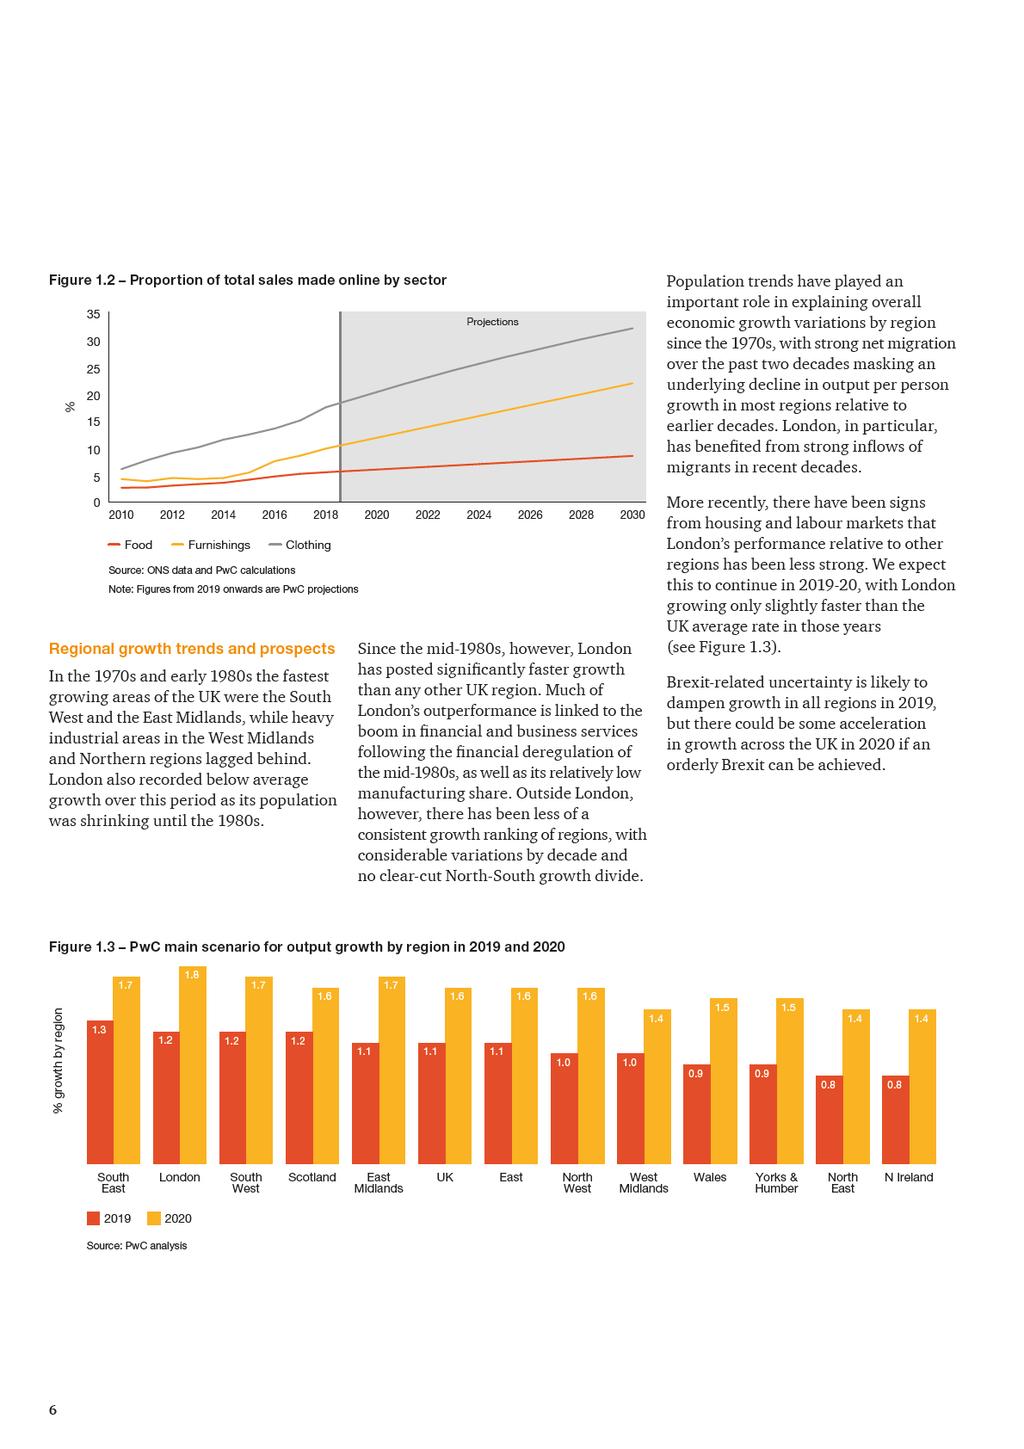
3 Highlights and key messages for business and public policy Key projections Real GDP growth 1.1% 1.6% Consumer spending growth 1.4% 1.7% Fixed investment growth -1.0% 2.1% Inflation (CPI) 1.8% 2.0% Source: PwC main scenario projections Recent UK developments and prospects In our main scenario, we project UK growth to dip to 1.1% in 2019 before picking up to around 1.6% in Slow growth this year reflects the drag on business investment from ongoing economic and political uncertainty relating to the outcome of the Brexit process. Our main scenario assumes an orderly exit from the EU with a transition period, with business investment and GDP growth picking up later in 2019 and in 2020 as a result. But short-term risks are weighted to the downside, due to the possibility of a more disorderly Brexit. Consumer spending has driven the economy since the referendum and has itself been supported by recent increases in real income growth. But the housing market has cooled, further rises in household borrowing may be hard to sustain and uncertainties regarding Brexit could combine to see consumer spending growth slow to around 1.4% this year, from 1.9% in 2018, before picking up slightly in Service sector growth should remain modest but positive in 2019, but manufacturing growth slowed in 2018 and is likely to contract in 2019 amid Brexit uncertainty. Construction sector output has been sluggish in the past 18 months owing to the weakness of commercial property investment in particular and looks set to remain relatively weak in the short term. In our main scenario, we assume that the Bank of England raises interest rates by a quarter of a percent to 1% in the second half of But the precise timing of this will be dependent on developments in Brexit and the economic data and the pace of any subsequent rate increases are likely to remain limited and gradual. Despite stronger income growth, real household expenditure growth could slow in 2019 Given the current strength of the labour market, we project real household disposable income growth to pick up gradually in 2019 and 2020, reaching 2% in the latter year. However, temporary uncertainty around the outcome of the Brexit process means that real household spending growth could slow this year, resulting in a slightly higher savings rate. Looking further out, we expect households to spend a larger share of their budgets on housing and utilities, with the proportion reaching more than 30% by 2030, up from 27% in The share of spending on financial services and personal care will also tend to increase over time, while the share spent on necessities such as food and clothing will fall. Online sales are likely to become a more important part of consumer spending in the long term. The proportion of sales conducted online doubled in each of the food, furnishing and clothing categories between 2010 and Assuming no structural change that accelerates the rate of growth from current levels, the online share of total retail spending could rise between 2018 and 2030 from 5% to 8% for food, from 10% to 22% for furnishings and from 18% to 32% for clothing. London likely to grow only slightly faster than rest of the UK in London has consistently outperformed other UK regions for most of the past three decades in terms of economic growth. This is in marked contrast to the 1970s and early 1980s when London s average growth rate was lower than the UK average due to people moving out of the capital. Much of London s historical outperformance is linked to the boom in financial and business services following the financial deregulation of the mid-1980s, as well as its relatively low manufacturing share and its ability to attract skilled international migrants. More recently, there have been signs from housing and labour markets that London s relative performance was less strong in We expect this to continue in 2019 and 2020, with London growing only slightly faster than the UK average rate in those years. UK Economic Outlook March
4 1. Summary Recent developments Economic growth slowed from early 2017 as higher inflation generated by a weaker pound squeezed consumers. The economy strengthened in the second and third quarters of 2018, helped by a recovery in consumer spending supported by warm weather, rising earnings growth and slowing inflation. However, softer data in the fourth quarter highlighted an underlying weakness in investment, which can be attributed to growing anxiety among businesses about the outcome of the Brexit process, as well as the effect of a slowing global economy. Table 1.1: Summary of UK economic growth and inflation prospects Indicator (% change on previous year) OBR forecasts (March 2019) Independent forecasts (February 2019) PwC main scenario (March 2019) GDP Consumer spending Inflation (CPI) Source: Office for Budget Responsibility (March 2019), HM Treasury survey of independent forecasters (average value of new forecasts made in February 2019 survey) and latest PwC main scenario. The jobs market has generally remained strong, with the employment rate at record levels and unemployment down to its lowest rate since In recent months this has finally started to feed through into increased wage growth, which is one reason why the Bank of England raised interest rates in August Future prospects As shown in Table 1.1, our main scenario is for UK GDP growth to slow to around 1.1% on average in 2019 before picking up somewhat to 1.6% in Our views on growth and inflation are broadly similar to the latest consensus and OBR forecasts (see Table 1.1), and indeed the latest Bank of England forecasts. Consumer spending growth held up well in 2018, but is expected to moderate to around 1.4% in 2019 in our main scenario as stronger real wage growth is offset by concerns about the implications of Brexit, slower projected jobs growth, the prospect of a gradual rise in interest rates and subdued house price growth. Brexit-related uncertainty will also continue to hold back business investment in the UK in the short term, although we assume in our main scenario that this eases later in 2019 on the assumption of an orderly Brexit with a transition period. Total fixed investment in the economy was flat in 2018 and is expected to fall by 1% in real terms in 2019, followed by moderate growth of around 2% in 2020 in our main scenario. The October 2018 Budget provided a significant boost to government spending in the medium term, particularly on the NHS, and also some short-term tax cuts that will support growth in The global economy has weakened notably over the past six months, with growth in China and the Eurozone areas of particular concern. It is possible that some of this weakness is temporary for example, the German economy was brought almost to a standstill by a one-off decline in exports because of new car emissions standards but there are also risks of a continued marked slowdown in global growth extending into 2020, with adverse effects on both UK exports and, through confidence effects, business investment. There are always uncertainties surrounding any growth projections, as illustrated by the alternative scenarios in Figure 1.1. There are still considerable downside risks relating in particular to the outcome of the Brexit process and the global outlook, but there are also upside possibilities if these problems can be contained and global growth regains some momentum. In our main scenario, we expect the UK to continue with moderate but steady growth in , but businesses need to monitor and make contingency plans for potential alternative scenarios related to Brexit and other factors such as global growth. Consumer price inflation fell back below the Bank of England s 2% target rate in January as the effect of more recent falls in global oil prices fed through to UK consumer prices. Given benign current levels of inflation and continued uncertainties around Brexit and the global economy, we expect the Monetary Policy Committee to remain cautious about the pace of future interest rate rises, but in our main scenario we assume a further quarter-point rate rise to 1% in the second half of 2019 and one further such increase at some point in
5
6
7 2. UK economic prospects 1 Key points In our main scenario, we project UK growth to dip to 1.1% in 2019 before picking up to around 1.6% in 2020, assuming an orderly Brexit. But risks are weighted to the downside in the short term due to the possibility of a more disorderly Brexit. Consumer spending was boosted during the warm summer months in 2018 and has been supported by recent rises in real incomes. But the housing market has cooled and further rises in household borrowing may be hard to sustain, so we project only moderate consumer spending growth of around 1.4% this year. Business investment has been weighed down by uncertainties related to Brexit, falling at an accelerating rate through the course of It could recover later in 2019 and in 2020, but only if the UK can achieve an orderly Brexit. We expect UK growth to be more balanced across regions in , with London no longer growing significantly faster than the UK average as has been the norm for most of the past three decades. As consumer price inflation remains moderate in , real wages are expected to continue to grow, but at rates below those seen before the global financial crisis as productivity growth remains relatively subdued. The Bank of England is expected to continue with very gradual interest rates rises over the next few years assuming an orderly Brexit. But the next rate increase seems unlikely to come until after the situation on Brexit clarifies, and a no deal scenario could see renewed monetary and fiscal policy relaxation to support the economy in the short term. Introduction In this section of the report we describe recent developments in the UK economy and review future prospects. The discussion covers: 2.1 Recent developments in the UK economy 2.2 Economic growth prospects: national, sectoral and regional 2.3 Outlook for inflation and real earnings growth 2.4 Monetary and fiscal policy In our main scenario, we project UK growth to dip to 1.1% in 2019 before picking up to around 1.6% in 2020, assuming an orderly Brexit. John Hawksworth Chief Economist, PwC 2.5 Summary and conclusions 1 This section was written by John Hawksworth with additional inputs by Megan Wulff. UK Economic Outlook March
8
9
10 Figure 2.5 Trends in productivity and employment Index (Q = 100) Q Q1 Q1 Q1 Q1 Q1 Q1 Q1 Q1 Q1 Q1 Q1 Q1 Q1 Q1 Q1 Q1 Q1 Productivity (per worker) Source: ONS Employment UK creates record number of jobs, but productivity growth remains subdued UK productivity growth, measured using output per worker, has been relatively weak since the global financial crisis, as illustrated in Figure 2.5. The positive side of this has been strong jobs growth, particularly since Recent trends have continued to follow this general pattern, with jobs growth strengthening in the final quarter of 2018, while productivity growth remained relatively subdued (at least in terms of output per worker). The ideal combination of strong jobs growth and robust productivity and real earnings growth, as seen before the financial crisis, remains elusive Q1 Why has productivity growth been so weak since the global financial crisis? Many possible explanations have been put forward for weak productivity growth over the past decade, including measurement error (in particular, not capturing the full benefit of digital innovations like smartphones). Soon after the recession, some put it down to labour hoarding by firms or credit constraints by banks, but both these explanations are less convincing now after almost ten years of recovery since mid Reduced competition in some sectors might be a possible explanation, but against that some other sectors have seen their markets disrupted by technology-savvy new entrants, which would usually be associated with increased innovation and productivity growth. Another possible explanation is that low productivity firms could have been kept alive by low interest rates, impeding the reallocation of capital and labour to higher productivity activities. The most convincing explanation from our perspective is that business investment, while picking up since the recession, has not done so to the extent seen in most past recovery cycles. Many businesses have been reluctant to invest in new labour-saving automation technologies that are relatively risky when compared to the alternative of using more low-cost labour, including migrant workers from the EU. Uncertainty around Brexit has been a further dampener on business investment over the past two and a half years, which has been relatively subdued at a time when global economic conditions and low interest rates might have been expected to lead to a stronger performance. Looking years ahead, emerging technologies like robotics and artificial intelligence could hold the potential for faster productivity growth 2, with a net impact on UK employment that we think could be broadly neutral in the long run as we discussed in detail in the July 2018 edition of this report 3. But, at least for the next few years, productivity growth may remain relatively subdued, with any recovery being at the expense of slower jobs growth. 2 See, for example, our report on the potential impact of AI on the UK economy here, which suggests gains of up to 10% of GDP by 2030: 3 Available here: 10
11 2.2 Economic growth prospects: national, sectoral and regional Our main scenario is for real GDP growth of around 1.1% in 2019 and 1.6% in 2020, somewhat below the UK s estimated longer term trend growth rate of just under 2%. Further details of this main scenario projection are set out in Table 2.1. We assume in this main scenario that the UK will avoid a no deal Brexit, where it falls out of the EU without any transitional arrangement, which would be highly disruptive. But clearly this is a key downside risk as discussed further below. Table 2.1: Main scenario projections for UK growth and inflation % real annual growth unless otherwise stated GDP Consumer spending Government consumption Fixed investment Domestic demand Net exports (% of GDP) CPI inflation (%: annual average) Source: Latest ONS estimates for , PwC main scenario for Slower year-on-year growth in 2018 was driven primarily by a decline in business investment and this seems likely to remain weak in early 2019 as Brexit-related uncertainty has intensified. But we assume in our main scenario that business investment will see some upturn later in 2019 and into 2020 on the assumption that a reasonably orderly Brexit can be achieved. Consumer spending held up much better in 2018, helped by a moderation of inflation, higher earnings growth and continued strong jobs growth. As discussed in more detail in Section 3 below, we expect some moderation of consumer spending growth in 2019 followed by a gradual pick-up in 2020, again assuming a reasonably orderly Brexit. Income tax cuts announced in the October 2018 Budget will also provide some further support for household spending power from this April. The October Budget also announced a significant rise in government consumption spending in 2019/20, particularly on the NHS, which will provide some support for the economy in that year and beyond. Higher public spending could also feed through into somewhat higher inflation and interest rates in the medium term, which would tend to dampen the impact on economic growth, but this is likely to be a lagged response that would not have a significant effect until after Overall, UK domestic demand growth is expected to average around 1.3% in 2019, down slightly from last year, before picking up to 1.8% in This would, however, still be some way below average domestic demand growth of around 2.7% p.a. in Net exports are projected to have a slightly negative impact on growth over this period as the global economy slows. Overall our main scenario for UK GDP growth in 2019 has been revised down from 1.6% to 1.1% since our last report in November, reflecting growing evidence of a negative drag on business investment in particular from Brexit-related uncertainty, as well as a less favourable global economic environment. However we do expect a modest recovery of UK growth to around 1.6% in 2020 assuming a relatively orderly Brexit. UK Economic Outlook March
12
13 Table 2.2: Key issues and questions for businesses preparing for Brexit Issues Implications Questions Trade Tax Regulation Sectoral effects Foreign direct investment (FDI) Labour market Uncertainty The EU is the UK s largest export partner, accounting for around 44% of total UK exports. Leaving the EU is likely to make trade with the EU more difficult, but the extent of this will depend on the type of deal, if any, agreed with the EU. The UK would gain more control over VAT and some other taxes. However, Brexit could also open the door to new tax initiatives within the EU that the UK might currently have sought to block. The UK is subject to EU regulation. Brexit could mean less red tape in some areas. But it could also mean that UK businesses need to adapt to a different set of regulations, which could be costly. The UK is the leading European financial services hub, which is a sector that is likely to be significantly affected by Brexit. Other sectors which rely on the EU single market could also feel a strong impact. FDI from the EU makes up around 45% of the total stock of FDI in the UK. Brexit could put some of this investment at risk. The UK may change its migration policies. Currently EU citizens can live and work in the UK without restrictions. Businesses will need to adjust to any change in this regime or in work preferences for EU nationals. Uncertainty has increased since the referendum and this seems likely to continue through the Brexit negotiation (including extension) period. How much do you rely on EU countries for revenue growth? Have you reviewed your supply chain to identify the potential impact of tariffs and additional customs procedures on your sales, procurement and logistics? Have you identified which third party contracts would require renegotiation in different Brexit scenarios (EEA/FTA/WTO)? Have you ensured your banks can continue to provide financial support for your operations in different Brexit scenarios? What risk assessments and contingency plans have you made for alternative Brexit scenarios? Have you thought about the impact of potential changes to the UK and EU tax regimes after Brexit? Have you upgraded your systems to deal with a significant volume of tax changes? Have you quantified the potential regulatory impact of Brexit to keep your stakeholders up-to-date? How flexible is your IT infrastructure to deal with potential changes to Data Protection laws? Is your compliance function ready to deal with any new reporting requirements arising from Brexit? Have you briefed potential investors on the impact of Brexit for your sector and organisation? How up-to-date are your contingency plans in place to deal with different Brexit scenarios, including no deal variants? Are you aware of the impact of potential volatility in financial markets on your capital raising plans? How much do your rely on FDI for growth? How does Brexit affect your location decisions? How are your competitors responding to the risk of Brexit? Are they relocating any key functions? How reliant is your value chain on EU labour? Have you communicated with your UK-based employees who are nationals of other EU countries? What advice should you give them? Have you considered the additional cost of hiring EU labour after Brexit? Could changes in access to EU labour increase the case for automation? How well prepared are you to manage future volatility in the exchange rate (and other asset prices) related to Brexit? Is your organisation ready for a downside scenario where there is a prolonged period of uncertainty and/or a no deal Brexit? Source: PwC UK Economic Outlook March
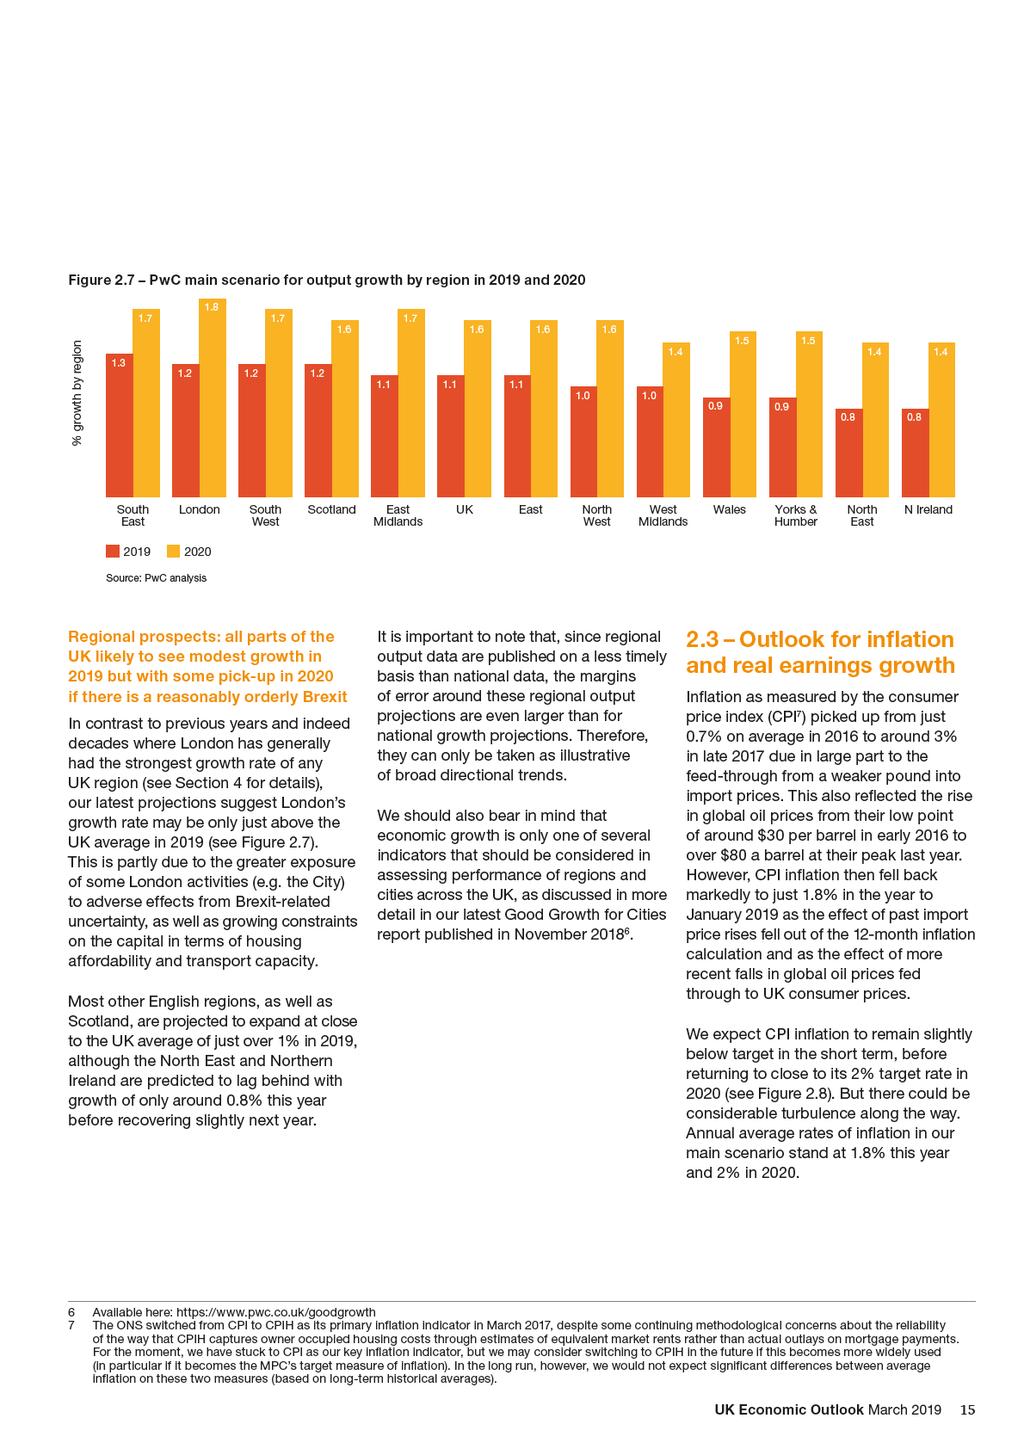
14 Most industry sectors projected to see relatively modest growth in The sector dashboard in Table 2.3 shows latest ONS estimates of growth rates for 2018 along with our projected main scenario growth rates for 2019 and 2020 for five of the largest sectors within the UK economy. The table also includes a summary of the key trends and issues affecting each sector. The distribution, hotels and restaurants sector recorded relatively strong output growth of 2.7% in 2018, helped by strong summer sales, but we expect this to moderate to around % in Manufacturing recorded relatively strong growth in 2017, but this slowed markedly to just 0.9% on average in 2018 and, given the recent downward trend, we project modestly negative growth in But there could be a gradual recovery in 2020 assuming an orderly Brexit as in our main scenario. Construction, as ever, has been volatile, with growth having dropped dramatically to just 0.7% in 2018 according to our latest estimates. We expect some recovery in 2019, though this is partly just due to a statistical bounce-back from the lows seen in early 2018, rather than strong underlying growth in the sector. This is also a sector where confidence is critical, and which is therefore particularly exposed to any loss of confidence related to a less-favourable Brexit outcome. Business services and finance growth should remain relatively steady at around 1.5-2% per annum in , although there are significant downside risks if Brexit negotiations go less smoothly than we assume in our main scenario. UK financial services companies could be particularly badly affected by any loss of access to EU markets, particularly if this happens in a disorderly fashion, although there is also positive longer term potential for the sector beyond Brexit 5. Table 2.3: UK sector dashboard Growth Issues Key issues/trends Manufacturing (10%) 0.9% -0.4% 1.4% Manufacturing PMI has moderated in recent months Exporters gained in 2017 and early 2018 from a weaker pound and a stronger global economy, though there are concerns about a global slowdown in as well as risks relating to Brexit Construction (6%) 0.7% 1.1% 1.5% Construction PMI has been relatively weak in recent months, although remaining volatile The construction sector fell back sharply in late 2018 after a strong summer, but output rebounded in January The government has boosted infrastructure investment to try to offset weakness in commercial construction due to Brexit-related uncertainty Distribution, hotels & restaurants (13%) 2.7% 1.4% 1.5% A weaker pound since 2016 has boosted tourism, both from overseas and domestically, leading to increased expenditure in the hospitality sector, though this effect is now fading Total consumer spending held up relatively well in 2018 as earnings growth rose and unemployment stayed low, but the housing market has weakened Business services and finance (34%) 1.8% 1.6% 2.1% The financial sector remains particularly concerned about the possible implications of Brexit, especially if this is disorderly The Bank of England has increased the counter-cyclical capital buffer to constrain consumer debt levels, which may impact lending by retail banks Business services, however, continued to see relatively strong growth during 2018 Government and other services (22%) 0.1% 1.2% 1.6% Public services continue to face tight budgets, but austerity was eased in the Budget and NHS spending is planned to increase significantly Total GDP 1.4% 1.1% 1.6% Sources: ONS for 2018 estimates, PwC for 2019 and 2020 main scenario projections and key issues. These are five of the largest sectors but they do not cover the whole economy - their GVA shares only sum to around 85% rather than 100% 5 For more on the future of UK financial services after Brexit, see our report with TheCityUK here 14
15
16
17 2.4 Monetary and fiscal policy The Monetary Policy Committee (MPC) raised interest rates from 0.5% to 0.75% in August 2018 in response to strengthening growth in mid-2018 and signs that wages had started to grow at a faster rate again. They also signalled the intention to raise interest rates very gradually over the next few years, but the timing of this will depend on how the economic data evolve and, at present, a further rate rise seems unlikely until we get clarity on Brexit. In the medium term, we project further small and gradual rate rises in our main scenario assuming an orderly Brexit, but interest rates will remain very low by historical standards for the foreseeable future. UK base rates may end up at around 2-3% in the medium term, as opposed to the 5% pre-crisis norm. If there is a no deal Brexit, however, then the MPC might loosen monetary policy again in the short term to support the economy through a difficult period (although the longer term impact of such a scenario on interest rates is less clear, since it depends on the relative scale of impacts on both demand and supply capacity). In his October 2018 Budget, the Chancellor benefited from a significant and persistent improvement in official public finance projections by the OBR. This reflected what the OBR judged to be a structural increase in the tax-to-gdp ratio as well as a lower sustainable unemployment rate of around 4% going forward. The Chancellor used almost all of the fiscal windfall at the time of the Budget to fund the increase in NHS spending over the next five years announced by the Prime Minister in June There were no major changes to tax and spending policy in the 2019 Spring Statement, although the OBR further revised down its medium term public borrowing projections, which could leave room for extra public spending in later years. The latest OBR projections assume an orderly Brexit, but note the downside risks to this. A disorderly no deal Brexit could lead the Chancellor to spend more and/or cut taxes further in the short term to cushion the impact on the economy in , but could require renewed austerity in the longer term given the damage that a disorderly Brexit would potentially do to the public finances. 2.5 Summary and conclusions UK economic growth has slowed recently as Brexit-related uncertainty has led to a decline in business investment. But consumer spending has held up better so far, helped by rising real earnings growth and a continued strong jobs market at least until the end of Our main scenario is for UK GDP growth to remain modest but positive at around 1.1% in 2019, but then pick up somewhat to around 1.6% in 2020 as business investment revives. This assumes an orderly Brexit with a transition period lasting at least until the end of It also takes into account the boost to short-term growth from the tax and spending measures announced in the October 2018 Budget. Most industry sectors are projected to see relatively modest growth in 2019, though short-term trends remain volatile and highly dependent on how the Brexit negotiations evolve. Manufacturing and other export-intensive sectors also face downside risks from any further deceleration in global growth in In our main scenario we assume a single one-quarter-point interest rate rise later in 2019 and one further such increase in 2020, although the exact timing of future rate changes remains uncertain. Given the delicate state of the Brexit negotiations, there are particularly large uncertainties around economic projections at present. A disorderly no deal Brexit could lead to a significantly less favourable outcome for growth, despite some offset from likely mitigating actions by the government, the Bank of England and others. Organisations should stress test their business and investment plans against alternative economic and political scenarios and review the potential wider implications of different Brexit outcomes for all aspects of their operations. UK Economic Outlook March
18 3. The outlook for consumer spending and online retail 1 Key points Consumer spending growth is estimated to have slowed for a second consecutive year in 2018, but is still expected to have grown at an average of 2.2% a year faster than inflation since This spending has aided the economy s recovery from the financial crisis and supported it during the more recent period of Brexitrelated uncertainty. Factors driving continued consumer spending growth include rising employment levels, accelerating real wage growth, a prolonged period of very low interest rates and consumers willingness to reduce their savings rate. Assuming an orderly Brexit, we project real household disposable income growth to accelerate mildly in 2019 and 2020, reaching 2% in the latter year. This will reflect further upward pressure on wages thanks to the tight labour market. Despite higher income growth, we expect real household expenditure growth to slow in 2019 as a result of temporary uncertainty around the outcome of the Brexit process. Growth should then be able to pick up later in 2019 and into 2020 assuming an orderly Brexit is achieved. Given the acceleration in income growth and the slowdown in spending growth, the household saving ratio is likely to begin to rise again gradually in 2019 and reach 2% in Housing and utilities will continue to represent the largest share of total household spending in the long run, with the proportion rising to more than 30% by Spending on discretionary services will also increase in proportional terms over this period, while the share spent on more basic goods, such as food, clothing and alcohol, will continue to decline. The disruption to consumer spending patterns caused by growth in online shopping will continue. The online share of total retail spending could rise between 2018 and 2030 from 5% to 8% for food, from 10% to 22% for furnishings and from 18% to 32% for clothing. Introduction Consumer spending accounts for more than two-thirds of UK GDP and is therefore the most important driver of economic growth. And it has been strong consumer spending growth that has powered the recovery of the economy since But how sustainable is this spending in 2019 and 2020? Looking further ahead, which areas of consumer expenditure might grow the fastest over the next decade? To answer these questions, we have looked at past trends and future prospects for the two main determinants of household spending growth: Real household disposable income (RHDI) growth, which is turn is driven by trends in real employment, state benefits and pensions and other private income such as share dividends; and Changes in the household savings ratio, which are particularly influenced by the relative indebtedness of households and wealth effects (e.g. from changes in house prices). We also consider the outlook for growth in online retail and consider what proportion of several of the main consumer spending categories could be generated by online sales in the coming years. The discussion is structured as follows: Section 3.1 provides an overview of recent trends in each of the key determinants of RHDI growth; Section 3.2 looks at potential future trends in household disposable income growth; Section 3.3 examines past trends and future prospects for the household savings ratio; Section 3.4 brings these analyses together to set out our main scenario for future consumer spending growth and assess risks around this as captured in alternative scenarios; Section 3.5 considers how consumer spending growth might vary by expenditure category over the period to 2030; Section 3.6 focuses on growth in online retail and projects the proportion of sales that may be accounted for by online shopping in the future; and Section 3.7 summarises key findings from the research. 1 This section was written by Mike Jakeman. 18
19 3.1 Recent trends in household disposable income The ONS defines household disposable income as the sum of earnings, state transfers (e.g. benefits) minus direct taxes (such as income tax and national insurance) and other net income accruing to households (e.g. from interest, dividends and rents). Table 3.1 shows how the most important elements of household disposable income have changed over the six years to Q During this period the economy recovered on a more sustained basis from the global financial crisis. By the final quarters of this period, the unemployment rate was down to multi-decade lows of around 4% and nominal wage growth had begun to accelerate in response. Real growth rates in the final column of the table have been calculated by deflating the nominal growth rates using the household expenditure deflator (which averaged 1.7% a year in the six years to Q3 2018). The most notable feature of this analysis is that RHDI growth stood at around 1.5% a year on average, while household expenditure grew 0.7 percentage points faster, at 2.2% a year. The difference between income and expenditure is savings; and when expenditure grows faster than income this difference diminishes, manifested in a lower ratio of savings to income. Accordingly, the household saving ratio (adjusted to exclude changes in pension entitlements) fell from around 5% of household disposable income in Q to 1.5% in Q Table 3.1: Key drivers of real household disposable income (RHDI) billion Average growth rates per year 2012 Q Q3 Nominal Deflator Real Wages and salaries % 1.7% 1.8% Household share of gross operating profits % 1.7% 2.6% Pre-tax earnings % 1.7% 2.0% Income tax paid % 1.7% 2.4% National insurance contribution by workers % 1.7% 1.7% Post-tax earnings % 1.7% 2% Social security benefits % 1.7% 0.0% Post-tax earnings and benefits % 1.7% 1.4% Net property income received (interest, dividends, rent etc.) % 1.7% 2.8% Net current transfers % 1.7% -0.1% Household disposable income % 1.7% 1.5% Adjustment for change in pensions entitlements % 1.7% -7.1% Available household resources % 1.7% 1.2% Memo: Household expenditure % 1.7% 2.2% Source: PwC analysis of ONS data Note: Totals may not round exactly to the sum of the sub-categories owing to rounding UK Economic Outlook March
20 Table 3.1 shows that wages and salaries grew by 1.8% a year in real terms over the period, supported by a fall in the unemployment rate from 7.9% to 4.1% in this time. However, this was outstripped by the profits earned by self-employed workers and business owners, which rose at an annual average rate of 2.6% during the six years. Within this period there was a pronounced shift towards self-employment and small business creation in , when self-employment grew by 10% and regular employment by 5%. This divergence was encouraged by the greater ability of small firms to compete through the internet and mobile technology, the rise of the gig economy, generally lower national insurance rates paid by the self-employed and a broader push to boost entrepreneurship by successive governments. By contrast, between 2015 and 2018, regular employment has grown by 5%, while self-employment has been flat, perhaps because an underlying preference for regular employment remained and this reasserted itself as the labour market tightened and wages increased. These shifting trends have resulted in slightly slower growth in national insurance contributions relative to wage growth and slightly faster growth in income tax payments. Table 3.1 also shows areas that have dampened growth in RHDI over the period: Social security benefits: this category has shown no growth at all in real terms since Although total state pension expenditure has grown relatively strongly at a real annual average rate of 2.3% during , there has been a freeze on working-age benefits in nominal terms 2. Net current transfers: this income category includes transfers to and from UK households in the form of financial gifts (e.g. to and from overseas family members) and some insurance claims, but excludes government transfers. The data in this category are volatile with no apparent trend. Transfers are also a comparatively small component of household income (around 4%), so the effect on overall growth is small. The final row in Table 3.1 shows that total real household resources grew by 1.2% a year after taking into account the change in pension fund entitlements (referred to as net equity in pension funds in the national accounts). However, such changes in pension values are unlikely to be perceived by most households as income that can be spent, so we prefer to remove this from our analysis and instead focus on an adjusted household saving ratio defined as the difference between household disposable income and household expenditure, expressed as a percentage of disposable income. This is lower than the standard ONS definition based on household resources rather than disposable income, but provides a more realistic indication of the difference between household income and spending. 2 Department for Work & Pensions Expenditure Caseload forecasts (2018). 20
21 3.2 Future trends in household disposable income How will household disposable incomes fare in the future? There are many uncertainties here, but Table 3.2 sets out what, assuming a reasonably orderly Brexit, we consider to be a plausible main scenario for real growth to 2020 for each of the main elements of household disposable income growth. In particular we assume that: Total income from wages and salaries will grow at a reasonable real rate of 3% in 2019 and 2.9% in 2020, owing to a tight labour market that will put upward pressure on remuneration and slower inflation that will be roughly in line with the Bank of England s 2% year-on-year target (as discussed further in Section 2 above). Income of households from gross operating profits will struggle to match the growth in salaries, as the demand for workers from companies will continue to draw potential employees away from self-employment. Income tax receipts will grow broadly in line with wages and salaries. Social security benefits will rise by just 0.3% in 2019 and 0.2% in 2020 owing to the government s continued welfare cap for working age benefits. In the medium and long term we expect the average rate of benefits growth to be a little stronger, driven by the expanding number of people accessing the state pension (offset in part by planned rises in the state pension age). But even then growth is likely to be relatively modest in real terms as welfare reform programmes continue. Table 3.2: Main scenario projections of RHDI growth Net property income growth will be particularly sluggish in 2019 as the housing market loses momentum. Faster growth is possible thereafter, but this will be constrained by the Bank of England gradually increasing its policy rate, which will result in more expensive mortgage repayments. Based on these assumptions, we project that RHDI growth will accelerate slightly to 1.8% in 2019 and 2% in 2020, up from 1.7% in 2018 and just 0.5% in This mostly reflects the continued strong labour market in our main scenario. In the long term we expect RHDI growth to settle between around 1.5% and 2% a year, weaker than in the period before the global financial crisis, but also significantly stronger than in the years immediately afterwards e 2019p 2020p Wages and salaries 1.8% 2.2% 3.0% 2.9% Household share of gross operating profits -0.9% 2.3% 3.1% 2.3% Pre-tax earnings 1.0% 2.3% 3.0% 2.7% Income tax paid 2.9% 2.4% 3.7% 2.4% National insurance contribution by workers 1.2% 2.7% 3.6% 3.0% Post-tax earnings 0.5% 2.1% 2.7% 2.8% Social security benefits 0.0% -0.6% 0.3% 0.2% Post-tax earnings and benefits 0.3% 1.3% 2.0% 2.0% Net property income received (interest, dividends, rent etc.) -3.9% 3.1% 0.7% 2.0% Net current transfers 24.7% 5.6% 3.5% 1.6% Household disposable income 0.5% 1.7% 1.8% 2.0% Source: PwC analysis of ONS data for and PwC projections for all growth rates are expressed in real terms UK Economic Outlook March
22 3.3 Household saving ratio: trends and projections The official household savings ratio is defined by the ONS as the difference between available household resources (household disposable income plus an adjustment for the change in pension entitlements as measured by net equity in pension funds) and household expenditure, expressed as a proportion of household resources. As noted above, we prefer to focus on an adjusted savings ratio that excludes changes in net equity in pension funds. Figure 3.1 shows how this adjusted ratio compares to the standard ONS headline measure. Both saving ratios show broadly similar trends over time, but at much lower levels for the adjusted savings rate. The latter fell from around 5% at the turn of the millennium to as a low as -0.2% before the onset of the financial crisis. This period saw consistent economic growth and easy credit conditions, which allowed house prices and household debt levels to rise. Following the shock of the post-crisis recession, household confidence and borrowing slumped and the adjusted savings ratio jumped to more than 6% on average in Since the end of the recession, however, the ratio has fallen back again as confidence and consumer borrowing have revived, although it has been volatile from quarter to quarter. The latest adjusted savings ratio for Q is estimated to be around 1.4%, which is still some way above pre-crisis lows, but also well below post-crisis highs. So what might be the future direction of the household savings ratio? Figure 3.1 Historical trends in headline and adjusted UK household savings ratios % Q Q Q Q Q Q1 Headline savings ratio (with net equity) Source: PwC analysis of ONS data 2007 Q Q1 Projecting forward the savings ratio is subject to considerable uncertainties, reflecting the fact that it is determined by the difference between two much larger numbers: gross disposable income and consumer spending. To address this issue we generated two additional scenarios in addition to our main scenario projections. In our main scenario, a combination of faster nominal wage growth, slightly lower inflation, a softer housing market and some Brexit-related consumer caution push up the savings rate to around 2% by 2020, from an estimated 1.3% in Q Q Q Q Q Q Q1 201 Q1 Adjusted savings ratio (without net equity) Table 3.3: Projections of the adjusted household savings ratio in alternative PwC scenarios (% of household disposable income) Q1 Q e 2019p 2020p Lower savings ratio 1.4% 1.1% 0.6% 0.6% Main scenario 1.4% 1.3% 1.7% 2.0% Higher savings ratio 1.4% 1.5% 2.8% 3.5% Source: PwC analysis based on ONS data for Q3 22
23 3.4 Alternative scenarios for consumer spending growth to 2030 We now combine our household disposable income projections from Table 3.2 with our alternative savings ratio scenarios from Table 3.3 to derive scenarios for real consumer spending growth to We also make illustrative further assumptions on longer growth in spending to Specifically, as set out in Tables : Our main scenario projects real household consumer spending growth to slow down from 1.9% in 2018 to 1.4% in 2019, followed by a mild acceleration to 1.7% in The main factor behind the moderation in growth in 2019 is weakening consumer confidence in the first half of the year owing to broader worries about how Brexit will affect the economy. So far, household spending growth has been remarkably resilient to political turmoil, but we believe that this has become sufficiently acute in early 2019 to trigger more cautious expenditure. Data from our 2019 Retail Outlook report supports this argument, with the proportion of consumers reporting that Brexit will affecting their spending rising to 40%, from 27% in Yet on the assumption that an orderly withdrawal from the EU is achieved, spending growth ought to be stronger in the second half of the year and in We note that RHDI growth is likely to accelerate in , and that this contributes to a slightly higher savings rate. In the longer term, consumer spending growth is likely to return to around 1.8% a year in the 2020s. This is consistent with our estimate for longer term economic growth. Table 3.4: Main scenario projections of growth in real household expenditure (% per year) e 2019p 2020p Average p Real household expenditure 2.1% 1.9% 1.4% 1.7% 1.8% Real household disposable income 0.5% 1.7% 1.8% 2.0% Adjusted savings ratio 1.4% 1.3% 1.7% 2.0% Sources: ONS for Q3. PwC estimates and projections for later periods. The figures for are illustrative assumptions for consumer spending only based on alternative views of long-term trends in GDP growth Table 3.5: Optimistic scenario projections of growth in real household expenditure (% per year) e 2019p 2020p Average p Real household expenditure 2.1% 2.1% 2.4% 2.4% 2.3% Real household disposable income 0.5% 1.7% 2.0% 2.3% Adjusted savings ratio 1.4% 1.1% 0.6% 0.6% Sources: ONS for Q3. PwC estimates and projections for later periods. The figures for are illustrative assumptions for consumer spending only based on alternative views of long-term trends in GDP growth Table 3.6: Pessimistic scenario projections of growth in real household expenditure (% per year) e 2019p 2020p Average p Real household expenditure 2.1% 1.6% 0.2% 0.6% 1.3% Real household disposable income 0.5% 1.7% 1.6% 1.3% Adjusted savings ratio 1.4% 1.5% 2.8% 3.5% Sources: ONS for Q3. PwC estimates and projections for later periods. The figures for are illustrative assumptions for consumer spending only based on alternative views of long-term trends in GDP growth Our optimistic scenario assumes that households enjoy the benefit of faster wage growth and that Brexitrelated developments do not alter their spending decisions. This acceleration of the existing trend lowers the adjusted savings rate to an annual average of 0.6% in , which would be a record low in the modern era. In the long term, we assume that RHDI grows faster than the main scenario due to higher UK productivity growth and so supports average real household expenditure growth of around 2.5% a year in the 2020s. Our pessimistic scenario assumes that the saving ratio rises to 2.8% in 2019 and then increases further in 2020 while disposable income growth is unimpressive. This type of scenario could be associated with UK consumers being less confident owing to a deteriorating global economy and an unsatisfactory conclusion to the Brexit negotiations, together with weak UK productivity growth in the long term, beyond Retail Outlook (PwC, February 2019): UK Economic Outlook March
24
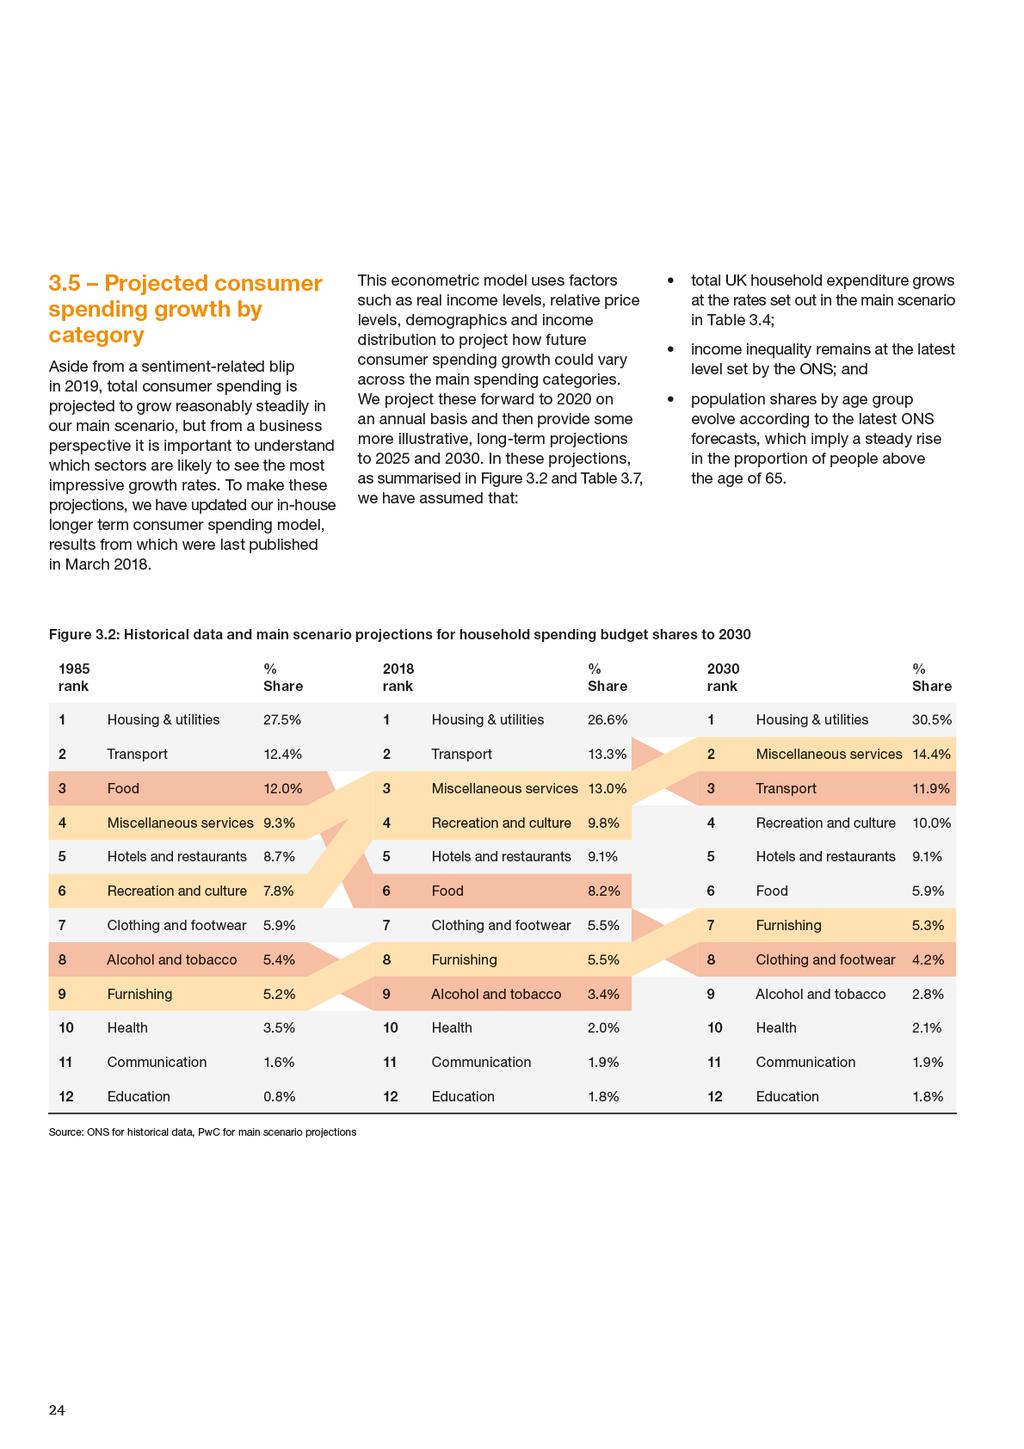
25 Table 3.7: Household budget share projections to 2030 and implied average annual real growth rates by household spending category in our main scenario Shares of total spending Implied average real growth rates 2018e 2025p 2030p p p Housing and utilities 26.6% 28.5% 30.5% 2.2% 2.6% Transport 13.3% 12.6% 11.9% 1.0% 0.5% Miscellaneous services 13.0% 13.9% 14.4% 2.3% 1.9% Recreation and culture 9.8% 10.0% 10.0% 1.8% 1.4% Hotels and restaurants 9.1% 9.1% 9.1% 1.5% 1.5% Food 8.2% 6.9% 5.9% -0.4% -1.0% Clothing and footwear 5.5% 4.7% 4.2% -0.1% -0.4% Furnishings 5.5% 5.4% 5.3% 1.5% 1.0% Alcohol and tobacco 3.4% 3.0% 2.8% 0.4% 0.2% Health 2.0% 2.0% 2.1% 1.7% 2.0% Communications 1.9% 1.9% 1.9% 1.8% 1.5% Education 1.8% 1.8% 1.8% 1.5% 1.4% Total spending 100% 100% 100% 1.7% 1.8% Source: PwC analysis of ONS data for and PwC projections for all growth rates are expressed in real terms Figure 3.2 shows that, by 2030, we estimate that households will need to allocate over 30% of their spending to housing and utilities, compared with around 27% at present. This reflects our expectation, based on past research, that supply shortages will keep house prices and rents rising relatively rapidly in real terms. Indeed, the average real growth rate of housing and utilities spending in both and is expected to be the fastest of all categories in Table 3.7. The miscellaneous services category, which includes financial services (such as credit cards and insurance) and personal care, is expected to become the second largest expenditure category in the period between 2018 and 2025, displacing transport. We expect its share to continue to rise in the years to 2030, so that it accounts for around 14% of total spending by that year. This is intuitive as we expect the Bank of England to raise interest rates gradually in the medium term in our main scenario, and insurance premiums, including tax, may also tend to increase. Reflecting the UK s status as a highincome economy, the two leisure categories recreation and culture and hotels and restaurants are also relatively income-elastic, and so tend to increase their share of total spending as RDHI grows over time. In contrast, necessities such as food and clothing will tend to see their spending shares decline in the long run, continuing the historic trends shown in Figure 3.2. These are also industries where prices have fallen owing to the development of highly efficient and sophisticated supply chains. Particularly in the case of food, however, there could be some volatility around this declining trend owing to fluctuations in harvest size and exchange rates. The transport sector is also expected to see a fall in its budgetary share in the long term, although it may still see some modest growth in real terms. The decline reflects both an ageing population and a fall in the proportion of younger adults with driving licences, coupled with the growth of internet shopping (see Section 3.6), food delivery companies and disruptive entrants into the transport sector (such as Uber) which are expected to impact on transport spend per person. UK Economic Outlook March
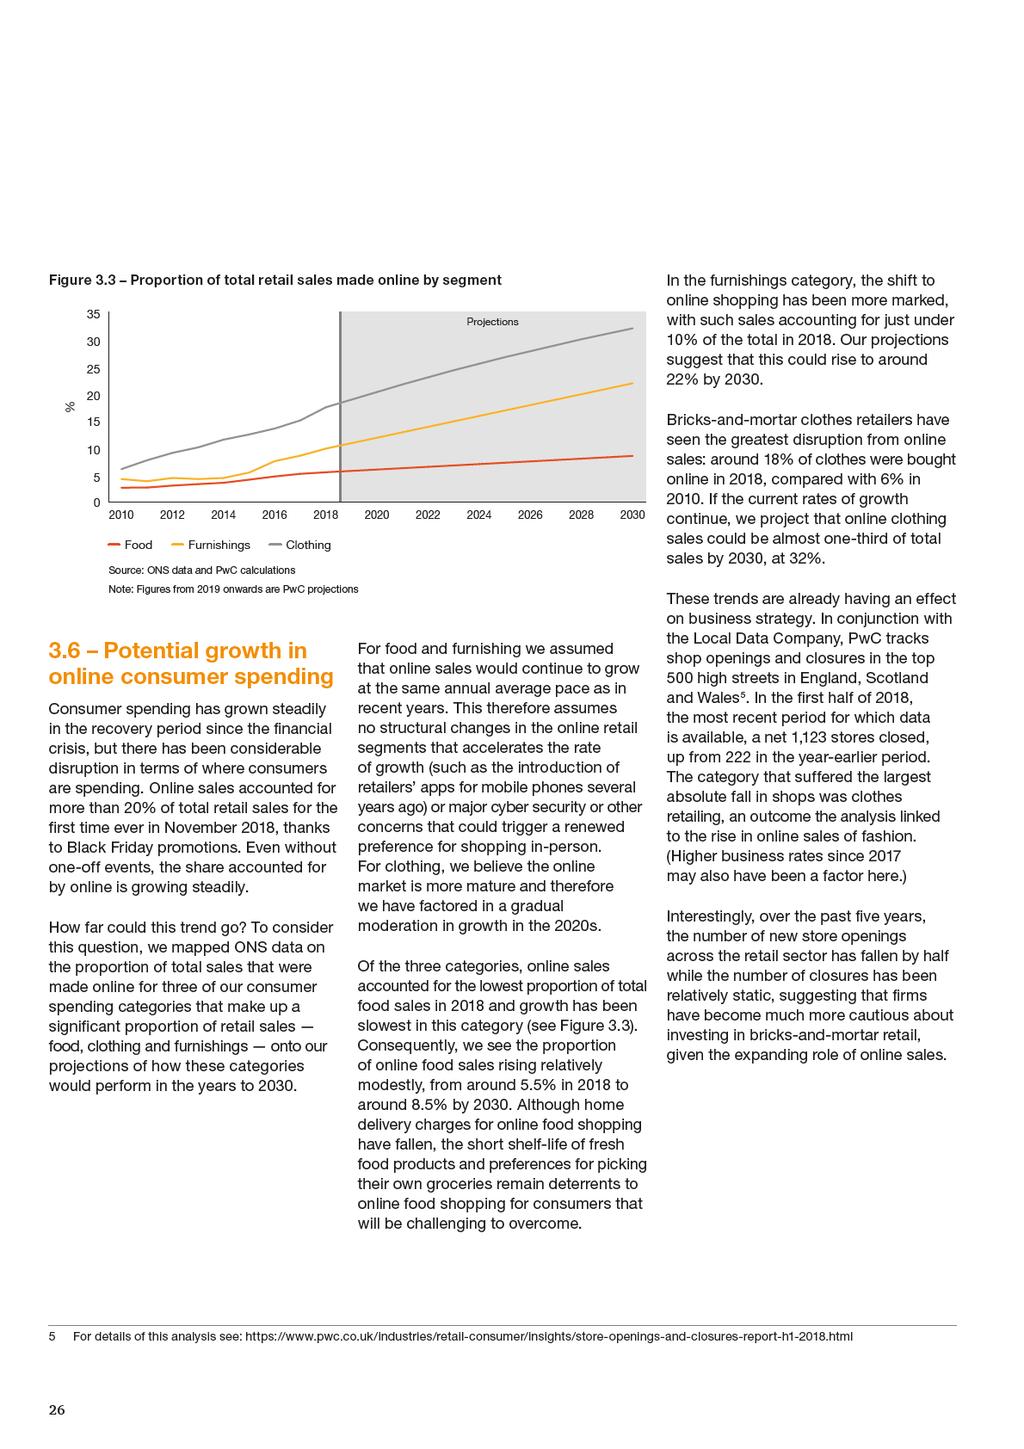
26
27 3.7 Summary and conclusions Over the past six years, household spending has tended to outpace consumer price inflation and support the UK s recovery from the global financial crisis, helped by continued low interest rates, strong employment growth and a willingness of households to borrow more. However, growth in consumer spending has also slowed since 2016 because of the effects of a weaker pound and rising inflation on real wage growth. These effects are beginning to fade, ut we expect more subdued growth in house prices and uncertainties about the Brexit process to mean that household spending growth slows for another year in At the same time, assuming a reasonably orderly Brexit, the labour market is likely to continue to tighten, with firms having to pay ever higher wages to attract new employees. This means that RDHI growth should accelerate in 2019 and again in Slower growth in spending and faster growth in income means that the adjusted saving ratio which had been in long-term decline could receive at least a temporary boost in these years. In our main scenario, we therefore project that real consumer spending will slow from around 1.9% in 2018 to 1.4% in 2019, before returning to its trend growth of around 1.8% on average in the 2020s. Other scenarios show long-term real consumer spending growth of between around 1.3% and 2.3% a year over the period to We expect that housing and utilities will absorb a larger and larger share of household spending, rising above the 30% threshold by 2030, from less than 27% in We also expect to see financial services and personal care account for a greater proportion of spending in the same period, while more basic categories, such as food, clothing and alcohol will see their shares decline. Social and industrial changes are likely to drive particular disruption in the transport category. Where transport was once accounting for a rising share of spending in the 30 years to 2018, this trend is projected to reverse in the years to Online sales are likely to become an even more important part of consumer spending in the long term. The proportion of sales conducted online doubled in each of the food, furnishing and clothing categories between 2010 and Assuming no structural change that accelerates the rate of growth from recent levels (or major cyber security or other concerns that trigger a significant slowdown or decline), we estimate that the online proportion of retail spending in each of these segments could rise between 2018 and 2030 from 5% to 8% for food, from 10% to 22% for furnishings and from 18% to 32% for clothing. UK Economic Outlook March
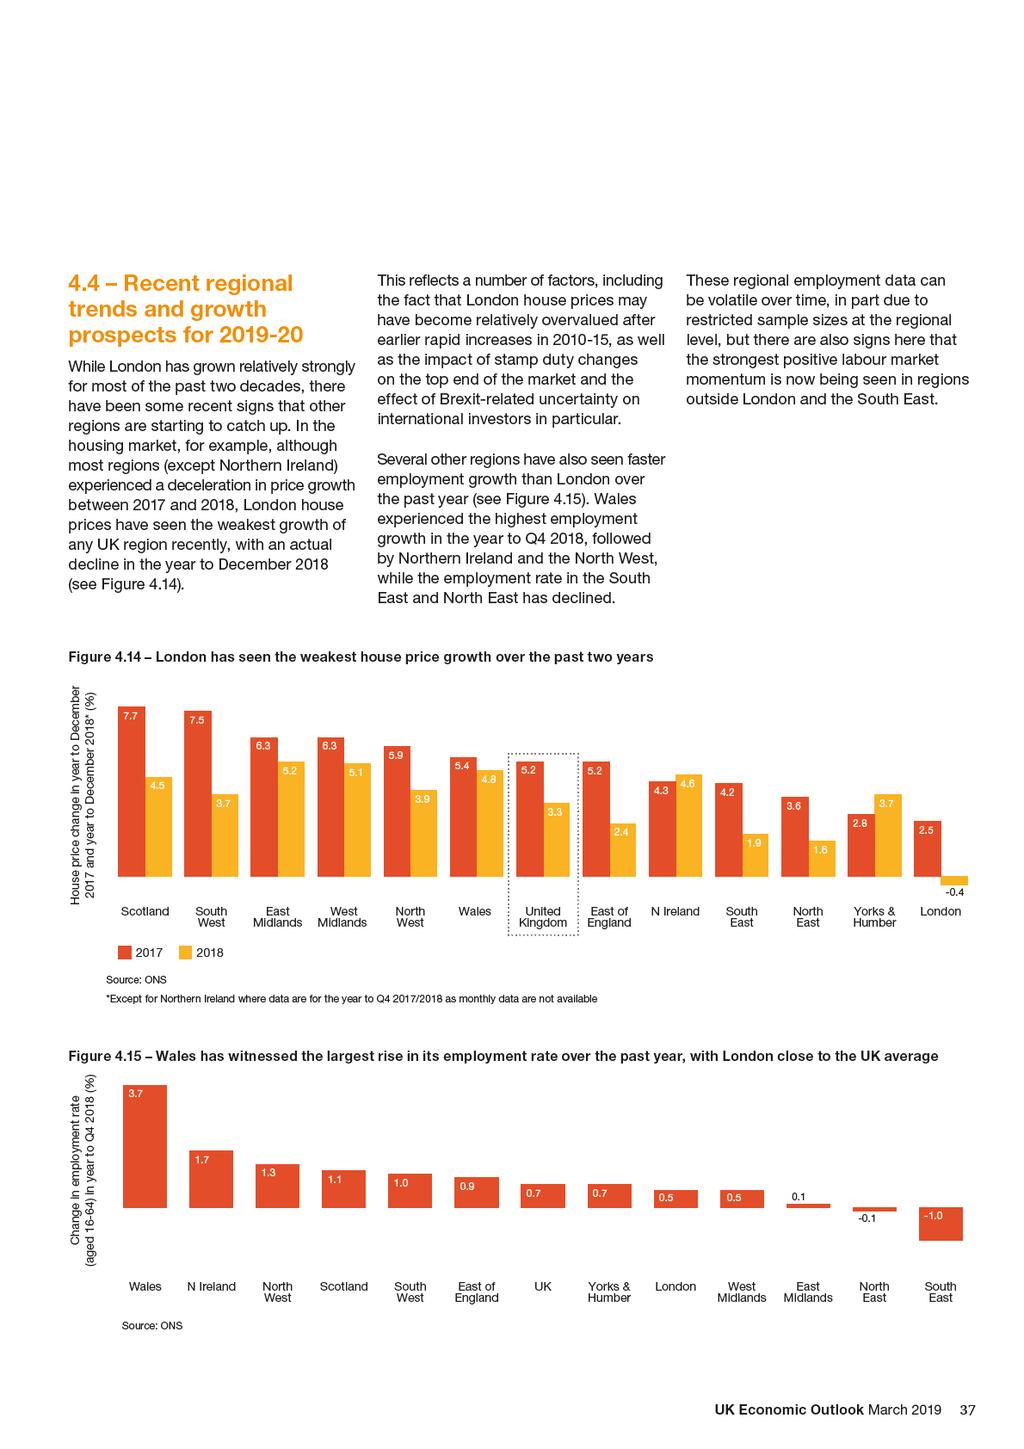
28 4. Regional growth trends and prospects 1 Key points London has consistently outperformed other UK regions for most of the past three decades in terms of economic growth. This is in marked contrast to the 1970s and early 1980s when London s average growth rate was slower than the UK average due to people moving out of the capital. Outside London, Southern English regions and the East Midlands grew relatively rapidly in the 1970s and 1980s, while heavy industrial areas in the West Midlands and Northern regions lagged behind. Since the early 1990s, however, there has been less consistent evidence of a clear North-South divide outside London. Much of London s outperformance is linked to the boom in financial and business services following the financial deregulation of the 1980s, as well as its relatively smaller exposure to the declining UK manufacturing sector. Population trends have played an important role in explaining overall economic growth variations by region since the 1970s, with strong net immigration over the past two decades masking an underlying decline in output per person growth in most regions relative to earlier decades. More recently, there have been signs from housing and labour markets that London s relative performance has been less strong. We expect this to continue in , with London growing only slightly faster than the UK average rate in those years. Brexit-related uncertainty is likely to dampen growth in all regions this year, but there could be some pick-up in growth across the UK in 2020 if a reasonably orderly Brexit can be achieved. Introduction It is well-documented that the UK has been characterised in recent decades by an increasing economic growth divide between London and other regions of the country. But what exactly has driven the opening up of this growth divide and can we expect it to continue? To address this question we have made use both of the latest official ONS data on real output (GVA 2 ) growth by region from 1998 to 2017, which was published in December , and a new set of estimates of quarterly and annual regional growth dating back as far as 1972 that has been published by the Economic Statistics Centre of Excellence (ESCoE) 4. The combination of these two data sets provides us with a longer term historical view of the UK regional real output growth than was previously available. In this article we begin by reviewing the key trends in real GVA growth by region since the early 1970s (Section 4.1) and then consider how far variations in regional population growth may have driven these historical growth differentials (Section 4.2). We also explore what other factors might explain these regional GVA growth variations, including differences in the mix of industry sectors seen in different regions and variations in education levels (Section 4.3). We then look at regional trends in 2018 and how regional growth rates might evolve in 2019 and 2020 (Section 4.4). Section 4.5 summarises and concludes. Data on average regional growth in GVA, population and GVA per capita for the decades since the 1970s is also available to explore further on our website at More recently, there have been signs from housing and labour markets that London s relative performance has been less strong. We expect this to continue in , with London growing only slightly faster than the UK average rate in those years. John Hawksworth Chief Economist, PwC 1 This article was written by John Hawksworth and Hoa Duong 2 Gross Value Added (GVA) provides the best available measure of economic activity at regional level, broadly corresponding to Gross Domestic Product (GDP) at national level. We therefore focus on GVA here, although we recognise that there are a range of other socio-economic measures that can help assess regional and local performance as discussed, for example, in our Good Growth for Cities report here: 3 For details of the latest ONS regional GVA data see: 4 Details of this new dataset were published in a November 2018 ESCoE discussion paper by G. Koop, J. Mitchell, S.McIntyre and A.Poon that is available here: 28
29
30
31 4.2 How far do population trends explain regional GVA growth variations? Figure 4.3 Average annual population growth by decade for the UK and selected regions Overall, the last five decades saw an upward trend in UK population growth over time at both a national and regional level (see Figure 4.3 for selected regions), particularly since net inward migration increased markedly after EU enlargement in But regional population trends have varied over time, notably in the case of London where the population was declining through the 1970s and early 1980s. As Figure 4.4 shows, this was associated with a movement of people from the capital to surrounding regions in Southern England over that period. A range of factors lay behind these trends, including companies moving offices out of London, families preferring to live in the Home Counties and commute into London where necessary, and retirees moving to areas such as the South West for a better perceived quality of life. London s population bottomed out in 1983 and has been growing at an accelerating rate since then. This was associated with financial deregulation (e.g. the Big Bang ) boosting London s attractions as a global financial and business services centre from the mid-1980s, as well as strong international net migration to London in more recent decades. % per annum UK Average South West South East East Midlands Scotland North West Yorkshire and the Humber West Midlands North East Source: PwC analysis of ONS data Figure 4.4 London experienced depopulation in the 1970s and early 1980s but its population has picked up sharply since the mid-1980s % per annum London's strenghtening population growth over time (% pa) UK Average London % per annum Other Southern regions gained population from London in 1970s and early 1980s UK Average South East South West East of England Source: PwC analysis of ONS data UK Economic Outlook March
32
33
34
35
36
37
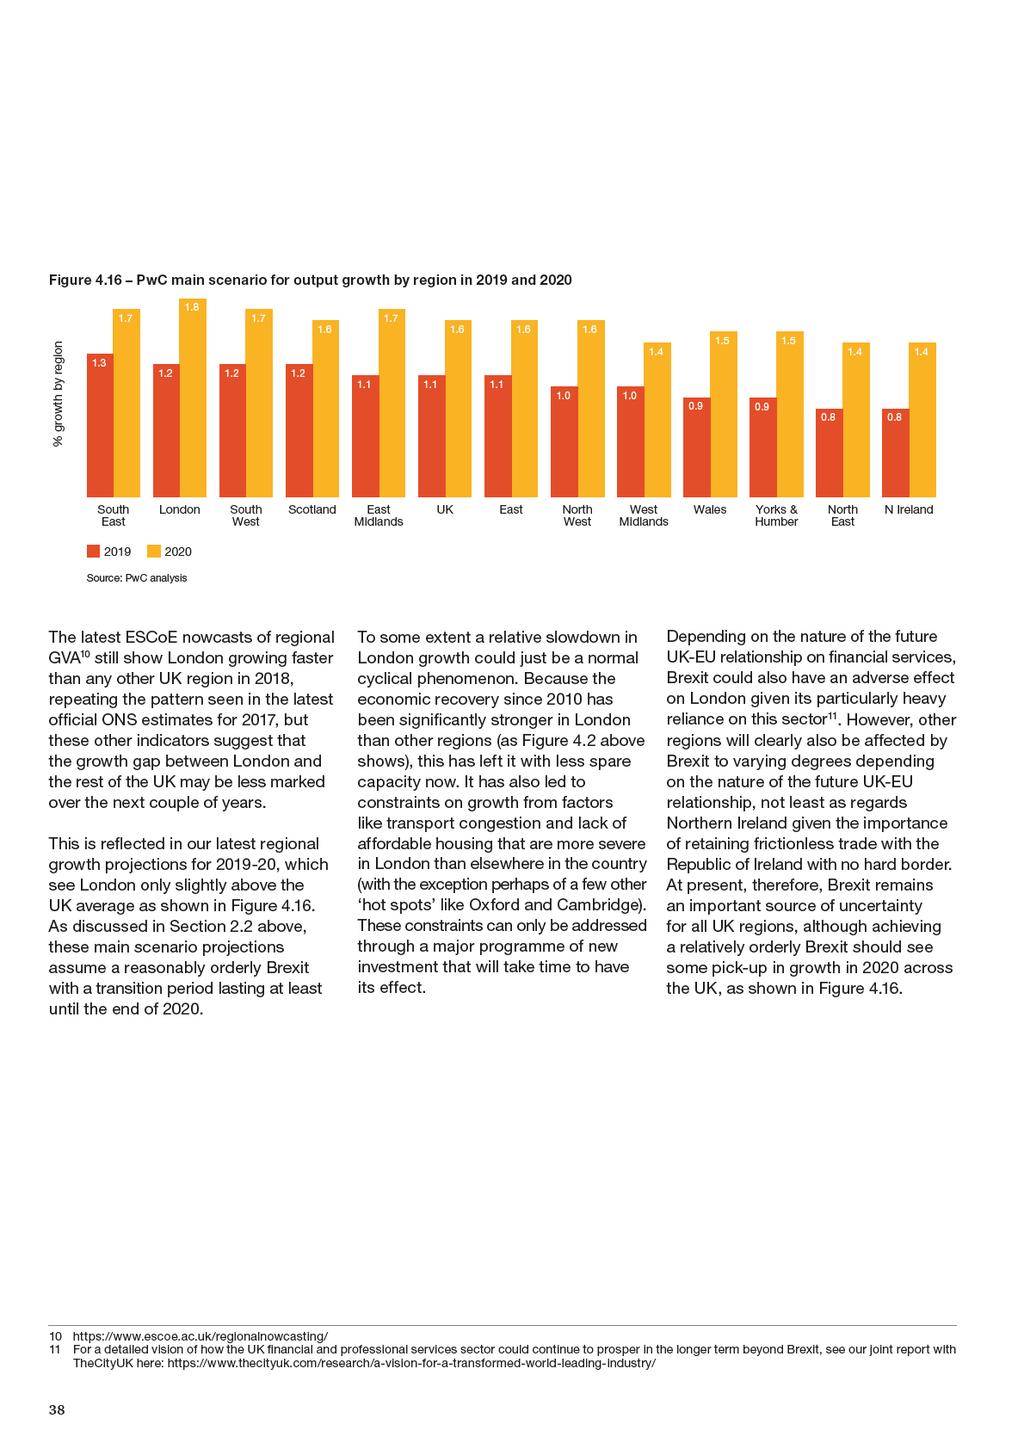
38
3. The outlook for consumer spending and online retail 1
 3. The outlook for consumer spending and online retail 1 Key points Consumer spending growth is estimated to have slowed for a second consecutive year in 2018, but is still expected to have grown at an
Highlights and key messages for business and public policy
 Highlights and key messages for business and public policy Key projections 2018 2019 Real GDP growth 1.5% 1.6% Consumer spending growth 1.1% 1.3% Inflation (CPI) 2.7% 2.3% Source: PwC main scenario projections
3 The outlook for consumer spending and the impact of automation 1
 3 The outlook for consumer spending and the impact of automation 1 Key points Consumer spending slowed during 2017, but has nonetheless grown by an average of 2.3 percentage points per annum faster than
Figure 2.3 Purchasing Managers Indices of business activity. Figure 2.4 US dollar and euro exchange rates against the pound.
 Prior to 20, consumer spending was a key driver of GDP growth, but this was achieved in part by running up ever higher debts. We explore this further in our latest Precious Plastic report 2, which highlighted
Highlights and key messages for business and public policy
 Highlights and key messages for business and public policy Key projections 2018 2019 Real GDP growth 1.5% 1.6% Consumer spending growth 1.1% 1.3% Inflation (CPI) 2.7% 2.3% Source: PwC main scenario projections
Highlights and key messages for business and public policy
 Highlights and key messages for business and public policy Key projections 2018 2019 Real GDP growth 1.3% 1.6% Consumer spending growth 1.1% 1.3% Inflation (CPI) 2.5% 2.3% House prices 2.9% 2.8% Source:
Highlights and key messages for business and public policy
 Highlights and key messages for business and public policy Key projections 2018 2019 Real GDP growth 1.3% 1.6% Consumer spending growth 1.7% 1.5% Fixed investment growth -0.5% 0.8% Inflation (CPI) 2.5%
Highlights and key messages for business and public policy
 Highlights and key messages for business and public policy Key projections 2017 2018 Real GDP growth 1.5% 1.4% Consumer spending growth 1.6% 1.1% Inflation (CPI) 2.7% 2.7% Source: PwC main scenario projections
INFLATION REPORT PRESS CONFERENCE. Thursday 10 th May Opening Remarks by the Governor
 INFLATION REPORT PRESS CONFERENCE Thursday 10 th May 2018 Opening Remarks by the Governor Three months ago, the MPC said that an ongoing tightening of monetary policy over the next few years would be appropriate
UK Economic Outlook. March The impact of lower oil prices on the UK economy
 March 2015 UK Economic Outlook The impact of lower oil prices on the UK economy New job creation in the UK: which regions will benefit most from the digital revolution? www.pwc.co.uk/economics Contents
BANK OF FINLAND ARTICLES ON THE ECONOMY
 BANK OF FINLAND ARTICLES ON THE ECONOMY Table of Contents Global economy to grow steadily 3 FORECAST FOR THE GLOBAL ECONOMY Global economy to grow steadily TODAY 1:00 PM BANK OF FINLAND BULLETIN 1/2017
LESS DYNAMIC GROWTH AMID HIGH UNCERTAINTY
 OVERVIEW: The European economy has moved into lower gear amid still robust domestic fundamentals. GDP growth is set to continue at a slower pace. LESS DYNAMIC GROWTH AMID HIGH UNCERTAINTY Interrelated
Structural changes in the Maltese economy
 Structural changes in the Maltese economy Article published in the Annual Report 2014, pp. 72-76 BOX 4: STRUCTURAL CHANGES IN THE MALTESE ECONOMY 1 Since the global recession that took hold around the
BCC UK Economic Forecast Q4 2015
 BCC UK Economic Forecast Q4 2015 David Kern, Chief Economist at the BCC The main purpose of the BCC Economic Forecast is to articulate a BCC view on economic topics that are relevant to our members, and
Monthly Economic Review
 Monthly Economic Review FEBRUARY 2018 Based on January 2018 data releases Bedfordshire Chamber of Commerce Headlines UK GDP growth picked up in Q4, driven by stronger output from the services sector The
UK Economic Outlook July 2013
 www.pwc.co.uk UK Economic Outlook July 213 Feature articles: Is the UK housing market on the road to recovery? The trillion pound question are gilts the next bubble to burst? PwC firms help organisations
UK Economic Outlook March 2017
 www.pwc.co.uk/economics Contents 1 2 3 4 Global outlook UK economic trends and prospects Consumer spending prospects after Brexit Will robots steal our jobs? 2 Global growth in 2017 should be slightly
Svein Gjedrem: Interest rates, the exchange rate and the outlook for the Norwegian economy
 Svein Gjedrem: Interest rates, the exchange rate and the outlook for the Norwegian economy Speech by Mr Svein Gjedrem, Governor of Norges Bank (Central Bank of Norway), to the Mid-Norway Chamber of Commerce
Ireland. Eurozone rebalancing. EY Eurozone Forecast June Portugal Slovakia Slovenia Spain. Latvia Lithuania Luxembourg Malta Netherlands
 EY Forecast June 2015 rebalancing recovery Outlook for Rising domestic demand improves prospects for 2015 Published in collaboration with Highlights The Irish economy grew by 4.8% last year, which was
Finland falling further behind euro area growth
 BANK OF FINLAND FORECAST Finland falling further behind euro area growth 30 JUN 2015 2:00 PM BANK OF FINLAND BULLETIN 3/2015 ECONOMIC OUTLOOK Economic growth in Finland has been slow for a prolonged period,
Monetary Policy Summary and minutes of the Monetary Policy Committee meeting ending on 10 May 2017
 Monetary Policy Summary and minutes of the Monetary Policy Committee meeting ending on 10 May 2017 Publication date: 11 May 2017 These are the minutes of the Monetary Policy Committee meeting ending on
November UK Economic Outlook. How robust is the UK consumer recovery? Getting the balance right in the UK regions.
 November 2014 UK Economic Outlook How robust is the UK consumer recovery? Getting the balance right in the UK regions www.pwc.co.uk/economics Contents Highlights and key messages 3 1. Summary 4 2. UK economic
Economic projections
 Economic projections 2017-2020 December 2017 Outlook for the Maltese economy Economic projections 2017-2020 The pace of economic activity in Malta has picked up in 2017. The Central Bank s latest economic
The UK economic and fiscal outlook
 The UK economic and fiscal outlook Report for StepChange Debt Charity Centre for Economics and Business Research ltd Contents Executive summary 3 Global economic outlook 4 UK economic outlook 8 UK regional
Economic ProjEctions for
 Economic Projections for 2016-2018 ECONOMIC PROJECTIONS FOR 2016-2018 Outlook for the Maltese economy 1 Economic growth is expected to ease Following three years of strong expansion, the Bank s latest
Outlook for Economic Activity and Prices (July 2018)
") Outlook for Economic Activity and Prices (July 2018) July 31, 2018 Bank of Japan The Bank's View 1 Summary Japan's economy is likely to continue growing at a pace above its potential in fiscal 2018, mainly
Outlook for Economic Activity and Prices (July 2018) July 31, 2018 Bank of Japan The Bank's View 1 Summary Japan's economy is likely to continue growing at a pace above its potential in fiscal 2018, mainly
Koji Ishida: Japan s economy, price developments and monetary policy
 Koji Ishida: Japan s economy, price developments and monetary policy Speech by Mr Koji Ishida, Member of the Policy Board of the Bank of Japan, at a meeting with business leaders, Fukuoka, 18 February
Explore the themes and thinking behind our decisions.
 ASSET ALLOCATION COMMITTEE VIEWPOINTS First Quarter 2017 These views are informed by a subjective assessment of the relative attractiveness of asset classes and subclasses over a 6- to 18-month horizon.
Structural Changes in the Maltese Economy
 Structural Changes in the Maltese Economy Dr. Aaron George Grech Modelling and Research Department, Central Bank of Malta, Castille Place, Valletta, Malta Email: grechga@centralbankmalta.org Doi:10.5901/mjss.2015.v6n5p423
Monetary Policy Summary and minutes of the Monetary Policy Committee meeting ending on 15 March 2017
 Monetary Policy Summary and minutes of the Monetary Policy Committee meeting ending on 15 March 2017 Publication date: 16 March 2017 These are the minutes of the Monetary Policy Committee meeting ending
Economic Projections :1
 Economic Projections 2017-2020 2018:1 Outlook for the Maltese economy Economic projections 2017-2020 The Central Bank s latest economic projections foresee economic growth over the coming three years to
Economic Projections :2
 Economic Projections 2018-2020 2018:2 Outlook for the Maltese economy Economic projections 2018-2020 The Central Bank s latest economic projections foresee economic growth over the coming three years to
Haruhiko Kuroda: Japan s economy and monetary policy
 Haruhiko Kuroda: Japan s economy and monetary policy Speech by Mr Haruhiko Kuroda, Governor of the Bank of Japan, at a meeting with business leaders, Osaka, 28 September 2015. Introduction * * * It is
Monetary Policy Summary and minutes of the Monetary Policy Committee meeting ending on 19 December 2018
 Monetary Policy Summary and minutes of the Monetary Policy Committee meeting ending on 19 December 2018 Publication date: 20 December 2018 These are the minutes of the Monetary Policy Committee meeting
The reasons why inflation has moved away from the target and the outlook for inflation.
 BANK OF ENGLAND Mark Carney Governor The Rt Hon George Osborne Chancellor of the Exchequer HM Treasury 1 Horse Guards Road London SW1A2HQ 12 May 2016 On 12 April, the Office for National Statistics (ONS)
Editor: Thomas Nilsson. The Week Ahead Key Events Jul, 2017
 Editor: Thomas Nilsson The Week Ahead Key Events 10 16 Jul, 2017 European Sovereign Rating Reviews Recent rating reviews Upcoming rating reviews Source: Bloomberg Monday 10, 08.00 NOR: CPI (Jun) SEB Cons.
Regional Forecast and Analysis Greater London (example) Sample from June 2015 forecast
 Sample from June 2015 forecast") Regional Forecast and Analysis Greater London (example) from June 2015 forecast Greater South London East Economic Outlook CONTENTS 1. Executive Summary 2. UK Economy Prospects & key risks Recent trends
Regional Forecast and Analysis Greater London (example) from June 2015 forecast Greater South London East Economic Outlook CONTENTS 1. Executive Summary 2. UK Economy Prospects & key risks Recent trends
Explore the themes and thinking behind our decisions.
 ASSET ALLOCATION COMMITTEE VIEWPOINTS Fourth Quarter 2016 These views are informed by a subjective assessment of the relative attractiveness of asset classes and subclasses over a 6- to 18-month horizon.
Highlights and key messages for business and public policy
 Highlights and key messages for business and public policy Key projections 2017 2018 Real GDP growth 1.5% 1.4% Consumer spending growth 1.6% 1.1% Inflation (CPI) 2.7% 2.7% Source: PwC main scenario projections
South African Reserve Bank STATEMENT OF THE MONETARY POLICY COMMITTEE. Issued by Lesetja Kganyago, Governor of the South African Reserve Bank
 South African Reserve Bank PRESS STATEMENT EMBARGO DELIVERY 23 November 2017 STATEMENT OF THE MONETARY POLICY COMMITTEE Issued by Lesetja Kganyago, Governor of the South African Reserve Bank Since the
MEDIUM-TERM FORECAST
 MEDIUM-TERM FORECAST Q2 2010 Published by: Národná banka Slovenska Address: Národná banka Slovenska Imricha Karvaša 1 813 25 Bratislava Slovakia Contact: Monetary Policy Department +421 2 5787 2611 +421
Monetary Policy Summary and minutes of the Monetary Policy Committee meeting ending on 13 December 2017
 Monetary Policy Summary and minutes of the Monetary Policy Committee meeting ending on 13 December 2017 Publication date: 14 December 2017 These are the minutes of the Monetary Policy Committee meeting
Svein Gjedrem: The outlook for the Norwegian economy
 Svein Gjedrem: The outlook for the Norwegian economy Address by Mr Svein Gjedrem, Governor of Norges Bank (Central Bank of Norway), at the Bergen Chamber of Commerce and Industry, Bergen, 11 April 2007.
Growth to accelerate. A quarterly analysis of trends in the Irish economy
 Produced by the Economic Research Unit July 2014 A quarterly analysis of trends in the Irish economy Growth to accelerate Strong start to 2014 Recovery becoming more broad-based GDP growth revised up for
a labour market that has continued to exhibit strong growth in employment, but weak growth in earnings and productivity; and
 1 Executive summary 1.1 Twice a year at the OBR, we provide a detailed central forecast for the economy and the public finances. These forecasts provide a transparent benchmark against which to judge the
Table 1: Arithmetic contributions to June 2016 CPl inflation relative to the pre-crisis average
 BANK OF ENGLAND Mark Carney Governor The Rt Hon Philip Hammond Chancellor of the Exchequer HM Treasury 1 Horse Guards Road London SW1A2HQ 4 August 2016 On 19 July, the Office for National Statistics published
Northern Ireland Quarterly Sectoral Forecasts
 2017 Quarter 1 Northern Ireland Quarterly Sectoral Forecasts Forecast summary The Northern Ireland economy enjoyed a solid performance in 2016 with overall growth of 1.5%, the strongest rate of growth
4 Regional growth trends and prospects 1
 4 Regional growth trends and prospects 1 Key points has consistently outperformed other UK regions for most of the past two decades in terms of economic growth, both before and after the global financial
Legal services sector forecasts
 www.lawsociety.org.uk Legal services sector forecasts 2017-2025 August 2018 Legal services sector forecasts 2017-2025 2 The Law Society of England and Wales August 2018 CONTENTS SUMMARY OF FORECASTS 4
Svein Gjedrem: The conduct of monetary policy
 Svein Gjedrem: The conduct of monetary policy Introductory statement by Mr Svein Gjedrem, Governor of Norges Bank (Central Bank of Norway), at the hearing before the Standing Committee on Finance and Economic
Japan's Economy and Monetary Policy
 September 28, 2015 B ank of Japan Japan's Economy and Monetary Policy Speech at a Meeting with Business Leaders in Osaka Haruhiko Kuroda Governor of the Bank of Japan (English translation based on the
Minutes of the Monetary Policy Council decision-making meeting held on 6 July 2016
 Minutes of the Monetary Policy Council decision-making meeting held on 6 July 2016 At the meeting, members of the Monetary Policy Council discussed monetary policy against the background of macroeconomic
1 Executive summary. Overview
 1 Executive summary Overview 1.1 Relatively little time has passed since our November forecast and the outlook for the economy and public finances looks broadly the same. The economy has slightly more
Lars Heikensten: Monetary policy and the economic situation
 Lars Heikensten: Monetary policy and the economic situation Speech by Mr Lars Heikensten, Governor of the Sveriges Riksbank, at Handelsbanken, Karlstad, 26 January 2004. * * * It is nice to meet a group
Eurozone. Economic Watch FEBRUARY 2017
 Eurozone Economic Watch FEBRUARY 2017 EUROZONE WATCH FEBRUARY 2017 Eurozone: A slight upward revision to our GDP growth projections The recovery proceeded at a steady and solid pace in, resulting in an
FISCAL COUNCIL OPINION ON THE SUMMER FORECAST 2018 OF THE MINISTRY OF FINANCE
 FISCAL COUNCIL OPINION ON THE SUMMER FORECAST 2018 OF THE MINISTRY OF FINANCE September 2018 Contents Opinion... 3 Explanatory Report... 4 Opinion on the summer forecast 2018 of the Ministry of Finance...
Projections for the Portuguese Economy:
 Projections for the Portuguese Economy: 2018-2020 March 2018 BANCO DE PORTUGAL E U R O S Y S T E M BANCO DE EUROSYSTEM PORTUGAL Projections for the portuguese economy: 2018-20 Continued expansion of economic
Outlook for Economic Activity and Prices (October 2017)
") Outlook for Economic Activity and Prices (October 2017) October 31, 2017 Bank of Japan The Bank's View 1 Summary Japan's economy is likely to continue expanding on the back of highly accommodative financial
Outlook for Economic Activity and Prices (October 2017) October 31, 2017 Bank of Japan The Bank's View 1 Summary Japan's economy is likely to continue expanding on the back of highly accommodative financial
2015: FINALLY, A STRONG YEAR
 2015: FINALLY, A STRONG YEAR A Cushman & Wakefield Research Publication U.S. GDP GROWTH IS ACCELERATING 4% 3.5% Percent Change Annual Rate 2% 0% -2% -4% -5.4% -0.5% 1.3% 3.9% 1.7% 3.9% 2.7% 2.5% -1.5%
QUARTERLY REPORT ON THE SPANISH ECONOMY OVERVIEW
 QUARTERLY REPORT ON THE SPANISH ECONOMY OVERVIEW During 13 the Spanish economy moved on a gradually improving path that enabled it to exit the contractionary phase dating back to early 11. This came about
DECEMBER 2017 BREXIT: BDO S MONTHLY ECONOMIC UPDATE
 DECEMBER 2017 BREXIT: BDO S MONTHLY ECONOMIC UPDATE Welcome to the 18th edition of BDO s monthly economic outlook a temperature check of how UK businesses are feeling in the post-referendum world. Our
Quarterly Economic Monitor
 Overview of Quarterly Economic Monitor December 214 Queenstown s economy boomed during 214, with ' provisional estimate of GDP showing that the Queenstown-Lakes District economy grew by 4.5% over the year
Asda Income Tracker. Report: December 2015 Released: January Centre for Economics and Business Research ltd
 Asda Income Tracker Report: December 2015 Released: January 2016 M a k i n g B u s i n e s s S e n s e Centre for Economics and Business Research ltd Unit 1, 4 Bath Street, London EC1V 9DX t 020 7324 2850
Global Macroeconomic Monthly Review
 Global Macroeconomic Monthly Review August 14 th, 2018 Arie Tal, Research Economist Capital Markets Division, Economics Department 1 Please see disclaimer on the last page of this report Key Issues Global
Regulatory Announcement RNS Number: RNS to insert number here Québec 27 November, 2017
 ISSN 1718-836 Regulatory Announcement RNS Number: RNS to insert number here Québec 27 November, 2017 Re: Québec Excerpts from The Quebec Economic Plan November 2017 Update, Québec Public Accounts 2016-2017
MINUTES OF THE MONETARY POLICY COMMITTEE MEETING 4 AND 5 NOVEMBER 2009
 Publication date: 18 November 2009 MINUTES OF THE MONETARY POLICY COMMITTEE MEETING 4 AND 5 NOVEMBER 2009 These are the minutes of the Monetary Policy Committee meeting held on 4 and 5 November 2009. They
South African Reserve Bank STATEMENT OF THE MONETARY POLICY COMMITTEE. Issued by Lesetja Kganyago, Governor of the South African Reserve Bank
 South African Reserve Bank PRESS STATEMENT 24 January 2017 STATEMENT OF THE MONETARY POLICY COMMITTEE Issued by Lesetja Kganyago, Governor of the South African Reserve Bank Since the previous meeting of
South African Reserve Bank STATEMENT OF THE MONETARY POLICY COMMITTEE. Issued by Lesetja Kganyago, Governor of the South African Reserve Bank
 South African Reserve Bank PRESS STATEMENT EMBARGO DELIVERY 18 January 2018 STATEMENT OF THE MONETARY POLICY COMMITTEE Issued by Lesetja Kganyago, Governor of the South African Reserve Bank In recent weeks,
Developments in inflation and its determinants
 INFLATION REPORT February 2018 Summary Developments in inflation and its determinants The annual CPI inflation rate strengthened its upward trend in the course of 2017 Q4, standing at 3.32 percent in December,
Minutes of the Monetary Policy Council decision-making meeting held on 2 September 2015
 Minutes of the Monetary Policy Council decision-making meeting held on 2 September 2015 Members of the Monetary Policy Council discussed monetary policy against the background of the current and expected
Outlook for Economic Activity and Prices
 Not to be released until : p.m. Japan Standard Time on Saturday, October 31, 15. October 31, 15 Bank of Japan Outlook for Economic Activity and Prices October 15 (English translation prepared by the Bank's
Lars Heikensten: The Swedish economy and monetary policy
 Lars Heikensten: The Swedish economy and monetary policy Speech by Mr Lars Heikensten, Governor of the Sveriges Riksbank, at a seminar arranged by the Stockholm Chamber of Commerce and Veckans Affärer,
MINUTES OF THE MONETARY POLICY COMMITTEE MEETING 7 AND 8 OCTOBER 2009
 Publication date: 21 October 2009 MINUTES OF THE MONETARY POLICY COMMITTEE MEETING 7 AND 8 OCTOBER 2009 These are the minutes of the Monetary Policy Committee meeting held on 7 and 8 October 2009. They
Economic Projections For 2014 And 2015
 Economic Projections For 2014 And 2015 Article published in the Quarterly Review 2014:3, pp. 77-81 7. ECONOMIC PROJECTIONS FOR 2014 AND 2015 Outlook for the Maltese economy 1 The Bank s latest macroeconomic
Irish Economic Update AIB Treasury Economic Research Unit
 Irish Economic Update AIB Treasury Economic Research Unit 9th October 2018 Budget 2019 Public Finances in Balance The Irish economy has performed strongly in recent years, boosting tax revenues. Corporation
ECONOMIC RECOVERY AT CRUISE SPEED
 EBF Economic Outlook Nr 43 May 2018 2018 SPRING OUTLOOK ON THE EURO AREA ECONOMIES IN 2018-2019 ECONOMIC RECOVERY AT CRUISE SPEED EDITORIAL TEAM: Francisco Saravia (author), Helge Pedersen - Chair of the
Economic Projections for
 Economic Projections for 2015-2017 Article published in the Quarterly Review 2015:3, pp. 86-91 7. ECONOMIC PROJECTIONS FOR 2015-2017 Outlook for the Maltese economy 1 The Bank s latest macroeconomic projections
Monthly Report of Prospects for Japan's Economy
 Monthly Report of Prospects for Japan's Economy June 1 Macro Economic Research Centre Economics Department http://www.jri.co.jp/english/periodical/ This report is the revised English version of the May
Asda Income Tracker. Report: June 2012 Released: July Centre for Economics and Business Research ltd
 Asda Income Tracker Report: June 2012 Released: July 2012 M a k i n g B u s i n e s s S e n s e Centre for Economics and Business Research ltd Unit 1, 4 Bath Street, London EC1V 9DX t 020 7324 2850 w www.cebr.com
INFLATION REPORT PRESS CONFERENCE. Thursday 7 February Opening Remarks by the Governor
 INFLATION REPORT PRESS CONFERENCE Thursday 7 February 2019 Opening Remarks by the Governor The Fog of Brexit There s a story that, a century or so ago, The Times ran the headline, Fog in the channel, continent
Asda Income Tracker. Report: July 2016 Released: August Centre for Economics and Business Research ltd
 Asda Income Tracker Report: July 2016 Released: August 2016 M a k i n g B u s i n e s s S e n s e Centre for Economics and Business Research ltd Unit 1, 4 Bath Street, London EC1V 9DX t 020 7324 2850 w
EUROPEAN EXPORT INDEX Q4 2017
 EUROPEAN EXPORT INDEX Q4 2017 BDO EXPORT INDEX KEY FIGURES The BDO Export Indices are composite indicators which provide snapshots of the export markets in Europe s five largest economies Germany, UK,
International Monetary and Financial Committee
 International Monetary and Financial Committee Thirty-Third Meeting April 16, 2016 IMFC Statement by Angel Gurría Secretary-General The Organisation for Economic Co-operation and Development (OECD) IMF
2014 Annual Review & Outlook
 2014 Annual Review & Outlook As we enter 2014, the current economic expansion is 4.5 years in duration, roughly the average life of U.S. economic expansions. There is every reason to believe it will continue,
State of the Economy. Office of the Chief Economic Adviser
 State of the Economy Office of the Chief Economic Adviser October 2018 1 State of the Economy October 2018 State of the Economy Office of the Chief Economic Adviser October 2018 State of the Economy Dr
Global PMI. Solid Q2 growth masks widening growth differentials. July 7 th IHS Markit. All Rights Reserved.
 Global PMI Solid Q2 growth masks widening growth differentials July 7 th 2017 2 Widening developed and emerging world growth trends The global economy enjoyed further steady growth in June, according to
Erdem Başçi: Recent economic and financial developments in Turkey
 Erdem Başçi: Recent economic and financial developments in Turkey Speech by Mr Erdem Başçi, Governor of the Central Bank of the Republic of Turkey, at the press conference for the presentation of the April
ECONOMY REPORT - CHINESE TAIPEI
 ECONOMY REPORT - CHINESE TAIPEI (Extracted from 2001 Economic Outlook) REAL GROSS DOMESTIC PRODUCT The Chinese Taipei economy grew strongly during the first three quarters of 2000, thanks largely to robust
Monthly Bulletin of Economic Trends: Review of the Australian Economy
 MELBOURNE INSTITUTE Applied Economic & Social Research Monthly Bulletin of Economic Trends: Review of the Australian Economy March 2018 Released on 22 March 2018 Outlook for Australia 1 Economic Activity
Outlook for Economic Activity and Prices (January 2018)
") Outlook for Economic Activity and Prices (January 2018) January 23, 2018 Bank of Japan The Bank's View 1 Summary Japan's economy is likely to continue expanding on the back of highly accommodative financial
Outlook for Economic Activity and Prices (January 2018) January 23, 2018 Bank of Japan The Bank's View 1 Summary Japan's economy is likely to continue expanding on the back of highly accommodative financial
Northern Ireland Quarterly Sectoral Forecasts
 Economic Analysis Northern Ireland Quarterly Sectoral Forecasts 2018 Quarter 1 Northern Ireland Quarterly Sectoral Forecasts Forecast summary For the Northern Ireland economy, the first part of 2018 has
RICS Economic Research
 RICS Economic Research / February 7 th 2014 Michael Hanley Economist www.rics.org/economics The Outlook for the Construction Sector Growth of 4% expected over 2014 Private housing and infrastructure to
Outlook for Economic Activity and Prices (April 2014)
") April 30, 2014 Bank of Japan Outlook for Economic Activity and Prices (April 2014) The Bank's View 1 Summary From fiscal 2014 through fiscal 2016, Japan's economy is likely to continue growing at a pace
April 30, 2014 Bank of Japan Outlook for Economic Activity and Prices (April 2014) The Bank's View 1 Summary From fiscal 2014 through fiscal 2016, Japan's economy is likely to continue growing at a pace
Global PMI. Global economy buoyed by rising US strength. June 12 th IHS Markit. All Rights Reserved.
 Global PMI Global economy buoyed by rising US strength June 12 th 2018 2 Global PMI rises but also brings signs of slower future growth At 54.0 in May, the headline JPMorgan Global Composite PMI, compiled
Main Economic & Financial Indicators UK
 Main Economic & Financial Indicators UK 17 MAY 217 AKIKO DARVELL ASSOCIATE ECONOMIST ECONOMIC RESEARCH OFFICE (LONDON) T +44-()2-7577-1591 E akiko.darvell@uk.mufg.jp The Bank of Tokyo-Mitsubishi UFJ, Ltd.
Main Economic & Financial Indicators The Czech Republic
 Main Economic & Financial Indicators The Czech Republic 15 OCTOBER 215 NAOKO ISHIHARA ECONOMIST ECONOMIC RESEARCH OFFICE (LONDON) T +44-()2-7577-2179 E naoko.ishihara@uk.mufg.jp The Bank of Tokyo-Mitsubishi
EUROPEAN COMMISSION DIRECTORATE-GENERAL FOR ECONOMIC AND FINANCIAL AFFAIRS. September 2006 Interim forecast
 EUROPEAN COMMISSION DIRECTORATE-GENERAL FOR ECONOMIC AND FINANCIAL AFFAIRS September 26 Interim forecast Press conference of 6 September 26 European economic growth speeding up, boosted by buoyant domestic
SOUTH ASIA. Chapter 2. Recent developments
 SOUTH ASIA GLOBAL ECONOMIC PROSPECTS January 2014 Chapter 2 s GDP growth rose to an estimated 4.6 percent in 2013 from 4.2 percent in 2012, but was well below its average in the past decade, reflecting
South African Reserve Bank STATEMENT OF THE MONETARY POLICY COMMITTEE. Issued by Lesetja Kganyago, Governor of the South African Reserve Bank
 South African Reserve Bank PRESS STATEMENT EMBARGO DELIVERY 30 March 2017 STATEMENT OF THE MONETARY POLICY COMMITTEE Issued by Lesetja Kganyago, Governor of the South African Reserve Bank Since the previous
Economic Projections :3
 Economic Projections 2018-2020 2018:3 Outlook for the Maltese economy Economic projections 2018-2020 The Central Bank s latest projections foresee economic growth over the coming three years to remain